Embed Size (px)
Citation preview
1
Influencing Factors of the
Grief, Depression, and
Quality of Life in Taiwanese
Women with Perinatal Loss
Sigma Theta Tau International's 28th International
Nursing Research Congress
Ya-Ling Yang, RN, Ph.D., Assistant Professor
Wen-Yu Hu, RN, Ph.D., Professor
School of Nursing, College of Medicine,
National Taiwan University
2017/07/27
2
Introduction
➢ Perinatal loss affect on 11.8 ‰ (n= 2507) of
pregnancies (abortion, therapeutic abortion,
miscarriages, IUFD) among 9.08 ‰ Crude
birth rate (2015) in Taiwan.
➢Chinese culturally not prefer to talk
about perinatal loss.
➢The perinatal loss is devastating,
potentially traumatizing for women
regardless of indications.
3
Introduction
- Rational
➢The prenatal genetic screening rate is
increasing, consequently increasing
termination rate.
➢The biopsychosocial-spiritual distress
caused by the perinatal loss.
➢Less evidences to explore the current
status of grief, depression and quality
of life in this population.
2017/07/27
4
The Aim
(1) explore differences of the grieving
adaptation, depression and quality of life
(QoL) for women at 3 time-range groups (2,
4, 6 months) after perinatal loss.
(2) compare differences between elective and
non-elective indications groups in grieving
adaptation, depression and QoL.
(3) identify predicting factors associated with
grief and QoL.
2017/07/27
5
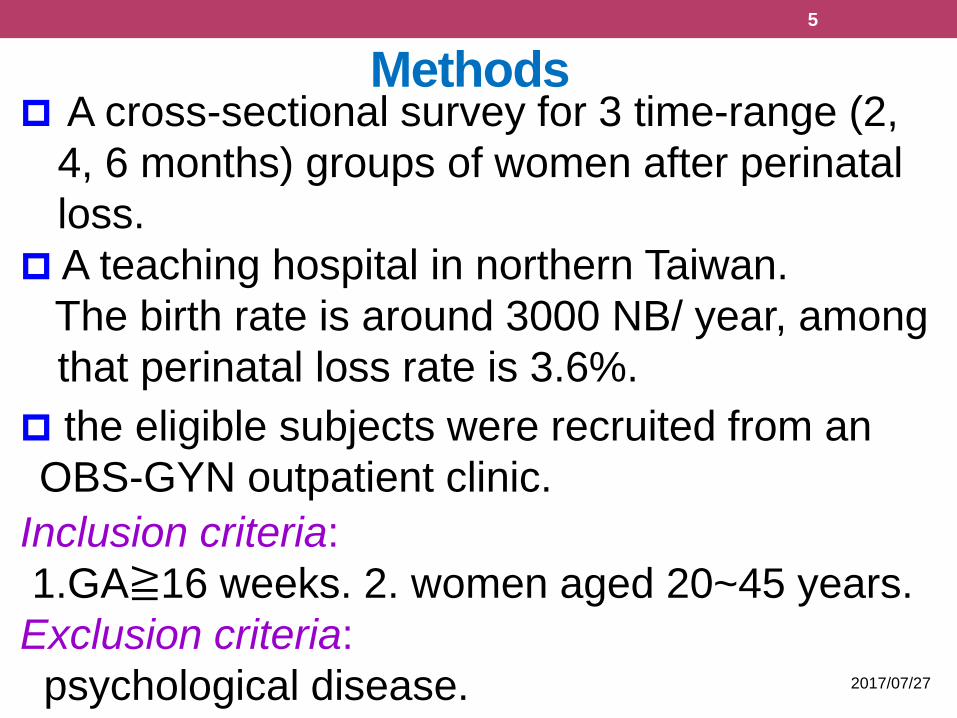
Methods A cross-sectional survey for 3 time-range (2,
4, 6 months) groups of women after perinatal
loss.
A teaching hospital in northern Taiwan.
The birth rate is around 3000 NB/ year, among
that perinatal loss rate is 3.6%.
the eligible subjects were recruited from an
OBS-GYN outpatient clinic.
Inclusion criteria:
1.GA≧16 weeks. 2. women aged 20~45 years.
Exclusion criteria:
psychological disease. 2017/07/27
2017/7/24
請輸入頁尾文字 6
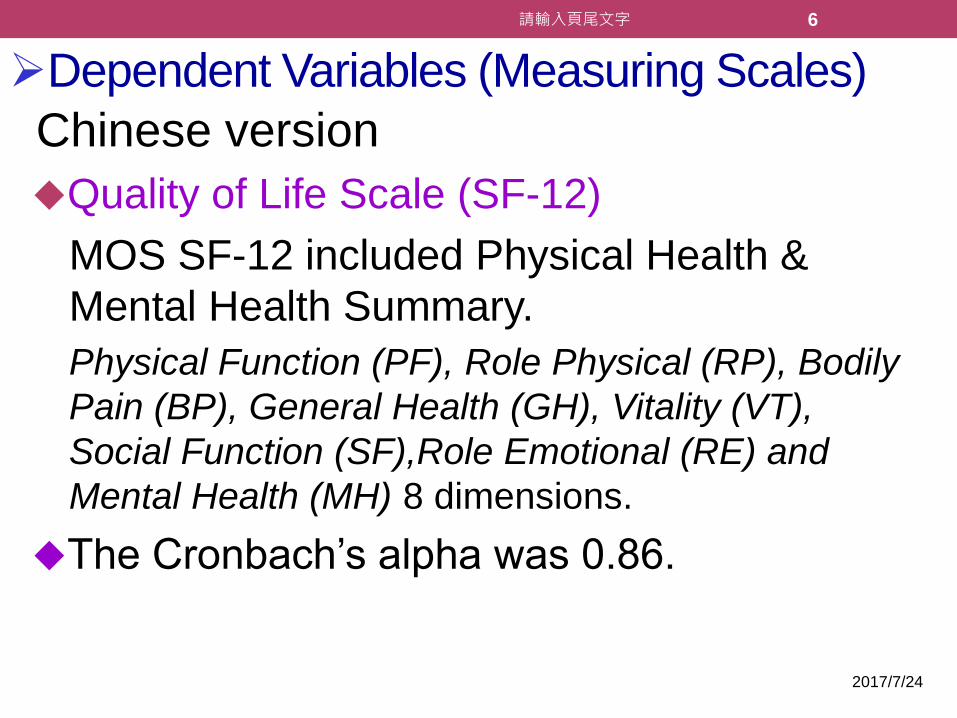
➢Dependent Variables (Measuring Scales)
Chinese version
Quality of Life Scale (SF-12)
MOS SF-12 included Physical Health &
Mental Health Summary.
Physical Function (PF), Role Physical (RP), Bodily
Pain (BP), General Health (GH), Vitality (VT),
Social Function (SF),Role Emotional (RE) and
Mental Health (MH) 8 dimensions.
The Cronbach’s alpha was 0.86.
7
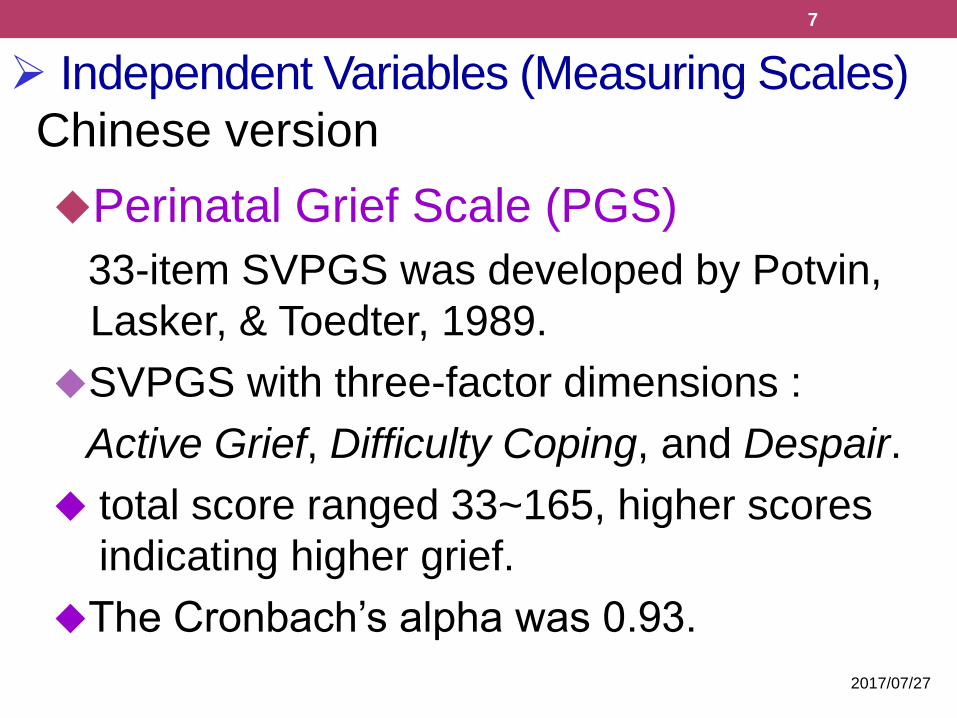
➢ Independent Variables (Measuring Scales)
Perinatal Grief Scale (PGS)
33-item SVPGS was developed by Potvin,
Lasker, & Toedter, 1989.
SVPGS with three-factor dimensions :
Active Grief, Difficulty Coping, and Despair.
total score ranged 33~165, higher scores
indicating higher grief.
The Cronbach’s alpha was 0.93.
Chinese version
2017/07/27
2017/07/27
請輸入頁尾文字 8
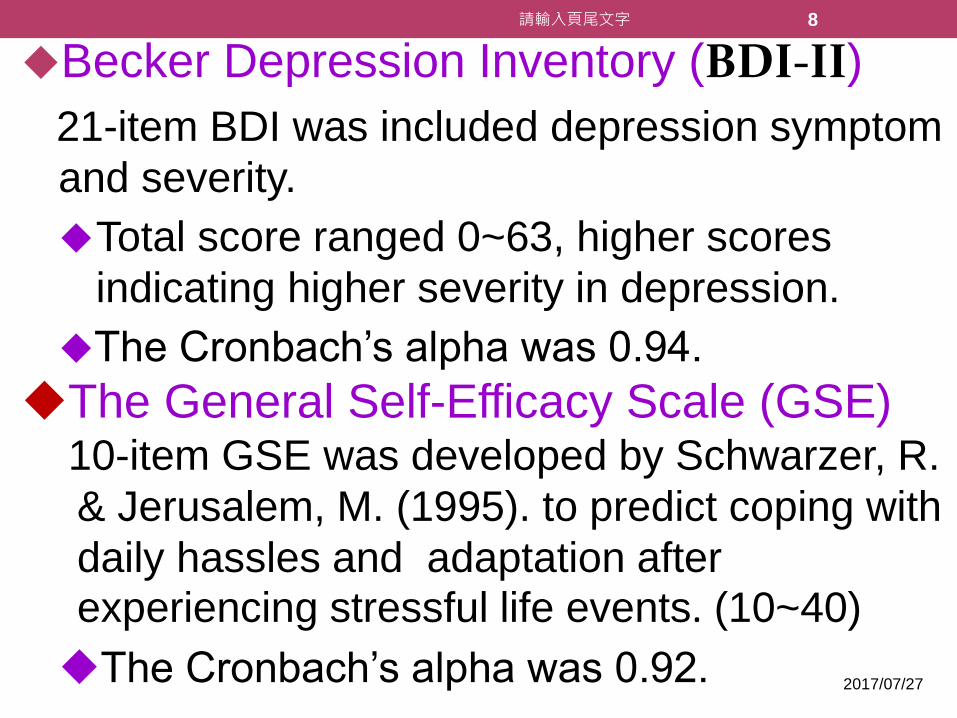
Becker Depression Inventory (BDI-II)
21-item BDI was included depression symptom
and severity.
Total score ranged 0~63, higher scores
indicating higher severity in depression.
The Cronbach’s alpha was 0.94.
The General Self-Efficacy Scale (GSE) 10-item GSE was developed by Schwarzer, R.
& Jerusalem, M. (1995). to predict coping with
daily hassles and adaptation after experiencing stressful life events. (10~40)
The Cronbach’s alpha was 0.92.
9
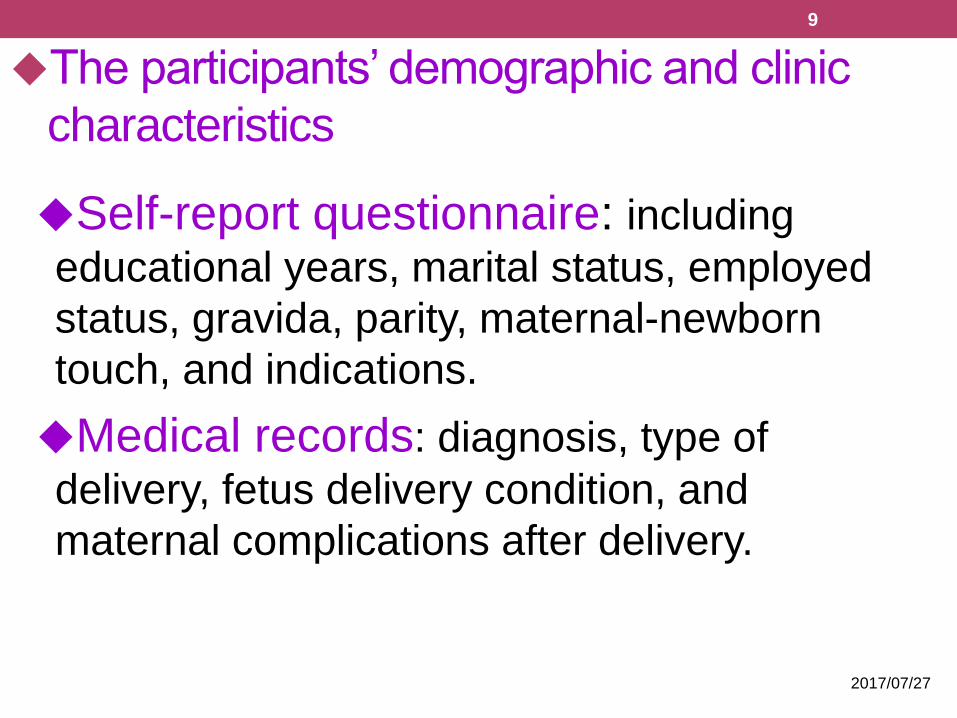
The participants’ demographic and clinic
characteristics
Self-report questionnaire: including
educational years, marital status, employed
status, gravida, parity, maternal-newborn
touch, and indications.
Medical records: diagnosis, type of
delivery, fetus delivery condition, and
maternal complications after delivery.
2017/07/27
10
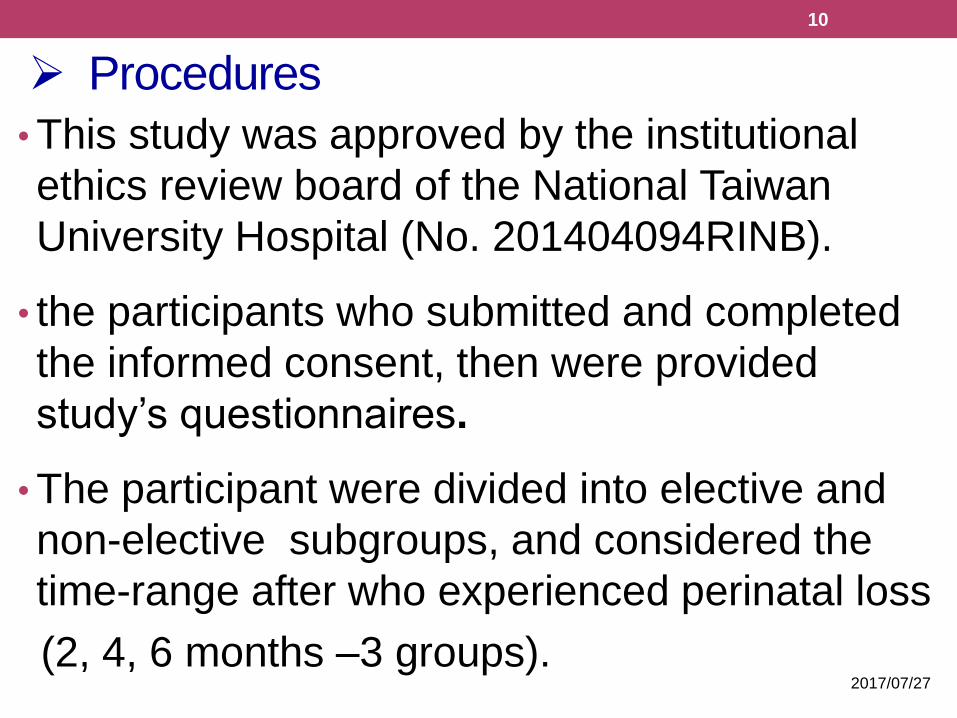
➢ Procedures
• This study was approved by the institutional
ethics review board of the National Taiwan
University Hospital (No. 201404094RINB).
• the participants who submitted and completed
the informed consent, then were provided
study’s questionnaires.
• The participant were divided into elective and
non-elective subgroups, and considered the
time-range after who experienced perinatal loss
(2, 4, 6 months –3 groups).2017/07/27
11
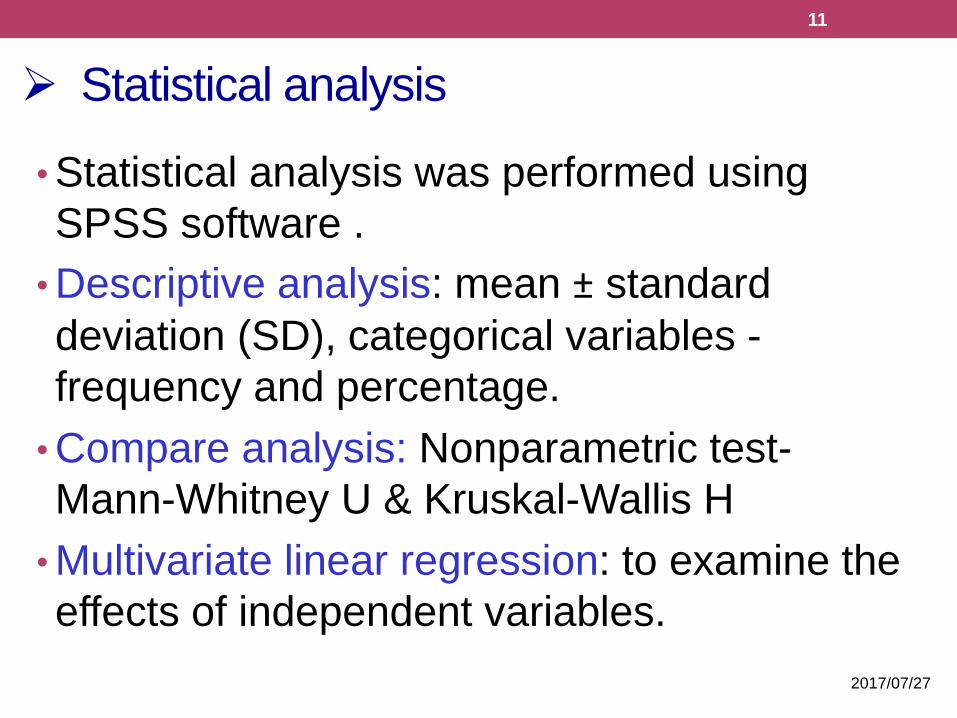
➢ Statistical analysis
• Statistical analysis was performed using
SPSS software .
• Descriptive analysis: mean ± standard
deviation (SD), categorical variables -
frequency and percentage.
• Compare analysis: Nonparametric test-
Mann-Whitney U & Kruskal-Wallis H
• Multivariate linear regression: to examine the
effects of independent variables.
2017/07/27
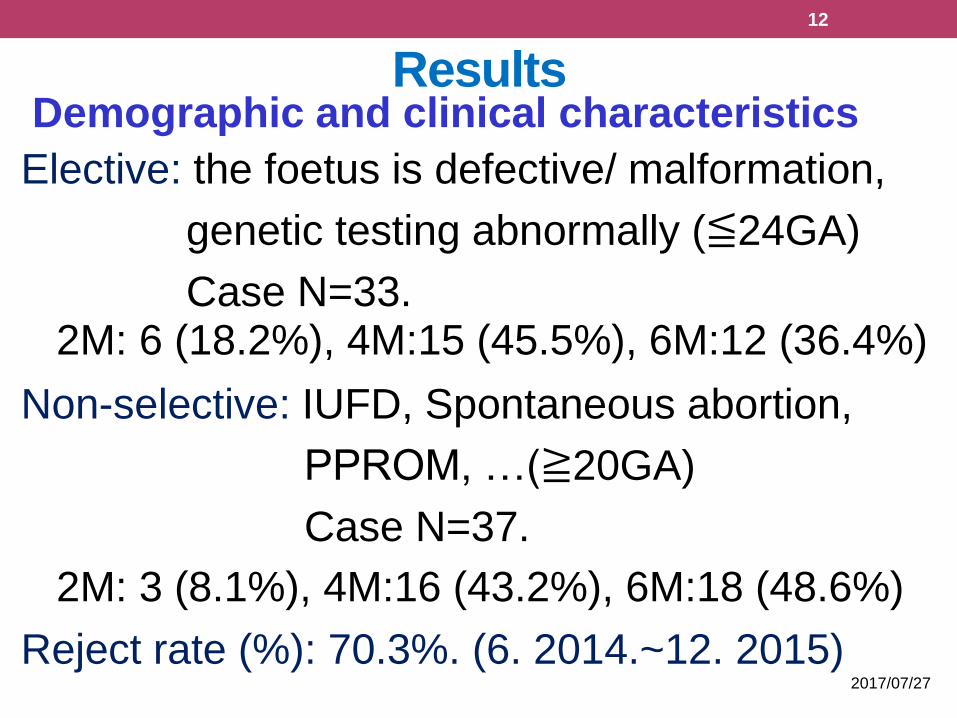
12
ResultsDemographic and clinical characteristics
Elective: the foetus is defective/ malformation,
genetic testing abnormally (≦24GA)
Case N=33.2M: 6 (18.2%), 4M:15 (45.5%), 6M:12 (36.4%)
Non-selective: IUFD, Spontaneous abortion,
PPROM, …(≧20GA)
Case N=37.
2M: 3 (8.1%), 4M:16 (43.2%), 6M:18 (48.6%)
Reject rate (%): 70.3%. (6. 2014.~12. 2015) 2017/07/27
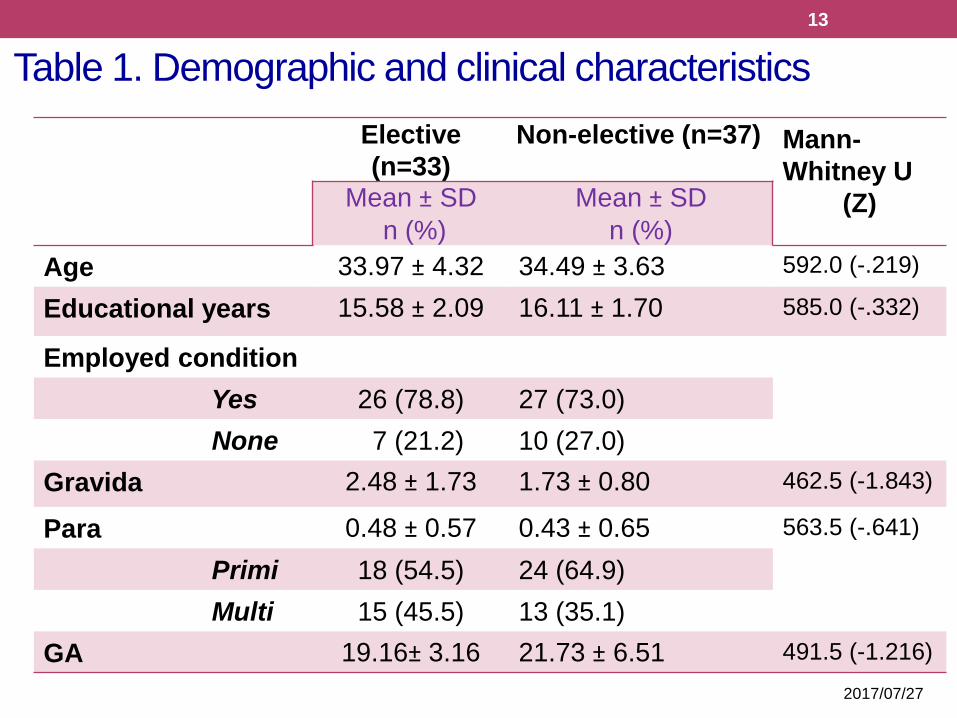
Table 1. Demographic and clinical characteristics
13
Elective
(n=33)
Non-elective (n=37) Mann-
Whitney U
(Z)Mean ± SD
n (%)
Mean ± SD
n (%)
Age 33.97 ± 4.32 34.49 ± 3.63 592.0 (-.219)
Educational years 15.58 ± 2.09 16.11 ± 1.70 585.0 (-.332)
Employed condition
Yes 26 (78.8) 27 (73.0)
None 7 (21.2) 10 (27.0)
Gravida 2.48 ± 1.73 1.73 ± 0.80 462.5 (-1.843)
Para 0.48 ± 0.57 0.43 ± 0.65 563.5 (-.641)
Primi 18 (54.5) 24 (64.9)
Multi 15 (45.5) 13 (35.1)
GA 19.16± 3.16 21.73 ± 6.51 491.5 (-1.216)
2017/07/27
2017/7/24
14
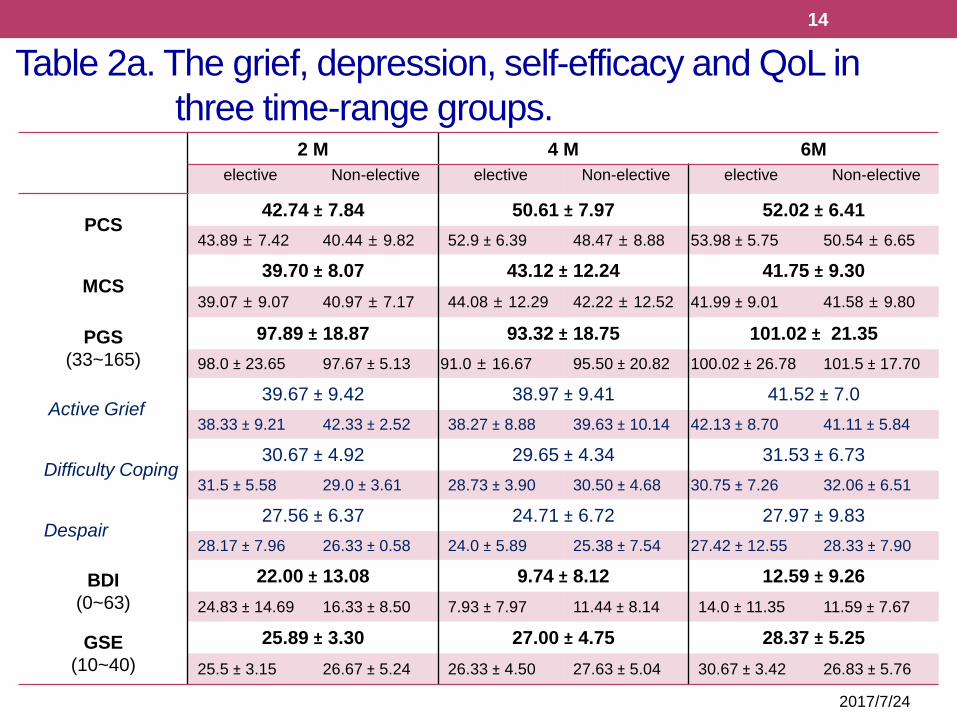
2 M 4 M 6M
elective Non-elective elective Non-elective elective Non-elective
PCS42.74 ± 7.84 50.61 ± 7.97 52.02 ± 6.41
43.89 ± 7.42 40.44 ± 9.82 52.9 ± 6.39 48.47 ± 8.88 53.98 ± 5.75 50.54 ± 6.65
MCS39.70 ± 8.07 43.12 ± 12.24 41.75 ± 9.30
39.07 ± 9.07 40.97 ± 7.17 44.08 ± 12.29 42.22 ± 12.52 41.99 ± 9.01 41.58 ± 9.80
PGS
(33~165)
97.89 ± 18.87 93.32 ± 18.75 101.02 ± 21.35
98.0 ± 23.65 97.67 ± 5.13 91.0 ± 16.67 95.50 ± 20.82 100.02 ± 26.78 101.5 ± 17.70
Active Grief39.67 ± 9.42 38.97 ± 9.41 41.52 ± 7.0
38.33 ± 9.21 42.33 ± 2.52 38.27 ± 8.88 39.63 ± 10.14 42.13 ± 8.70 41.11 ± 5.84
Difficulty Coping30.67 ± 4.92 29.65 ± 4.34 31.53 ± 6.73
31.5 ± 5.58 29.0 ± 3.61 28.73 ± 3.90 30.50 ± 4.68 30.75 ± 7.26 32.06 ± 6.51
Despair27.56 ± 6.37 24.71 ± 6.72 27.97 ± 9.83
28.17 ± 7.96 26.33 ± 0.58 24.0 ± 5.89 25.38 ± 7.54 27.42 ± 12.55 28.33 ± 7.90
BDI
(0~63)
22.00 ± 13.08 9.74 ± 8.12 12.59 ± 9.26
24.83 ± 14.69 16.33 ± 8.50 7.93 ± 7.97 11.44 ± 8.14 14.0 ± 11.35 11.59 ± 7.67
GSE
(10~40)
25.89 ± 3.30 27.00 ± 4.75 28.37 ± 5.25
25.5 ± 3.15 26.67 ± 5.24 26.33 ± 4.50 27.63 ± 5.04 30.67 ± 3.42 26.83 ± 5.76
Table 2a. The grief, depression, self-efficacy and QoL in
three time-range groups.
2017/07/27
15
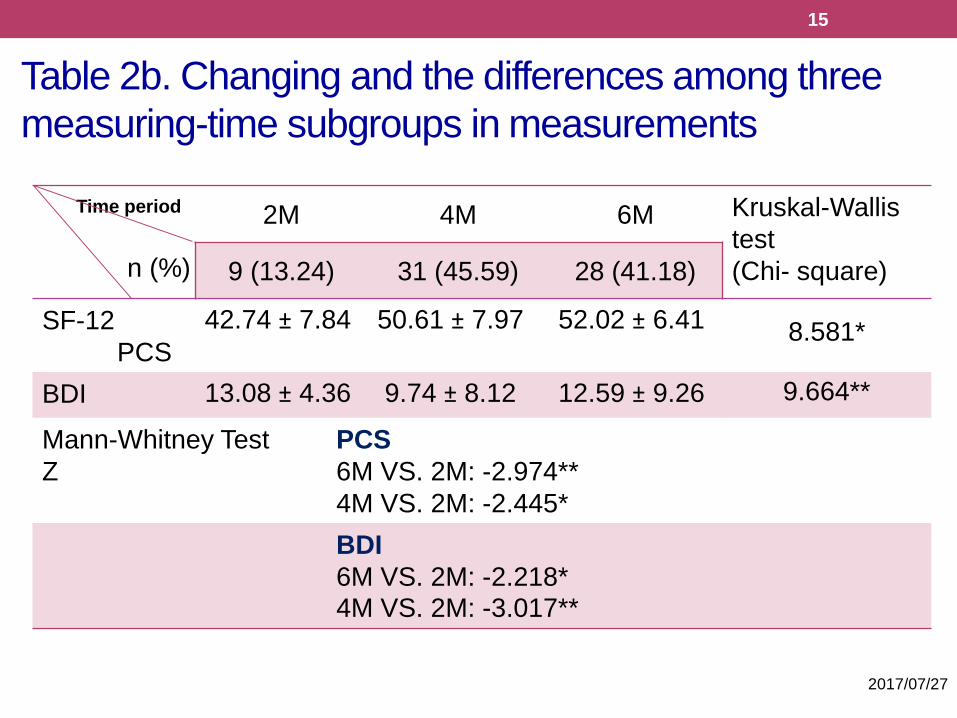
Time period
n (%)
2M 4M 6M Kruskal-Wallis
test
(Chi- square)9 (13.24) 31 (45.59) 28 (41.18)
SF-12
PCS
42.74 ± 7.84 50.61 ± 7.97 52.02 ± 6.41 8.581*
BDI 13.08 ± 4.36 9.74 ± 8.12 12.59 ± 9.26 9.664**
Mann-Whitney Test
Z
PCS
6M VS. 2M: -2.974**
4M VS. 2M: -2.445*
BDI
6M VS. 2M: -2.218*4M VS. 2M: -3.017**
Table 2b. Changing and the differences among three
measuring-time subgroups in measurements
16
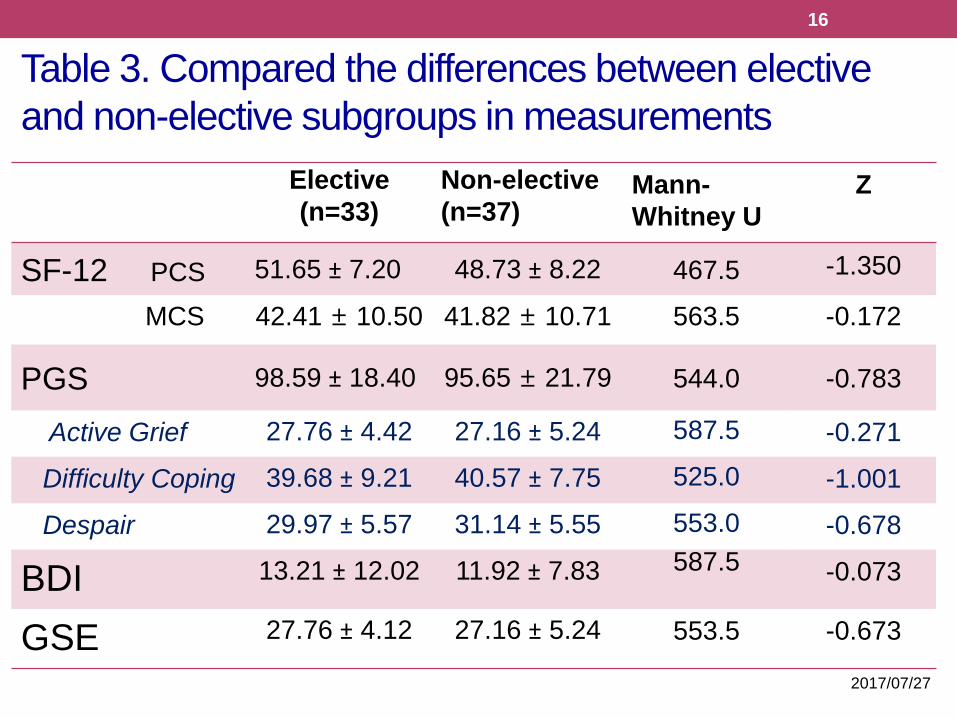
Table 3. Compared the differences between elective
and non-elective subgroups in measurements
Elective
(n=33)
Non-elective
(n=37)Mann-
Whitney U
Z
SF-12 PCS 51.65 ± 7.20 48.73 ± 8.22 467.5 -1.350
MCS 42.41 ± 10.50 41.82 ± 10.71 563.5 -0.172
PGS 98.59 ± 18.40 95.65 ± 21.79 544.0 -0.783
Active Grief 27.76 ± 4.42 27.16 ± 5.24 587.5 -0.271
Difficulty Coping 39.68 ± 9.21 40.57 ± 7.75 525.0 -1.001
Despair 29.97 ± 5.57 31.14 ± 5.55 553.0 -0.678
BDI 13.21 ± 12.02 11.92 ± 7.83 587.5 -0.073
GSE 27.76 ± 4.12 27.16 ± 5.24 553.5 -0.673
2017/07/27
2017/7/24
17
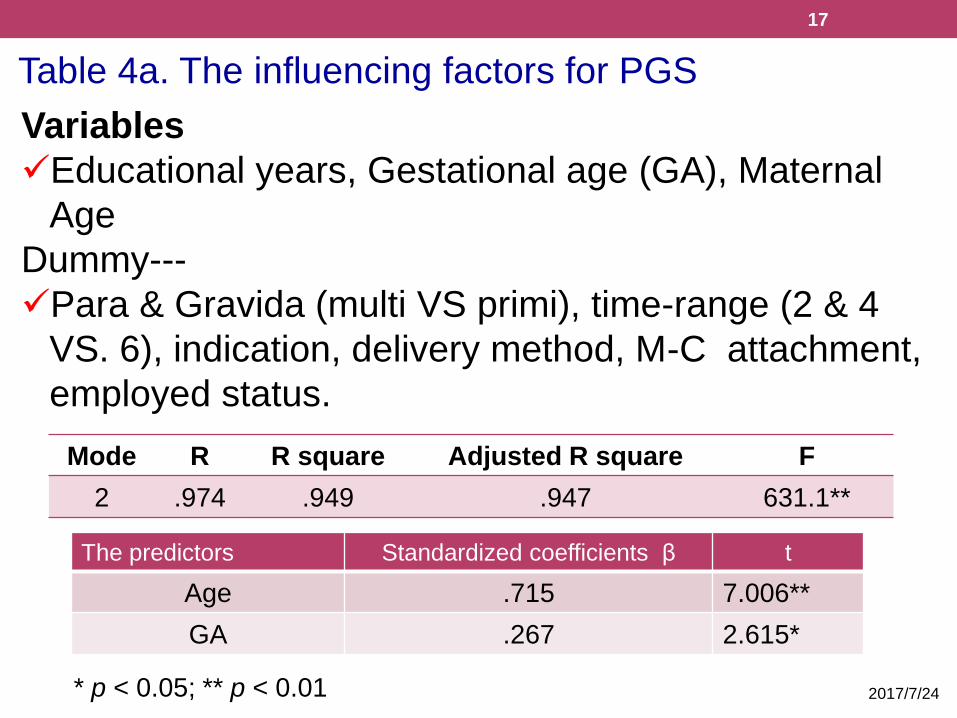
Table 4a. The influencing factors for PGS
Mode R R square Adjusted R square F
2 .974 .949 .947 631.1**
The predictors Standardized coefficients β t
Age .715 7.006**
GA .267 2.615*
Variables
✓Educational years, Gestational age (GA), Maternal
Age
Dummy---
✓Para & Gravida (multi VS primi), time-range (2 & 4
VS. 6), indication, delivery method, M-C attachment,
employed status.
* p < 0.05; ** p < 0.01
2017/7/24
18
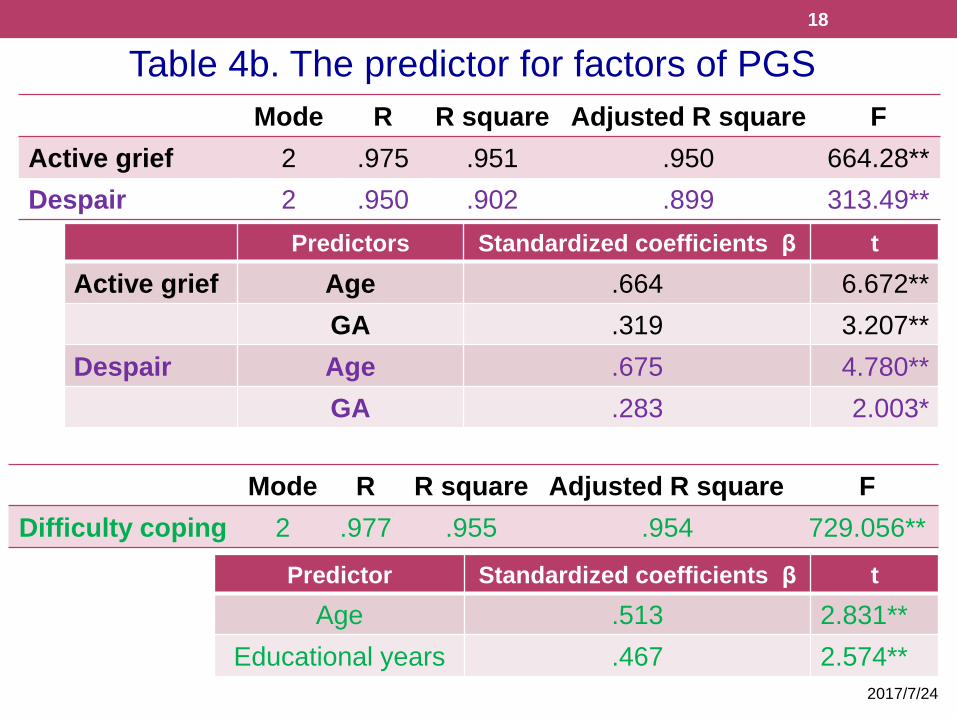
Table 4b. The predictor for factors of PGS
Mode R R square Adjusted R square F
Active grief 2 .975 .951 .950 664.28**
Despair 2 .950 .902 .899 313.49**
Predictors Standardized coefficients β t
Active grief Age .664 6.672**
GA .319 3.207**
Despair Age .675 4.780**
GA .283 2.003*
Mode R R square Adjusted R square F
Difficulty coping 2 .977 .955 .954 729.056**
Predictor Standardized coefficients β t
Age .513 2.831**
Educational years .467 2.574**
2017/07/27
19
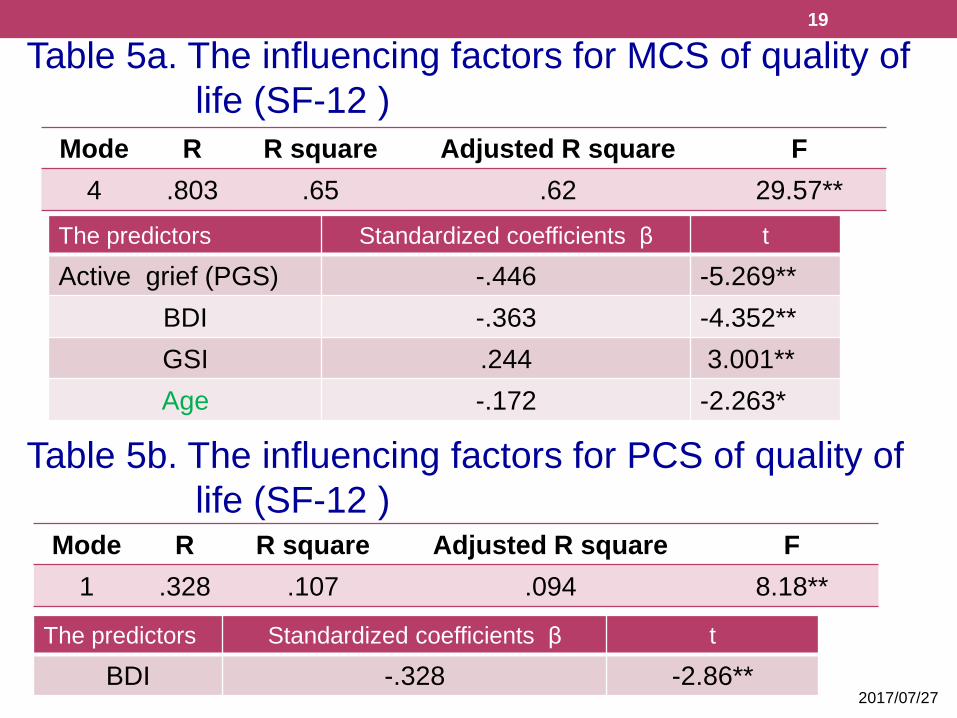
Table 5a. The influencing factors for MCS of quality of
life (SF-12 )
Mode R R square Adjusted R square F
4 .803 .65 .62 29.57**
The predictors Standardized coefficients β t
Active grief (PGS) -.446 -5.269**
BDI -.363 -4.352**
GSI .244 3.001**
Age -.172 -2.263*
Table 5b. The influencing factors for PCS of quality of
life (SF-12 )Mode R R square Adjusted R square F
1 .328 .107 .094 8.18**
The predictors Standardized coefficients β t
BDI -.328 -2.86**
20
Discussions - 1
• Age is a good predictor in grief and MCS.
• The time change among the three time-range
groups only in PCS and BDI were different.
• The grief, depression, GSI and quality of life
were no difference between elective and non-
elective mothers.
• The grief responses were still bothering the
participant at 6 months after they
experiencing stressful life events (perinatal
loss). 2017/07/27
21
Discussions - 2
Limitation
1.Only one medical center was involved in
this study and this might limit the variation
of participant’s responses.
2.The partner responses to perinatal loss
should be considered as an influencing
variable of maternal grief and quality of life.
2017/07/27
22
Discussions – 3
Clinical Implication
• The woman’s attitude toward the role
function and meaning of a mother crucial to
the psychological consequences after
perinatal loss.
• The result is helpful for the doctors and
nurses to assess and counsel the mother
contemplating termination or undergo
failure in tocolysis.
2017/07/27

23
Acknowledgements
The author would like to thank
1.The participants for their
cooperation in completing the study
questionnaires.
2.The National Science Council of
Taiwan (MOST 103-2629-B-002-001)
provided financial support for this
study.2017/07/27

Thank you for your
attention!!24


![Equilibriumcdn-au.mailsnd.com/94094/o_hyqxb_ns8NcxVd9XEwzjQR49...Equilibrium September 2016 l 3 disorders are anxiety and depression [1,2]. Significant adjustment issues and grief](https://img.pdfslide.us/doc/110x75/5e705c4e9355fc5da8037f62/equilibriumcdn-au-equilibrium-september-2016-l-3-disorders-are-anxiety-and.jpg)