Embed Size (px)
Citation preview

Environment. Technology. Resources, Rezekne, Latvia
Proceedings of the 10th International Scientific and Practical Conference. Volume I, 102-107
ISSN 1691-5402 © Rezekne Higher Education Institution (Rēzeknes Augstskola), Rezekne 2015
DOI: http://dx.doi.org/10.17770/etr2015vol1.223
Factors influencing the color laser marking Lyubomir Lazov, Hristina Deneva, Pavels Narica
Rezeknes Augstskola, Faculty of Engineering, Institute of Regional Studies (REGI). Address: Atbrivosanas aleja 90, Rezekne, LV-4601, Latvia.
Abstract. In recent years, conventional techniques of marking on some parts of different work pieces, as well as on
packages with color printing are increasingly being displaced by laser color marking. Colored marking of stainless steel could be realized by the process annealing. The advantages offered by the new technology are in greater accuracy, speed, flexibility and high amount of recorded information per unit area (bar and matrix codes). In the report are discussed and analyzed the factors influencing on the specific to the process of laser color marking at the products of CrNi steel. The study was conducted using a commercially available industrial pulsed fiber laser. Presents the results of the measurements and analysis of the influence of laser process parameters on the color contrasting obtained. In this case, the relevant parameter, the field of high frequencies and low pulse energy were examined. The present thesis describes studies a properties of the laser radiation, such as, pulse width, average power, the intensity and beam diameter.
Keywords: laser, marking, color lettering of stainless steel.
I INTRODUCTION
Modern solid-state Q-switched lasers generate a powerful pulses with a repetition rate of tens of kHz. The average radiation power value of tens of watts, provides P ~ 108 W / cm2 power density in the area of processing. This allows to use solid-state lasers for marking metals, refractory alloys and steels, hard ceramics in various industries. The laser marking is a modification of the material surface. It causes local heating, melting and partial evaporation of the material in the limited spot size field.
The most common method for color marking on metal surfaces are termoprinting, emulsion coating, powder coating or electrolytic oxidation techniques. The disadvantages of these methods can be noted that during operation they have a low degree of durability, color fading over time, etc. The method of electrolytic oxidation does not allow simultaneous labeling with several colors on the surface.
Mechanism of coloring marking on plastic materials is based on major four principles: bubbling; condensation; carbonization; chemical change.
Laser color marking on metals appeared about 15 years ago. Compared to other methods, laser color marking is the fastest and cheapest way of color marking on metal surface. But it have not found wide application in practice. The reason can be found in quite complicated implementation, time-consuming and not quite often repeatable results.
The two main problems that researchers must solve at this stage is reproducibility and process stability. Often, experimentally determined parameters required
to obtain a specific color on one system, do not give a positive result for other systems, even very similar to the same model. In the literature are articles that describes this process, but there is still a lack of information about what extent and which of the process parameters have an impact on the reproducibility of the created colors.
II LASER COLORING MARKING PRINCIPLE
To be successful conditions for the emergence color marking, there are several parameters to be optimized for all solid-state lasers used for marking: frequency and pulse width, power density, the layout of the intensity over the cross-section of the beam, etc. It is known that for lasers such as lamp-pumped, the optimal frequency range for labeling metals is 2-5 kHz, and the use of such frequencies in Fiber laser are impossible. If, try to compare different modes of laser marking systems at the same power, we will not get correct result, as the time and energy characteristics of the pulses are different, not mentioning the significant differences of the spatial characteristics of radiation.
Colour marking can be obtained with diode and lamp-pumped lasers. However, this effect is not stable ("floating") and difficult to reproduce. Constancy integrated zone temperature laser action is probably necessary condition Table 1, but for the better effect of color marking specific conditions are required that are related to the spatio-temporal characteristics of the laser radiation and its stability. It is these conditions
Lyubomir Lazov, et al./ Environment. Technology. Resources, (2015), Volume I, 102-107
103
are fulfilled in Fiber-lasers that successfully determined the possibility of color coding.
In the literature are mentioned two methods for color laser marking on metal surfaces:
- The first utilizes a laser as a heat source, which covers metal surface with transparent or semitransparent oxide film. [1, 2, 3, 4, 5]. Illuminating surface with white light, radiation is reflected from the upper and lower oxide layer. As a result, the phenomenon of interference (superposition) of the reflected rays turns light effect, which is perceived by sight. The thickness of the oxide layer [6] and are determined by the coefficient of the refractive index into color spectrum.
TABLE 1.
PROCESS OF HEAT TREATING (TEMPERING) OF STAINLESS STEEL
- Second method, colors on the surface of various
metals are created by the laser-induced periodic surface structures (LIPSS), known as “laser-induced ripples,” by the femtoor and picosecond lasers [7, 8] (fig.1) .
At the moment, there is an increasing trend to look for scientific and engineering and technological solutions to improve the capabilities of these technologies and related systems for color marking. Today, for commerciall marking there are available laser systems with stable parameters. For a real implementation of this method in the industry identification of process control parameters and articulation of scientifically-based physical representations are needed.
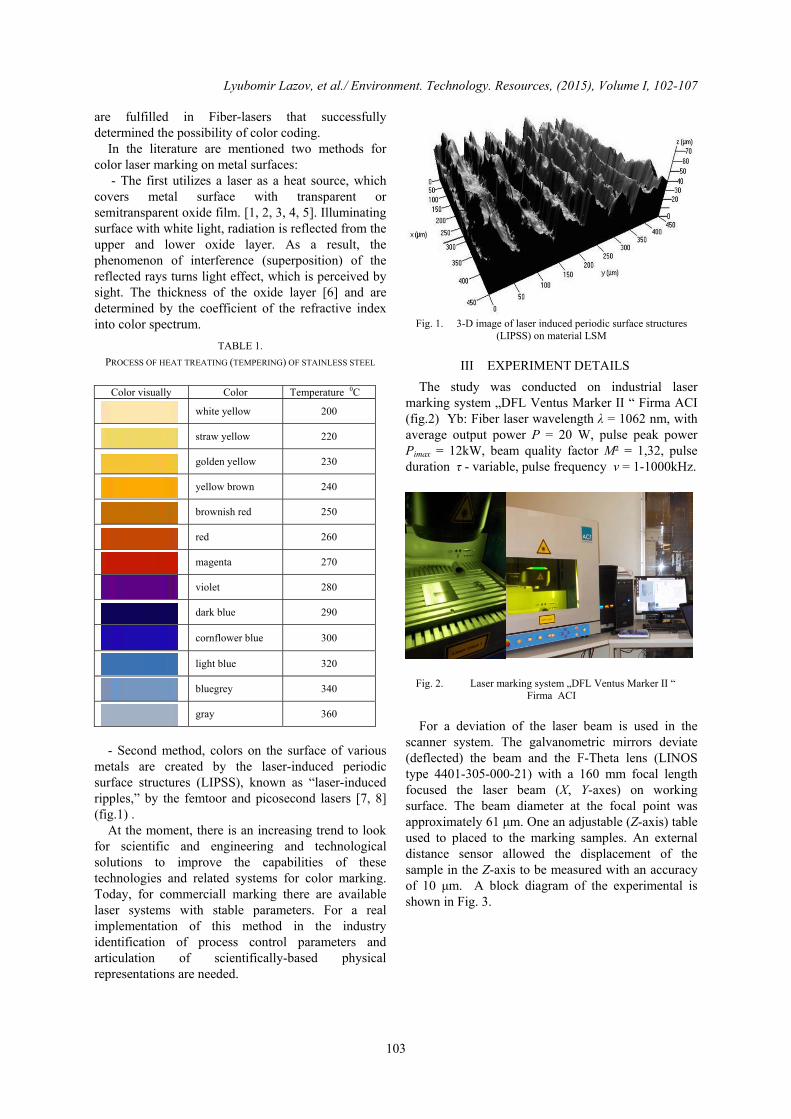
Fig. 1. 3-D image of laser induced periodic surface structures
(LIPSS) on material LSM
III EXPERIMENT DETAILS
The study was conducted on industrial laser marking system „DFL Ventus Marker II “ Firma ACI (fig.2) Yb: Fiber laser wavelength λ = 1062 nm, with average output power P = 20 W, pulse peak power Pimax = 12kW, beam quality factor M² = 1,32, pulse duration τ - variable, pulse frequency ν = 1-1000kHz.
Fig. 2. Laser marking system „DFL Ventus Marker II “ Firma ACI
For a deviation of the laser beam is used in the scanner system. The galvanometric mirrors deviate (deflected) the beam and the F-Theta lens (LINOS type 4401-305-000-21) with a 160 mm focal length focused the laser beam (X, Y-axes) on working surface. The beam diameter at the focal point was approximately 61 μm. One an adjustable (Z-axis) table used to placed to the marking samples. An external distance sensor allowed the displacement of the sample in the Z-axis to be measured with an accuracy of 10 μm. A block diagram of the experimental is shown in Fig. 3.
Color visually Color Temperature 0C
white yellow 200
straw yellow 220
golden yellow 230
yellow brown 240
brownish red 250
red 260
magenta 270
violet 280
dark blue 290
cornflower blue 300
light blue 320
bluegrey 340
gray 360

Lyubomir Lazov, et al./ Environment. Technology. Resources, (2015), Volume I, 102-107
104
Fig. 3. Block diagram of the experimental system
Tests were carried out on plates made of the most commonly used type of stainless steel alloys. The chemical composition of the samples 12Х18Н10Т is (71% Fe; 0,12% C; 18% Cr; 10% Ni, 2% Mn, 0,8% Si,…) [9][10]. Тhe samples of stainless steel with dimensions of
100 × 100 mm and thickness of 1 mm. Before the experiment, the plates were washed with isopropyl alcohol in an ultrasonic cleaner. The samples were marked in atmospheric air.
The tested plates contained up to 81 fields with dimensions of 6 × 6 mm and about 1 mm interval between successive rows and columns. Each tested field corresponded to a different set of process parameters (laser fluence). The tests were conducted for the experimentally determined range of parameters (presented in Table 2).
TABLE 2.
PARAMETERS SELECTED FOR TESTING OF LASER COLOR MARKING
Due to the vast number of parameters, experiments
were designed in a manner to keep several parameters constant while adjusting the others and thus establishing the effect of the processing parameters individually.
A test fields be filled by the method of the raster marking (the principle of sequential line scanning) (fig.4) with an option for variable pitch dy = 10 µm. Аt diameter of work spot 62 µm any line would overlap about 83%.
Working ranges for power and processing speed were selected from preliminary experiments. The speed range of 50 to 650 mm/s was selected for
research from available scanner speeds (10 - 2000 mm/s). The average power working range of 5 W to 13 W was selected accordingly. The frequency was changed in a range of 100 kHz to 715 kHz with a corresponding pulse width. The Table 3 are presented the data for puls frequency v, puls duration τ, puls energy Ei which were conducted experimental studies.
Fig. 4. Тhe method of the raster marking
TABLE 3.
SUMMARIZED DATA FOR PULS FREQUENCY, PULS DURATION AND
PULS ENERGY USED IN THE EXPERIMENT
v, kHz τ, ns Ei, µJ
20 320 1000
25 221 800
32 144 630
41 100 490
76 36 260
123 20 160
215 13 90
500 5 40
715 3 30
In order to optimize the laser coloring process can
adjust the pulse width, repetition rate, average power and scanning velocity. Further, the combinations of these parameters produce different pulse energies and peak powers. The peak power Pimax during a square pulse can be calculated by
Pimax = P / τ v
Pimax = Ep / τ in which P is the average power [W], τ - the pulse width [s], v - the pulse repetition rate [Hz], Ep - the pulse energy [J]. The pulse energy can be calculated by
Ep = P/ v
Average laser power P [W] 10–64 in steps of 5
Speed of scanning V [mm/s] 10–633 in steps of 78
Pulse repetition rate PRR [kHz] 395
Hatching h [μm] 10
(1)
(2)
(3)
Lyubomir Lazov, et al./ Environment. Technology. Resources, (2015), Volume I, 102-107
105
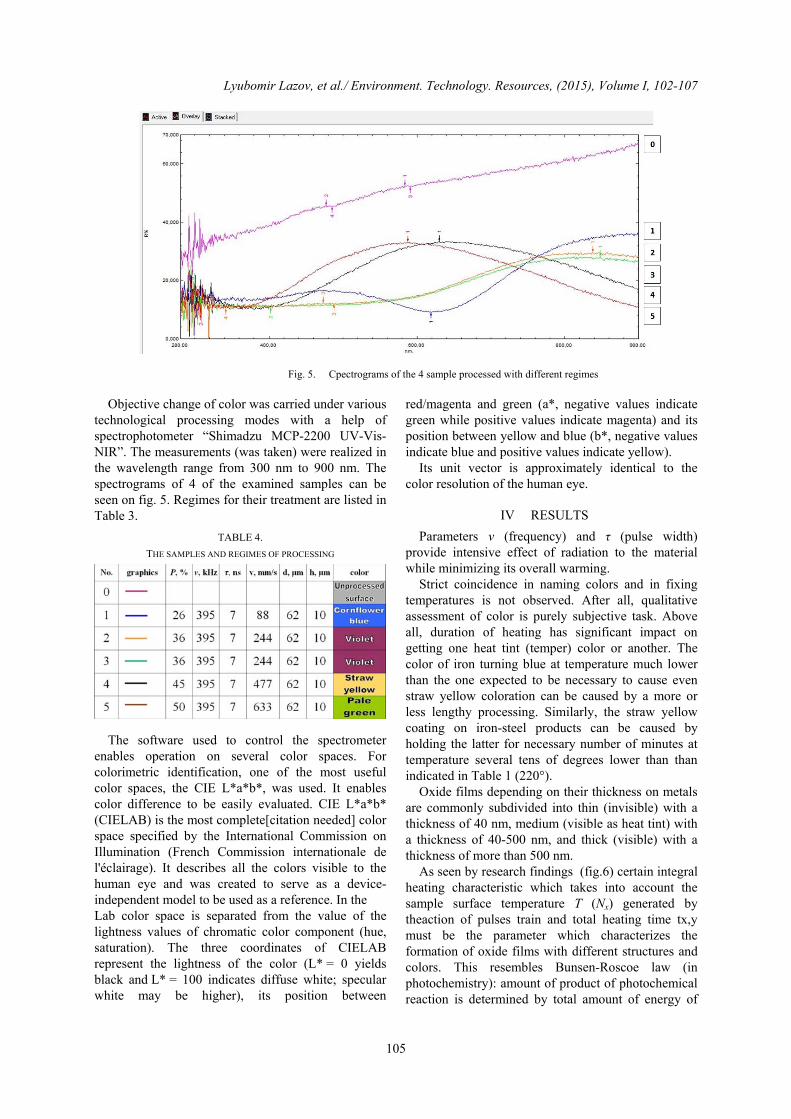
Fig. 5. Сpectrograms of the 4 sample processed with different regimes
Objective change of color was carried under various
technological processing modes with a help of spectrophotometer “Shimadzu MCP-2200 UV-Vis-NIR”. Тhe measurements (was taken) were realized in the wavelength range from 300 nm to 900 nm. The spectrograms of 4 of the examined samples can be seen on fig. 5. Regimes for their treatment are listed in Table 3.
TABLE 4.
THE SAMPLES AND REGIMES OF PROCESSING
The software used to control the spectrometer enables operation on several color spaces. For colorimetric identification, one of the most useful color spaces, the CIE L*a*b*, was used. It enables color difference to be easily evaluated. CIE L*a*b* (CIELAB) is the most complete[citation needed] color space specified by the International Commission on Illumination (French Commission internationale de l'éclairage). It describes all the colors visible to the human eye and was created to serve as a device-independent model to be used as a reference. In the Lab color space is separated from the value of the lightness values of chromatic color component (hue, saturation). The three coordinates of CIELAB represent the lightness of the color (L* = 0 yields black and L* = 100 indicates diffuse white; specular white may be higher), its position between
red/magenta and green (a*, negative values indicate green while positive values indicate magenta) and its position between yellow and blue (b*, negative values indicate blue and positive values indicate yellow).
Its unit vector is approximately identical to the color resolution of the human eye.
IV RESULTS
Parameters ν (frequency) and τ (pulse width) provide intensive effect of radiation to the material while minimizing its overall warming.
Strict coincidence in naming colors and in fixing temperatures is not observed. After all, qualitative assessment of color is purely subjective task. Above all, duration of heating has significant impact on getting one heat tint (temper) color or another. The color of iron turning blue at temperature much lower than the one expected to be necessary to cause even straw yellow coloration can be caused by a more or less lengthy processing. Similarly, the straw yellow coating on iron-steel products can be caused by holding the latter for necessary number of minutes at temperature several tens of degrees lower than than indicated in Table 1 (220°).
Oxide films depending on their thickness on metals are commonly subdivided into thin (invisible) with a thickness of 40 nm, medium (visible as heat tint) with a thickness of 40-500 nm, and thick (visible) with a thickness of more than 500 nm. Аs seen by research findings (fig.6) certain integral
heating characteristic which takes into account the sample surface temperature T (Nх) generated by theaction of pulses train and total heating time tx,y must be the parameter which characterizes the formation of oxide films with different structures and colors. This resembles Bunsen-Roscoe law (in photochemistry): amount of product of photochemical reaction is determined by total amount of energy of

Lyubomir Lazov, et al./ Environment. Technology. Resources, (2015), Volume I, 102-107
106
incident radiation, i.e., product of power of radiation and time of action, or generalized parameter - exposure (amount of lighting). In addition, photochemical effect does not change for various values of generalized parameter.
The made a series of experiments at v = 215 kHz; τ = 13ns and v = 715 kHz; τ = 3ns have shown that each color corresponds to a value of an integral temperature which is in narrow range for wide change of mode parameters (power, speed, pulse frequency and width) fig. 7a,b.
According our results of experiments the specific form of chosen function for laser coloring is well described by the semiempirical temperature-time combination the function F.
F = T(Nx) . tx,y
where tx,y is the action time, T(Nx)- the temperature of metal surface.
The action time tx,y can be calculated on the basis of
the following formula
vNd
NNt yxyx
2
.,
where Nx, Ny are the amounts of pulses in the focus region taking into account the overlap on х and y axes, v is the scanning speed, d - diameter of working spot, mm, N is the resolution (lines by 1 mm)
The temperature of metal surface Т(Nх) upon laser
irradiation with the series of Nх pulses the following formula can be attained [11]
00
0 12T
nn
k
aRqNT
xN
nx
)(
)(
where q0 is the density of radiation power; τ - the pulse duration; v - the repetition rate; Т0 - the initial sample temperature; R - the reflectivity on λ = 1,06 μm; k - the material thermal conduction; a is the material thermal diffusivity.
Research suggested that change of the parameter of function F characterizes the order of occurrence of colors upon the laser coloring, which is also confirmed by other authors [12].
According to thermodynamic calculations in research, the most probable is formation of compounds of iron and chromium with oxygen in the process of interaction between steel and atmosphere during laser heating, as the magnitude of the Gibbs energy in temperature range of (298-1000)K is significantly lower than needed for compounds with nitrogen, carbon or water. According to results of calculations, multicomponent film with phase composition of Fe2O3, CrO2, NiO is formed in the atmosphere while heating surface of stainless steel up to 700 K.
Fig. 6. The influence of average power P and scanning speed v of
the sample on the color marking, v = 395 kHz, τ = 7.10-9 s
TABLE 5. THE SAMPLES AND REGIMES OF PROCESSING
This fact is confirmed in our experimental results.
From the components of the atmosphere we found only oxygen during energy-dispersive X-ray spectroscopy analysis with scanning electron microscope (SEM) TESCAN-VEGA LMU II. Investigation of thin films structure was performed on x-ray difractometer SmartLab RIGAKU with Cu-Kα radiation (λ = 1,543 Ǻ) operated at an acceleration voltage of 40 kV and an emission current of 150 mA. Bragg - Brentano focusing optic wavelength with a primary monochromator was used.
Mass fraction ω(Х) of each component of stainless steel for an unprocessed surface of stainless steel as well as for colored films after laser heating up to certain temperature is shown in the Table 5.
Elements Weight % Metal
12Х18Н10Т
Metal 12Х18Н10Т surface
of the test sample GOST
5632-72
(EN - 1.4878)
Unproces
sed surface
Treated
surface
50%
Treated
surface
26%
O oxygen -- -- 5,70 9,05
Cr chrome 17,0 – 19,0 19,16 15,68 17,33
Fe iron Basic 70,87 69,44 64,40
Ni nickel 9,0 - 11,0 7,72 7,77 7,86
Mn manganese ˂ 2,0 2,25 1,41 1,37
Si silicon ˂ 0,8
(4)
(5)
(6)

Lyubomir Lazov, et al./ Environment. Technology. Resources, (2015), Volume I, 102-107
107
Fig. 7. The influence of average power P and scanning speed v of the color marking:
a) v = 215 kHz, τ = 13.10-9 s b) v = 715 kHz, τ = 7.10-9 s
V CONCLUSION
The research of interaction of nanosecond duration laser radiation with surface of stainless steel was conducted in this work. As a result, empirical tables of dependencies between colors formed by engraving and laser radiation parameters with help of which it is possible to program obtaining quite complex colored images were set up for given stainless steel specimens.
The research of phase composition of surface and its structure confirmed presence of oxide films and showed that quite complex periodic surface structure and layers of various thickness form by virtue of pulsed nature of radiation caused by exposure. In order to ascertain this complex process there is a need for further research with application of other types of lasers and other technological parameters.
The technology of laser color marking of metal surfaces which allows to change their optical properties in visible range can be applied in metal coloring when obtaining a durable high resolution image is needed with help of contactless effect on material (advertising business, jewelry production, machine manufacturing). It can also be used successfully as a mean of protection against corrosion.
VI VI. REFERENCES [1] A. Pérez del Pino, P. Serra, J.L. Morenza, Oxidation of
titanium through Nd_YAG laser irradiation. Appl. Surf. Sci. 197–198, 887–890 (2002)
[2] S. O’Hana, A.J. Pinkerton, K. Shoba, A.W. Gale, L. Li, Laser surface colouring of titanium for contemporary jewelery. Surf. Eng. 24, 147–153 (2008)
[3] Á. Perez del Pino, J.M. Fernandez-Pradas, P. Serra, J.L. Morenza, Coloring of titanium through laser oxidation: comparative study with anodizing. Surf. Coat. Technol. 187, 106–112 (2004)
[4] Z.L. Li, H.Y. Zheng, K.M. Teh, Y.C. Liu, G.C. Lim, H.L. Seng, N.L. Yakovlev, Analysis of oxide formation induced by UV laser coloration of stainless steel. Appl. Surf. Sci. 256, 1731–1734 (2009)
[5] A.J. Anto´nczak, D. Koco´n, M. Nowak, P. Kozioł, K.M. Abramski, Laser-induced colour marking—Sensitivity 16. L. Baufay, F.A. Houle, R.J.Wilson, Optical self-regulation during laser-induced oxidation of copper. J. Appl. Phys. 61, 4640 (1987)
[6] S. Fujimoto, K. Tsujino, T. Shibata, Growth and properties of Cr-rich thick and porous oxide films on Type 304 stainless steel formed by square wave potential pulse polarisation. Electrochim. Acta 47, 543–551 (2001)
[7] A.Y. Vorobyev, C. Guo, Colorizing metals with femtosecond laser pulses. Appl. Phys. Lett. 92, 041914 (2008)
[8] E.B. Barmina, E. Stratakis, C. Fotakis, G.A. Shafeev, Generation of nanostructures on metals by laser ablation in liquids: new results. Quantum Electron. 40, 1012 (2010)
[9] www.inoxstory.ru/ask.html] [10] Гост 5632-72, издательство стандартов, Москва,
www.docload.ru/Basesdoc/3/3936/index.htm [11] Шахно Е. А. Аналитические методы исследования и
разработки лазерных микро- и нанотехнологий. Методические рекомендации по выполнению курсовых проектов и само-стоятельных работ студентов. – СПб: СПбГУ ИТМО, 200818
[12] Вейко В. П., Горный С. Г., Одинцова Г. В. и др. Формирование многоцветного изображения при лазерном окислении металлов. – Изв. вузов. Приборостроение, 2011, т.54, №2, c.47–53
b)
a)