Embed Size (px)
Citation preview

Agricultural and Forest Meteorology 102 (2000) 83–103
Factors controlling evaporation and energy partitioning beneath adeciduous forest over an annual cycle
Kell B. Wilsona,∗, Paul J. Hansonb, Dennis D. Baldocchica Atmospheric Turbulence and Diffusion Division, NOAA, P.O. Box 2456, Oak Ridge, TN 37831, USA
b Environmental Sciences Division, Oak Ridge National Laboratory, P.O. Box 2008, Oak Ridge, TN 37831, USAc Department of Environmental Science, Policy and Management, University of California,
Berkeley, 151 Hilgard Hall, Berkeley, CA 94720, USA
Received 20 October 1999; received in revised form 31 January 2000; accepted 3 February 2000
Abstract
The energy balance components were measured above the ground surface of a temperate deciduous forest over an annualcycle using the eddy covariance technique. Over a year, the net radiation at the forest floor was 21.5% of that above the canopy,but this proportion was not constant, primarily because of the distinct phenological stages separated by the emergence andsenescence of leaves. The dominant response to seasonal changes in net radiation was through corresponding changes in thesensible heat flux, and both net radiation and sensible heat flux peaked just before leaf emergence. Evaporation at the forestfloor was typically less than 0.5 mm per day, and unlike sensible heat flux, was not closely coupled to seasonal changes innet radiation. Instead, evaporation at the forest floor responded primarily to rapid changes in litter water content. Forest floorevaporation was limited by the water-holding capacity of litter, and when the atmospheric demand was large, the litter layerdried on the time scale of several hours. After this rapid period of drying, net radiation and sensible heat flux dominated theenergy budget.
When leaves were present during the growing season, the sensible and latent energy fluxes at the forest floor were less than10% of the total canopy fluxes, and the mean Bowen ratio was similar to that above the canopy. However, during the dormantseason, the controls of the energy budget at the forest floor largely determine the whole canopy fluxes. On an annual basis, thefluxes from the forest floor are roughly 15–22% of those above the canopy and the evaporation was 86 mm. © 2000 ElsevierScience B.V. All rights reserved.
Keywords:Evaporation; Forest floor; Energy budget; Litter water content; Deciduous forest; Eddy-covariance; Ameriflux
1. Introduction
Energy fluxes and evapotranspiration above veg-etated surfaces depend not only on climatologicaland biophysical controls in the vegetative canopy but
∗ Corresponding author. Tel.:+1-865-576-2317;fax: +1-865-576-1237.E-mail addresses:[email protected] (K.B. Wilson), [email protected] (D.D. Baldocchi)
also on the available energy and energy partitioningbeneath the canopy. Fluxes from a forest floor andthe relative contribution of the forest floor to wholecanopy fluxes vary considerably, from generally lowin dense coniferous forests (Schaap and Bouten,1997) and during the growing season in deciduousforests (Moore et al., 1996), to much greater in moreopen canopies (Lafleur, 1992; Kelliher et al., 1997,1998; Baldocchi et al., 2000). The presence and den-sity of the canopy modify a number of factors that
0168-1923/00/$ – see front matter © 2000 Elsevier Science B.V. All rights reserved.PII: S0168-1923(00)00124-6
84 K.B. Wilson et al. / Agricultural and Forest Meteorology 102 (2000) 83–103
influence energy availability and partitioning at theforest floor. These factors include solar and net radia-tion, soil water content, wind speed, temperature andhumidity beneath the canopy, as well as the quantityand quality of decomposing litter, which can act asa mulching layer (Kondo and Saigusa, 1992) largelydecoupling the surface litter layer from the soil. De-ciduous forests of the southeast US are unique inhaving a dense canopy during the growing season,but are essentially open during the dormant season.Therefore, characterizing the magnitude, partitioningand controls of energy fluxes and forest floor evap-oration in deciduous forests requires data sets thatextend over a complete dormant and growing seasoncycle.
Although leaf area influences energy availabilityand partitioning at the forest floor, some evidencesuggests that forest floor evaporation is often largelydecoupled from net radiation (Baldocchi and Meyers,1991; Schaap and Bouten, 1997), even during thedramatic changes associated with leaf emergence andsenescence in a deciduous forest (Moore et al., 1996).Soil water content near the upper horizon (Kelliheret al., 1986) and leaf litter water content (Schaapand Bouten, 1997; Baldocchi et al., 2000) have alsobeen suggested as controls on forest floor evaporationin other studies, but litter quantity and composi-tion can also be important, along with the presenceof ground-dwelling and water-absorbing vegetation,such as moss and lichens (Lafleur, 1992; Kelliheret al., 1998). There is scarce information detailing thehourly to annual interaction between forest floor litterwater content and evaporation in deciduous forests.
Baldocchi and Meyers (1991) and Baldocchi andVogel (1996) have presented energy budget dataunder the canopy of a temperate deciduous forestusing the eddy covariance technique, but only dur-ing short-term studies. Moore et al. (1996) presentedforest floor fluxes in a deciduous forest in the north-eastern US over parts of an annual cycle. The forestin the present study is located in a much warmer cli-mate, has almost no snow cover, and has an extendedgrowing season and a greater leaf area compared tothat reported in Moore et al. (1996). We also expectsoil type and litter quality and composition at theforest floor to vary between the two sites.
In this study, we discuss the energy budget beneatha temperate deciduous forest in the southeastern
US over an annual cycle using the eddy covariancetechnique. The daily and annual fluxes beneath thecanopy will be compared with the whole canopyfluxes measured above the canopy. In addition toshowing the annual magnitude of energy flux den-sities, we discuss the likely biophysical controls onforest floor evaporation at this site. Specifically, ourgoals are (1) to show the seasonality and magnitudeof energy fluxes beneath a deciduous forest over anannual cycle, emphasizing differences between thedormant and growing seasons, (2) to determine rela-tive importance of forest floor fluxes with those abovethe canopy, and (3) to determine the role of climateforcing and litter water content on energy partitioning,particularly evaporation.
2. Materials and methods
2.1. General forest characteristics
Micrometeorological and flux measurements weremade below and above the canopy of a temperatedeciduous forest in Oak Ridge, TN (35◦57′30′′N,84◦17′15′′W, 365 m asl) continuously during 1998.The canopy height is approximately 26 m above thesurface and the maximum leaf area is approximately6.0. The forest is a mixed deciduous stand domi-nated in the overstorey by oak, maple and hickory.The stand is over 50 years old, having regeneratedfrom agricultural land. The instruments were locatedon a spur ridge, which slopes to the west-southwest.The vertical difference between ridge-valley altitudewithin a kilometer radius of the instrumentation ison the order of 60 m. The upwind fetch of forestextends several kilometers in all directions. The soilis well drained and is classified as a typic Paleudult,which encompasses clayey and kaolinitic soils. A lit-ter layer of decomposing leaves and branches, with adry weight density ranging from approximately 800(late summer) to 1600 g m−2 (winter) covers the soilsurface. Maximum water holding capacity of the litterlayer is approximately 2.0 mm and somewhat less insummer. A more detailed description of the canopyarchitecture, species composition and soil propertiesis provided by Peters et al. (1970), Luxmoore et al.(1981), Hutchison et al. (1986) and Johnson and vanHook (1989).
K.B. Wilson et al. / Agricultural and Forest Meteorology 102 (2000) 83–103 85
2.2. Eddy covariance and meteorological data
The instruments designed to measure fluxes abovethe forest floor were placed on a 1 m horizon-tal boom supported by a 2 m tower. Above thecanopy, measurements were made on a scaffoldtower 10 m above the forest (Wilson and Baldocchi,2000). Three-dimensional sonic anemometers (modelSWS-211/3K, Applied Technology, Boulder, CO)were used to determine wind velocity and virtual tem-perature fluctuations at both measurement heights.Fluctuations in water vapor were measured with anopen path, infrared absorption gas analyzer (Aubleand Meyers, 1992). Water vapor calibrations werereferenced to a dew point hygrometer.
Digitized anemometer and gas analyzer data werecollected at 10 Hz and processed real time on acomputer. Vertical flux densities were evaluated bycomputing the mean covariance of water and sensibleheat fluctuations with the fluctuating vertical veloc-ity (Baldocchi et al., 1988). Fluctuations of velocityand scalars from the mean were determined from thedifference between the instantaneous values and themean scalar quantities. Mean scalar values were de-termined using a digital recursive filter with a 400 stime constant. Fluxes at both heights were not sen-sitive to the value of the time constant in the rangeof 200–800 s, similar to other studies (Baldocchi andMeyers, 1991; Baldocchi et al., 2000). Coordinateaxes were rotated so that the mean vertical velocitywas 0 (McMillen, 1988). Water vapor fluxes werecorrected for the effect of density fluctuations (Webbet al., 1980).
Environmental and meteorological variables weremeasured at 1 s intervals and logged on digital dataloggers (model CR-21x, Campbell Scientific, LoganUtah). Soil heat flux density was measured with threesoil heat plates (model HFT-3, Radiation Energy Bal-ance systems (REBS), Seattle, Washington) buried0.01 m below the soil surface. Air temperature andrelative humidity were measured at 2 and 36 m (heightof above canopy system) with a temperature/humidityprobe (HMP-35 A, Vaisala, Helsinki, Finland). Netradiation was measured above and below the canopyusing a net radiometer (model 7, REBS, Seattle,Washington). The radiation sensor placed below thecanopy was on a moving tram, which was used toobtain mean values over a horizontal transect of 20 m.
2.3. Litter and soil water content
Litter water content of the Oi/Oe horizons, theorganic layers that contains litter of recognizableorigin, were measured continuously and hourly esti-mates were recorded on a datalogger (model CR-21x,Campbell Scientific). The approach estimates litterwater content from the characteristic electrical con-ductance and is analogous to the electrical impedancegrids reported by Gillespie and Kidd (1978), exceptthe measurements were performed using actual leaveswithin the organic horizons. Eight replicate chestnutoak leaves (Quercus prinusL.), chosen because oftheir higher resistance to decomposition, were at-tached to a voltage supply and external resistors andsubsequently reinserted between the Oi and Oe hori-zons, where they remained for the duration of thegrowing season.
Throughout the growing season, additional chest-nut oak litter samples were collected under variablemoisture conditions. From independent estimates ofleaf water content, obtained by weighing leaves beforeand after drying, these leaves were used to develop acalibration curve between litter water content and leafelectrical conductance. The final relationship yielded alinear function between litter water content and electri-cal conductance. The coefficients for this relationshipchanged slightly over the course of the season as theleaves decomposed. The intercepts were−0.0015 and−0.0011 g g−1 for the first half and the second half ofthe year, respectively. The corresponding slopes were4.05 and 3.09 g g−1 mv−1. The coefficient of determi-nation (r2) during both periods was 0.87.
Litter water content data was subjectively separatedinto three categories: ‘wet’, ‘intermediate’ and ‘dry’.As the sensor was unable to effectively resolve differ-ences in water contents less than 0.3 g (H2O) g–1 (leafdry weight), all litter wetness contents equal to or lessthan 0.3 g g−1 were considered ‘dry’. The litter wasclassified as ‘wet’ when the water content exceeded1.0 g g−1. Values of litter water content between 0.3and 1.0 g g−1 were considered to be of ‘intermedi-ate’ wetness. After leaf abscission in 1998, the leaflitter material used for estimating water content wasnearly 1-year old in age and was covered by a new setof leaves. Therefore, only litter wetness data beforethe abscission of leaves (approximately Day 305) wasused for analysis in this paper.
86 K.B. Wilson et al. / Agricultural and Forest Meteorology 102 (2000) 83–103
After Day 90, soil water content over the 300 mmprofile was measured hourly near the flux instrumen-tation site with four water content reflectometers (ItemCS615, Campbell Scientific, Logan, UT) installed hor-izontally on the side of a subsequently backfilled soilpit. Before Day 90, soil water contents were measuredperiodically over the same depth with a time-domainreflectometer (Soil Moisture Equipment, Santa Bar-bara, CA). The measurements between the two typesof instruments were comparable.
2.4. Data processing
Data were screened vigorously for both anomalousturbulent statistics and sensor malfunction, both ofwhich introduced periods without reliable flux data.The portion of missing or rejected data was 14% on thetower and 16% on the forest floor system. To obtaindaily and annual sums, it was necessary to fill in miss-ing data. Hourly latent heat fluxes (LE) that were miss-ing or were of insufficient quality on the forest floorsystem were assessed from the product of equilibriumevaporation for the hour (LEeq=(Rnf−G)ε/(ε+1)) andthe mean Priestly–Taylor coefficient (α=E/Eeq). E isthe measured evaporation (kg m−2 s−1); ε is sL/Cp,wheres is the slope of the saturation specific humid-ity versus temperature (K−1); L is the latent heat ofvaporization (J kg−1); Cp is the specific heat capacity(J kg−1 K−1), Rnf is the net radiation (W m−2) at theforest floor; andG is the soil heat transfer (W m−2).Values ofα were obtained for the dormant and thegrowing season for each of three categories: ‘dry’, ‘in-termediate’ or ‘wet’ litter layers.
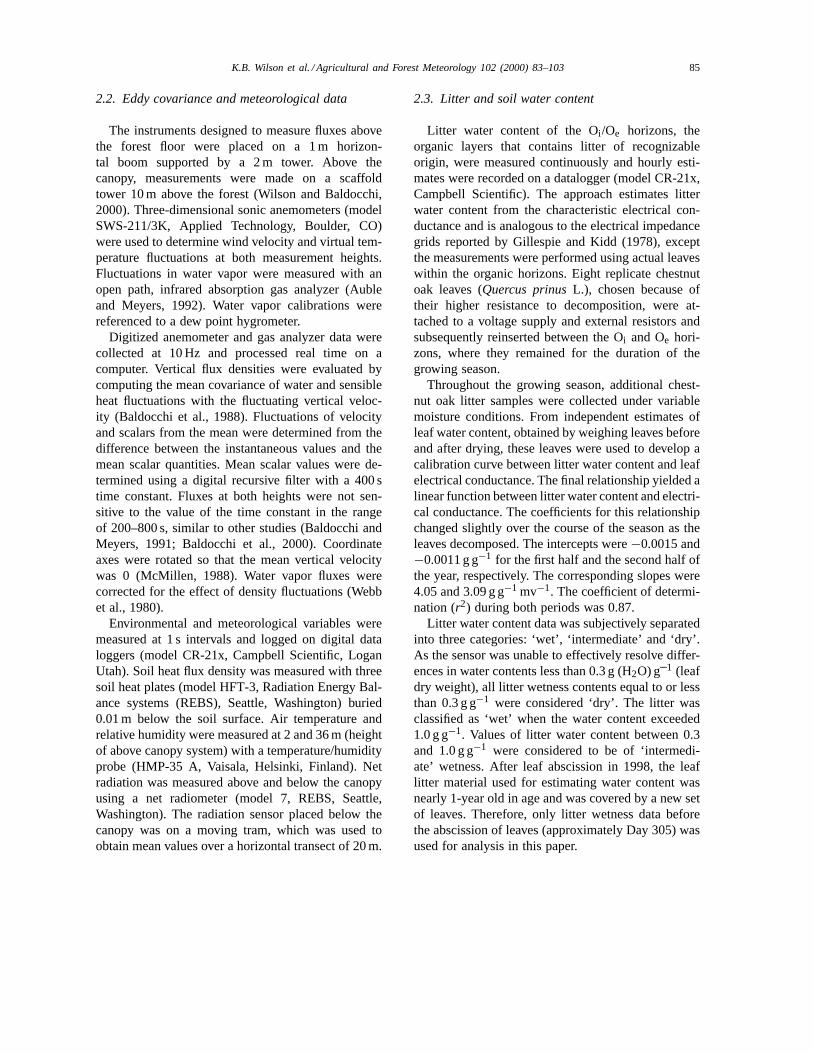
The relationship between LE and LEeq at the forestfloor during the dormant season is shown in Fig. 1 forperiods of ‘wet’ and ‘dry’ leaf litter. Although this re-lationship is not particularly robust, the procedure doesaccount for large differences between wet and dry leaflitter. Also, a majority of the missing data occurred atnight or when precipitation or dew obscured the gasanalyzer optics or sonic transducers, which are periodswhen energy fluxes were expected to be small. Miss-ing sensible heat fluxes (H) were assessed from theregression equation describing the energy balance (seeSection 3.1). Flux data above the canopy was synthe-sized using similar procedures (Wilson and Baldocchi,2000). Daily and annual sums of latent and sensible
Fig. 1. LE vs. equilibrium LE (LEeq, see text) during the dormantseason for ‘wet’ (d) or ‘dry’ (5) litter wetness. Slopes of therelationship (the parameterα) are 0.61 (wet,r2=0.52) and 0.09(dry, r2=0.10).
heat flux were not highly sensitive to data acceptancecriteria or methods of estimating missing hours.
Surface conductance of the forest floor (Gflr ) wascomputed by inverting the Penman–Monteith equation(Shuttleworth et al., 1984):
1
Gflr= εβ − 1
Ga+ ρD
E(1)
Whereρ is the density of air (kg m−3), D is the specifichumidity deficit of the air at 2 m (kg kg−1), β is the ra-tio of sensible to latent heat flux (H/LE). The aerody-namic conductance (Ga) was determined fromu′w′/U
(Monteith and Unsworth, 1990), whereu′w′ and Uare the momentum flux and the mean wind speed at2 m, respectively. Daily values of surface conductancewere computed by weighting the surface conductanceover the day by net radiation (Wilson and Baldocchi,2000).
Maximum leaf area was computed from litter basketcollections. Continuous estimates of total plant areaindex were computed by applying Beers Law to solarradiation measurements above and below the canopy(Greco and Baldocchi, 1996). Leaf area was obtainedby subtracting the woody canopy area index, whichwas obtained during leafless periods (Hutchison et al.,
K.B. Wilson et al. / Agricultural and Forest Meteorology 102 (2000) 83–103 87
1986), from the total plant area index. The growingseason was defined as the period when leaf area wasat least 40% of the maximum, which we roughly es-timated as being between Days 115 and 305. Theremainder of the year was classified as the dormantseason.
3. Results
3.1. Energy balance closure and spectral analysis
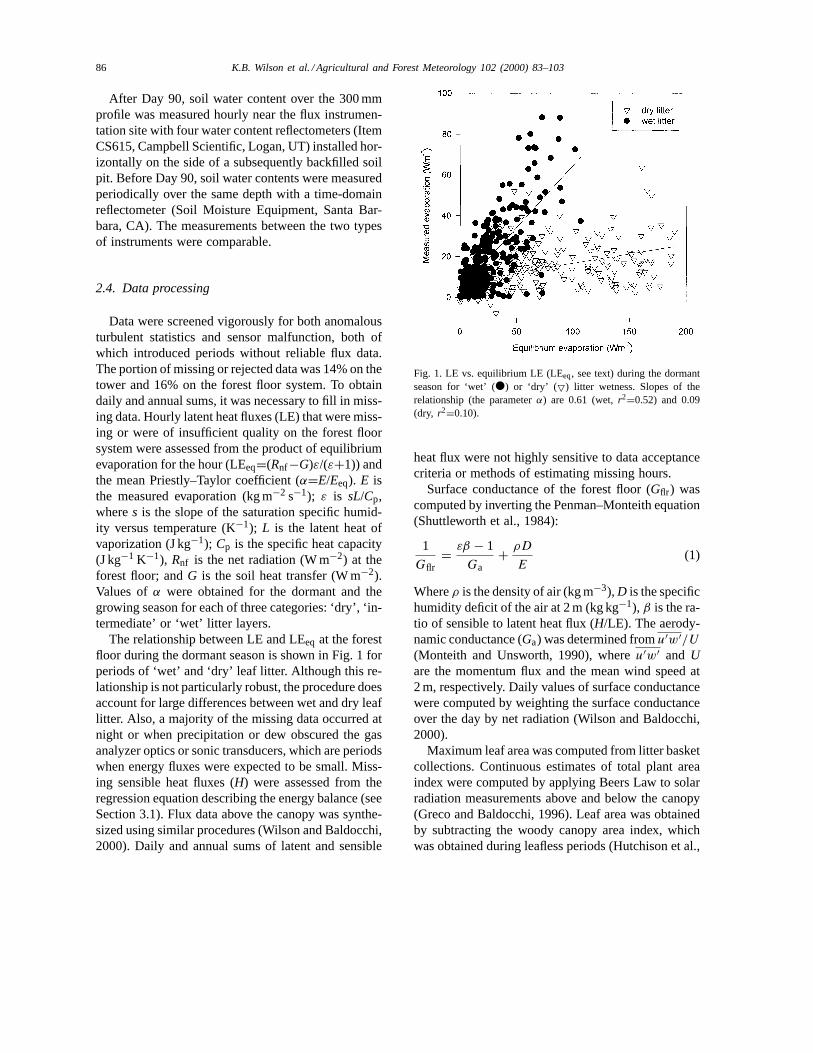
Two checks on the quality of eddy covariance dataare energy balance closure (Baldocchi et al., 1988)and spectral analysis (Baldocchi and Meyers, 1991).The hourly energy balance at the forest floor (LE+HversusRnf−G) during the dormant season is shown inFig. 2. The slope is less than 1 (0.80), similar to theabove-canopy fluxes (Wilson and Baldocchi, 2000).The intercept of 1.98 W m−2 was not significantly dif-ferent from 0 and the coefficient of determination (r2)was 0.90. Although there were no statistical differ-ences between data during periods of ‘wet’ and ‘dry’leaf litter (Fig. 2), energy balance closure at the forest
Fig. 2. Half-hourly sums of LE+H against available energy(Rnf−G) during the dormant period. Linear regression through alldata shown as a dashed line (slope=0.80; r2=0.90). Data is ei-ther from periods of ‘wet’ or ‘intermediate’ litter wetness (d), or‘dry’ litter ( 5) wetness.
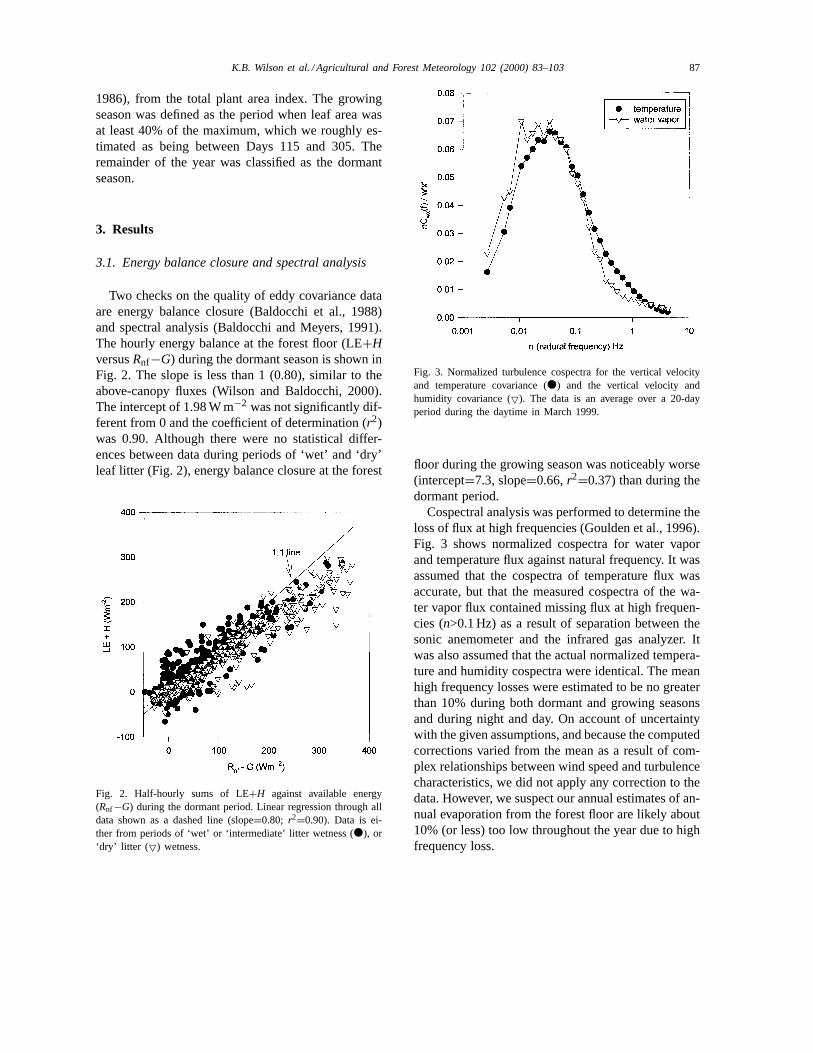
Fig. 3. Normalized turbulence cospectra for the vertical velocityand temperature covariance (d) and the vertical velocity andhumidity covariance (5). The data is an average over a 20-dayperiod during the daytime in March 1999.
floor during the growing season was noticeably worse(intercept=7.3, slope=0.66,r2=0.37) than during thedormant period.
Cospectral analysis was performed to determine theloss of flux at high frequencies (Goulden et al., 1996).Fig. 3 shows normalized cospectra for water vaporand temperature flux against natural frequency. It wasassumed that the cospectra of temperature flux wasaccurate, but that the measured cospectra of the wa-ter vapor flux contained missing flux at high frequen-cies (n>0.1 Hz) as a result of separation between thesonic anemometer and the infrared gas analyzer. Itwas also assumed that the actual normalized tempera-ture and humidity cospectra were identical. The meanhigh frequency losses were estimated to be no greaterthan 10% during both dormant and growing seasonsand during night and day. On account of uncertaintywith the given assumptions, and because the computedcorrections varied from the mean as a result of com-plex relationships between wind speed and turbulencecharacteristics, we did not apply any correction to thedata. However, we suspect our annual estimates of an-nual evaporation from the forest floor are likely about10% (or less) too low throughout the year due to highfrequency loss.
88 K.B. Wilson et al. / Agricultural and Forest Meteorology 102 (2000) 83–103
3.2. Climate forcing
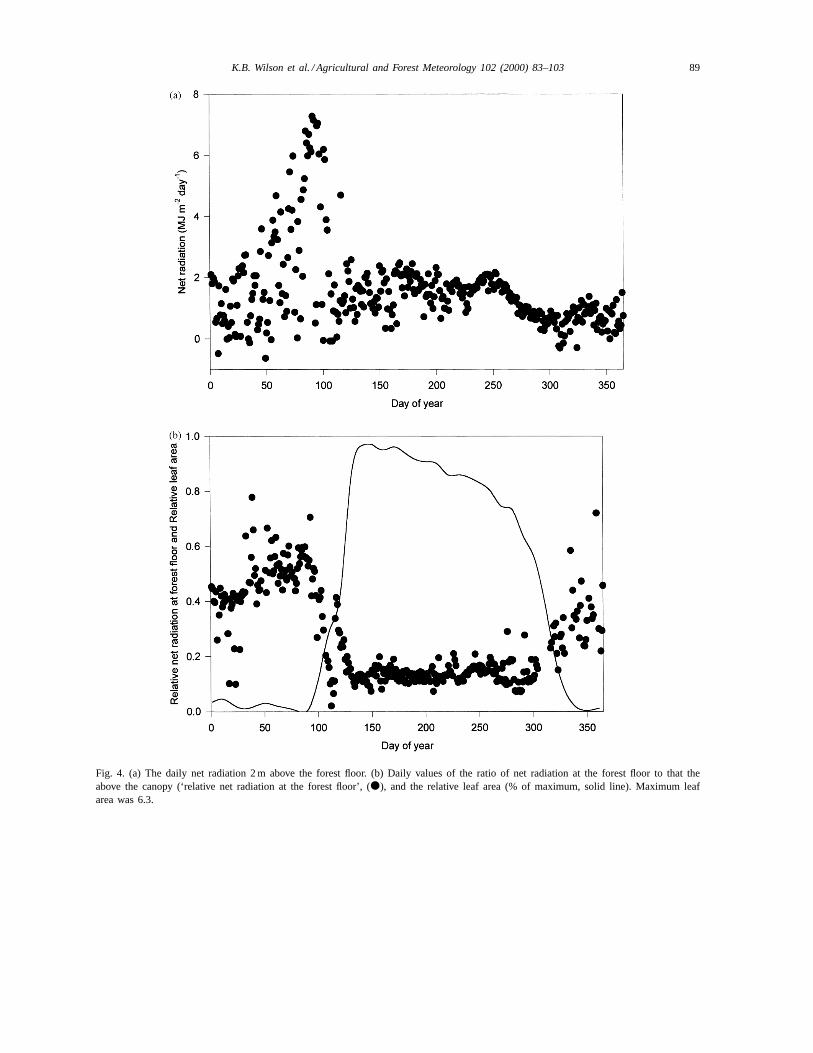
Climate and environmental forcing variables con-trol energy and energy partitioning at the forest floor.The daily and annual trends in leaf area and four im-portant forcing variables, net radiation, vapor pressuredeficit (VPD), wind speed and water content (litter andsoil) are shown in Figs. 4–7. Above the canopy, netradiation follows the increase in solar elevation angleas the year progresses, with daily variation primarilyresulting from cloudiness (not shown). Above-canopynet radiation is important for determining net radia-tion below the canopy, but it is not the only impor-tant factor, as demonstrated by the non-constant ratioof net radiation at the forest floor to that above thecanopy (Fig. 4b). The presence or lack of leaves isalso a major control on the absolute value of net radi-ation at the forest floor (Fig. 4a) and largely controlsthe fraction of above-canopy net radiation present atthe forest floor (Fig. 4b). Total net radiation at the for-est floor during the dormant season (Days 1–115 andDays 305–365) was 44% of the value at the top of thecanopy (Table 1), but was not constant and increasedslightly with the solar zenith angle to about 60% inspring (just before Day 100, Fig. 4b). This peak oc-curs immediately before leaf emergence, and is fol-lowed by a rapid decrease as canopy leaves expand.During the growing season (Days 116–304), the to-tal net radiation at the forest floor was only 13.8% ofthat above the canopy (Table 2). Over the annual cy-cle, the total net radiation measured at the forest floorwas 21.5% (602 MJ m−2) of that measured at the topof the canopy (Table 3). Approximately one-third ofthis radiation was received during a 40-day period justprior to leaf emergence (Fig. 4a).
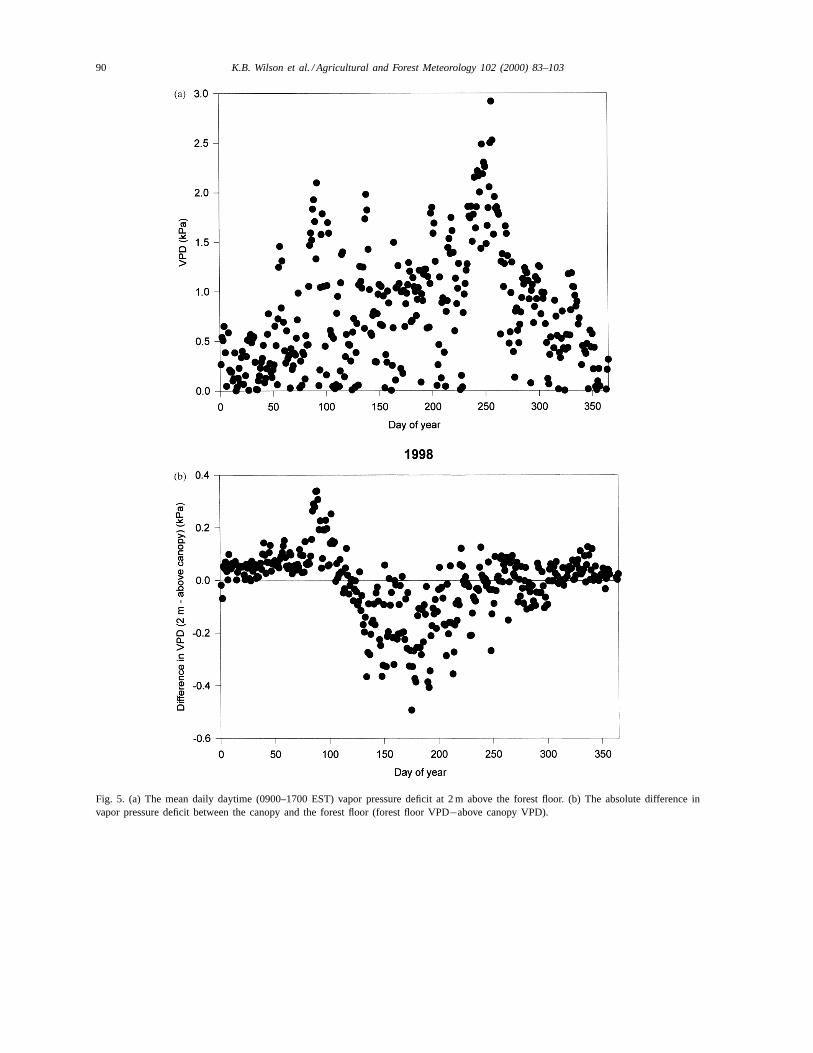
The coupling between above and below the canopywas much stronger for VPD than for net radiation, dur-ing both dormant and growing seasons (Fig. 5). Therewas a tendency for the VPD to be slightly greater atthe forest floor just before leaf emergence and greaterabove the canopy during most of the growing season(Fig. 5b). In dramatic contrast to net radiation, VPD atthe forest floor remained high during the entire grow-ing season (Fig. 5a).
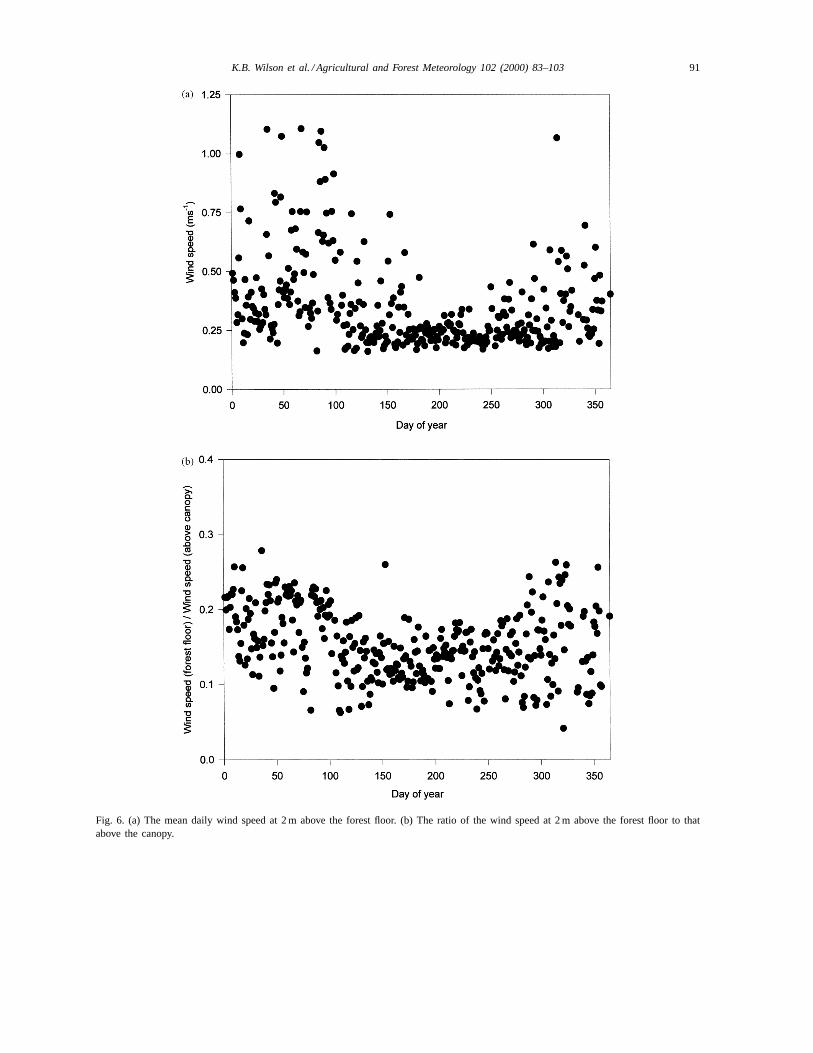
Mean daily wind speed at the forest floor was gen-erally greater and more variable during the dormantseason than during the growing season, when it wasoften near or less than 0.25 ms−1 (Fig. 6a). Wind speed
above the canopy was also typically greater during thedormant season (not shown). As a result, the ratio ofbelow to above canopy wind speeds decreased onlyslightly during the growing season (Fig. 6b), and av-eraged about 0.15 over the year.
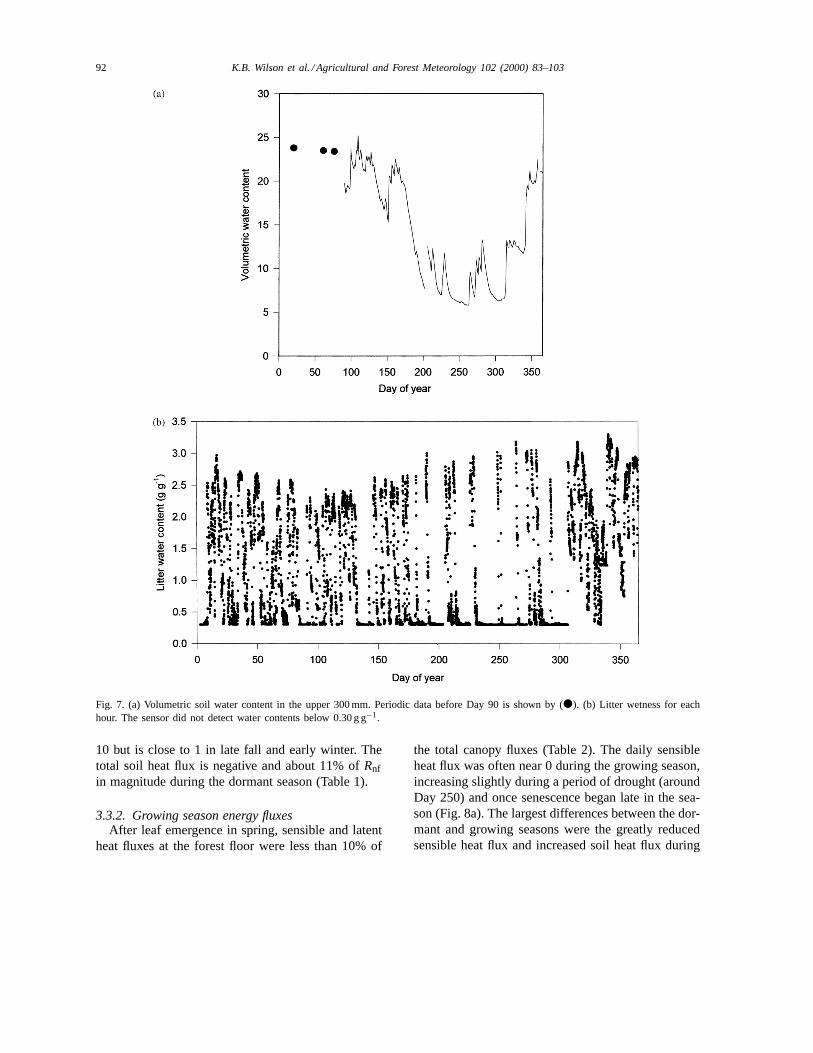
Soil water content in the top 300 mm is shown inFig. 7a. Precipitation during the first half of 1998was above normal, but a drought occurred through-out much of August through October, with the lowestsoil water contents occurring during the growing sea-son between Days 240 and 265. Litter water content(Fig. 7b) varied at a much higher temporal resolutionover the year than soil water content, often changingby nearly an order of magnitude over one to severaldays in response to rain events and rapid drying.
3.3. Overall seasonality of fluxes
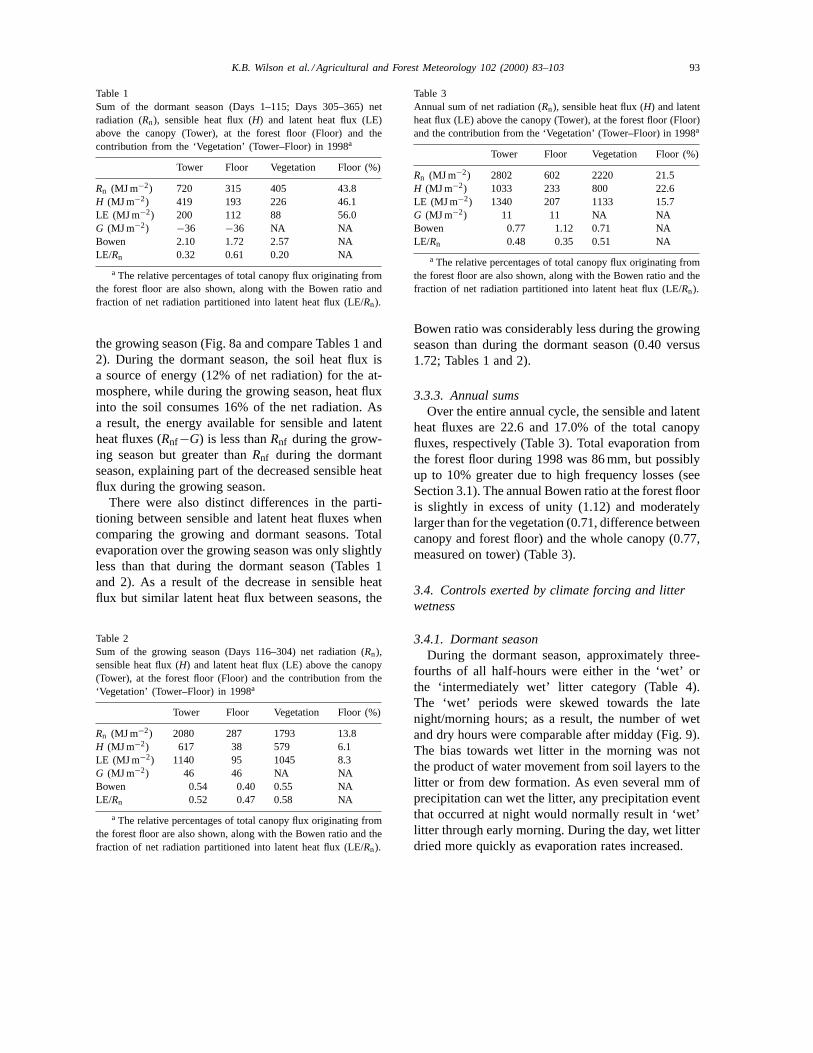
The daily energy flux densities at the forest floorover the 2 years are shown in Fig. 8. The most dra-matic seasonal pattern is the distinct peak in sensibleheat flux just preceding leaf emergence and the sud-den decline following leaf emergence. This peak co-incides temporally with that of net radiation (Fig. 4).There was also seasonality in the soil heat flux, it be-ing generally negative during the cold season and pos-itive during the warm season (Fig. 8b). Despite theseclear seasonal patterns of net radiation and sensibleand soil heat flux, there is much less seasonality in thelatent heat flux (Fig. 8a). Evaporation from the for-est floor only rarely exceeded 0.5 mm (approximately1.25 MJ m−2) on any day. The daily variability in allthe fluxes was generally less during the growing sea-son, but especially so for net radiation, sensible heatflux and soil heat flux.
3.3.1. Dormant season fluxesDuring the dormant period, both sensible and latent
heat fluxes at the forest floor are an important fraction(46 and 56%) of the total canopy fluxes, but there areindications that a sizeable portion (54% ofH and 44%of LE) of the total canopy fluxes originates from thewoody biomass (Table 1). The Bowen ratio (H/LE)at the forest floor over the entire dormant period was1.72, but was not constant, and was clearly the largestimmediately preceding leaf emergence (Fig. 8a). TheBowen ratio on mostly sunny spring days approaches
K.B. Wilson et al. / Agricultural and Forest Meteorology 102 (2000) 83–103 89
Fig. 4. (a) The daily net radiation 2 m above the forest floor. (b) Daily values of the ratio of net radiation at the forest floor to that theabove the canopy (‘relative net radiation at the forest floor’, (d), and the relative leaf area (% of maximum, solid line). Maximum leafarea was 6.3.
90 K.B. Wilson et al. / Agricultural and Forest Meteorology 102 (2000) 83–103
Fig. 5. (a) The mean daily daytime (0900–1700 EST) vapor pressure deficit at 2 m above the forest floor. (b) The absolute difference invapor pressure deficit between the canopy and the forest floor (forest floor VPD−above canopy VPD).
K.B. Wilson et al. / Agricultural and Forest Meteorology 102 (2000) 83–103 91
Fig. 6. (a) The mean daily wind speed at 2 m above the forest floor. (b) The ratio of the wind speed at 2 m above the forest floor to thatabove the canopy.
92 K.B. Wilson et al. / Agricultural and Forest Meteorology 102 (2000) 83–103
Fig. 7. (a) Volumetric soil water content in the upper 300 mm. Periodic data before Day 90 is shown by (d). (b) Litter wetness for eachhour. The sensor did not detect water contents below 0.30 g g−1.
10 but is close to 1 in late fall and early winter. Thetotal soil heat flux is negative and about 11% ofRnfin magnitude during the dormant season (Table 1).
3.3.2. Growing season energy fluxesAfter leaf emergence in spring, sensible and latent
heat fluxes at the forest floor were less than 10% of
the total canopy fluxes (Table 2). The daily sensibleheat flux was often near 0 during the growing season,increasing slightly during a period of drought (aroundDay 250) and once senescence began late in the sea-son (Fig. 8a). The largest differences between the dor-mant and growing seasons were the greatly reducedsensible heat flux and increased soil heat flux during
K.B. Wilson et al. / Agricultural and Forest Meteorology 102 (2000) 83–103 93
Table 1Sum of the dormant season (Days 1–115; Days 305–365) netradiation (Rn), sensible heat flux (H) and latent heat flux (LE)above the canopy (Tower), at the forest floor (Floor) and thecontribution from the ‘Vegetation’ (Tower–Floor) in 1998a
Tower Floor Vegetation Floor (%)
Rn (MJ m−2) 720 315 405 43.8H (MJ m−2) 419 193 226 46.1LE (MJ m−2) 200 112 88 56.0G (MJ m−2) −36 −36 NA NABowen 2.10 1.72 2.57 NALE/Rn 0.32 0.61 0.20 NA
a The relative percentages of total canopy flux originating fromthe forest floor are also shown, along with the Bowen ratio andfraction of net radiation partitioned into latent heat flux (LE/Rn).
the growing season (Fig. 8a and compare Tables 1 and2). During the dormant season, the soil heat flux isa source of energy (12% of net radiation) for the at-mosphere, while during the growing season, heat fluxinto the soil consumes 16% of the net radiation. Asa result, the energy available for sensible and latentheat fluxes (Rnf−G) is less thanRnf during the grow-ing season but greater thanRnf during the dormantseason, explaining part of the decreased sensible heatflux during the growing season.
There were also distinct differences in the parti-tioning between sensible and latent heat fluxes whencomparing the growing and dormant seasons. Totalevaporation over the growing season was only slightlyless than that during the dormant season (Tables 1and 2). As a result of the decrease in sensible heatflux but similar latent heat flux between seasons, the
Table 2Sum of the growing season (Days 116–304) net radiation (Rn),sensible heat flux (H) and latent heat flux (LE) above the canopy(Tower), at the forest floor (Floor) and the contribution from the‘Vegetation’ (Tower–Floor) in 1998a
Tower Floor Vegetation Floor (%)
Rn (MJ m−2) 2080 287 1793 13.8H (MJ m−2) 617 38 579 6.1LE (MJ m−2) 1140 95 1045 8.3G (MJ m−2) 46 46 NA NABowen 0.54 0.40 0.55 NALE/Rn 0.52 0.47 0.58 NA
a The relative percentages of total canopy flux originating fromthe forest floor are also shown, along with the Bowen ratio and thefraction of net radiation partitioned into latent heat flux (LE/Rn).
Table 3Annual sum of net radiation (Rn), sensible heat flux (H) and latentheat flux (LE) above the canopy (Tower), at the forest floor (Floor)and the contribution from the ‘Vegetation’ (Tower–Floor) in 1998a
Tower Floor Vegetation Floor (%)
Rn (MJ m−2) 2802 602 2220 21.5H (MJ m−2) 1033 233 800 22.6LE (MJ m−2) 1340 207 1133 15.7G (MJ m−2) 11 11 NA NABowen 0.77 1.12 0.71 NALE/Rn 0.48 0.35 0.51 NA
a The relative percentages of total canopy flux originating fromthe forest floor are also shown, along with the Bowen ratio and thefraction of net radiation partitioned into latent heat flux (LE/Rn).
Bowen ratio was considerably less during the growingseason than during the dormant season (0.40 versus1.72; Tables 1 and 2).
3.3.3. Annual sumsOver the entire annual cycle, the sensible and latent
heat fluxes are 22.6 and 17.0% of the total canopyfluxes, respectively (Table 3). Total evaporation fromthe forest floor during 1998 was 86 mm, but possiblyup to 10% greater due to high frequency losses (seeSection 3.1). The annual Bowen ratio at the forest flooris slightly in excess of unity (1.12) and moderatelylarger than for the vegetation (0.71, difference betweencanopy and forest floor) and the whole canopy (0.77,measured on tower) (Table 3).
3.4. Controls exerted by climate forcing and litterwetness
3.4.1. Dormant seasonDuring the dormant season, approximately three-
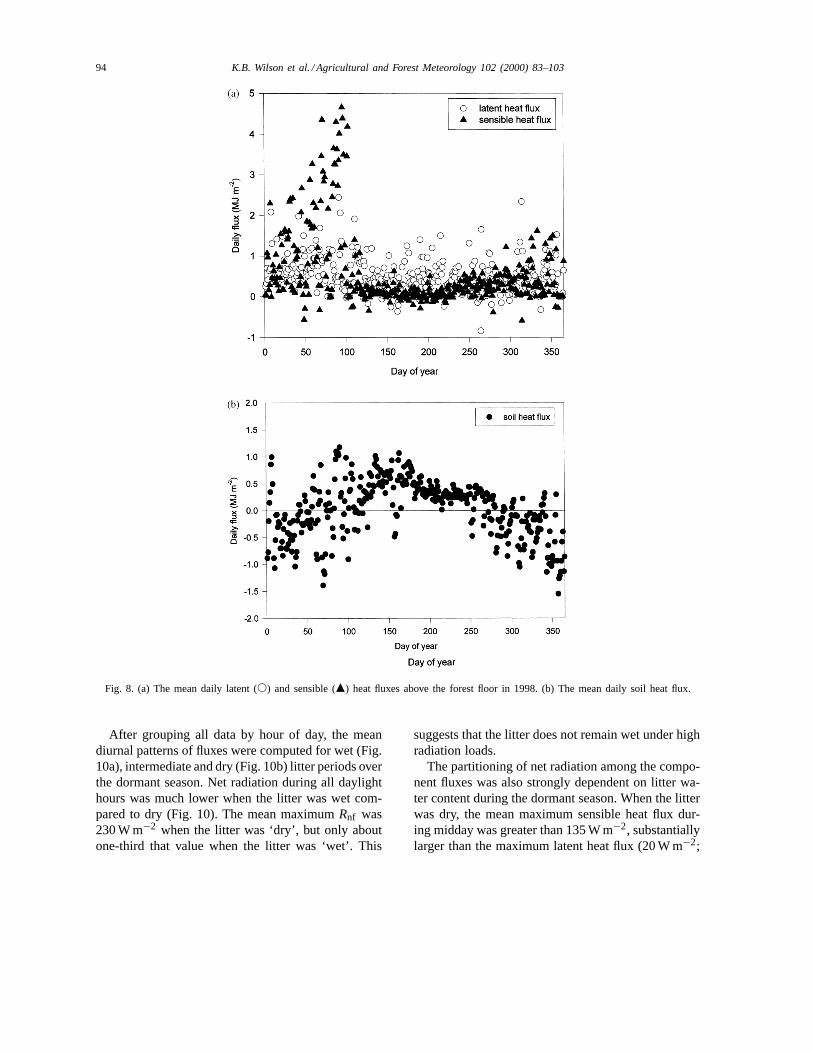
fourths of all half-hours were either in the ‘wet’ orthe ‘intermediately wet’ litter category (Table 4).The ‘wet’ periods were skewed towards the latenight/morning hours; as a result, the number of wetand dry hours were comparable after midday (Fig. 9).The bias towards wet litter in the morning was notthe product of water movement from soil layers to thelitter or from dew formation. As even several mm ofprecipitation can wet the litter, any precipitation eventthat occurred at night would normally result in ‘wet’litter through early morning. During the day, wet litterdried more quickly as evaporation rates increased.
94 K.B. Wilson et al. / Agricultural and Forest Meteorology 102 (2000) 83–103
Fig. 8. (a) The mean daily latent (s) and sensible (m) heat fluxes above the forest floor in 1998. (b) The mean daily soil heat flux.
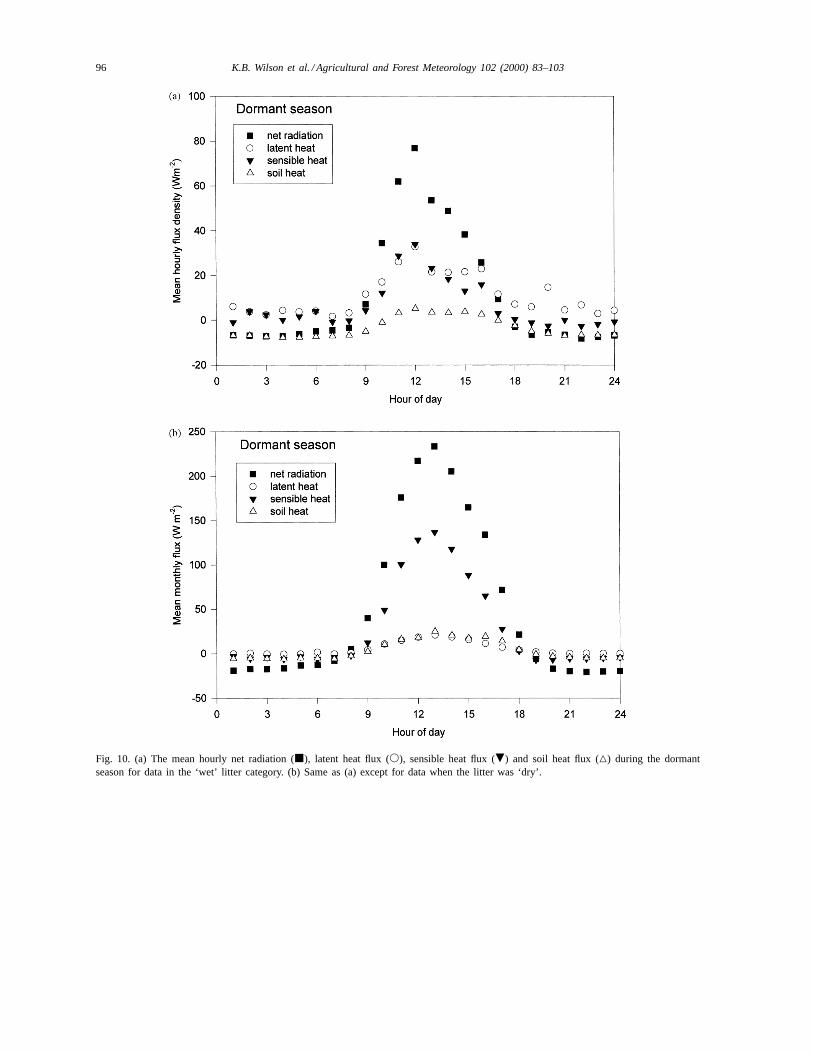
After grouping all data by hour of day, the meandiurnal patterns of fluxes were computed for wet (Fig.10a), intermediate and dry (Fig. 10b) litter periods overthe dormant season. Net radiation during all daylighthours was much lower when the litter was wet com-pared to dry (Fig. 10). The mean maximumRnf was230 W m−2 when the litter was ‘dry’, but only aboutone-third that value when the litter was ‘wet’. This
suggests that the litter does not remain wet under highradiation loads.
The partitioning of net radiation among the compo-nent fluxes was also strongly dependent on litter wa-ter content during the dormant season. When the litterwas dry, the mean maximum sensible heat flux dur-ing midday was greater than 135 W m−2, substantiallylarger than the maximum latent heat flux (20 W m−2;
K.B. Wilson et al. / Agricultural and Forest Meteorology 102 (2000) 83–103 95
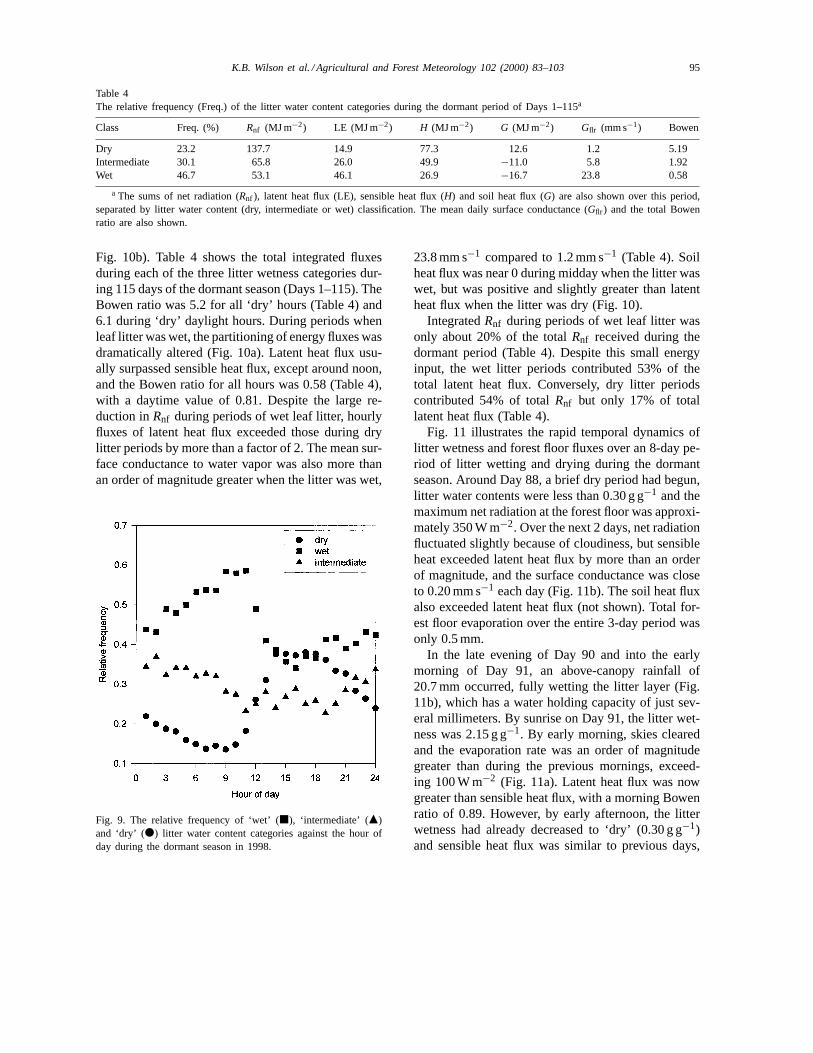
Table 4The relative frequency (Freq.) of the litter water content categories during the dormant period of Days 1–115a
Class Freq. (%) Rnf (MJ m−2) LE (MJ m−2) H (MJ m−2) G (MJ m−2) Gflr (mm s−1) Bowen
Dry 23.2 137.7 14.9 77.3 12.6 1.2 5.19Intermediate 30.1 65.8 26.0 49.9 −11.0 5.8 1.92Wet 46.7 53.1 46.1 26.9 −16.7 23.8 0.58
a The sums of net radiation (Rnf ), latent heat flux (LE), sensible heat flux (H) and soil heat flux (G) are also shown over this period,separated by litter water content (dry, intermediate or wet) classification. The mean daily surface conductance (Gflr ) and the total Bowenratio are also shown.
Fig. 10b). Table 4 shows the total integrated fluxesduring each of the three litter wetness categories dur-ing 115 days of the dormant season (Days 1–115). TheBowen ratio was 5.2 for all ‘dry’ hours (Table 4) and6.1 during ‘dry’ daylight hours. During periods whenleaf litter was wet, the partitioning of energy fluxes wasdramatically altered (Fig. 10a). Latent heat flux usu-ally surpassed sensible heat flux, except around noon,and the Bowen ratio for all hours was 0.58 (Table 4),with a daytime value of 0.81. Despite the large re-duction inRnf during periods of wet leaf litter, hourlyfluxes of latent heat flux exceeded those during drylitter periods by more than a factor of 2. The mean sur-face conductance to water vapor was also more thanan order of magnitude greater when the litter was wet,
Fig. 9. The relative frequency of ‘wet’ (j), ‘intermediate’ (m)and ‘dry’ (d) litter water content categories against the hour ofday during the dormant season in 1998.
23.8 mm s−1 compared to 1.2 mm s−1 (Table 4). Soilheat flux was near 0 during midday when the litter waswet, but was positive and slightly greater than latentheat flux when the litter was dry (Fig. 10).
IntegratedRnf during periods of wet leaf litter wasonly about 20% of the totalRnf received during thedormant period (Table 4). Despite this small energyinput, the wet litter periods contributed 53% of thetotal latent heat flux. Conversely, dry litter periodscontributed 54% of totalRnf but only 17% of totallatent heat flux (Table 4).
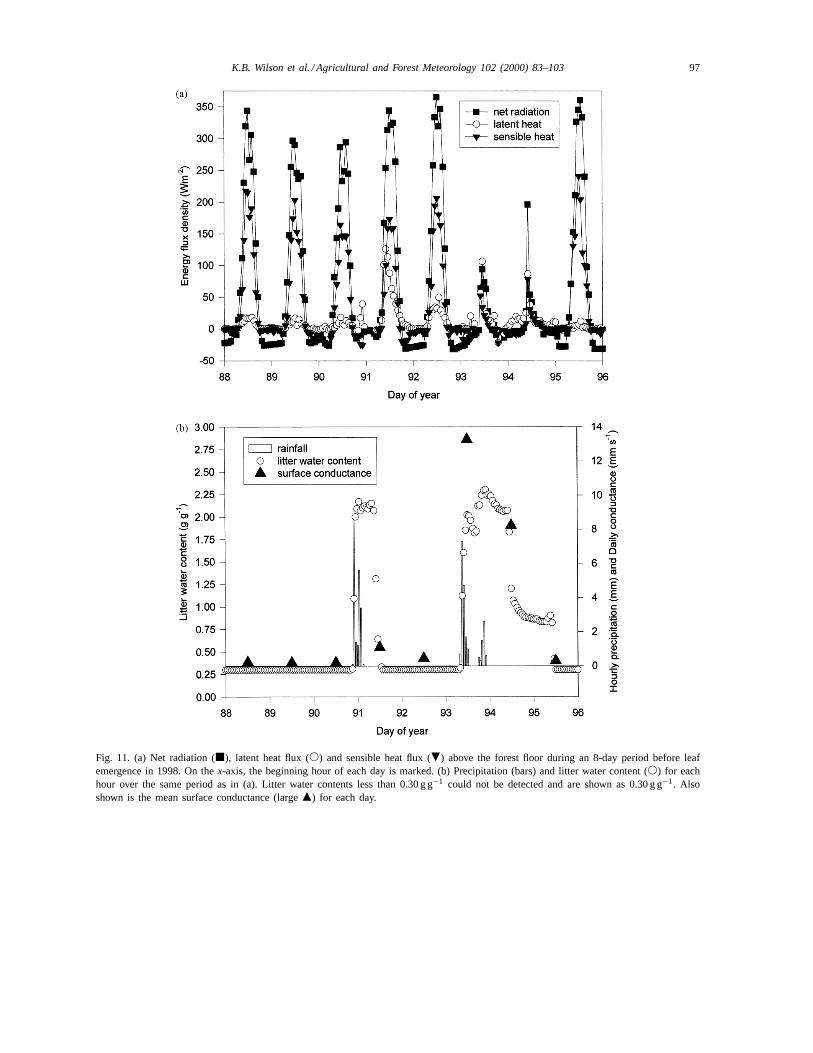
Fig. 11 illustrates the rapid temporal dynamics oflitter wetness and forest floor fluxes over an 8-day pe-riod of litter wetting and drying during the dormantseason. Around Day 88, a brief dry period had begun,litter water contents were less than 0.30 g g−1 and themaximum net radiation at the forest floor was approxi-mately 350 W m−2. Over the next 2 days, net radiationfluctuated slightly because of cloudiness, but sensibleheat exceeded latent heat flux by more than an orderof magnitude, and the surface conductance was closeto 0.20 mm s−1 each day (Fig. 11b). The soil heat fluxalso exceeded latent heat flux (not shown). Total for-est floor evaporation over the entire 3-day period wasonly 0.5 mm.
In the late evening of Day 90 and into the earlymorning of Day 91, an above-canopy rainfall of20.7 mm occurred, fully wetting the litter layer (Fig.11b), which has a water holding capacity of just sev-eral millimeters. By sunrise on Day 91, the litter wet-ness was 2.15 g g−1. By early morning, skies clearedand the evaporation rate was an order of magnitudegreater than during the previous mornings, exceed-ing 100 W m−2 (Fig. 11a). Latent heat flux was nowgreater than sensible heat flux, with a morning Bowenratio of 0.89. However, by early afternoon, the litterwetness had already decreased to ‘dry’ (0.30 g g−1)and sensible heat flux was similar to previous days,
96 K.B. Wilson et al. / Agricultural and Forest Meteorology 102 (2000) 83–103
Fig. 10. (a) The mean hourly net radiation (j), latent heat flux (s), sensible heat flux (.) and soil heat flux (4) during the dormantseason for data in the ‘wet’ litter category. (b) Same as (a) except for data when the litter was ‘dry’.
K.B. Wilson et al. / Agricultural and Forest Meteorology 102 (2000) 83–103 97
Fig. 11. (a) Net radiation (j), latent heat flux (s) and sensible heat flux (.) above the forest floor during an 8-day period before leafemergence in 1998. On thex-axis, the beginning hour of each day is marked. (b) Precipitation (bars) and litter water content (s) for eachhour over the same period as in (a). Litter water contents less than 0.30 g g−1 could not be detected and are shown as 0.30 g g−1. Alsoshown is the mean surface conductance (largem) for each day.
98 K.B. Wilson et al. / Agricultural and Forest Meteorology 102 (2000) 83–103
substantially surpassing latent heat flux. The after-noon Bowen ratio increased to 2.3. Total forest floorevaporation during Day 91 was about 1.0 mm, anexceptionally high rate for this forest and one of thehighest measured on any day, indicating there wassome daily variability. The mean surface conductance(Eq. (1)) was 1.08 mm s−1, but it declined by nearlytwo orders of magnitude during the day from around20 to 0.5 mm s−1 as the leaf litter dried. On the fol-lowing day (Day 92), the latent heat flux remainedbelow 50 W m−2, the mean surface conductance was0.44 mm s−1 and energy partitioning was dominatedby sensible heat flux and net radiation. Early thefollowing morning (Day 93), 20.9 mm of precipita-tion fell (Fig. 11b). Over the next 2 days,Rnf wasgreatly diminished by cloudiness, leaf litter wetnessremained above 0.75 g g−1, mean surface conduc-tance was greater than 8 mm s−1 and latent heat fluxexceeded sensible heat flux (Fig. 11a). Heat flux intothe soil was also reduced during this cloudy period(not shown). By Day 95, the net radiation increased,litter wetness rapidly fell to 0.3 g g−1, the surfaceconductance approached 0.20 mm s−1 and the fluxesquickly resumed the familiar pattern observed duringthe earlier dry periods. Although litter water contentand the partitioning of energy fluxes varied tremen-dously during this 8-day period, the relative variationin volumeteric soil water content was only 6% (from18.6 to 19.8%) and there was essentially no change insoil water potential, indicating that soil water contentwas not the factor influencing surface fluxes.
3.4.2. Growing seasonDuring the growing season, the leaf litter was more
frequently dry because of the extended drought, butlitter wetness was less important as a control of en-ergy fluxes than during the dormant season (Table 5).
Table 5The relative frequency (Freq.) of the litter water content categories during the growing season (Days 116–305)a
Class Freq. (%) Rn (MJ m−2) LE (MJ m−2) H (MJ m−2) G (MJ m−2) Gflr (mm s−1) Bowen
Dry 45.1 178.2 46.7 25.5 30.4 0.87 0.55Intermediate 28.9 50.8 23.3 7.8 4.5 4.2 0.33Wet 26.1 57.9 25.0 4.7 11.0 16.4 0.19
a The sums of net radiation (Rnf ), latent heat flux (LE), sensible heat flux (H) and soil heat flux (G) are also shown over this period,separated by litter water content (dry, intermediate or wet) classification. The mean daily surface conductance (Gflr ) and the Bowen ratioare also shown.
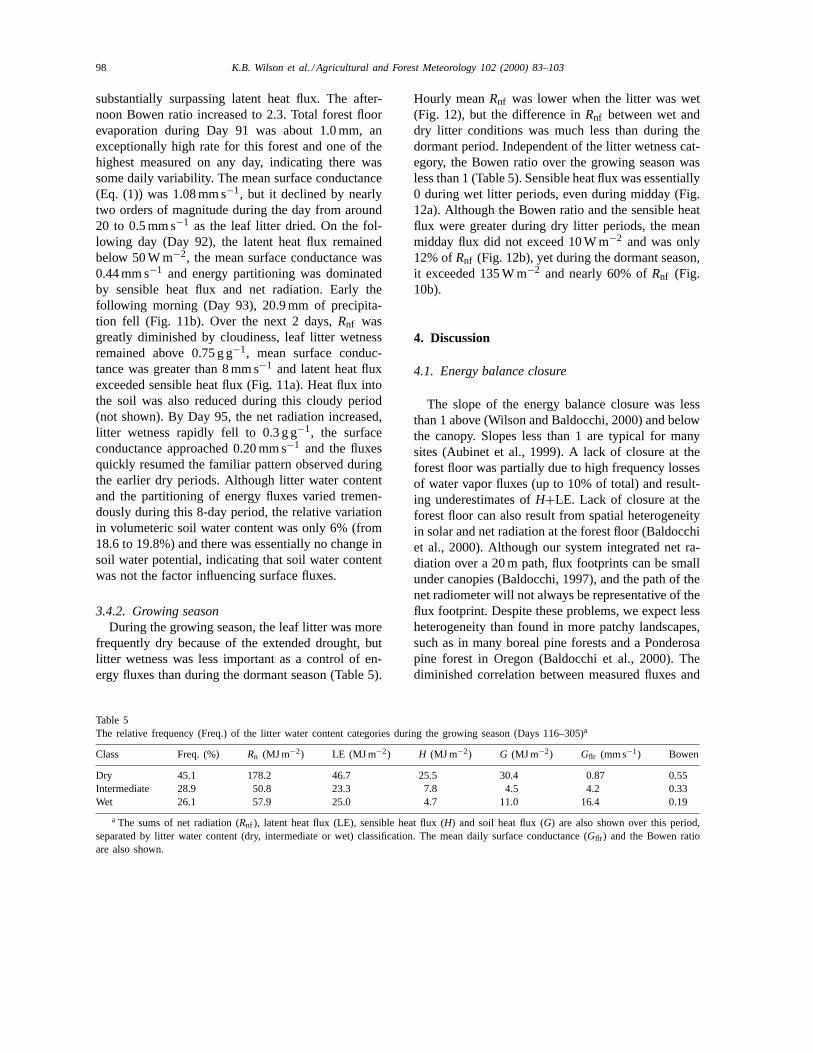
Hourly meanRnf was lower when the litter was wet(Fig. 12), but the difference inRnf between wet anddry litter conditions was much less than during thedormant period. Independent of the litter wetness cat-egory, the Bowen ratio over the growing season wasless than 1 (Table 5). Sensible heat flux was essentially0 during wet litter periods, even during midday (Fig.12a). Although the Bowen ratio and the sensible heatflux were greater during dry litter periods, the meanmidday flux did not exceed 10 W m−2 and was only12% ofRnf (Fig. 12b), yet during the dormant season,it exceeded 135 W m−2 and nearly 60% ofRnf (Fig.10b).
4. Discussion
4.1. Energy balance closure
The slope of the energy balance closure was lessthan 1 above (Wilson and Baldocchi, 2000) and belowthe canopy. Slopes less than 1 are typical for manysites (Aubinet et al., 1999). A lack of closure at theforest floor was partially due to high frequency lossesof water vapor fluxes (up to 10% of total) and result-ing underestimates ofH+LE. Lack of closure at theforest floor can also result from spatial heterogeneityin solar and net radiation at the forest floor (Baldocchiet al., 2000). Although our system integrated net ra-diation over a 20 m path, flux footprints can be smallunder canopies (Baldocchi, 1997), and the path of thenet radiometer will not always be representative of theflux footprint. Despite these problems, we expect lessheterogeneity than found in more patchy landscapes,such as in many boreal pine forests and a Ponderosapine forest in Oregon (Baldocchi et al., 2000). Thediminished correlation between measured fluxes and
K.B. Wilson et al. / Agricultural and Forest Meteorology 102 (2000) 83–103 99
Fig. 12. (a) The mean hourly net radiation (j), latent heat flux (s) and sensible heat flux (.) above the forest floor and the soil heatflux (4) during the growing season when leaf litter was in the ‘wet’ category. (b) Same as (a) except for data when the litter was ‘dry’.
100 K.B. Wilson et al. / Agricultural and Forest Meteorology 102 (2000) 83–103
available energy during the growing season comparedto the dormant season has two primary causes. First,during the growing season, the heterogeneity at theforest floor increases as leaves emerge and gaps insolar radiation develop (Baldocchi et al., 1986). Dur-ing this period, the path of the net radiometer is lesslikely to be representative of the flux footprint. Sec-ondly, the magnitudes of the fluxes are constrained bylower maximums in net radiation, and relative errorsin fluxes and net radiation are magnified.
4.2. Net radiation
The two most general characteristics describing netradiation at the floor of this forest are the moderatelylow relative values (21.5% of the above-canopy valueson an annual basis), but with a distinct peak of signif-icant magnitude in late spring. The low annual mag-nitude occurs because the period of maximum solarradiation above the canopy generally coincides withthe period of maximum leaf area and radiation attenu-ation within the canopy. The peak in total net radiationat the forest floor in late spring is a result of three pro-cesses in this forest. First, total solar insulation abovethe canopy is increasing from winter values. Second,the low sun angles in the winter allowed boles to inter-cept a significant fraction of energy during the dormantperiod. With higher sun angles in spring, light trans-mission increases. Third, because of the deciduous na-ture of this forest, leaves have still not emerged evenafter spring equinox, but soon after leaf emergence,the transmission of solar radiation is quickly reduced.
Although the forest floor of more open stands, withlower maximum leaf areas, generally receives largerfractions of the above-canopy net radiation (Black andKelliher, 1989; Baldocchi and Vogel, 1997; Baldocchiet al., 2000), the annual magnitude and seasonality ofthe fraction received also depends on whether a forestis deciduous or evergreen and on the latitude and sea-sonal variation in solar angles. For example, becauseof changes in solar angle during the growing seasonalone, the relative fraction of above-canopy net radia-tion reaching the forest floor ranged from 10 to 30%in a boreal coniferous forest (Baldocchi and Vogel,1997). Although the maximum leaf area at our site isthree times larger than in the Jack pine stand (approx-imately 6 versus 2), the annual relative fraction of netradiation beneath the canopies may be similar at the
two sites because of the higher solar angles and thepresence of a dormant season in our forest. The rela-tive fraction of net radiation at the forest floor will alsobe greater if computed for all hours (as in this study)than if computed only during the daytime, especiallyduring the growing season when the canopy can de-couple the larger longwave losses above the canopyfrom those within it.
4.3. Sensible heat flux
The daily and seasonal changes in net radiation atthe forest floor, whether resulting from leaf expan-sion and senescence, seasonal changes in insulationand solar angle, or daily changes in cloudiness, hadthe largest effect on the sensible heat flux. A simi-lar seasonality in sensible heat flux, with a markedspring maximum just before leaf emergence, has beenobserved at the floor of a deciduous forest in Mas-sachusetts (Moore et al., 1996). In the Massachusettsstudy, sensible heat flux at the forest floor was roughly50% of the above-canopy values during the dormantseason, with maximum values up to 70% at high so-lar angles in spring. These large relative fluxes werereduced to only 10% after leaf emergence. In our for-est, these relative contributions were similar, 46% dur-ing the dormant season, with maximum values around65–70% in late spring, and decreasing to 6.1% duringthe growing season.
In boreal pine forests (Baldocchi and Vogel, 1997)and a Ponderosa pine forest in Oregon (Baldocchiet al., 2000), the sensible heat flux from the forest flooris generally a larger portion of total canopy flux andcan be up to 70% (Kelliher et al., 1998), but the dis-tinct spring peak in sensible heat flux is not observedin these evergreen coniferous stands. As a result,although the sensible heat flux beneath a boreal Jackpine forest was 25–40% of the total over the warmseason (Baldocchi and Vogel, 1997), the maximumrelative contribution from beneath the canopy wasnever as large as in our forest just before leaf emer-gence (65–70% late in spring).
4.4. Latent heat flux
Baldocchi and Meyers (1991) and Baldocchi andVogel (1996) have noted the relative consistency of
K.B. Wilson et al. / Agricultural and Forest Meteorology 102 (2000) 83–103 101
latent heat fluxes in this deciduous forest, but theseanalyses were limited only to the growing season.Here, we show that latent heat flux demonstrates muchless seasonality than the other flux components overan entire year. As in our forest, the effect of leaf emer-gence and the resulting dramatic increase in net radi-ation had only minor effects on latent heat flux at thefloor of the Massachusetts deciduous forest (Mooreet al., 1996). On account of the seasonality in sensiblebut not latent heat flux at the forest floor, both decid-uous forests have a very distinct decrease in Bowenratio between dormant and growing seasons. In ourforest, it ranged from 1.72 during the dormant seasonto 0.47 during the growing season. Moore et al. (1996)report ‘midday’ subcanopy Bowen ratios greater than3 during the leafless period, and the Bowen ratio ap-pears to be less during the growing season.
Although daily evaporation rates from the forestfloor approached 1.0 mm on a few select days, 0.5 mmis a more general maximum of daily evaporation in thisforest over the entire year. ‘Capping’ of forest floorevaporation at fairly low values has been observed inother types of forests, not only in dense coniferousstands (0.38 mm daily, Schaap and Bouten, 1997), butalso in some more open stands (Baldocchi et al., 2000).However, much larger mean forest floor evaporationrates of 1.6 mm per day (Kelliher et al., 1990, 1998),1.1 mm per day (Kelliher et al., 1997) and approxi-mately 1.7 mm per day (Lafleur, 1992) have been ob-served in the forests of Canada and Siberia. High ratesat certain times of the year have also been observed ina Ponderosa pine forest in Oregon (Baldocchi et al.,2000). These higher evaporation rates may only par-tially be the result of more open stands, because evenduring the dormant season when net radiation is sub-stantial, in our forest, mean evaporation rates do notapproach these magnitudes.
Evaporation from the forest floor was 56% (26 mm)of the total evapotranspiration measured above thecanopy during the dormant season (47 mm). Dur-ing the dormant (leafless) season, transpiration isassumed to be 0. Therefore, the difference betweenevapotranspiration measured above the canopy andforest floor evaporation measured below the canopyshould be the evaporation of water intercepted by treeboles and branches. This suggests that a relativelysignificant proportion (44%) of total dormant seasonevapotranspiration may be evaporation of intercepted
rainfall from the tree boles. Interception rates of thismagnitude and greater during the dormant season arenot inconsistent with previous measurements (Lux-moore and Huff, 1989). During the growing season,forest floor evaporation was only 8.3% (39 mm) oftotal evapotranspiration, and was nearly always lessthan 20% on any given day. A similar relative con-tribution (10–11%) during the growing season wasobserved in the deciduous forest in Massachusetts(Moore et al., 1996). Black and Kelliher (1989) notedthat forest floor evaporation is frequently between 3and 21% of total evapotranspiration, a conclusion alsoreached in some more recent studies (Kelliher et al.,1992; Schaap and Bouten, 1997). However, there areindications that this percentage can be significantlygreater in some forests, ranging from 20 to 40% inJack pine stands (Baldocchi and Vogel, 1996; Mooreet al., 2000), from 30 to 50% in temperate pine forests(Kelliher et al., 1990; Baldocchi et al., 2000) to 50%and greater in some high-latitude forests (Lafleur,1992; Kelliher et al., 1997, 1998).
4.5. Controls on forest floor evaporation
Two of the most distinguishing flux characteristicsof this forest floor are the strong seasonality in sen-sible heat flux but much less seasonality and an ap-parent ‘capping’ of maximum daily evaporation rates.These characteristics result from three features thatcontrol energy partitioning at the floor of this forest:(1) its deciduous nature, promoting seasonality in netenergy availability, (2) the characteristics of the leaflitter layer and (3) the apparent decoupling of evapo-transpiration from the available energy.
The deciduous nature of this forest allows for rapidseasonal changes in available energy, but this trans-lates primarily into changes in sensible heat flux. Theweak sensitivity of latent heat flux to energy availabil-ity is a characteristic of surfaces that have evapora-tion rates that are ‘coupled’ to the ambient atmosphereand are controlled by surface conductance and VPD(Jarvis and McNaughton, 1986). Strong coupling hasbeen observed in other studies at the forest floor (Bal-docchi and Vogel, 1996; Schaap and Bouten, 1997)and is also indicated in our forest by the similarityof VPD above and below the canopy. Greater windspeeds likely increase the coupling further during thedormant season.
102 K.B. Wilson et al. / Agricultural and Forest Meteorology 102 (2000) 83–103
The seasonality of forest floor evaporation moreclosely follows the seasonal pattern of VPD at theforest floor than net radiation, further indicating thatVPD is a stronger control of forest floor evaporationthan net radiation. However, VPD is not the only, oreven the major, driving force for forest floor evapora-tion. During some of the periods with highest VPDs(around Day 250), the surface evaporation is particu-larly depressed.
The rapid responses of litter water content and therelationships between litter water content, surface con-ductance and the energy fluxes indicate that availablelitter water content is probably the major factor con-trolling forest floor evaporation rates. In contrast, soilwater content is frequently decoupled from both litterwater content and the partitioning of energy.
Surface layer water content is also an importantfactor in determining forest floor evaporation rates atother sites. When the surface was wet, the Bowen ra-tio at the floor of a Ponderosa pine forest was 0.47,but it was 2.16 when it was dry (Baldocchi et al.,2000). In our forest, the Bowen ratios were 0.58 (wet)and 5.19 (dry) during the dormant season and 0.19(wet) and 0.55 (dry) during the growing season. Largedifferences in the Bowen ratio of only slightly lessermagnitude than in our study were also observed fora Jack pine forest between wet and dry events (Bal-docchi et al., 2000). Schaap and Bouten (1997) alsoshowed that litter water content strongly influencesforest-floor surface conductance and evaporation in aDouglas Fir stand. Even at sites where the magnitudeof forest floor evaporation was larger, the Bowen ratioincreased from 0.6 to 5.6, and evaporation decreasedby a factor of 3 after 9 days without rainfall (Kelliheret al., 1998).
Although wet leaf litter was associated with an or-der of magnitude reduction in the Bowen ratio com-pared to dry litter conditions, absolute differences inevaporation between wet and dry litter periods wereless, because wet litter periods were associated withmuch lower net radiation and VPDs. A similar pat-tern was found in a Jack Pine stand (Baldocchi et al.,2000) and inferred in a Douglas Fir stand (Schaap andBouten, 1997). The wetting and drying cycles in ourforest show that periods of wet litter are not associ-ated with large energy loads and high VPDs, likely be-cause the upper surface of the litter layer dries rapidly(few hours) under these conditions. As a result, the
properties and the quantity of forest floor debris de-termine maximum evaporation rates and the length oftime during which these rates can be maintained. Thepresence of large woody debris (dead branches) withlow water holding capacity was responsible for reduc-tions in forest floor evaporation between two differentpine stands (Kelliher et al., 1990).
The rapid changes in litter water content and par-titioning of energy fluxes at the forest floor indicatea low water holding capacity for the litter layer. In-dependent estimates of maximum litter water holdingcapacity are approximately 2.0 mm. There is also alikely decoupling of dry upper layers of litter fromwetter layers below, and as a result, the lower litter lay-ers may participate less in the rapid evaporation ratesfollowing rainfall. In many forests where evaporationfrom the floor is greater and changes in surface con-ductance and energy fluxes are on the order of daysinstead of hours, litter capacity is greater (3–5 mm inKelliher et al., 1998) and/or the forest floor containslichens, moss, standing water (Lafleur, 1992; Kelliheret al., 1998), or other forms of short herbaceous veg-etation (Kelliher et al., 1990, 1997).
Acknowledgements
This work was funded by a grant from NASA/GEWEX and the US Department of Energy (Ter-restrial Carbon Program) and is a contribution tothe AmeriFlux and FLUXNET projects. PJH wassponsored by the Program for Ecosystem Research,Environmental Sciences Division, Office of Healthand Environmental Research, US Department ofEnergy under contract No. DE-ACO5-84OR21400with Lockheed Martin Energy Research Corporation.Mark Brewer and Mark Hall provided field and lab-oratory assistance. We thank Tilden Meyers and StanWullschleger for reviewing an earlier version of thismanuscript.
References
Aubinet, M., Grelle, A., Ibrom, A., Rannik, Ü., Moncrieff,J., Foken, T., Kowalski, A.S., Martin, P.H., Berbigier, P.,Bernhofer, Ch., Clement, R., Elbers, J., Granier, A., Grünwald,T., Morgenstern, K., Pilegaard, K., Rebmann, C., Snijders,W., Valentini, R., Vesala, T., 1999. Estimates of the annual
K.B. Wilson et al. / Agricultural and Forest Meteorology 102 (2000) 83–103 103
net carbon and water exchange of European forests: theEUROFLUX methodology. Adv. Ecol. Res. 30, 113–175.
Auble, D.L., Meyers, T.P., 1992. An open path, fast responseinfrared absorption gas analyzer for H2O and CO2. BoundaryLayer Meteorol. 59, 243–256.
Baldocchi, D.D., 1997. Flux footprints under forest canopies.Boundary Layer Meteorol. 85, 273–292.
Baldocchi, D.D., Meyers, T.P., 1991. Trace gas exchange at thefloor of a deciduous forest I. Evaporation and CO2 efflux. J.Geophys. Res. 96, 7271–7285.
Baldocchi, D.D., Vogel, C.A., 1996. Energy and CO2 flux densitiesabove and below a temperate broad-leaved forest and a borealpine forest. Tree Physiol. 16, 5–16.
Baldocchi, D.D., Hicks, B.B., Meyers, T.P., 1988. Measuringbiosphere–atmosphere exchanges of biologically related gaseswith micrometeorolgical methods. Ecology 69, 1331–1340.
Baldocchi, D.D., Hutchinson, B., Matt, D., McMillen, R., 1986.Seasonal variation in the statistics of photosynthetically activeradiation penetration in an oak-hickory forest. Agricultural andForest Meteorology 36, 343–361.
Baldocchi, D.D., Law, B.E., Anthoni, P.M., 2000. On measuringand modeling energy fluxes above the floor of a homogeneousand heterogeneous conifer forest. Agric. For. Meteorol., in press.
Black, T.A., Kelliher, F.M., 1989. Processes controlling understoryevapotranspiration. Philosophical Transactions of the RoyalSociety of London. B., 324, 207–231.
Gillespie, T.J., Kidd, G.E., 1978. Sensing duration of leaf moistureretention using electrical impedance grids. Can. J. Plant. Sci.58, 179–187.
Goulden, M.L., Munger, J.W., Fan, S.-M., Daube, B.C., Wofsy,S.C., 1996. Measurements of carbon sequestration by long-termeddy covariance: methods and a critical evaluation of accuracy.Global Change Biol. 2, 169–182.
Greco, S., Baldocchi, D.D., 1996. Seasonal variations of CO2 andwater vapour exchange rates over a temperate deciduous forest.Global Change Biol. 2, 183–197.
Hutchison, B.A., Matt, D.R., McMillen, R.T., Gross, L.J.,Tajchman, S.J., Norman, J.M., 1986. The architecture of adeciduous forest canopy in eastern Tennessee, USA. J. Ecol.74, 635–646.
Jarvis, P.G., McNaughton, K.G., 1986. Stomatal control oftranspiration: scaling up from leaf to region. Adv. Ecol. Res.15, 1–49.
Johnson, D.W., van Hook, R.I. (Eds.), 1989. Analysisof Biogeochemical Cycling Processes in Walker BranchWatershed. Springer, New York.
Kelliher, F.M., Black, T.A., Price, D.T., 1986. Estimating the effectsof understorey removal from a Douglas Fir using a two-layercanopy evapotranspiration model. Water Resources Res. 22,1891–1899.
Kelliher, F.M., Whitehead, D., McAneney, K.J., Judd, M.J.,1990. Partitioning evapotranspiration into tree and understoreycomponents in two youngPinus RadiataD. Don stands. Agric.For. Meteorol. 50, 211–227.
Kelliher, F.M., Kostner, B.M.M., Hollinger, D.Y., Byers, J.N., Hunt,J.E., McSeveny, T.M., Meserth, R., Weir, P.L., Schulze, E.-D.,1992. Evaporation, xylem sap flow, and tree transpiration in
a New Zealand broad-leaved forest. Agric. For. Meteorol. 62,53–73.
Kelliher, F.M., Hollinger, D.Y., Schulze, E.-D., Vygodskaya,N.N., Beyers, J.N., Hunt, J.E., McSeveny, T.M., Milukova, I.,Sogatchev, A., Varlargin, A., Ziegler, W., Arneth, A., Bauer, G.,1997. Evaporation for an eastern Siberian larch forest. Agric.For. Meteorol. 85, 135–147.
Kelliher, F.M., Lloyd, J., Arneth, A., Byers, J.N., McSeveny,T.M., Milukova, I., Grigoriev, S., Panfyorov, M., Sogatchev,A., Varlargin, A., Ziegler, W., Bauer, G., Schulze, E.-D., 1998.Evaporation from a central Siberian pine forest. J. Hydrol. 205,279–296.
Kondo, J., Saigusa, S., 1992. A model and experimental studyof evaporation from bare-soil surfaces. J. Appl. Meteorol. 31,304–312.
Lafleur, P.M., 1992. Energy balance and evapotranspiration froma subarctic forest. Agric. For. Meteorol. 58, 163–175.
Luxmoore, R.J., Huff, D.D., 1989. Water. In: Johnson, D.W.,Van Hook, R.I. (Eds.), Analysis of Biogeochemical CyclingProcesses in Walker Branch Watershed. Springer, New York,pp. 164–196.
Luxmoore, R.J., Grizzard, T., Patterson, M.R., 1981. Hydraulicproperties of Fullerton cherty silt loam. Soil Sci. Soc. Am. J.45, 692–698.
McMillen, R.T., 1988. An eddy correlation technique withextended applicability to non-simple terrain. Boundary LayerMeteorol. 43, 231–245.
Monteith, J.L., Unsworth, M.H., 1990. Principles of EnvironmentalPhysics. Edward Arnold, London.
Moore, K.E., Fitzjarrald, D.R., Sakai, R.K., Goulden, M.L.,Munger, J.W., Wofsy, S.C., 1996. Season variation in radiativeand turbulent exchange at a deciduous forest in centralMassachussets. J. Appl. Meteorol. 35, 122–134.
Moore, K.E., Fitzjarrald, D.R., Sakai, R.K., Freedman, J.C., 2000.Growing season water balance at a boreal Jack Pine forest.Water Resources Res., in press.
Peters, L.N., Grigal, D.F., Curlin, J.W., Selvidge, W.J., 1970.Walker Branch watershed project: Chemical, physical andmorphological properties of the soils of Walker Branchwatershed. Ecological Sciences Division, ORNL-TM-2968, OakRidge National Laboratory, TN.
Schaap, M.G., Bouten, W., 1997. Forest floor evaporation in adense Douglas fir stand. J. Hydrol. 193, 97–113.
Shuttleworth, W.J., Gash, J.H.C., Lloyd, C.R., Moore, C.J.,Roberts, J., Filho, A.D.O.M., Fisch, G., Filho, V.D.P.S.,Ribeiro, M.D.N.G., Molion, L.C.B., Sa, L.D.D.A., Nobre,J.C.A., Cabral, O.M.R., Patel, S., Moraes, J.C.D., 1984. Eddycorrelation measurements of energy partition for Amazonianforest. Quarterly Journal of the Royal Meteorological Society,110, 1143–1162.
Webb, E.K., Pearman, G.I., Leuning, R., 1980. Correction of fluxmeasurements for density effects due to heat and water vaportransfer. Quarter. J. R. Meteorol. Soc. 106, 67–90.
Wilson, K.B., Baldocchi, D.D., 2000. Seasonal and interannualvariability of energy fluxes over a broadleaved temperaturedeciduous forest in North America. Agric. For. Meterol. 100,1–18.