Embed Size (px)
Citation preview

1
Factors Affecting Users' Assessment of the Economic Value of
University Library Services
< Table of Contents >
1. Introduction 2. Preliminary Survey
2.1 Measurement Method 2.2 P University’s Library Value Measurement 2.3 Q University’s Library Value Measurement
3. Hypothesis Development 4. Main Survey
4.1 Measurement Method 4.2 WTP regarding University Library Service
⑴ WTP by Service
⑵ WTP by Status and Major
⑶ WTP by University's Core Mission
5. Hypothesis Test
5.1 Difference in WTP Value by University Characteristics 5.2 Difference in WTP Value by User Characteristics 5.3 Difference in WTP Value by Whether Payment Card is Presented
6. Discussion 7. Conclusion References
2
Title: Factors Affecting Users' Assessment of the Economic Value of University Library Services Article Type: Research Paper Corresponding Author: Prof. Wonsik Shim, Ph.D. Corresponding Author's Institution: Sungkyunkwan University First Author: Prof. Young Man Ko, Dr. Phil. Order of Authors: Young Man Ko, Dr. Phil.; Wonsik Shim, Ph.D.; Soon-Hee Pyo Author names and affiliations:
Young Man Koa, Wonsik Shim
b, Soon-Hee Pyo
c
aDepartment of Library and Information Science, 53 Myeongnyun-Dong 3-Ga, Jongno-Gu,
Sungkyunkwan University, Seoul, Korea (110-745), email: [email protected] bDepartment of Library and Information Science, 53 Myeongnyun-Dong 3-Ga, Jongno-Gu,
Sungkyunkwan University, Seoul, Korea (110-745), email: [email protected] cInstitute for Knowledge and Information Management, 53 Myeongnyun-Dong 3-Ga, Jongno-Gu,
Sungkyunkwan University, Seoul, Korea (110-745), email: [email protected]
Corresponding author: Wonsik Shim
Email: [email protected]
Phone: 82-2-2629-4293
Mobile: 82-10-2629-4293
Fax: 82-2-760-0326

3
1. Introduction
The demand for valuation methods of university libraries has resulted from the fact that
universities are being recognized as an important economic asset of national competitiveness.
This realization has led to an attempt to verify the effectiveness of investment in higher education,
and university libraries also have had a chance to reconsider and promote the importance of their
existence to their universities. The objective of this study is to demonstrate in concrete terms the
economic value of the library to the institution as a whole.
Another main factor for the demand for university library valuation has been the changes in the
information environment and the user environment. Today's users show a tendency to prefer free
information that is easily accessible and handy rather than information that is reliable and of a
high quality. In addition, many users consider electronic resources, which are accessible via a
subscription paid by the library, to be free resources that can be obtained by search engines
(Online Computer Library Center 2005). In this current situation, valuation of the university library
has become a way for libraries to prove their value as an asset to the university.
In an attempt to gather information about university libraries' values, Donovan (1996) targeted
Tulane University's law students, Wong and Webb (2011) studied A University (in Hong Kong)
students, and Jager (2002) worked with Capetown University's humanities students about the
relationship between the amount of the library's resources that were borrowed and study
achievement. In similar studies, Whitemire (2002) researched the effect of a university library's
resources and services on undergraduates' critical thinking abilities, while Matthews (2007) and
Munde and Marks (2009) investigated service factors that had a positive influence on university
libraries and their contributions. These studies quantitatively analyzed the grounds and the
degree that university libraries contribute, but they did not attempt an analysis of the economic
value of libraries.
Research on the services provided by university libraries from an economic standpoint was
conducted regarding the aspects of the reference service and collection service. Studies that
converted reference service to labor value began in 1980 by Cable (1980) and have been
continued by Kantor (1986), Abels (1997), and Kantor, Saracevic and D'Esposito-Wachtmann
(1995). Studies regarding the utility value of collection service have taken place in two directions.
One is the time value, which was given by King et al. (2004)'s study and measured the hours of
use of academic journals as time value. Tenopir and King (2007)'s study assessed the value of
time reduction by comparing the average journal usage time with cases done without journal
collection.
The other direction is one that focuses on developing a quantitative measure of the library’s
return on investment (ROI) by tying faculty’s use of library materials to the generation of grant
income. The focus to date in these studies has been on linking the use of library resources to
successful grant proposals, initially at the University of Illinois at Urbana-Champaign (Luther
2008) and then at eight additional institutions worldwide (Tenopir et al. 2010).
Recently, Melo and Pires (2011) published a study that measured the economic value of the
Portuguese electronic scientific information consortium called “b-on”. In their study, the economic
value of the consortium was measured in two ways: the value of the time saved by using the
service and the contingent valuation method (CVM). The benefit-to-cost (B/C) ratios derived from

4
both methods were 1.91 and 3.32, respectively. As a means of quantifying the value of the library,
ROI or B/C calculations are now being extended to cover the value of all key library products and
services.
The values generated between the university library service and the user are generally divided
into individual services such as literature (books) service, reference service, space service,
interloan/text copy, user education sessions, and integrated services where respective disparate
services are combined (Saracevic & Kantor 1997, 546). These services create various values as
evidenced in reports made by the Association of College and Research Libraries (ACRL) and the
Research Information Network and the Research Libraries United Kingdom (RIN and RLUK).
The ACRL, which is based in the United States (US), arranged the categories, measurement
indices, and measurement factors of the contribution of university libraries to their universities in
guide book-form in "Value of Academic Libraries: A Comprehensive Research Review and
Report" (Oakleaf 2010). However, this report did not extract or examine real data or measure
their economic feasibility. In the UK, RIN and RLUK (2011) published a report entitled "The Value
of Libraries for Research and Researchers". This report measured the correlation between the
number of students doing research, the procurement of research funding, and the research
performance evaluation of the university against the number of the library's books, staff, and
budget of 67 higher education institutions in England. They also analyzed the value of services
the library provided to researchers and the library's level of contribution to research performance.
This report suggested a result based on empirical data, but it did not measure the values
contributed to various aspects of the university by the library; its range was also limited to values
provided by studies and researchers. Therefore, to measure the university library’s ROI, an in-
depth review of the value contributed by each service and the measurement method of that value
will be required.
The purpose of this article was to explore factors that influence university library users' economic
value assignments for various library services. Specifically, the study investigated the effect of
institutional and user characteristics as well as the presence of payment card information in the
CVM survey on users' WTP values. To answer this question, a preliminary survey was provided
by 2 university libraries located in Seoul, Korea. The hypothesis was set up based on the
problems and abnormalities that appeared in the preliminary survey process. To test the
hypothesis, a main survey, which calculated the WTP of the users of 4 university libraries that
differed in size, agents of funding, and locations was carried out. The data were drawn from a 12-
month study on the costs and value of library services at six Korean university libraries.
2. Preliminary Survey
2.1 Measurement Method
There were two objectives of this preliminary survey. One was to analyze the factors required for
value measurement of a university library and to identify any problems in the procedure and
methodology, while the other was to draw a hypothesis based on the problems found and to test
the possibility of what can be practically applied to measure the value of a university library.
Therefore, in this preliminary survey, we used the CVM, a direct measurement method, and time
value as well as an alternative service value, an indirect measurement method, to measure the
value of university library services.

5
The value measurement targets for the preliminary survey were the libraries of P and Q private
universities located in downtown Seoul. For P University’s library, the survey measured multiple
main service values with CVM. The survey asked students about their WTP values for 5 main
services: book lending, electronic scholarly information, reference services, user education
sessions, and space provision (reading room). Professors were inventoried regarding their WTP
values for lending services, electronic scholarly information, and reference services. For Q
University’s library, the survey measured the value of electronic scholarly information services
using 3 measurement methods: CVM, time value, and alternative service value. The survey
asked both professors and graduate students about the download numbers and the frequency of
utilization of electronic scholarly information services and their WTP using the charged thesis
shown in Table 1.
<Table 1> Value measurement plan outline of university libraries
P University’s library Q University’s library
Measurement composition
Multiple services vs. single measurement method
Single service vs. multiple measurement methods
Target service of measurement
Book lending, electronic scholarly info, reference services, user education, space provisions
Electronic scholarly info
Method CVM CVM, time value, alternative service value
Survey object
Undergraduate, graduate, professor Graduate, professor
Output
‧ WTP value of university library
service spoken by user
‧ ROI
‧ Time saved and cost by usage of
electronic scholarly information
‧ WTP value of university library
service spoken by user
‧ ROI
The survey was carried out at the university libraries’ lobbies and campuses from June to July
2011 by giving the questionnaires to the users and immediately collecting them after users had
finished. For P University’s library, 211 answer sheets (34 from professors and 215 from students)
were collected, and 211 sheets were analyzed; 4 sheets were unusable due to being
insufficiently answered. For Q University’s library, 207 sheets were collected, and 202 were
analyzed; 5 were incomplete and therefore were not included in our analysis.
2.2 P University’s Library Value Measurement
In the CVM survey for P University’s library users, the survey asked about the WTP in case the
university charged for each service. Considering that the research was exploratory, the survey
chose open-ended questions as the question form, which allowed respondents to describe the
value price freely rather than limiting them to multiple-choice questions, and suggested a
payment card that used the price of school convenient facilities or consumables (Table 2).
<Table 2> Payment card for P University library’s value measurement applying CVM
Item Price (unit: Won)

6
1 shuttle bus ticket 250
Cell phone charge in convenience store 1,000
Certificate issue per case 1,000
1 cup of Americano in the school café 2,000
Monthly fee for use of the gym 20,000
The study surveyed professors and students separately. Professors were asked 3 items: book
lending, full-text article download, and reference services. The study calculated the average
value, the 5%-trimmed average, and the median. The 5%-trimmed average is an average
calculated after cutting 5% off of both the maximum and the minimum values.
In a meta-analysis of CVM research, Noonan (2003) clarified that the mean value is generally 1.5
times higher than the median. The means and the medians measured in this study’s preliminary
survey partly agreed with Noonan’s work depending on the type of service, but there were cases
where the survey results were 2 to 5 times higher, so it was not feasible to draw a generalized
relationship. Thus, in the main survey process, the study uses the mean as the value price of the
university library and presents the median and the 5%-trimmed average as well.
According to the survey results, the differences among the mean, the median, and the 5%-
trimmed average were not large in WTP for students, but they were for professors. There was no
difference of WTP values between undergraduates and graduates for all service categories, but
large differences appeared between students and professors regarding book-lending services
(Tables 3 and 4).
<Table 3> P University students’ WTP (unit: Won)
1 Book lending
1 Journal
download
1 Referenc
e service
1 Library
use education
1-hr Reading
room use
1-hr Compute
r use
1-hr Seminar
room use
1 Movie in a
cinema room
Mean 664.8 775.1 304.1 3,834.7 483.8 454.4 994.8 1,057.1
Median 500.0 500.0 100.0 1,000.0 500.0 500.0 650.0 1,000.0
5%-trimmed
avg. 551.3 596,1 251.7 1607.8 420.3 413.2 846.9 940.9
<Table 4> P University professor’s WTP (unit: Won)
1 Book lending
1 International journal
download
1 Domestic journal
download
1 Reference service
Mean 7,317.6 6,746.2 3,258.5 3,338.8
Median 750.0 500.0 150.0 50.0
5%-trimmed
avg. 1366.0 845.4 329.7 277.1
2.3 Q University’s Library Value Measurement

7
The average number of students’ and professors’ recent original text downloads was 8, and it
took about 82.7 minutes to download them, resulting in an average of 10.3 minutes for 1 paper of
original text (Table 5).
<Table 5> Usage and use time of Q University’s electronic library system
Original text download number
in past month (case)
Time spent for downloading
original texts (min)
Average download time per paper
(min)
Mean 8.0 82.7 10.3
Median 3.0 30.0 -
When asked about using libraries and alternative services, 53% of the respondents answered
that there was no difference in hours of use. After surveying users who only used alternative
services about the extra time these alternative services took or saved, it was found that the sum
of all users’ time was 195.2 minutes more spent than library services and 41.6 minutes saved. To
standardize this figure, the survey subtracted the saved time of 41.6 minutes from the exceeding
time (195.2 minutes) and divided the result by 110, which was the number of users who said they
used an alternative service. As a result, it took an extra 1.4 minutes per case of alternative
service (Table 6).
<Table 6> Extra time spent on alternative service (unit: min)
N Minimum Maximum Mean
Standard deviation
Exceeding time on alternative service
30 1.00 1440.00 195.15 425.16
Saved time on alternative service
19 5.00 180.00 41.58 48.82
(Regarding only the alternative service users)
When asked whether there was an extra cost for alternative services, about 72% of respondents
answered that no extra costs were charged, and the average cost of alternate services was
12,318.1. This cost was divided by 109, the total number of respondents, for standardization, and
it appeared that 113 more expenses per case occurred compared to library services (Table 7).
<Table 7> Extra cost by alternative service (unit: Won)
N Mean Median Maximum Mode
Extra cost for to the use of an
alternative service 31 12,318.18 7,500 110,000 10,000
No extra cost for the use of an alternative
service 79 - - - -
(Regarding only the alternative service users)

8
The results of the 5%-trimmed average of WTP for journal usage show that the WTP for 1
domestic journal was 762.2 for students and 674.7 for professors, and for international journals,
the WTP was 1,394.4 for students and 2,167.0 for professors (Table 8).
<Table 8> WTP value of Q University’s electronic scholarly information (unit: Won)
Category N Mean Median 5%-trimmed
avg.
WTP for a domestic
journal
Professor and Researcher
35 814.34 500.0 674.7
Grad student, etc. 139 1001.40 500.0 762.2
WTP for an
international journal
Professor and Researcher
34 2452.94 1750.0 2167.0
Grad student, etc. 135 1880.89 1000.0 1394.4
3. Hypothesis Development
As a result of the analysis of the data obtained in the preliminary survey, it was determined that
the following data were needed: the value difference among university libraries regarding the
characteristics of universities, user characteristics, and the existence of a payment card.
▪The difference in university library service values according to the university’s characteristics
Each value of the same service was calculated differently depending on the university as a result
of the preliminary survey. The target universities of the preliminary survey were both located in
the capital area, but the result of WTP measurements among professors regarding electronic
scholarly information service showed that P University’s professors were willing to pay on
average ₩6746.2 per 1 international electronic scholarly information, and professors of Q
University were willing to pay ₩2452.9, which was a difference of about 300%. This finding
showed that university libraries’ value can differ depending on the university.
In this context, Whitmire (2002) found that a university library’s effect on students comes out
differently depending upon the core mission of the university, such as a research-oriented
university, a doctoral course-oriented university, a collegiate university, and a liberal arts-
oriented university. In addition, in the studies of Hamrick, Schuh, and Shelley (2004) and Kuh
and Hu (2001), the subject of foundation (national or private), region, or level of urbanization
were chosen as the main variables to analyze the relationship between the university’s
characteristics and the students’ achievements. The main survey aimed to test the difference of
values by functional attributes, which are research-oriented and education-oriented, as well as by
the subject of foundation, such as national and private. The hypotheses were as follows.
Hypothesis ⑴ There will be a difference in WTP between research-oriented universities and
education-oriented universities.
Hypothesis ⑵ There will be a difference in WTP between national universities and private
universities.
▪The difference of university library value by user characteristics
9
As a result of the preliminary survey, the WTP of professors and students for the same service
differed heavily. At P University, the WTP for lending one book was ₩7,317 for professors on
average and ₩664 for students, which was a difference of 10 times, and the 5%-trimmed
average also showed a difference that was 2 times greater (₩1,366.0 for professors and ₩551.3
for students). These findings indicated that there was a great deal of difference in WTP according
to user status. Moreover, the main survey aimed to test whether the position and major of users
affected the value statement of libraries based on differences that appeared in the usage pattern
analysis in the preliminary survey. The hypotheses were as follows:
Hypothesis ⑶ There will be a difference in WTP between students and professors.
Hypothesis ⑷ There will be a difference in WTP by major.
▪The difference of value according to the existence of a payment card
As a result of the preliminary survey, P University’s WTP (where a payment card was proposed)
regarding electronic scholarly information differed 3 times compared to that of Q University on
average. However, the 2 questionnaires carried out in the preliminary survey process had
different structures. Therefore the main survey process aimed to examine if the difference shown
was influenced by the availability of a payment card by surveying the same conditions.
Hypothesis ⑸ There will be a difference in WTP between cases where a payment card is
presented and where a payment card is not presented.
4. Main Survey
4.1 Measurement Method
The main survey applied CVM to measure the various services of university libraries. The
questionnaire survey was carried out face-to-face by researchers participating in the main survey
at the respective university’s library lobby and campus for 2 months from October through
November 2011.
Regarding the diversity of services provided by university libraries, the survey categorized the
measured service targets as lending services, reference services, electronic scholarly
information services, user education sessions, and facility provisions, and it allowed the
respondent to state the WTP value for each service. Therefore, the survey used a simple
assumption, “If you set the service you are using now to a monetary value,” instead of an
imaginary situation.
The statement form of WTP was designed to be open-ended. If the questions about the 5
services had been multiple choice, the questions would have been too complicated and the users
might have felt uncomfortable stating the value or may have even refused to answer.
The statement unit of value was minimized to 1 book, once, and 1 case. In the case of the
electronic scholarly information service, the number of downloads was regarded as the criteria

10
instead of the number of search cases. For the selection of a survey target, the study used data
of Rinfo (scholarly information statistics system) provided by the Korea Education and Research
Information Service (Korea Education and Research Information Service, 2012). After sorting the
universities by operator and core mission with the help of the data, the survey selected 4
universities capable of cooperating with the questionnaire survey for professors, graduate
students, and undergraduates (Figure 1):
–Private, research-oriented university (over 10,000 enrolled students)
– National, research-oriented university (over 10,000 enrolled students)
– Private, education-oriented university (5,000-10,000 enrolled students)
– National, education-oriented university (5,000-10,000 enrolled students)
<Figure 1> Target libraries and methodology of the main survey
Questionnaires collected from the 4 universities that were analyzed totaled 758 and consisted of
63% undergraduates, 18% graduate students, 15% professors, and 4% other users. We
investigated the ratio of majors at the target universities and found that the actual representations
of survey respondents’ majors were 45% humanities and social sciences, 40% natural sciences
and engineering, 8% college of education, 4% medical sciences, and 3% in college of arts/sports
and education.
4.2 WTP regarding University Library Services
⑴ WTP by Service
11
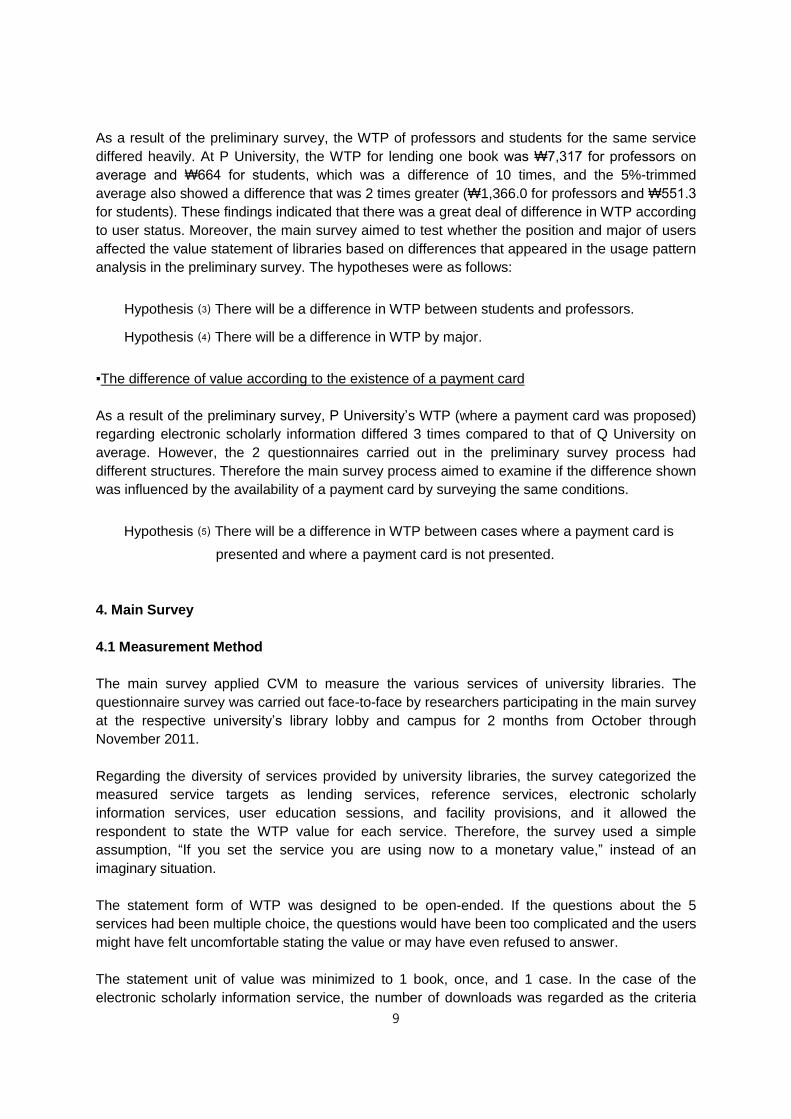
The WTP values for the main services of 4 university libraries (lending services,
international/domestic journal use, reference services, user education, and reading room use)
are shown in Table 9 and Figure 2.
<Table 9> WTP for university library services
Book
lending Int.
journal Dom.
journal Reference services
User education
Reading room
N 743 733 733 730 711 722
Mean 957.07 1424.30 976.81 533.01 2609.46 894.99
5%-trimmed avg.
716.39 1080.43 764.06 308.67 1742.18 697.57
Median 500.00 1000.00 500.00 100.00 1000.00 500.00
<Figure 2> WTP regarding university library services (average value)
The average WTP value for one book-lending service was about ₩957; one international journal
article was ₩1,424, and one domestic journal article was ₩976, which makes the value of the
international journal article one and a half times higher than that of a domestic journal article. The
WTP for reference services was about ₩533, while the value of a single user education session
was about ₩2,609, making it the highest value. The fact that the WTP value for a user education
session came out higher than that of lending and reference services means that the respondents’
perceptible service value for user education was high, and it could be grounds for the
implementation of various user education programs that are increasing in most libraries now.
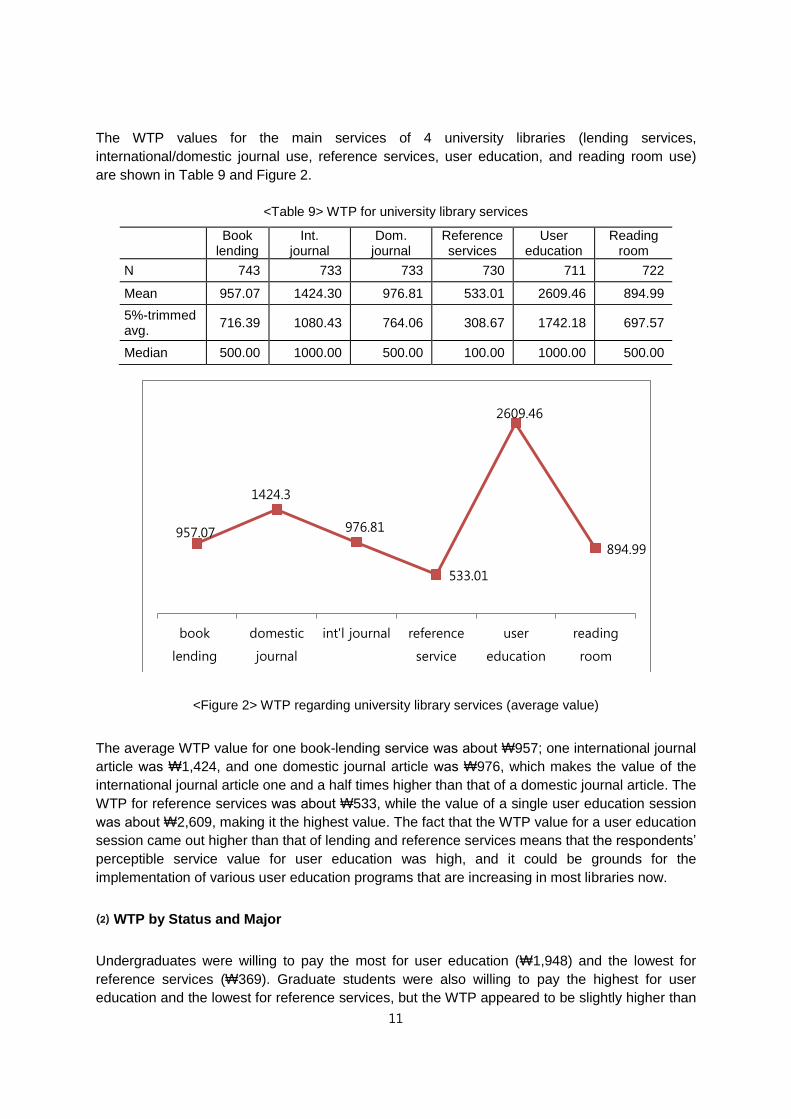
⑵ WTP by Status and Major
Undergraduates were willing to pay the most for user education (₩1,948) and the lowest for
reference services (₩369). Graduate students were also willing to pay the highest for user
education and the lowest for reference services, but the WTP appeared to be slightly higher than
957.07
1424.3
976.81
533.01
2609.46
894.99
book
lending
domestic
journal
int'l journal reference
service
user
education
reading
room

12
that of undergraduates. The average WTP value reported by professors for university library
services was higher than that of both undergraduates and graduate students, which makes the
WTP value for user education the highest (₩5,915) and that for international journals second
(₩2,327). For most services, the average WTP value differed between professors and students,
but the WTP value for using a reading room did not differ much (₩965 for professors and ₩970
for graduate students; Table 10, Figure 3).
<Table 10> WTP for university library service by status
Service type Status
Book lending
Int. journal Dom.
journal Reference services
User education
Reading room
Undergrad.
Mean 815.28 1144.68 938.51 369.39 1948.27 877.95
N 470 464 465 465 454 463
5%-trimmed avg.
645.54 956.73 770.99 243.05 1402.38 693.64
Median 500.00 1000.00 500.00 100.00 1000.00 500.00
Grad.
Mean 922.08 1381.18 755.20 517.64 2438.52 970.79
N 130 127 127 127 122 126
5%-trimmed avg.
742.48 1038.15 570.52 324.06 1789.62 749.29
Median 500.00 1000.00 500.00 100.00 1000.00 500.00
Prof.
Mean 1620.75 2327.62 1121.83 1355.94 5915.15 965.10
N 106 105 104 101 99 96
5%-trimmed avg.
1103.77 1819.05 861.86 951.05 3216.61 697.34
Median 1000.00 1000.00 500.00 500.00 1000.00 500.00
<Figure 3> WTP for university library service by status (average value)
1620.75
2327.62
1121.83 1355.94
5915.15
965.1
book
lending
domestic
journal
int'l journal reference
service
user
education
reading
room
under-grad.
grad.
prof.

13
In regards to the average WTP value by major, Humanities and Social Science majors were each
willing to pay relatively more for services: ~₩1,127 and ~₩1,162 for book-lending services,
respectively. For international journal article usage, Arts/Sports and Social Science majors were
willing to pay ~₩2,029 and ~₩1,808, respectively. Arts/Sports majors showed the highest WTP
value for user education sessions, which was ₩3,505, and Social Science and Engineering were
next, reporting ₩2,790 and ₩2,753, respectively (Table 11, Figures 4 and 5).
<Table 11> WTP for university library services by major
Service type Major
Book lending
Int. journal Dom.
journal Reference services
User education
Reading room
Humanities
Mean 1127.13 1488.28 935.05 527.72 2052.80 894.95
N 94 93 93 92 93 91
5%-trimmed avg.
715.40 1103.80 715.60 301.90 1628.50 635.10
Median 500.00 1000.00 500.00 150.00 1000.00 500.00
Social science
Mean 1162.58 1808.28 1145.21 731.81 2790.88 1047.62
N 240 238 238 237 228 235
5%-trimmed avg.
819.20 1326.50 951.10 377.60 2179.50 832.30
Median 500.00 1000.00 500.00 200.00 1000.00 500.00
Natural Science
Mean 936.86 1202.24 899.38 409.08 2852.85 1008.02
N 121 121 120 119 113 116
5%-trimmed avg.
738.30 1018.20 830.10 312.60 1271.00 776.60
Median 500.00 1000.00 1000.00 200.00 1000.00 500.00
Engineering
Mean 702.70 954.42 681.92 426.15 2753.90 681.18
N 174 172 173 171 167 169
5%-trimmed avg.
569.80 739.10 542.00 232.50 1480.10 529.60
Median 500.00 500.00 500.00 100.00 1000.00 500.00
Medicine
Mean 963.64 1336.36 1070.30 501.82 1793.94 940.91
N 33 33 33 33 33 33
5%-trimmed avg.
792.90 1036.50 911.00 367.30 1437.70 767.70
Median 500.00 1000.00 500.00 200.00 500.00 500.00
Arts/Sports
Mean 694.74 2029.41 1823.53 479.44 3605.56 555.56
N 19 17 17 18 18 18
5%-trimmed avg.
689.50 1671.60 1465.00 181.70 2248.40 586.90
Median 500.00 1000.00 500.00 100.00 1000.00 500.00
Education
Mean 713.11 1482.78 1090.71 344.27 1926.21 736.46
N 61 58 58 59 58 59
5%-trimmed avg.
593.60 1008.80 777.00 213.70 1329.80 590.50
Median 500.00 1000.00 500.00 100.00 1000.00 500.00

14
<Figure 4> WTP for university library service by major (average value)
<Figure 5> WTP for university library services by major, service (average value)
⑶ WTP by University's Core Mission
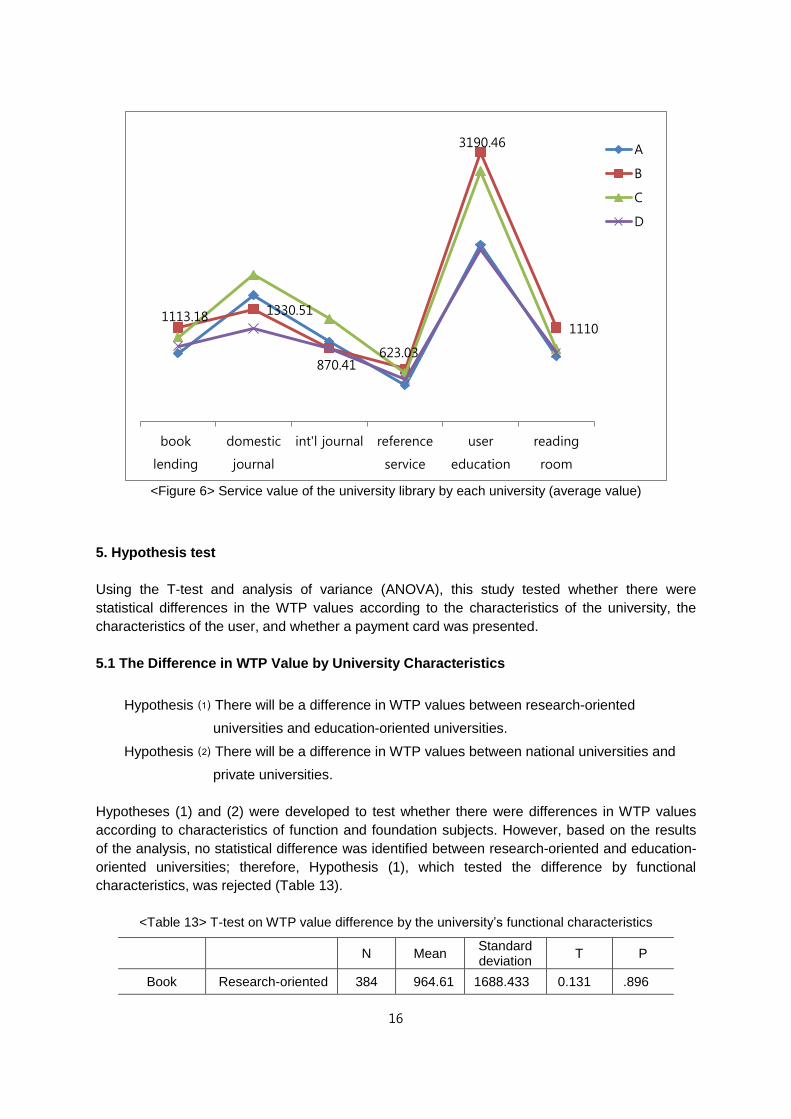
WTP values for university library services by university are shown in Table 12. For B University,
a national, research-oriented university, the average WTP values for lending services, reference
services, user education sessions, and reading room usage were ₩1,113, ₩623, ₩3,190, and
₩1,110, respectively, making their WTP values the highest of the 4 universities. C University, a
694.74
2029.41 1823.53
479.44
3605.56
555.56
book
lending
domestic
journal
int'l
journal
reference
service
user
education
reading
room
Humanities
Social scinece
Natural science
Engineering
Medicine
Art/ Physical
Education
2052.80
2790.88 2852.85 2753.90
1793.94
3605.56
1926.21
book lending
domestic journal
int'l journal
reference service
user education
reading room

15
national, education-oriented university, had average WTP values for international and domestic
journal article usage of ₩1,735 and ₩1,216, respectively, making them the highest.
In comparison, A and D Universities, which are private universities, had WTP values lower than
the two national universities across all services. A University, a private, research-oriented
university, had the lowest average WTP values for reference services and user education. It can
be assumed that the differences of core missions and subjects of foundation of each university
were reflected in the results because WTP values for services differed by university; national
universities’ WTP values were higher than those of private universities.
<Table 12> Service value of the university library by university
University Book
lending Int.
journal Dom.
journal Reference services
User education
Reading room
A
(priv./ res.)
Mean 806.45 1494.30 944.77 429.71 2092.02 770.00
N 186 184 185 182 174 181
5%-trimmed avg.
617.68 1110.82 690.88 274.77 1481.55 770.00
Median 500.00 725.00 500.00 100.00 1000.00 500.00
B
(nat./ res.)
Mean 1113.18 1330.51 870.41 623.03 3190.46 1110.00
N 198 197 197 198 196 198
5%-trimmed avg.
818.75 1014.44 732.77 330.56 1855.61 815.21
Median 500.00 1000.00 500.00 100.00 1000.00 500.00
C
(nat./ edu.)
Mean 995.98 1735.03 1216.81 566.89 2967.13 858.53
N 194 189 188 189 184 183
5%-trimmed avg.
716.61 1238.51 938.30 335.73 1956.23 665.82
Median 500.00 1000.00 500.00 100.00 1000.00 500.00
D
(priv./ edu.)
Mean 893.76 1098.34 864.94 499.29 2038.41 812.00
N 165 163 163 161 157 160
5%-trimmed avg.
754.46 985.4 778.31 326.33 1638.57 673.06
Median 500.00 1000.00 500.00 100.00 1000.00 500.00
16
<Figure 6> Service value of the university library by each university (average value)
5. Hypothesis test
Using the T-test and analysis of variance (ANOVA), this study tested whether there were
statistical differences in the WTP values according to the characteristics of the university, the
characteristics of the user, and whether a payment card was presented.
5.1 The Difference in WTP Value by University Characteristics
Hypothesis ⑴ There will be a difference in WTP values between research-oriented
universities and education-oriented universities.
Hypothesis ⑵ There will be a difference in WTP values between national universities and
private universities.
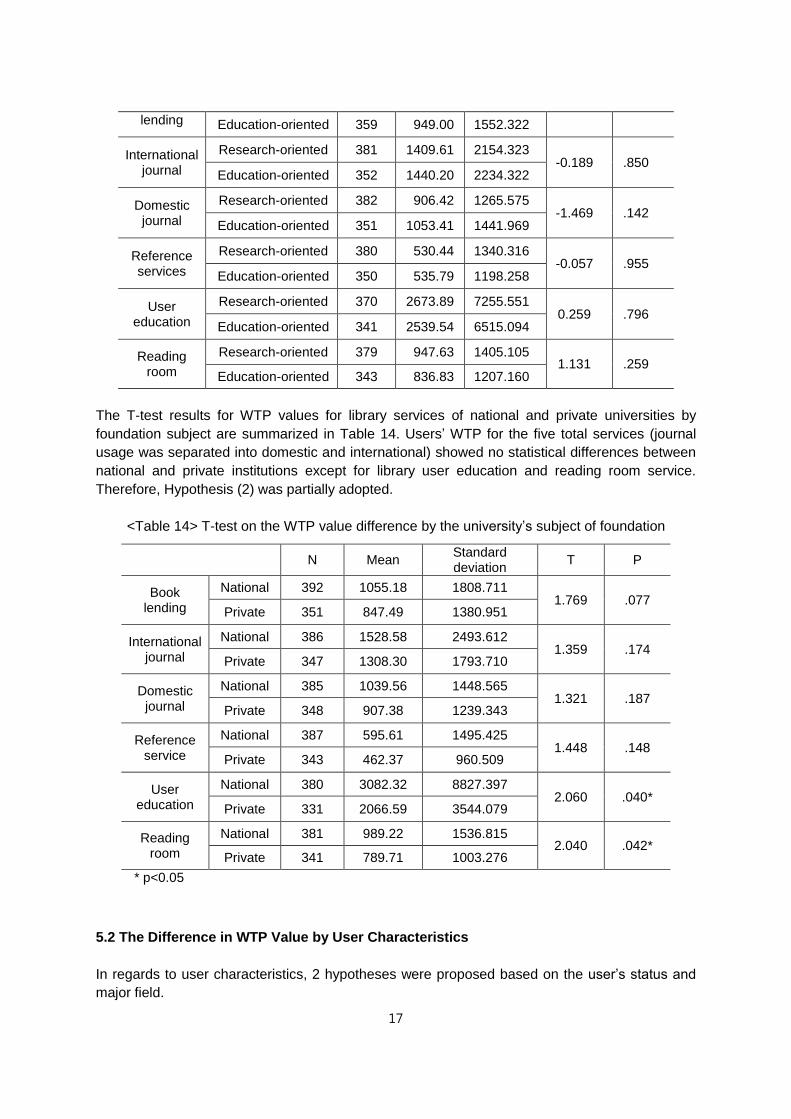
Hypotheses (1) and (2) were developed to test whether there were differences in WTP values
according to characteristics of function and foundation subjects. However, based on the results
of the analysis, no statistical difference was identified between research-oriented and education-
oriented universities; therefore, Hypothesis (1), which tested the difference by functional
characteristics, was rejected (Table 13).
<Table 13> T-test on WTP value difference by the university’s functional characteristics
N Mean
Standard deviation
T P
Book Research-oriented 384 964.61 1688.433 0.131 .896
1113.18 1330.51
870.41 623.03
3190.46
1110
book
lending
domestic
journal
int'l journal reference
service
user
education
reading
room
A
B
C
D
17
lending Education-oriented 359 949.00 1552.322
International journal
Research-oriented 381 1409.61 2154.323 -0.189 .850
Education-oriented 352 1440.20 2234.322
Domestic journal
Research-oriented 382 906.42 1265.575 -1.469 .142
Education-oriented 351 1053.41 1441.969
Reference services
Research-oriented 380 530.44 1340.316 -0.057 .955
Education-oriented 350 535.79 1198.258
User education
Research-oriented 370 2673.89 7255.551 0.259 .796
Education-oriented 341 2539.54 6515.094
Reading room
Research-oriented 379 947.63 1405.105 1.131 .259
Education-oriented 343 836.83 1207.160
The T-test results for WTP values for library services of national and private universities by
foundation subject are summarized in Table 14. Users’ WTP for the five total services (journal
usage was separated into domestic and international) showed no statistical differences between
national and private institutions except for library user education and reading room service.
Therefore, Hypothesis (2) was partially adopted.
<Table 14> T-test on the WTP value difference by the university’s subject of foundation
N Mean
Standard deviation
T P
Book lending
National 392 1055.18 1808.711 1.769 .077
Private 351 847.49 1380.951
International journal
National 386 1528.58 2493.612 1.359 .174
Private 347 1308.30 1793.710
Domestic journal
National 385 1039.56 1448.565 1.321 .187
Private 348 907.38 1239.343
Reference service
National 387 595.61 1495.425 1.448 .148
Private 343 462.37 960.509
User education
National 380 3082.32 8827.397 2.060 .040*
Private 331 2066.59 3544.079
Reading room
National 381 989.22 1536.815 2.040 .042*
Private 341 789.71 1003.276
* p<0.05
5.2 The Difference in WTP Value by User Characteristics
In regards to user characteristics, 2 hypotheses were proposed based on the user’s status and
major field.
18
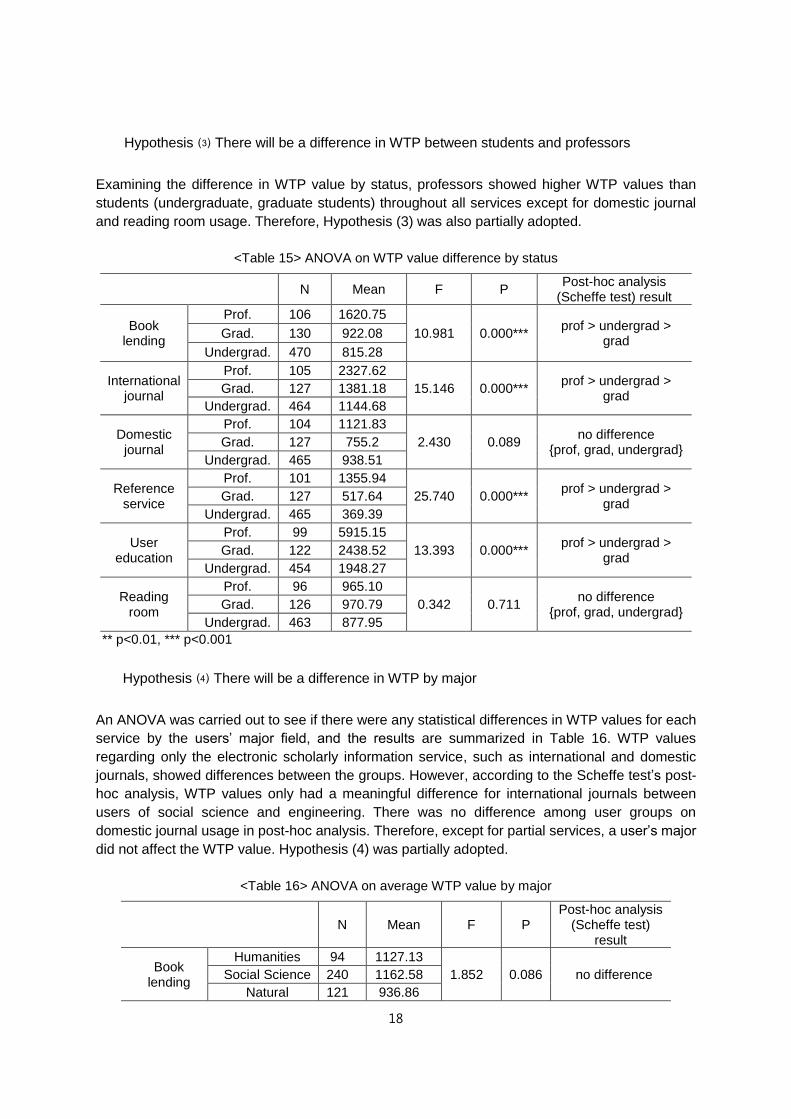
Hypothesis ⑶ There will be a difference in WTP between students and professors
Examining the difference in WTP value by status, professors showed higher WTP values than
students (undergraduate, graduate students) throughout all services except for domestic journal
and reading room usage. Therefore, Hypothesis (3) was also partially adopted.
<Table 15> ANOVA on WTP value difference by status
N Mean F P
Post-hoc analysis (Scheffe test) result
Book lending
Prof. 106 1620.75
10.981 0.000*** prof > undergrad >
grad Grad. 130 922.08
Undergrad. 470 815.28
International journal
Prof. 105 2327.62
15.146 0.000*** prof > undergrad >
grad Grad. 127 1381.18
Undergrad. 464 1144.68
Domestic journal
Prof. 104 1121.83
2.430 0.089 no difference
{prof, grad, undergrad} Grad. 127 755.2
Undergrad. 465 938.51
Reference service
Prof. 101 1355.94
25.740 0.000*** prof > undergrad >
grad Grad. 127 517.64
Undergrad. 465 369.39
User education
Prof. 99 5915.15
13.393 0.000*** prof > undergrad >
grad Grad. 122 2438.52
Undergrad. 454 1948.27
Reading room
Prof. 96 965.10
0.342 0.711 no difference
{prof, grad, undergrad} Grad. 126 970.79
Undergrad. 463 877.95
** p<0.01, *** p<0.001
Hypothesis ⑷ There will be a difference in WTP by major
An ANOVA was carried out to see if there were any statistical differences in WTP values for each
service by the users’ major field, and the results are summarized in Table 16. WTP values
regarding only the electronic scholarly information service, such as international and domestic
journals, showed differences between the groups. However, according to the Scheffe test’s post-
hoc analysis, WTP values only had a meaningful difference for international journals between
users of social science and engineering. There was no difference among user groups on
domestic journal usage in post-hoc analysis. Therefore, except for partial services, a user’s major
did not affect the WTP value. Hypothesis (4) was partially adopted.
<Table 16> ANOVA on average WTP value by major
N Mean F P
Post-hoc analysis (Scheffe test)
result
Book lending
Humanities 94 1127.13
1.852 0.086 no difference Social Science 240 1162.58
Natural 121 936.86

19
Science
Engineering 174 702.70
Medicine 33 963.64
Arts/Sports 19 694.74
Education 61 713.11
International
journal
Humanities 93 1488.28
3.033 0.006
** social science >
engineering
Social Science 238 1808.28
Natural Science
121 1202.24
Engineering 172 954.42
Medicine 33 1336.36
Arts/Sports 17 2029.41
Education 58 1482.78
Domestic journal
Humanities 93 935.05
3.322 0.003
** no difference
Social Science 238 1145.21
Natural Science
120 899.38
Engineering 173 681.92
Medicine 33 1070.30
Arts/Sports 17 1823.53
Education 58 1090.71
Reference service
Humanities 92 527.72
1.582 0.149 no difference
Social Science 237 731.81
Natural Science
119 409.08
Engineering 171 426.15
Medicine 33 501.82
Arts/Sports 18 479.44
Education 59 344.27
User education
Humanities 93 2052.80
.394 0.883 no difference
Social Science 228 2790.88
Natural Science
113 2852.85
Engineering 167 2753.90
Medicine 33 1793.94
Arts/Sports 18 3605.56
Education 58 1926.21
Reading room
Humanities 91 894.95
1.775 0.102 no difference
Social Science 235 1047.62
Natural Science
116 1008.02
Engineering 169 681.18
Medicine 33 940.91
Arts/Sports 18 555.56
Education 59 736.46
** p<0.01
After dividing the users by status into professor, graduate student, and undergraduate,
undergraduates and professors showed no difference by major, but graduate students had a
difference in WTP value by major about book lending and reference services at the 0.05 level of
significance. Upon post-hoc analysis, the book lending WTP values of humanities graduate
students were higher than those of engineering students. There was no difference in rank among
the groups regarding reading room usage by post-hoc analysis.
20
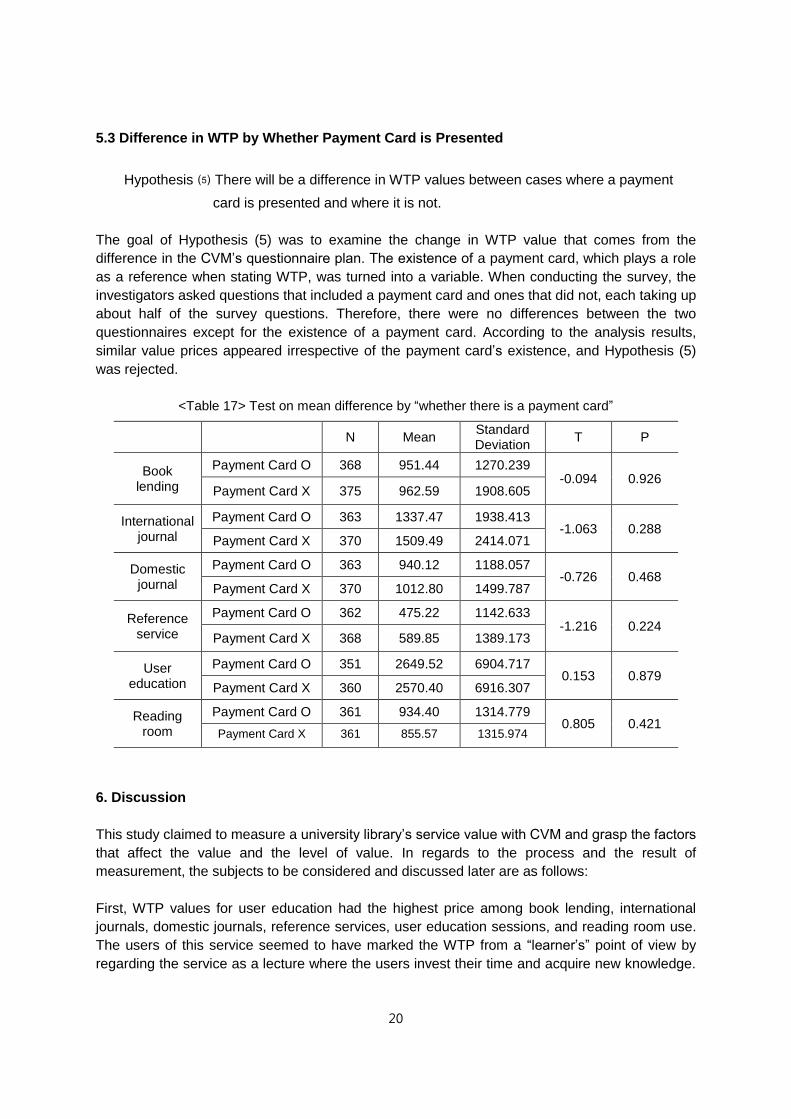
5.3 Difference in WTP by Whether Payment Card is Presented
Hypothesis ⑸ There will be a difference in WTP values between cases where a payment
card is presented and where it is not.
The goal of Hypothesis (5) was to examine the change in WTP value that comes from the
difference in the CVM’s questionnaire plan. The existence of a payment card, which plays a role
as a reference when stating WTP, was turned into a variable. When conducting the survey, the
investigators asked questions that included a payment card and ones that did not, each taking up
about half of the survey questions. Therefore, there were no differences between the two
questionnaires except for the existence of a payment card. According to the analysis results,
similar value prices appeared irrespective of the payment card’s existence, and Hypothesis (5)
was rejected.
<Table 17> Test on mean difference by “whether there is a payment card”
N Mean
Standard Deviation
T P
Book lending
Payment Card O 368 951.44 1270.239 -0.094 0.926
Payment Card X 375 962.59 1908.605
International journal
Payment Card O 363 1337.47 1938.413 -1.063 0.288
Payment Card X 370 1509.49 2414.071
Domestic journal
Payment Card O 363 940.12 1188.057 -0.726 0.468
Payment Card X 370 1012.80 1499.787
Reference service
Payment Card O 362 475.22 1142.633 -1.216 0.224
Payment Card X 368 589.85 1389.173
User education
Payment Card O 351 2649.52 6904.717 0.153 0.879
Payment Card X 360 2570.40 6916.307
Reading room
Payment Card O 361 934.40 1314.779 0.805 0.421
Payment Card X 361 855.57 1315.974
6. Discussion
This study claimed to measure a university library’s service value with CVM and grasp the factors
that affect the value and the level of value. In regards to the process and the result of
measurement, the subjects to be considered and discussed later are as follows:
First, WTP values for user education had the highest price among book lending, international
journals, domestic journals, reference services, user education sessions, and reading room use.
The users of this service seemed to have marked the WTP from a “learner’s” point of view by
regarding the service as a lecture where the users invest their time and acquire new knowledge.
21
International journal downloads had the second highest WTP, which reflects the essential role of
a university library in supporting research and study by providing scholarly information.
Second, owing to the structure of this study, respondents were likely to feel pressure or reject
stating the value at all if the questions about the 5 services had been multiple choice or
complicated. As such, the study measured the value using open-ended questions. The total
range of WTP values was very broad, and it caused hardships in the calculation of reliable
values. In addition to the mean, which is typically used, the study presented various value prices,
such as the median, 5%-trimmed average, etc.
The users’ WTP values regarding university library services measured in this study were
determined personally by individual users about the values of particular services. Deducted WTP
was complexly affected not only by a user’s individual experience of using library services but
also by the characteristics of the institute the user belongs to, personal characteristics of the user,
situational attributes, and the composition of the questionnaire. At the present time, few studies
have detailed how to measure service value, and systematic analyses on factors that affect WTP
are scarce. Therefore, this study deducted the characteristics of the university providing the
service, the characteristics of the user, and characteristics related to survey composition as
potential reasons that might influence WTP values of users, and selected and tested hypotheses
to see if these characteristics actually affect WTP.
The analysis results of WTP differences by hypotheses were university characteristics, user
characteristics, and survey composition.
First, among the 5 causes set up through the preliminary survey and literature review, the cause
that showed a statistically significant effect on WTP values of surveyed university library users
was the status of the user. It has been reported that there are differences in most service areas
based on the user’s status, such as a student or professor. The general environment of university
library-university characteristics (education or research-oriented, private or national), a user’s
major, and the survey composition (existence of payment card) did not produce a difference in
WTP by and large.
Second, it is easy to understand that professors’ WTP level would turn out higher than that of
students. However, it is difficult to conclude that the service value that professors experience is
higher than that of undergraduates or graduate students. The high WTP of the professor group
may show a relative value about services, but it could also reflect the economic level between
the professor group and the student group. A substantially high WTP was observed in the
professor group’s data, although it was a minority. In the case of very high WTP values, which
are regarded as an ideal point, it can be said that these high values reflect a relatively high
service value rather than the economic position of the particular user. There almost never were
very high WTP values in the student group. Therefore, users’ WTP values were affected by a
complex combination of individual economic level and experienced level of services. A
measurement method that can distinguish these differences will need to be developed.
Third, even though there were no statistically significant results, additional research of the
characteristics included in this study (university, user’s major, the existence of a payment card) is
still necessary. To achieve more valid WTP values, this study contacted individual users through
face-to-face surveys and limited the target institute of research to 4 universities. Therefore, the
22
results of our hypothesis tests should be considered provisional. If related data are collected and
analyzed in different situations at other times, clearer results regarding the research questions of
this study sought may be achieved.
7. Conclusion
Recently, the value of a university library has become a key measure of the actual performance
of a university. The value of a university library assesses the contribution made by library
services with various properties to the success of professors and students through the subjective
judgment of users who actually benefit from these services. The intangible character of value and
the subjectivity of value judgment are the main reasons that value measurements are difficult to
carry out; therefore, a university library’s value should be investigated and in-depth research on
measurement methods should be conducted to draw better conclusions regarding this topic.
CVM, which is usually applied in the public sector and to public libraries, has the advantage of
being able to measure usefulness and nonuse values most directly, but few advanced research
studies on value measurement of the entire service offerings of a university library with the help
of CVM have been published domestically or internationally. The main reason for this lack of
studies is that basic discussion to investigate a university library’s value has only just started, and
information regarding the best methodology for measuring the value of library services of
universities that have various characteristics is still in its infancy.
In this context, the value measurement performed in this study was significant in that this study
was an experimental measurement study that applied a single measurement method, CVM, to
various services. Moreover, it was meaningful that the study tried a methodical explanation by
testing hypotheses on various factors that affect WTP, a value of service authorized by users. In
the hypothesis test, WTP differed according to the users’ status (who the user is) as well as by
characteristics of the institution, and the survey method did not influence the WTP distinctively. In
various information service environments (including a university library), a continuous study
should be carried out to measure the level of service that the user actually experiences through
the users’ subjective value judgment and on the factors that affect their value judgment. Through
this effort, studies would be able to collect and utilize data that people directly or indirectly
concerned with library studies can depend on for the value of library services.
References
Abels, E. G. 1997. Improving reference service cost studies. Library and Information Science
Research, 19(2): 135-152.
Cable, L. G. 1980. Cost analysis of reference service to outside users. Bulletin of the Medical
Library Association, 68(2): 247.
Donovan, J. M. 1996. Do Librarians Deserve Tenure? Casting an Anthropological Eye on Role
Definition within the Law School. Law Library Journal, 88(3): 382-401.
Hamrick, F. A., Schuh, J. H. & Shelley, M. C. 2004. Predicting higher education graduation rates
from institutional characteristics and resources allocation. Education Policy Analysis
Archives.12(19). Retrieved from http://epaa.asu.edu/ojs/article/view/174
23
Jager, K. 2002. Successful Students: Does the Library Make a Difference? Performance
Measurement and Metrics, 3(3): 140-144.
Kantor, P. B. 1986. Three studies of the economics of academic libraries. Advances in Library
Administration and Organization, 5 : 221-286.
Kantor, P. B., Saracevic, T. & D'Esposito-Wachtmann, J. 1995. Studying the cost and value of
library services. Final Report New Brunswick, NJ: School of Communication, Information
and Librayr Studies, Rutgers University. Technical report APLAB/94-3. Retrieved from
http://www.academia.edu/2820469/Studying_the_cost_and_value_of_library_services_fin
al_report
King, D. W., Aerni, S., Brody, F., Herbison, M., & Knapp, A. 2004.The Use and Outcomes of
University Library Print and Electronic Collections.The Sara Fine Institute for
Interpersonal Behavior and Technology. Retrieved from
http://web.utk.edu/~tenopir/research/pitts/Pitt_Use_Final.pdf
Korea Education and Research Information Service. 2012. Research Information Statistics.
Retreived from http://www.rinfo.kr/.
Kuh, G. D. & Hu, S. 2001. Learning productivity at research universities. The Journal of Higher
Education. 72(1): 1-28.
Luther, J. 2008. University Investment in the Library: What's the Return? A Case Study at the
University of Illinois at Urbana-Champaign. San Diego, CA: Elsevier. Retrieved from
http://citeseerx.ist.psu.edu/viewdoc/download?doi=10.1.1.183.1882&rep=rep1&type=pdf.
Matthews, J. R. 2007. Library Assessment in Higher Education. London: Libraries Unlimited.
Melo, L. B., & Pires C. P. 2011. Measuring the economic value of the electronic scientific
information services in Portuguese academic libraries. Journal of Librarianship and
Information Science. 43(3): 146-156.
Munde, G. & Marks, K. 2009.Surviving the Future: Academic Libraries, Quality, and Assessment.
London: Chando Pub.
Noonan, D. S. 2003. Contingent valuation and cultural reseources: a meta-analysis review of the
literature. Journal of Cultural Economics. 27: 159-176.
Oakleaf, M. 2010. Value of Academic Libraries: A Comprehensive Research Review and Report.
Chicago: ACRL. Retrieved from
http://www.ala.org/acrl/sites/ala.org.acrl/files/content/issues/value/val_report.pdf
Online Computer Library Center. 2005. Perceptions of Libraries and Information Resources: A
Report to the OCLC Membership. Dublin, OH: OCLC.
Research Information Network & Research Libraries UK. 2011. The Value of Libraries for
Research and Researchers. London: Research Information Network. Retrieved from
http://www.rluk.ac.uk/content/value-libraries-research-and-researchers.
Saracevic, T. & Kantor, P. B. 1997.Studying the value of library and information services. Part II.
Methodology and taxonomy. Journal of the American Society for Information Science,
48(6), 543-563.
Tenopir, C. et al. 2010. University investment in the library: An international study of the library's
value to the grants process. Library Connect White Paper II. Retrieved from
http://libraryconnect.elsevier.com/sites/default/files/2010-06-whitepaper-roi2_0.pdf
Tenopir, C. & King, D. W. 2007. Perceptions of Value and Value Beyond Perceptions: Measuring
the Quality and Value of Journal Article Readings. Serials, 20(3): 199-207.
Whitmire, E. 2002. Academic Library Performance Measures and Undergraduates' Library Use
and Educational Outcomes. Library and Information Science Research, 24(2): 107-128.
Wong, S. R. & Webb, T. D. 2011. Uncovering Meaningful Correlation between Student Academic
Performance and Library Material Usage. College & Research Libraries, July: 361-370.