Embed Size (px)
Citation preview
i
Factors Affecting the Profitability of
Pharmacies
Graham Pampel
Student Number: 0411217R
Supervisor: Nirupa Padia
Ethics Number: CACCN/1023
A research report submitted to the Faculty of Commerce, Law and
Management, University of the Witwatersrand, in partial fulfilment of the
requirements for the degree of Bachelor of Commerce Masters in Accounting
Johannesburg, 2013
ii
ABSTRACT
In South Africa, the pharmaceutical industry has been in a state of flux since the end of
apartheid. The Department of Health intends to make healthcare available to all and, in so
doing, a number of laws have changed. These laws have affected the entire medicine
supply chain and have caused the cost of medicine to be reduced in order to make it more
affordable. However, this price fixing or ceiling, as implemented by the Department of
Health, has resulted in a number of pharmacy closures.
This research paper thus attempts to identify factors which affect the profitability of
pharmacies so that pharmacies can devote their time and efforts to areas that will result in
the best outcomes. In this research, the factors identified and tested included average
inventory holding, floor space, product mix and location. Other ancillary variables were
also tested, including customer loyalty, advertising, prescribing and buying patterns,
buyer groups and the effect of information technology. In testing the location, an index
was developed from four other factors, which added a level of complexity to the variable
that is also apparent in the retail literature.
The method used to analyse these factors was least squares regression. Data was obtained
from a questionnaire completed by a sample of 65 pharmacies situated in Johannesburg,
South Africa. Cluster analysis also provided insight into the location factor.
The results of this research prove that average inventory holding and floor space have an
effect on the profitability of pharmacies. However, location and product mix appear to
have no relationship with pharmacy profitability. A number of interesting conclusions
were drawn, for example customer loyalty and the number of doctors near the pharmacy
seem to have some relationship with pharmacy profitability. Other factors not examined
by this research could be considered in the future to determine their relationship with
profit.
iii
DECLARATION
I, Graham Edward Pampel, declare that this research report is my own work. It is
submitted in partial fulfilment of the requirements for the degree of Bachelor of
Commerce Masters in Accounting in the University of the Witwatersrand, Johannesburg.
It has not been submitted before for any degree or examination in this or any other
university.
_____________________
Graham Edward Pampel
30 September 2013

iv
DEDICATION
I would like to thank my family, girlfriend and friends who supported me throughout this
process. The support was greatly appreciated, especially on those days that things did not
seem to be going right. I would like to thank my company, Deloitte, for being supportive
throughout the process, providing me the necessary leave to ensure that I completed this
dissertation on time. To Professor Nirupa Padia, thank you for all the hard work and the
hours spent with me keeping me going no matter what challenges I faced.

v
ACKNOWLEDGEMENTS
I would like to thank all the pharmacists who completed the questionnaires. Without
them this research would not have been possible. Thank you to my supervisor Professor
Nirupa Padia, whose undivided support and attention were fantastic. I had almost given
up on completing this degree until we had that chat over coffee. Despite all the setbacks I
would like to thank you for helping me get over the finish line. I would also like to thank
Ms Dina Venter for assisting me with my statistics and giving of her time to explain the
relationships that did not make sense to me. To Ms Alexa Barnby, I appreciate the hours
spent editing this document and ensuring that my grammar and spelling were sound.
1
Table of contents
ABSTRACT ...................................................................................................................... II
DECLARATION ............................................................................................................. III
DEDICATION ................................................................................................................. IV
ACKNOWLEDGEMENTS .............................................................................................V
1 INTRODUCTION ..................................................................................................... 1
1.1 Background of the study......................................................................................................................1
1.2 Problem statement ...............................................................................................................................7
1.3 Significance of the study .................................................................................................................... 16
1.4 Delimitations and limitations ............................................................................................................ 17
1.5 Definition of terms ............................................................................................................................. 17
2 LITERATURE REVIEW ...................................................................................... 21
2.1 Introduction ........................................................................................................................................ 21
2.2 Background discussion ...................................................................................................................... 22
2.3 Development of a model for performance ........................................................................................ 23
2.4 Factors affecting the profitability of pharmacies ............................................................................ 25
2.4.1 Average inventory holding ......................................................................................................... 26
2.4.1.1 Information technology ..................................................................................................... 27
2.4.1.2 Prescribing and purchasing patterns.................................................................................. 28
2.4.2 Product mix ................................................................................................................................ 29
2.4.2.1 Advertising........................................................................................................................ 31
2.4.2.2 Other services ................................................................................................................... 32
2.4.2.3 Customer loyalty ............................................................................................................... 32
2
2.4.2.4 Discounts and buyer groups .............................................................................................. 34
2.4.3 Floor space ................................................................................................................................. 35
2.4.4 Location ...................................................................................................................................... 36
2.4.4.1 Roadside accessibility ....................................................................................................... 37
2.4.4.2 Pedestrian accessibility ..................................................................................................... 38
2.4.4.3 Competition ...................................................................................................................... 39
2.4.4.4 Number of doctors ............................................................................................................ 40
2.5 Conclusion of literature review ......................................................................................................... 41
3 RESEARCH METHODOLOGY .......................................................................... 42
3.1 Introduction ........................................................................................................................................ 42
3.2 Research methodology ....................................................................................................................... 42
3.3 Research design .................................................................................................................................. 43
3.4 Population ........................................................................................................................................... 45
3.5 Sample and sampling method ........................................................................................................... 46
3.6 Instrument design and data collection ............................................................................................. 47
3.6.1 Average inventory holding ......................................................................................................... 48
3.6.2 Total turnover and turnover from scripts .................................................................................... 49
3.6.3 Number of pharmacies ............................................................................................................... 50
3.6.4 Number of doctors in the region ................................................................................................. 51
3.6.5 Floor space ................................................................................................................................. 51
3.6.6 Roadside accessibility and pedestrian accessibility .................................................................... 52
3.6.7 Location index ............................................................................................................................ 52
3.6.8 Other relevant data points ........................................................................................................... 53
3.7 Data analysis ....................................................................................................................................... 53
3.8 Validity and reliability ....................................................................................................................... 55
3.8.1 Validity ....................................................................................................................................... 55
3.8.2 Reliability ................................................................................................................................... 56
3.9 Conclusion .......................................................................................................................................... 56
4 THE RESULTS ....................................................................................................... 58
3
4.1 Introduction ........................................................................................................................................ 58
4.2 Sample tested and response rate ....................................................................................................... 58
4.3 Descriptive statistics ........................................................................................................................... 60
4.4 Regression analysis ............................................................................................................................ 68
4.4.1 Individual variable analysis ........................................................................................................ 68
4.4.2 Multiple Regression Analysis ..................................................................................................... 75
4.5 K-means cluster analysis ................................................................................................................... 81
4.5.1 Low competition/good accessibility ........................................................................................... 81
4.5.2 High competition/poor accessibility ........................................................................................... 82
4.5.3 High competition/good accessibility .......................................................................................... 82
4.5.4 Low competition/good pedestrian accessibility/poor roadside accessibility .............................. 82
4.5.5 Situational index ......................................................................................................................... 84
4.5.6 Validation of cluster solution ..................................................................................................... 85
4.6 Group type tests ................................................................................................................................. 86
4.6.1 Group tests .................................................................................................................................. 86
4.6.2 Regional Tests ............................................................................................................................ 88
5 INTERPRETATION OF RESULTS .................................................................... 89
5.1 Introduction ........................................................................................................................................ 89
5.2 Testing of hypotheses ......................................................................................................................... 89
5.2.1 Average inventory holding ......................................................................................................... 89
5.2.2 Product mix ................................................................................................................................ 92
5.2.3 Floor space ................................................................................................................................. 98
5.2.4 Location .................................................................................................................................... 101
5.3 Conclusion ........................................................................................................................................ 104
6 CONCLUSIONS AND AREAS FOR FUTURE RESEARCH ......................... 105
6.1 Introduction ...................................................................................................................................... 105
6.2 Overall conclusions .......................................................................................................................... 105
6.3 Areas for future research ................................................................................................................ 107

4
APPENDIX A TABLE OF FIGURES .......................................................................... I
APPENDIX B QUESTIONNAIRE ................................................................................ I
7 REFERENCES ........................................................................................................... I
1
1
1 INTRODUCTION
In South Africa, the pharmaceutical industry has been in a state of flux since the end of
apartheid. Laws have been enacted which have affected the entire medicine supply chain.
These laws have driven the price of medicines downward and as a result a number of
pharmacies have closed down.
The purpose of this section is to provide insight in to the issue identified above.
Accordingly, the historical background relating to the topic will be discussed. This
discussion will provide valuable insights into the pharmaceutical industry as a whole, as
well as the specific area of the medicine supply chain to be analysed, namely,
pharmacies. The research problem will be developed from this analysis together with an
explanation of the significance of this research. Further, the width, breadth and
underlying assumptions of the research will also be considered. This chapter will also
define the industry-specific terminology that will be used in the following sections of the
report. Finally, the chapter will end with a discussion on the subsequent sections of the
research report.
1.1 Background of the study
Since 2004, the pharmaceutical industry has consistently been in the media spotlight.
Much of the focus has been on the extraordinary profits earned by pharmacies and ways
in which to curb these profits in order to make medicines available to the general public
at the lowest possible cost. Pharmacists have, for obvious reasons, strongly opposed the
new pricing regulations ("New pricing model has pharmacists worried," 2006).
Despite the arguments presented by the pharmacists, in 2004 the Department of Health
(DOH) implemented new pricing regulations. In response, pharmacists challenged the
new regulations in the Supreme Court of Appeal and the matter was finally resolved in
2
the Constitutional Court, where the court recommended a review of the dispensing fee
model and a consideration of the viability of retail pharmacies ("CCT 59/04," 2004).
Despite the legal setback, the DOH is remaining focused on ensuring that primary health
care is available to the entire population. This is aligned with the preamble to the
Medicines and Related Substances Act No. 101 of 1965, which states that the purpose of
the Act is “to provide for measures for the supply of more affordable medicines in certain
circumstances” ("Medicines and Related Substances Act," 1965). This intention is also
highlighted by the proposed implementation of the National Health Insurance system
("EDITORIAL: Prepare for a new healthcare battle," 2012; "Negotiations are the best
medicine," 2011) by the DOH.
At this stage it should be noted that pricing pressure has not only been focused on the
local pharmacy. The pharmaceutical manufacturers have also been under pricing
pressures. These relate to the annual price increase that they can apply to their medicines.
In this regard, there is a formula that is applied to determine the value of what is referred
to as the single exit price (SEP). This concept is defined later in the chapter. However, the
pricing committee, a body that forms part of the DOH, can override the expected increase
if they believe this is necessary, which was the case in 2008. In that year, the pricing
committee increased the SEP by only 6,5%, which was in line with retail inflation. This
was lower than the 8% suggested by the manufacturers in line with the published formula
(Kahn, 2008b). Drug distributors or wholesalers are not permitted to charge logistics fees
in certain instances (Kahn, 2011a).
The state of the South African pharmaceutical industry is, however, no different to that in
other developed and developing countries in the world. In Iran, to curb out-of-pocket
expenses faced by consumers when purchasing medicines from pharmacies, policy
makers intend to reduce the dispensing fee that these pharmacies can charge (Keshavarz,
Kebriaeezadeh, Meshkini, Nikfar, Mirian, & Khoonsari, 2012). In both the UK and
Germany there have been changes in legislation that have altered the special status of
pharmacies. This is mainly due to pricing pressures faced by the health sector in these
countries (Pioch & Schmidt, 2004). A working group of the United Nations Millennium
3
project suggests that there is a need to provide affordable essential drugs to developing
countries (Waning, Maddix, & Soucy, 2010).
In order to understand the role of the retail pharmacy in the South African healthcare
system it is important to understand all the key role players in the supply chain. These
players include the pharmaceutical manufacturers, medicine wholesalers, the DOH,
doctors, medical aids and pharmacies.
Pharmaceutical manufacturers form the start of the medicine supply chain. They are
responsible for manufacturing the medicines that will be sold in the pharmacies. They are
responsible for the process of researching and developing new drugs which are then
introduced into the market. These manufacturers are usually multinational corporations
such as Aspen, Glaxo-Smith Kline and AstraZeneca, to name but a few. These
manufacturers produce two types of medicine for the market; these are referred to as
brand name drugs and generic medicines respectively. Brand name drugs are drugs that
are developed under a patent and are usually more expensive than generic medicine.
Generic medicine, on the other hand, is defined in section 1 of the Medicines and Related
Substances Act No. 101 of 1965 as interchangeable multi-source medicine, that is,
“medicines that contain the same active substances … which comply with the
requirements for therapeutic equivalence as prescribed”. Both of these types of medicine
need to be sold by the manufacturer at the SEP.
The next step in the supply chain is the medicine wholesaler. This stage in the supply
chain is responsible for making bulk purchases from the pharmaceutical manufacturer.
The wholesaler assists with the logistics associated with the delivery of medicines to the
next stage in the supply chain and is responsible for distributing medicine to both the
private and the public healthcare sector. These wholesalers purchase medicines from a
variety of local and internal pharmaceutical companies. They also have extensive
bargaining power with the drug manufacturers owing to the competition that exists in this
arena, particularly when it relates to generic medicines (Kahn, 2011a).
4
The national health ministry is a key element of any healthcare system. Accordingly, the
DOH is responsible for dictating the healthcare policy of the country. It does so by
passing legislation that provides stability within the healthcare sector. This ensures
consistency.
Doctors play an important role in the medicine supply chain. They are responsible for
treating patients for a spectrum of different ailments. Further, doctors are the only
members of the healthcare profession that are entitled to prescribe medicines within
South Africa. The current reality is that doctors are not only entitled to prescribe
medicine but also to dispense it (Gilbert, 1998; "SAMA Medigram : Double dose of good
news for dispensing doctors ", 2011). This adds an additional competitive element to the
retail pharmacy segment.
Another key role player in the medicine supply chain in South Africa is the medical
schemes. These are corporate bodies that have been established in terms of the Medical
Schemes Act No. 131 of 1998. Section 1 of this Act defines the business of a medical
scheme as undertaking liability in return for a premium or contribution
a) to make provision for the obtaining of any relevant health service;
b) to grant assistance in defraying expenditure incurred in connection with the
rendering of any relevant health service; and
c) where applicable, to render a relevant health service, either by the medical scheme
itself, or by any supplier or group of suppliers of a relevant health service or by
any person, in association with or in terms of an agreement with a medical scheme
("Medical Schemes Act," 1998).
As is clear from the above definition, members of these schemes are entitled to benefits, a
portion of which relates to medication. Thus, the medical aid plays a key role in the
dispensing of medication as patients can claim their prescriptions from pharmacists or
dispensing doctors without paying cash. This is because the medical scheme will settle
the claim later. The medical scheme thus effectively controls the cash flows of the
pharmacists and dispensing doctors as a result of the lead time between the actual claim
being submitted and the payment of the claim. Further, medical schemes play another
5
role in the medicine supply chain. This role is often seen as detrimental to the healthcare
industry, particularly from the perspective of the pharmacist. Medical schemes, as part of
their benefit schemes, will only permit that the cheapest generics be supplied (Holford-
Walker, 2011). If a doctor prescribes a different medicine, the patient will be responsible
for the payment gap that is created. Through this mechanism the medical schemes control
the dispensing patterns.
The pharmacy is the final step in the medicine supply chain. A pharmacy is defined in
section 1 of the Pharmacy Act No. 53 of 1974, as any place wherein or from which any
service specially pertaining to the scope of practice of a pharmacist is provided
("Pharmacy Act," 1974). The Pharmacy Act does not specifically define the practice of a
pharmacist. This is defined by the South African Pharmacy Council which, under the
1974 Pharmacy Act, is entitled to prescribe the scope of practice of a pharmacist. Thus, in
accordance with Regulation GNR 1158, the key element of the scope of practice is
defined as follows:
(1) The provision of pharmaceutical care by taking responsibility for the patient’s
medicine related needs….. (a) evaluation of a patient’s medicine related needs by
determining the indication, safety and effectiveness of the therapy; (b) dispensing of any
medicine or scheduled substance on the prescription of a person authorised to prescribe
medicine; (c) furnishing of information and advice to any person with regard to the use of
medicine (Council, 2000a, 2000b).
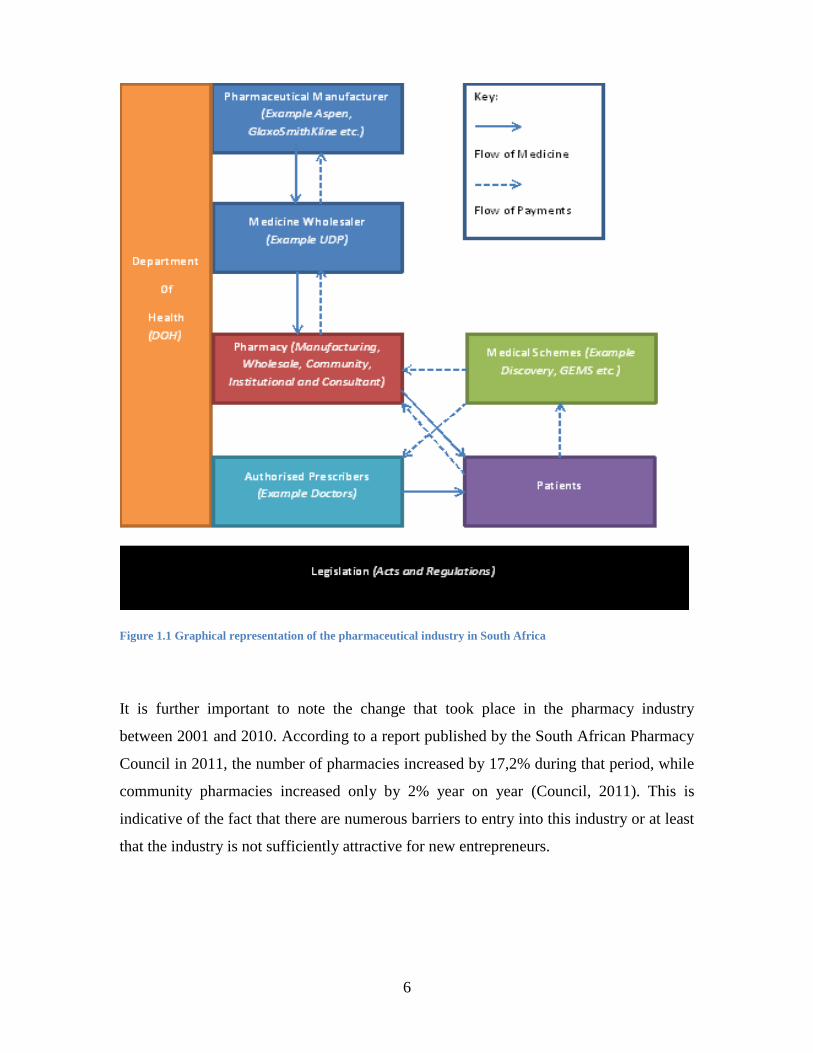
This regulation further divides the practice of pharmacies into different categories. These
categories are explained here because they form an important part of this research paper
and they define the research population. There are four categories of pharmacy in South
Africa. These include manufacturing pharmacies, wholesale pharmacies, community or
institutional pharmacies and consultant pharmacies. These entities are defined in the
regulation relating to the practice of pharmacy (Council, 2000a). Only key elements of
the definitions are included later in this chapter for the purposes of this research paper. A
graphic representation of the industry is included in Figure 1.1.
6
Figure 1.1 Graphical representation of the pharmaceutical industry in South Africa
It is further important to note the change that took place in the pharmacy industry
between 2001 and 2010. According to a report published by the South African Pharmacy
Council in 2011, the number of pharmacies increased by 17,2% during that period, while
community pharmacies increased only by 2% year on year (Council, 2011). This is
indicative of the fact that there are numerous barriers to entry into this industry or at least
that the industry is not sufficiently attractive for new entrepreneurs.
7
1.2 Problem statement
A key element of this research paper is to investigate the factors affecting the profitability
of pharmacies. Thus, it is necessary to develop an understanding of the term profit as it
will be used in this work. The Oxford English dictionary defines profit as “a financial
gain, especially the difference between the amount earned and the amount spent in
buying, operating, or producing something” (Dictionaries, 2010). Neither the
International Financial Reporting Standards Framework nor the International Financial
Reporting Standards defines profit as an individual term. However, it is referenced as an
element of disclosure on the bottom line of the Statement of Comprehensive Income. The
Statement of Comprehensive Income must include all items of income and expense
((IASB), 2007). Thus, reading the two definitions in conjunction develops an
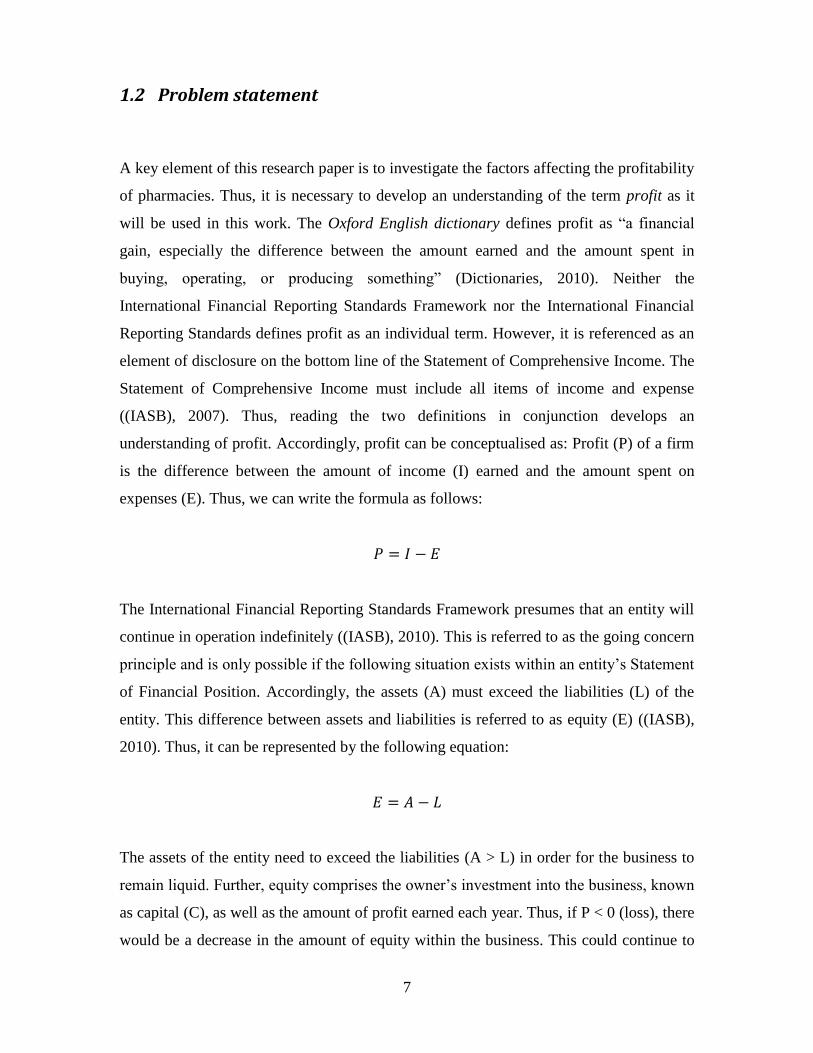
understanding of profit. Accordingly, profit can be conceptualised as: Profit (P) of a firm
is the difference between the amount of income (I) earned and the amount spent on
expenses (E). Thus, we can write the formula as follows:
The International Financial Reporting Standards Framework presumes that an entity will
continue in operation indefinitely ((IASB), 2010). This is referred to as the going concern
principle and is only possible if the following situation exists within an entity’s Statement
of Financial Position. Accordingly, the assets (A) must exceed the liabilities (L) of the
entity. This difference between assets and liabilities is referred to as equity (E) ((IASB),
2010). Thus, it can be represented by the following equation:
The assets of the entity need to exceed the liabilities (A > L) in order for the business to
remain liquid. Further, equity comprises the owner’s investment into the business, known
as capital (C), as well as the amount of profit earned each year. Thus, if P < 0 (loss), there
would be a decrease in the amount of equity within the business. This could continue to
8
take place until the capital invested is equal to the equity of the business minus the
accumulated profit (∑ P), or rather accumulated loss (∑ Loss). This is represented by the
following formula:
∑
Written differently:
( ∑ )
∑
At this point in time the entity would need to close or the owner would need to inject
further capital into the business in order for it to continue. This would represent the
accounting view of profit. This principle was captured in a research study performed in
Germany where it was stated that “unprofitability leads to outlet closure” (Pioch &
Schmidt, 2001).
As has been previously mentioned, it is the general view that pharmacies earn
extraordinary profits. If this were the case, however, there would have been a number of
new entrants into the industry and supporting statistics indicate that growth has been flat.
As a result, it would appear that there are underlying forces which are limiting growth
and that the barriers of entry are greater than the apparently extraordinary profits earned.
This research paper does not intend to develop theories as to why there is this apparent
disconnect. This research paper intends to determine what factors affect the profit of
these pharmacies. Thus the main focus is to consider the factors which have an impact on
the first equation presented, that is:
9
To understand the factors it is important to break down the elements of income and
expense further. From this breakdown it will be possible to identify factors on which the
hypotheses will be based for testing in this research paper.
Income is defined in the International Financial Reporting Standards Framework as
“increases in economic benefits during the accounting period in the form of inflows or
enhancements of assets or decreases of liabilities that result in increases in equity, other
than those relating to contributions from equity participants” ((IASB), 2010). This
definition is highly theoretical and requires extensive analysis in order to understand the
concept of income. It is therefore unnecessary for the purposes of the definition required.
As a result, the definition of revenue, as defined in IAS 18 Revenue, provides a clearer
and more understandable view of revenue by defining it as “the gross inflow of economic
benefits (cash, receivables, other assets) arising from the ordinary operating activities of
an entity (such as sales of goods, sales of services, interest, royalties, and dividends)”,
Thus, for the purposes of this research paper, the terms revenue and income will be used
interchangeably.
To understand revenue in the context of the pharmacy it is important to apply this
definition to the pharmacist’s trade. Cash and receivables are indicated as economic
benefits. The main flow of funds, as indicated in Figure 1.1, is the flow of cash to the
pharmacy from the patient or the medical scheme. Thus, the pharmacy will either receive
cash from the patient or will be waiting for cash to be paid by the medical scheme, hence
the recognition of a receivable. This cash or receivable must be received in the ordinary
course of the entity’s business. The ordinary course of the pharmacy’s business as
defined above is to provide medicines to patients, thus the sale of goods. Further, the
pharmacist is required to provide professional services to the patient, such as indicating
the correct method for the use of the medicine. Thus the income of a pharmacy can be
redefined as follows: The pharmacy will earn income (I) from sales (S) and the provision
of professional services (PS). A number of studies have shown how important the
pharmacist’s role is in identifying medical errors and inappropriate prescribing and the
optimal use of medication, as well as the fact that there is a need to make better use of
their knowledge and training (Harrison, Scahill, & Sheridan, 2012; Keshavarz et al.,
10
2012). In Iran, this has led to the introduction of a dispensing fee for the pharmacists
(Keshavarz et al., 2012).
These revenue elements can be further broken down into separate elements as they are
two distinctive streams. To begin with the analysis, sales (S) can be broken into different
streams. There is the sale of ethical medicine (EM), over-the counter (OTC) medicine and
non-medical (NM) items. EM is medicine which requires a prescription from an
authorised prescriber, usually a doctor. The medicine for which a prescription (“script”)
is required is those that are Schedule 3 and greater as defined by the Medicines and
Related Substances Act No. 101 of 1965. OTC medicine is medicine that is lower than
Schedule 2 and can be sold without a script. These medicines are not only stocked in a
pharmacy but are also sold in other retail stores such as supermarkets. The last stream of
revenue is from the sale of NM items. In South Africa there are different regulations
regarding what is entitled to be stocked in a pharmacy as compared to the rest of the
world. This will be considered in the next chapter. However, the regulation in South
Africa does not prevent pharmacies from stocking a wide range of items. This can include
food, cosmetics and toys, to name but a few.
Thus, the revenue generated from each stream will be dependent on two elements: the
selling price (SP) and the number of items sold (n). Thus revenue generated from a single
item will be determined by multiplying the selling price by the number of items sold.
Furthermore, it should be recognised that there is a wide range of products that can be
sold under each stream. Thus, the revenue generated from each stream will be the
summation of all the sales from that stream. This is represented as follows:
∑
The above formula can be used to represent each stream. Thus the following formula for
income can be derived:
11
∑ ∑ ∑
The equation suggests that to increase income in either or both the sales variable and the
number of items sold variable would produce such an outcome. This is not entirely true;
microeconomic theory determines the supply and demand curves and their relationship.
However, further analysis of these concepts is not within the scope of this paper. The
reason for this is twofold. Firstly, it can be generally widely accepted that prices will
increase in line with the Consumer Price Index. Further, consumers are more likely to
switch products that cost less, particularly when there is a situation of free market
competition. Secondly, pricing, particularly in the category of ethical medicine is
restricted by government. The second variable, the number of items sold, could be
increased indefinitely. The only limiting factor is the physical size of the pharmacy. In
the retail literature this is referred to as the gross sales area. This refers to the floor space
of the pharmacy. It is possible to extend this notion further by referring to the number of
shelves that an entity has as this would be more likely to provide a more accurate
description of the available space for the sale of items. It is commonly accepted in the
retail literature that floor space is a sufficient proxy for this, as locations are defined by
the number of sales per square metre.
To update the income formula the following adjustments are required to be made.
Assuming the total floor space (FS) is equal to one; for every percentage of floor space
that is used to sell one product there is less space to sell other items. Thus, the equation
for a set of items is
where ni represents the number of items sold of each category, that is, EM, OTC and NM
items. FStotal represents the total available floor space within the pharmacy, while FSj and
FSk represent the percentage floor space utilised for the sale of the other categories and ni
12
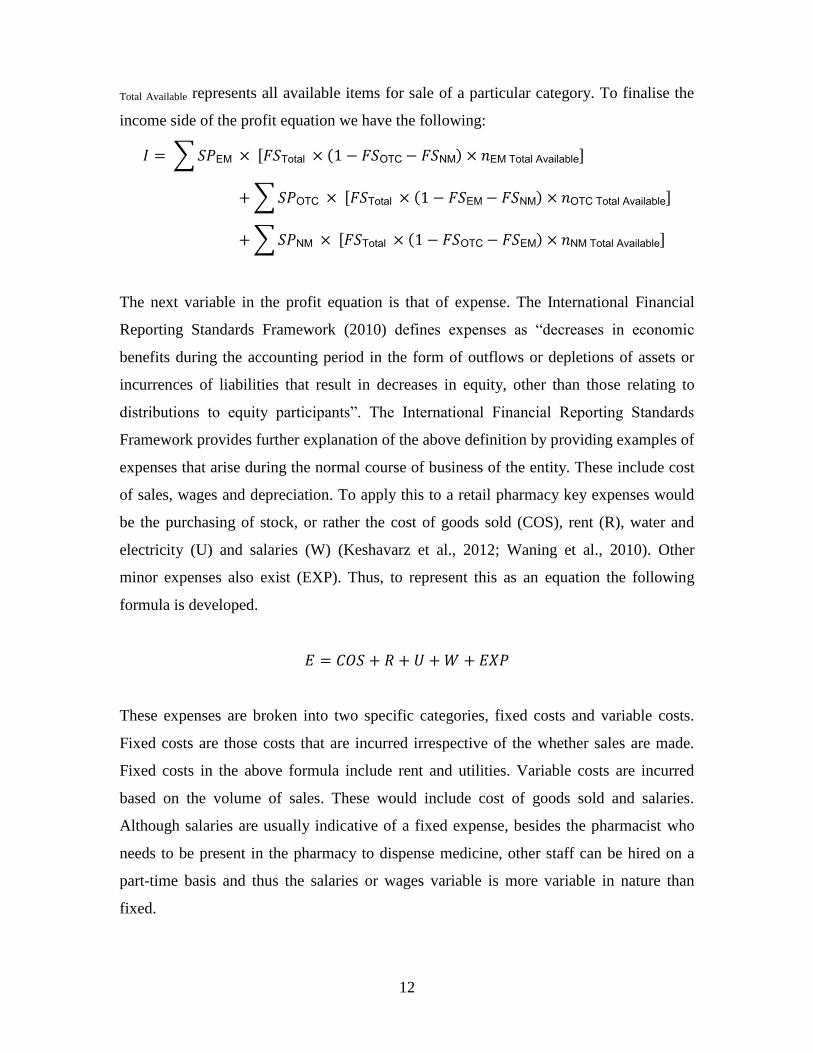
Total Available represents all available items for sale of a particular category. To finalise the
income side of the profit equation we have the following:
∑ [ ]
∑ [ ]
∑ [ ]
The next variable in the profit equation is that of expense. The International Financial
Reporting Standards Framework (2010) defines expenses as “decreases in economic
benefits during the accounting period in the form of outflows or depletions of assets or
incurrences of liabilities that result in decreases in equity, other than those relating to
distributions to equity participants”. The International Financial Reporting Standards
Framework provides further explanation of the above definition by providing examples of
expenses that arise during the normal course of business of the entity. These include cost
of sales, wages and depreciation. To apply this to a retail pharmacy key expenses would
be the purchasing of stock, or rather the cost of goods sold (COS), rent (R), water and
electricity (U) and salaries (W) (Keshavarz et al., 2012; Waning et al., 2010). Other
minor expenses also exist (EXP). Thus, to represent this as an equation the following
formula is developed.
These expenses are broken into two specific categories, fixed costs and variable costs.
Fixed costs are those costs that are incurred irrespective of the whether sales are made.
Fixed costs in the above formula include rent and utilities. Variable costs are incurred
based on the volume of sales. These would include cost of goods sold and salaries.
Although salaries are usually indicative of a fixed expense, besides the pharmacist who
needs to be present in the pharmacy to dispense medicine, other staff can be hired on a
part-time basis and thus the salaries or wages variable is more variable in nature than
fixed.
13
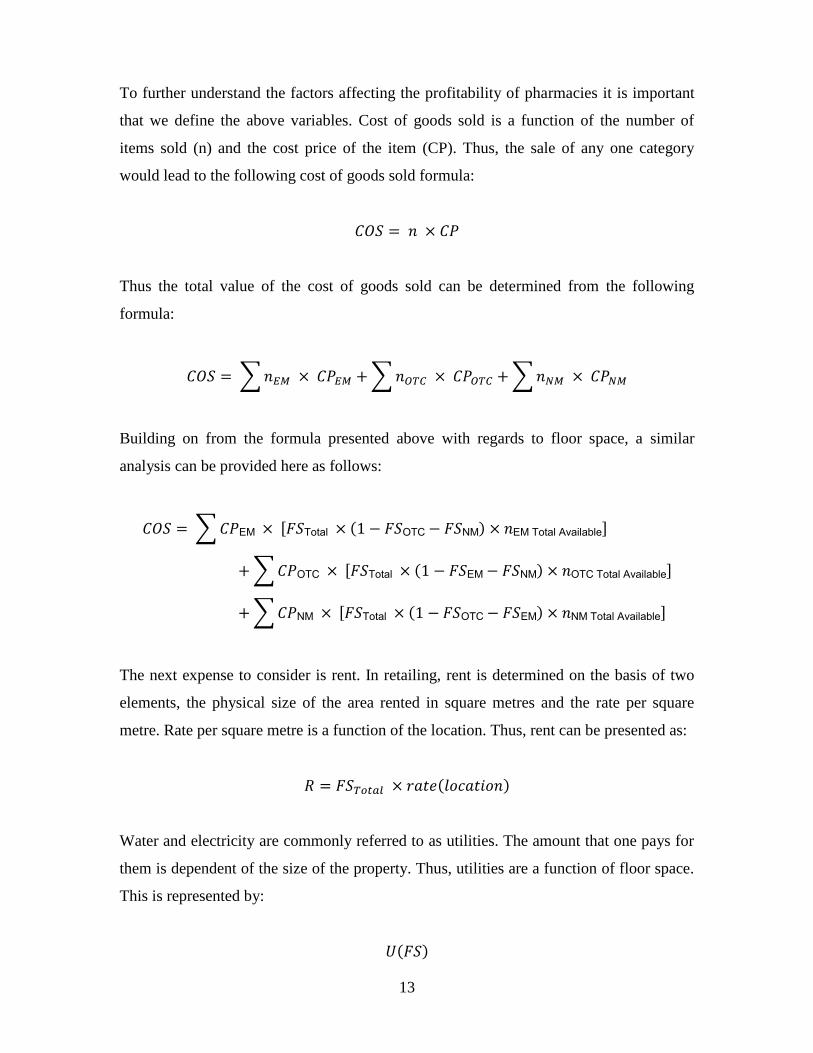
To further understand the factors affecting the profitability of pharmacies it is important
that we define the above variables. Cost of goods sold is a function of the number of
items sold (n) and the cost price of the item (CP). Thus, the sale of any one category
would lead to the following cost of goods sold formula:
Thus the total value of the cost of goods sold can be determined from the following
formula:
∑ ∑ ∑
Building on from the formula presented above with regards to floor space, a similar
analysis can be provided here as follows:
∑ [ ]
∑ [ ]
∑ [ ]
The next expense to consider is rent. In retailing, rent is determined on the basis of two
elements, the physical size of the area rented in square metres and the rate per square
metre. Rate per square metre is a function of the location. Thus, rent can be presented as:
Water and electricity are commonly referred to as utilities. The amount that one pays for
them is dependent of the size of the property. Thus, utilities are a function of floor space.
This is represented by:
14
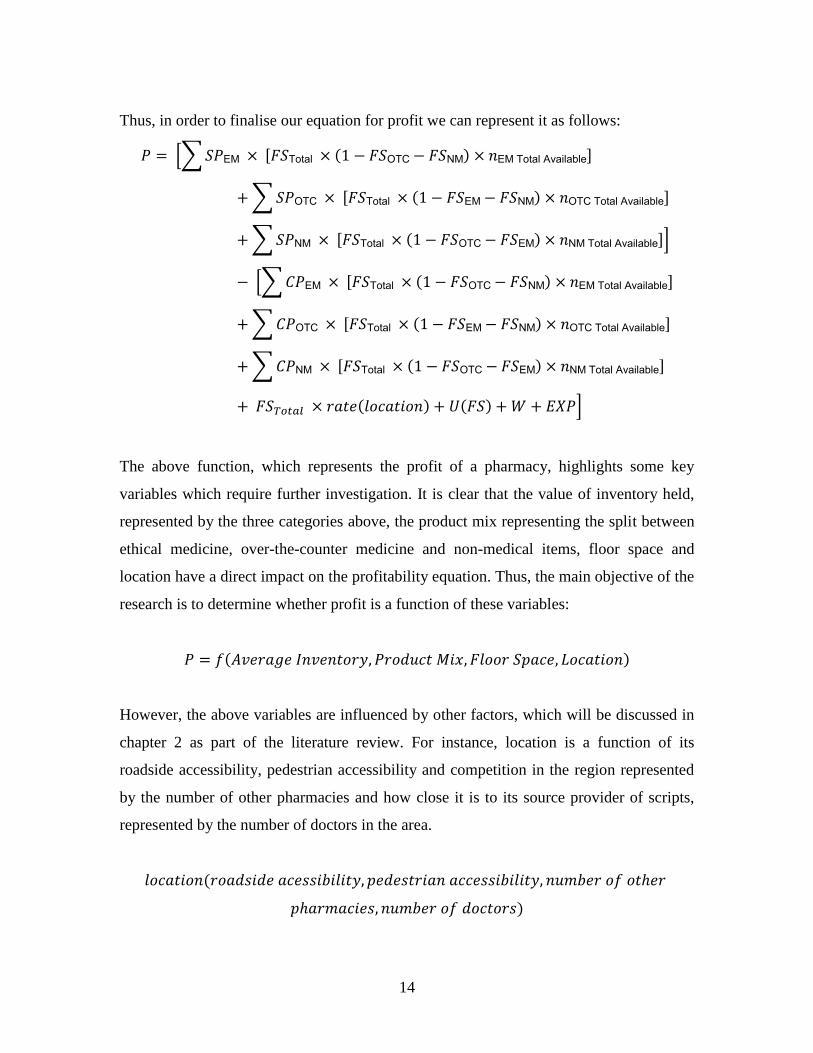
Thus, in order to finalise our equation for profit we can represent it as follows:
[∑ [ ]
∑ [ ]
∑ [ ]]
[∑ [ ]
∑ [ ]
∑ [ ]
]
The above function, which represents the profit of a pharmacy, highlights some key
variables which require further investigation. It is clear that the value of inventory held,
represented by the three categories above, the product mix representing the split between
ethical medicine, over-the-counter medicine and non-medical items, floor space and
location have a direct impact on the profitability equation. Thus, the main objective of the
research is to determine whether profit is a function of these variables:
However, the above variables are influenced by other factors, which will be discussed in
chapter 2 as part of the literature review. For instance, location is a function of its
roadside accessibility, pedestrian accessibility and competition in the region represented
by the number of other pharmacies and how close it is to its source provider of scripts,
represented by the number of doctors in the area.
15
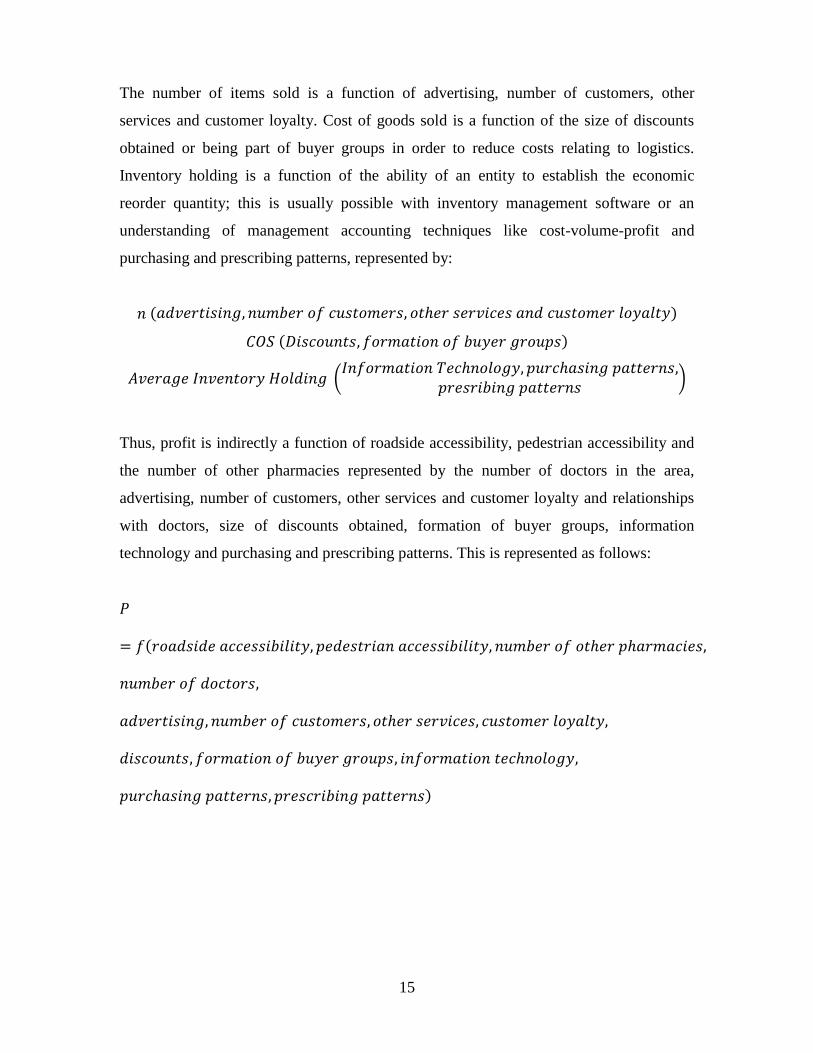
The number of items sold is a function of advertising, number of customers, other
services and customer loyalty. Cost of goods sold is a function of the size of discounts
obtained or being part of buyer groups in order to reduce costs relating to logistics.
Inventory holding is a function of the ability of an entity to establish the economic
reorder quantity; this is usually possible with inventory management software or an
understanding of management accounting techniques like cost-volume-profit and
purchasing and prescribing patterns, represented by:
(
)
Thus, profit is indirectly a function of roadside accessibility, pedestrian accessibility and
the number of other pharmacies represented by the number of doctors in the area,
advertising, number of customers, other services and customer loyalty and relationships
with doctors, size of discounts obtained, formation of buyer groups, information
technology and purchasing and prescribing patterns. This is represented as follows:
16
1.3 Significance of the study
The pharmaceutical industry has been in the news since 2001 with a number of court
cases ("CCT 59/04," 2004) that have subsequently resulted in the suspension of the
implementation of the dispensing fee and newspaper articles ("EDITORIAL: Prepare for
a new healthcare battle," 2012; Kahn, 2008a, 2008b, 2010, 2011a, 2011b, 2012; Mngadi,
2005; "Negotiations are the best medicine," 2011; "New pricing model has pharmacists
worried," 2006; "SAMA Medigram : Double dose of good news for dispensing doctors ",
2011). Pretorius (2011), performed an investigation in South Africa on the impact that the
implementation of the SEP would have on pharmaceuticals (Pretorius, 2011). Similar
research to investigate the profitability of pharmacies in South Africa appears not to have
been performed. Thus this investigation fills a gap in the literature by investigating
whether such factors exist. Pretorius (2011) only considered the selling price variable
particularly with regard to ethical medicine and some of the indirect factors. This study
intends to fill a gap in the retailing literature by determining whether the principles of
retailing exist in the pharmaceutical industry in South Africa.
Similar research has been performed in Iran where the pharmacies were considered to be
making extraordinary profits and profitability factors relating to dispensing fees and
specific non-medical items were considered (Keshavarz et al., 2012). In rural Kyrgyzstan
similar cost accounting research was performed to determine the mark-up level required
for pharmacies to recoup costs and make minimal profits to ensure that the pharmacy
remained financially viable. They considered factors affecting pharmacy costs and
revenue (Waning et al., 2010). In Delhi, India research also attempted to fill a gap in the
retail literature by determining which discretionary and non-discretionary variables had
an impact on the performance of pharmacy stores (Patel & Pande, 2012). It also built on
prior research performed in the retail industry which investigated an appropriate method
for assessing store performance models. This research focused on the supermarket-type
store as the theoretical model for a store (Pauler, Trivedi, & Gauri, 2009).
17
1.4 Delimitations and limitations
Delimitations
This research will consider retail pharmacies that are situated in shopping centres as well
as the corner stores. It deals with pharmacies that form part of a retail chain group as well
as the individual store owner. This research will not consider whether operating as a retail
chain has advantages above that of the individual owner. However, it may need to
consider whether retail chains have some form of competitive advantage. Specific
variables have been selected for testing and are considered to be factors. It is possible that
there are other factors outside of the in scope factors which may affect the profitability of
pharmacies. Further, there are a number of research techniques and methodologies that
could be used to validate the effect of a factor on profitability; however, specific methods
were applied as described in chapter 3.
Limitations
This study has only been performed in Johannesburg. This will influence the results in
that it cannot take into account the costs faced by the pharmacists in the more rural parts
of the country. The instrument used in performing the research was a questionnaire
which, based on its nature, has inherent limitations when performing research.
The turnover of the pharmacy is utilised as a proxy for profit. The reason for this is due to
the fact that there are potentially other factors and costs which may impact the profit of
the pharmacy which have not been accounted for.
1.5 Definition of terms
18
Single exit price (SEP): This is the price at which the product exits the factory.
Thus it is the cost that the doctor or pharmacist pays to purchase the drug from
the manufacturer.
Over the counter (OTC): These are drugs that can be purchased without a
prescription and do not have to be dispensed by a pharmacist. These are
Schedule 0 and include medicines such as Aspirin or Panado.
Consumer Price Index: This is the amount by which the prices, faced by consumers,
increase on a yearly basis.
DOH: The Department of Health. The organisation that is responsible for healthcare
policy and legislation in South Africa.
Manufacturing pharmacy: This is defined in section 16 of the Regulation GNR. 1158
– Except as provided for in the Medicines Act, only the following services
pertaining to the scope of practice of a pharmacist, may be provided in a
manufacturing pharmacy—
a) the manufacturing of any medicine or scheduled substance;
b) the purchasing, acquiring, keeping, possessing, using, supplying or selling of any
medicine or scheduled substance;
c) the furnishing of information and advice to any person with regard to medicine
manufactured by him, her or it;
d) the repackaging of medicine in accordance with the Medicines Act;
e) the initiation and conducting of pharmaceutical research and development;
Wholesale pharmacy: This definition is defined in section 17 of the regulation
GNR. 1158 - Except as provided for in the Medicines Act, only the following
services pertaining to the scope of practice of a pharmacist, may be provided
in a wholesale pharmacy—
19
a) the wholesale distribution of any medicine or scheduled substance through the
purchasing, acquiring, keeping, possessing, using, supplying or selling of any
medicine or scheduled substance;
b) the furnishing of information and advice to any person with regard to medicine
distributed by him, her or it;
Community or institutional pharmacy:
This definition is included in section 18 of the regulation GNR. 1158 – Except
as provided for in the Medicines Act, the following services pertaining to the
scope of practice of a pharmacist may be provided in a community or
institutional pharmacy—
a) the provision of pharmaceutical care by taking responsibility for the patient’s
medicine related needs and being accountable for meeting these needs, which
shall include but not be limited to the following functions:
i) evaluation of a patient’s medicine related needs by determining the indication,
safety and effectiveness of the therapy;
ii) dispensing of any medicine or scheduled substance on the prescription of an
authorised prescriber;
iii) furnishing of information and advice to any person with regard to medicine;
iv) provision of pharmacist initiated therapy;
b) the compounding, manipulation or preparation of any medicine or scheduled
substance;
c) the promotion of public health in accordance with guidelines and standards as
determined by a competent authority which includes but shall not be limited to:
i) the provision of immunisation, mother and childcare, blood pressure
monitoring; health education; blood-glucose monitoring; screening tests for
pregnancy; family planning; cholesterol screening tests; HIV screening tests;
urine analysis; and visiometric and audiometric screening tests;
Consultant pharmacy: This definition is defined in section 19 of the regulation
GNR. 1158 – Only the following services pertaining to the scope of practice
of a pharmacist may be provided in a consultant pharmacy—

20
a) the provision of pharmaceutical care with the goal of improving compliance with
medicine therapy and which shall be limited to the following functions:
i) evaluation of a patient’s medicine regimen with respect to the indications,
safety and effectiveness of therapy;
ii) the provision of information and advice to any person with regard to the use of
medicine;
21
2 Literature Review
2.1 Introduction
This chapter will attempt to review the necessary literature in order to further develop an
understanding of the factors that appear to affect the profitability of pharmacies. The
literature helps to paint a complete picture of the research question (Pretorius, 2011). One
of the purposes of this chapter is to validate the theories presented in chapter 1. Thus, this
chapter will analyse each variable discussed above and consider whether a plausible
relationship exists between the variable and profit. The selection of references will
consider local and international studies in order to develop a review which is of a high
standard (Pretorius, 2011). The literature review will discuss the initial background
relating to the industry in general, the development of a model for performance and
finally consider each of the factors identified in the research problem to determine
whether past research supports a plausible relationship or, where a plausible relationship
is proved not to exist, to understand why and consider this in the current research.
The factors that will be discussed are as follows, average inventory holding, product mix,
floor space and location. Indirect factors, such as roadside accessibility, pedestrian
accessibility, number of pharmacies in the area, number of doctors in the area,
advertising, number of customers, other services, customer loyalty, relationships with
doctors, discounts, formation of buyer groups, information technology, purchasing
patterns and prescribing patterns will be discussed in conjunction with the four main
variables.
22
2.2 Background discussion
Since 1994 there have been a number of legislature changes. The main focus has been to
provide basic services to the population in general. The pharmaceutical industry has been
no exception to this requirement. The Medicines and Related Substances Act No. 101 of
1965 was promulgated to provide medicines to the public at affordable prices. It is clear
from this that the Department of Health is suggesting that it is trying to provide health
care to the nation at large. As discussed in chapter 1, the medical supply chain is broken
up into numerous players. This supply chain is no different to other countries around the
world, as was demonstrated by the case of an individual pharmaceutical company in
Japan (Hamuro, Katoh, Matsuda, & Yada, 1998). A similar situation exists in the United
States of America, where a qualitative literature review of the retail pharmaceutical
industry was performed in order to identify gaps for future research (Brooks, Doucette,
Wan, & Klepser, 2008).
As a developing country it is usually viable to replicate policies of other developed and,
in certain instances, developing countries. Often adjustments are needed in terms of the
policy to fit the local socioeconomic environment of the country. For instance, in terms of
the SEP, a judgement was passed relating to an international benchmarking exercise
which is to be performed in order to determine the appropriate price ("CCT 59/04,"
2004). Accordingly, a recent study considered the pricing regulations of developed
countries, including Germany, United States of America, Canada, Australia, the United
Kingdom, New Zealand, Belgium and the Netherlands. It is important to note that
Germany, Canada in certain instances of patented medication, Australia, New Zealand,
Belgium and the Netherlands make use of pricing regulations for medicines (Pretorius,
2011). Only in the United States is there free market competition, which was suggested as
one of the reasons why medication is not available to the public at large. It was also noted
that the medicine prices in the United States of America are 72% higher than Canada
(Pretorius, 2011). The same research article investigated the pricing regulations in
developing countries, including India, Brazil, Russia, Egypt, Israel, Mexico and Greece.
Each of these countries make use of different pricing measures to keep medical costs low
23
(Pretorius, 2011). It should moreover be noted that of these sample countries, Canada,
Belgium, Netherlands, New Zealand and Greece, make use of international benchmarking
techniques to price their medicines (Pretorius, 2011). By contrast, Iran makes use of
dispensing fee regulations to limit the amount that a pharmacist can charge for medicine
(Keshavarz et al., 2012).
It is clear that the industry in South Africa and the changes that are being carried out
relating to policy are no different from the rest of the world. As a result, one needs to
develop a model in which to survive in terms of these regulations which will most likely
be implemented in due course. To survive in the market an entity needs to be profitable.
According to Pioch and Schmidt (2001), unprofitability over a period of time could lead
to outlet closure. Furthermore, downward pressures on prices to levels that do not provide
incentives for pharmacy ownership actually threaten the distribution of medicine due to
the closure of branches (Waning et al., 2010).
2.3 Development of a model for performance
As a new business owner it would be very useful if, prior to a single cent being spent, it
would be possible to determine whether ones business would be successful or not. Often
this is not possible owing to both the macroeconomic and the microeconomic
environment in which the entity needs to operate. Thus, the owner of the business is
required to take a risk with the capital he invests into the business. However, with this
risk there is a related benefit that can be obtained.
A great deal of literature exists in the fields of marketing, commerce, retailing and
consumer business on the determination of factors that promote competitive advantage
and the importance of a particular factor on the profit of a company (Dubelaar, Chow, &
Larson, 2001; Gijsbrechts, Campo, & Goossens, 2003; C. Guy, 1995; Patel & Pande,
2012; Pauler et al., 2009; Swoboda, Berg, Schramm-Klein, & Foscht, 2013; Waning et
al., 2010). Competitive advantage, a term coined by Michael Porter, requires the
implementation of a generic strategy and this should result in better than average market
24
returns (Akan, Allen, Helms, & Spralls, 2006). It is clear from this research that there is
some degree of interest in determining the factors, strategies and microeconomic
conditions that exist that will allow an entity to be successful.
It has been suggested in the literature that pricing is the only factor that influences the
marketing mix. See Lovelock in 1996, Marn and Rosiello in 1992 and Kotler and Keller
in 2006 (Avlonitis & Indounas, 2004; Pretorius, 2011) in this regard. This suggests that,
in order for an entity to be profitable, merely controlling price will have an impact on its
performance. This is in contrast to the research presented in the previous paragraph.
Further if this were the case, pharmacies in South Africa and other parts of the world
where pricing regulations exist would have no control over their profitability, which
would then suggest that there would be an equilibrium number of players in the market,
otherwise the number of players in the market would continue increasing indefinitely
which would not be possible. Thus, the equilibrium number of players will exist at the
point where all players make zero profit under the fixed pricing regime.
As a result, this paper intends to return to the “grass roots” definition of profit and to
develop a model in order to identify factors which have previously been considered
separately in retailing, commerce and marketing research. This is similar to the work
performed in rural Kyrgyzstan where basic cost-accounting measures were used to
determine an appropriate mark-up on cost for medicines (Waning et al., 2010). This basic
definition of profit is income less expenses.
In the development of this model it is essential to hold the macroeconomic environment
as constant. The reason for this is that no player in the retail pharmaceutical industry can
affect the macroeconomic environment. The macroeconomic environment refers to the
CPI, the interest rate environment, global exchange rates and the global economy relating
to trade.
The microeconomic environment is considered for the sample and population which is
identified in chapter 3. The microeconomic environment includes the region in which a
25
store chooses to locate itself, the competition in that environment and the pricing
regulations within South Africa.
In the development of this model, the model does not intend to produce a value or range
of values that should be used as the dispensing fee or mark-up by the DOH. Accordingly,
this model is intended to determine whether individual factors or a combination of factors
lead to better store performance than another combination of factors. Therefore the model
assumes that the selling price is a constant resulting from the regulations implemented by
government ("New pricing model has pharmacists worried," 2006).
2.4 Factors affecting the profitability of pharmacies
The rest of this chapter intends to analyse the factors identified in chapter 1 and to
determine whether the theoretical definition of profit is grounded in research theory. To
observe instances where it is plausible and where it has been identified not to be
plausible, as well as to understand the circumstances of this and whether it applies to the
local pharmaceutical industry, consequently determining whether further investigation is
required.
Pharmacies have to some extent lost their identification as a professional institution
offering advice. Although pharmacists are medicine experts they are often seen as the
final step in the supply chain and do not utilise their knowledge and training to form an
integral part of the supply chain (Harrison et al., 2012). The role of the pharmacist is
highlighted by the Pharmaceutical Society of South Africa, which stated in the Health
Care 2000 report that a pharmacist’s main income should be derived from providing
professional services rather than trading in medicine (Bruin, 1990). Over time, however,
the lines between professionalism and a firm that is selling goods and trying to make a
profit have become blurred. The question has been asked as to whether or not pharmacists
are acting as professionals or as shopkeepers (WIlliams, 2007). In reality, pharmacists
often have to carry out a dual role. This role portrays them as health care professionals
and business owners (Schmidt & Pioch, 2001). However, there has been a shift in their
26
role over time from providing pharmaceutical care to service-oriented business. One
important task of such a business is to manage its front end or retail store better (Patel &
Pande, 2012).
2.4.1 Average inventory holding
Economic Order Quantity (EOQ) is a theoretical concept that has formed part of
inventory management literature as early as 1915 (Sarkar, Saren, & Wee, 2013). The
EOQ is a model which suggests that with the constant level of demand for a good there is
an order point which minimises the holding costs and reorder costs associated with that
product and, as a result, maximise the profit (Drury, 2004). For entities that experience
low profitability, or in the case of pharmacies whose profitability is controlled by “price
ceilings” regulated by the government, operating at the lowest possible cost is important
for continued survival. The holding costs include items such as insurance and
warehousing. They also include a cost known as opportunity cost. This cost is not a
physical cash cost that needs to be settled, but rather an economic cost. The opportunity
cost is the cost incurred by the entity by tying up its cash and cash equivalents in
inventory that does not generate a return, rather than placing them in other assets that do
generate a return. The more inventories held by an entity the higher their total costs as
there is a positive relationship between holding inventory and the costs incurred.
The other type of cost associated with inventory is what is known as ordering costs. The
costs that are normally related to ordering costs include costs related to placing the order
and delivery. These costs also include those that may not actually be quantifiable, such as
lost sales resulting from not having the necessary stock on hand. The two costs must be
offset until the optimal balance is achieved. At this point total costs will be the lowest.
This is known as the economic order quantity. Owing to the uncertainty of demand
during the lead time, that is, the time between the actual order and the delivery of the
stock, entities usually hold safety stocks to ensure that they do not lose sales. Extensive
research to relax the original assumptions have been performed (Alfares, 2007; Min,
1992; Pando, Garcia-Laguna, San-Jose, & Sicilla, 2012; Sarkar et al., 2013). This
27
research paper does not intend to build on this body of literature but rather to use the
theory as the existence of a plausible relationship of average stock holding with profit.
The relationship appears plausible because the cost of goods sold forms part of the profit
equation and, thus, a reduction in these costs will result in an increase in the profit
function.
As the pharmaceutical industry has become more deregulated, the pharmacist has had to
focus on remaining competitive. In this regard, it has been suggested that inventory
management is key to retail financial success. Controlling the inventory of an entity
efficiently requires an understanding of the number of products, the size of the store and
the operating hours of the entity (Dubelaar et al., 2001). In a competitive industry, such as
the retail pharmaceutical industry, if a pharmacy does not have the appropriate stock
available customers will simply go to another pharmacy. The owner of the store thus
needs to make decisions relating to how much safety stock he should maintain and how
much stock to order, as well as the lead time relating to delivery of this stock (Dubelaar et
al., 2001) versus the demand for the stock.
2.4.1.1 Information technology
In 1997, Coopers and Lybrand stated that a key element of running a grocery business
was sales forecasting and the statistical management of safety stocks (Dubelaar et al.,
2001). As has been suggested in the section on the background to the industry, the
pharmacy industry is moving away from the pharmacist offering advice, to rather
positioning itself as a retailer and supplier of goods. As a result, the pharmacy is now
becoming more similar to a grocery store. Therefore, proper inventory management relies
on accurate data of sales and inventory (Dubelaar et al., 2001).
Further, this data can be used to determine trends. Accordingly, medicines that
complement each other in terms of sales volumes can be identified; for example, the sale
of vitamin c and nasal anti-decongestants at the same time during winter could assist in
ensuring that the correct stock is available during the times it is needed. This mining of
28
pharmacy data was used to great effect by Pharma, a drug chain store in Japan. This
organisation discovered a number of relationships specific to its chain and customers,
thus ensuring that the correct stock was carried in their pharmacies (Hamuro et al., 1998).
Another example was the sale of small disposable heaters. It was assumed that these
would only be purchased in winter and no items were manufactured in summer.
However, one store still made sales during summer. On further analysis it was identified
that the sale of this item was linked to the sale of drugs for rheumatism, and thus the sale
of these heaters was linked to patients who needed this medicine. As a result, the
manufacturing patterns were changed to provide these items during summer (Hamuro et
al., 1998). Pharmacists may actually be able to use information technology to help cut
costs (Akan, Allen, Helms & Spralls III, 2006). This can be done by utilising information
management software to develop operational efficiencies. It would appear that
information technology, if correctly applied, can provide some degree of benefit in
achieving better management of stock or identification of trends. Thus, it would appear
plausible that information technology is a factor affecting average inventory holding.
2.4.1.2 Prescribing and purchasing patterns
For any patented or branded medication that is produced there is usually a corresponding
generic medicine. A generic medicine is a medicine that has the same active ingredients
in the medicine and is used within in the same therapeutic class as the patented medicine.
The main difference is that the price of a generic medicine is considerably less than the
branded or patented medicine. In order to make medication more affordable to the
general public, a pharmacist is required in terms of section 22F of the Medicines and
Related Substances Act No. 101 of 1965 to offer the customer a generic substitute when
the doctor has prescribed the branded or patented medication. This is similar to other
countries in the world such as Germany (Pioch & Schmidt, 2001). Similarly, although
generic substitution in South Africa is a legal requirement, the pharmacist may guide the
customer to a certain medication for reasons of profit margins or stock levels, as is the
case in Great Britain and India (Kennedy & Moody, 2000; Keshavarz et al., 2012).
29
To hold all medicines, both generic and branded, would have a major impact on the
holding costs of pharmacies. This would, in turn, have an impact on the average
inventory holding of the pharmacy. Thus, as pharmacies rely on doctors to provide
medicine, it would be useful to determine whether these doctors have particular
prescribing patterns or customers have particular purchasing patterns, as this may
generate some degree of competitive advantage. German pharmacies have strong
relationships with the doctors in their regions in order to aid stock control. They also
carry stock to service their regular customers (Pioch & Schmidt, 2001). Thus, it would
appear reasonable to assume that a relationship exists between the prescribing and
purchasing patterns of doctors and patients and the average stock holding.
A significant positive relationship between inventory and sales has been identified
(Dubelaar et al., 2001). Since the introduction of SEP in South Africa the number of
inventory days for pharmacies has been reduced in order to survive (Pretorius, 2011). As
a result it is possible to develop the following hypotheses:
H1a: Does the average inventory holding affect the profitability of pharmacies
(profit = f (ave. inventory holding))?
H1b: Does the use information technology affect the average inventory
holding (average inventory holding = f (information technology))?
H1c: Do prescribing patterns and purchasing patterns affect the average
inventory holding (average inventory holding = f (purchasing or prescribing
patterns))?
2.4.2 Product mix
As shown in the formula in chapter 1, total sales is equal to the sales price times the
number of items sold. Thus, to increase the number of items two broad strategies can be
applied: either increase the number of items sold per customer or increase the number of
customers that enter the store (known as footfalls). Both of these strategies have their
30
place in the marketing and retailing literature and neither factor exists exclusive of the
other. The second principle would require other external measures to increase the number
of customers into the store such as location or size of the store, which will be discussed
later in this chapter.
In terms of the first principle, the idea would be to economise or cut down on the time the
customer intends to spend on shopping. Thus, in order to ensure that a customer has a one
stop shopping location, a more varied array of items must be sold (Messinger &
Narasimhan, 1997). Often having other services within a retail store, such as an
Automated Teller Machine, in-store bakery or pharmacy has been seen to improve store
performance through product differentiation (Pauler et al., 2009). This can be seen in
stores such as Pick ‘n Pay and Woolworths, which sell food and clothing in the same
store. However, this principle is not surprising since a differentiation strategy is one of
Porter’s generic strategies for obtaining competitive advantage (Akan et al., 2006). It is
suggested that the greater the product diversification the more likely a firm is to earn a
profit (Dubelaar et al., 2001). However, the products must be related (Palepu, 1985).
The question would thus remain whether pharmacies could obtain some form of benefit if
they were to implement a differentiation strategy. A differentiation strategy for a
pharmacy would be to offer a mix of different products and services. In South Africa this
is legally permissible, although it is not the case in countries like Germany where only
items that are medical in nature can be sold (Pioch & Schmidt, 2001). The product mix
available to pharmacies in South Africa allows these pharmacies to sell ethical medicine,
which is all medicine that is required to be dispensed by a pharmacist, over-the-counter
medicine, that is, Schedule 0 drugs which can be sold in any open store (Bruin, 1990;
"Medicines and Related Substances Act," 1965; Pioch & Schmidt, 2001, 2004; WIlliams,
2007), as well as medicine not requiring a script, that is, Schedule 1, 2 and 3 medicine
and, finally, non-medical products, such as cosmetics, toiletries, food and any other good.
Owing to the protection provided to pharmacies for the dispensing of certain medication
it would appear that the pharmacy has become more reliant on the number of
prescriptions that it fills in a day (Pioch & Schmidt, 2001). Despite this contradictory
31
evidence, it appears that there is a positive plausible relationship with non-medical items
sold and profit. The reason for this is that a pharmacist is not restricted in the products it
can sell. Thus, an increased number of items can be sold due to increased variety leading
to increased sales. The reason for the contradictory evidence is as a result of a different
industry structure, where the pharmacy cannot stock all items, only those that are medical
in nature.
To further build on the theory of product mix, the variables being considered in the
equation include the number of items sold (n) and the cost of goods sold (COS). The
reason for this is that the number of different items available directly affects the product
mix. The cost of goods also affects the product mix due to the availability of products, the
potential profit margin that can be earned and the costs associated with the purchase of
that product.
To alter the number of products sold the equation in chapter 1 suggests that this could be
done through a number of different measures, including advertising, number of
customers, other services, customer loyalty, and relationships with doctors. The number
of customers is influenced by the store’s location which is discussed later in this chapter.
The development of the following hypothesis is therefore possible:
H2a: Does the sale of non-medical items affect the profitability of pharmacies
(profit = f (non-medical items))?
2.4.2.1 Advertising
Advertising helps to control the creation of value and give direction. A store can also
create a personality or brand image in the minds of a customer through its physical
environment and aura (Meenaghan, 1995; Pauler et al., 2009). Marketing research has
found that a positive relationship exists between a promotional item and its corresponding
sales during a specific time period (Gijsbrechts et al., 2003). In today’s competitive
environment it remains crucial for a retail store to advertise in order to increase the
32
number of customers that come into the store. It thus appears plausible that the number of
items sold is dependent on the whether a product is advertised or not.
H2b: Does advertising affect the number of items sold (number of items sold =
f (advertising))?
2.4.2.2 Other services
Owing to the regulations that control the industry, in a retail pharmaceutical environment
there are very few ways in which a pharmacy can compete differently to its competitors.
Depending on the model used by the pharmacy, one method of competing effectively is
to provide a variety of useful, but different, services to its customers.
In Germany the other products and services that a pharmacist is permitted to offer his
customers must have medicinal qualities or be used for health and body care (Pioch &
Schmidt, 2001). A home delivery service is also often offered to an entity’s clients (Pioch
& Schmidt, 2004). It appears plausible that offering different services has a relationship
with the number of items sold.
H2c: Do other services affect the number of items sold (number of items sold
= f (other services))?
2.4.2.3 Customer loyalty
For a customer to remain loyal to a particular brand, store or product, the customer needs
to believe that he/she is receiving a superior service or quality product (Wong & Sohal,
2003). According to Reichheld in1993, customer loyalty is essential for continued
survival (Wong & Sohal, 2003). Other areas of the pharmaceutical industry appear to
develop this level of customer loyalty. For instance, patients often visit the same doctor
throughout their lives and as such the pharmacy usually builds up a client base that is
33
fairly regular (Pioch & Schmidt, 2001, 2004). However, this was proved to the contrary
in Germany as it would appear customers who could not get a specific product would
switch pharmacies and therefore are not loyal (Pioch & Schmidt, 2001).
If customer loyalty could be achieved by a pharmacy, it would result in a fixed portion of
the market share. Fixing a portion of the market share is a strong technique in competitive
environments between suppliers as this would suggest that a particular supplier’s supply
curve would be fairly inelastic and, as a result, changes in demand and the price of
medicines would have minimal effect on the pharmacy’s profitability. It is interesting to
note that the pricing objectives of Greek service firms are to focus on maintaining their
existing client base (Avlonitis & Indounas, 2004). Pretorius (2011) proved that a major
change in the business strategy of pharmacies was to focus on customer retention and this
was similar for independent pharmacies as well as corporate groups (Pretorius, 2011). It
thus appears plausible that a relationship exists between customer loyalty and the number
of items sold.
H2d: Does customer loyalty affect the number of items sold (number of items
sold = f (customer loyalty))?
Another element relating to product mix is the cost price of the stock that is sold. If there
are stock items for which a discount can be obtained, the difference between price and
cost is greater thus resulting in larger profit margins being obtained. Further, one of
Porter’s generic strategies relating to cost leadership (Akan et al., 2006) can be
implemented as the pharmacy can offer the product at a lower cost than its competitors.
This will provide some degree of competitive advantage for the pharmacy. In line with
the EOQ model, cost minimisation is important to maximise profit. Two elements of
these costs include logistics cost and physical cost.
34
2.4.2.4 Discounts and buyer groups
Discounts are a common practice within in a commercial environment. Customers form
relationships with suppliers and over time these suppliers will provide them with a
discount. Customers also tend to obtain volume-based discounts when they reach certain
order thresholds. In Germany in order to achieve these discounts buyer groups were
established. Such groups also allowed pharmacies to obtain discounts from suppliers as
they purchase large quantities of drugs (Pioch & Schmidt, 2004). However, legislation in
South Africa now prevents such a practice as, according to section 18A read in
conjunction with section 22G(3)(a) of the Medical and Related Substances Act No. 101
of 1965, manufacturers are required to sell medicines at the SEP and no discounts or
rebates can be achieved. This is the case for ethical medicine and thus it would appear
that for non-medical items and certain OTCs such rebates are still permissible. Although
discounts are permissible, each individual pharmacy will be given the same discount. As
a result, it would appear that no plausible relationship exists in the South African
pharmacy industry to reduce the costs of goods sold through the use of volume discounts.
However, in the South African pharmacy industry distinctive groups have formed. These
include the likes of Dis-chem, Clicks, Netcare and Link. These could represent buyer
groups and as a result reduce their logistical fees with a central head office purchasing the
stock thus reducing the costs of distribution and time spent on ordering. This approach is
seen globally with the likes of Pharma in Japan (Hamuro et al., 1998), in Kyrgyzstan
(Waning et al., 2010) and in ordinary retailing in the United States of America with the
likes of Wal-Mart, Target and Kmart where these stores have positioned themselves close
to the distribution centre to reduce costs (Zhu & Singh, 2009). Further, loyalty can be
achieved through a retail brand (Swoboda et al., 2013). As a result, it would appear that a
plausible relationship exists between buyer groups and the cost of goods sold.
H2e: Do buyer groups affect the number of items sold (number of items sold =
f (buyer groups))?
35
2.4.3 Floor space
A pharmacy is defined by the physical space that it covers. As part of the Pharmacy
Council’s responsibility, as defined in section 35A(b)(ii) of the Pharmacy Act No. 53 of
1974, the council is required to publish what is defined as good pharmacy practice. In this
manual specific mention is made of the size of the dispensary of the pharmacy (Council,
2010). However, the actual size of the dispensary is not mentioned.
In the retailing literature the size of the store is often seen as a driver of the cost of the
rental paid for the space. As such a store is defined by the total sales surface (Verhetsel,
2005). There are also inherent costs required to establish a new store and massive capital
investment is required which is linked to the size of the store (C. Guy, 1995; Keshavarz et
al., 2012; Patel & Pande, 2012). As an outcome of this a pharmacy cannot increase
indefinitely as there would be an optimal size where the pharmacy would maximise its
revenue. Size definitely matters in retailing, as is shown in the United States of America,
where the likes of Wal-Mart, Kmart and Target develop massive superstores as well as
smaller regional stores within the same catchment area. The size differential aims to
attract a wider catchment area of customers because, as was shown with the larger stores,
customers will tend to travel greater distances to these stores (C. Guy, 1995).
In 1997, Sinigagalia (Verhetsel, 2005) proved that the size of the store affects width,
depth and quality of the services provided. In 1999 Orenstein (Dubelaar et al., 2001) took
the concept of size or rather scarce shelf and examined the ability of stores to maximise
this space using inventory management systems. One of the variables used to define the
atmosphere of a store is the size of its sales area, besides other factors such as number of
aisles (Pauler et al., 2009). However, this literature is focused mostly on supermarkets
and hypermarkets. It would then be appropriate to determine whether a pharmacy’s sales
would also be affected by the same physical attributes. A pharmacy would be restricted
by the same physical bounds and any retail development. Thus it can be said that size
appears to have an impact on sales in a pharmacy. In the retail pharmacies in New Delhi,
India, it was identified that store size is a significant factor in driving store efficiency
(Patel & Pande, 2012). In this study only the overall size of the pharmacy was considered
36
and no differentiation was made between the two distinct areas that exist within a
pharmacy in South Africa, namely, the dispensary and the rest of the store area. Further
insights into the effect of size or rather floor space on sales should be investigated.
As a result of the above it appears that the following hypotheses can be developed:
H3a: Does the size of the dispensary affect the profitability of pharmacies
(profit = f (size of the dispensary))?
H3b: Does the size of the store affect the profitability of pharmacies (profit = f
(size of the store))?
2.4.4 Location
There is a well-known aphorism in retailing: location, location, location. However the
location variable is complex in nature. Of all the variables presented it is the most
difficult to change in the short term. Further, the location of a store is influenced by a
number of external and market conditions, for instance development or re-development
of the specific area surrounding the store, the type of road accessibility, competitors in
the region and the population density of the area.
As a result, in order to determine whether the location of a pharmacy affects its
profitability each of the factors should be considered individually to determine whether
plausible relationships exist between each component and the profitability of a store.
These factors include roadside accessibility, pedestrian accessibility, number of
competitors and number of doctors. Finally, the components should be combined to
develop a location index in order to generate a complex variable against which
profitability could be compared.
According to Patel (2012), location is not a variable that drives pharmacy store
efficiency. However, this is firstly contrary to a large amount of retailing literature on the
location of a store and its profitability. Secondly, the variable for location in Patel’s study
37
only considered one of the components presented above, number of competitors in the
area. Again the outcomes of that study are contrary to other studies that considered
competition on profitability (Gonzalez-Benito, 2005; C. Guy, 1995; Zhu & Singh, 2009).
Lastly, the study identified footfalls as a driver of efficiency for pharmacy store
performance. Footfalls, or rather the number of customers, are influenced by competition
because if there are a number of options for a consumer to choose from the consumer will
easily switch to another store in the region. Thus location is indirectly related to the
footfalls. A literature review of each component is required to develop the plausibility of
the relationship.
2.4.4.1 Roadside accessibility
Roadside accessibility is defined as how easy is it to reach the store (Swoboda et al.,
2013). Customers are prepared to economise on their use of time. This means that
customers will search for the lowest prices. Thus if a store is easy to access the customer
will be able to use less time to find the lowest price. However, the time spent searching
for the lowest price is referred to as search costs. It is for this reason that particular stores
tend to distribute themselves based on a particular benefit that they can achieve. For
instance, petrol stations are often located on the side of a highway or main road to capture
the flow of traffic (Sadahiro, 2000). Further if a store is dependent on footfalls (Patel &
Pande, 2012), then being positioned in relation to main roads and highways allows for
greater amounts of traffic to pass near the store thus increasing the catchment of potential
customers. In 1963 Berry suggested that retail and business areas in Chicago positioned
themselves around highways (C. M. Guy, 1998). Further, closeness to a national road was
found to be statistically significant when related to customer loyalty (Swoboda et al.,
2013). Thus, it appears plausible that roadside accessibility is a component of location.
Hence the development of the following hypothesis:
H4a: Does roadside accessibility affect the profitability of pharmacies (profit
= f (roadside accessibility))?
38
2.4.4.2 Pedestrian accessibility
Pedestrian accessibility refers to the different types of shopping location that exist. These
include shopping malls, shopping centres and retail outlets. In geographic planning
research there tends to be a number of different definitions to define the different
shopping locations. These definitions are based on the size of the shopping area, the type
of stores that exist, catchment area and physical form (C. M. Guy, 1998). As there are a
number of methodological issues related to the types of shopping centre that exist, the
definition relating to the physical form was selected as a convenient measure to determine
pedestrian accessibility. The physical form of the shopping centre is defined by its
appearance, tenant mix and size (C. M. Guy, 1998). This assessment also matches the
criteria which consumers often use in identifying shopping destinations (C. M. Guy,
1998). Owing to the latter statement, it would be most useful to use this measure in order
to determine pedestrian accessibility. Guy (1998) defines the following different types of
shopping development: the focused centre, the retail park, the shopping mall, the regional
shopping centre, the factory outlet centre and the speciality centre. Only the definitions
that are applicable to the current research problem have been included. These include the
focused centre, the shopping mall and the speciality centre.
The focused centre is usually built to serve the surrounding residential area. It contains a
supermarket and other small shops. This can also be referred to as a shopping complex,
local centre or neighbourhood centre. The shopping mall is a single building that is
usually very large and contains anchor tenants. They also have other features such as
entertainment or a food court. The speciality store is usually situated on the side of the
road and tend to specialise in one type of good (C. M. Guy, 1998).
Although the speciality store is not usually the nature of a pharmaceutical business, it
appropriately completes the contrasting establishments selected in solving this location
hypothesis. Owing to the different store locations that exist and the different types of
store that would cluster together in the different retailing establishments, it would seem
that stores are influenced by the type of establishment in which they operate. As a result,
39
it appears that a plausible relationship exists between pedestrian accessibility and
profitability resulting in the following hypothesis.
H4b: Does pedestrian accessibility affect the profitability of pharmacies
(profit = f (pedestrian accessibility))?
2.4.4.3 Competition
In unregulated environments, competition results in the lowest possible price being paid
by the consumer. This is because suppliers will drive down the price in an attempt to take
market share away from their competitor. This is known as free-market competition. The
United States of America makes use of such forces within its pharmaceutical industry
(Pretorius, 2011). However, in most countries there is extensive regulation around selling
price maintenance. Thus competition in these environments can be detrimental to the
survival of the store location.
The question arises is to what is defined as competition for a pharmacy. The simple
answer is a pharmacy that is in close proximity to the pharmacy. The issue then becomes
how to define how close another store needs to be in order to influence the focal store.
This can be determined by defining discrete distance bands (Zhu & Singh, 2009) or
assuming that the areas of competition overlap (Pauler et al., 2009). This is not the aim of
this research paper, however, it is necessary to determine whether competition has a
negative effect on store performance. In all cases it was identified that competition within
the region has a negative impact on sales and, as a result, profitability ((Gonzalez-Benito,
2005; Pauler et al., 2009; Verhetsel, 2005; Zhu & Singh, 2009). Thus the next hypothesis
appears to have a plausible relationship within the literature on which its existence is
based. It appears that competition has a negative impact on store profitability.
H4c: Does the number of other pharmacies in the area affect the profitability
of pharmacies (profit = f (number of other pharmacies in the area))?
40
2.4.4.4 Number of doctors
Footfalls, or the number of customers, has been identified as a key driver of efficiency in
pharmacies in New Delhi, India (Patel & Pande, 2012). From this the next hypothesis is
developed. As most of the medicine in South Africa can only be supplied to a patient by
an authorised prescriber or doctor ("Medicines and Related Substances Act," 1965), it
would suggest that in areas with a high density of doctors there would be increased
profitability. This seems logical when you consider the number of doctors at a hospital
and the pharmacy at the same hospital. After their doctor’s visit most patients collect their
script at that pharmacy. Further, if footfalls are a key driver of efficiency, being in an area
surrounded by doctors is a way in which a pharmacy could increase its footfalls. The
reason for this is that patients will go to the store closest to their doctor. Thus there would
be a difference in the level of travel experienced if a pharmacy were close to a number of
pharmacies than those that are not close. As a result, we develop the following
relationship:
H4d: Does the number of doctors in the area affect the profitability of
pharmacies (profit = f (number of doctors in the area))?
From the analysis of the literature that exists on the location of a store it appears that
there is sufficient evidence to suggest that a number of locational factors affect the
profitability of the retail store. However, each of these components is not mutually
exclusive and a particular location is a function of each of these. As a result the final
hypothesis needs to be developed as follows:
H4e: Does the location index affect the profitability of pharmacies (profit = f
(location index))?
41
2.5 Conclusion of literature review
Based on the review of the current literature it appears that a number of valid hypotheses
exist that supports the profit function that was developed in chapter 1. It is evident that
there is increased global focus on assessing the performance of pharmacies in order to
trim their profits to ensure that patients receive medicines at the lowest cost possible. It is
important to note that it is possible that there are other variables or factors not considered
in the current research. However, the key factors of research interest relate to the average
inventory holding, product mix, floor space and location.
42
3 Research Methodology
3.1 Introduction
This chapter will describe the purpose of developing an appropriate research
methodology and will consider the research design to determine how the data links to the
research questions proposed. Subsequently, a description of the population will be
provided together with the associated sample and the sampling technique used. The
process of data collection will then be considered as well as the development of the
research instrument. The methods applied to analyse the variables and test the research
hypotheses will be provided. Finally, the validity and reliability of the testing instrument
will be considered.
3.2 Research methodology
Research methodology normally forms part of three broad categories: quantitative
research, qualitative research and mixed methods approach. Quantitative research is a
method that is used when the researcher intends to quantify a specific phenomenon and
measure specific values or variables. Qualitative research is used in research where the
problem cannot be easily reduced to numerical values and the item being tested is
complex in nature (Leedy & Ormrod, 2010). In contrast, a mixed methods approach
makes use of elements of both of these broad categories to develop a complete picture of
a situation where it is possible to decompose the research question into numerical
elements and qualitative elements.
This research paper intends to make use of a quantitative research approach to analyse the
research hypotheses that have been developed. It is also post-positivist in nature. The
reason for this is that the research method makes use of a scientific approach to explain
43
phenomena, but does not suggest that the variables are the only variables that exist to
explain the research outcomes (Wagner, Kawulich, & Garner, 2012). Further, as will be
shown as part of the research design, the data collected is objective in nature.
Although true objectivity cannot be obtained owing to the design of the research
instrument, it does approach a level of objectivity. The reason for this is that the data is
based on “hard” facts at the time at which the data is collected and the answering of the
questions is not dependent on the opinion of the person completing the research
instrument. The research hypotheses were developed from theory and have been
explicitly defined so that the research can be re-performed and verified (Wagner et al.,
2012).
Post-positivist quantitative research has certain inherent limitations. One of the main
issues related to this study is that, where plausible relationships are not found to exist,
there is no mechanism to determine with some degree of insight into the industry why
this would be the case. This would leave unanswered questions which could be areas for
future research.
3.3 Research design
In order to perform the research a method needs to be constructed in order to collect the
appropriate data. This data must then be linked appropriately to the research question.
This will allow for conclusions to be drawn (Rowley, 2002).
An adequate understanding of one’s research design is important for answering the
research questions posed. Firstly, it allows the researcher to understand whether the
design is adequate for addressing the research questions. Secondly, as with all research
methods, there are inherent limitations to a specific approach which need to be
considered when drawing conclusions on any findings identified. Lastly, each research
design has certain advantages and disadvantages associated with it. This may relate to the
ease of execution, the target group and the availability of literature. The rest of this
44
section attempts to describe the research design method that has been applied. It will look
at the advantages and disadvantages of this design from a theoretical perspective, as well
as in the context of this research paper.
There are a number of different methods that exist under quantitative research. These
include experimental research, grounded theory, action research, case study research and
survey research to name a few (Leedy & Ormrod, 2010). This paper is not a paper on
research design, however, and, as a result, only the research method selected under
quantitative methodology has been explained. The research method used is survey
research. Although survey research is often misunderstood in the literature, this specific
research method is intended to obtain information from a group of people by making use
of a list of questions. Surveys can be conducted using pen-and-paper questionnaires or
face-to-face interviews or can be administered online.
Accordingly, a questionnaire can then be administered to the sample that is willing to
participate in the research. The nature of survey research is such that it takes a snapshot
of the state of a phenomenon at a certain point in time. This snapshot is then used to draw
conclusions and these conclusions are then assumed to represent a longer period of time
(Leedy & Ormrod, 2010). However, it should be noted that such assumptions or
inferences can be dangerous as, owing to the nature of the sample and the time period,
there may have been external factors which were not considered as part of the research
and that might have affected the ability to infer the conclusions to the population or time
period.
A mix of a pen-and-paper approach and face-to-face interviews was used in this research.
The reason for this is that, for pen-and-paper research, a complete listing of the entire
population is usually obtained and the questionnaire is then mailed to the recipient. The
recipient is then able to complete the questionnaire in their own time and there is no place
for the interviewer bias that exists if the questionnaire is administered during a face-to-
face interview. However, the response rates with this type of design are usually low. In a
face-to-face interview, the researcher has better control of the response rate as he or she is
required to visit the participants and then ask all the questions in the questionnaire in the
45
same order for each respondent. There is obviously some degree of bias relating to the
face-to-face interview as the respondent may feel compelled to respond in a particular
way (Wagner et al., 2012).
To try and encapsulate the advantages of each method as well as the limitations relating
to the availability of a complete listing of pharmacists, a pen-and-paper questionnaire was
developed and each questionnaire was handed personally to the responsible pharmacist or
store owner to complete. The questionnaire could be completed while the interviewer
waited or was left at the pharmacy to be completed at a convenient time and follow-up
was performed. The use of this approach was to ensure a better response rate than a
mailed survey while still encouraging unbiased responses, as the interviewer did not
participate in the completion of the questionnaire.
It is important to note that the use of questionnaires in performing this type of research is
not new and quantitative research is often performed using such instruments (Dubelaar et
al., 2001; Eboli & Mazzulla, 2009; Helgesen, Nesset, & Voldsund, 2009; Keshavarz et
al., 2012). In each of these studies data was obtained from a survey that was completed,
in these cases mail surveys. The survey data was then used to determine certain positivist
theory by establishing the existence of cause-and-effect relationships within the data.
Consequently, the research hypotheses developed in chapter 2 represent similar cause-
and-effect relationships and, as a result, the use of survey research would appear to be
appropriate for answering the questions.
3.4 Population
The study is focused on the urban retail pharmacy sector of the South African
pharmaceutical supply chain. Thus, the population would include all of these pharmacies.
As disclosed on the Pharmacy Council website the number of pharmacies across all the
different defined types of pharmacy is 4 582. However, the research questions limit the
research to community pharmacies which account for 3 118 pharmacies across the nine
provinces (Council, 2012). To further define the population, there are different locational
46
characteristics that exist within the different provinces of South Africa; this resulted in a
population of 1 099 community pharmacies in Gauteng, which was defined as the
population for this study.
3.5 Sample and sampling method
A sample represents a subset of the population as it is usually not possible to test the
entire population. The sample should be sufficiently representative of the population so
that inferences can be made to the population (Leedy & Ormrod, 2010). The population
sample focused on community pharmacies in Johannesburg and its surrounding areas,
with Johannesburg forming part of Gauteng province.
Two types of sampling technique exist in practice: probability and non-probability
sampling. This research makes use of non-probability sampling because, owing to the
method of distribution of the questionnaire, it would not have been possible to guarantee
that each element of the population would be included (Huysamen, 1993; Leedy &
Ormrod, 2010). However, a key element of this form of sampling is the removal of any
evidence of bias (Howell, 2004). To address this issue, the questionnaire was handed out
in all the areas surrounding the Johannesburg Central Business District. Using theoretical
compass points, the sample covered the south, east, west and north of Johannesburg. In
addition, the sample selected included both corporate retail pharmacy chain groups like
Dis-chem and Clicks and small independent pharmacists.
Non-probability sampling is further divided into the different methods by means of which
it can be performed. For example, purposive sampling is a method of sampling that is
used when the sample is picked for a particular reason (Leedy & Ormrod, 2010) and there
is often a specific selection criterion (Wagner et al., 2012). The selection criterion for this
sample was that the responsible pharmacist, that is, the person who is responsible for
ensuring compliance with pharmaceutical legislation, or the owner of the pharmacy, was
requested to complete the questionnaire. The reason for this was that they have
47
specialised knowledge and experience of the characteristics highlighted in the research
hypotheses.
3.6 Instrument design and data collection
This section will describe the method used to create the research instrument. A key
element of the research instrument is to ensure its reliability and validity and this will be
discussed later in the chapter. According to Wagner et al. (2012), there are a number of
simple key principles that should be applied in order to build credibility with your
audience. These include giving your research questionnaire a title and supplying a
covering letter that explains the purpose of the research. Refer to Appendix B for a copy
of the questionnaire that was used in this research. Further, according to Goodman in
2003, it is also useful to provide instructions above the specific question block to ensure
correct completion of the questions involved (Wagner et al., 2012). The questionnaire
was therefore designed with these principles in mind. The next element of the research
instrument that needs to be considered is the content.
The content included in the questionnaire should be effective in obtaining meaningful
data from the respondent (Walonick, 2004). In developing content for the questionnaire,
the research hypotheses were considered and the type of data that was required for each
hypothesis was determined. This enabled the questions to be framed correctly. To ensure
that the questionnaire was relatively easy and simple to complete a number of questions
were asked by defining ranges. These questions related to physical store size, dispensary
size, turnover from scripts, total turnover, average inventory holding, number of other
pharmacies in the region, number of doctors who practice in the region, as well as the
locational items of roadside accessibility and pedestrian accessibility. This type of
questioning also considered the ethical issues relating to the right to privacy associated
with research (Leedy & Ormrod, 2010). The reason for this is that data relating to
financial performance is often considered to be private and participants were unlikely to
share this information with the researcher.
48
In developing the other questions to be included in the content of the questionnaire,
simple closed questions were used. A closed question is a type of questioning technique
in terms of which a user is required to answer in a specific way and there is no other
answer that can be provided. Closed questioning is often easy to use in statistical analysis
(Wagner et al., 2012). Other benefits associated with closed questioning include the fact
that little writing is required, provides the ability to make group comparisons and is
useful for testing specific hypotheses. The latter characteristic is probably the most
important. Consequently, this type of questioning was considered appropriate for
achieving the desired outcomes of this research (Vinten, 1995).
A major drawback of closed questioning is that the respondent is restrained by the items,
which can result in the wrong outcomes. For instance, if selected items are presented as a
closed question such as the following: “What would you most prefer in a job?”(Kalton &
Schuman, 1982). The respondent is then constrained by the answers or categories
presented. However, as was shown when the same question was left open-ended, the
statistically significant responses did not include any of the themes or categories
presented as part of the closed question (Kalton & Schuman, 1982). However, the closed
questions used in this questionnaire elicited yes/no type responses. The reason for this
was to ascertain the existence of a variable or not. However, some of these yes/no
responses did illicit contingent questions being asked within the questionnaire (Wagner et
al., 2012). As a result of this type of closed questioning the drawback presented was not
considered to be an issue. The next part of this chapter will discuss the different variables.
3.6.1 Average inventory holding
The variable of average inventory holding is defined in rand, as this is the currency in
which purchasing transactions take place in the pharmaceutical industry at the retail
pharmacy level. Accordingly, this basis of measure would appear to be appropriate.
Moreover, an average balance was selected owing to the fact that the inventory balance
could be higher or lower than the mean at different times of the year as a result of the
trading cycles that exist. These trading cycles are present in the pharmacy industry
49
because the incidence of illness varies according to the time of the year (Hamuro et al.,
1998).
In order to illicit a response from respondents certain ranges were developed, the value of
which was based on discussions with three different pharmacists who were personal
friends of the researcher.
3.6.2 Total turnover and turnover from scripts
The term turnover is often used in commerce to refer to revenue or income. Accordingly,
turnover represents the number of sales made during a period of time. For the purposes of
the research this period was taken to be a monthly period. Turnover is further defined in
rand, as this is the currency used to perform sale transactions in pharmacies in South
Africa. Specifically, the concept of thousands of rand (’000s) was used.
Although the research problem intends to address profitability, turnover has been used as
a proxy for profit. There are two main reasons for this. Firstly, turnover is a figure that is
less guarded by members of the public than profit. Secondly, turnover is a “clean”
number, as it represents the number of sales made. Profit includes other factors that have
not been expressly considered or defined in this research question, such as gearing.
Gearing relates to the basis on which businesses are financed. In other words, companies
that have made use of loan financing from a financial institution could have a lower profit
than those that use their own start-up capital, owing to the interest expense charged,
which is recorded in the Statement of Comprehensive Income. Another example of this is
the fact that certain pharmacies may own the building within which they are located and
others may be renting. Again, there will be an unaccounted variable within the model that
may have an impact on the outcome of the analysis.
The turnover measures were represented using ordinal data because the data represents
intervals which have a comparable element (Leedy & Ormrod, 2010). To determine the
intervals the insights of the three pharmacists were used. This approach is supported by a
50
study conducted in Tehran, Iran, where a pharmacy’s income was defined as $106 301
annually (Keshavarz et al., 2012). Thus, converting to a rand equivalent would, on the 22
January 2013 at a rate of 8.857630/USD (x-rates.com, 2013), result in R941 574,93. This
would represent the mean revenue expected. However, this is considered to be revenue
earned on an annual basis, which was consequently deemed to be too low. Hence, on
discussion this was used as the mean monthly turnover earned. Further, it should be noted
that in Tehran the turnover that can be earned on non-medical items is restricted, which
may suggest the reason for the difference.
3.6.3 Number of pharmacies
The number of pharmacies in an area is used as a proxy for the level of competition that
is experienced. Hence, more pharmacies in an area would represent more competition.
However, it does not suggest that when there are four pharmacies in a region there is
twice the competition than if there were only two pharmacies. As a result, the pharmacy
measure represents ordinal data. As defined, ordinal data ranks data but does not take into
account how similar or dissimilar the groups are (Leedy & Ormrod, 2010). Therefore, a
ranking letter was allocated to each item and a value of 5 was allocated when there was
less than one pharmacy in the area as this corresponds to low competition. Each block
after that was allocated a corresponding number, ending at 1, with 1 suggesting that the
environment is the most competitive.
Zhu and Singh (2009), study analysed the effect of competition as a decreasing function
of distance from the store. However, our competition measure is not concerned with this
complex measure of competition, merely with the existence of competition. Thus, the
discrete bands that were defined by Zhu and Singh (2009) were a measure of less than
two miles, which when converted to the metric system is just more than three kilometres.
This measure of competition is consistent with other studies performed (Patel & Pande,
2012) and this band therefore seemed appropriate for the competition measure.
51
3.6.4 Number of doctors in the region
Population density is often seen to have an impact on the number of customers who
actually make use of a store (Pauler et al., 2009). However, in the retail literature,
population density is not the only way in which to measure the number of people who
will actually make use of a store. For instance, in Japan (Sadahiro, 2000) found that, in
areas where a large number of people work, this too may affect the number of footfalls in
a store. For instance, stores were often found around key public transportation centres in
the business district rather than in the suburbs. Based on this, the questionnaire in the
current study attempted to develop a similar density measure.
As a pharmacy is reliant on the number of scripts it fills it is reliant on the providers of
these scripts (i.e. the doctors) being in the area. To measure this ordinal data was used.
Again, the dataset represents intervals and, as the data does not indicate degrees or
amounts, it is ordinal data. Once again, a ranking measure was allocated to each box. As
the number of doctors in the area increases so too do the providers of scripts increase. As
a result, the field with the most doctors is represented using a rating of 5, while less than
one doctor in the region is represented by the lowest score of 1.
3.6.5 Floor space
The floor space of the pharmacy is defined using the metric system; thus, floor space is
measured in metres squared. The data set represents ordinal data because the data
generated represents discrete intervals. These intervals are then ranked, which is a key
element of ordinal data. To define these bands reliance was placed on the retail literature,
which states that type of store trip depends on either the size of the store or the purpose of
the trip. Accordingly, it was indicated that a pharmacy is generally 250 m2 or less (C. M.
Guy, 1998). As a result the measure of floor space was developed from this by working
backwards to define each ratio.
52
A similar process was used to determine the physical size of the dispensary. As a
dispensary forms part of a larger pharmacy, the dispensary must be a proportion of the
total size. The use of this approach enabled the smaller dispensary-only pharmacies to
select the same answer in each grouping to indicate that their entire pharmacy represents
the dispensary.
3.6.6 Roadside accessibility and pedestrian accessibility
"Roadside accessibility” and “pedestrian accessibility” are defined using ordinal data.
This is because a random value from 1 to 5 is allocated to each item. However, the value
allocated suggests that a particular item is preferred for the location index over another
item, although it does not suggest the degree to which one is preferred over another. For
“roadside accessibility”, “main roads” were considered to be rated a 5 as these are
indicative of more traffic (Sadahiro, 2000) and busy side streets were rated as 1. In terms
of “pedestrian accessibility”, “shopping centres” were considered to be a 5 and
“roadside” a 1.
3.6.7 Location index
The location is developed as a variable of the four components that form part of location.
The location represents ordinal data as the value generated from the other components is
comparable. A 5 represents a location point with a high degree of favourability, while a 1
represents a location that is unfavourable. However, there is no reference to how much
more favourable a 5 is to a 4. The variable is constructed by using a 25% weighting to the
location index. The reason for this is that the aim is not to suggest a single variable has a
larger influence on a location in comparison to another variable. Thus, this is deemed
appropriate.
53
3.6.8 Other relevant data points
The other data points included in the questionnaire represent binary nominal data. The
data points are nominal because the coding of the data merely reflects a difference in the
items; there is no comparison of the items or significance of the value allocated. The data
is binary as there are only two potential answers, which are provided by responding either
“yes” or “no”.
3.7 Data analysis
To analyse the research questions, a mix of parametric and non-parametric statistics will
be used. Parametric statistics can only be used when the data meets certain key
assumptions about the parameters of the population. For example, some parametric
procedures, such as regression, requires that, (a) that the data be interval or ratio in
measurement level and (b) that the dependent variable has a normal distribution (Leedy &
Ormrod, 2010). As the ordinal data is being treated as scale measurement the use of
parametric analysis is possible.
The first step in data analysis is to summarise the data. This is often done by using
descriptive statistical techniques. The methods applied in summarising the data include
calculating means, standard deviations and distribution graphs. After this basic analysis
of the data, it can then be applied in other parametric and non-parametric statistical
procedures such as chi-square, correlational analysis and regression.
In determining which statistical methods are appropriate for use in this study, various
methods were considered from previous studies. To determine whether a pharmacy was a
lucrative business in Tehran, Iran, the researcher made use of non-parametric statistics
such as chi-square to determine the significance of proportion differences (Keshavarz et
al., 2012). In a similar study performed in New Delhi, India, a Tobit regression model
was used to determine drivers of efficiency after a data envelopment analysis (DEA)
54
method was utilised. DEA is useful for developing the “best” solution for relating input to
output (Patel & Pande, 2012).
Furthermore, the impact of market structure was considered on a service firm’s pricing
objectives. This study considered a number of industries and as part of the study a cluster
analysis was conducted to analyse the market structure (Avlonitis & Indounas, 2004). To
specifically test the relationship between inventory and sales in a retail chain store, which
is represented by a relationship of inventory increasing by the square root of sales, t-
statistics and p-values were used to identify significant predictors of the relationship
(Dubelaar et al., 2001).
To address the research questions presented by the current study, the following methods
are to be used. Descriptive statistics will be used to summarise the data, which will
subsequently be used to determine whether the parametric variables can be tested using
inferential statistics. The summarised data will also be used to determine whether any
relationship can be identified. The main aim of the research hypotheses is to determine
whether a relationship exists between the independent variable and the dependent
variable. The mathematical determination of relationships from the scatter plots is known
as regression analysis (Vesselo, 1965). Ordinary least squares regression is a parametric
technique that can be used to determine whether such a relationship is linear.
Ordinary least squares regression is a parametric technique that can be utilised to model a
causal linear relationship between variables. Other methods of regression that exist are
Tobit and logistic regression. In order to determine significant mean differences between
different buyer groups and regions, independent samples t-test and Analysis of Variance
(“ANOVA”), test will be utilised.
Cluster analysis is a technique that can be used to determine groupings within the data. It
is a multivariate, exploratory technique designed to reveal natural groupings that may
exist in the data ("Chapter 23 Cluster Analysis,"). A number of different methods of
cluster analysis exist. These methods include hierarchical cluster analysis, Ward’s
method, Square Euclidean Distance and K-means clustering. Cluster analysis can often be
55
used in conjunction with regression analysis and is generally applied by grouping or
classifying variables which can then form part of the independent variables in the logistic
regression (Wood, 2006) or ordinal regression (Helgesen et al., 2009).
The cluster analysis method to be used is K-means clustering, because a preconceived
idea relating to the number of clusters that may exist and no grouping of the variables
into smaller groups is required. The preconceived grouping is defined by the four
variables which relate to competition and accessibility. The limitation of this cluster
analysis method is that the researcher needs to decide on the number of clusters (Everitt,
1979).
3.8 Validity and reliability
When performing research using a questionnaire, the validity and reliability of the data
obtained can be threatened. One reason for this is the fact that if the questionnaire is not
appropriately designed, it is possible that the data obtained will not be reliable. This can
happen when the constructs being used to collect the data are not applied consistently
(Wagner et al., 2012). However, if the research instrument is valid, the questions included
in the questionnaire will address the proposed hypotheses (Leedy & Ormrod, 2010).
Although there are various types of validity and reliability measures, only those that are
appropriate for the research instrument used in this study will be considered here.
3.8.1 Validity
There are four main types of validity: face validity, content validity, criterion validity and
construct validity. The questionnaire in this study appears to have some degree of face
validity as the questions were developed from the research questions proposed. The
questionnaire also has a level of content validity. In order to attain this validity, certain
elements were verified with three pharmacists prior to the questionnaire being
administered to a larger sample. Further, a number of the relationships identified are
56
relationships that have been developed in the literature (Dubelaar et al., 2001; Keshavarz
et al., 2012; Patel & Pande, 2012; Pauler et al., 2009). The content validity of a tool is
obtained when the questions included address the specific area of research (Wagner et al.,
2012).
3.8.2 Reliability
Reliability refers to the consistency of the results produced by the research instrument.
For instance, a test is reliable if the same results are produced for the test when performed
by the same people on a different day (Leedy & Ormrod, 2010). This type of reliability is
referred to as test-retest reliability. The research tool in this study, however, makes use of
an internal measure of reliability. Accordingly, the questions at the end of the
questionnaire request percentage data relating to where the pharmacist believes the
revenue in the pharmacy is earned and the number of scripts and the value of these
scripts. The use of this data, that is, average turnover of a pharmacy for a year and a
month, can be compared to the answers provided in the tick-box questions. Hence, if
there is a high correlation this would indicate reliability.
In addition, in order to enhance the reliability of the tool, it was administered to each
participant in the same standard way. Accordingly, it was presented to the pharmacist
responsible for its completion who then completed the questionnaire without any help or
guidance from the researcher. In addition, the questions were designed so as to ensure
consistency in selection, as the pharmacists could only select their answers from a
predetermined set.
3.9 Conclusion
This chapter has presented an extensive review of the process involved in developing the
research instrument, the definitions of the variables to be used and the methods by which

57
the data collected will be analysed in order to draw the conclusions required to support
the research hypotheses that have been formulated.
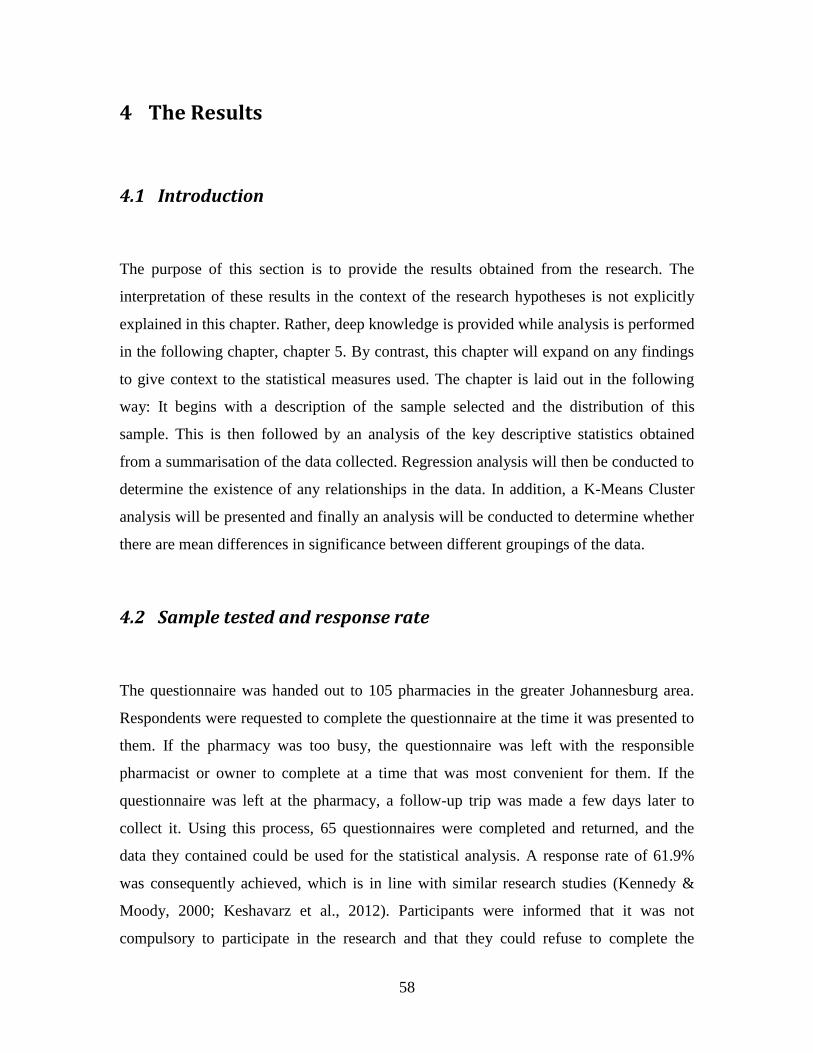
58
4 The Results
4.1 Introduction
The purpose of this section is to provide the results obtained from the research. The
interpretation of these results in the context of the research hypotheses is not explicitly
explained in this chapter. Rather, deep knowledge is provided while analysis is performed
in the following chapter, chapter 5. By contrast, this chapter will expand on any findings
to give context to the statistical measures used. The chapter is laid out in the following
way: It begins with a description of the sample selected and the distribution of this
sample. This is then followed by an analysis of the key descriptive statistics obtained
from a summarisation of the data collected. Regression analysis will then be conducted to
determine the existence of any relationships in the data. In addition, a K-Means Cluster
analysis will be presented and finally an analysis will be conducted to determine whether
there are mean differences in significance between different groupings of the data.
4.2 Sample tested and response rate
The questionnaire was handed out to 105 pharmacies in the greater Johannesburg area.
Respondents were requested to complete the questionnaire at the time it was presented to
them. If the pharmacy was too busy, the questionnaire was left with the responsible
pharmacist or owner to complete at a time that was most convenient for them. If the
questionnaire was left at the pharmacy, a follow-up trip was made a few days later to
collect it. Using this process, 65 questionnaires were completed and returned, and the
data they contained could be used for the statistical analysis. A response rate of 61.9%
was consequently achieved, which is in line with similar research studies (Kennedy &
Moody, 2000; Keshavarz et al., 2012). Participants were informed that it was not
compulsory to participate in the research and that they could refuse to complete the
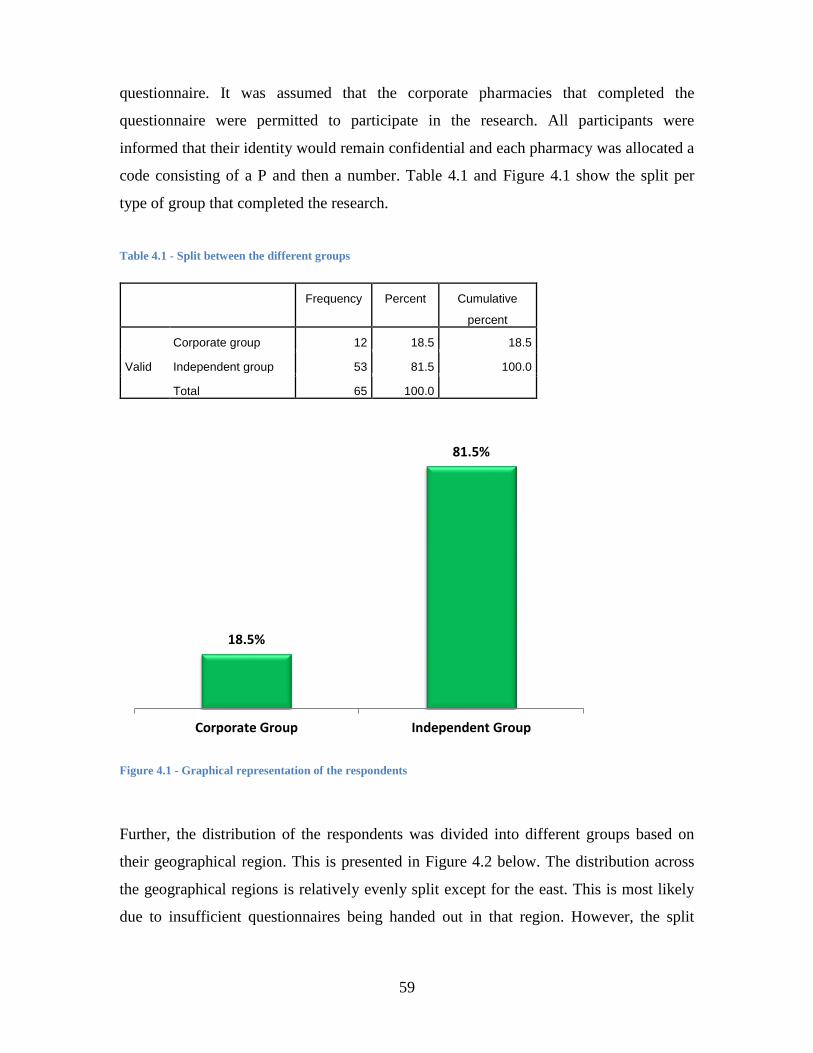
59
questionnaire. It was assumed that the corporate pharmacies that completed the
questionnaire were permitted to participate in the research. All participants were
informed that their identity would remain confidential and each pharmacy was allocated a
code consisting of a P and then a number. Table 4.1 and Figure 4.1 show the split per
type of group that completed the research.
Table 4.1 - Split between the different groups
Frequency Percent Cumulative
percent
Valid
Corporate group 12 18.5 18.5
Independent group 53 81.5 100.0
Total 65 100.0
Figure 4.1 - Graphical representation of the respondents
Further, the distribution of the respondents was divided into different groups based on
their geographical region. This is presented in Figure 4.2 below. The distribution across
the geographical regions is relatively evenly split except for the east. This is most likely
due to insufficient questionnaires being handed out in that region. However, the split
18.5%
81.5%
Corporate Group Independent Group
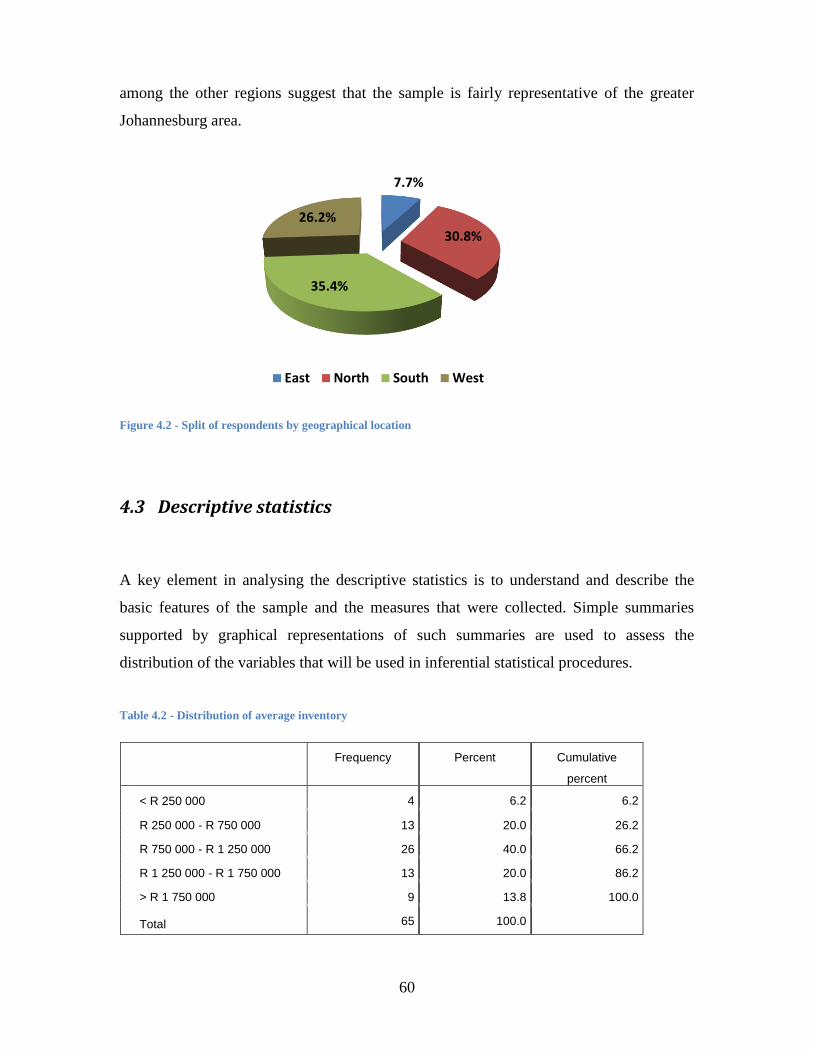
60
among the other regions suggest that the sample is fairly representative of the greater
Johannesburg area.
Figure 4.2 - Split of respondents by geographical location
4.3 Descriptive statistics
A key element in analysing the descriptive statistics is to understand and describe the
basic features of the sample and the measures that were collected. Simple summaries
supported by graphical representations of such summaries are used to assess the
distribution of the variables that will be used in inferential statistical procedures.
Table 4.2 - Distribution of average inventory
Frequency Percent Cumulative
percent
< R 250 000 4 6.2 6.2
R 250 000 - R 750 000 13 20.0 26.2
R 750 000 - R 1 250 000 26 40.0 66.2
R 1 250 000 - R 1 750 000 13 20.0 86.2
> R 1 750 000 9 13.8 100.0
Total 65 100.0
7.7%
30.8%
35.4%
26.2%
East North South West
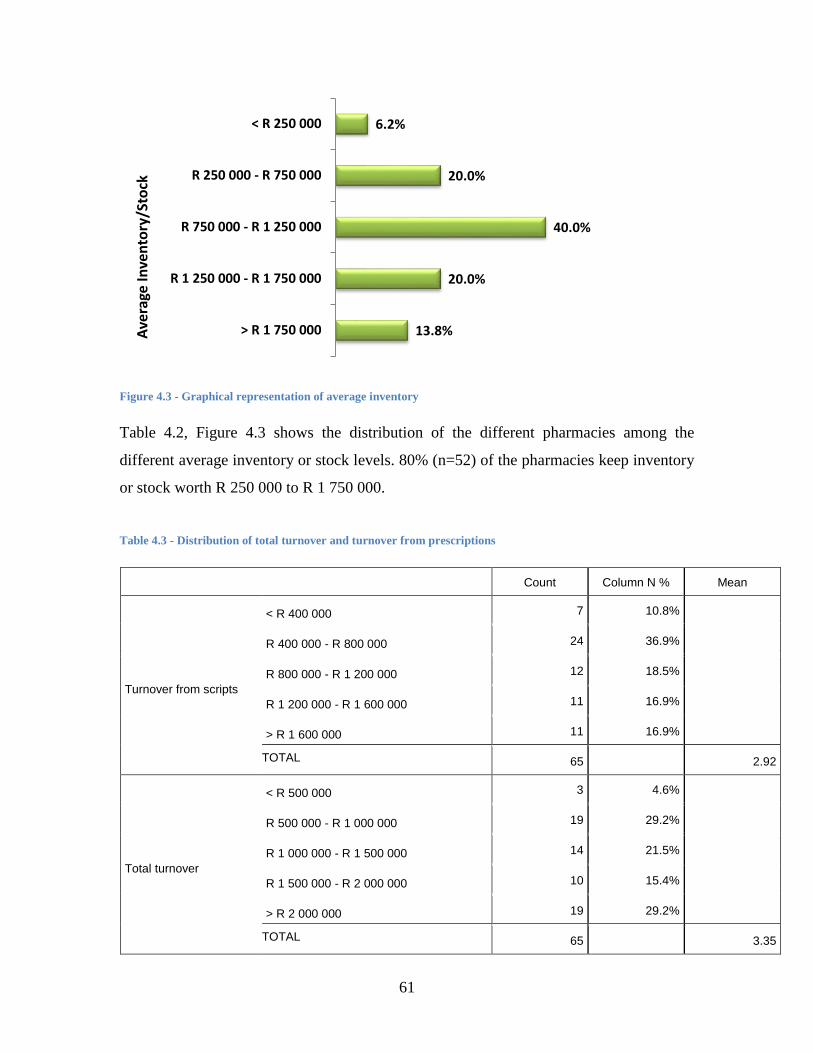
61
Figure 4.3 - Graphical representation of average inventory
Table 4.2, Figure 4.3 shows the distribution of the different pharmacies among the
different average inventory or stock levels. 80% (n=52) of the pharmacies keep inventory
or stock worth R 250 000 to R 1 750 000.
Table 4.3 - Distribution of total turnover and turnover from prescriptions
Count Column N % Mean
Turnover from scripts
< R 400 000 7 10.8%
R 400 000 - R 800 000 24 36.9%
R 800 000 - R 1 200 000 12 18.5%
R 1 200 000 - R 1 600 000 11 16.9%
> R 1 600 000 11 16.9%
TOTAL 65 2.92
Total turnover
< R 500 000 3 4.6%
R 500 000 - R 1 000 000 19 29.2%
R 1 000 000 - R 1 500 000 14 21.5%
R 1 500 000 - R 2 000 000 10 15.4%
> R 2 000 000 19 29.2%
TOTAL 65 3.35
6.2%
20.0%
40.0%
20.0%
13.8%
< R 250 000
R 250 000 - R 750 000
R 750 000 - R 1 250 000
R 1 250 000 - R 1 750 000
> R 1 750 000Ave
rage
Inve
nto
ry/S
tock
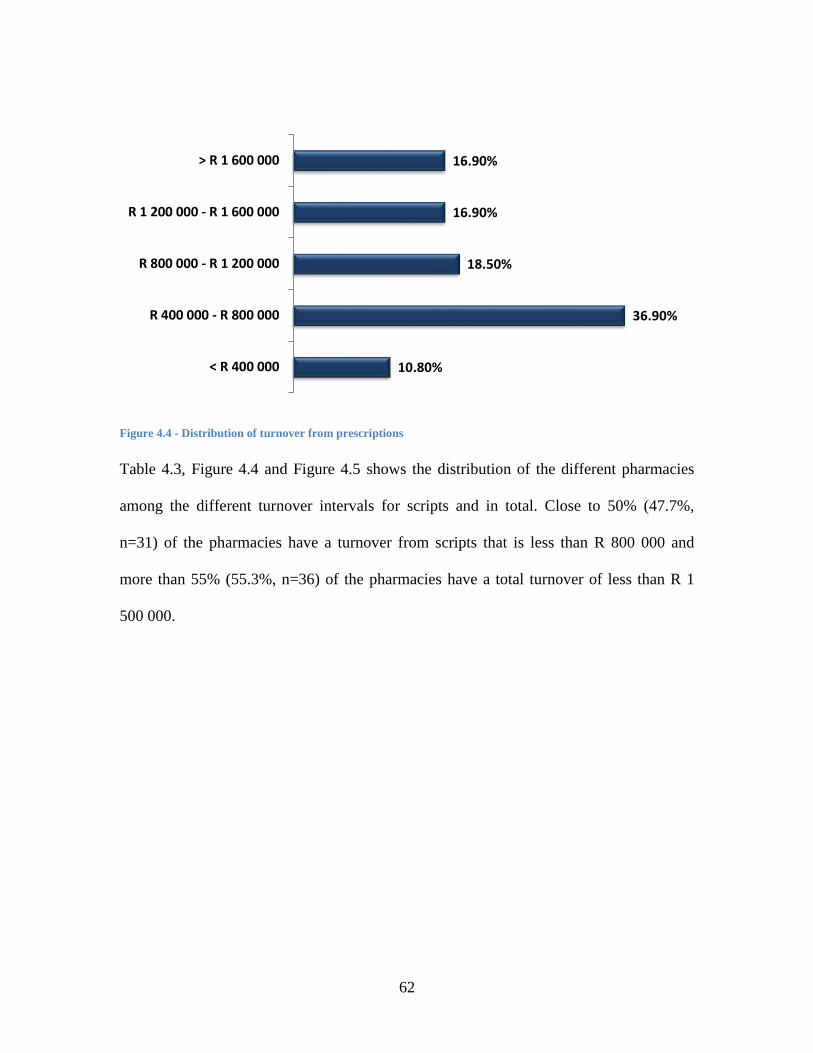
62
Figure 4.4 - Distribution of turnover from prescriptions
Table 4.3, Figure 4.4 and Figure 4.5 shows the distribution of the different pharmacies
among the different turnover intervals for scripts and in total. Close to 50% (47.7%,
n=31) of the pharmacies have a turnover from scripts that is less than R 800 000 and
more than 55% (55.3%, n=36) of the pharmacies have a total turnover of less than R 1
500 000.
10.80%
36.90%
18.50%
16.90%
16.90%
< R 400 000
R 400 000 - R 800 000
R 800 000 - R 1 200 000
R 1 200 000 - R 1 600 000
> R 1 600 000
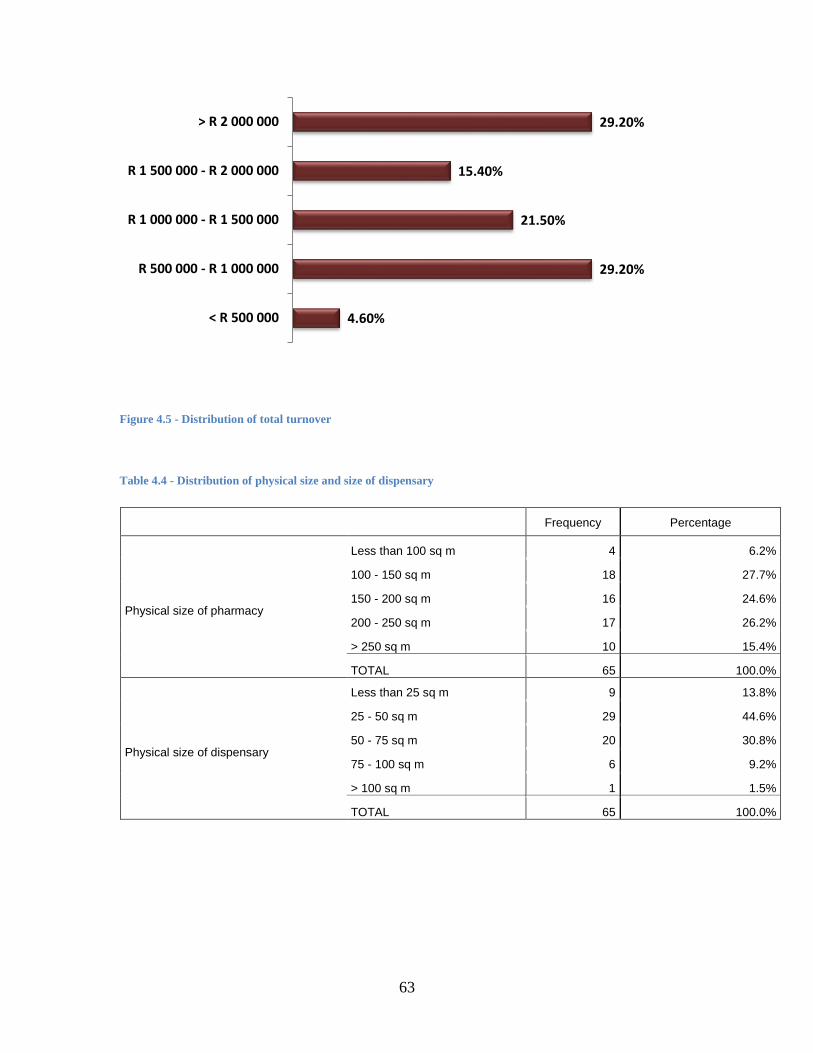
63
Figure 4.5 - Distribution of total turnover
Table 4.4 - Distribution of physical size and size of dispensary
Frequency Percentage
Physical size of pharmacy
Less than 100 sq m 4 6.2%
100 - 150 sq m 18 27.7%
150 - 200 sq m 16 24.6%
200 - 250 sq m 17 26.2%
> 250 sq m 10 15.4%
TOTAL 65 100.0%
Physical size of dispensary
Less than 25 sq m 9 13.8%
25 - 50 sq m 29 44.6%
50 - 75 sq m 20 30.8%
75 - 100 sq m 6 9.2%
> 100 sq m 1 1.5%
TOTAL 65 100.0%
4.60%
29.20%
21.50%
15.40%
29.20%
< R 500 000
R 500 000 - R 1 000 000
R 1 000 000 - R 1 500 000
R 1 500 000 - R 2 000 000
> R 2 000 000
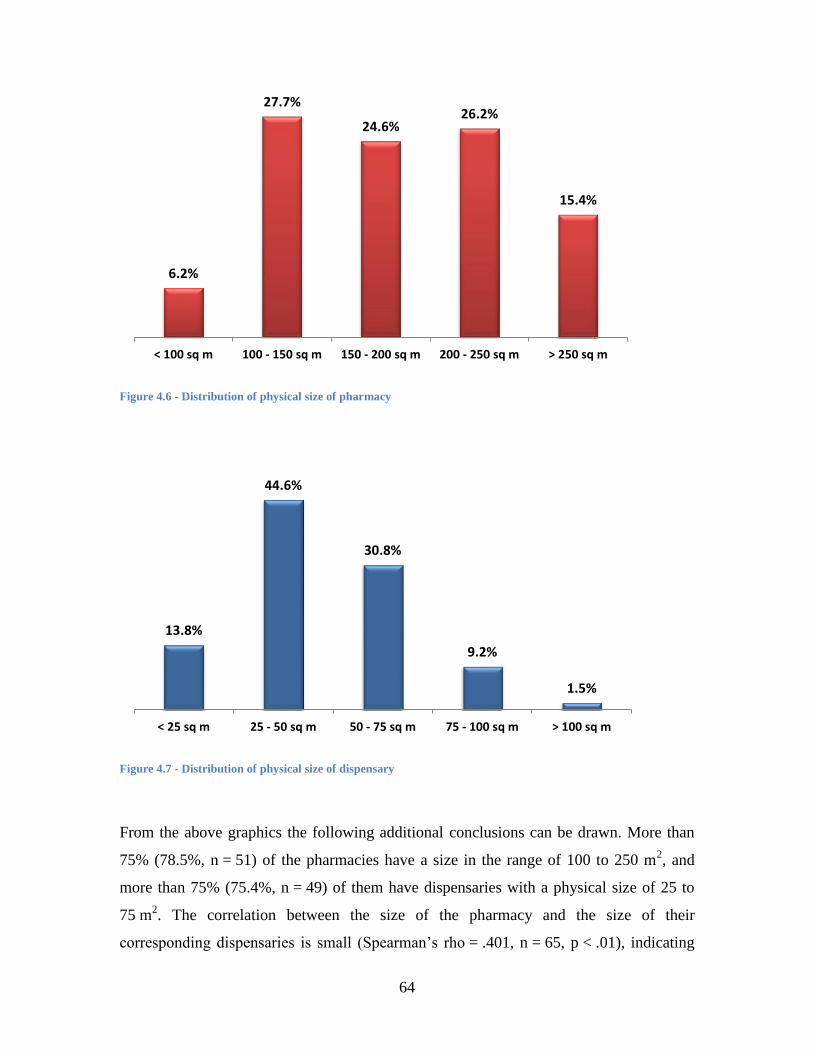
64
Figure 4.6 - Distribution of physical size of pharmacy
Figure 4.7 - Distribution of physical size of dispensary
From the above graphics the following additional conclusions can be drawn. More than
75% (78.5%, n = 51) of the pharmacies have a size in the range of 100 to 250 m2, and
more than 75% (75.4%, n = 49) of them have dispensaries with a physical size of 25 to
75 m2. The correlation between the size of the pharmacy and the size of their
corresponding dispensaries is small (Spearman’s rho = .401, n = 65, p < .01), indicating
6.2%
27.7%
24.6% 26.2%
15.4%
< 100 sq m 100 - 150 sq m 150 - 200 sq m 200 - 250 sq m > 250 sq m
13.8%
44.6%
30.8%
9.2%
1.5%
< 25 sq m 25 - 50 sq m 50 - 75 sq m 75 - 100 sq m > 100 sq m
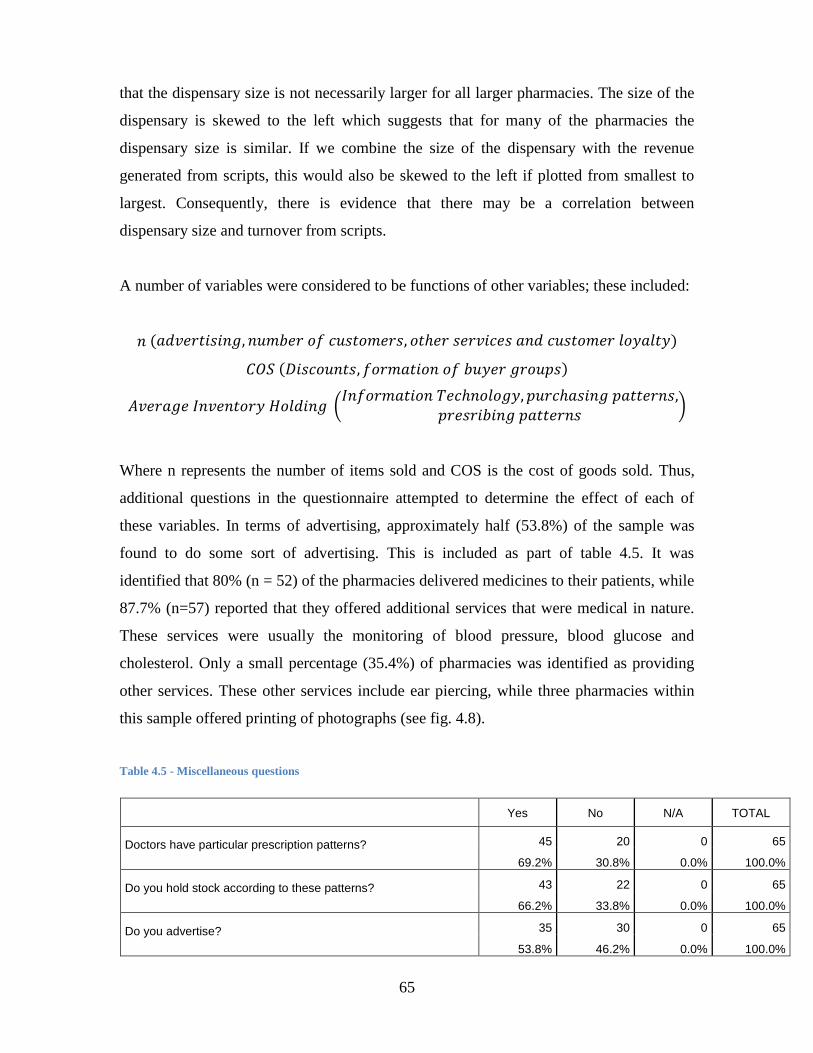
65
that the dispensary size is not necessarily larger for all larger pharmacies. The size of the
dispensary is skewed to the left which suggests that for many of the pharmacies the
dispensary size is similar. If we combine the size of the dispensary with the revenue
generated from scripts, this would also be skewed to the left if plotted from smallest to
largest. Consequently, there is evidence that there may be a correlation between
dispensary size and turnover from scripts.
A number of variables were considered to be functions of other variables; these included:
(
)
Where n represents the number of items sold and COS is the cost of goods sold. Thus,
additional questions in the questionnaire attempted to determine the effect of each of
these variables. In terms of advertising, approximately half (53.8%) of the sample was
found to do some sort of advertising. This is included as part of table 4.5. It was
identified that 80% (n = 52) of the pharmacies delivered medicines to their patients, while
87.7% (n=57) reported that they offered additional services that were medical in nature.
These services were usually the monitoring of blood pressure, blood glucose and
cholesterol. Only a small percentage (35.4%) of pharmacies was identified as providing
other services. These other services include ear piercing, while three pharmacies within
this sample offered printing of photographs (see fig. 4.8).
Table 4.5 - Miscellaneous questions
Yes No N/A TOTAL
Doctors have particular prescription patterns? 45 20 0 65
69.2% 30.8% 0.0% 100.0%
Do you hold stock according to these patterns? 43 22 0 65
66.2% 33.8% 0.0% 100.0%
Do you advertise? 35 30 0 65
53.8% 46.2% 0.0% 100.0%
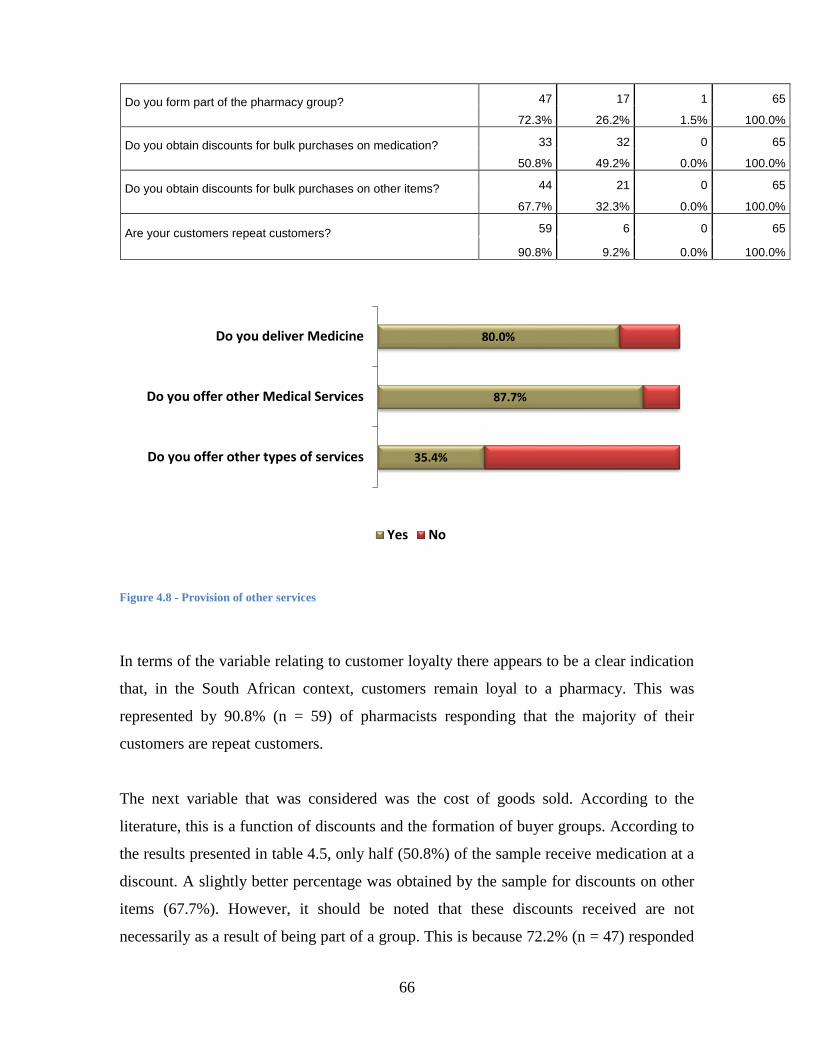
66
Do you form part of the pharmacy group? 47 17 1 65
72.3% 26.2% 1.5% 100.0%
Do you obtain discounts for bulk purchases on medication? 33 32 0 65
50.8% 49.2% 0.0% 100.0%
Do you obtain discounts for bulk purchases on other items? 44 21 0 65
67.7% 32.3% 0.0% 100.0%
Are your customers repeat customers? 59 6 0 65
90.8% 9.2% 0.0% 100.0%
Figure 4.8 - Provision of other services
In terms of the variable relating to customer loyalty there appears to be a clear indication
that, in the South African context, customers remain loyal to a pharmacy. This was
represented by 90.8% (n = 59) of pharmacists responding that the majority of their
customers are repeat customers.
The next variable that was considered was the cost of goods sold. According to the
literature, this is a function of discounts and the formation of buyer groups. According to
the results presented in table 4.5, only half (50.8%) of the sample receive medication at a
discount. A slightly better percentage was obtained by the sample for discounts on other
items (67.7%). However, it should be noted that these discounts received are not
necessarily as a result of being part of a group. This is because 72.2% (n = 47) responded
80.0%
87.7%
35.4%
Do you deliver Medicine
Do you offer other Medical Services
Do you offer other types of services
Yes No
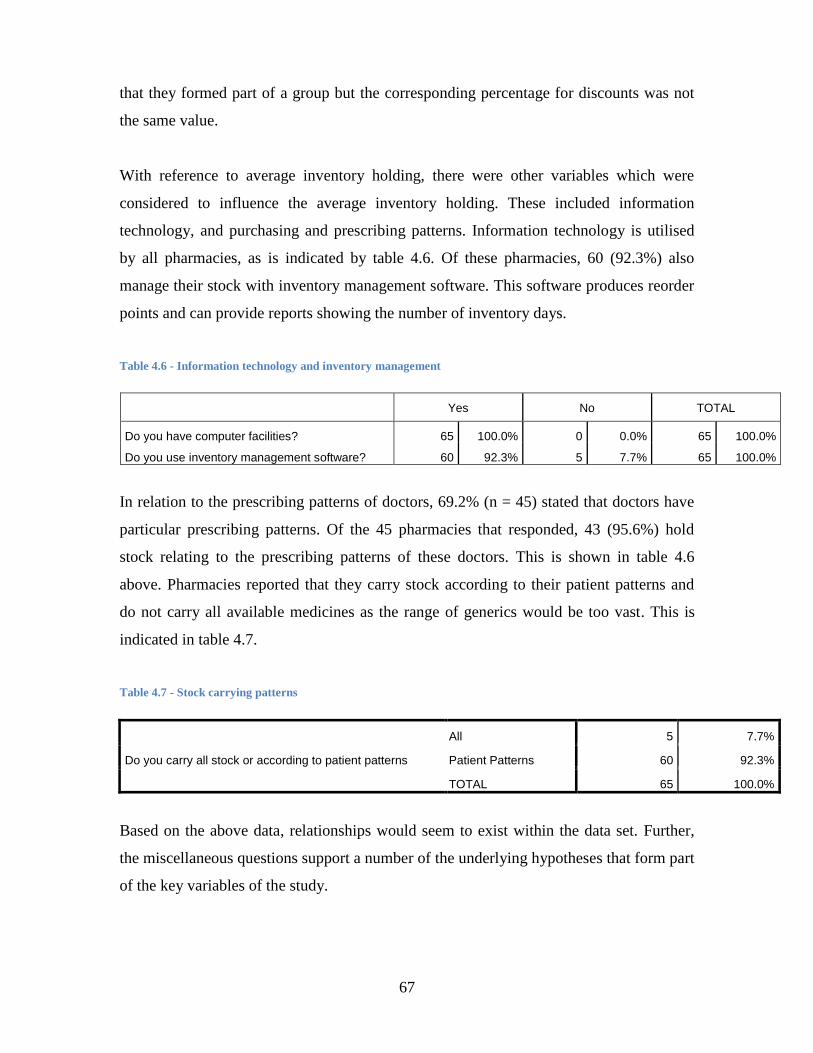
67
that they formed part of a group but the corresponding percentage for discounts was not
the same value.
With reference to average inventory holding, there were other variables which were
considered to influence the average inventory holding. These included information
technology, and purchasing and prescribing patterns. Information technology is utilised
by all pharmacies, as is indicated by table 4.6. Of these pharmacies, 60 (92.3%) also
manage their stock with inventory management software. This software produces reorder
points and can provide reports showing the number of inventory days.
Table 4.6 - Information technology and inventory management
Yes No TOTAL
Do you have computer facilities? 65 100.0% 0 0.0% 65 100.0%
Do you use inventory management software? 60 92.3% 5 7.7% 65 100.0%
In relation to the prescribing patterns of doctors, 69.2% (n = 45) stated that doctors have
particular prescribing patterns. Of the 45 pharmacies that responded, 43 (95.6%) hold
stock relating to the prescribing patterns of these doctors. This is shown in table 4.6
above. Pharmacies reported that they carry stock according to their patient patterns and
do not carry all available medicines as the range of generics would be too vast. This is
indicated in table 4.7.
Table 4.7 - Stock carrying patterns
Do you carry all stock or according to patient patterns
All 5 7.7%
Patient Patterns 60 92.3%
TOTAL 65 100.0%
Based on the above data, relationships would seem to exist within the data set. Further,
the miscellaneous questions support a number of the underlying hypotheses that form part
of the key variables of the study.
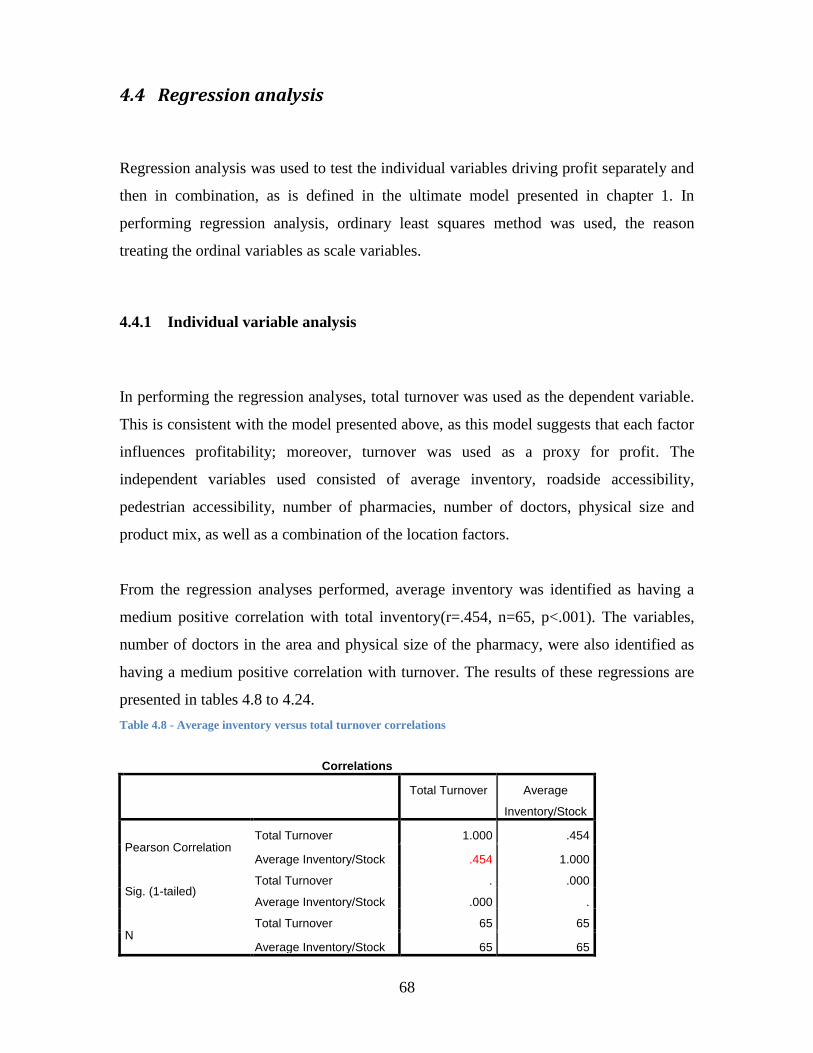
68
4.4 Regression analysis
Regression analysis was used to test the individual variables driving profit separately and
then in combination, as is defined in the ultimate model presented in chapter 1. In
performing regression analysis, ordinary least squares method was used, the reason
treating the ordinal variables as scale variables.
4.4.1 Individual variable analysis
In performing the regression analyses, total turnover was used as the dependent variable.
This is consistent with the model presented above, as this model suggests that each factor
influences profitability; moreover, turnover was used as a proxy for profit. The
independent variables used consisted of average inventory, roadside accessibility,
pedestrian accessibility, number of pharmacies, number of doctors, physical size and
product mix, as well as a combination of the location factors.
From the regression analyses performed, average inventory was identified as having a
medium positive correlation with total inventory(r=.454, n=65, p<.001). The variables,
number of doctors in the area and physical size of the pharmacy, were also identified as
having a medium positive correlation with turnover. The results of these regressions are
presented in tables 4.8 to 4.24.
Table 4.8 - Average inventory versus total turnover correlations
Correlations
Total Turnover Average
Inventory/Stock
Pearson Correlation Total Turnover 1.000 .454
Average Inventory/Stock .454 1.000
Sig. (1-tailed) Total Turnover . .000
Average Inventory/Stock .000 .
N Total Turnover 65 65
Average Inventory/Stock 65 65
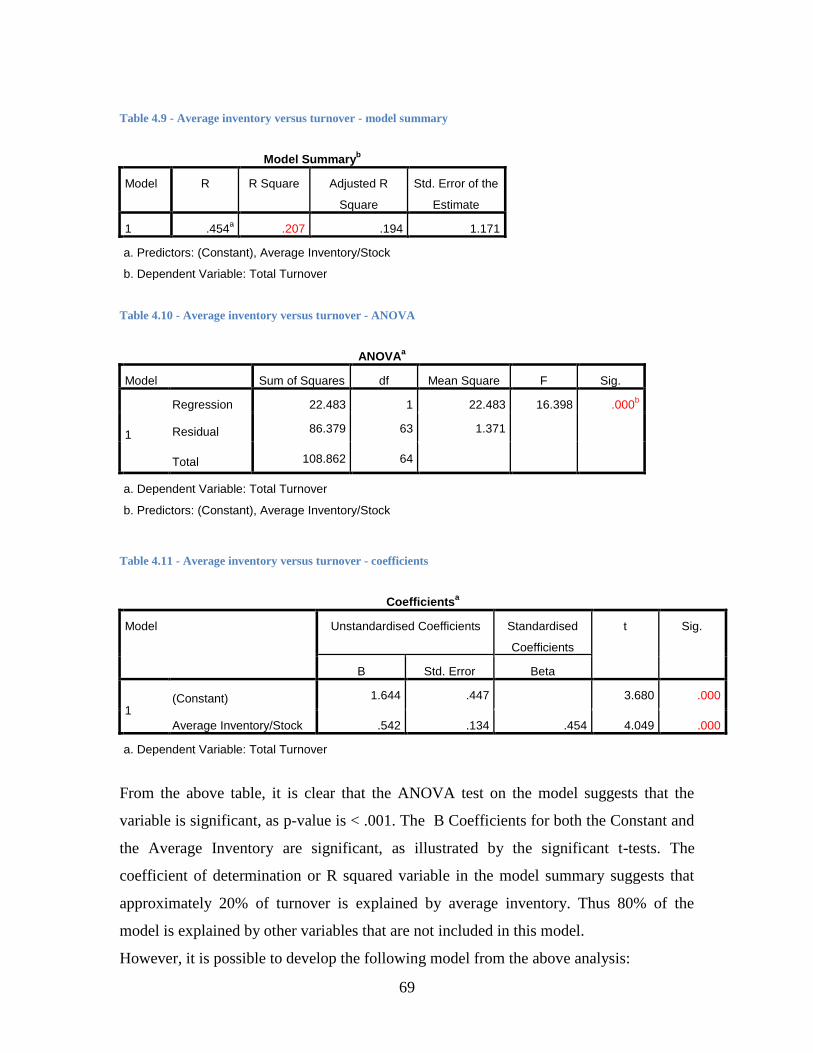
69
Table 4.9 - Average inventory versus turnover - model summary
Model Summaryb
Model R R Square Adjusted R
Square
Std. Error of the
Estimate
1 .454a .207 .194 1.171
a. Predictors: (Constant), Average Inventory/Stock
b. Dependent Variable: Total Turnover
Table 4.10 - Average inventory versus turnover - ANOVA
ANOVAa
Model Sum of Squares df Mean Square F Sig.
1
Regression 22.483 1 22.483 16.398 .000b
Residual 86.379 63 1.371
Total 108.862 64
a. Dependent Variable: Total Turnover
b. Predictors: (Constant), Average Inventory/Stock
Table 4.11 - Average inventory versus turnover - coefficients
Coefficientsa
Model Unstandardised Coefficients Standardised
Coefficients
t Sig.
B Std. Error Beta
1 (Constant) 1.644 .447 3.680 .000
Average Inventory/Stock .542 .134 .454 4.049 .000
a. Dependent Variable: Total Turnover
From the above table, it is clear that the ANOVA test on the model suggests that the
variable is significant, as p-value is < .001. The B Coefficients for both the Constant and
the Average Inventory are significant, as illustrated by the significant t-tests. The
coefficient of determination or R squared variable in the model summary suggests that
approximately 20% of turnover is explained by average inventory. Thus 80% of the
model is explained by other variables that are not included in this model.
However, it is possible to develop the following model from the above analysis:
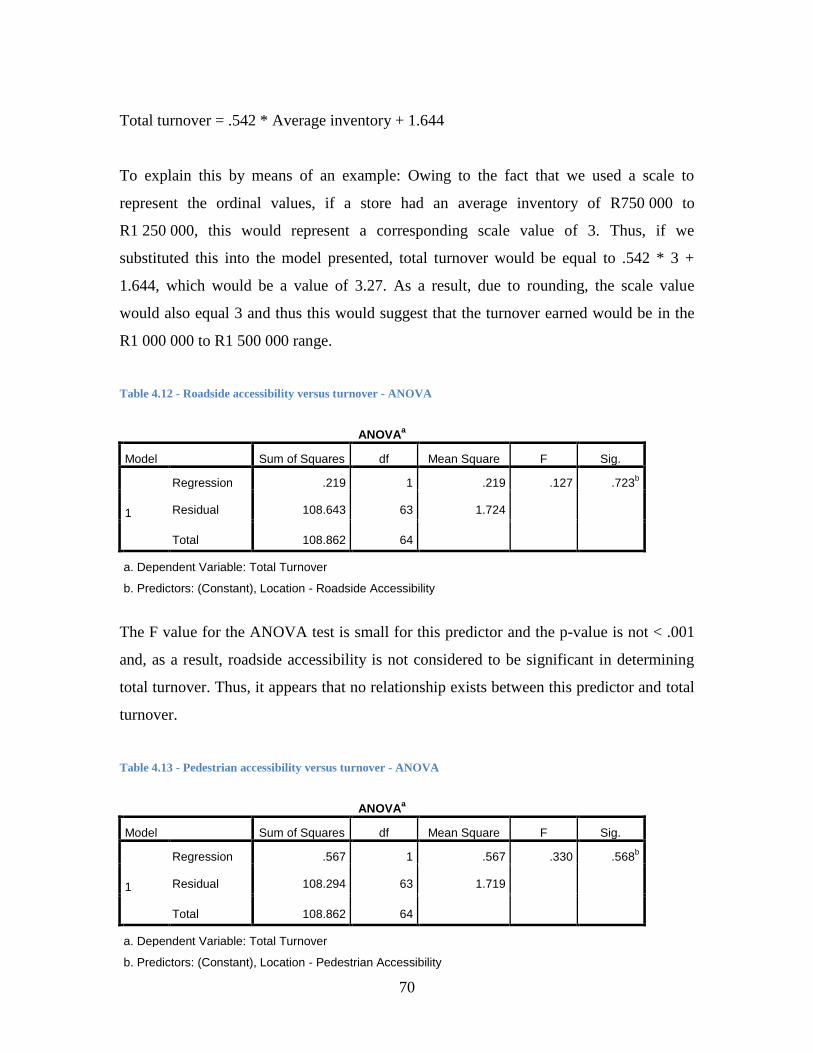
70
Total turnover = .542 * Average inventory + 1.644
To explain this by means of an example: Owing to the fact that we used a scale to
represent the ordinal values, if a store had an average inventory of R750 000 to
R1 250 000, this would represent a corresponding scale value of 3. Thus, if we
substituted this into the model presented, total turnover would be equal to .542 * 3 +
1.644, which would be a value of 3.27. As a result, due to rounding, the scale value
would also equal 3 and thus this would suggest that the turnover earned would be in the
R1 000 000 to R1 500 000 range.
Table 4.12 - Roadside accessibility versus turnover - ANOVA
ANOVAa
Model Sum of Squares df Mean Square F Sig.
1
Regression .219 1 .219 .127 .723b
Residual 108.643 63 1.724
Total 108.862 64
a. Dependent Variable: Total Turnover
b. Predictors: (Constant), Location - Roadside Accessibility
The F value for the ANOVA test is small for this predictor and the p-value is not < .001
and, as a result, roadside accessibility is not considered to be significant in determining
total turnover. Thus, it appears that no relationship exists between this predictor and total
turnover.
Table 4.13 - Pedestrian accessibility versus turnover - ANOVA
ANOVAa
Model Sum of Squares df Mean Square F Sig.
1
Regression .567 1 .567 .330 .568b
Residual 108.294 63 1.719
Total 108.862 64
a. Dependent Variable: Total Turnover
b. Predictors: (Constant), Location - Pedestrian Accessibility
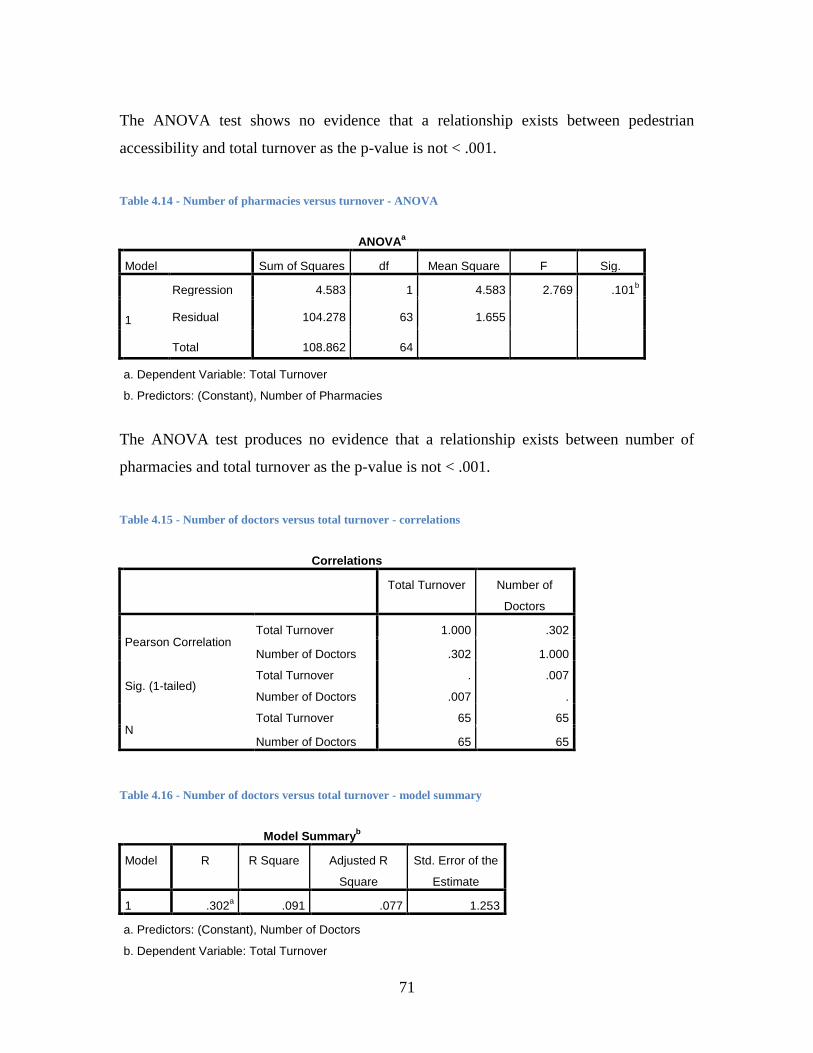
71
The ANOVA test shows no evidence that a relationship exists between pedestrian
accessibility and total turnover as the p-value is not < .001.
Table 4.14 - Number of pharmacies versus turnover - ANOVA
ANOVAa
Model Sum of Squares df Mean Square F Sig.
1
Regression 4.583 1 4.583 2.769 .101b
Residual 104.278 63 1.655
Total 108.862 64
a. Dependent Variable: Total Turnover
b. Predictors: (Constant), Number of Pharmacies
The ANOVA test produces no evidence that a relationship exists between number of
pharmacies and total turnover as the p-value is not < .001.
Table 4.15 - Number of doctors versus total turnover - correlations
Correlations
Total Turnover Number of
Doctors
Pearson Correlation Total Turnover 1.000 .302
Number of Doctors .302 1.000
Sig. (1-tailed) Total Turnover . .007
Number of Doctors .007 .
N Total Turnover 65 65
Number of Doctors 65 65
Table 4.16 - Number of doctors versus total turnover - model summary
Model Summaryb
Model R R Square Adjusted R
Square
Std. Error of the
Estimate
1 .302a .091 .077 1.253
a. Predictors: (Constant), Number of Doctors
b. Dependent Variable: Total Turnover
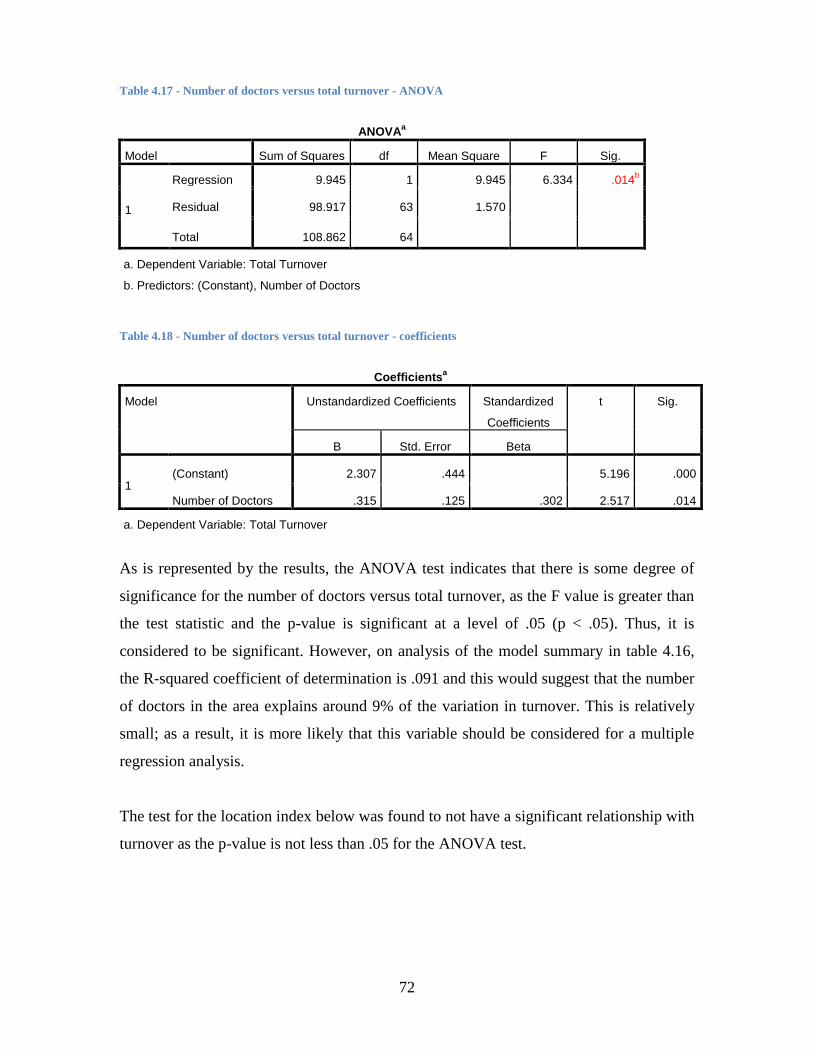
72
Table 4.17 - Number of doctors versus total turnover - ANOVA
ANOVAa
Model Sum of Squares df Mean Square F Sig.
1
Regression 9.945 1 9.945 6.334 .014b
Residual 98.917 63 1.570
Total 108.862 64
a. Dependent Variable: Total Turnover
b. Predictors: (Constant), Number of Doctors
Table 4.18 - Number of doctors versus total turnover - coefficients
Coefficientsa
Model Unstandardized Coefficients Standardized
Coefficients
t Sig.
B Std. Error Beta
1 (Constant) 2.307 .444
5.196 .000
Number of Doctors .315 .125 .302 2.517 .014
a. Dependent Variable: Total Turnover
As is represented by the results, the ANOVA test indicates that there is some degree of
significance for the number of doctors versus total turnover, as the F value is greater than
the test statistic and the p-value is significant at a level of .05 (p < .05). Thus, it is
considered to be significant. However, on analysis of the model summary in table 4.16,
the R-squared coefficient of determination is .091 and this would suggest that the number
of doctors in the area explains around 9% of the variation in turnover. This is relatively
small; as a result, it is more likely that this variable should be considered for a multiple
regression analysis.
The test for the location index below was found to not have a significant relationship with
turnover as the p-value is not less than .05 for the ANOVA test.
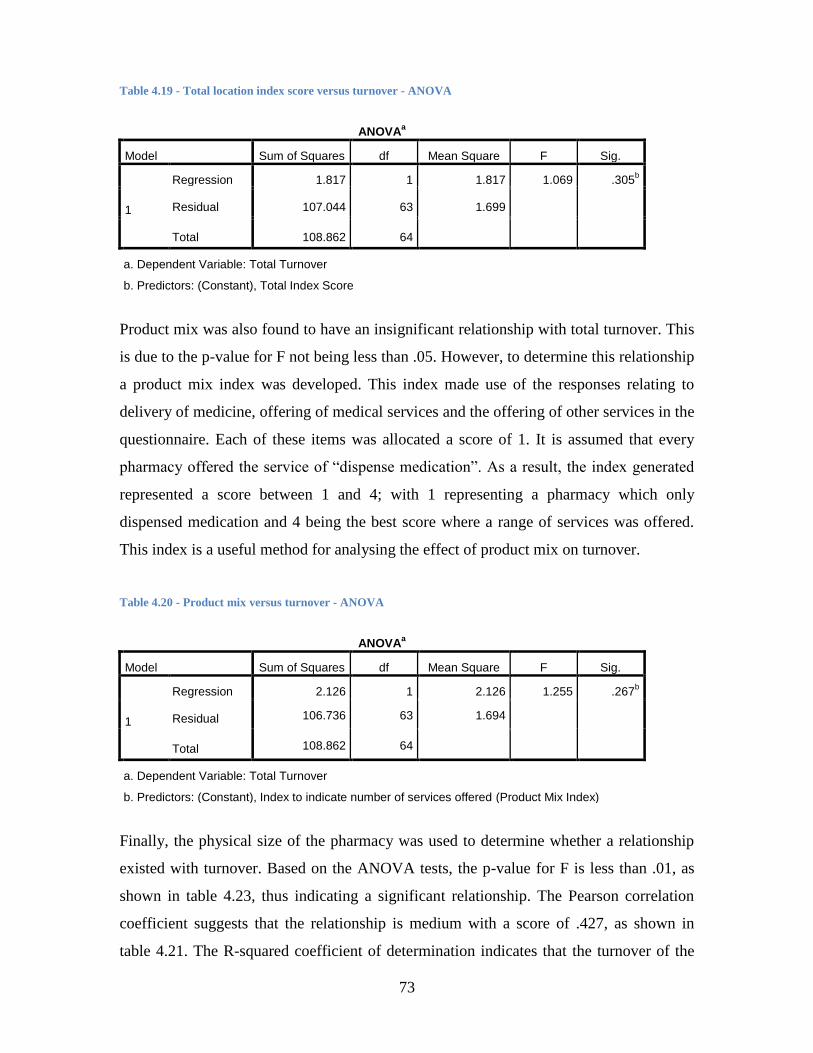
73
Table 4.19 - Total location index score versus turnover - ANOVA
ANOVAa
Model Sum of Squares df Mean Square F Sig.
1
Regression 1.817 1 1.817 1.069 .305b
Residual 107.044 63 1.699
Total 108.862 64
a. Dependent Variable: Total Turnover
b. Predictors: (Constant), Total Index Score
Product mix was also found to have an insignificant relationship with total turnover. This
is due to the p-value for F not being less than .05. However, to determine this relationship
a product mix index was developed. This index made use of the responses relating to
delivery of medicine, offering of medical services and the offering of other services in the
questionnaire. Each of these items was allocated a score of 1. It is assumed that every
pharmacy offered the service of “dispense medication”. As a result, the index generated
represented a score between 1 and 4; with 1 representing a pharmacy which only
dispensed medication and 4 being the best score where a range of services was offered.
This index is a useful method for analysing the effect of product mix on turnover.
Table 4.20 - Product mix versus turnover - ANOVA
ANOVAa
Model Sum of Squares df Mean Square F Sig.
1
Regression 2.126 1 2.126 1.255 .267b
Residual 106.736 63 1.694
Total 108.862 64
a. Dependent Variable: Total Turnover
b. Predictors: (Constant), Index to indicate number of services offered (Product Mix Index)
Finally, the physical size of the pharmacy was used to determine whether a relationship
existed with turnover. Based on the ANOVA tests, the p-value for F is less than .01, as
shown in table 4.23, thus indicating a significant relationship. The Pearson correlation
coefficient suggests that the relationship is medium with a score of .427, as shown in
table 4.21. The R-squared coefficient of determination indicates that the turnover of the
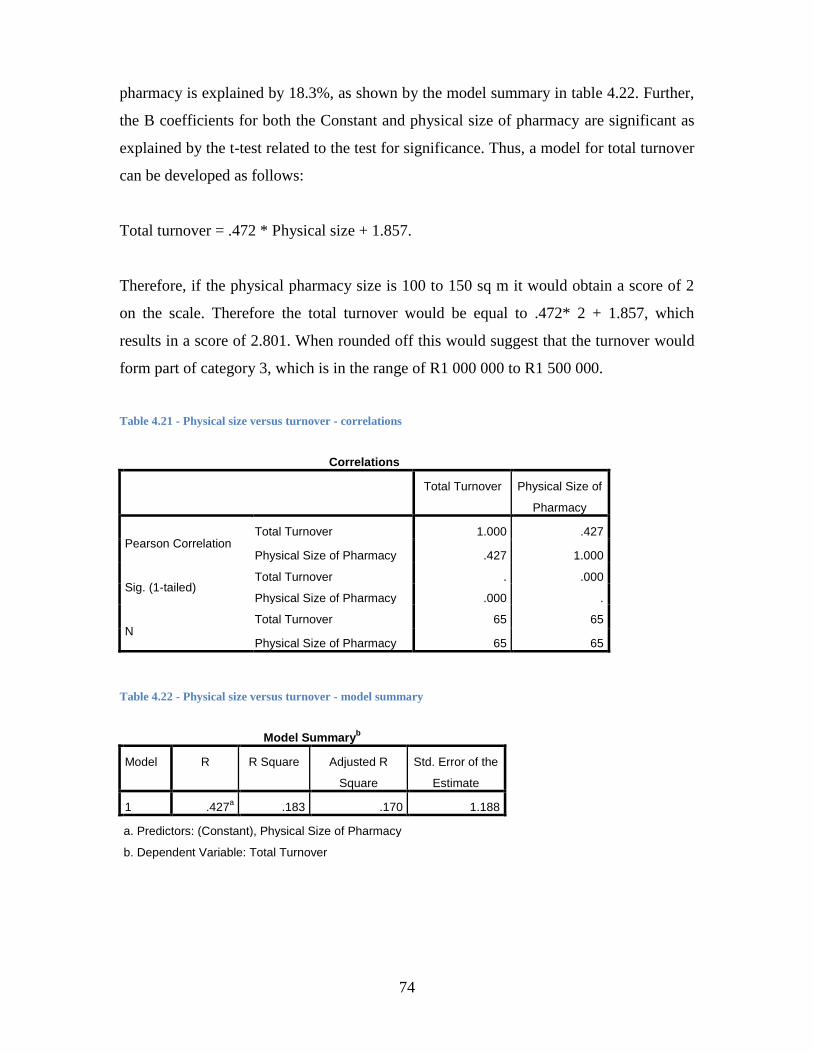
74
pharmacy is explained by 18.3%, as shown by the model summary in table 4.22. Further,
the B coefficients for both the Constant and physical size of pharmacy are significant as
explained by the t-test related to the test for significance. Thus, a model for total turnover
can be developed as follows:
Total turnover = .472 * Physical size + 1.857.
Therefore, if the physical pharmacy size is 100 to 150 sq m it would obtain a score of 2
on the scale. Therefore the total turnover would be equal to .472* 2 + 1.857, which
results in a score of 2.801. When rounded off this would suggest that the turnover would
form part of category 3, which is in the range of R1 000 000 to R1 500 000.
Table 4.21 - Physical size versus turnover - correlations
Correlations
Total Turnover Physical Size of
Pharmacy
Pearson Correlation Total Turnover 1.000 .427
Physical Size of Pharmacy .427 1.000
Sig. (1-tailed) Total Turnover . .000
Physical Size of Pharmacy .000 .
N Total Turnover 65 65
Physical Size of Pharmacy 65 65
Table 4.22 - Physical size versus turnover - model summary
Model Summaryb
Model R R Square Adjusted R
Square
Std. Error of the
Estimate
1 .427a .183 .170 1.188
a. Predictors: (Constant), Physical Size of Pharmacy
b. Dependent Variable: Total Turnover
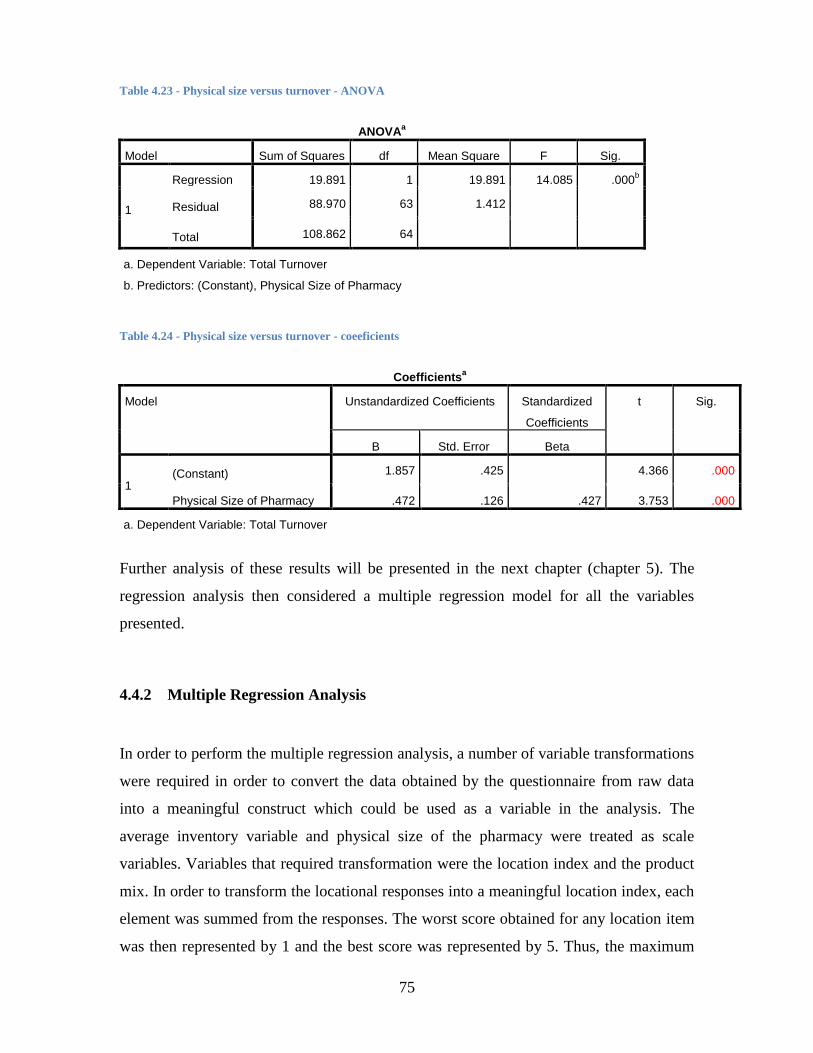
75
Table 4.23 - Physical size versus turnover - ANOVA
ANOVAa
Model Sum of Squares df Mean Square F Sig.
1
Regression 19.891 1 19.891 14.085 .000b
Residual 88.970 63 1.412
Total 108.862 64
a. Dependent Variable: Total Turnover
b. Predictors: (Constant), Physical Size of Pharmacy
Table 4.24 - Physical size versus turnover - coeeficients
Coefficientsa
Model Unstandardized Coefficients Standardized
Coefficients
t Sig.
B Std. Error Beta
1 (Constant) 1.857 .425 4.366 .000
Physical Size of Pharmacy .472 .126 .427 3.753 .000
a. Dependent Variable: Total Turnover
Further analysis of these results will be presented in the next chapter (chapter 5). The
regression analysis then considered a multiple regression model for all the variables
presented.
4.4.2 Multiple Regression Analysis
In order to perform the multiple regression analysis, a number of variable transformations
were required in order to convert the data obtained by the questionnaire from raw data
into a meaningful construct which could be used as a variable in the analysis. The
average inventory variable and physical size of the pharmacy were treated as scale
variables. Variables that required transformation were the location index and the product
mix. In order to transform the locational responses into a meaningful location index, each
element was summed from the responses. The worst score obtained for any location item
was then represented by 1 and the best score was represented by 5. Thus, the maximum
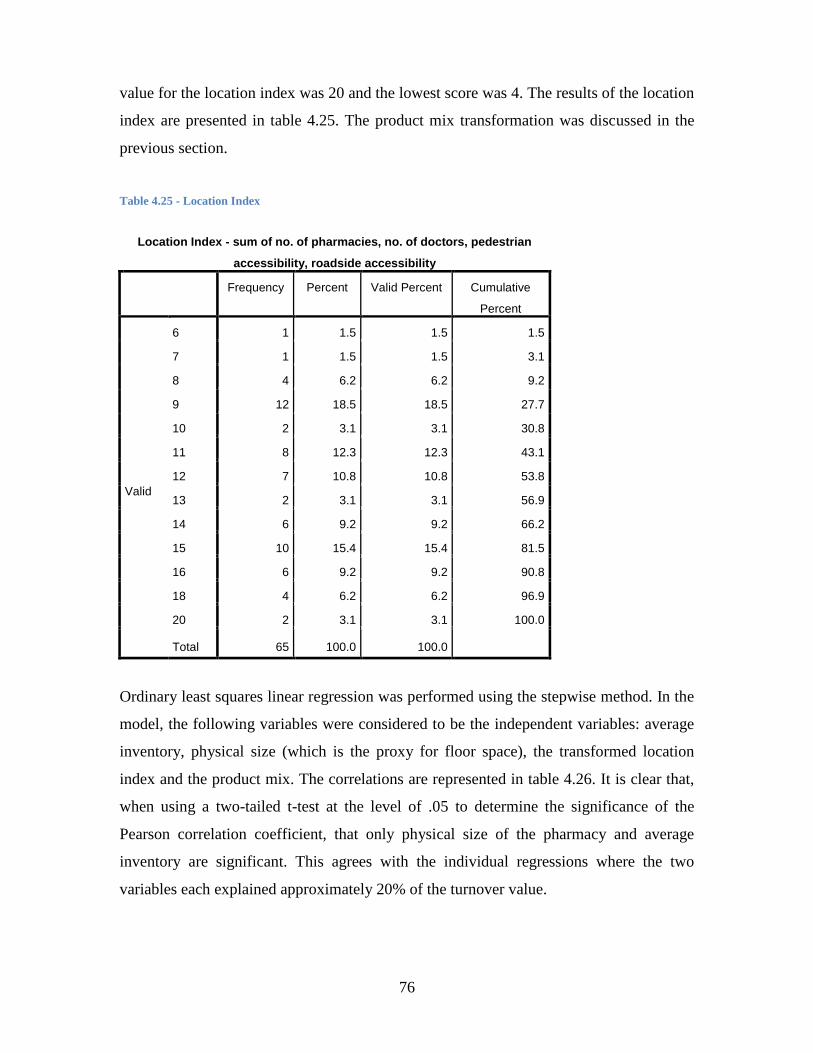
76
value for the location index was 20 and the lowest score was 4. The results of the location
index are presented in table 4.25. The product mix transformation was discussed in the
previous section.
Table 4.25 - Location Index
Location Index - sum of no. of pharmacies, no. of doctors, pedestrian
accessibility, roadside accessibility
Frequency Percent Valid Percent Cumulative
Percent
Valid
6 1 1.5 1.5 1.5
7 1 1.5 1.5 3.1
8 4 6.2 6.2 9.2
9 12 18.5 18.5 27.7
10 2 3.1 3.1 30.8
11 8 12.3 12.3 43.1
12 7 10.8 10.8 53.8
13 2 3.1 3.1 56.9
14 6 9.2 9.2 66.2
15 10 15.4 15.4 81.5
16 6 9.2 9.2 90.8
18 4 6.2 6.2 96.9
20 2 3.1 3.1 100.0
Total 65 100.0 100.0
Ordinary least squares linear regression was performed using the stepwise method. In the
model, the following variables were considered to be the independent variables: average
inventory, physical size (which is the proxy for floor space), the transformed location
index and the product mix. The correlations are represented in table 4.26. It is clear that,
when using a two-tailed t-test at the level of .05 to determine the significance of the
Pearson correlation coefficient, that only physical size of the pharmacy and average
inventory are significant. This agrees with the individual regressions where the two
variables each explained approximately 20% of the turnover value.
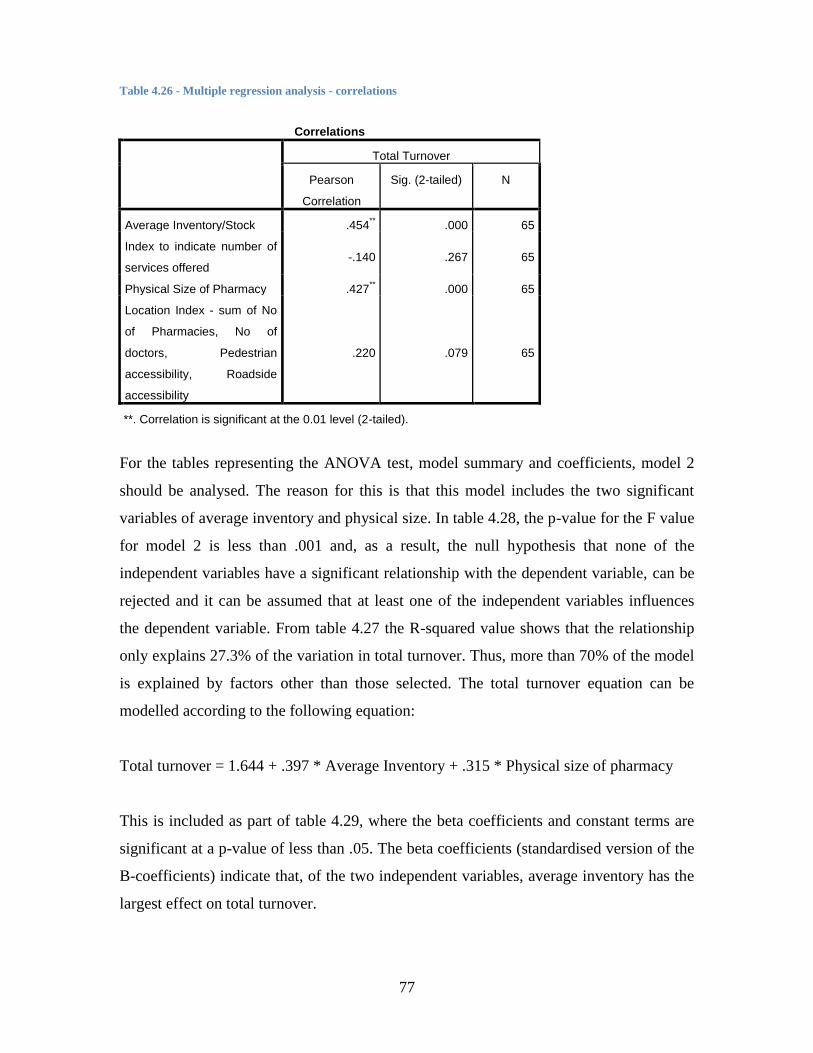
77
Table 4.26 - Multiple regression analysis - correlations
Correlations
Total Turnover
Pearson
Correlation
Sig. (2-tailed) N
Average Inventory/Stock .454** .000 65
Index to indicate number of
services offered -.140 .267 65
Physical Size of Pharmacy .427** .000 65
Location Index - sum of No
of Pharmacies, No of
doctors, Pedestrian
accessibility, Roadside
accessibility
.220 .079 65
**. Correlation is significant at the 0.01 level (2-tailed).
For the tables representing the ANOVA test, model summary and coefficients, model 2
should be analysed. The reason for this is that this model includes the two significant
variables of average inventory and physical size. In table 4.28, the p-value for the F value
for model 2 is less than .001 and, as a result, the null hypothesis that none of the
independent variables have a significant relationship with the dependent variable, can be
rejected and it can be assumed that at least one of the independent variables influences
the dependent variable. From table 4.27 the R-squared value shows that the relationship
only explains 27.3% of the variation in total turnover. Thus, more than 70% of the model
is explained by factors other than those selected. The total turnover equation can be
modelled according to the following equation:
Total turnover = 1.644 + .397 * Average Inventory + .315 * Physical size of pharmacy
This is included as part of table 4.29, where the beta coefficients and constant terms are
significant at a p-value of less than .05. The beta coefficients (standardised version of the
B-coefficients) indicate that, of the two independent variables, average inventory has the
largest effect on total turnover.
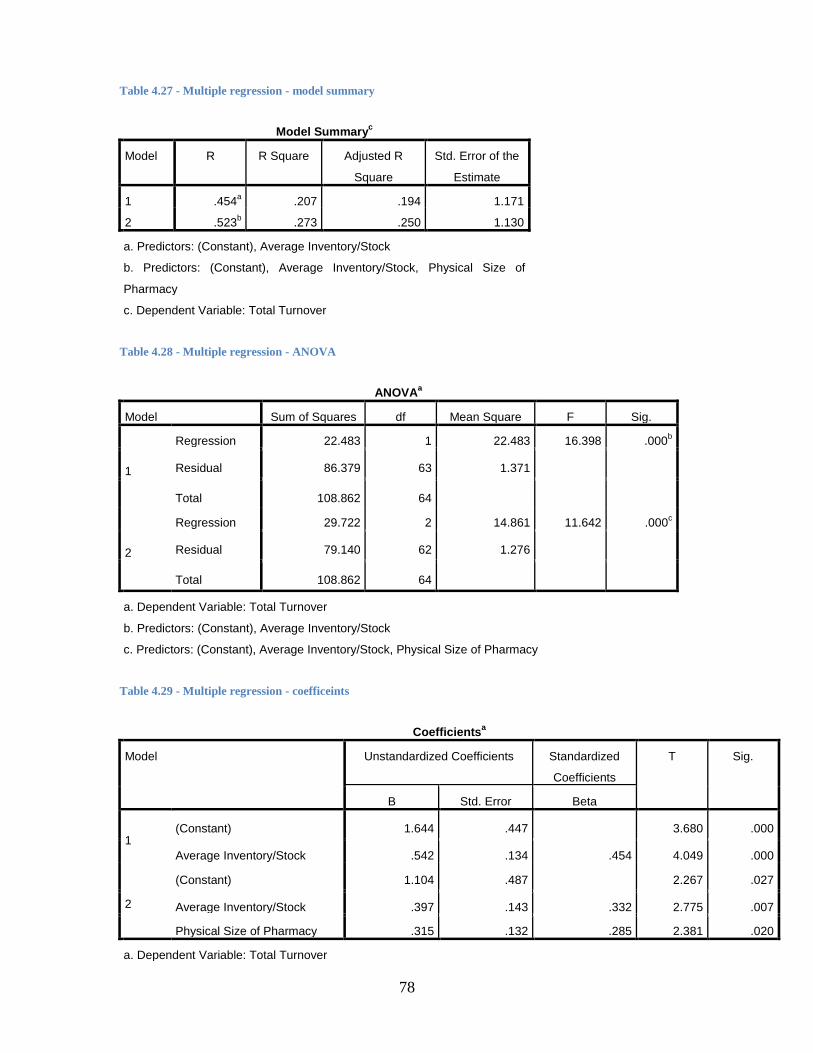
78
Table 4.27 - Multiple regression - model summary
Model Summaryc
Model R R Square Adjusted R
Square
Std. Error of the
Estimate
1 .454a .207 .194 1.171
2 .523b .273 .250 1.130
a. Predictors: (Constant), Average Inventory/Stock
b. Predictors: (Constant), Average Inventory/Stock, Physical Size of
Pharmacy
c. Dependent Variable: Total Turnover
Table 4.28 - Multiple regression - ANOVA
ANOVAa
Model Sum of Squares df Mean Square F Sig.
1
Regression 22.483 1 22.483 16.398 .000b
Residual 86.379 63 1.371
Total 108.862 64
2
Regression 29.722 2 14.861 11.642 .000c
Residual 79.140 62 1.276
Total 108.862 64
a. Dependent Variable: Total Turnover
b. Predictors: (Constant), Average Inventory/Stock
c. Predictors: (Constant), Average Inventory/Stock, Physical Size of Pharmacy
Table 4.29 - Multiple regression - coefficeints
Coefficientsa
Model Unstandardized Coefficients Standardized
Coefficients
T Sig.
B Std. Error Beta
1 (Constant) 1.644 .447
3.680 .000
Average Inventory/Stock .542 .134 .454 4.049 .000
2
(Constant) 1.104 .487
2.267 .027
Average Inventory/Stock .397 .143 .332 2.775 .007
Physical Size of Pharmacy .315 .132 .285 2.381 .020
a. Dependent Variable: Total Turnover
79
It should be mentioned that regression analysis was performed without generating the
location index. When this was performed, the significant variables were average
inventory and number of doctors, while physical size of pharmacy was no longer
significant. However, when analysing the R-squared value, the relationship was explained
by 27.8%, which is similar to the previous multiple regression model presented. This may
indicate an interaction relationship between the size of the pharmacy and the number of
doctors in the area.
CHi-squared Automatic Interaction Detection (CHAID) tree analysis was also used to
determine which variables are the most important in predicting total turnover. The
predictor values used in the analysis were physical size of pharmacy, physical size of
dispensary, number of doctors, number of pharmacies, location – pedestrian accessibility,
location – roadside accessibility, and average inventory/stock. From the decision tree
presented in figure 4.9 it is clear that only physical size of the pharmacy and number of
doctors discriminate with respect to the total turnover. If pharmacy size is either less than
100 m2 or larger than 200 m
2 and the number of doctors is more than five, then the
chances are, based on this sample, that this pharmacy has a total turnover of more than
R2 000 000.
However, there is a limitation inherent in this test owing to the sample size being fairly
small and the analysis not being able to extend further than three levels. Nevertheless, it
can be used to determine a model for turnover. This shows that the model is accurate
53.8% of the time overall when it is used to predict turnover. This is particularly so when
predicting the turnover category of R500 000 to R1 000 000 with an accuracy of 89.5%.
This is represented in table 4.30.
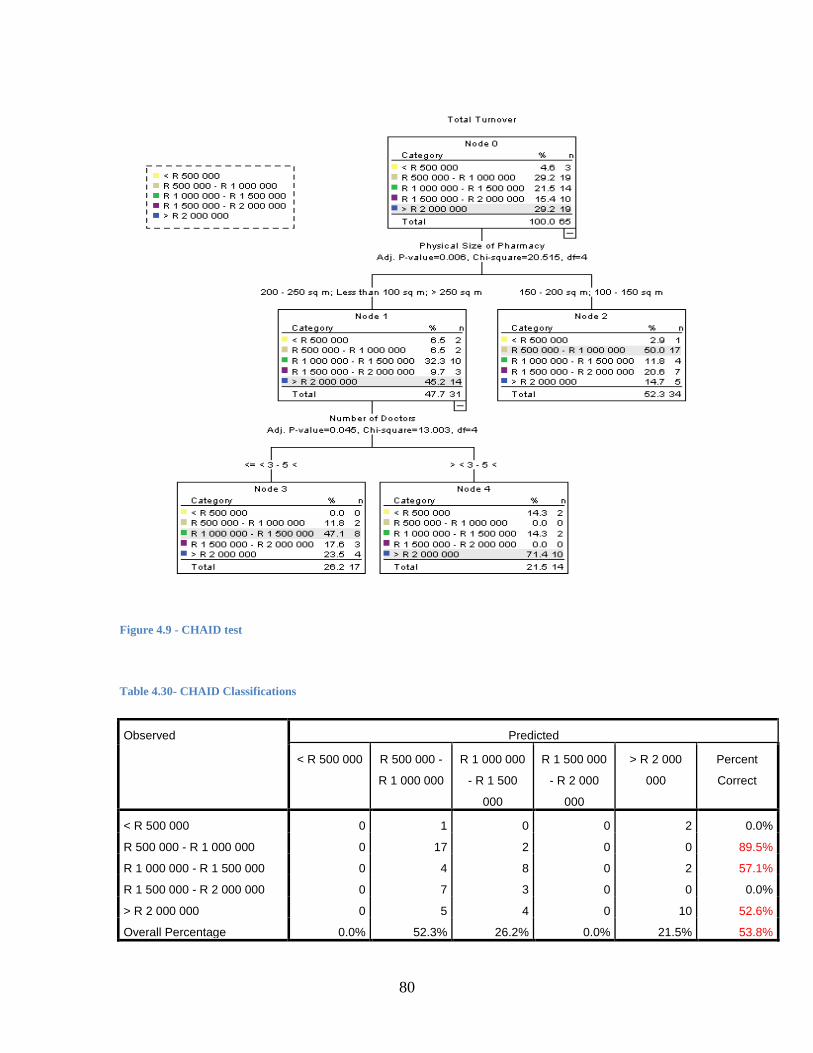
80
Figure 4.9 - CHAID test
Table 4.30- CHAID Classifications
Observed Predicted
< R 500 000 R 500 000 -
R 1 000 000
R 1 000 000
- R 1 500
000
R 1 500 000
- R 2 000
000
> R 2 000
000
Percent
Correct
< R 500 000 0 1 0 0 2 0.0%
R 500 000 - R 1 000 000 0 17 2 0 0 89.5%
R 1 000 000 - R 1 500 000 0 4 8 0 2 57.1%
R 1 500 000 - R 2 000 000 0 7 3 0 0 0.0%
> R 2 000 000 0 5 4 0 10 52.6%
Overall Percentage 0.0% 52.3% 26.2% 0.0% 21.5% 53.8%
81
This analysis further supports the existence of a relationship between the physical size of
the pharmacy and the number of doctors in the area, as both of these factors seem to
create distinct results relating to the prediction of the turnover of a pharmacy.
4.5 K-means cluster analysis
In an effort to classify the respondents into different competitiveness groups, a K-means
cluster analysis was performed using the four variables that measure how well placed a
pharmacy is in terms of the number of doctors and other pharmacies in the vicinity, as
well as its accessibility in terms of pedestrians and roadside access. The variables were
measured using a five-point scale with the higher values corresponding with low levels of
competition and high levels of accessibility. In the cluster analysis a four-cluster solution
was used as this closely represents the location index value that has been generated. The
central values of the final cluster for each of the four clustering variables are listed in
table 4.31. These four clusters were characterised by making inter-cluster centroid value
comparisons for each of the different situational variables and also comparing all centroid
values to the overall mean situational values.
4.5.1 Low competition/good accessibility
A pharmacy that falls into this cluster is a pharmacy surrounded by very few pharmacies
(low competition) and many doctors (density). The accessibility of these stores was
relatively good, as they are positioned in a mall or shopping complex and these are
usually located on main roads, resulting in good traffic passing by.
82
4.5.2 High competition/poor accessibility
In a region where high competition/poor accessibility exists, the pharmacy is subject to a
high degree of competition with a number of pharmacies and the number of doctors is
low. The accessibility of these stores is also the lowest.
4.5.3 High competition/good accessibility
Survival within this group, high competition/good accessibility, requires a high degree of
accessibility. This is because there are a number of other pharmacies in the area
(competition). However, there are few source providers of scripts in this sub-group.
Therefore, success is due to the fact that there is a high level of traffic via roadside
accessibility as well as pedestrian accessibility.
4.5.4 Low competition/good pedestrian accessibility/poor roadside accessibility
In this cluster, low competition/good pedestrian accessibility/poor roadside accessibility,
a pharmacy has very few competitors as the number of pharmacies in the region is low.
There was also a score relating to the number of doctors in the region and only a single
accessibility variable is seen to positively affect this group, that is, good pedestrian
accessibility.
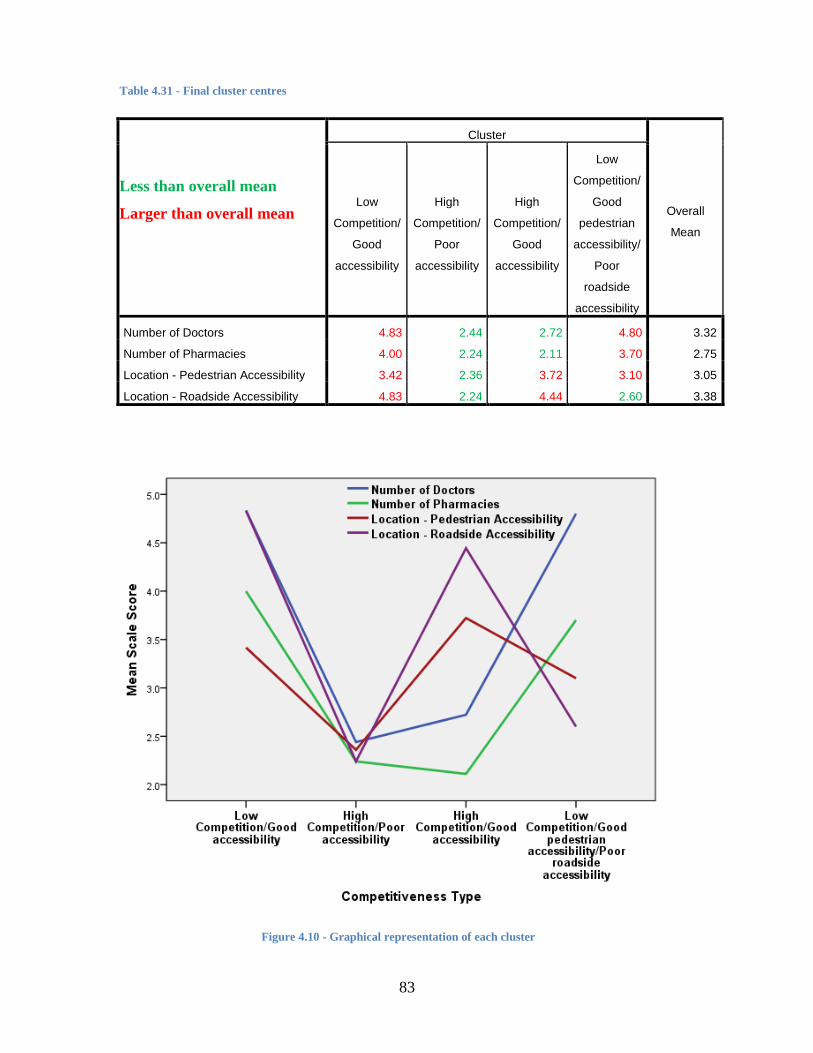
83
Table 4.31 - Final cluster centres
Less than overall mean
Larger than overall mean
Cluster
Overall
Mean
Low
Competition/
Good
accessibility
High
Competition/
Poor
accessibility
High
Competition/
Good
accessibility
Low
Competition/
Good
pedestrian
accessibility/
Poor
roadside
accessibility
Number of Doctors 4.83 2.44 2.72 4.80 3.32
Number of Pharmacies 4.00 2.24 2.11 3.70 2.75
Location - Pedestrian Accessibility 3.42 2.36 3.72 3.10 3.05
Location - Roadside Accessibility 4.83 2.24 4.44 2.60 3.38
Figure 4.10 - Graphical representation of each cluster
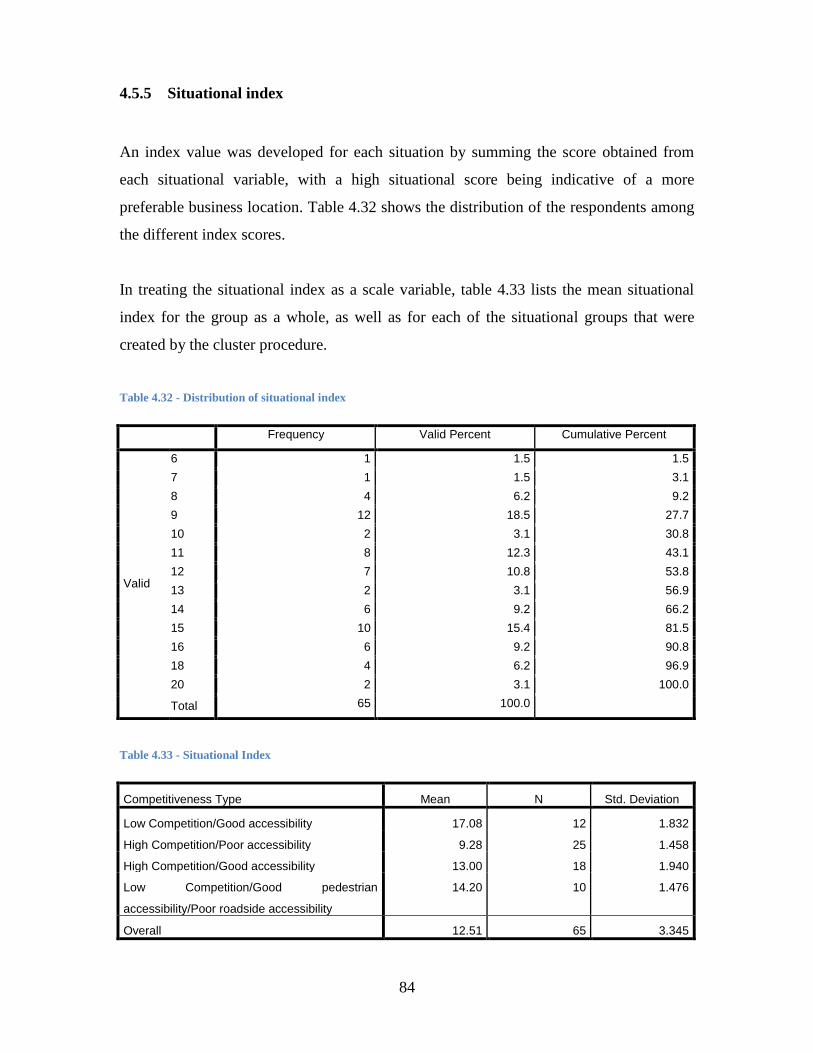
84
4.5.5 Situational index
An index value was developed for each situation by summing the score obtained from
each situational variable, with a high situational score being indicative of a more
preferable business location. Table 4.32 shows the distribution of the respondents among
the different index scores.
In treating the situational index as a scale variable, table 4.33 lists the mean situational
index for the group as a whole, as well as for each of the situational groups that were
created by the cluster procedure.
Table 4.32 - Distribution of situational index
Frequency Valid Percent Cumulative Percent
Valid
6 1 1.5 1.5
7 1 1.5 3.1
8 4 6.2 9.2
9 12 18.5 27.7
10 2 3.1 30.8
11 8 12.3 43.1
12 7 10.8 53.8
13 2 3.1 56.9
14 6 9.2 66.2
15 10 15.4 81.5
16 6 9.2 90.8
18 4 6.2 96.9
20 2 3.1 100.0
Total 65 100.0
Table 4.33 - Situational Index
Competitiveness Type Mean N Std. Deviation
Low Competition/Good accessibility 17.08 12 1.832
High Competition/Poor accessibility 9.28 25 1.458
High Competition/Good accessibility 13.00 18 1.940
Low Competition/Good pedestrian
accessibility/Poor roadside accessibility
14.20 10 1.476
Overall 12.51 65 3.345
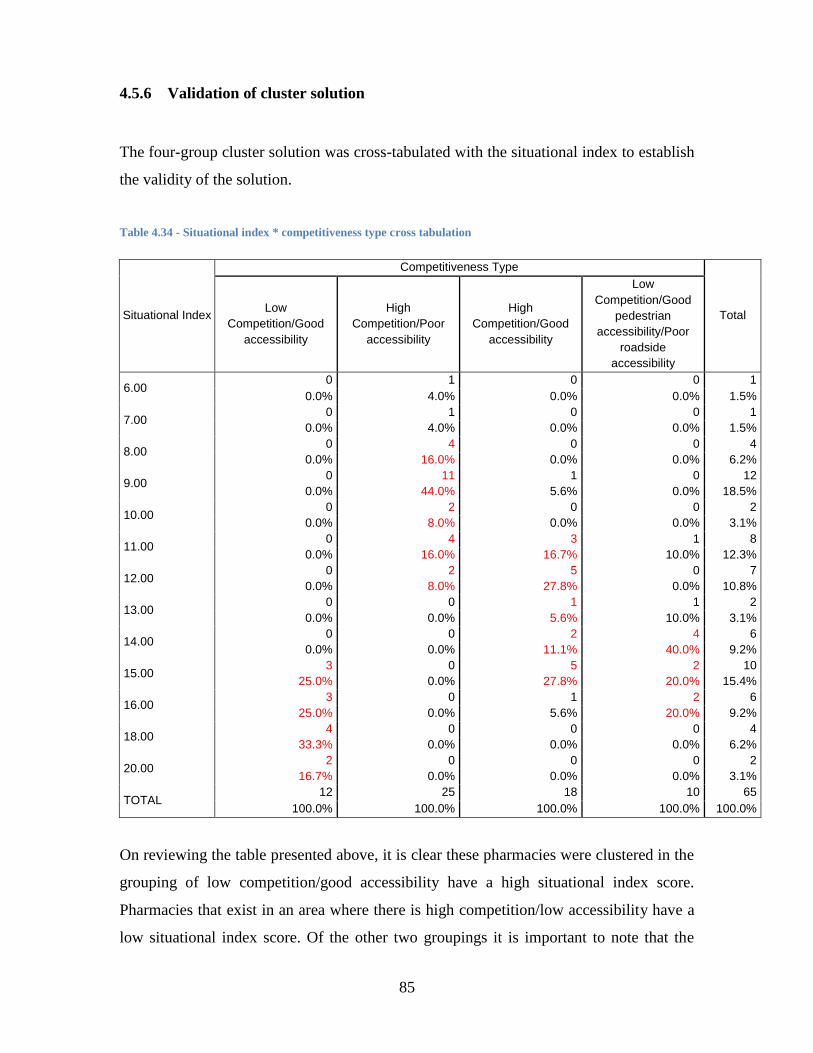
85
4.5.6 Validation of cluster solution
The four-group cluster solution was cross-tabulated with the situational index to establish
the validity of the solution.
Table 4.34 - Situational index * competitiveness type cross tabulation
Situational Index
Competitiveness Type
Total Low
Competition/Good
accessibility
High
Competition/Poor
accessibility
High
Competition/Good
accessibility
Low
Competition/Good
pedestrian
accessibility/Poor
roadside
accessibility
6.00 0 1 0 0 1
0.0% 4.0% 0.0% 0.0% 1.5%
7.00 0 1 0 0 1
0.0% 4.0% 0.0% 0.0% 1.5%
8.00 0 4 0 0 4
0.0% 16.0% 0.0% 0.0% 6.2%
9.00 0 11 1 0 12
0.0% 44.0% 5.6% 0.0% 18.5%
10.00 0 2 0 0 2
0.0% 8.0% 0.0% 0.0% 3.1%
11.00 0 4 3 1 8
0.0% 16.0% 16.7% 10.0% 12.3%
12.00 0 2 5 0 7
0.0% 8.0% 27.8% 0.0% 10.8%
13.00 0 0 1 1 2
0.0% 0.0% 5.6% 10.0% 3.1%
14.00 0 0 2 4 6
0.0% 0.0% 11.1% 40.0% 9.2%
15.00 3 0 5 2 10
25.0% 0.0% 27.8% 20.0% 15.4%
16.00 3 0 1 2 6
25.0% 0.0% 5.6% 20.0% 9.2%
18.00 4 0 0 0 4
33.3% 0.0% 0.0% 0.0% 6.2%
20.00 2 0 0 0 2
16.7% 0.0% 0.0% 0.0% 3.1%
TOTAL 12 25 18 10 65
100.0% 100.0% 100.0% 100.0% 100.0%
On reviewing the table presented above, it is clear these pharmacies were clustered in the
grouping of low competition/good accessibility have a high situational index score.
Pharmacies that exist in an area where there is high competition/low accessibility have a
low situational index score. Of the other two groupings it is important to note that the
86
pharmacies that have low competition have a better situational index than pharmacies that
have higher competition but good accessibility. Further analysis will be presented in the
next chapter.
4.6 Group type tests
An analysis of groups and regions was performed to identify whether there were any
variables within these subdivisions that may indicate the existence of a relationship based
on geographical location or whether a pharmacy forms part of a corporate group or is an
independent pharmacy. Accordingly, chi square tests and t-tests were performed on the
groups in order to identify any significant relationships. For the regional tests, chi square
tests and ANOVA were used together with the associated tests for homogeneity.
4.6.1 Group tests
From the chi square tests that were performed, only three adhered to the inherent
assumption of the chi square test that at least 80% of the cells must have an expected
value of more than 5, as presented in table 4.35. It is clear that only one of these questions
resulted in a significant value where the p-value was less than .01. This relates to
advertising. As a result, it was found that pharmacies that form part of a corporate group
are more likely to advertise than independent pharmacies.
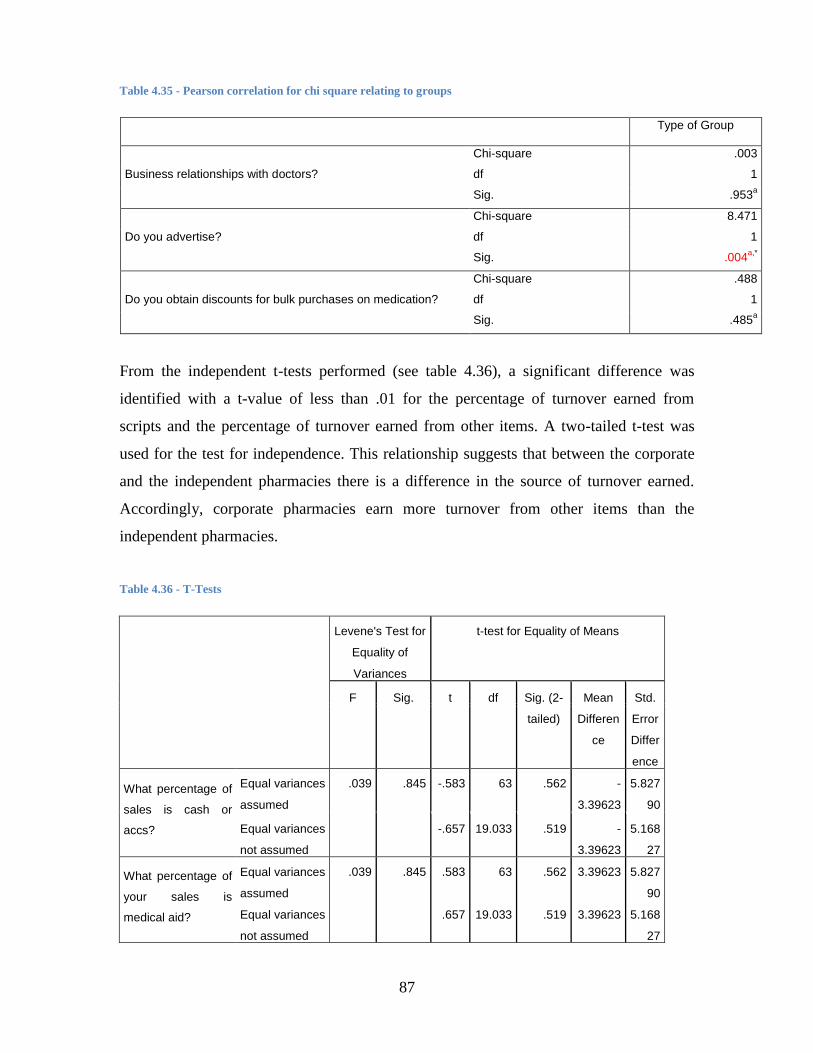
87
Table 4.35 - Pearson correlation for chi square relating to groups
Type of Group
Business relationships with doctors?
Chi-square .003
df 1
Sig. .953a
Do you advertise?
Chi-square 8.471
df 1
Sig. .004a,*
Do you obtain discounts for bulk purchases on medication?
Chi-square .488
df 1
Sig. .485a
From the independent t-tests performed (see table 4.36), a significant difference was
identified with a t-value of less than .01 for the percentage of turnover earned from
scripts and the percentage of turnover earned from other items. A two-tailed t-test was
used for the test for independence. This relationship suggests that between the corporate
and the independent pharmacies there is a difference in the source of turnover earned.
Accordingly, corporate pharmacies earn more turnover from other items than the
independent pharmacies.
Table 4.36 - T-Tests
Levene's Test for
Equality of
Variances
t-test for Equality of Means
F Sig. t df Sig. (2-
tailed)
Mean
Differen
ce
Std.
Error
Differ
ence
What percentage of
sales is cash or
accs?
Equal variances
assumed
.039 .845 -.583 63 .562 -
3.39623
5.827
90
Equal variances
not assumed
-.657 19.033 .519 -
3.39623
5.168
27
What percentage of
your sales is
medical aid?
Equal variances
assumed
.039 .845 .583 63 .562 3.39623 5.827
90
Equal variances
not assumed
.657 19.033 .519 3.39623 5.168
27
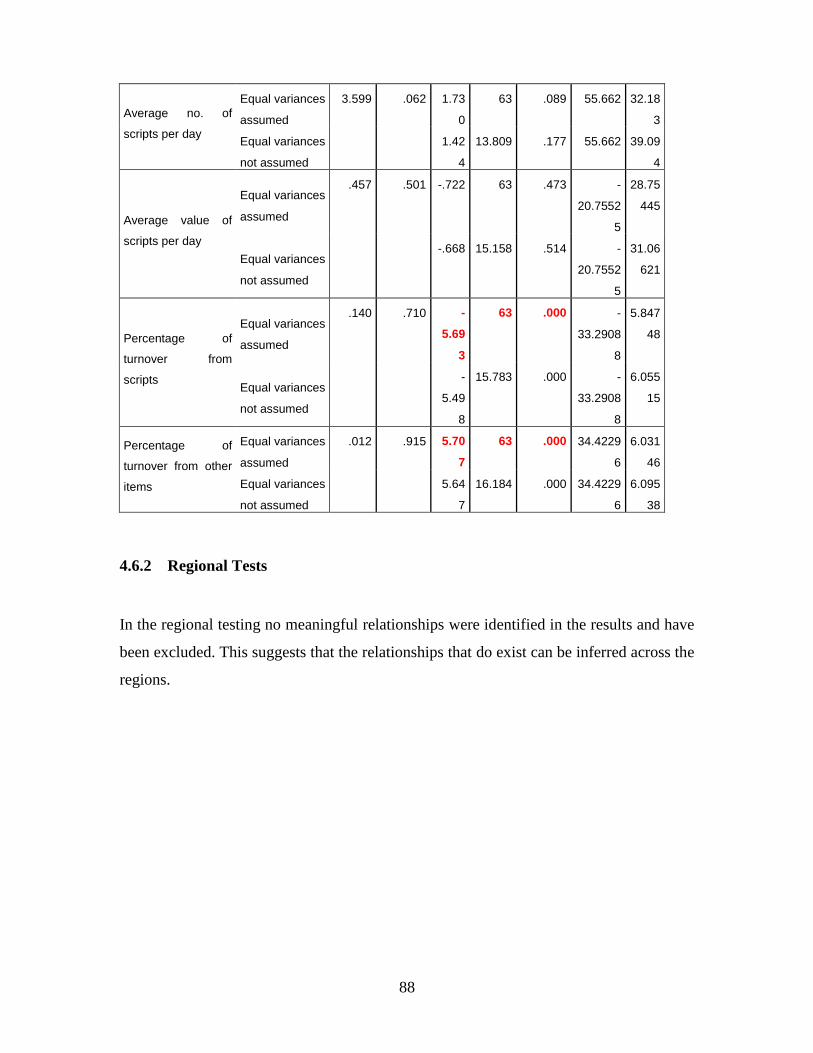
88
Average no. of
scripts per day
Equal variances
assumed
3.599 .062 1.73
0
63 .089 55.662 32.18
3
Equal variances
not assumed
1.42
4
13.809 .177 55.662 39.09
4
Average value of
scripts per day
Equal variances
assumed
.457 .501 -.722 63 .473 -
20.7552
5
28.75
445
Equal variances
not assumed
-.668 15.158 .514 -
20.7552
5
31.06
621
Percentage of
turnover from
scripts
Equal variances
assumed
.140 .710 -
5.69
3
63 .000 -
33.2908
8
5.847
48
Equal variances
not assumed
-
5.49
8
15.783 .000 -
33.2908
8
6.055
15
Percentage of
turnover from other
items
Equal variances
assumed
.012 .915 5.70
7
63 .000 34.4229
6
6.031
46
Equal variances
not assumed
5.64
7
16.184 .000 34.4229
6
6.095
38
4.6.2 Regional Tests
In the regional testing no meaningful relationships were identified in the results and have
been excluded. This suggests that the relationships that do exist can be inferred across the
regions.
89
5 Interpretation of Results
5.1 Introduction
The results presented in the previous chapter provide information; however, without an
interpretation of these results, usefulness would be limited. This chapter will thus provide
a deeper explanation of these results by comparing them with the hypotheses proposed in
chapter 2. This comparison will determine whether the results found support the
hypotheses proposed, with each hypothesis being considered individually. Where the
evidence in support of a hypothesis is weak or contradictory, possible reasons will be
provided.
5.2 Testing of hypotheses
The hypotheses developed in chapter 2 were split into different groupings and this
chapter will analyse the results according to those groupings. Each grouping will present
a number of hypotheses and the subsequent analysis of their validity.
5.2.1 Average inventory holding
In terms of average inventory holding the following research hypotheses were developed:
H1a: Does the average inventory holding affect the profitability of pharmacies
(profit = f (ave. inventory holding))?
H1b: Does the use information technology affect the average inventory
holding (average inventory holding = f (information technology))?
90
H1c: Do prescribing patterns and purchasing patterns affect the average
inventory holding (average inventory holding = f (purchasing or prescribing
patterns))?
To analyse the first hypothesis, ordinary least squares regression was used. Thus, in
relation to H1a it was found that a relationship appears to exist where average inventory
holding has a relationship with turnover and, as a result, is a factor of profitability. This
relationship explains around 20% of relationship with profit and was explained through
the R-squared coefficient of determination. The Pearson correlation suggests that a
medium relationship exists with a value of .454. There is further support for this
relationship in the fact that during the multiple regression analysis, average inventory was
again identified as a key factor that explained the relationship between the factors and
profit, with the relationship being a positive linear relationship.
However, increasing inventory does not suggest that there will be an increase of profit
indefinitely. This is due to the EOQ model, which suggests that there are costs associated
with holding inventory. These costs may eventually lead to a decrease in profit over time.
As a result, there is an optimal inventory holding point. Both of these concepts are
supported in the literature where inventory is a predictor of sales (Dubelaar et al., 2001)
and there is an optimal point for inventory (Alfares, 2007; Min, 1992; Pando et al., 2012;
Sarkar et al., 2013). The results of this study do not differ from the literature related to
this topic. Thus, the finding presented builds on the current literature in this area and
specifically relates to the profitability of pharmacies. It can therefore be concluded that a
pharmacy should consider its average inventory holding when considering ways in which
to improve its profitability.
With regard to H1b, it appears from the data presented that all pharmacies utilise
information technology, with 92.3% of pharmacies making use of this technology to
manage stock levels. As a result, it could be said that information technology is a factor
of average inventory holding. The extent of the relationship and whether it is a main
driver in the relationship has not been specifically considered in this research paper.
However, as it is being utilised by such a high percentage of pharmacies to manage stock,
91
pharmacies that do not manage their stock in this way could consider whether there is any
benefit to be obtained from managing stock in this way. Although this study did not
explicitly determine whether information technology affects average inventory holding,
there is evidence that exists to support this notion. This also supports prior research which
concluded that pharmacies could look to cut costs using this technology (Akan et al.,
2006; Dubelaar et al., 2001). Further, the use of sales data also provides a competitive
advantage as was shown in Japan (Hamuro et al., 1998). There appears to be evidence
from this study that supports this theory.
From the results presented, 92.3% of pharmacies carry stock in line with their patient
patterns. This relationship appears logical owing to the fact that a patient often remains
with a pharmacy their entire life (Pioch & Schmidt, 2001). Furthermore, if a patient
obtains chronic medication, their prescription is linked to a specific pharmacy and thus
the pharmacy can predict the stock required to service their regular customers. The extent
to which this relationship affects average inventory was not tested in the hypothesis.
In addition, it was found that 95.6% of pharmacists carried stock in relation to the
prescribing patterns of the doctors in the area, although just less than 70% stated that such
a relationship with their doctors existed. It appears that the pharmacies that do not carry
stock in this way should attempt to determine whether such a relationship exists. This can
be done by using information technology. The notion that there is a set of prescribing
patterns is supported by the literature, which states that, in Germany, patients remain with
their doctors for their entire life (Pioch & Schmidt, 2001). Thus, it could be said that if a
patient remains with their doctor for their entire life and the pharmacies in South Africa
have identified that they carry stock in relation to patient patterns, by inference there
exists a relationship with the prescribing patterns of doctors. Therefore, the pharmacies
that do not carry stock in relation to the prescribing pattern of doctors may be able to
manage their stock holding more efficiently if they attempted to determine whether such
a relationship exists for their pharmacy by mining their pharmacy data (Hamuro et al.,
1998). Accordingly, in relation to H1c there appears to be evidence to support the idea
that the prescribing patterns of doctors and the purchasing patterns of patients influence
92
average stock holding. Again, the research paper did not attempt to determine the level of
relationship that exists.
As a result the following can be concluded:
H1a: Average inventory holding appears to affect the profitability of
pharmacies (profit = f (ave inventory holding))
H1b: The use of information technology appears to affect the average
inventory holding (average inventory holding = f (information technology))
H1c: Prescribing patterns and purchasing patterns appears to affect the
average inventory holding (average inventory holding = f (purchasing or
prescribing patterns))
5.2.2 Product mix
H2a: Does the sale of non-medical items affect the profitability of pharmacies
(profit = f (non-medical items))?
H2b: Does advertising affect the number of items sold (number of items sold =
f (advertising))?
H2c: Does other services affect the number of items sold (number of items
sold = f (other services))?
H2d: Does customer loyalty affect the number of items sold (number of items
sold = f (customer loyalty))?
H2e: Does buyer groups affect the cost of goods sold (cost of goods sold = f
(buyer groups))?
To test H2a a product index was used. It was assumed that all pharmacies fill scripts and
this enabled all pharmacies to be provided with a score of 1. Each of the following three
other products were also allocated a score of 1: delivery service, other medical services
such as blood pressure and other services such as ear piercings. In performing the
regression analysis, the relationship identified was insignificant. The F-value was 1.255
and the p-value was equal to .276, which suggests that there is no relationship. The
93
sample for this does not appear to support the hypothesis suggested in the retail literature,
however, which suggests that there is a competitive advantage to be obtained by selling
other services provided they are related (Palepu, 1985).
Furthermore, benefit has been seen in major retailing organisations providing one-stop
shopping destinations (Messinger & Narasimhan, 1997). In South Africa a pharmacy is
not a one-stop destination, as even the major corporate bodies such as Clicks and Dis-
chem focus mainly on medical and health products, with neither operating as a major
retailer as referred to by Messinger (1997). However, on analysis of the group tests it
appears that corporate pharmacies do generate higher turnover from non-medical items
than the independent pharmacies. This does not, however, necessarily create a sufficient
plausible relationship in terms of which non-medical items have an effect on profit.
Accordingly, an area for future research could be to determine whether non-medical
items are a factor for corporate groups. It would appear that no plausible relationship
exists between the sale of non-medical products and pharmacy profitability.
The marketing literature suggests that advertising can be used to influence customers’
perceptions in order to encourage them to purchase a particular product. Advertising has
influenced the level and type of product selected for advertising in a store flyer
(Gijsbrechts et al., 2003). Thus, marketing would appear to have an impact on the number
of goods sold and, in turn, the number of items sold has a direct impact on the profit of
the entity. Thus, H2b attempted to determine whether advertising was an important factor
in generating sales in the pharmacy industry. However, a chi square test could not be
performed on the data owing to the underlying assumption of the chi square not being
fulfilled. This assumption is that 80% of the cells need to have an expected count of more
than 5. However, in table 5.1 the services offered were cross-tabulated with the responses
to the question, “Do you advertise?”.
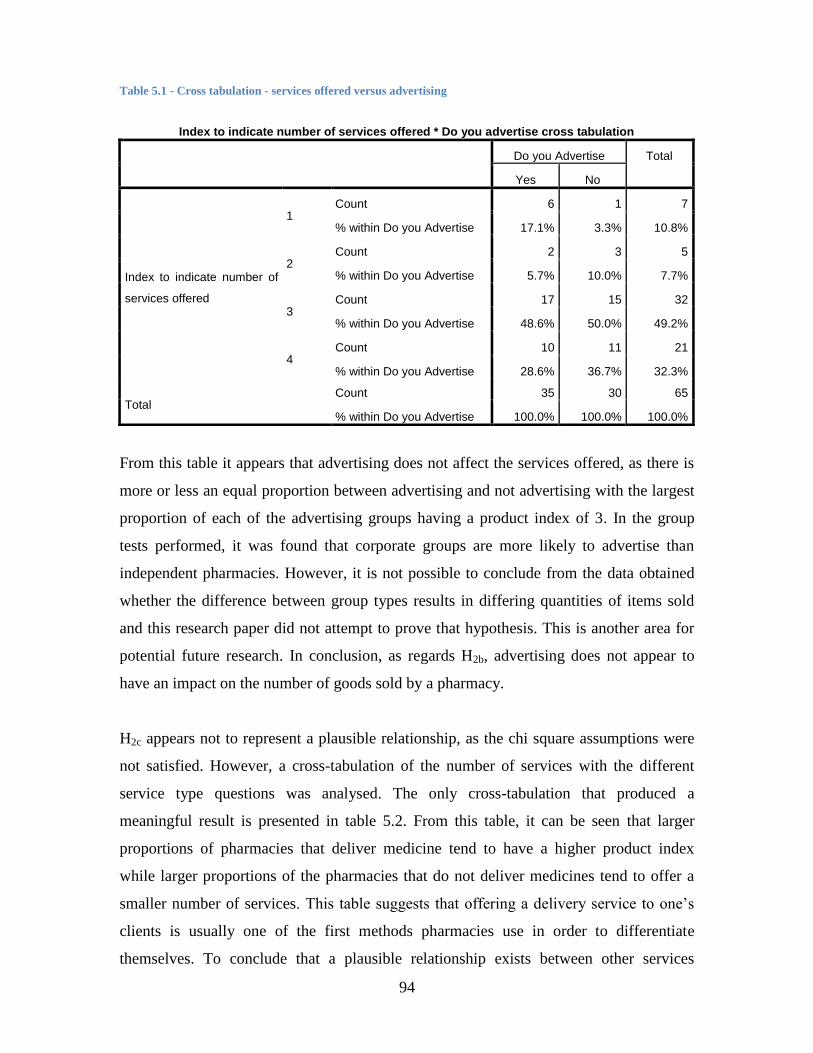
94
Table 5.1 - Cross tabulation - services offered versus advertising
Index to indicate number of services offered * Do you advertise cross tabulation
Do you Advertise Total
Yes No
Index to indicate number of
services offered
1 Count 6 1 7
% within Do you Advertise 17.1% 3.3% 10.8%
2 Count 2 3 5
% within Do you Advertise 5.7% 10.0% 7.7%
3 Count 17 15 32
% within Do you Advertise 48.6% 50.0% 49.2%
4 Count 10 11 21
% within Do you Advertise 28.6% 36.7% 32.3%
Total Count 35 30 65
% within Do you Advertise 100.0% 100.0% 100.0%
From this table it appears that advertising does not affect the services offered, as there is
more or less an equal proportion between advertising and not advertising with the largest
proportion of each of the advertising groups having a product index of 3. In the group
tests performed, it was found that corporate groups are more likely to advertise than
independent pharmacies. However, it is not possible to conclude from the data obtained
whether the difference between group types results in differing quantities of items sold
and this research paper did not attempt to prove that hypothesis. This is another area for
potential future research. In conclusion, as regards H2b, advertising does not appear to
have an impact on the number of goods sold by a pharmacy.
H2c appears not to represent a plausible relationship, as the chi square assumptions were
not satisfied. However, a cross-tabulation of the number of services with the different
service type questions was analysed. The only cross-tabulation that produced a
meaningful result is presented in table 5.2. From this table, it can be seen that larger
proportions of pharmacies that deliver medicine tend to have a higher product index
while larger proportions of the pharmacies that do not deliver medicines tend to offer a
smaller number of services. This table suggests that offering a delivery service to one’s
clients is usually one of the first methods pharmacies use in order to differentiate
themselves. To conclude that a plausible relationship exists between other services
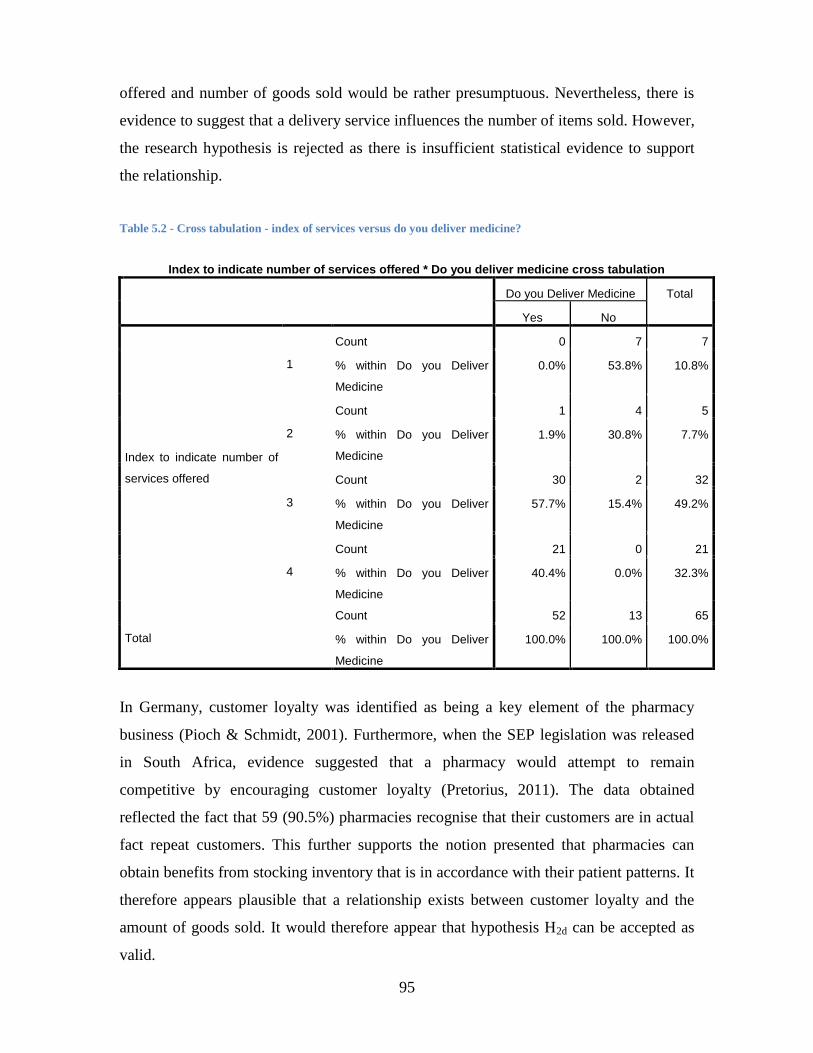
95
offered and number of goods sold would be rather presumptuous. Nevertheless, there is
evidence to suggest that a delivery service influences the number of items sold. However,
the research hypothesis is rejected as there is insufficient statistical evidence to support
the relationship.
Table 5.2 - Cross tabulation - index of services versus do you deliver medicine?
Index to indicate number of services offered * Do you deliver medicine cross tabulation
Do you Deliver Medicine Total
Yes No
Index to indicate number of
services offered
1
Count 0 7 7
% within Do you Deliver
Medicine
0.0% 53.8% 10.8%
2
Count 1 4 5
% within Do you Deliver
Medicine
1.9% 30.8% 7.7%
3
Count 30 2 32
% within Do you Deliver
Medicine
57.7% 15.4% 49.2%
4
Count 21 0 21
% within Do you Deliver
Medicine
40.4% 0.0% 32.3%
Total
Count 52 13 65
% within Do you Deliver
Medicine
100.0% 100.0% 100.0%
In Germany, customer loyalty was identified as being a key element of the pharmacy
business (Pioch & Schmidt, 2001). Furthermore, when the SEP legislation was released
in South Africa, evidence suggested that a pharmacy would attempt to remain
competitive by encouraging customer loyalty (Pretorius, 2011). The data obtained
reflected the fact that 59 (90.5%) pharmacies recognise that their customers are in actual
fact repeat customers. This further supports the notion presented that pharmacies can
obtain benefits from stocking inventory that is in accordance with their patient patterns. It
therefore appears plausible that a relationship exists between customer loyalty and the
amount of goods sold. It would therefore appear that hypothesis H2d can be accepted as
valid.
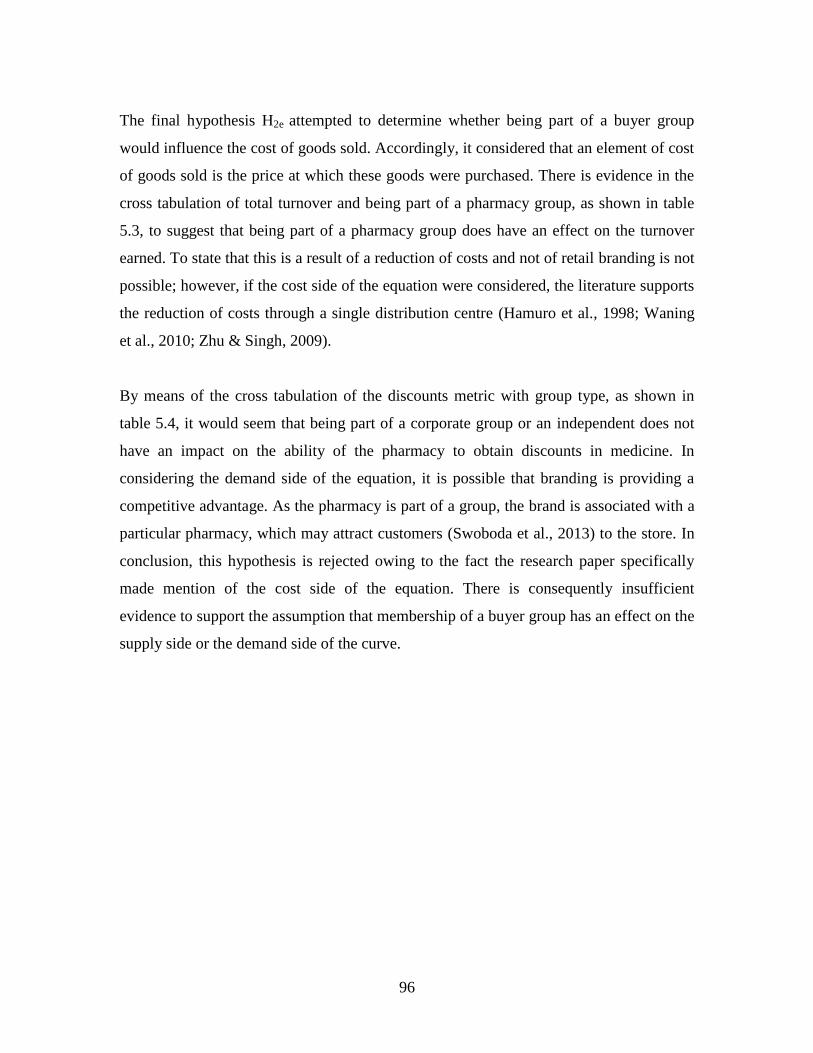
96
The final hypothesis H2e attempted to determine whether being part of a buyer group
would influence the cost of goods sold. Accordingly, it considered that an element of cost
of goods sold is the price at which these goods were purchased. There is evidence in the
cross tabulation of total turnover and being part of a pharmacy group, as shown in table
5.3, to suggest that being part of a pharmacy group does have an effect on the turnover
earned. To state that this is a result of a reduction of costs and not of retail branding is not
possible; however, if the cost side of the equation were considered, the literature supports
the reduction of costs through a single distribution centre (Hamuro et al., 1998; Waning
et al., 2010; Zhu & Singh, 2009).
By means of the cross tabulation of the discounts metric with group type, as shown in
table 5.4, it would seem that being part of a corporate group or an independent does not
have an impact on the ability of the pharmacy to obtain discounts in medicine. In
considering the demand side of the equation, it is possible that branding is providing a
competitive advantage. As the pharmacy is part of a group, the brand is associated with a
particular pharmacy, which may attract customers (Swoboda et al., 2013) to the store. In
conclusion, this hypothesis is rejected owing to the fact the research paper specifically
made mention of the cost side of the equation. There is consequently insufficient
evidence to support the assumption that membership of a buyer group has an effect on the
supply side or the demand side of the curve.
97
Table 5.3 - Cross tabulation - total turnover versus pharmacy group
Total * Do you form part of the pharmacy group cross tabulation
Do you Form Part of the Pharmacy
Group
Total
Yes No N/A
Total
Turnover
< R 500 000
Count 2 1 0 3
% within Do you Form
Part of the Pharmacy
Group
4.3% 5.9% 0.0% 4.6%
R 500 000 - R 1 000
000
Count 14 4 1 19
% within Do you Form
Part of the Pharmacy
Group
29.8% 23.5% 100.0% 29.2%
R 1 000 000 - R 1 500
000
Count 9 5 0 14
% within Do you Form
Part of the Pharmacy
Group
19.1% 29.4% 0.0% 21.5%
R 1 500 000 - R 2 000
000
Count 6 4 0 10
% within Do you Form
Part of the Pharmacy
Group
12.8% 23.5% 0.0% 15.4%
> R 2 000 000
Count 16 3 0 19
% within Do you Form
Part of the Pharmacy
Group
34.0% 17.6% 0.0% 29.2%
Total
Count 47 17 1 65
% within Do you Form
Part of the Pharmacy
Group
100.0% 100.0% 100.0% 100.0%
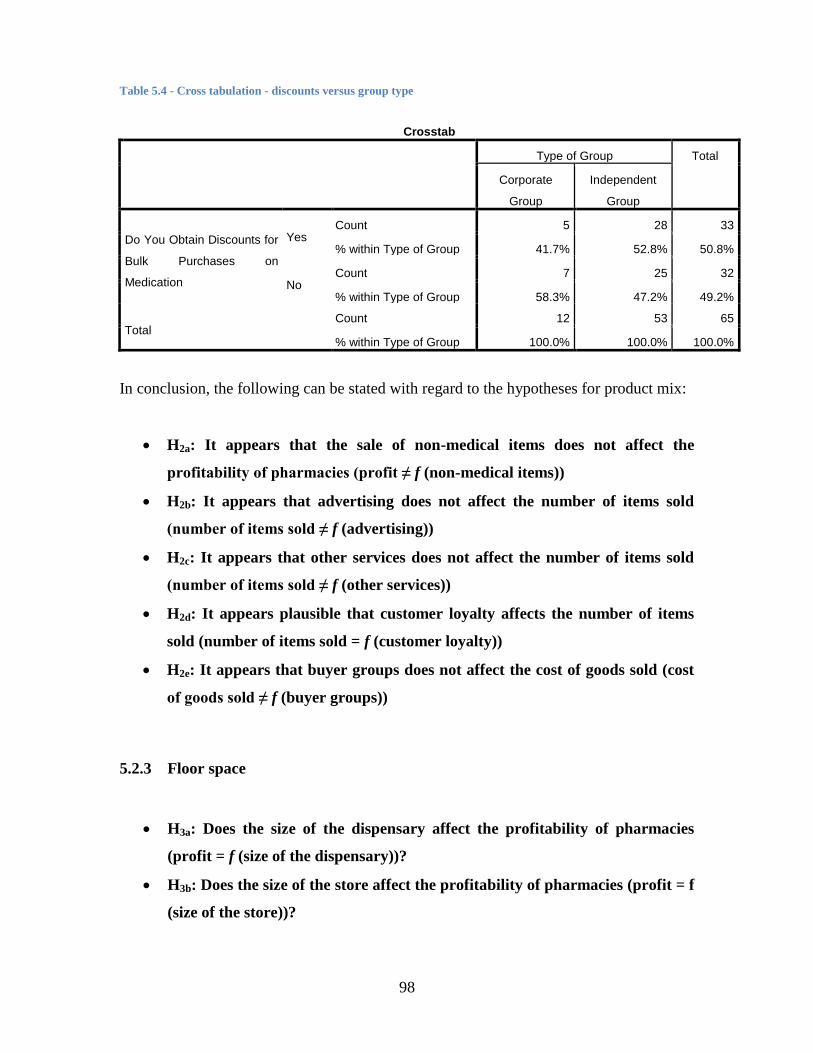
98
Table 5.4 - Cross tabulation - discounts versus group type
Crosstab
Type of Group Total
Corporate
Group
Independent
Group
Do You Obtain Discounts for
Bulk Purchases on
Medication
Yes Count 5 28 33
% within Type of Group 41.7% 52.8% 50.8%
No Count 7 25 32
% within Type of Group 58.3% 47.2% 49.2%
Total Count 12 53 65
% within Type of Group 100.0% 100.0% 100.0%
In conclusion, the following can be stated with regard to the hypotheses for product mix:
H2a: It appears that the sale of non-medical items does not affect the
profitability of pharmacies (profit ≠ f (non-medical items))
H2b: It appears that advertising does not affect the number of items sold
(number of items sold ≠ f (advertising))
H2c: It appears that other services does not affect the number of items sold
(number of items sold ≠ f (other services))
H2d: It appears plausible that customer loyalty affects the number of items
sold (number of items sold = f (customer loyalty))
H2e: It appears that buyer groups does not affect the cost of goods sold (cost
of goods sold ≠ f (buyer groups))
5.2.3 Floor space
H3a: Does the size of the dispensary affect the profitability of pharmacies
(profit = f (size of the dispensary))?
H3b: Does the size of the store affect the profitability of pharmacies (profit = f
(size of the store))?
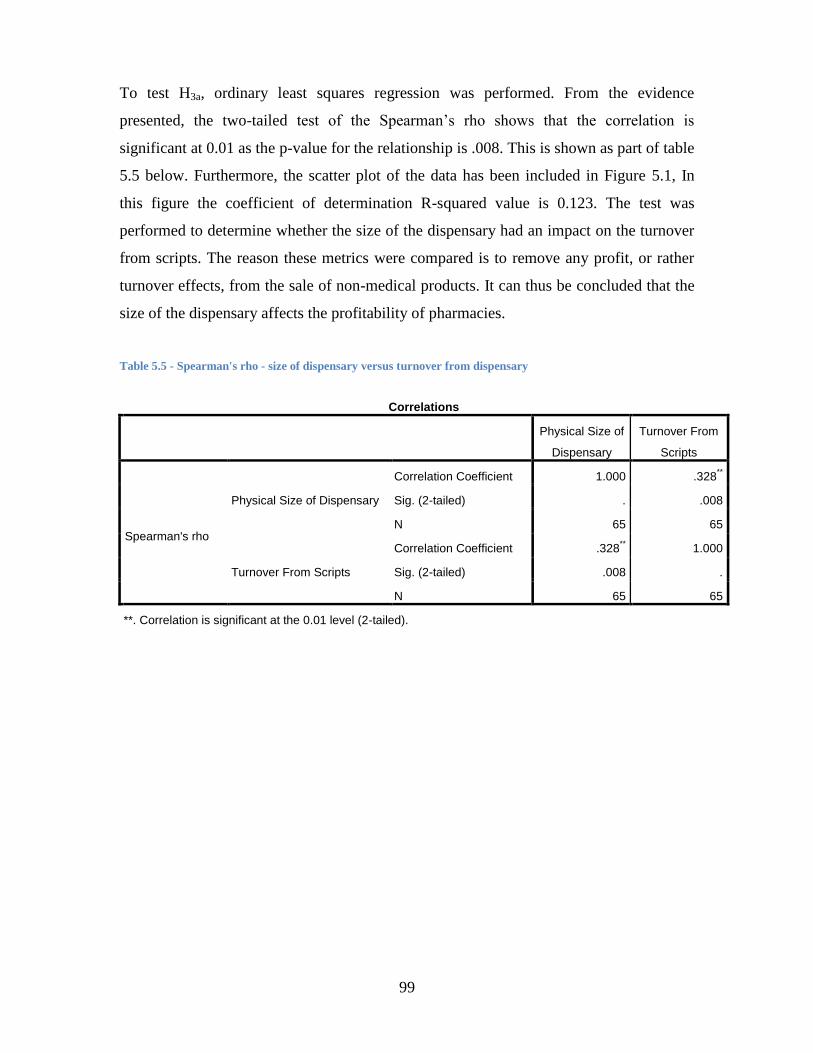
99
To test H3a, ordinary least squares regression was performed. From the evidence
presented, the two-tailed test of the Spearman’s rho shows that the correlation is
significant at 0.01 as the p-value for the relationship is .008. This is shown as part of table
5.5 below. Furthermore, the scatter plot of the data has been included in Figure 5.1, In
this figure the coefficient of determination R-squared value is 0.123. The test was
performed to determine whether the size of the dispensary had an impact on the turnover
from scripts. The reason these metrics were compared is to remove any profit, or rather
turnover effects, from the sale of non-medical products. It can thus be concluded that the
size of the dispensary affects the profitability of pharmacies.
Table 5.5 - Spearman's rho - size of dispensary versus turnover from dispensary
Correlations
Physical Size of
Dispensary
Turnover From
Scripts
Spearman's rho
Physical Size of Dispensary
Correlation Coefficient 1.000 .328**
Sig. (2-tailed) . .008
N 65 65
Turnover From Scripts
Correlation Coefficient .328** 1.000
Sig. (2-tailed) .008 .
N 65 65
**. Correlation is significant at the 0.01 level (2-tailed).
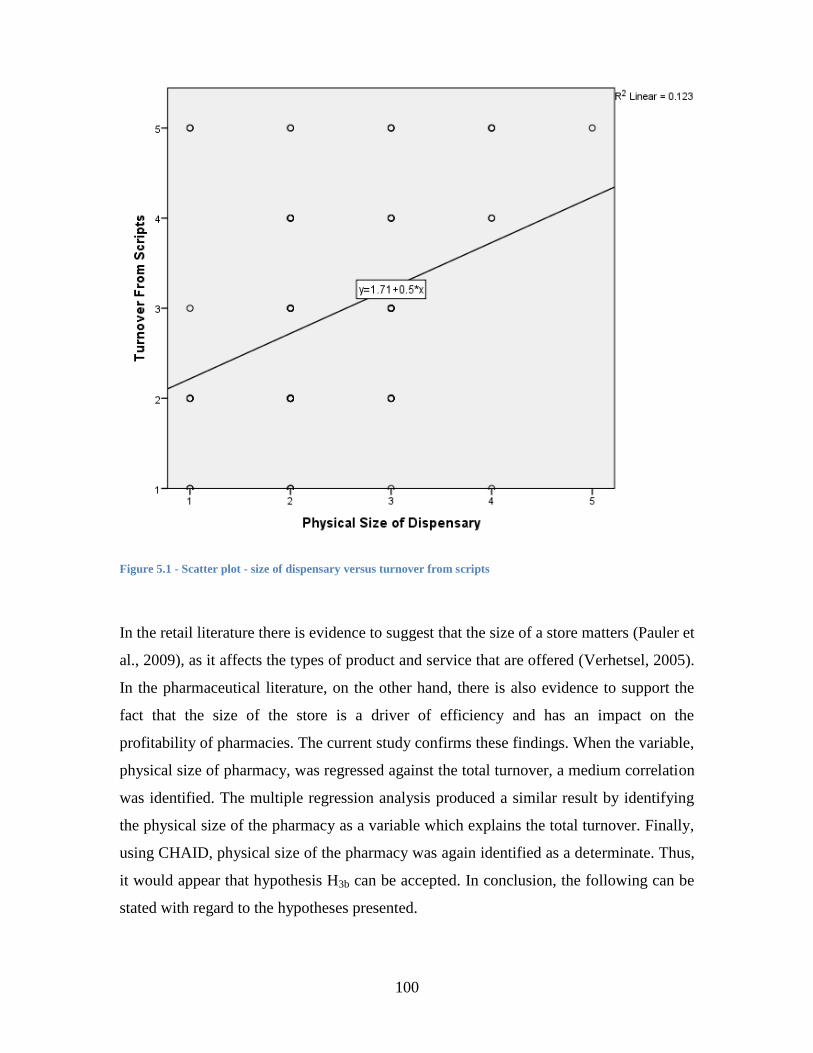
100
Figure 5.1 - Scatter plot - size of dispensary versus turnover from scripts
In the retail literature there is evidence to suggest that the size of a store matters (Pauler et
al., 2009), as it affects the types of product and service that are offered (Verhetsel, 2005).
In the pharmaceutical literature, on the other hand, there is also evidence to support the
fact that the size of the store is a driver of efficiency and has an impact on the
profitability of pharmacies. The current study confirms these findings. When the variable,
physical size of pharmacy, was regressed against the total turnover, a medium correlation
was identified. The multiple regression analysis produced a similar result by identifying
the physical size of the pharmacy as a variable which explains the total turnover. Finally,
using CHAID, physical size of the pharmacy was again identified as a determinate. Thus,
it would appear that hypothesis H3b can be accepted. In conclusion, the following can be
stated with regard to the hypotheses presented.
101
H3a: It appears that the size of the dispensary affects the profitability of
pharmacies (profit = f (size of the dispensary))
H3b: It appears that the size of the store affects the profitability of
pharmacies (profit = f (size of the store))
5.2.4 Location
H4a: Does roadside accessibility affect the profitability of pharmacies (profit
= f (roadside accessibility))?
H4b: Does pedestrian accessibility affect the profitability of pharmacies
(profit = f (pedestrian accessibility))?
H4c: Does the number of other pharmacies in the area affect the profitability
of pharmacies (profit = f (number of other pharmacies in the area))?
H4d: Does the number of doctors in the area affect the profitability of
pharmacies (profit = f (number of doctors in the area))?
H4e: Does the location index affect the profitability of pharmacies (profit = f
(location index))?
Prior to making any conclusions regarding the above hypotheses, the important elements
will be recapitulated. Roadside accessibility refers to whether a store is easy to access by
road. The literature suggests that stores are often found on the side of highways or main
roads so as to capture passing customers (Sadahiro, 2000; Swoboda et al., 2013).
Pedestrian accessibility makes reference to the type of shopping location with extensive
retail literature demonstrating that the definition of such locations are unclear (C. M.
Guy, 1998). However, specific types of location were examined in this study as the
number of other pharmacies in the area was analysed and this was used as a proxy for the
level of competition in the area. Number of doctors in the area was also analysed and this
was used to represent population density.
In relation to roadside accessibility, no relationship was identified using ordinary least
squares regression. The other tests like CHIAD also did not identify a relationship. The
102
reason for this lack of relationship appears to be due to the specialised nature of the
shopping trip. The pharmacy is not dependent on passing traffic to attract customers into
the store. Customers, as previously purported (C. M. Guy, 1998), usually visit a
pharmacy for a particular reason; for example purchasing medicine, therefore a pharmacy
will not have to rely on passing traffic for customers. Thus, hypothesis H4a is rejected.
In relation to pedestrian accessibility, hypothesis H4b is rejected as no plausible
relationship exists between pedestrian accessibility and total turnover. It appears that this
is again related to the nature of trip theory that is presented to define retailing space. The
definitions of pedestrian accessibility were not the issue as those used were standard,
distinct and understandable. The issue lies in the fact that visiting a pharmacy is not part
of every shopping trip and is generally a special trip that is made. Hence, pharmacies are
located in stores like Clicks. This is supported by the literature (Pauler et al., 2009).
However, owing to the nature of trip theory, a standalone pharmacy could also attract the
same customer.
The number of other pharmacies in the area is a proxy for the level of competition faced
by a pharmacy. In New Delhi, India, location is not a factor that drives the efficiency of a
pharmacy and, hence, its profitability (Patel & Pande, 2012). The definition used is that
of competition. Therefore, the hypothesis presented as H4c is rejected. The rejection of
this hypothesis supports the findings presented. In addition, in support of this conclusion,
pharmacy locations are controlled by the Pharmacy Council of South Africa which is
responsible for issuing a certificate for trading in a particular location. The Pharmacy
Council thus has the ability to control the level of competition in an area.
It is interesting to note that the number of doctors in an area appears to be related to the
total turnover of the pharmacy. This was identified using least squares regression and this
relationship explains around 9% of the total variance in turnover. Although it is a small
factor in the overall model, the relationship nevertheless still exists. Thus, hypothesis H4d
is accepted. This is further supported by CHAID, which found the number of doctors to
be a factor. This appears to be reasonable owing to the fact that once a patient visits a
doctor they will most likely take their script to the nearest pharmacy. As a result, if a
103
pharmacy is close to a number of doctors, it is likely that the pharmacy will experience a
number of patients visiting the store.
In terms of the multiple regression analysis, when each factor was accounted for
separately, the number of doctors was the only factor that was identified from the
locational factors.
Location is a complex variable in that it is made up of a number of factors. Accordingly,
a location index was derived in order to examine the factors. This location index was
included in a simple ordinary least squares regression as well as part of the multiple
regression analysis. In both these instances the relationship identified was not plausible
and resulted in the rejection of hypothesis H4e.
Further analysis of the location was performed not necessarily to determine its effect on
profit, but rather to determine which factors suggested a potential business location. This
was done using cluster analysis, which indicated that better situations were associated
with pharmacies that had low competition and high number of pharmacies and were
easily accessible in terms of roads and pedestrians. Using the rest of the data from the
cluster analysis, pedestrian accessibility was shown to be more important than roadside
accessibility. Although this paper rejects the notion of the location index influencing
profit, using the cluster analysis a better location index could nevertheless be developed.
The location index assumed that there is an equal weighting of 25% for each factor on the
location. Based on the cluster analysis, these weightings could be altered to reflect the
location factors more appropriately.
The following hypotheses are summarised below:
H4a: It appears that roadside accessibility does not affect the profitability of
pharmacies (profit ≠ f (roadside accessibility))
H4b: It appears that pedestrian accessibility does not affect the profitability of
pharmacies (profit ≠ f (pedestrian accessibility))
104
H4c: It appears that the number of other pharmacies in the area does not
affect the profitability of pharmacies (profit ≠ f (number of other pharmacies
in the area))
H4d: It appears that the number of doctors in the area affect the profitability
of pharmacies (profit = f (number of doctors in the area))
H4e: It appears that the location index does not affect the profitability of
pharmacies (profit ≠ f (location index))
5.3 Conclusion
In conclusion, it would appear that a number of hypotheses support the literature
presented, particularly with respect to the average inventory holding and physical size of
the store. Location appears not to affect the profitability of pharmacies nor does product
mix. This is most likely due to the specialised nature of the products sold. As customer
demand for these products is fairly inelastic, location would therefore not influence the
customer buying decision, except in cases where the pharmacy is close to a doctor
because patients visit the doctor and then obtain medication. Other more implicit
variables were considered and conclusions drawn, but these are not conclusive and could
be areas for future research. It should also be noted that although certain hypotheses were
proved to be true, the multiple regression analysis model only explains 27.3% of the
variability in turnover. Thus, there are other factors apart from those tested that affect the
profitability of pharmacies.
105
6 Conclusions and Areas for Future Research
6.1 Introduction
Since the beginning of the new democratic era the pharmaceutical industry has been in a
state of flux. Subsequently, the Department of Health has focused on providing
healthcare in general and medicines in particular to a wider population as well as to
reduce the costs faced by the patient. As a result, there has been pressure on the medicine
supply chain which has resulted in the passing of a number of new pieces of legislation.
One such piece of legislation is the implementation of the single exit price (SEP).
For any organisation, profit is defined as income minus expenses. This is no different for
a pharmacy. With one of the variables on the income side being fixed, that is, the selling
price of the goods, pharmacies need to look for other ways in which to influence the other
variables in order to remain profitable. There is extensive literature relating to the
different variables that affect profit. The variables tested by this research study included
average inventory holding, product mix, floor space and location.
6.2 Overall conclusions
Using ordinary least squares regression analysis, it was found that only average inventory
holding, physical size and the number of doctors in the area are positively correlated with
turnover, while average inventory and physical size individually explain around 20 and
18.3% respectively of the variation in total turnover. Although a relationship with the
number of doctors in the area exists, the relationship explains only a small percentage of
turnover variance. On further analysis the same variables were identified as drivers of a
multiple regression model. However, in the multiple regression model the factors only
106
explained 27% of the relationship with turnover. It thus appears that there are other
factors not considered by this research paper that affect pharmacy profitability.
With reference to the other drivers of profit tested in this research paper, it was found that
there was evidence to support plausible relationships with certain factors, such as
customer loyalty and stock holding patterns, in relation to doctors and patients.
There are a number of limitations inherent in this research that should be considered.
Relationship testing was performed using ordinary least squares regression, which was
done by treating the ordinal data as scale data. However, had the data been continuous,
the regression tests could have had more statistical power to determine whether a
relationship existed.
The findings of this research are similar to those of a study performed in New Delhi,
India. This study made use of a different methodology, but the key drivers of store size
and reduction of costs were similar. Furthermore, the construct of the location index
within this study was identified as not being a factor of profitability. However, it should
be noted that an element of this index did have a relationship with total turnover.
Using cluster analysis, it was found that potential new businesses could be classified
according to whether they are positioned in locations with low competition, a high
density of doctors, and relatively simple access to the location, larger proportions fall in
the higher turnover brackets. This is true even though location was not found to be a
significant driver. However, location comprised a number of separate variables and,
accordingly, the cluster analysis found that being in a mall was more important than type
of road access.
To conclude this research, it would seem that there are identifiable factors that affect the
profitability of pharmacies and which should be considered when establishing a new
pharmacy. The factors identified do not necessarily, however, assist the Department of
Health in developing a specific mark-up value for medicines. There also appears to be
107
other factors that need to be tested in order to determine the complete set of factors that
drive the profitability of pharmacies.
6.3 Areas for future research
This research found that the factors identified do not make up the full set of factors that
drive pharmacy profitability. As a result, the following future research can be performed
in an attempt to close these gaps:
Testing of the same factors affecting profit using a different methodology, such as
logistic regression or Tobit regression.
In building up the location index, the percentage values used in the determination
of the index could be altered in relation to the results of the cluster analysis.
A model could be developed from the dispensing fee to determine the fee
structure needed in order for a pharmacy to break even.
Detailed testing of the product mix could be performed by splitting the turnover of
a store between the different medical categories, such as medicines, OTCs and
non-medical.
Further work could be carried out to determine whether a relationship exists
between customer loyalty and store performance.
These areas of additional research would build on the research presented in this paper. In
addition, they might provide pharmacies with a competitive advantage which could be
used to remain profitable. Finally, the research could provide the Department of Health
with a basis on which to formulate a dispensing fee and SEP, to ensure that pharmacies
earn sufficient profit to remain in business and that medicines are provided to customers
at the lowest possible cost.
i
Appendix A Table of Figures
Figure 1.1 Graphical representation of the pharmaceutical industry in South Africa ........ 6
Table 4.1 - Split between the different groups .................................................................. 59
Figure 4.1 - Graphical representation of the respondents ................................................. 59
Figure 4.2 - Split of respondents by geographical location .............................................. 60
Table 4.2 - Distribution of average inventory ................................................................... 60
Figure 4.3 - Graphical representation of average inventory ............................................. 61
Table 4.3 - Distribution of total turnover and turnover from prescriptions ...................... 61
Figure 4.4 - Distribution of turnover from prescriptions .................................................. 62
Figure 4.5 - Distribution of total turnover ........................................................................ 63
Table 4.4 - Distribution of physical size and size of dispensary ...................................... 63
Figure 4.6 - Distribution of physical size of pharmacy .................................................... 64
Figure 4.7 - Distribution of physical size of dispensary ................................................... 64
Table 4.5 - Miscellaneous questions ................................................................................. 65
Figure 4.8 - Provision of other services ............................................................................ 66
Table 4.6 - Information technology and inventory management ...................................... 67
Table 4.7 - Stock carrying patterns ................................................................................... 67
Table 4.8 - Average inventory versus total turnover correlations .................................... 68
Table 4.9 - Average inventory versus turnover - model summary ................................... 69
Table 4.10 - Average inventory versus turnover - ANOVA ............................................. 69
Table 4.11 - Average inventory versus turnover - coefficients......................................... 69
Table 4.12 - Roadside accessibility versus turnover - ANOVA ....................................... 70
Table 4.13 - Pedestrian accessibility versus turnover - ANOVA ..................................... 70
Table 4.14 - Number of pharmacies versus turnover - ANOVA ...................................... 71
Table 4.15 - Number of doctors versus total turnover - correlations ................................ 71
Table 4.16 - Number of doctors versus total turnover - model summary ......................... 71
Table 4.17 - Number of doctors versus total turnover - ANOVA .................................... 72
Table 4.18 - Number of doctors versus total turnover - coefficients ................................ 72
Table 4.19 - Total location index score versus turnover - ANOVA ................................. 73
Table 4.20 - Product mix versus turnover - ANOVA ....................................................... 73
Table 4.21 - Physical size versus turnover - correlations ................................................. 74
ii
Table 4.22 - Physical size versus turnover - model summary .......................................... 74
Table 4.23 - Physical size versus turnover - ANOVA ...................................................... 75
Table 4.24 - Physical size versus turnover - coeeficients ................................................. 75
Table 4.25 - Location Index .............................................................................................. 76
Table 4.26 - Multiple regression analysis - correlations ................................................... 77
Table 4.27 - Multiple regression - model summary .......................................................... 78
Table 4.28 - Multiple regression - ANOVA ..................................................................... 78
Table 4.29 - Multiple regression - coefficeints ................................................................. 78
Figure 4.9 - CHAID test .................................................................................................... 80
Table 4.30- CHAID Classifications .................................................................................. 80
Table 4.31 - Final cluster centres ...................................................................................... 83
Figure 4.10 - Graphical representation of each cluster ..................................................... 83
Table 4.32 - Distribution of situational index ................................................................... 84
Table 4.33 - Situational Index ........................................................................................... 84
Table 4.34 - Situational index * competitiveness type cross tabulation ........................... 85
Table 4.35 - Pearson correlation for chi square relating to groups ................................... 87
Table 4.36 - T-Tests .......................................................................................................... 87
Table 5.1 - Cross tabulation - services offered versus advertising ................................... 94
Table 5.2 - Cross tabulation - index of services versus do you deliver medicine? ........... 95
Table 5.3 - Cross tabulation - total turnover versus pharmacy group ............................... 97
Table 5.4 - Cross tabulation - discounts versus group type .............................................. 98
Table 5.5 - Spearman's rho - size of dispensary versus turnover from dispensary ........... 99
Figure 5.1 - Scatter plot - size of dispensary versus turnover from scripts .................... 100
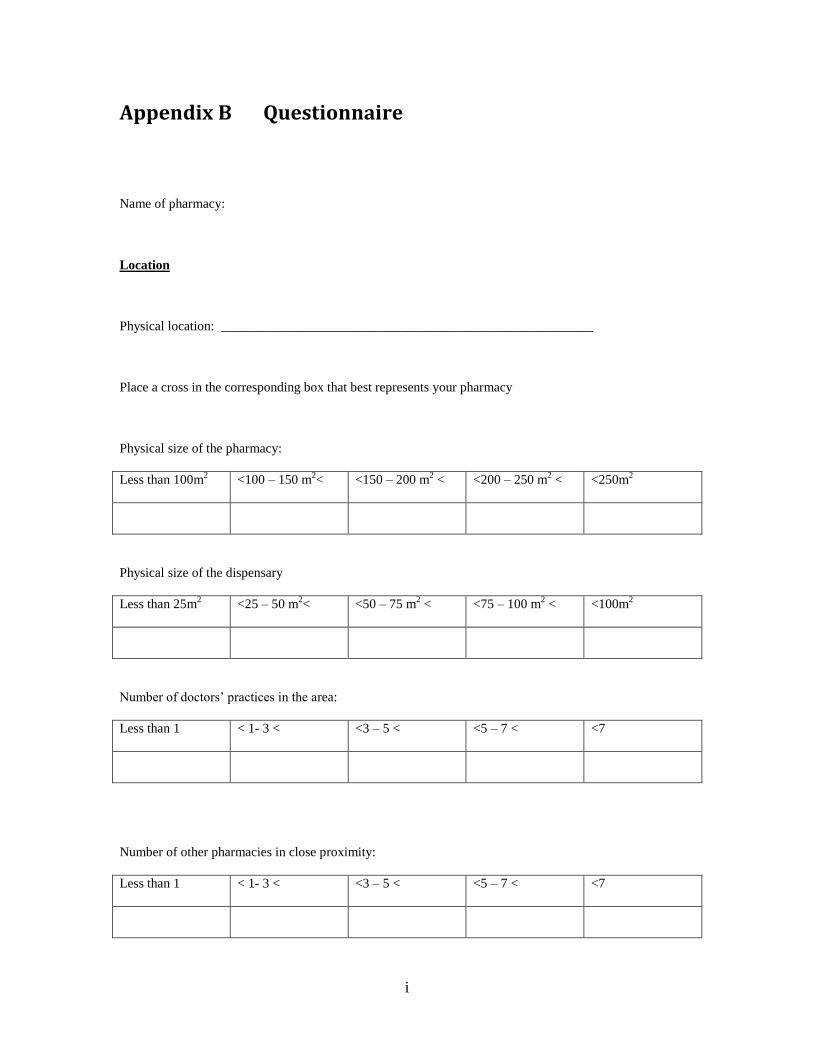
i
Appendix B Questionnaire
Name of pharmacy:
Location
Physical location: ________________________________________________________
Place a cross in the corresponding box that best represents your pharmacy
Physical size of the pharmacy:
Less than 100m2 <100 – 150 m
2< <150 – 200 m
2 < <200 – 250 m
2 < <250m
2
Physical size of the dispensary
Less than 25m2 <25 – 50 m
2< <50 – 75 m
2 < <75 – 100 m
2 < <100m
2
Number of doctors’ practices in the area:
Less than 1 < 1- 3 < <3 – 5 < <5 – 7 < <7
Number of other pharmacies in close proximity:
Less than 1 < 1- 3 < <3 – 5 < <5 – 7 < <7

ii
Location
In a Mall or Clinic Within a km of
Mall
Within a small
shopping complex
Within a km of
small shopping
complex
Roadside
Main Road Within a km of
Main Road
Major Road Within a km of
Major Road
Busy side Road
Turnover from Scripts (R’000):
> R 400 < R 400 – R 800 < < R800 – R 1200 < < R 1200 – R 1600 < < R 1600
Total turnover (R’000):
> R 500 < R 500 – R 1000 < < R1000 – R 1500 < < R 1500 – R 2000 < < R 2000
Average inventory (R’000):
> R 250 < R 250 – R 750 < < R750 – R 1250 < < R 1250 – R 1750 < < R 1750
Circle the appropriate answer for the questions below:
“Business” relationships with doctors: Yes/No
Do these doctors have particular prescription patterns? Yes/No
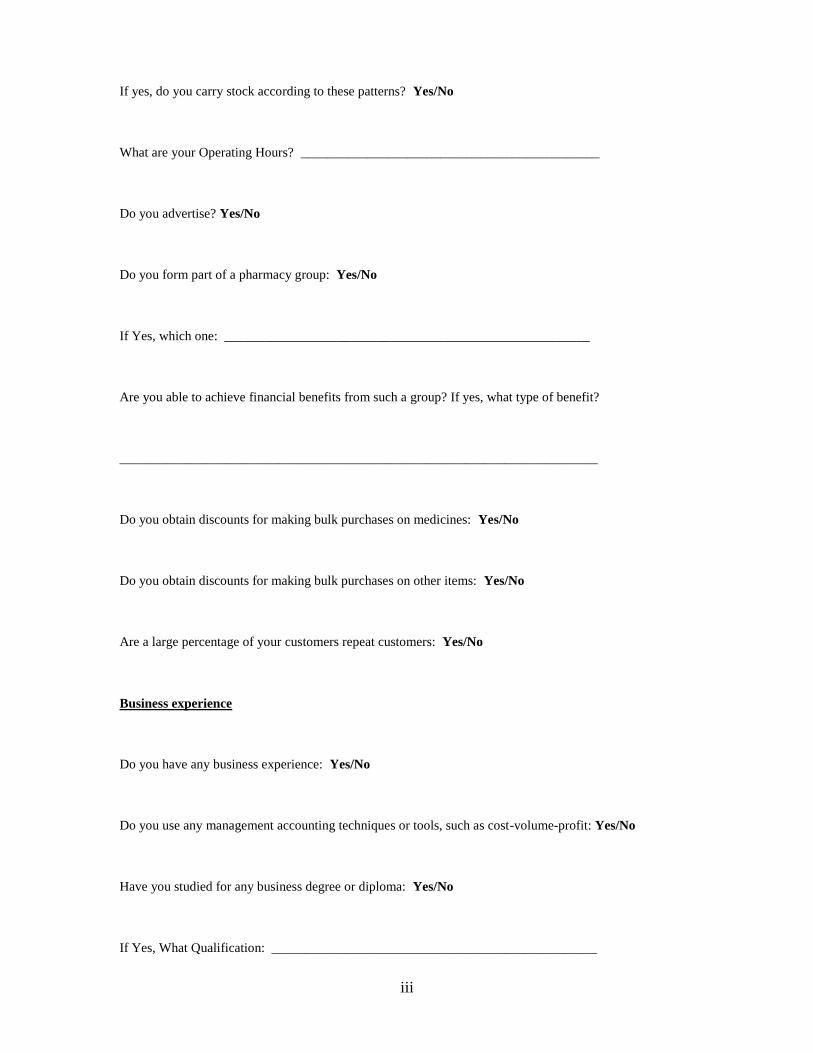
iii
If yes, do you carry stock according to these patterns? Yes/No
What are your Operating Hours? _____________________________________________
Do you advertise? Yes/No
Do you form part of a pharmacy group: Yes/No
If Yes, which one: _______________________________________________________
Are you able to achieve financial benefits from such a group? If yes, what type of benefit?
________________________________________________________________________
Do you obtain discounts for making bulk purchases on medicines: Yes/No
Do you obtain discounts for making bulk purchases on other items: Yes/No
Are a large percentage of your customers repeat customers: Yes/No
Business experience
Do you have any business experience: Yes/No
Do you use any management accounting techniques or tools, such as cost-volume-profit: Yes/No
Have you studied for any business degree or diploma: Yes/No
If Yes, What Qualification: _________________________________________________
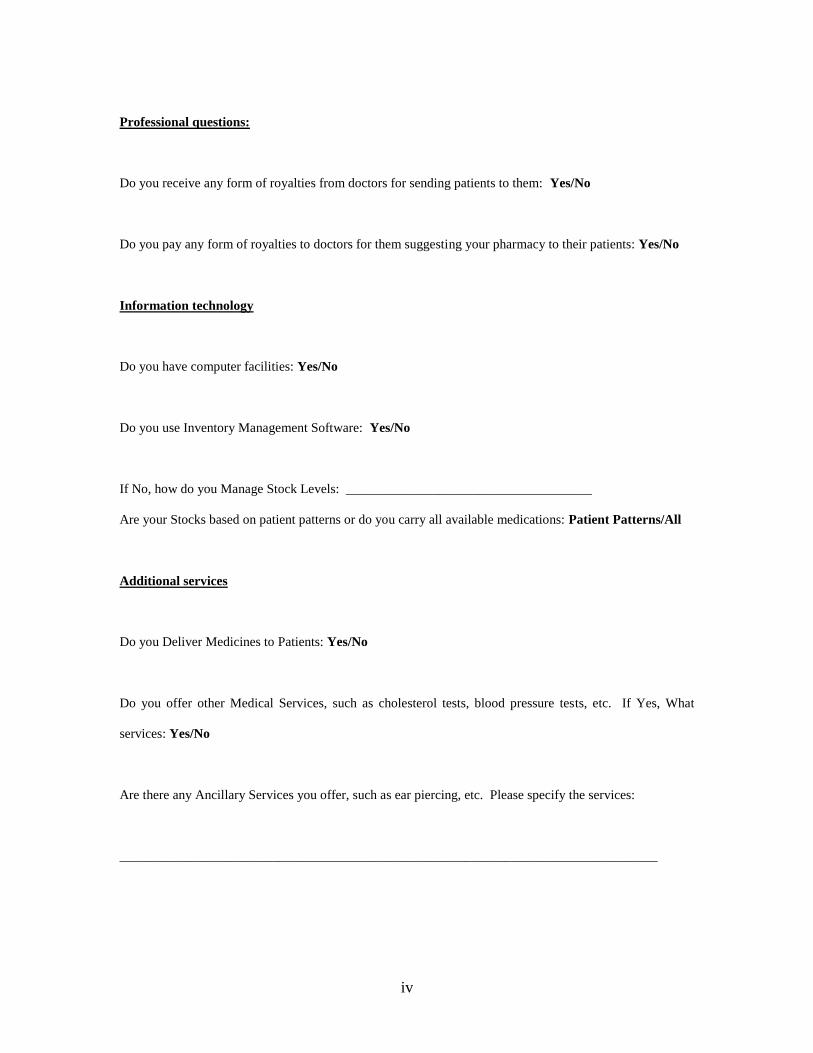
iv
Professional questions:
Do you receive any form of royalties from doctors for sending patients to them: Yes/No
Do you pay any form of royalties to doctors for them suggesting your pharmacy to their patients: Yes/No
Information technology
Do you have computer facilities: Yes/No
Do you use Inventory Management Software: Yes/No
If No, how do you Manage Stock Levels: _____________________________________
Are your Stocks based on patient patterns or do you carry all available medications: Patient Patterns/All
Additional services
Do you Deliver Medicines to Patients: Yes/No
Do you offer other Medical Services, such as cholesterol tests, blood pressure tests, etc. If Yes, What
services: Yes/No
Are there any Ancillary Services you offer, such as ear piercing, etc. Please specify the services:
_________________________________________________________________________________
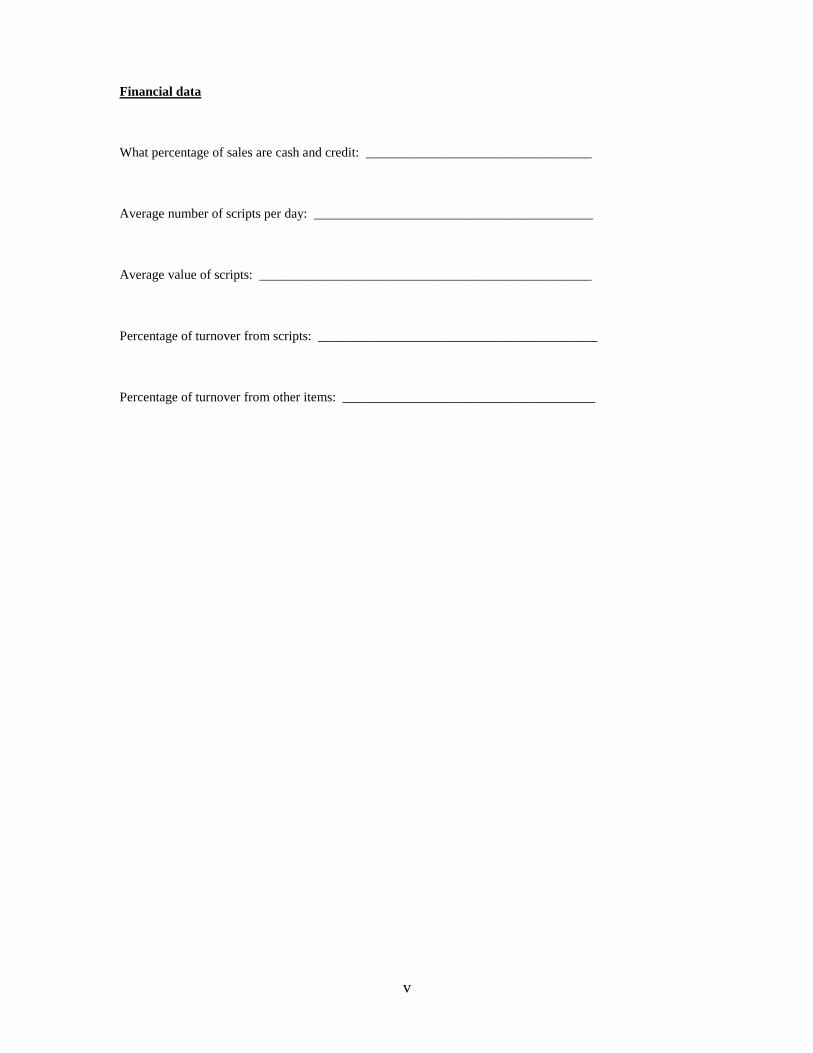
v
Financial data
What percentage of sales are cash and credit: __________________________________
Average number of scripts per day: __________________________________________
Average value of scripts: __________________________________________________
Percentage of turnover from scripts: __________________________________________
Percentage of turnover from other items: ______________________________________
i
7 References
(IASB), I. A. S. B. (2007). IAS 1 — Presentation of Financial Statements. International Financial Reporting Standards, from
http://www.iasplus.com/en/standards/standard5
(IASB), I. A. S. B. (2010). The IFRS Framework. International Financial Reporting Standards, from
http://www.iasplus.com/en/standards/standard4
Akan, O., Allen, R. S., Helms, M. M., & Spralls, S. A. (2006). Critical Tactics for Implementing Porter’s Generic Strategies. Journal of
Business Strategy, 27(1), 43 - 53.
Alfares, H. K. (2007). Inventory model with stock-level dependent demand rate and variable holding cost. International Journal of
Production Economics, 108, 259 - 265.
Avlonitis, G. J., & Indounas, K. A. (2004). The impact of market structure on pricing objectives of service firms. Journal of Product and
Brand Management, 13(5), 343 - 358.
Brooks, J. M., Doucette, W. R., Wan, S., & Klepser, D. G. (2008). Retail Pharmacy Market Structure and Performance. Inquiry, 45(1), 75
- 88.
Bruin, C. J. D. (1990). Determination, Comparison and Evaluation of Alternative Retail Pharmacy Dispensing Price Structures. Masters
Dissertation. University of Pretoria.
CCT 59/04 (Constitutional Court of South Africa 2004).
. Chapter 23 Cluster Analysis. from http://www.uk.sagepub.com/burns/website%20material/Chapter%2023%20-
%20Cluster%20Analysis.pdf
Regulation relating to the practice of pharmacy (2000a).
ii
Council, T. S. A. P. (2000b). Scope of Practice: Pharmacist Retrieved 28 December 2012, 2012, from
http://www.mm3admin.co.za/documents/docmanager/0C43CA52-121E-4F58-B8F6-81F656F2FD17/00010976.pdf
Council, T. S. A. P. (2010). Good Pharmacy Practice Manual (Fourth Edition ed.). Pretoria.
Council, T. S. A. P. (2011). Pharmacy Human Resources in South Africa (pp. 92): South African Pharmacy Council.
Council, T. S. A. P. (2012). Statistics for registered persons and organisations Retrieved 23 December 2012, 2012, from
http://www.pharmcouncil.co.za/B_Statistics.asp
Dictionaries, O. (2010). "profit". Oxford Dictionaries. April 2010: Oxford University Press.
Drury, C. (2004). Quantitative models for the planning and control of stocks (Sixth ed.). London.
Dubelaar, C., Chow, G., & Larson, P. D. (2001). Relationships between Inventory, Sales and Service in a Retail Chain Store Operation.
International Journal of Physical Distribution & Logistics Management, 31(2), 96 - 108.
Eboli, L., & Mazzulla, G. (2009). An ordinal logistic regression model for analysing airport passenger satisfaction. EuroMed Journal of
Business, 4(1), 40 - 57.
EDITORIAL: Prepare for a new healthcare battle. (2012, 16 August 2012). Business Day Online.
Everitt, B. S. (1979). Unresolved Problems in Cluster Analysis. Biometrics, 35(1), 169 - 181.
Gijsbrechts, E., Campo, K., & Goossens, T. (2003). The impact of store flyers on store traffic and store sales: a geo-marketing approach.
Journal of Retailing, 79, 1 - 16.
Gilbert, L. (1998). Dispensing Doctors and Prescribing Pharmacists: A South African Perspective. Social Science and Medicine, 46(1), 83
- 95.
Gonzalez-Benito, O. (2005). Spatial competitive interaction of retail store formats: modeling proposal and empirical results. Journal of
Business Research, 58, 457 - 466.
Guy, C. (1995). Retail store development at the margin. Journal of Retailing and Consumer Services, 2(1), 25 - 32.
iii
Guy, C. M. (1998). Classifications of retail stores and shopping centres: some methodological issues. GeoJournal, 45(4), 255 - 264.
Hamuro, Y., Katoh, N., Matsuda, Y., & Yada, K. (1998). Mining Pharmacy Data Helps to Make Profits. Data Mining and Knowledger
Discovery, 2, 391 - 398.
Harrison, J., Scahill, S., & Sheridan, J. (2012). New Zealand pharmacists' alignment with their professional body's vision for the future.
Research in Social and Administative Pharmacy, 8, 17 - 35.
Helgesen, Ø., Nesset, E., & Voldsund, T. (2009). Marketing perceptions and business performance Implications for marketing education?
Marketing Intelligence & Planning, 27(1), 25 - 47.
Holford-Walker, L. (2011). Discovery scheme irks chemists, Business Day Online.
Howell, D. C. (2004). Fundamental statistics for the behavioral sciences. Pacific Grove: Brooks/Cole.
Huysamen, G. K. (1993). Metodologie vir die sosiale en gedragswetenskappe. South Africa: International Thomson Publishing.
Kahn, T. (2008a). Hope for dispensing charge settlement, Business Day.
Kahn, T. (2008b, 31 March 2008). Medicine price rise topped at 6.5%, Business Day Online.
Kahn, T. (2010). Pharmacists relieved as dispensing row settled, Business Day.
Kahn, T. (2011a, 15 March 2011). Drug Distributors bemoan new fee proposals, Business Day Online.
Kahn, T. (2011b). Negotiations are the best medicine, Business Day.
Kahn, T. (2012). Plan to end incentives in medicine sales, Business Day.
Kalton, G., & Schuman, H. (1982). The Effect of the Question on Survey Responses: A Review. Journal of the Royal Statistical Society,
145(1), 42 - 73.
Kennedy, E., & Moody, M. (2000). An investigation of the factors affecting community pharmacists' selection of over the counter
preparations. Pharmacy WOrld and Science, 22(2), 47 - 52.
iv
Keshavarz, K., Kebriaeezadeh, A., Meshkini, A. H., Nikfar, S., Mirian, I., & Khoonsari, H. (2012). Financial perspective of private
pharmacies in Tehran (Iran); is it a lucrative business. DARU Journal of Pharmaceutical Services, 20(62).
Leedy, P. D., & Ormrod, J. E. (2010). Practical Research: Planning and Design (Ninth ed.). Boston: Pearson Education International.
Medical Schemes Act, 131 Stat. (Govenment Printer 1998).
Medicines and Related Substances Act, 18505, Pub. L. No. 18505, 101 Stat. (Govenment Printer 1965).
Meenaghan, T. (1995). The role of advertising in brand image development. Journal of Product and Brand Management, 4(4), 23 - 34.
Messinger, P. R., & Narasimhan, C. (1997). A model of Retail Formats based on Consumers' Economizing on Shopping Time. Marketing
Science, 16(1), 1 - 23.
Min, K. J. (1992). Inventory and Quantity discount pricing policies under profit maximization. Operational Research Letters, 11, 187 -
193.
Mngadi, S. (2005). Pharmacists awaits the Constitutional Court case on the medicine pricing regulations Retrieved 27 December 2012,
from http://www.doh.gov.za/docs/pr/2005/pr0114a.html
Negotiations are the best medicine. (2011, 5 January 2011). Business Day Online.
New pricing model has pharmacists worried. (2006). Business Day Online. Retrieved from
http://www.businessday.co.za/Articles/TarkArticle.aspx?ID=1936886
Palepu, K. (1985). Diversification Strategy, Profit Performance and the Entropy Measure. Strategic Management Journal, 6(3), 239 - 255.
Pando, V., Garcia-Laguna, J., San-Jose, L. A., & Sicilla, J. (2012). Maximizing profits in an inventory model with demand rate and
holding cost per unit time dependent on stock level. Computers and Industrial Engineering, 62, 599 - 608.
Patel, G. N., & Pande, S. (2012). Measuring the performance of pharmacy stores using discretionary and non-discretionary variables.
OPSEARCH. doi: 10.1007/s12597-012-0095-0
v
Pauler, G., Trivedi, M., & Gauri, D. K. (2009). Assessing store performance models. European Journal of Operational Research, 197,
349 - 359.
Pharmacy Act, 53 Stat. (Govenment Printer 1974).
Pioch, E. A., & Schmidt, R. A. (2001). German retail pharmacies - regulation, professional identity and commercial differentiation.
Marketing Intelligence and Planning, 19(5), 330 - 340.
Pioch, E. A., & Schmidt, R. A. (2004). Community Pharmacies as Good Neighbours? A Comparative Study of Germany and the UK.
International Journal of Retail & Distribution Management, 32(11), 532 - 544.
Pretorius, D. (2011). The impact of the implementation of single exit pricing for pharmaceuticals in South Africa. Faculty of Commerce,
Law and Management. University of the Witswatersrand.
Rowley, J. (2002). Using Case Studies in Research. Management Research News, 25(1), 16 - 27.
Sadahiro, Y. (2000). A PDF-based analysis of the spatial structure of retailing. GeoJournal, 52(3), 237 - 252.
. SAMA Medigram : Double dose of good news for dispensing doctors (2011) Retrieved 12 January 2013, 2013, from
http://www.sasom.org/all-latest-news/133-sama-medigram-double-dose-of-good-news-for-dispensing-doctors
Sarkar, B., Saren, S., & Wee, H.-M. (2013). An inventory model with variable demand, component cost and selling price for deteriorating
items. Economic Modelling, 306 - 310.
Schmidt, R. A., & Pioch, E. A. (2001). Ten years after: the impact of German unification on retail pharmacies. International Journal of
Retail and Distribution Management, 29(5), 247 - 258.
Swoboda, B., Berg, B., Schramm-Klein, H., & Foscht, T. (2013). The importance of retail brand equity and store accessibility for store
loyalty in local competition. Journal of Retailing and Consumer Services.
Verhetsel, A. (2005). Effects of Neighbourhood Characteristics on store performance supermarkets versus hypermarkets. Journal of
Retailing and Consumer Services, 12, 141 - 150.
vi
Vesselo, I. R. (1965). How to Read Statistics. London: George G. Harrap & Co Ltd.
Vinten, G. (1995). Open versus closed questions – an open issue? Management Decision, 33(4), 27 - 31.
Wagner, C., Kawulich, B., & Garner, M. (2012). Doing Social Research: A Global Context: McGraw-Hill Higher Education.
Walonick, D. S. (2004). Survival Statistics. USA: Bloomington.
Waning, B., Maddix, J., & Soucy, L. (2010). Balancing medicine prices and business sustainability: analyses of pharmacy costs, revenues
and profit shed light on retail medicine mark-ups in rural Kyrgyzstan. BMC Health Services Research, 10(205).
WIlliams, K. F. (2007). Re-examining 'professionalism' in pharmacy: A South African perspective. Social Science and Medicine, 64,
1285 - 1296.
Wong, A., & Sohal, A. (2003). Service Quality and Customer Loyalty on two levels of retail relationships. Journal of Services Marketing,
17(5), 495 - 513.
Wood, E. H. (2006). The internal predictors of business performance in small firms: A logistic regression analysis. Journal of Small
Business and Enterprise Development, 13(3), 441 - 453.
x-rates.com. (2013). Historic Lookup - Exchange Rates, from http://www.x-rates.com/historical/?from=ZAR&amount=1.00&date=2013-
01-22
Zhu, T., & Singh, V. (2009). Spatial Competition with endogenous location choices: An application to discount retailing. Quantitative
Marketing Economics, 7, 1 - 35.


![INDEX [] · There are many general factors also affecting the value of goodwill these are profitability, nature of business, capital employed, patent and trademark protection etc](https://img.pdfslide.us/doc/110x75/5e37fb703236706569706957/index-there-are-many-general-factors-also-affecting-the-value-of-goodwill-these.jpg)