Embed Size (px)
Citation preview
7/25/2019 Factors Affecting Growth of Developing Country
http://slidepdf.com/reader/full/factors-affecting-growth-of-developing-country 1/18
37
Factors Affecting Economic Growth
in Developing Countries
Parash Upreti
ABSTRACT. This paper aims to identify the factors affecting economic growth in
developing countries. It uses cross-country data for 76 countries from 2010, 2005, 2000,
and 1995. A high volume of exports, plentiful natural resources, longer life expectancy,
and higher investment rates have positive impacts on the growth of per capita gross
domestic product in developing countries. Much research needs to be done to distinguish
the causes of growth in developing countries, as the scope of existing research is limiteddue to a lack of reliable data.
I. Introduction
Economists have used both theory and empirical research to explain the
cause of economic growth. People like Solow, Swann, and Romer have
provided theoretical frameworks on which most later works are based.
Following their work, Barro, and Sala-i-Martin have conducted extensive
empirical work to test established hypotheses. This study will employ the
empirical model of economic growth proposed by Barro (1996), and use
newer data to test whether the theory of economic growth that held true
for most of the countries in his sample will hold true for a set of
developing countries.
There has been minimal empirical work that specifically looks into
factors that determine growth in developing economies in recent years.Since growth is a very dynamic process, studies that are based on cases
hundreds of years ago might not be as relevant now. The technological
changes in the last few decades have revolutionized the way countries
improve their economy. This study will help motivate more research and
case studies on developing countries from which other countries can learn
and benefit. Thus, this study has policy implications.
This study attempted to find the factors that determine economic
growth in developing countries. Also, it compared whether the factors
that affect growth of developed countries were the same for developing
countries. Using an Ordinary Least Squares regression, the data showed
that, to a certain extent, the factors that affect economic growth were
consistent overall. It also found that a lack of reliable data had made the
7/25/2019 Factors Affecting Growth of Developing Country
http://slidepdf.com/reader/full/factors-affecting-growth-of-developing-country 2/18
Major Themes in Economics, Spring 201538
process daunting, but also opened room for many future opportunities.More empirical research on developing countries should be conducted.
II. Literature Review
Robert Barro (1996) studied a panel of 100 countries from 1960 to 1990
to find the factors that affected the economic growth of countries. He
found that the growth rate of real per capita GDP was associated with
maintenance of the rule of law, smaller government consumption, longer
life expectancy, more male secondary and higher levels of schooling,
lower fertility rates, higher levels of investment, the level of democracy,
a lower inflation rate, and openness to trade. He also emphasized the
theory of convergence, which implies that as the real GDP level rises, the
growth rate falls. Barro’s sample of 100 countries included 18 countries
from Sub-Saharan Africa, 22 from Latin America, and 18 from Asia of all
economic levels, but included very few developing countries (i.e. the
poorest countries). Many of these countries were excluded from the
sample because data was missing.
Despite international aid and support, developing countries were not
able to grow and prosper because of economic traps. The traps include
conflicts or wars, rent seeking on natural resources, dependence on only
one neighboring country, and lack of the rule of law (Collier, 2007).
Although real per capita GDP growth of developing countries was higher
than the world average, they had low levels of socio-economic conditions.It was partly due to weak institutions, low human and physical capital,
conflicts, poverty, a low level of productivity, lack of international trade,
and heavy reliance on external help. Since they had a low level of real per
capita GDP, the theory of convergence, “catching up,” should hold true.
In fact it seemed to, because despite all the problems, they had higher
growth rates compared to developed countries.
Foreign direct investment (FDI) has been a big source of external
funding in developing and developed countries. The impact of FDI on
economic growth has been extensively discussed in economic research.
There have been both positive and negative analysis of FDI on economic
growth. Most economists and policymakers believe that FDI stimulates
development in investment in technology, increases the capital stock, andincreases employment. Some worry, however, that it has a crowding out
effect on domestic investment and eliminates competition in the local
markets.
7/25/2019 Factors Affecting Growth of Developing Country
http://slidepdf.com/reader/full/factors-affecting-growth-of-developing-country 3/18
Upreti: Factors Affecting Economic Growth 39
Caves (1971) found that there was a positive correlation between the productivity of a multinational enterprise and labor productivity indomestic firms in the same industry. He claimed that this was a result of competition and continuous improvement brought by foreign investmentto the domestic market. Foreign direct investment may also have benefitsnot only to the industry that receives the investments but also to other domestic industries that gain from spillover effects of improved humancapital and technological improvement (Rappaport, 2000). Foreign directinvestment benefits a host country through added employment, newtechnology and transfer of knowledge. Also, it causes an increase in thevolume of domestic investment (Borensztein, De Gregorio, and Lee1998).
Foreign direct investment (FDI) may also have negative effects on therecipient country. Foreign firms may invest capital only on what theythink is productive. It drives away domestic firms, which lowers thewelfare of the nation (Hanson, 2001). While there had been a lot of talk about spillover effects from foreign direct investment in previous studies,Aitekn and Harrison (1999) did not find any evidence of beneficialspillover effects from foreign firms to domestic ones in Venezuela over the period 1979-1989. Also, Mansfield and Romeo (1980) did not find a positive effect of FDI on the rate of economic growth in Morocco, adeveloping country. So, while there is optimism for the role of FDI ineconomic growth, there is some pessimism as well. Therefore, it isimportant to discover how FDI affects the economies of the least
developed countries.International trade enhances the economy of both importing and
exporting countries. There is a positive relationship between internationaltrade and economic growth. Kavoussi (1984) found that higher rates of economic growth were strongly correlated with higher rates of exportgrowth. He found that the positive correlation between exports andgrowth holds for both middle and low income countries. Sachs andWarner (1995) found that open developing economies outperformedclosed developing economies every year in terms of real GDP growth.Even in poorer countries, openness to trade enhances growth in productivity, and thus, human capital (Harrison 1996). Least developedcountries, however, are heavily dependent on primitive agriculture and
are more vulnerable to shocks.A country rich in natural resources can benefit from the production
and sale of such wealth. Yet, even with abundant natural resources suchas oil and diamonds, countries in Africa have not experienced substantial
7/25/2019 Factors Affecting Growth of Developing Country
http://slidepdf.com/reader/full/factors-affecting-growth-of-developing-country 4/18
Major Themes in Economics, Spring 201540
GDP growth (Sachs and Warner, 1995). This may be because poor countries fall into the natural resource trap. For one thing, the export of the natural resource leads to an appreciation in the exchange rate, whichmakes their other exports more expensive. This is known as “DutchDisease.” Also, diverting human and physical capital from other industries to the production of natural resources shrinks other industries(Collier, 2007). In addition, natural resource sales fuel corruption andother rent-seeking behavior. Some of the developing countries in Sub-Saharan Africa are rich in natural resources and have a very low per capita GDP.
Kumar and Woo (2010) found a linear inverse relationship betweeninitial debt and subsequent growth in a sample of emerging and advanced
economics. The impact of high debt was smaller in developed economies.They also found that only very high levels of the debt-to-GDP ratio hadsignificant negative effects on economic growth. Reinhart and Rogoff (2010) studied 20 developed economies for about two centuries and foundthat the negative relationship between growth and level of debt was veryweak.
However, Clements, Bhattacharya and Nguyen (2003) found that thesubstantial reduction in the stock of external debt for highly indebted poor countries would directly increase per capita income growth by about one percentage point per annum. Gelos, Sahay and Sandleris (2010)concluded that only larger and wealthier countries had access to larger credit and borrowed larger amounts and more frequently.
Because of the inaccessibility of external credit, most of thedeveloping countries relied on unilateral transfers of international fundsfor development. The World Bank Data (2015) reported that countries inthe Organization for Economic Co-operation and Development (OECD)contributed about 130 billion US Dollars to developing countries asOfficial Development Assistance. Minoiu and Reddy (2009) found thatdevelopment aid (as opposed to non-development aid) had positive androbust effects on subsequent growth. However, they suggested that sucheffects appeared after long time-lags. In the short run, such aid had noeffects on growth and development.
An increase in life expectancy is directly related to the control of diseases and better health. Increases in life expectancy have a direct
impact on population growth. A study by Acemoglu and Johnson (2006)cast doubt on the claim that unfavorable health conditions are the rootcause of poverty in some countries, but agree that improvement in healthconditions may lead to improvement in economic conditions. Another
7/25/2019 Factors Affecting Growth of Developing Country
http://slidepdf.com/reader/full/factors-affecting-growth-of-developing-country 5/18
Upreti: Factors Affecting Economic Growth 41
study by Cervellati and Sunde (2009) predicted that improvements in lifeexpectancy foster human capital accumulation and have an effect onincome generation.
The level of education is widely accepted as a factor in economicgrowth. Barro (1999) found that an additional year of schooling increasedthe country’s growth rate by 0.7 percent per year. Investment in humancapital enhances the workforce’s ability to work and increases productivity. Al Nassar (2007) noted that a worker’s level of educationwas a measure of human capital and was directly related to productivity.
Corruption and poor governance hinders the economic health of countries. Mauro studied 67 countries and concluded that annualeconomic growth increased 1.3 percentage points where corruption was
reduced by one standard deviation (Murro 1995). Poor countries that have people of different backgrounds, cultures, languages, and customs aremore vulnerable to corruption. Empirical models can test these claims andsee if they are true for both developing and developed economies.
III. Data and Method
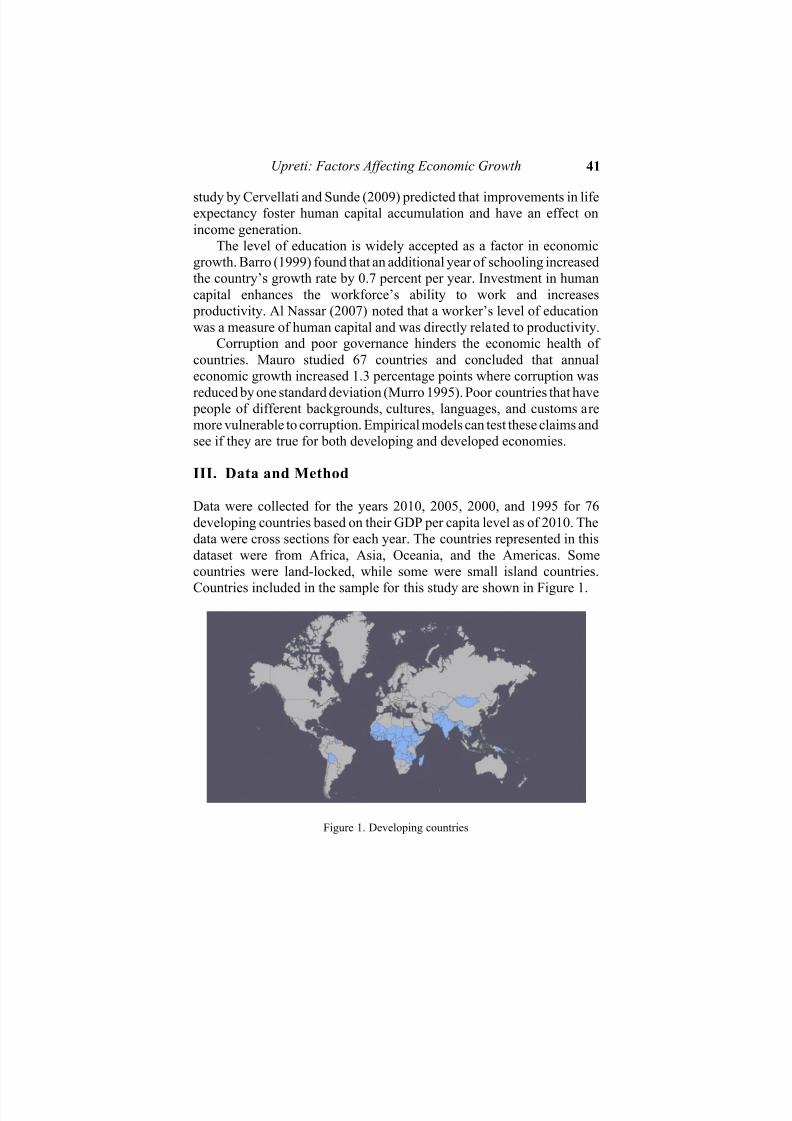
Data were collected for the years 2010, 2005, 2000, and 1995 for 76developing countries based on their GDP per capita level as of 2010. Thedata were cross sections for each year. The countries represented in thisdataset were from Africa, Asia, Oceania, and the Americas. Somecountries were land-locked, while some were small island countries.
Countries included in the sample for this study are shown in Figure 1.
Figure 1. Developing countries
7/25/2019 Factors Affecting Growth of Developing Country
http://slidepdf.com/reader/full/factors-affecting-growth-of-developing-country 6/18
Major Themes in Economics, Spring 201542
The list of developing countries was taken from the World Bank (2015). It included the World Bank's list of low-income and lower-middle
income economies. The data on GDP per capita growth rate, GDP per
capita, natural resource production, and life expectancy were taken from
the World Bank (2015). Data on the volume of exports, government debt,
and net foreign aid received were taken from the International Monetary
Fund (2015). The data on investment rates and foreign direct investment
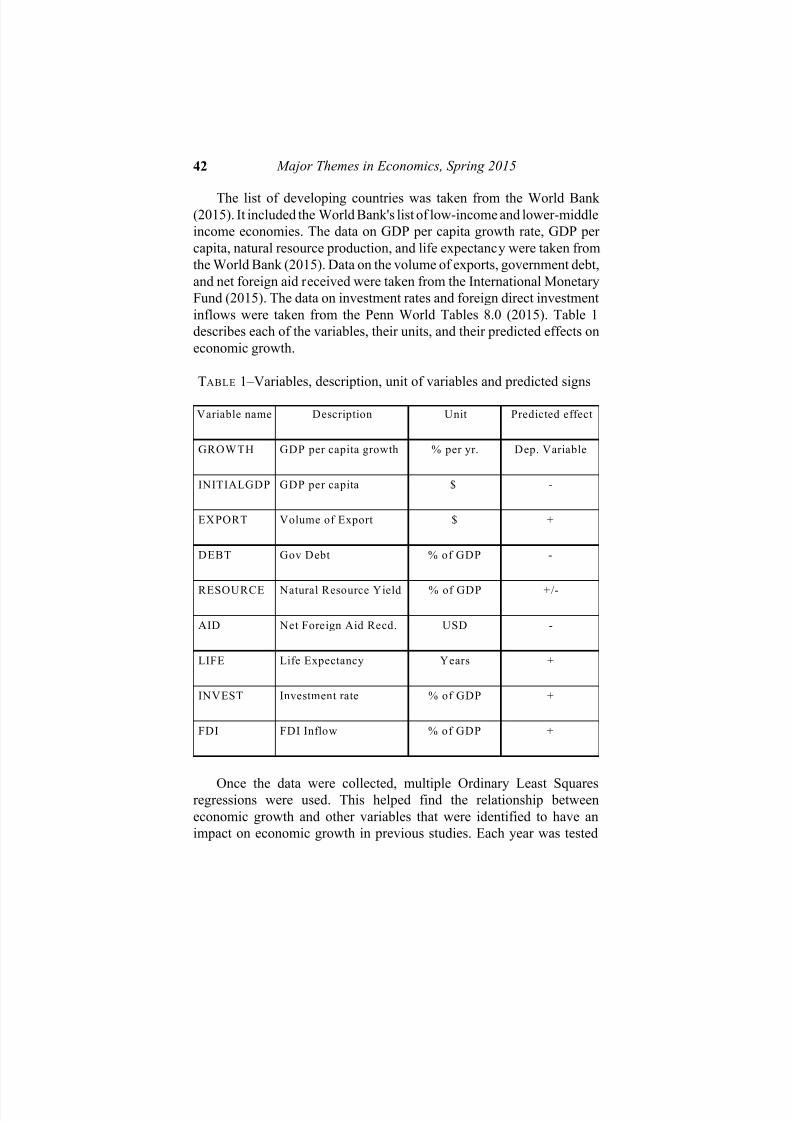
inflows were taken from the Penn World Tables 8.0 (2015). Table 1
describes each of the variables, their units, and their predicted effects on
economic growth.
TABLE 1–Variables, description, unit of variables and predicted signs
Variable name Description Unit Predicted effect
GROWTH GDP per capita growth % per yr. Dep. Variable
INITIALGDP GDP per capita $ -
EXPORT Volume of Export $ +
DEBT Gov Debt % of GDP -
RESOURCE Natural Resource Yield % of GDP +/-
AID Net Foreign Aid Recd. USD -
LIFE Life Expectancy Years +
INVEST Investment rate % of GDP +
FDI FDI Inflow % of GDP +
Once the data were collected, multiple Ordinary Least Squaresregressions were used. This helped find the relationship between
economic growth and other variables that were identified to have an
impact on economic growth in previous studies. Each year was tested
7/25/2019 Factors Affecting Growth of Developing Country
http://slidepdf.com/reader/full/factors-affecting-growth-of-developing-country 7/18
Upreti: Factors Affecting Economic Growth 43
separately and then compared with the other years to see if the resultsyielded were similar.
The proxy for economic growth was the growth rate of GDP per
capita, which was the dependent variable. The indicator for this variable
was GROWTH in the model. It was the percentage change in the per
capita GDP from the previous year to the next. For example, GDP per
capita growth for 2010 was the rate of change of GDP per capita from
2009 to 2010. Since countries could have had negative or positive growth
in any interval, this value could have been negative or positive. A higher
growth rate was desirable.
The first control variable was the starting level of GDP per capita
denoted by INITIALGDP in the model. It is the per capita GDP of the
year tested. The unit of this measure was constant 2005 purchasing power parity (PPP) dollars. Using purchasing power parity dollars controlled for
differences in price levels in different countries. Including this variable
in the statistical model controlled for the size of the economy. The theory
of conditional convergence implied that bigger economies tended to
expand slower than smaller economies. Including this variable controlled
for such effects in our model. The predicted sign of the INITIALGDP was
negative.
The second variable was volume of exports denoted by EXPORT. It
was the constant 2005 purchasing power parity dollar amount of goods
and services that the country exported in the calendar year. Economic
theories suggest that higher exports mean more openness to trade, which
implies higher gains. The expected sign of the coefficient was positive.
The third variable was the natural resources produced by the country
for its own use or export, which was indicated by RESOURCE. The unit
of this variable was the percentage of GDP. For example, if a country
produced $10,000 worth of natural resources and the GDP of that country
was $100,000, then RESOURCE would equal 10%. There have been
different claims about whether production and sales of natural resources
have positive or negative impacts on economic growth. The predicted sign
of the coefficient was ambiguous since previous research concluded that
the export of resources may have a positive effect, helping countries
grow, or a negative effect due to the Dutch Disease and rent seeking.
The fourth variable was the government debt owed to its people andforeigners; it was indicated by DEBT. The unit of this variable was also
percentage of GDP. Studies have found that a higher level of government
debt was associated with administrative mismanagement, some level of
7/25/2019 Factors Affecting Growth of Developing Country
http://slidepdf.com/reader/full/factors-affecting-growth-of-developing-country 8/18
Major Themes in Economics, Spring 201544
corruption, and high investment risk. So, the predicted sign for thisvariable was negative. However, there have been empirical
counterexamples, as Japan was able to grow, at a slower rate, even with
more than 200% of government debt (International Monetary fund 2015).
The fifth variable was the net foreign aid received by a country. It
was represented by AID and the unit was nominal US dollars. While
foreign aid was sent with good intentions, it hinted at economic problems
in the receiving countries or dependence on others. Thus the predicted
sign of the coefficient was negative.
The sixth variable was life expectancy, denoted by LIFE. The unit of
LIFE was number of years. Higher life expectancy meant that the country
had a better healthcare system, access to doctor and hospitals, and
promoted a healthy lifestyle. Those things could have only been achievedwith economic prosperity. Thus the predicted sign of coefficient of LIFE
was positive.
The seventh variable was investment in the country, denoted by
INVEST. The unit of INVEST was percentage of GDP. Investment was
the amount spent on creation of capital goods. The predicted sign of
INVEST was positive.
Finally, the eighth variable was foreign direct investment inflow into
the country which was represented by FDI. The unit of FDI was also
percentage of GDP. It was the amount foreign citizens or companies
invested in the local economy. Foreigners’ investment creates jobs and
additional economic activity that benefits the local economy. Thus, the
predicted sign of the coefficient of FDI was also positive.
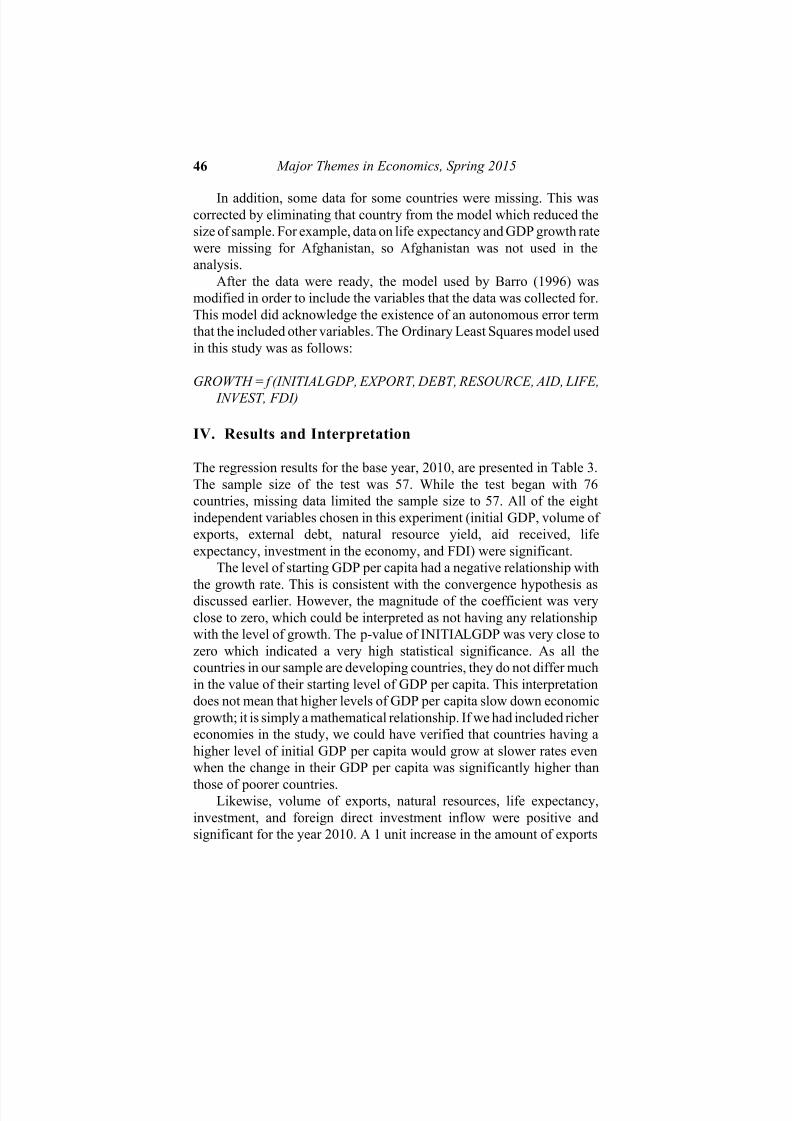
After the data were collected and filtered, descriptive statistics were
studied to understand the structure of the data. The descriptive statistics
of 2010, shown in Table 2, provided a sample of how the data behaved.
The average growth rate of the sample was about 5% per year with the
highest of just under 14% for Chad and the lowest for Haiti of about -
5.5% (Haiti suffered from a devastating earthquake in 2010). Eritrea’s
debt-to-GDP ratio was more than 140% and was the only country on this
list to have more than 100%. Natural resources contributed the least to
GDP in Tonga. Also, Angola was the only country that has a net outflow
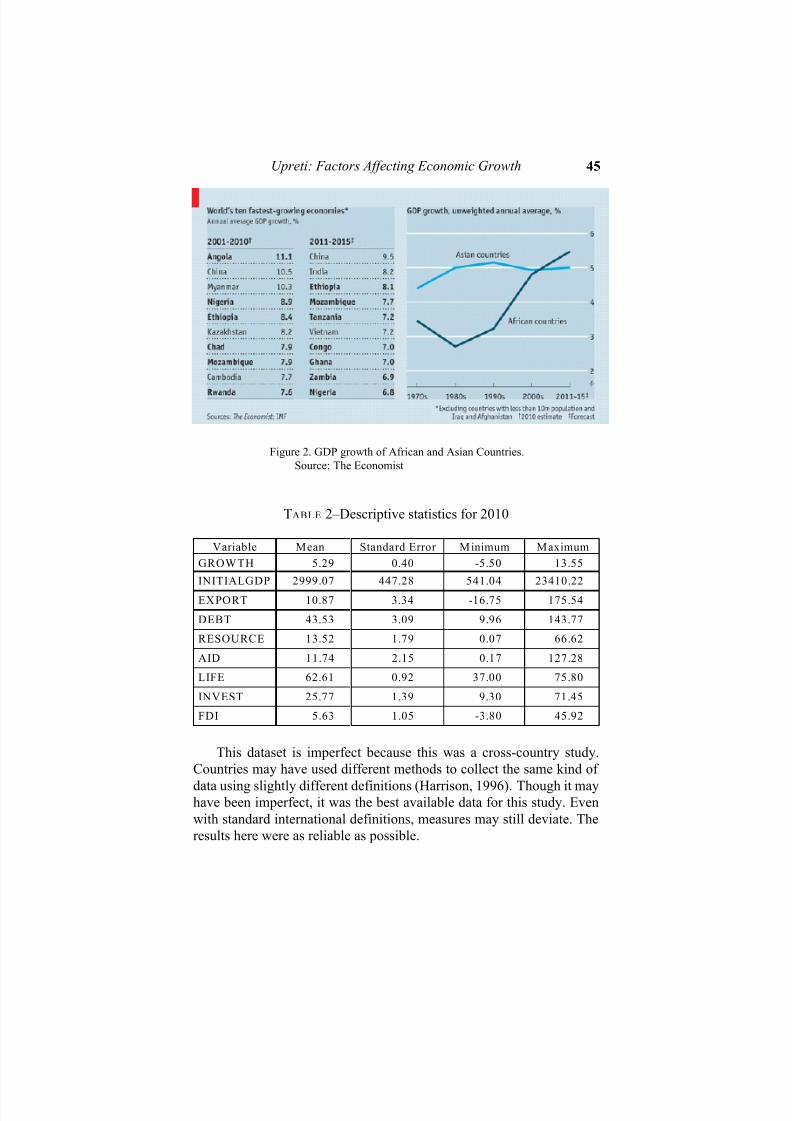
of foreign direct investment at the rate of -4%. The Economist reported
that sub- Saharan countries have grown faster than any other groups since1980s (2011), as indicated in Figure 2.
7/25/2019 Factors Affecting Growth of Developing Country
http://slidepdf.com/reader/full/factors-affecting-growth-of-developing-country 9/18
Upreti: Factors Affecting Economic Growth 45
Figure 2. GDP growth of African and Asian Countries.
Source: The Economist
TABLE 2–Descriptive statistics for 2010
Variable Mean Standard Error Minimum Maximum
GROWTH 5.29 0.40 -5.50 13.55
INITIALGDP 2999.07 447.28 541.04 23410.22
EXPORT 10.87 3.34 -16.75 175.54
DEBT 43.53 3.09 9.96 143.77
RESOURCE 13.52 1.79 0.07 66.62
AID 11.74 2.15 0.17 127.28
LIFE 62.61 0.92 37.00 75.80
INVEST 25.77 1.39 9.30 71.45
FDI 5.63 1.05 -3.80 45.92
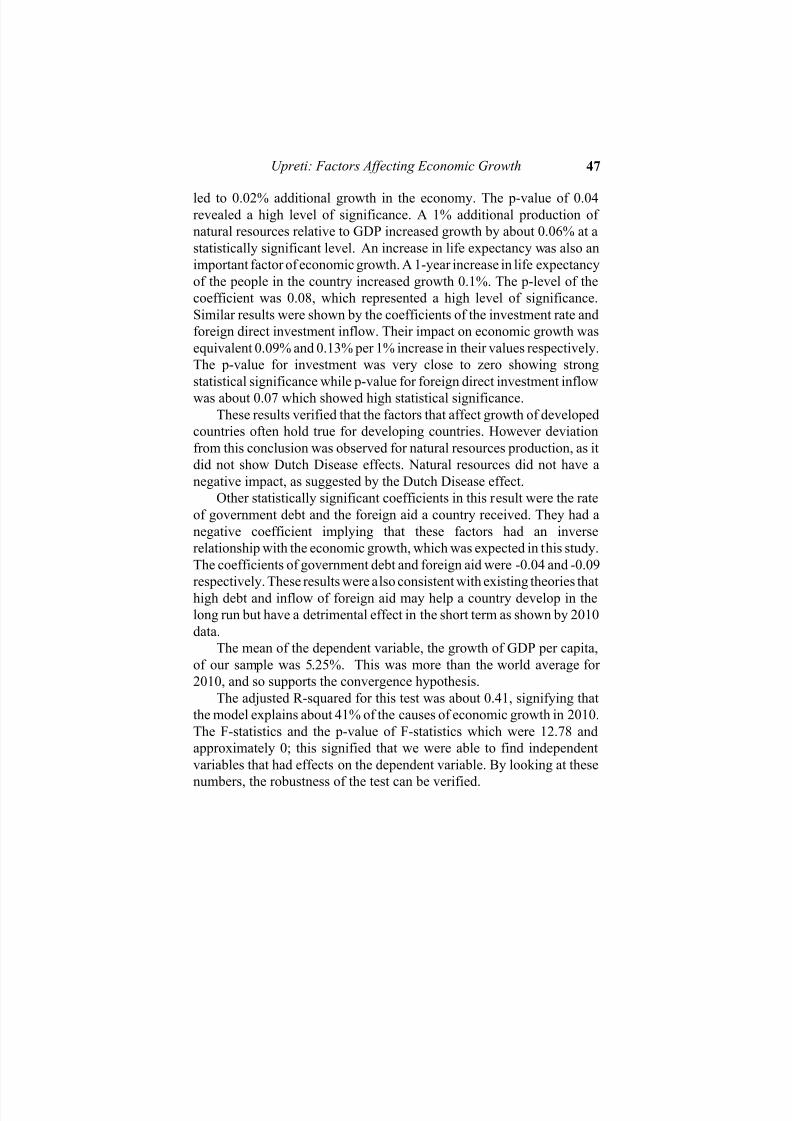
This dataset is imperfect because this was a cross-country study.
Countries may have used different methods to collect the same kind of
data using slightly different definitions (Harrison, 1996). Though it mayhave been imperfect, it was the best available data for this study. Even
with standard international definitions, measures may still deviate. The
results here were as reliable as possible.
7/25/2019 Factors Affecting Growth of Developing Country
http://slidepdf.com/reader/full/factors-affecting-growth-of-developing-country 10/18
Major Themes in Economics, Spring 201546
In addition, some data for some countries were missing. This wascorrected by eliminating that country from the model which reduced the
size of sample. For example, data on life expectancy and GDP growth rate
were missing for Afghanistan, so Afghanistan was not used in the
analysis.
After the data were ready, the model used by Barro (1996) was
modified in order to include the variables that the data was collected for.
This model did acknowledge the existence of an autonomous error term
that the included other variables. The Ordinary Least Squares model used
in this study was as follows:
GROWTH = f (INITIALGDP, EXPORT, DEBT, RESOURCE, AID, LIFE,
INVEST, FDI)
IV. Results and Interpretation
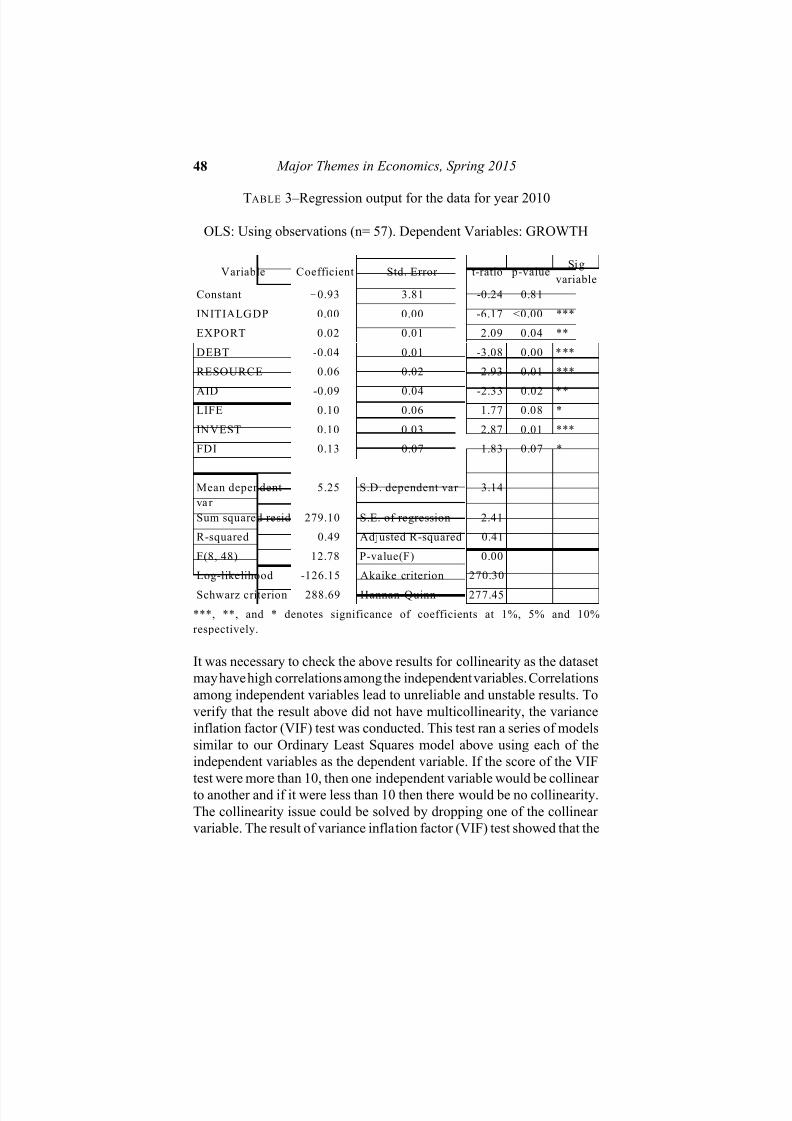
The regression results for the base year, 2010, are presented in Table 3.
The sample size of the test was 57. While the test began with 76
countries, missing data limited the sample size to 57. All of the eight
independent variables chosen in this experiment (initial GDP, volume of
exports, external debt, natural resource yield, aid received, life
expectancy, investment in the economy, and FDI) were significant.
The level of starting GDP per capita had a negative relationship with
the growth rate. This is consistent with the convergence hypothesis asdiscussed earlier. However, the magnitude of the coefficient was very
close to zero, which could be interpreted as not having any relationship
with the level of growth. The p-value of INITIALGDP was very close to
zero which indicated a very high statistical significance. As all the
countries in our sample are developing countries, they do not differ much
in the value of their starting level of GDP per capita. This interpretation
does not mean that higher levels of GDP per capita slow down economic
growth; it is simply a mathematical relationship. If we had included richer
economies in the study, we could have verified that countries having a
higher level of initial GDP per capita would grow at slower rates even
when the change in their GDP per capita was significantly higher than
those of poorer countries.Likewise, volume of exports, natural resources, life expectancy,
investment, and foreign direct investment inflow were positive and
significant for the year 2010. A 1 unit increase in the amount of exports
7/25/2019 Factors Affecting Growth of Developing Country
http://slidepdf.com/reader/full/factors-affecting-growth-of-developing-country 11/18
Upreti: Factors Affecting Economic Growth 47
led to 0.02% additional growth in the economy. The p-value of 0.04revealed a high level of significance. A 1% additional production of
natural resources relative to GDP increased growth by about 0.06% at a
statistically significant level. An increase in life expectancy was also an
important factor of economic growth. A 1-year increase in life expectancy
of the people in the country increased growth 0.1%. The p-level of the
coefficient was 0.08, which represented a high level of significance.
Similar results were shown by the coefficients of the investment rate and
foreign direct investment inflow. Their impact on economic growth was
equivalent 0.09% and 0.13% per 1% increase in their values respectively.
The p-value for investment was very close to zero showing strong
statistical significance while p-value for foreign direct investment inflow
was about 0.07 which showed high statistical significance.These results verified that the factors that affect growth of developed
countries often hold true for developing countries. However deviation
from this conclusion was observed for natural resources production, as it
did not show Dutch Disease effects. Natural resources did not have a
negative impact, as suggested by the Dutch Disease effect.
Other statistically significant coefficients in this result were the rate
of government debt and the foreign aid a country received. They had a
negative coefficient implying that these factors had an inverse
relationship with the economic growth, which was expected in this study.
The coefficients of government debt and foreign aid were -0.04 and -0.09
respectively. These results were also consistent with existing theories that
high debt and inflow of foreign aid may help a country develop in the
long run but have a detrimental effect in the short term as shown by 2010
data.
The mean of the dependent variable, the growth of GDP per capita,
of our sample was 5.25%. This was more than the world average for
2010, and so supports the convergence hypothesis.
The adjusted R-squared for this test was about 0.41, signifying that
the model explains about 41% of the causes of economic growth in 2010.
The F-statistics and the p-value of F-statistics which were 12.78 and
approximately 0; this signified that we were able to find independent
variables that had effects on the dependent variable. By looking at these
numbers, the robustness of the test can be verified.
7/25/2019 Factors Affecting Growth of Developing Country
http://slidepdf.com/reader/full/factors-affecting-growth-of-developing-country 12/18
Major Themes in Economics, Spring 201548
TABLE 3–Regression output for the data for year 2010
OLS: Using observations (n= 57). Dependent Variables: GROWTH
Variable Coefficient Std. Error t-ratio p-valueSig
variable
Constant 0.93 3.81 -0.24 0.81
INITIALGDP 0.00 0.00 -6.17 <0.00 ***
EXPORT 0.02 0.01 2.09 0.04 **
DEBT -0.04 0.01 -3.08 0.00 ***
RESOURCE 0.06 0.02 2.93 0.01 ***
AID -0.09 0.04 -2.33 0.02 **LIFE 0.10 0.06 1.77 0.08 *
INVEST 0.10 0.03 2.87 0.01 ***
FDI 0.13 0.07 1.83 0.07 *
Mean dependent
var
5.25 S.D. dependent var 3.14
Sum squared resid 279.10 S.E. of regression 2.41
R-squared 0.49 Adjusted R-squared 0.41
F(8, 48) 12.78 P-value(F) 0.00
Log-likelihood -126.15 Akaike criterion 270.30
Schwarz criterion 288.69 Hannan-Quinn 277.45
***, **, and * denotes significance of coefficients at 1%, 5% and 10%
respectively.
It was necessary to check the above results for collinearity as the dataset
may have high correlations among the independent variables. Correlations
among independent variables lead to unreliable and unstable results. To
verify that the result above did not have multicollinearity, the variance
inflation factor (VIF) test was conducted. This test ran a series of models
similar to our Ordinary Least Squares model above using each of the
independent variables as the dependent variable. If the score of the VIF
test were more than 10, then one independent variable would be collinear
to another and if it were less than 10 then there would be no collinearity.
The collinearity issue could be solved by dropping one of the collinear
variable. The result of variance inflation factor (VIF) test showed that the
7/25/2019 Factors Affecting Growth of Developing Country
http://slidepdf.com/reader/full/factors-affecting-growth-of-developing-country 13/18
Upreti: Factors Affecting Economic Growth 49
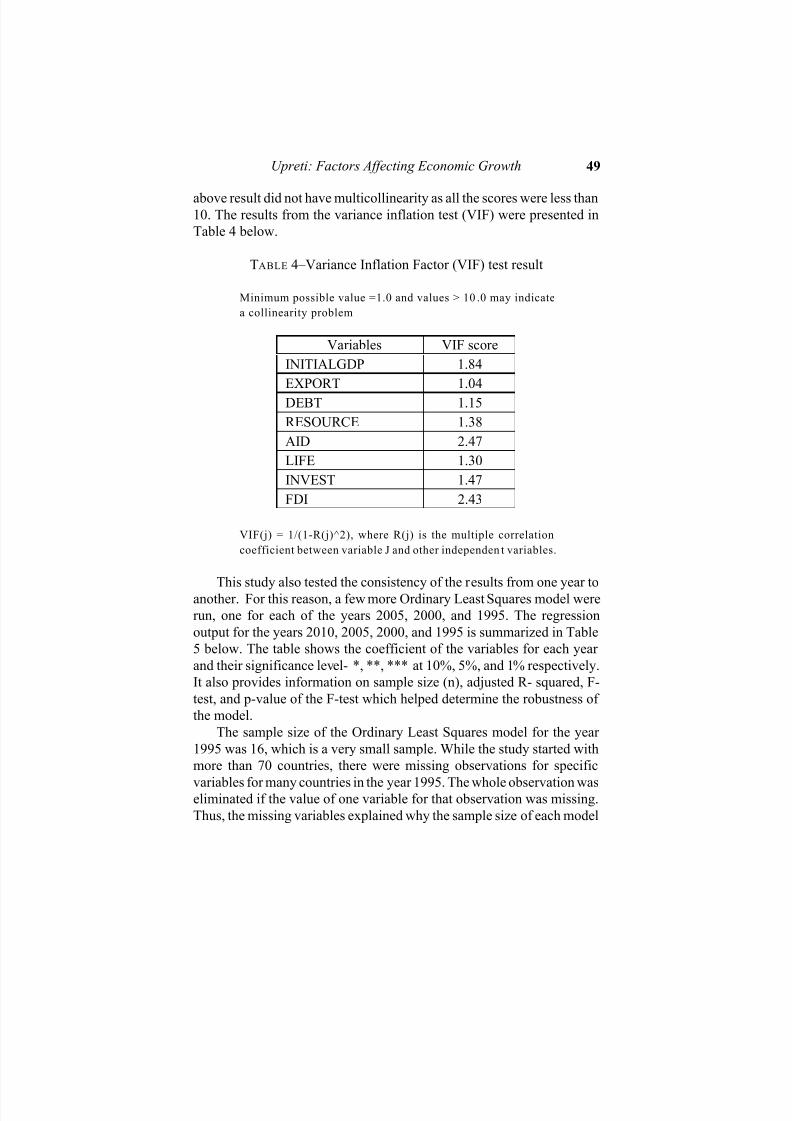
above result did not have multicollinearity as all the scores were less than10. The results from the variance inflation test (VIF) were presented in
Table 4 below.
TABLE 4–Variance Inflation Factor (VIF) test result
Minimum possible value =1.0 and values > 10 .0 may indicate
a collinearity problem
Variables VIF score
INITIALGDP 1.84
EXPORT 1.04
DEBT 1.15
RESOURCE 1.38
AID 2.47
LIFE 1.30
INVEST 1.47
FDI 2.43
VIF(j) = 1/(1-R(j)^2), where R(j) is the multiple correlation
coefficient between variable J and other independen t variables.
This study also tested the consistency of the results from one year toanother. For this reason, a few more Ordinary Least Squares model were
run, one for each of the years 2005, 2000, and 1995. The regression
output for the years 2010, 2005, 2000, and 1995 is summarized in Table
5 below. The table shows the coefficient of the variables for each year
and their significance level- *, **, *** at 10%, 5%, and 1% respectively.
It also provides information on sample size (n), adjusted R- squared, F-
test, and p-value of the F-test which helped determine the robustness of
the model.
The sample size of the Ordinary Least Squares model for the year
1995 was 16, which is a very small sample. While the study started with
more than 70 countries, there were missing observations for specific
variables for many countries in the year 1995. The whole observation waseliminated if the value of one variable for that observation was missing.
Thus, the missing variables explained why the sample size of each model
7/25/2019 Factors Affecting Growth of Developing Country
http://slidepdf.com/reader/full/factors-affecting-growth-of-developing-country 14/18
Major Themes in Economics, Spring 201550
was different. Therefore the result for the year 1995 was ignored in thediscussion about consistency overall.
The comparison of three Ordinary Least Squares models showed the
factors that had a positive effect on economic growth in developing
countries. It showed that the volume of exports and production of natural
resources were the best sources of economic growth for the developing
countries. The coefficients of both the variables were positive and highly
significant across all three time periods. It also showed that the increase
in life expectancy and the increase in investment had positive impacts on
the economic growth for three of the four time periods studied. The
coefficients of life expectancy and investment variables were significant
at 10% and 1%, respectively. Thus, this showed that openness to trade,
production and use of natural resources, better health services leading tolonger life, and investment in the economy were positive factors for
economic growth in developing countries. Therefore, policies promoting
these factors should be encouraged.
On the other hand, we were not able to verify the theory of
convergence, effects of debt, and effects of aid. The coefficient for
starting level of GDP per capita was almost zero for the years 2005 and
2000. This meant that for all developing countries, the initial size of GDP
per capita did not matter. But this variable was not statistically significant
for the years 2005 and 2000. In general, we do not have statistical
evidence to say that theory of convergence held true. Likewise, the
coefficient for government debt and the level of international aid, which
were expected to have negative effects on economic growth, were not
statistically significant. Therefore, there was not enough evidence to draw
the conclusions that high government debt and high foreign aid inflow
had a detrimental effect on a developing country’s economy.
Finally, it was noted earlier that the coefficient of the foreign direct
investment inflow was positive in the year 2010. But the coefficient in the
year 2000 was negative. Both coefficients were statistically significant at
the10% level. The expected coefficient for foreign direct investment was
positive. Thus, this result is different than what the study had expected.
This study was unable to verify the hypothesis that foreign direct
investment has a positive impact on economic growth. Further studies are
required to verify if the foreign direct investment inflow has an impact onthe economic growth of developing countries.
Overall, the Ordinary Least Squares models used to compare the
results were able to provide insight on the factors of economic growth in
7/25/2019 Factors Affecting Growth of Developing Country
http://slidepdf.com/reader/full/factors-affecting-growth-of-developing-country 15/18
Upreti: Factors Affecting Economic Growth 51
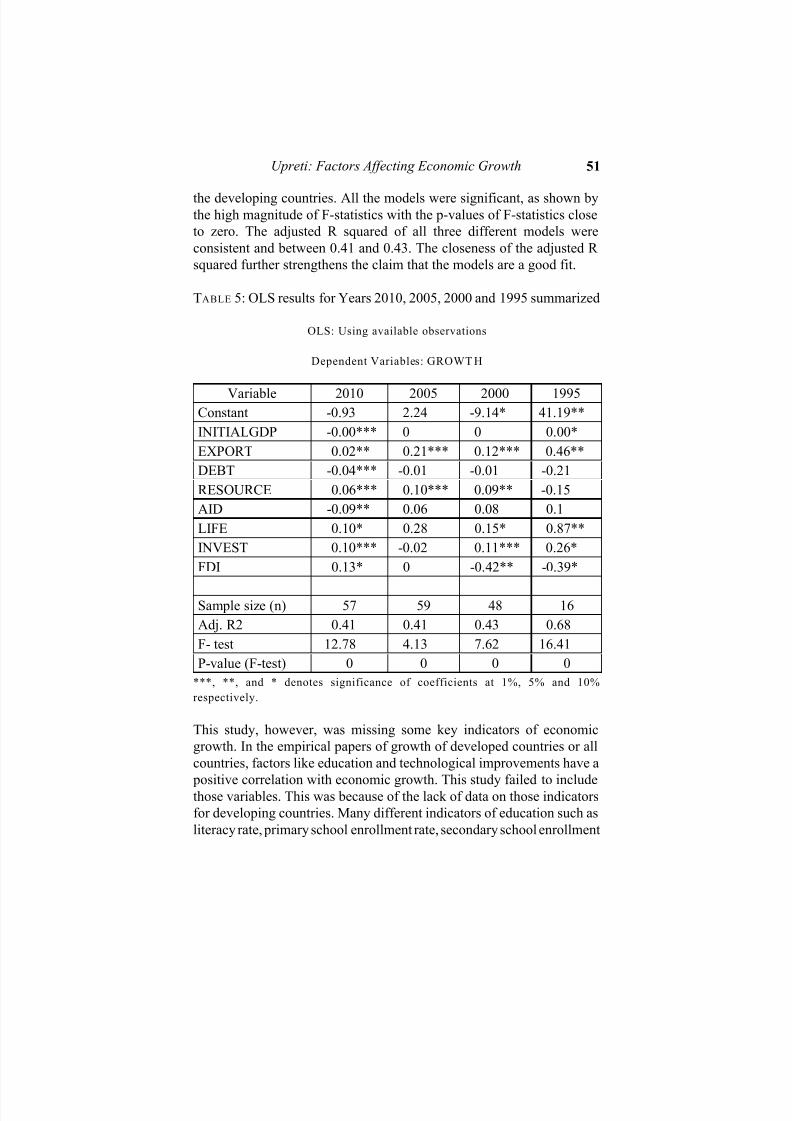
the developing countries. All the models were significant, as shown bythe high magnitude of F-statistics with the p-values of F-statistics close
to zero. The adjusted R squared of all three different models were
consistent and between 0.41 and 0.43. The closeness of the adjusted R
squared further strengthens the claim that the models are a good fit.
TABLE 5: OLS results for Years 2010, 2005, 2000 and 1995 summarized
OLS: Using available observations
Dependent Variables: GROWT H
Variable 2010 2005 2000 1995Constant -0.93 2.24 -9.14* 41.19**
INITIALGDP -0.00*** 0 0 0.00*
EXPORT 0.02** 0.21*** 0.12*** 0.46**
DEBT -0.04*** -0.01 -0.01 -0.21
RESOURCE 0.06*** 0.10*** 0.09** -0.15
AID -0.09** 0.06 0.08 0.1
LIFE 0.10* 0.28 0.15* 0.87**
INVEST 0.10*** -0.02 0.11*** 0.26*
FDI 0.13* 0 -0.42** -0.39*
Sample size (n) 57 59 48 16
Adj. R2 0.41 0.41 0.43 0.68
F- test 12.78 4.13 7.62 16.41
P-value (F-test) 0 0 0 0
***, **, and * denotes significance of coefficients at 1%, 5% and 10%
respectively.
This study, however, was missing some key indicators of economic
growth. In the empirical papers of growth of developed countries or all
countries, factors like education and technological improvements have a
positive correlation with economic growth. This study failed to includethose variables. This was because of the lack of data on those indicators
for developing countries. Many different indicators of education such as
literacy rate, primary school enrollment rate, secondary school enrollment
7/25/2019 Factors Affecting Growth of Developing Country
http://slidepdf.com/reader/full/factors-affecting-growth-of-developing-country 16/18
Major Themes in Economics, Spring 201552
rate, etc. and indicators of technology such as internet access, mobile phone access, patent registration, etc. were considered but data could not
be found for most of the countries considered in the sample. Also,
previous studies in development economics considered using variables
like effectiveness of governance, corruption, rule of law, internal conflict,
religion of people, etc. Due to the limited nature of this study and issues
of data availability, those variables were not used here. Missing variables
in this study might have created omitted variable bias. By carefully
identifying important variables and including those variables in the model
the results could be improved which could have significant policy
implications for developing economies.
V. Conclusion
This study use Ordinary Least Squares regressions for the years 2010,
2005, 2000, and 1995 to investigate the factors that contribute to
economic growth. Then it compares them across time to find if the
patterns in the variables are consistent. It finds that the volume of exports
and the production of natural resources have positive impacts on
economic growth in developing countries during all time periods
measured. It also finds that higher life expectancy and increases in
investment have a positive impact on economic growth, but this result
was only valid for three out of four time periods. These findings are
consistent with previous research and some of these factors have the sameeffect on economic growth of both developed and developing countries.
Furthermore, no evidence of Dutch Disease Effect was found.
However, this study does not give clear indication on the effects of
some variables on economic growth of developing countries. First, it finds
contradictory result on the effects of foreign direct investment on
economic growth. It finds that inflow of foreign investment had positive
effects on economic growth in one time period, whereas it has a negative
effect in another for developing countries. This calls for additional
research in the role of foreign direct investment in developing countries.
Second, it does not provide enough evidence on the conditional
convergence theory that big economies grow slower. One explanation of
that outcome is that most of the developing economies have the samelevel of initial GDP per capita level. Additional research may be able to
determine if developing economies who all start at the same levels of per
capita GDP show convergence in the long run.
7/25/2019 Factors Affecting Growth of Developing Country
http://slidepdf.com/reader/full/factors-affecting-growth-of-developing-country 17/18
Upreti: Factors Affecting Economic Growth 53
In addition, the models do not find consistent results for the effectsof government debt and foreign aid inflow on economic growth. The first
model showed a negative effect of high level of government debt and high
levels foreign aid. But additional models do not complement the findings,
thus leaving a gap in the study to be filled by future studies.
While this study has political implications on how to effectively raise
the economic conditions of developing countries, more research needs to
be done. Better data would help. Specific case studies on developing
countries that are growing at a faster rate may also help answer some of
the growth-related questions. Future researchers should run time series or
panel analysis using a similar dataset to verify the results from this study.
The policy suggestions generated by such research could have a
significant impact on the growth rates of developing countries.
References
Acemoglu, Daron, and Simon Johnson. 2006. Disease and Development: the Effect of Life Expectancy and Economic Growth. Bureau of Research and Economic Analysis
of Development. Working Paper: 120.
Al Nasser, Omar M. 2007. The Determinants of the U.S. Foreign Direct Investment:
Does the Region Matter? Global Economic Review v.36, n.1: 37-51.
Barro, Robert J. 1996. Determinants of Economic Growth: A Cross-Country Empirical
Study. National Bureau of Economic Research, Working Paper: 5698.
Barro, Robert J. 1999. Determinants of Economic Growth: Implications of the GlobalEvidence for Chile. Cuadernos de Economia v.36, n.107:443-478.
Borensztein, E., J. De Gregorio, and J-W. Lee. 1998. How Does Foreign DirectInvestment Affect Economic Growth? Journal of International Economics 45: 115-
135.
Caves, Richard E. 1971. International Corporations: The Industrial Economics of Foreign
Investment, Economica 38: 1-27.
Cervellati, Matteco. and Uwe Sunde. 2009. Life Expectancy and Economic Growth: TheRole of Demographic Transition. The Institute for the Study of Labor (IZA).
Discussion Paper no. 4160.
Clements, Benedict J., Rina Bhattacharya, and Toan Q. Nguyen. 2003. External Debt,
Public Investment, and Growth in Low-Income Countries. International Monetary
Fund . Working Paper: 249.
Collier, Paul. 2007. The Bottom Billion: Why the Poorest Countries are Failing and What
Can be Done About It. New York: Oxford University Press.
Gelos, Gaston R., Ratna Sahay, and Guido Sandlers. 2010. Sovereign Borrowing byDeveloping Countries: What Determines Market Access? Journal of International
Economics. 83: 243-254.
Hanson, Gordon H. 2010. Why Isn’t Mexico Rich? Journal of Economic Literature
48:987-1004.
7/25/2019 Factors Affecting Growth of Developing Country
http://slidepdf.com/reader/full/factors-affecting-growth-of-developing-country 18/18
Major Themes in Economics, Spring 201554
Harrison, Ann. 1996. Openness and Growth: A Time-Series, Cross-Country Analysis for Developing Countries. Journal of Development Economics 48: 419-447.
International Monetary Fund. 2015 World Economic Outlook Database.
https://www.imf.org/external/pubs/ft/weo/2014/02/weodata/index.aspx. (accessed
January 31, 2015)
Kavoussi, Rostam M. 1985. International Trade and Economic Development: The
Experience of Developing Countries. Journal of Developing Areas 19: 379-392.
Kumar, Manmohan S., and Jaejoon Woo. 2010. Public Debt and Growth. International
Monetary Fund. Working Paper no. 174
Mauro, Paolo. 1995. Corruption and Growth. The Quarterly Journal of Economics v.110,
n. 3: 681-712.
Minoiu, Camelia. and Sanjaya Reddy. 2009. Development Aid and Economic Growth:
A Positive Long-Run Relation. International Monetary Fund . Working Paper: 118.
Rheinhart, Carmen, and Kenneth Rogoff. 2010. Growth in a Time of Debt. National
Bureau of Economic Research. Working Paper: 15639.Sachs, Jeffery D. and Andrew M. Warner. 1995. Natural Resource Abundance and
Economic Growth. National Bureau of Economic Research Working Paper Series:
5398.
Penn World Table. 2015. Penn World Table 8.0.
http://www.rug.nl/research/ggdc/data/pwt/ (Accessed January 31, 2015)
The Economist. “Africa’s Impressive Growth” January 6, 2011
http://www.economist.com/blogs/dailychart/2011/01/daily_chart (accessed March 15,2015)
The World Bank. 2015 Economic Indicators. http://data.worldbank.org/data-catalog.
(accessed January 31, 2015)