Embed Size (px)
Citation preview

01METALS ENVIRONMENTAL RISK ASSESSMENT GUIDANCE
MERAGRisk characterisation
MAY 2016
Check you have the most recent fact sheet by visiting www.icmm.com
FACT SHEET

CONTENTS
01 Introduction 02
02 Risk characterisation: deterministic versus probabilistic
2.1 Deterministic risk characterisation approach 06
2.2 Probabilistic risk characterisation approach 07
2.2.1 General 07
2.2.2 Probabilistic risk quotient method 14
2.2.3 Joint probability curve 15
2.2.4 Interpretation of ECD and/or SSD curve 16
2.2.5 Spatially referenced regional risk characterisation 17
ANNEX 1: Added versus total risk approach and its use in risk assessment and/or
environmental quality setting 20
ANNEX 2: Combined risk assessment/combined toxicity 33
References 36
The content of the Metal Risk Assessment Guidance (MERAG) fact sheets reflect the experiences and
recent progress made with environmental risk assessment methods, concepts and methodologies used
in Chemicals Management programs and Environmental Quality Standards setting (soil, water,
sediments, …) for metals. Because science keeps evolving, these fact sheets will be updated on a
regular basis to take into account new developments.

MERAG FACT SHEET 01 – March 2016 2
1. INTRODUCTION
In the risk characterisation phase of a risk assessment, modelled or measured environmental
concentrations are compared to toxicity values for each environmental compartment to identify
risk magnitude and probabilities. The current fact sheet presents the general building blocks of
a risk characterisation strategy that will allow compliance in an anticipative way with
forthcoming legislative obligations while ensuring, at the same time, that the best option for
managing risks presented by metals/metal compounds is considered. To this end, a tiered
approach is advocated because data availability will depend on the type of metal/metal
compound under investigation, allowing for further refinement of the assessment following two
not mutually exclusive dimensions: refinement 1: total dissolved bioavailable
biogeochemical or metallo-regions and refinement; 2: deterministic probabilistic.
The incorporation of the bioavailability concept into the risk assessment context of water,
sediment and soils is the preferred way forward. Bioavailability concepts are discussed in
detail in MERAG Fact Sheet 5. There, the bioavailability approach builds further on the total
risk approach and can be seen as the scientifically most appropriate way in assessing risks for
metals. However, it is acknowledged that in some particular cases (eg, setting of
environmental effects thresholds) the use of the added risk approach may have its merits. A
discussion on the assumptions/differences and limitations on the conventionally used total risk
approach (TRA) versus the added risk approach (ARA) is further elaborated in Annex 1 to this
Fact Sheet.
The remainder of this Fact Sheet discusses the general principles of risk assessment and
explores more in depth of how risk assessments can be refined, taking into account
bioavailability or using probabilistic techniques. Therefore, the term PNEC (Predicted No Effect
Concentration) is used as an example of an environmental threshold value (ETV) throughout
this section. Because metals in the environment most likely occur in mixtures, Annex 2
explores potential metal mixture toxicity approaches that could be used.
Figure 1 below outlines the generic tiered approach for the characterisation of risks to
ecosystems associated with metals/metal compounds.

MERAG FACT SHEET 01 – March 2016 3
Figure 1: Generic tiered approach for performing the risk characterisation for metals/metal compounds
(PEC: Predicted Environmental Concentration, PNEC: Predicted No Effect Concentration)
no
Calculatetotal PEC
Calculatetotal PNEC
Potentialrisks ?
risk
man
age
me
nt
no further actions
Potentialrisks ?
Potentialrisks ?
Potentialrisks ?
option2
Potentialrisks ?
Potentialrisks ?
yes
yes
option2
no
Option 1: refinement (deterministic > probabilistic)
Op
tion
2: refinem
ent (to
tal > p
hysic
o-ch
emical >
bio
-available >
bio
geo
chem
ical regio
n)
option1
option1
option1
option2
PNEC < background?
yes
Incorporate probabilistic
concepts
Incorporate probabilistic
concepts
Incorporate probabilistic
concepts
Incorporate probabilistic
concepts
Perform soluble transformation
Perform bioavailability normalisation
Perform bioavailability normalisation
Potentialrisks ?
Potentialrisks ?
option1
option2
To
tal
Ph
ysic
o-
chem
ical
Bio
-av
aila
bil
ity
Bio
geo
-ch
emic
al r
egio
n

MERAG FACT SHEET 01 – March 2016 4
The possibility for further refinement at every tier is governed by the availability of data, while
the need for refinement results from the risk level and/or the magnitude of the required
response.
Two dimensions are proposed for possible refinements, although they are not mutually
exclusive (visualised as two axes in Figure 1). Concepts relative to bioavailability and
biogeochemical regions can be applied to both deterministic and probabilistic assessments.
Refinement 1 deals with assessing the bioavailable fraction. Incorporation of the bioavailability
concept could be performed at different levels of refinement. A rudimentary but not preferred
way of taking into account (bio)availability is the use of dissolved concentrations. The use of
speciation models could help to determine the free metal ion concentration, quite often
associated with metal toxicity.
But preferentially, the assessment should be performed on a ‘bioavailable’ basis. For this
purpose ambient dissolved metal concentrations and appropriate toxicity-related bioavailability
models (eg, Biotic Ligand Model) could be used. For further details see MERAG Fact Sheet 5).
It should also be recognized that due to local or regional differences in geochemistry, the
physico-chemical parameters influencing bioavailability can be quite different, in a similar way,
metal (natural) background will vary to a large extent (see more information in MERAG Fact
Sheet 2). A local or regional environmental compartment (water, soil, and sediment) is hence
not characterised by one single set of abiotic factors/background, but rather is represented by
a range of abiotic factors/metal backgrounds. The abiotic factors variation in space may have
a significant impact and should be taken fully into account in the risk assessment process. It is
therefore critical to understand which geochemical characteristics influence the toxicity of each
metal and metal compound and different biogeochemical ecoregions should be identified
where possible. Because biology also plays an important role in determining the level of
response to a given metal concentration, this concept may be extended to include the premise
that those species that are not present in the region under investigation should be excluded in
the environmental threshold derivation (ETV). Examples of ETV’s are Predicted No Effect
Concentrations (PNEC); Environmental Quality Standards (EQS), etc derivation. Potential
risks that metals may pose should be assessed within properly defined specific
river/stream/lake eco-regions.
Currently, guidance on the application of the biogeochemical region concept is being
developed for the aquatic compartment (Annex 1), but the same concepts apply to the other
environmental compartments (sediments and soil).
In the second axis of refinement, ie moving from a deterministic to a probabilistic approach,
the inherent spatial and temporal variability and estimate or measurement uncertainty of
exposure concentrations and the inter-species variability of effects are fully integrated into the
risk analysis. The initial (or screening) deterministic approach uses a simplified and often

MERAG FACT SHEET 01 – March 2016 5
unrealistic worst-case single extreme exposure concentration (EEC) (for example Predicted
Environmental Concentration (PEC) and single ETV (example PNEC), in which the risk is
subsequently quantified as a quotient of single values. This results in a “bright line” where
“risk” is assumed if the exposure estimate is greater than the environmental threshold value
and “no risk” is ascribed to the alternative. It provides no information about the probability of
the occurrence of an adverse effect, which is the true definition of risk. However, because the
deterministic quotient is based on worst-case estimates, if a finding of “no risks” is identified at
this stage, no further action is required. When sufficient data are available, single point
estimates can be replaced by probability distributions which allow assessors to understand the
variability and uncertainty associated with both the exposure and effects sides of the risk
assessment. Generally, more realistic scenarios are developed, and the probabilistic risk
assessment (PRA) results in an evaluation of the probability of occurrence as well as the
magnitude of effect.
It should, however, be acknowledged that a PRA is slightly more complex to compute and can
be more difficult to communicate to risk managers than a deterministic approach that simply
compares two numbers. Therefore, PRA may be more valuable when the risk boundary is
approached and less valuable when the deterministic approach indicates a very low or very
high risk. Finally, in addition to the PRA, a weight-of-evidence approach (eg, including field
assessments, direct toxicity testing, and predictive modelling) can be used to develop more
robust risk estimates (for more information on the weight-of-evidence approach, see Fact
Sheet 9 on this issue).
2. RISK CHARACTERISATION: DETERMINISTIC VERSUS PROBABILISTIC APPROACH
The key question of environmental risk characterisation of metals is to answer: “What is the
likelihood (ie probability) of adverse effects occurring to exposed ecological systems due to
exceedance of a toxicity level by an environmental metal concentration?” This question
assesses both the probability of occurrence (exposure) and the magnitude of effects.
However, for data-poor metals, the key question is usually simplified to: “Is it likely that
adverse effects occur to exposed ecological systems due to exceedance of a no-effect level by
an environmental concentration?”

MERAG FACT SHEET 01 – March 2016 6
2.1 Deterministic risk characterisation approach
Environmental risks are typically estimated in a deterministic way using single point estimates
for both exposure and effects. For example, the level corresponding to the protection of 95%
of the species, ie the PNEC value, is compared to a reasonable worst-case exposure
concentration in the environment, ie the PEC value, estimated as a high-end value (eg, 90th
percentile) (see Figure 2). This is done separately for each of the environmental compartments
of concern.
Inland environmental compartments that are distinguished in this regard are, for example, in
Europe (TGD 2003):
Aquatic ecosystem (including sediment);
Terrestrial ecosystem (including both the below- and above-ground compartments);
Atmosphere;
Aquatic and terrestrial top predators;
Micro-organisms in sewage treatment plants.
Marine environmental compartments:
Aquatic ecosystem (including sediments);
Top predators.
The estimations of PEC and PNEC are considered in other Fact Sheets. A list of the different
PEC/PNEC ratios that could be considered for the inland and marine environments is given in
Table 1.
Local scale Regional scale
PEClocalwater/PNECwater* PECregionalwater/PNECwater*
PEClocalsediment/PNECsediment* PECregionalsediment/PNECsediment
*
PEClocalsoil/PNECsoil PECregionalagr.soil/PNECsoil
PECstp/PNECmicro-organisms
PEClocal,oralfish vs PNEC,oralfish*
PEClocal, oralworm vs PNEC,oralworm
Table 1: Overview of PEC/PNEC ratios considered in the EU for inland risk assessment and marine risk
assessment (marine indicated with * if applicable) for different geographical scales
The potential risks of the metal in each environmental compartment are calculated as point
estimates, being the quotient of single values representing exposure and effects (ie

MERAG FACT SHEET 01 – March 2016 7
PEC/PNEC also known as the Risk Characterisation Ratio (RCR) ratio3 or Risk Quotient
(RQ)). A RCR value smaller than one (1) indicates that no further actions are required. A
RCR value exceeding one (1) suggests that the metal is present at levels that may pose
a risk to ecological receptors. Further refinement on the exposure side (additional
monitoring data, using site-specific information instead of defaults, reconsideration of
operational conditions and/or risk management measures) or a reality check of the derived
PNEC value (eg. if the PNEC is close to or even below reported background concentrations,
the PNEC could be revisited) is required until RCR is below one (1). This can require several
iterative loops. If no further refinement by taking into account bioavailability is possible or
feasible, risk reduction measures could be considered on the basis of a RCR.
2.2 Probabilistic risk characterisation approach
2.2.1 General
Single point or deterministic modelling involves using a single “best guess” or “worst-case”
estimate of each variable within a model to determine the model’s outcome(s). “What if”
scenarios are then conducted to determine how much that outcome might vary, depending
upon which input value is selected (for example, for metals, lower and upper estimates for
partitioning coefficients are typically used in the exposure assessment). Probabilistic risk
assessment is similar to developing “what if” scenarios in that it generates a number of
possible results and their attendant probabilities. However, it goes one step further by
effectively accounting for every possible value that each variable could take and weighting
each possible scenario by the probability of its occurrence. Probabilistic risk assessment
achieves this by applying a probability distribution to each variable. Guidance on probabilistic
risk assessment methods can be found in U.S. programs (ECOFRAM 1999; U.S. EPA 2001),
EU research programs on plant protection products (Hart 2001; EUFRAM 2005), and scientific
literature (Warren-Hicks and Hart 2010).
In a PRA, the point estimates (PEC and PNEC), used in the deterministic approach, are
replaced by probability distributions representing the inherent variability (and uncertainty in
case variability and uncertainty cannot be properly distinguished) in both the exposure and
effect parameters (see Figure 2). Variability represents inherent heterogeneity or diversity in a
well-characterised population or measurement method. Fundamentally a property of nature,
variability is not reducible through further measurement or study. Uncertainty, which can also
be incorporated into the probability distribution, represents partial ignorance or lack of perfect
3 Note that in some risk assessment schemes (eg, plant protection products in Europe), the RCR value is expressed as the inverse of this (ie PNEC/PEC); as a consequence, an RCR<1 indicates risk.

MERAG FACT SHEET 01 – March 2016 8
information about poorly characterised phenomena or models (eg, sampling or measurement
error) and is, however, reducible, generally through generation of more data to increase the
number of measurements. For more information, a separate MERAG Fact Sheet (Fact Sheet
7) is dedicated to uncertainty analysis.
Figure 2: Visualisation of the deterministic concepts PEC (Predicted Environmental Concentration) and
PNEC (Predicted No Effect Concentration) versus the probabilistic concepts of ECD
(Exposure Concentration Distribution) and SSD (Species Sensitivity Distribution)
Temporal and spatial variations of metal concentrations in the environment are captured in a
variability distribution, called the Exposure Concentration Distribution (ECD) (see Figure 2 left
side). The different sensitivities of various species to a metal are described in a variability
probability distribution could be called the effect concentration distribution. The most common
effect concentration distribution is the Species Sensitivity Distribution (SSD) and represents
inter-species variability (see Figure 3 right side). Both ECD and SSD can be represented as
probability density functions or cumulative probability distributions (Figure 3 presents
cumulative probability distributions). Note that the probability distributions can have different
interpretations depending on the data that were used to estimate them. For example, the
probability distribution on the effects side could also represent the spatial variability of the
PNEC due to spatial variability of bioavailability or the individual dose response curve of one
particular species (eg, top predator). Possible representations of the exposure and effects
distribution are:
Exposure: - Spatial variations of the exposure concentration
- Temporal variations of the exposure concentration (eg, at a local site)
- A combination of the representations above (as eg, in a regional assessment)
0%
20%
40%
60%
80%
100%
0.1 10 1000 100000
Concentration
Cum
ulat
ive
Pro
babi
lity
90th percentile
5th percentile
PEC PNEC
ECD SSD
MERAG FACT SHEET 01 – March 2016 9
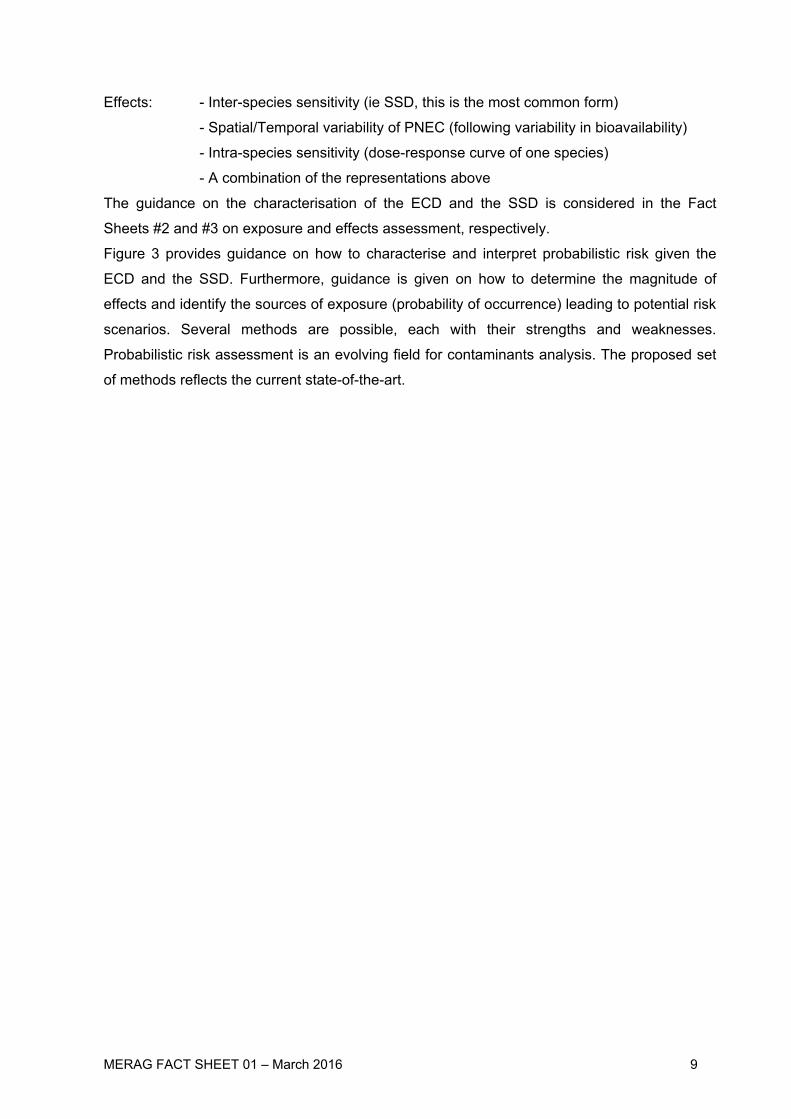
Effects: - Inter-species sensitivity (ie SSD, this is the most common form)
- Spatial/Temporal variability of PNEC (following variability in bioavailability)
- Intra-species sensitivity (dose-response curve of one species)
- A combination of the representations above
The guidance on the characterisation of the ECD and the SSD is considered in the Fact
Sheets #2 and #3 on exposure and effects assessment, respectively.
Figure 3 provides guidance on how to characterise and interpret probabilistic risk given the
ECD and the SSD. Furthermore, guidance is given on how to determine the magnitude of
effects and identify the sources of exposure (probability of occurrence) leading to potential risk
scenarios. Several methods are possible, each with their strengths and weaknesses.
Probabilistic risk assessment is an evolving field for contaminants analysis. The proposed set
of methods reflects the current state-of-the-art.

MERAG FACT SHEET 01 – March 2016 10
Figure 3: Guidance of risk characterisation, interpretation and refinement (field approaches have not yet
been completely developed)
The first step is to calculate the probabilistic risk (see Figure 3). If the calculated risk level is
acceptable, no further actions are deemed necessary (in analogy with the deterministic risk
characterisation). The probability of some randomly selected exposure concentration
exceeding a randomly selected species sensitivity or toxicity value has been demonstrated to
DetermineECD
DetermineSSD or Dose-Response
Calculate probabilistic risk
Probabilistic risk quotient method Section 2 . 2 . 2
Area under the Joint Probability CurveSection 2.2.3
Probabilisticrisk acceptable ?
(< a %)
No
furtheraction
Field approaches
Determine magnitude of effects andidentify sources of risk (probability of occurrence )
Interpretation of ECD and SSD
Section 2 . 2 . 4
Joint Probability CurveSection 2.2.3
No
Yes
Refinement possible?
No
Yes
Risk management

MERAG FACT SHEET 01 – March 2016 11
be a common measure of risk (an overview is given in Aldenberg et al (2002)). Guidance on
how to derive exposure concentration or toxicity value (eg, one single species value or a
geometric mean of values) can be found in the respective Fact Sheets on exposure and
effects assessment.
lueToxicityVaionConcentratExposurePRisk
where P( ) denotes “the probability of”
The probabilistic risk can alternatively be defined as the probability that the risk quotient
becomes larger than one. This can be written as:
Equation (1)
This definition is intuitively easier to understand because it is an extension of the well-known
and widely accepted Risk Characterisation Ratio (RCR) or PEC/PNEC ratio of the
deterministic risk assessment (see previous section). The main difference is that the inherent
variability of exposure and effects quantified in the ECD and the SSD are considered instead
of deriving point estimates as PEC and PNEC. Other probabilistic risk definitions, in which
either the exposure concentration or toxicity value is fixed in combination with a probability
distribution for, respectively, the toxicity value or exposure concentration, are also possible.
For example, the Potentially Affected Fraction (PAF) has been considered as an alternative
risk outcome. The PAF assessed the percentage of potentially affected species for a fixed
exposure concentration.
The probabilistic risk definition, as defined in equation 1, is more general and considers all
possible “what if”-scenarios. This comprises all possible combinations of the exposure
concentration and the toxicity values (both toxicity values above and below the deterministic
PNEC and both exposure concentrations above and below the deterministic PEC) because
these combinations also occur in the real environment, although with differing probability of
occurrence. Both (very) sensitive and insensitive species can be exposed to both low and high
concentrations in a particular location/region or during a particular season. Or in other words, a
probabilistic risk accounts for both the probability of occurrence (expressed by ECD) and the
magnitude of effect (expressed by SSD).
11
QuotientRiskP
lueToxicityVa
ionConcentratExposurePRisk

MERAG FACT SHEET 01 – March 2016 12
Note that a probabilistic risk does not require the specification of the level of protection in the
effects assessment (as eg, 95% protection level in SSD) and the exposure assessment (as eg,
90th percentile for PEC). Instead, an acceptability criterion only needs to be specified in the
risk characterisation phase. Acceptability criteria for risk management currently are lacking.
For deterministic assessments, it is generally accepted that a PEC/PNEC >1 is not acceptable
(and becomes less so as the quotient gets larger). But there is no consensus on an
acceptable probability of this happening, or whether the acceptable probability level changes
as the ratio increases. Different acceptable thresholds on probabilistic risk could be defined at
the regional and local scales. If the estimated probabilistic risk is smaller than that threshold,
no further action is needed. Identification of potential risks (when exceeding that threshold)
could be a trigger for further in-depth analysis (eg, considering spatial variability; incorporation
of bioavailability) as indicated in Figure 3.
Knowing the probability of risk does not decrease the actual risk. Instead, it provides a better
understanding of the risk estimate because likelihood of occurrence of an adverse effect of
different magnitudes is provided. This allows the risk manager to differentiate risk statements
such as eg, “negligible risk”, “low risk”, “medium risk”, “high risk” or other categories and which
risk category is most likely. A deterministic risk estimate only provides a “yes” or “no” answer,
without any statement of the likelihood associated with either outcome.
The probabilistic risk can be quantified using several methods (see Figure 3) of which the two
most important ones, reflecting the current state-of-the-art, are a) the probabilistic risk quotient
method (described in 2.2.2) and b) the area under the joint probability curve (described in
2.2.3). Mathematically, it can be shown that both methods result in the same risk estimate
(Aldenberg et al 2002). Consequently, the two methods are equally valid and either method
can be used to estimate the probabilistic risk. The risk assessor can therefore apply the
method that is in his/her opinion easier to understand, apply, and communicate.

MERAG FACT SHEET 01 – March 2016 13
Box 1: Consideration of disadvantages
of probabilistic risk characterisation
Criticism/disadvantage Clarification
No common standard/consensus
on methods to be used
Several frameworks in literature and ongoing initiatives
strive for standardisation and guidance (eg, ECOFRAM,
EUPRA, EUFRAM).
Complex output/complicated,
difficult to communicate and
interpret
This is an issue for some of the probabilistic outputs (eg,
joint probability curve). However, some probabilistic
concepts are easily accessible, interpretable and
communicable because these are extensions of the
deterministic concepts (eg, exposure concentration
distribution, species sensitivity distribution and risk
quotient distribution).
How to deal with probabilistic risk
in decision-making? (acceptability
criteria)
Acceptability criteria for risk management are currently
still lacking.
Lack of experience On an academic level, there is a lot of literature illustrating
probabilistic assessments. In risk assessment practice,
there is already experience in other fields (eg, EU Water
Framework Directive, UK consenting of dangerous
substances in discharges to surface waters, U.S. EPA
Superfund). In addition, “lack of experience” is a weak
argument because it can be used against any scientific
development. Also, probabilistic methods are well
established in other fields such as engineering and
finance.
Probabilistic risks contain less
conservatism or are a
mathematical artifact to decrease
risk
A probabilistic risk does not decrease the actual risk.
Instead, it is a true, more robust estimate of the risk and
therefore allows the risk manager to differentiate between
different risk levels or the probability of occurrence of an
adverse outcome. Probabilistic methods deal with
uncertainty differently (by separating it from risk
characterisation) and are for this reason a precautionary-
driven approach (Verdonck et al 2005).

MERAG FACT SHEET 01 – March 2016 14
To assist with the risk communication, the species that will be impacted or the amount of
impact to an individual species (ie magnitude of effect) should be quantified, and which
monitoring sites or exposure scenarios result in different risk probabilities should be identified
(i.e probability of occurrence). In this way, different management actions can be implemented
depending on the probability of occurrence (ECD) in combination with the magnitude of effects
(SSD).
2.2.2 Probabilistic risk quotient method
General case
This method is the direct translation of the mathematical definition of probabilistic risk (the
probability of some randomly selected exposure concentration exceeding a randomly selected
toxicity value):
Equation 1
Exposure and effects are characterised by probability distributions ie respectively, the ECD
and the SSD. Many random samples are drawn (typically Monte Carlo2 techniques are used)
from both ECD and SSD distributions and for each set of samples, the ratio Exposure
Concentration/Toxicity Value is calculated. All these ratios form the risk quotient distribution.
The obtained risk quotient distribution is used to express the probability that the exposure
concentration exceeds the toxicity value (Figure 4). This probability of some randomly selected
environmental concentration exceeding some randomly selected toxicity value for the
metal/metal compound under consideration is equal to the probability that the risk quotient
becomes larger than 1 and can therefore be regarded as a measure of adverse effects. It can
also be used to determine the probability of a larger effect, eg, the probability of the risk
quotient exceeding 10 or 100. More information can be found in Verdonck et al (2003). In
case the ECD and SSD are both (log)normally distributed, the lookup Table 5.3 of Aldenberg
et al (2002) can also be used. In the example of Figure 4, there is 13% probability that any
possible exposure concentration will exceed any possible toxicity value (both larger and
smaller than the deterministic PNEC, derived as 5th percentile from SSD).
11
QuotientRiskP
lueToxicityVa
ionConcentratExposurePRisk

MERAG FACT SHEET 01 – March 2016 15
Figure 4: Probabilistic framework in case extensive exposure/effects data are available
Specific sub-cases
In the literature, special cases of probabilistic risk (usually of a semi-probabilistic nature) are
used in which a fixed PEC or fixed PNEC are compared with a probability distribution,
respectively a SSD or an ECD. These do not include all information on exposure and effects
(and therefore are neglecting species with toxicity values smaller than the PNEC or exposure
concentrations larger than PEC). These hybrid-versions add to the complexity of the
interpretation of possible probabilistic outcomes. Nevertheless, they can be useful in cases
where there is sufficient information to estimate a probability distribution for either exposure or
effects but data are lacking for, respectivel, effects or exposure. Special attention should,
however, be paid to the interpretation.
2.2.3 Joint probability curve
Another way of integrating the ECD and the SSD is through the use of so-called Joint
Probability Curves (JPCs) (ECOFRAM 1999; Giesy et al 1999). In JPCs, the cumulative
probabilities of the ECD and the SSD for each concentration are plotted in a graph. An
example is given in Figure 5. For concentration a, the fraction of species affected, 20% (ie the
cumulative probability of the SSD or the magnitude of effects), is plotted against the
exceedance exposure probability 22% (ie the complement of the cumulative probability of the
ECD) (see line a in Figure 5). The same exercise is repeated for concentration b and for any
other concentration (see line b in Figure 5). The resulting JPC presents the fraction of species
affected for each exposure exceedance or the exposure exceedance for each fraction of
species affected. JPCs come in several forms. Aldenberg et al (2002) gives an overview.
0%
20%
40%
60%
80%
100%
0.0001 0.01 1 100
Concentration (mg/l)
Cum
ulat
ive
pro
babi
lity
EC
SS0%
20%
40%
60%
80%
100%
0.001 0.01 0.1 1 10 1Risk quotient = ratio EC/SS
Cum
ula
tive
prob
abili
ty
13.3%

MERAG
Figure
JPCs
1. Ca
Fig
pro
13
2. Ex
co
a s
on
be
an
the
JPCs
the int
assess
and/or
2.2.4 I
Some
accept
conce
type a
when
the hy
G FACT SHE
e 5: Exposure
Prob
can be use
alculation of
gure 5) is e
obabilistic r
3.3% in the h
xploration o
mbinations
single spec
e graph. T
ecause it al
d risk mana
e choice of
often result
terpretation
sors and m
r SSD curve
Interpretati
risk assess
table effec
ntrations ex
nd amount
sufficient da
ypothetical
0
20
40
60
80
100
Cum
ulat
ive
pro
babi
lity
EET 01 – Ma
e Concentrat
bability Curve
d for:
f the proba
equal to the
isk. This pro
hypothetica
of the mag
of the prote
cies) versus
The derivat
lows “what-
ager a met
a different p
t in interpre
of the EC
managers a
es contain t
ion of ECD
sors prefer
ct level (fix
xceed this l
of data ava
ata are ava
example ill
0%
0%
0%
0%
0%
0%
0.0001
arch 2016
tion Distribut
e (JPC) (type
abilistic risk:
e probabilist
obability of
al example o
nitude of e
ection level
s percentag
ion of the
-if” question
hod for ass
protection le
etation and
D and/or S
re more fa
he same inf
D and/or SS
to interpret
xed PNEC
evel. An ex
ailable, the f
ailable, from
lustrated in
0.01
Concentra
tion (ECD), S
e cumulative
: The area
tic risk and
an exposur
of Figure 5.
effects vers
(eg, fractio
ge of expos
JPC offers
ns to be ad
sessing the
evel (eg, pe
communica
SSD curves
miliar with
formation a
SD curve
the ECD a
C) and cal
xample is gi
fixed PNEC
m an SSD (a
n Figure 6,
1 100
ation (mg/l)
a b
Species Sens
profile plot)
under the j
offers an a
re concentra
sus probab
on of specie
sure concen
s a useful
ddressed. It
effects of c
ercentile of s
ation issues
is much e
these curv
as in a JPC.
nd SSD cur
lculate the
iven in Doy
C can be de
as in Figure
the expos
0
E
S
b
sitivity Distrib
with its Area
joint probab
alternative w
ation excee
bility of occ
es affected o
ntrations ex
tool for co
t also provi
changes in
species affe
s by non-ex
asier and s
ves (see ne
rves directly
probability
le et al (200
rived from a
e 6) or dose
ure concen
bution (SSD)
a Under the C
bility curve
way of calc
eding a toxic
currence: A
or percent m
xceeded are
ommunicatio
ides the ris
assumption
ected).
xperts. For t
straightforw
ext section)
y. One coul
y that the
03). Depen
assessmen
e-response
ntration in 4
16
) and Joint
Curve (AUC)
(shaded in
culating the
city value is
All possible
mortality for
e plotted in
on of risks
sk assessor
ns, such as
this reason,
ward as risk
. The ECD
d define an
e exposure
ding on the
t factors or,
function. In
42% of the
n
e
s
e
r
n
s
r
s
,
k
D
n
e
e
,
n
e

MERAG FACT SHEET 01 – March 2016 17
monitoring locations will exceed the PNEC (defined as 95% protection level from the SSD). In
addition, the locations of the monitoring stations or the particular exposure scenarios leading
to exceedance of the PNEC can also be identified.
Figure 6: Exposure Concentration Distribution and Species Sensitivity Distribution
Similarly, a fixed exposure level (fixed PEC) can be determined and the percentage of species
affected at that level can be calculated (no example shown here). It is recommended that this
exercise be repeated for several exposure and effect levels when exploring the sensitivity of
varying threshold levels. When only a single, fixed PNEC is compared with an ECD, although
relatively easy to interpret, only a one-sided view on the actual risk is obtained.
2.2.5 Spatially referenced regional risk characterisation
In a standard risk assessment, worst-case approaches are typically used, but unfortunately
these do not account for the large spatial variation in both exposure and effect concentrations.
As a consequence, exposure and effect concentrations for metals typically overlap at regional
level (Figure 7), and worst-case assumptions for both parameters (ie high exposure and low
effect concentrations) may result in overly conservative conclusions.
0%
20%
40%
60%
80%
100%
0.0001 0.01 1 100 10000
Concentration (mg/l)
Cum
ulat
ive
pro
bab
ility
ECD
SSD
PNECcritical exposure scenario

MERAG
Figure
concen
organis
A sou
accou
metal
largely
assum
protoc
differe
that m
signific
treated
assess
metals
for loc
site-sp
G FACT SHE
e 7: Probabili
ntrations (no
sms (EC10))
nd risk ass
nt the spati
concentrati
y across d
mptions on
cols and a
ently genera
metal bioav
cantly corre
d independ
sment. Wh
s must be b
cal bioavaila
pecific risk c
EET 01 – Ma
ity distributio
observed ef
) without bioa
sessment fo
ial variation
ons and ph
ifferent cou
exposure a
analytical m
ated monito
vailability (
elated and
dently to d
henever po
based on co
ability and s
characterisa
arch 2016
n of Cu expo
ffect concent
availability co
or metals in
n of both ex
hysico-chem
untries or r
and effects
methods fu
oring data s
effects) an
therefore, e
erive gene
ossible, reg
omparison
species sen
ation ratios
osure concen
tration (NOE
orrection
n water, se
xposure and
mical param
regions, re
s of metals
urther comp
sets. Based
nd backgro
exposure a
eric reasona
gional and
of site-spec
nsitivity diffe
(Oorts and
ntrations in a
C) or effect c
ediment, or
d effects co
eters influe
sulting in v
(Figure 8)
plicates co
d on harmo
ound conce
nd effects
able worst-
local envir
cific exposu
erences, an
Schoeters
agricultural so
concentration
soil must p
oncentration
ncing the to
varying deg
). The use
omparison
nised datas
entrations
data should
-case (RW
ronmental
ure and effe
nd the distri
2014).
oil and selec
n affecting 1
preferential
ns. Data ava
oxicity of me
grees of (w
of differen
and conso
sets, it bec
(exposure)
d preferent
WC) scenari
risk asses
ects data th
ibution of th
18
cted effect
0% of
ly take into
ailability for
etals differs
worst-case)
nt sampling
olidation of
omes clear
are often
ially not be
os for risk
sments for
hat account
he resulting
o
r
s
)
g
f
r
n
e
k
r
t
g

MERAG FACT SHEET 01 – March 2016 19
Figure 8: Data availability and uncertainty for regional risk assessments for metals
PEC = Predicted Environmental Concentra on PNEC = Predicted No Effect Concentra on RCR = Risk Characterisa on Ra o, i.e. PEC/PNEC RWC = Reasonable Worst Case
Distribu on of RCR for all individual points
Paired PEC and PNEC data?
PEC and PNEC data?
Data geo‐referenced
?
Distribu on of RCR based on overlay of
interpolated PEC and PNEC maps
Probability distribu on of RCR based on Monte Carlo analysis
of distribu on of PEC and PNEC Comparison of RWC
PEC with RWC PNEC
Yes
Yes Yes
No
No
No
Uncertainty
Worst‐case
assump
ons
Data available

MERAG FACT SHEET 01 – March 2016 20
ANNEX 1: ADDED VERSUS TOTAL RISK APPROACH AND ITS USE IN RISK
ASSESSMENT AND/OR ENVIRONMENTAL QUALITY SETTING
1 INTRODUCTION
The presence of metals in the environment due to natural processes (resulting in a natural
background concentration of metals in all environmental compartments, including organisms)
and the chemical processes that affect the speciation of metals in the environment have
implications for both the environmental exposure and effects assessment of metals and thus
for the risk characterisation/environmental quality setting of metals in general.
In order to deal with the presence of a natural background, different concepts have been
developed such as the Added Risk approach4 (ARA) or the Total Risk approach (TRA). The
total risk approach (TRA) assumes that “exposure” (PECTOT) and “effects” (PNECTOT) should
be compared on both the fraction comprising the natural background and the added
anthropogenic component. The risk characterisation can be done at different levels, for
example, on total, total dissolved, or bioavailable fractions. The added risk approach (ARA)
assumes that only the anthropogenic added fraction of a natural element contributes to the risk
for the environment.
Although the ARA approach acknowledges that negative effects from the bioavailable fraction
of the background concentration on some organisms in the ecosystem may occur or that
organisms may even become acclimated/adapted to it, from an environmental policy point of
view such effects may be ignored and may even be regarded as desirable, because these
effects theoretically may lead to an increase in ecosystem differentiation or biodiversity
(Crommentuijn et al 1997).
For the soil compartment, a significant difference in extractability between the added fraction
and the natural background concentration present in soil results in a significant difference in
bioavailability of both fractions. If this difference persists after long-term equilibration of added
metals in soil, this can also be a reason to select the added approach instead of the total
approach. Vanadium and boron are examples of elements that show low partitioning to soil
4 The concept was developed and published by: T Crommentuijn et al (1997). Maximum permissible concentrations and negligible concentrations for metals, taking backgrounds concentrations into account, Netherlands, Institute of Public Health and the Environment, RIVM, Bilthoven, RIVM report N° 601501001

MERAG FACT SHEET 01 – March 2016 21
and hence high water extractability of the added fraction compared to the natural background
concentration. In theory, the use of the ARA avoids the potential problem of deriving Predicted
No Effect Concentration (PNEC) / Environmental Quality Standard (EQS) values below the
natural background concentration, as could be the case when the TRA is used. In the ARA,
both the "Predicted Environmental Concentration"(PEC) and the "Predicted No Effect
Concentration" (PNEC) are expressed as anthropogenically added metals, resulting in an
“added Predicted Environmental Concentration” (PECADD)5 and “added Predicted No Effect
Concentration” (PNECADD)6, respectively.
Currently, no clear guidance is available on how to deal with elements that have a natural
background concentration in the environment, such as metals. Both approaches have been
used in the EU Risk Assessments for metals: eg, “added risk approach” (according to Struijs et
al 1997 and Crommentuijn et al 1997) – cfr. Zn RAR - and the “total risk approach” – cfr. Cd
RAR, Pb RAR and Cu RAR.
In general, it can be stated that the total risk approach may be the most scientifically
defensible option in the context of a risk assessment, but for regulatory purposes (eg, the
setting of environmental quality standards) the added risk approach may have merits.
Therefore preferably, environmental risks or compliance checking should be based on the
TRA. However, PNEC/EQS values in this approach below natural background levels may be
generated if:
- The PNEC/EQS has been set to an unrealistically low level simply because of a (too)
conservative approach adopted in the PNEC/EQS derivation (ie a large assessment
factor (AF)) to compensate for uncertainties arising from a lack of reliable
(eco)toxicological data.
- The PNEC/EQS was set using ecotoxicity tests with organisms cultured/tested under
conditions of low metal concentrations compared with the surface water background
levels (ie organisms locally may have adapted to higher natural concentrations). This
may occur, especially for metals with a significant background concentration in relation
to the estimated PNEC/EQS.
Setting PNEC/EQS below the natural background level would result in a PNEC/EQS ratio that
serves little regulatory purpose and is scientifically indefensible. Furthermore, many water
bodies would fail the PNEC/EQS even though there is no risk to biota. A pragmatic way to
5 PECadd = PECtotal – Cbregion/site 6 PNECadd = PNECtot – Cbculture medium

MERAG FACT SHEET 01 – March 2016 22
overcome this problem is:
- to evaluate the scope for refining the PNEC/EQS by reducing uncertainty (including
making a correction for bioavailability- BRA approach) and/or
- to use the added risk approach (ARA).
Guidance on the use of the total risk approach (TRA) and added risk approach (ARA) is further
outlined in detail below. More guidance on how to establish the natural background can be
found in MERAG Fact Sheet 2.
2 USE OF TRA AND ARA CONCEPTS IN THE CONTEXT OF CHEMICAL SAFETY
MANAGEMENT (EG, RISK ASSESSMENT AND ENVIRONMENTAL QUALITY STANDARD
SETTING)
2.1 Application
Potential environmental risks (RCR) for use in both chemicals safety management and EQS
setting are characterised in the TRA approach based on the following quotient:
RCR = PECTOT/PNECTOT
In the ARA the following approaches are used depending on the regulatory context:
- Use in chemicals safety management
Potential environmental risks (RQ) are characterised based on the following quotient:
RCR = PECADD/PNECADD
Where PECADD = PECTOT – Cbsite/region and PNECADD = PNECTOT – Cbculture medium
With Cbsite/region the background concentration of the specific site/region under
investigation; Cbculture medium the metal concentration in the culture media.
- Use in EQS settings
Although the same principles apply for EQS settings, the added risk approach is used
somewhat differently. Indeed compliance of the monitoring data (PECTOT) with the proposed
EQS (ie PNEC) is estimated after addition of the Cbsite/region to the PNECADD. Compliance
checking is therefore realized by comparing:

MERAG FACT SHEET 01 – March 2016 23
PECTOT with PNECADD (ie PNECTOT – Cbculture medium) + Cbsite/region
2.2 Further considerations when using the added risk approach
However, the added risk approach should be considered with caution for the following
reasons:
- This approach ignores the possible contribution of the natural background (Cbculture
medium /Cbsite/region) concentration to the toxic effects of metals to ecological systems. As
currently used in risk assessment exercises (eg, Zn RAR), only the anthropogenic
added fraction of a natural element that contributes to the risk for the environment is
considered. However, organisms are not able to distinguish between the natural and
the anthropogenic bioavailable part of the metal present in the environment.
Consequently, part of the natural background will be bioavailable and could therefore
contribute to the total bioavailable metal concentration to which the organisms are
exposed and to which organisms could have been adapted, too.
- In order to use this approach correctly, the natural background of a particular location
and/or a specific region (Cbsite/region) needs to be established (see MERAG Exposure
Fact Sheet #2). Limited knowledge of the geographical distribution of metal
background concentration in ecological systems may hamper the proper
implementation of the ARA. However, significant work is ongoing in relation to soil and
sediments in the UK, Australia, EU, US and some other countries. Significant efforts
have been made to use extensive databases and intrinsic knowledge of the
relationships between soil and sediment structural components and geogenic metal
concentrations.
- To apply the ARA also involves correctly quantifying the metal concentration to which
the test organisms are adapted/acclimatised (Cbculture medium). Indeed, for several metals
(particularly essential metals) a relationship has been demonstrated between the
sensitivity of the organism and the metal concentrations of the standard culture
condition. Organisms cultured in media with low metal concentrations (which is often
the case in standard media) generally are more sensitive to added metals than those
cultured in higher metal concentrations. However, organisms often are cultured in
media (eg, treated tap water or natural water) with varying metal background
concentrations or even with unknown metal concentrations, which therefore
complicates the proper interpretation of test results. It must be stressed that culture
media often differ from the standard test media used in the toxicity tests, suggesting

MERAG FACT SHEET 01 – March 2016 24
that test organisms may not be acclimatised/adapted to the metal background
concentrations in toxicity tests. Moreover, metal background concentrations in the
culture media (Cbculture medium) may not be representative of the site/regional background
concentrations (Cbsite/region). It should be noted that proper application of the TRA is
also hampered in case only the added metal concentration is known and no
information on the metal concentration in the culture medium is reported.
- The ARA ‘pragmatically’ accounts for the effects of acclimation/adaptation on the
sensitivity of the organisms. Indeed, accounting for higher Cbsite/region will result in higher
region/site EQS/PNEC values7 (lower sensitivity) or lower potential risks8 (lower
sensitivity). This approach therefore suggests a relationship between the natural
background concentration of the site/region (Cbsite/region) and the sensitivity of the
organisms.
- The remaining uncertainty on the effects assessment should be properly characterised.
Indeed, the ARA ‘allows (opens the door to)’ the application of overly conservatism (eg,
using large assessment factors, AF to the HC5) because the reality check will always
result in EQS/PNEC values (PNECTOT) above the natural background concentrations of
the site/region under investigation (Cbsite/region )9 (because the AF is not applied to the
background).
2.3 Further considerations when using the total risk approach
The total risk approach is based on the following assumptions:
- Contrary to the added risk approach, the total risk approach suggests the natural
background (Cbculture medium /Cbsite/region) concentration contributes to the toxic effects of
metals on ecological systems. As currently used in risk assessment exercises (eg, Pb
VRAR), it assumes that the natural background is physiologically available, thus
contributing to the toxicity.
- Following the reasoning that background concentration especially in aquatic culture
media are generally lower than those encountered in the environment (Cbsite/region >
Cbculture medium), the total risk approach will be more conservative than the added risk
7 PNECtotal;site/region = PNECadd + Cbsite/region 8 Added Risks = (PECTOT- Cbsite/region)/PNECADD 9 PNECTOT = PNECADD + Cbsite/region = (HC5ADD/AF) + Cbsite/region

MERAG FACT SHEET 01 – March 2016 25
approach (ie a lower RQ is noted in the added risk approach compared with the total
risk approach).
- This results in EQS/PNEC settings based on organisms acclimatised/adapted towards
metal background concentrations prevailing in culture media. Such metal
concentrations in the culture media often do not reflect those encountered in the
environment. Compared to natural levels occurring especially in the aquatic
environment, such concentrations are generally low (or even deficient for essential
elements). This therefore suggests a higher sensitivity of the organisms, thereby
leading to conservative EQS/PNEC settings. Consequently, if background
concentrations affect the sensitivity of the organisms, the total EQS/PNEC value only
reflects adaptation/acclimation effects to metal background concentrations of the
culture media. Ideally, the organisms should have been cultured under conditions
relevant for the region under investigation.
- The remaining uncertainty surrounding the effects assessment should also be properly
characterised. As a reality check, it is suggested to compare the total EQS/PNEC
against the total natural background, to check the environmental relevancy of the
effects database used or the EQS/PNEC derived. A revision of the toxicity data set or
the derivation approach (eg, size of assessment factors) would be required if the
EQS/PNECtotal is below background concentration (Cbsite/region ).
2.4. Proposed most scientific approach
Based on the above considerations, the most accurate and ecologically relevant risk
characterisation should be made by establishing - on a site-specific-, watershed/basin- or
regional basis - both exposure and effects data sets expressed as bioavailable total fraction in
the environmental compartment/medium (PECbioavailable) and the bioavailable total no effect
concentrations (EQS/PNECbioavailable). Tools for assessing and predicting metal bioavailability
are available or are being developed for a number of metals (eg, BLM model for water and the
AVS-SEM model for sediment).
The bioavailability concept as described here could be further extended to an even more
refined approach where both geographical/geological and biological characteristics are
considered. This approach is often called the “metallo-region driven approach” (or
biogeochemical region concept).

MERAG FACT SHEET 01 – March 2016 26
This biogeochemical-region approach arises from the fact that different ecoregions can be
identified in terms of the physico-chemical characteristics and boundaries of the environmental
compartment as well as in terms of their representative species. Within ecoregions, sub-
ecoregions can be differentiated on the basis of the natural background concentration of the
metal under consideration and the presence of well-defined abiotic factors that influence metal
bioavailability. This concept therefore recognises that bioavailable background concentrations
of a metal in a given ecoregion can differ from one ecosystem to the other, resulting in
different sensitivities of organisms to the toxic effects of metals due to adaptation. This
approach further suggests that when characterising the sensitivity of the ecosystem, instead of
using generic species sensitivity distributions comprised of test organisms from any location, it
is preferable to use endemic test organisms representative for the natural environment under
investigation (Figure A1).

MERAG
Figure
The B
biogeo
the Ad
Safety
into bo
need
assess
2.5 Pr
Some
biogeo
in Figu
using
approa
backg
require
G FACT SHE
e A1: Schem
Biogeochem
ochemical-r
dded Risk
y Framewor
oth the effe
to know s
sment, and
roposed pr
regulatory
ochemical-r
ure A2, a t
either the
ach is ma
round level
ements set
EET 01 – Ma
atic overview
mical-region
region spec
concept for
rks and EQ
ects and ex
specific bio
their assoc
agmatic tie
y initiative
region conc
tiered decis
ARA or TR
ainly based
s (see Sect
out in a reg
arch 2016
w of the biog
n approach
cific biodive
r the enviro
S settings,
posure esti
ogeochemic
ciated chara
ered appro
es (eg, th
cept be furth
sion tree is
RA in the a
d on the
tion 1 of An
gulatory con
geochemical r
h will furth
ersity related
onmental ri
would disa
imations. T
cal region c
acteristics.
oach
he Water
her develop
presented
absence of
comparison
nnex 1) but
ntext. If the
region conce
her strengt
d to metal
sk assessm
appear whe
he risk ass
class(es) r
Framewor
ped before
to facilitate
biogeochem
n of the P
can also b
data allows
ept
then the u
background
ments of m
n bioavailab
essors and
elevant for
rk Directive
it can be a
e the exper
mical mode
PNEC/EQS
e driven by
s it, preferen
understandi
d levels. Th
metals within
bility is fully
d risk mana
r the regio
e) require
applied. Con
rt judgment
els. The ch
S values a
y data availa
nce should
27
ing of the
he need for
n Chemical
y integrated
agers would
on(s) under
that the
nsequently,
t choice for
oice of the
and natural
ability or by
be given to
e
r
l
d
d
r
e
,
r
e
l
y
o
MERAG
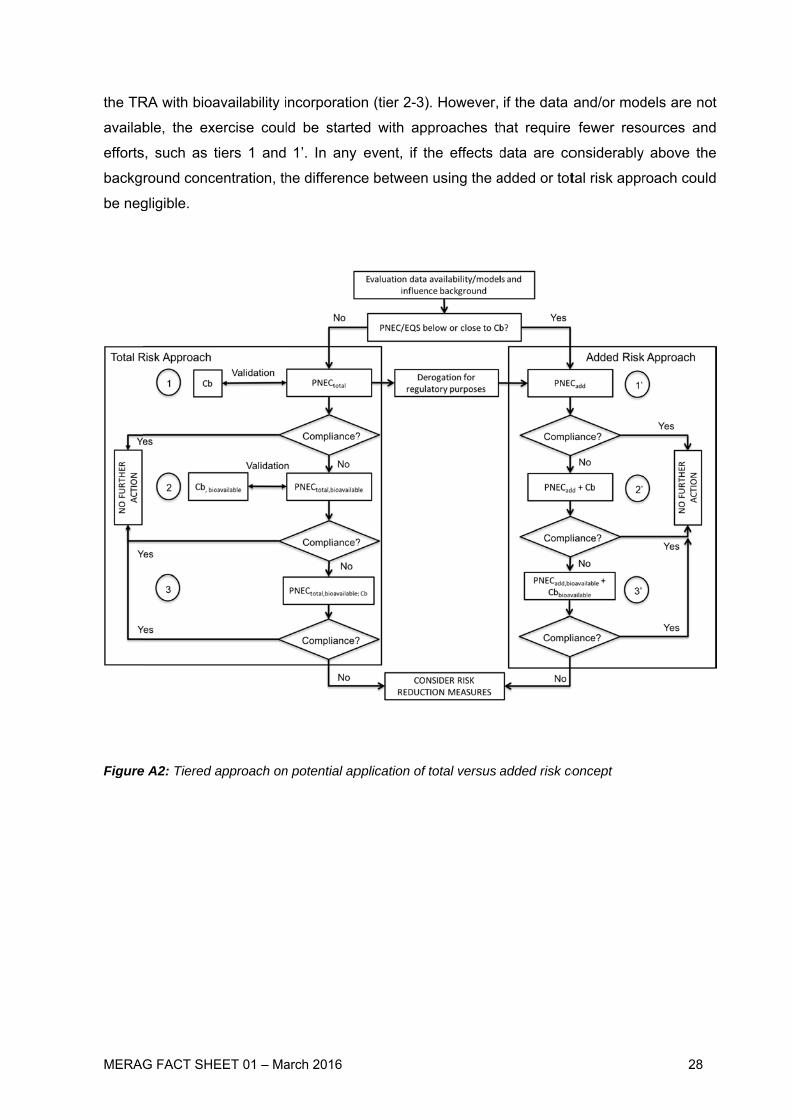
the TR
availab
efforts
backg
be neg
Figure
G FACT SHE
RA with bioa
ble, the ex
s, such as t
round conc
gligible.
e A2: Tiered
EET 01 – Ma
availability i
xercise coul
tiers 1 and
centration, th
approach on
arch 2016
incorporatio
ld be starte
1’. In any
he differenc
n potential ap
on (tier 2-3)
ed with app
event, if th
ce between
pplication of
. However,
proaches th
he effects d
using the a
total versus
if the data
hat require
data are co
added or tot
added risk co
and/or mod
fewer reso
onsiderably
tal risk appr
concept
28
dels are not
ources and
y above the
roach could
t
d
e
d

MERAG FACT SHEET 01 – March 2016 29
The individual steps of the decision tree are described below for both approaches.
Total Risk Approach
1. As a first step, it is strongly recommended to check the ecological relevancy of the proposed
PNEC value by comparing the total PNEC with the natural background of the site/region
(Cbsite/region). A revision of both the data set and/or the derivation approach would be required if
the PNECTOT, total dissolved < Cbsite/region, total dissolved.
- Use in chemicals safety management
Potential environmental risks (RQ) are characterised based on the following quotient:
RQ = PECTOT, total dissolved / PNECTOT, total dissolved
- Use in EQS settings
Compliance checking is therefore checked by comparing:
PECTOT, total dissolved with PNECTOT, total dissolved
2. If no compliance can be reached, a further refinement is possible when models are
available to account for bioavailability of metals in the environmental matrix of concern. In the
case of the TRA, both the PNEC and PEC should be corrected for bioavailability (see Fact
Sheet 5 for further details). As a validation step, it is strongly recommended to check the
ecological relevancy of the proposed PNEC value by comparing the bioavailable PNEC with
the bioavailable natural background of the site/region (Cbsite/region; bioavailable). A revision of both
the data set and/or the derivation approach would be required if the PNECTOT, bioavailable <
Cbsite/region, bioavailable.
- Use in chemicals safety management
Potential environmental risks (RQ) are further characterised based on the following quotient:
RQ = PECTOT, bioavailable / PNECTOT, bioavailable
- Use in EQS settings
Compliance checking is therefore checked by comparing:
PECTOT, bioavailable with PNECTOT, bioavailable

MERAG FACT SHEET 01 – March 2016 30
3. The most accurate and ecologically relevant approach would be to correct the effects and
exposure data for bioavailability and acclimation or adaptation differences (~Cb). As the
bioavailable fraction of both the natural background concentration and the anthropogenic
amount of the metal are considered as potentially contributing to toxic effects, the use of the
total risk approach is recommended, resulting in a PNECTOT, bioavailable; Cb.
- Use in chemicals safety management
Potential environmental risks (RQ) are characterised based on the following quotient:
RQ = PECTOT, bioavailable / PNECTOT, bioavailable; Cb.
- Use in EQS settings
Similarly, compliance of the proposed EQS with the monitoring data is based on the
comparison between the site/region specific PECTOT, bioavailable and the PNECTOT, bioavailable; Cb
Added Risk Approach
1’. The first tier in compliance checking in a regulatory context when using the ARA would be
to correct the PNEC for background concentration and therefore to compare the PECTOT, total
dissolved with the PNECADD, total dissolved. If the PECTOT, total dissolved is below the PNECADD, total dissolved
then consideration of the background (as in tier 2’) will only make this difference bigger. This
simple first step would ensure that only sites of concern are taken through the tiers.
- Use in chemicals safety management
Potential environmental risks (RQ) are characterised based on the following quotient:
RQ = PECTOT, total dissolved / PNECADD, total dissolved
Where PNECADD, total dissolved = PNECTOT, total dissolved – Cbculture medium, total dissolved
- Use in EQS settings
Compliance checking is checked by comparing:
PECTOT, total dissolved with PNECADD, total dissolved (ie PNECTOT, total dissolved – Cbculture medium, total
dissolved).

MERAG FACT SHEET 01 – March 2016 31
2’. In the second tier, both the PEC and PNEC are corrected for background concentrations.
This approach also suggests the ‘correct’ estimation of the culture medium and natural
site/region background concentrations.
- Use in chemicals safety management
Potential environmental risks (RQ) are characterised based on the following quotient:
RQ = PECADD, total dissolved/ PNECADD, total dissolved
Where PECADD, total dissolved = PECTOT, total dissolved – Cbsite/region, total dissolved and PNECADD, total dissolved =
PNECTOT, total dissolved – Cbculture medium, total dissolved
- Use in EQS settings
Compliance checking is checked by comparing:
PECTOT, total dissolved with PNECADD, total dissolved (ie PNECTOT, total dissolved – Cbculture medium, total
dissolved) + Cbsite/region, total dissolved
3’. In the third tier, in case the ARA is used and no compliance is reached, bioavailability can
be taken into account, similar to the TRA. In such case the PEC, PNEC and the background
values should be corrected for bioavailability. However, care should be taken in how the
background correction is done (see below).
- Use in chemicals safety management
Potential environmental risks (RQ) are characterised based on the following quotient:
RQ = PECADD,bioavailable / PNECADD, bioavailable
Where PECADD, bioavailable = (PECTOT – Cbsite/region)bioavailable and PNECADD, bioavailable = (PNECTOT –
Cb culture medium) bioavailable
- Use in EQS settings
Compliance checking is therefore checked by comparing:
PECTOT, bioavailable with PNECADD, bioavailable (ie PNECTOT, bioavailable – Cbculture medium, bioavailable) +
Cbsite/region, bioavailable

MERAG FACT SHEET 01 – March 2016 32
Conclusions
The above discussion shows that both the total and the added risk approach may be used for
chemicals management purposes as well as for EQS setting. The added risk approach may be
employed as a pragmatic solution facilitating risk management to account for the impact of
background concentrations if strict data conditions are fulfilled and when more robust
approaches (eg, the biogeochemical region approach) are not available.

MERAG FACT SHEET 01 – March 2016 33
ANNEX 2: COMBINED RISK ASSESSMENT/COMBINED TOXICITY
Disclaimer: the current text is largely based on the information gathered from Meyer et al
(2015) as part of the Metal Mixtures Modelling evaluation project. This special Environmental
Toxicology and Chemistry issue was published in 2015 and consists of 11 peer-reviewed
publications.
Although organisms in real-world aquatic systems usually are exposed to mixtures of metals
and other substances instead of only one metal at a time (USEPA 2007), metals are still
regulated only on a metal-by-metal basis (EU 2008; USEPA 2013) except in Australia and
New Zealand (ANZECC 2000). This metal-by-metal regulatory approach has, in part, been
adopted because of the perceived complexity of mixture toxicity and because of difficulties in
modelling metal-mixture toxicity. Two basic models are commonly used to define and test for
mixture toxicity: concentration addition (also called simple similar joint action) and response
addition (also called independent action or independent joint action) (Newman 2013). In
concentration-addition models, the toxicants are assumed to have the same mechanism of
action at the same toxicity site(s), and only differ in potency. In contrast to concentration-
addition models, response-addition models assume the toxicants in a mixture have different
mechanisms of action and act jointly but independently of each other (eg, Borgmann 1980).
No clear pattern has emerged to allow a priori qualitative (much less quantitative) prediction of
whether a given mixture of metals will produce less-than-additive, additive, or more-than-
additive toxicity compared to the concentration-addition or response-addition models..
Therefore, there is a need to understand how metals interact in mixtures and to predict their
toxicity accurately (Van Genderen et al 2015).
Australia and New Zealand are the only countries that explicitly incorporate calculations for
mixture toxicity into their regulations for metals (ANZECC 2000). Under that framework, a
sum-of-toxic-units approach is recommended for determining regulatory exceedance if a
mixture contains less than or equal to 5 “significant toxicants” (regardless of whether they are
organic chemicals, metals, or other compounds) and if their toxicity is known to be additive.
However, if the toxicity of that mixture is known to be non-additive or if the interaction is
uncertain, and/or more than 5 “significant toxicants” are in the mixture, those guidelines
recommend that direct toxicity assessment (ie a whole effluent toxicity test) should be used to
determine whether the mixture exceeds a regulatory limit. In the European Union (EU), mixture
toxicity for ecological receptors in receiving environments is regulated in specific legislations,
such as for biocides or plant protection products (eg, ECHA 2014). On the other hand, mixture
toxicity assessment is indirectly required for compliance with the European REACH

MERAG FACT SHEET 01 – March 2016 34
Regulations for the assessment of complex multi-metallic substances based on information on
their individual metal constituents. Kortenkamp et al (2009) reported that, out of 21 pieces of
legislation they reviewed, only 4 deal explicitly with exposure to chemical mixtures.
Kortenkamp et al (2009) recommended using concentration addition as a default first-tier
approach in an assessment of potential mixture toxicity, and ECETOC (2001) recommended
“…the assumption of additivity [of acute toxicity of metals] is probably the most balanced
choice, unless there is clear evidence in the literature that mixtures of the metals under
examination behave differently.” Therefore, it appears that additivity would be a generally safe
regulatory assumption about the acute toxicity of the majority of metal mixtures. The paucity
of metal-mixture toxicity data for chronic endpoints makes it currently difficult to draw
meaningful conclusions about interactions in long-term chronic exposures to metal
mixtures.
There is, however, growing evidence that the concentration-addition model is also a
conservative and scientific-justified generic first-tier approach to assess chronic combined
effects of metal mixtures because there are only few indications for synergistic (more-than-
additive) effects when compared to the concentration addition (CA) approach. On the other
hand, synergistic effects relative to the independent action approach are more commonly
observed when studying chronic toxicity of metal mixtures. Unfortunately, the information on
chronic effects of metal mixtures still falls short compared to data on acute toxicity.
Recent initiatives in Europe have considered how to regulate chemical mixtures (eg, Backhaus
et al 2011; EC 2012; Kortenkamp et al 2013). Some of the approaches include treating all
chemicals in a mixture equally and thus dividing the regulatory limit for each chemical by the
total number of “significant” chemicals in the exposure water (ie to provide a an assessment or
safety factor to protect against the combined toxicity of the mixture). The problem is that
differences in potency are not considered in such an approach. The relative contribution of all
mixture constituents should be preferably considered by multiplying by a potency factor.
Approaches that would apply a uniform safety factor to decrease the regulatory-acceptable
concentration of metals (and other chemicals) in a mixture below that deemed acceptable for
single-metal exposures run the unintended risk of regulating the concentrations of essential
metals (eg, Cu, Zn) in receiving waters into the deficiency range and/or below natural
background concentrations (Janssen and Muyssen 2001). In the new EU Biocidal Product
Regulation, additivity of long-term PEC/PNEC ratios has also been suggested as a
conservative, precautionary approach.

MERAG FACT SHEET 01 – March 2016 35
Summation of long-term PEC/PNEC ratios immediately faces two important concerns for
metals:
First of all, because of the natural occurrence of metals and the conservatism built into the
PNECs derivation, the simple sum up of the RCRs values of metals even at background
levels may already result in a sum >1, and this before any possible anthropogenic metal
production/use. To resolve this, the added risk approach has been proposed (see Annex
1). This way, any hypothetical contribution to the risk ratio due to the natural presence of
metals (which does not lead to ecotoxicological effects) is excluded.
Secondly, the simple sum up entails that the considered toxicity values refer to the same
species and endpoint. For metals, however, the most sensitive trophic level or species in a
specific compartment may differ from one metal to the other (eg, fish for Ag, bacteria for
Ni…) and one will need to consider this species sensitivity as well as the compartment
specificity. This approach can be further refined and the risk for multiple metals can be
assessed by calculating the RCRmix,j for every trophic level or species/endpoint separately.
These considerations place increased importance on development of methods to quantitatively
predict metal-mixture toxicity, and mathematical models will probably play an important role. In
particular, BLM models could be useful here. Although no multiple-metal bioavailability model
has yet been adopted for regulatory use, BLM type of mechanistic, bioavailability-based
models might help to understand interactions among metals in a mixture and might also
predict metal-mixture toxicity. Bioavailability models that incorporate metal-metal interactions
and the myriad interactions of metals with other chemical components in water offer promise
that metal-mixture toxicity might be reliably predicted in the future. As a potential key to
advancing the understanding and prediction of metal-mixture toxicity, it is hypothesised that
the toxicity of metal mixtures will be additive when based on concentrations of metals
accumulated at sites of toxic action on or within organisms, even though the mixture toxicity
might appear to be less-than-additive or more-than-additive based on dissolved-metal
concentrations. The use of critical body burdens could be considered in this regard (McCarty
et al 1993).

MERAG FACT SHEET 01 – March 2016 36
REFERENCES
Aldenberg, T, Jaworska, JS.,Traas, TP (2002). Normal species sensitivity distributions and
probabilistic ecological risk assessment. Pages 49-102 in Posthuma, L, Suter, GWII, Traas,
TP (eds). Species sensitivity distributions in ecotoxicology. Lewis Publishers, London, UK.
ANZECC (Australian and New Zealand Environment and Conservation Council) and
ARMCANZ (Agriculture and Resource Management Council of Australia and New Zealand).
(2000). Australian and New Zealand Guidelines for Fresh and Marine Water Quality. Volume
2. Aquatic Ecosystems – Rationale and Background Information. Australian Water
Association, Artarmon, New South Wales, Australia; New Zealand Water & Wastes
Association, Onehunga, Auckland, New Zealand.
Backhaus, T, Cedergreen, N, Hutchinson, T (2011). 3rd SETAC Europe Special Science
Symposium, “Prospective and Retrospective Environmental Risk Assessment of Mixtures:
Moving from Research to Regulation”. SETAC Globe 12(4), April 14.
Borgmann, U (1980). Interactive effects of metals in mixtures on biomass production kinetics
of freshwater copepods. Can. J. Fish. Aquat. Sci., 37, 1295-1302.
Crommentuijn, T, Polder, M, Van de Plassche, E (1997). Maximum permissible concentrations
and negligible concentrations for metals, taking background concentrations into account.
RIVM, Report 601501001.
Doyle, PJ, Gutzman, DW, Sheppard, MI, Sheppard, SC, Bird, GA, Hrebenyk, D (2003). An
ecological risk assessment of air emissions of trace metals from copper and zinc production
facilities. Human and Ecological Risk Assessment, 9(2), 607-636.
ECETOC (European Centre for Ecotoxicology and Toxicity of Chemicals) (2001). Aquatic
Toxicity of Mixtures. Technical Report No. 80. European Centre for Ecotoxicology and Toxicity
of Chemicals, Brussels, Belgium.
ECOFRAM (1999). ECOFRAM Aquatic and Terrestrial Final Draft Reports. U.S.
Environmental Protection Agency, Washington, DC.
EC (2012). The Combination Effects of Chemicals: Chemical Mixtures. Communication from
the Commission to the Council. COM(2012) 252 Final. European Commission, Brussels,

MERAG FACT SHEET 01 – March 2016 37
Belgium.
European Union (2008). Directive 2008/105/EC of the European Parliament and of the Council
of 16 December 2008 on Environmental Quality Standards in the Field of Water Policy,
Amending and Subsequently Repealing Council Directives 82/176/EEC, 83/513/EEC,
84/156/EEC, 84/491/EEC, 86/280/EEC and Amending Directive 2000/60/EC of the European
Parliament and of the Council. Official J European Union 24.12.2008:L 348/84 - L 348/97.
EUFRAM (2005). EUFRAM is a Concerted Action coordinated by CSL and supported by
European Commission's 5th Framework Programme, contract number QLK5 - CT 2002
01346. http://www.eufram.com/
Giesy, JP, Solomon, K, Coats, JR, Dixon, KR, Giddings, JM, Kenaga EE (1999). Chlorpyrifos,
ecological risk assessment in North American aquatic environments. Reviews in
Environmental Contamination and Toxicology, 160, 1-129.
Hart A (2001). Probabilistic risk assessment for pesticides in Europe (EUPRA):
implementation and research needs. A report from the European workshop on probabilistic
risk assessment for the environmental impacts of plant protection products, June 2001, The
Netherlands. Central Science Laboratory, Sand Hutton, UK. ISBN 185 945 010 5.
Janssen, C, Muyssen, B (2001). Essentiality of Metals: Consequences for Environmental Risk
Assessments. International Council on Metals and the Environment, Ottawa, ON, Canada.
Kortenkamp, A, Backhaus, T, Faust, M (2009). State of the Art Report on Mixture Toxicity. The
School of Pharmacy, University of London, London, UK.
McCarty, L S, Mackay, D (1993) Enhancing ecotoxicological modeling and assessment.
Environ. Sci. Technol., 27(9), 1719−1728.
Meyer, JS, Farley, KJ, Garman, ER (2015). Metal Mixtures Modeling evaluation: 1.
Background. Environ. Toxicol. Chem., 34(4), 726-740. DOI: 10.1002/etc.2792.
Newman, MC (ed. ?)(2013). Quantitative Ecotoxicology. 2nd ed. CRC Press, Boca Raton, FL,
USA.
Oorts, K and Schoeters, I (2014). Use of monitoring data for risk assessment of metals in soil
under the European REACH regulation. In: Reimann, C, Birke, M, Demetriades, A, Filzmoser,
P, O'Connor, P (eds), 2014. Chemistry of Europe's agricultural soils – Part B: General

MERAG FACT SHEET 01 – March 2016 38
background information and further analysis of the GEMAS data set. Geologisches Jahrbuch
(Reihe B), Schweizerbarth, Hannover. pp.189-202.
Struijs, J, Van de Meent, D, Peijenburg, W, Van den Hoop, M, Crommentuijn, T (1997). Added
risk approach to derive maximum permissible concentration for heavy metals: how to take into
account the natural background levels? Ecotoxicology and Environmental Safety, 37, 112-118.
TGD (2003)
USEPA (2001). Risk assessment guidance for superfund (RAGS): Volume III - Part A. Process
for conducting probabilistic risk assessment. U.S. Environmental Protection Agency.
USEPA (2007). Framework for Metals Risk Assessment. EPA 120/R-07/001. U.S.
Environmental Protection Agency, Washington, DC, USA.
USEPA (2013). National Recommended Water Quality Criteria, Aquatic Life Criteria Table.
http://water.epa.gov/scitech/swguidance/standards/criteria/current/index.cfm#altable
Van Genderen, E, Adams, W, Dwyer, R, Garman, E, Gorsuch, J (2015). Modeling and
interpreting biological effects of mixtures in the environment: Introduction to the Metal Mixture
Modeling Evaluation Project. Environ. Toxicol. Chem., 34(4), 721-725.
Verdonck, FAM, Aldenberg, T, Jaworska, JS, Vanrolleghem, PA (2003). Limitations of current
risk characterization methods in probabilistic environmental risk assessment. Environ. Toxicol.
Chem., 22(9), 2209-2213.
Verdonck FAM, Van Sprang P and Vanrolleghem PA, 2005. Uncertainty and precaution in
European environmental risk assessment of chemicals. Water, Sci. Technol.., 52(6), 227-234.
Warren-Hicks. WJ and Hart, A (eds). 2010. Application of uncertainty analysis to ecological
risks of pesticides. SETAC Press, Pensacola, FL. 190pp.


![Arche - Sedimentologia Vol 1 [by.geolibrospdf]](https://img.pdfslide.us/doc/110x75/577c82dc1a28abe054b28ec8/arche-sedimentologia-vol-1-bygeolibrospdf.jpg)

![Libro-Arche - Sedimentologia__Vol_1 [by.geolibros] Lina](https://img.pdfslide.us/doc/110x75/5695d4a21a28ab9b02a22fe6/libro-arche-sedimentologiavol1-bygeolibros-lina.jpg)
