Embed Size (px)
Citation preview
I 7 8 5·
The University of Georgia
Fact Bool( 19 8 8 20th Edition
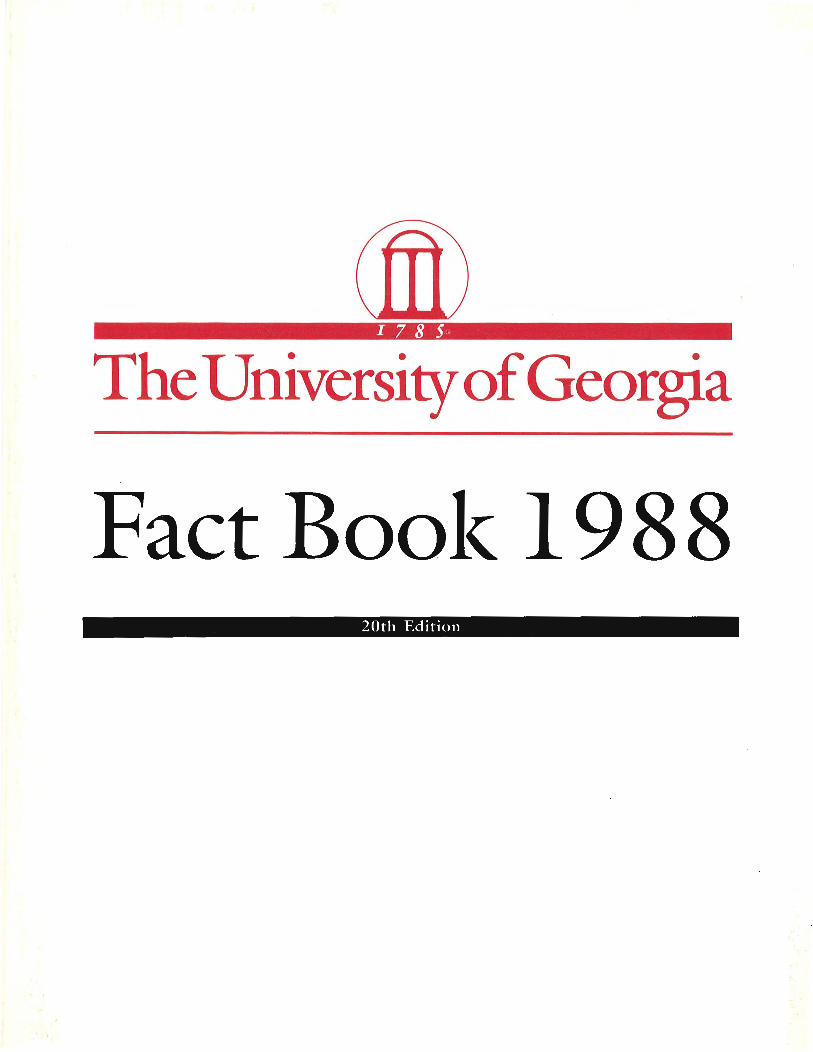
The Fact Book 1988 Cover
University of Georgia Logo I
Featured on the Fact Book 1988 cover is one of three designs created and adopted in 1988 as part of a
logo system within the University of Georgia Identity Program. The identity program and logo designs
incorporate several University of Georgia attributes: History and tradition in the use of the arch and the
1785 university charter date; academics through the use of the University of Georgia name; and the
established red and black colors of the university. A second logo (carried on the letterhead of President
Knapp's transmittal letter, pg. iii) is very much like the first, with only a slight change in the line containing
the founding date. The third logo features the arch enclosed by a circle over the founding date; it is used
on the section divider pages of this year's Fact Book .
The purpose of the University of Georgia Identity Program is to present a uniform visual representation of
the university and its distinct character through easily recognized and consistent images. The new logo
system will replace the innumerable individualized logos and symbols currently in use by university units
and groups, although the bulldog and related registered trademarks of the Athletic Department will
continue to serve as the traditional symbols of University of Georgia athletics. The logo designs are
registered as trademarks, and a set of policies and guidelines has been developed for their appropriate
use. Complete details of the University of Georgia Identity Program are available through the Office of the
Vice President for Development and University Relations.
THE UNIVERSITY OF GEORGIA
ATHENS, GEORGIA
A UNIT OF THE UNIVERSITY SYSTEM OF GEORGIA
@ THE UNIVERSITY OF GIOORGIA
THE UNIVERSITY OF GEORGIA FACT BOOK 1988 :20th Edition
Edited By:
Larry G. Jones, Associate Director Office of Institutional Research and Planning ~10 New College The University of Georgia Athens, Georgia 30602
Published By:
Office of Institutional Research and Planning David G. Clements, Director 310 New College The University of Georgia Athens, Georgia 30602 (404) 542-8832
Printed By:
The University of Georgia Printing Department Richard B. Lane, Unit Head Printing Building Green Street Athens, Georgia 30602
Copyright :Q. 1989 By:
The University of Georgia Office of the Vice President for Research 609 Boyd Graduate Studies and Research Center Athens, Georgia 30602
This book is intended as a reference and may be quoted using accepted scholarly citation without permission. Reproduction of complete tables, figures, or text must include a University of Georgia Fact Book 1988 notation and page number.
UID --------------- I 7 8S ---------------
The University of Georgia Office of the President
Dear Colleagues and Friends:
I am pleased to present the 20th annual University of Georgia Fact Book for the year 1988. We can all take great pride in the excellent progress of our University, and this book documents many of the tangible measures of that success. These accomplishments reflect a team effort. Through the cooperative spirit of faculty, staff, students, alumni and the citizens of Georgia, I am confident we will continue that progress.
This publication can be an important resource to all those interested in the The University of Georgia. I look forward to continuing to work with you toward our objective of building one of the best public universities in America.
Sincerely,
~ ~~ e t<...o.pp Charles B. Knapp President
CBK: sfj
Enclosure
Lustrat House • Athens, Georgia 30602 • (404) 542-1214 An Equal Opportunity/ Affirmative Action Institution
PREFACE AND ACKNOWLEDG EMENTS
r he Univers ity of Georgia Fact Book 1988 is the twentieth ed it ion of "a pilot project" which the first editors
thought " ... may become an annual publ ication ." First comp iled and edited by Gary Stock and Nathan
Keith, Jr. in 1969, the Fact Book was viewed as a means of providing "factual institutional information [for]
preparing grant proposals , developing long-range plans, answering quest ionnaires, or recruiting new
!acuity members, " and the basic purpose of the Fact Book remains, as they envisioned it, " ... to present
useful objective information about the University of Georgia." Readers and users of the Fact Book over the
years have given considerable testimony to the fact that the intent of the first editors has been realized .
While the first Fact Book was designed for an audience of "deans, d irectors, and department heads," it
has become a campus-wide publication used as frequently by faculty members as by administrators, and
it is quickly becoming a popular university publication for off-campus constituents as well.
Unfortunately, it is no more possible in the 20th Fact Book than it was in the first to provide " ... an exhaustive
presentation of statistical information about the university, " but it is more possible now than then to provide
an historical and/or comparative conteX1 for the data, and in many cases, add itional detail for the summary
tables is available upon request.
r he 20th edition of the Fact Book continues to reflect the work of many people in the university community,
and sincere appreciation is eX1ended to those responsible for the noted accomplishments as well as those
who help record the facts. Spec ial recogn ition in the production of this year's Fact Book , must go to Dianne
Bishop who set the pages using microcomputer software; to Don Snell and Debbie Simmons who made
the several micro software packages produce the required format and style; and to the University Printing
Department for their efforts in producing the published document.
" ... Any criticisms, suggestions, or corrections which will improve the usefulness of this publication" are as
welcomed and appreciated today as they were 20 years ago when the first editors sol icited such comments.
Larry G. Jones, Associate Director Office of Institutional Research and Planning December 23, 1988
Quoted excerpts from : Stock, Gary C. and Nathan R. Keith, editors. "Preface, " The Un iversity of Georgia
Fact Book, 1969: Institute of Higher Education, the University of Georgia .
iv
TABLE OF CONTENTS
Page List of Figures .. .. .. ..... .... ......... ..... ....................... ... ..... .. .. ...... .. .............. .. .. ... .... .... ....... ...... ... ... ......... .. .... x
GENERAL INFORMATION Charter of the University of Georg ia Preamble .......... ..... .. ................ .. ..... .......... ......... ... ............ .. ... 3 University of Georgia Perspective ....... ........... ................ ..... ....... ............... ........ ....... .. .. .. .. ..... ... ... .. .. 4 Purpose ............... .. ........... .. ........ ... ...... ... .. .. .......... ......... .... .. ................... .. ... ........................ ......... . 5 Chronological Highlights in the History of
the University of Georgia ................. ........................... ...................... ....... ... ....... ........ .. ...... ... ..... . 6 Institutional and Professional Accreditation ..... .... .................. ... ....... ... .. ... ....................... ... .. .. .. ....... 9 Commitment to Affirmative Action ....... .... ............... ....... ......................... .. ... ........ .. ... .. ... ....... ... ..... .. 9 University of Georgia International Agreements ............. ...... ............. .... .. .... ....... ....................... .. ... 1 0 Flag of the University of Georgia ............. ... ... .. .. .. .... .... ... ............ ......... ... .. ... .. .. .. ............. .. ..... .. ... ... 13 Seal of the University of Georgia ........................ .... .... .. ......... ... .... .. ... ..... .... .. .. .. ....... .. ......... .. ..... .... 14
ADMINISTRATION Board of Regents ...... ............. ................ ............ ..... ................................................ .. ............... ...... 16 Board of Regents' Staff ........................ ... ..... ....... ..... ... ....................... .... ....... ... .............. ..... .. ...... .. 16 Central Administrative Officers ... .. ..... .. .. ...... .. .... ..... .. ... ... .... ................. ... .... ........... .. .. .. .. ....... .. .. ..... 17 Presidents or Chancellors of the University of Georgia .... .. .. ....... ............ .. .. ... .... .... ......... .... ........... 17 Deans of Colleges and Schools .... .. .. ... .... .... .. .............. .. ............................ .... .. ...... ........... .. .... .. .... . 18 Directors of Institutes and Service Units ................. .. ......................... .. ... ................ .. ............... .... .. 19 University of Georgia Foundation Trustees .... ..................... ........................ .. ........... ..... ............ .... 22 University of Georgia Research Foundation, Inc:
Members of the Board of Directors ................. .. .. ................ .. ........... .. ...... .................. ... .......... .. 23 University Council Standing Committees .. ... ... .......... ................. .............. .. ... .. ... ... ............ ..... ... .. .. 23 University Self-Study Steering Committee ................... ..... .. .... ... .................. .......................... ....... 24 University Self-Study Committee Chairpersons ..... .......... .......... ...... .. .. ............................. .... ..... ... 24
ADMISSIONS New Freshmen: Fall Quarters 1960 - 1988 ... ...... ...... .................... .. ................ ........... .... .. .. ....... .. .. 26 Mean College Scholastic Aptitude Test Scores for Freshman Classes:
Fall Quarters 1966 - 1988 ........... .. ......... .. .... ....... ................. .. ....................................... .. .. .... ..... 28 Distribution of Freshman Math and Verbal Scholastic Aptitude Test Scores:
Fall Quarter 1988 ...... ..................................................... .. .......... .... ... ........................................ 30 Distribution of Freshman Scholastic Aptitude Total Test Scores: Fall Quarter 1988 ...... ... ............. 30 Distribution of High School Grade-Point Averages for Entering Freshmen:
Fall Quarters 1984 - 1988 .......... ........ .. ....... .. ......... ..................... .. .. .. ...... ...... ...... ..... .................. 31 High Schools of Entering Freshmen: Fall Quarter 1988 ........... .. ....... ..... .... ............ .......... .. ........... 32 Academic Scholarships: Fall Quarter 1988 .. ...... ...... .. ............ .... ... .......... ....... .... ............ .... .. ...... .. 33 Undergraduate Transfers: Fall Quarters 1972 - 1988 .... ............................ ........................ .. .. .... .. .. 33 Distribution of Entering Grade-Point Averages for Undergraduate Transfers:
Fall Quarters 1984 - 1988 ...................... ....... ..... ..... ........ ................... .......... ...... ..... .. ...... .... .. .... 34 Colleges and Universities from which Undergraduate Students Transferred
to the University of Georgia: Fall Quarter 1988 .......... .............. .................................... ............. 35 Graduate School Admissions: Fall Quarters 1968 - 1988 ...... ...... ............ .. ............ .. .... ...... .. ... .. ... .. 36
v
t: NROLLMENT University Enrollment: Fall Quarters 1830 - 1966 ..................................................... ...................... 38 Fall Quarter Enrollment by Class: 1967 - 1977 .. .......... ......... ...... ...................... .. .... ........ .............. 39 Fall Quarter Enrollment by Class: 1978 - 1988 .. ...... ........ ........ ................ ...................... .. ...... .... .. .. 39 College Enrollment by Quarter: FY 1980-81 - 1988-89 .... .. .. .... ...... .. ...... ........................................ 40 Cumulative Resident and Non-Resident Campus Enrollment .................. ..................................... 46 Regularly Enrolled Foreign Students by Country: Fall Quarter 1988 .................... .... .. .. .................. 4 7 Distribution of Fall Quarter 1988 Enrollment by State of Origin ................ .... ...... .............. .............. 48 Distribution of Fall Quarter 1988 Enrolled Georgia Residents
by County of Residence ...................................................................................................... ... .. 50 Selected Personal Characteristics of Enrolled Students:
Fall Quarter 1988 ..... ................. .............................................................. .. .... ... ...... ....... .... ........ 52 Enrollment Progression of First-Time Students
Entering Fall Quarters 1978 - 1987 .................................................. .......... .. .... ........................ . 54 Enrollment by Degree Objective: Fall Quarter 1988 ............................. ...... .... .. ...... .... ................... 56
DEGREES CONFERRED Degrees Conferred by Year and School: FY 1968-69 - 1977-78 .. ...... .. .................. ........ ................ . 58 Degrees Conferred by Year, School , and Sex: FY 1978-79 - 1987-88 .. .............. ...................... .... . 60 Summary of Degrees Conferred by Program Classification: FY 1987-88 ................ ........ .. ...... ...... 66 Degree Majors: Fall Quarter 1988 .... .. .... .. ......................................................... .. ....... ... ..... .. ......... . 67 Popular Degree Majors: Fall Quarter 1988 ............ ...................... .... .............................................. . 71 Graduation Rates for New Matriculants: Fall Quarters 1977 - 1987 .......... .............. .. ................ .... .. 72
ACADEMIC INFORMATION Class Sizes, Courses, and Sections: FY 1987-88 ........................................................................... 76 Total University Student Credit Hours: FY 1987-88 .. .... .... .... .... .............. ...... .................................. 76 Distribution of Student Credit-Hour Loads: Fall Quarter 1988 .... .. ................ .... .. .. .......................... 77 Student Class Rank by Student Classification:
Fall Quarter 1988 Cumulative Grade-Point Average .......... .. .. ...... .... ...... ..................... ...... .......... 78 Distribution of Grades by Class: Fall Quarters 1986 - 1988 ........................................................... 79 Honors Program Enrollment and Sections: FY 1987-88 ................................................ .. ............... 80 Honors Program Awards: FY 1963-64-1987-88 ............................................................ ............... 80 Distribution of Honors Students by Major and Class: Fall Quarter 1988 ........ .... .. ...... .. .................. 81 Statistical Analysis of Advanced Placement .................................. ....... .......................................... 82 Graduate Assistantships: Fall Quarter 1988 .. ... .......................... .... .............. .......... ......... .. .... ... .. .... 83 Graduate Fellowships and Assistantships Awarded through the
Graduate School : Fall Quarter 1988 ....................... .......... ........ .. ................................................ 83 Matriculation Fees by Quarter: Fall 1974- Spring 1989 ...... ........ ................................................... 84 Estimated Cost of Attendance: 1976 - 1989 ...... .... .. .... .... .... ......................................... ... .... ........... 88 University of Georgia Libraries : National Ranking of
Resources and Services ..... ..... ...... ......... ................. ............. .... .... .......... .. .... ......... ...... .. .... ........ 89 Academic Awards Earned by UGA Students ........................................................ .. ................. .. ... 90
STUDENT RELATED INFORMATION Division of Student Affairs ...... ... .... ........... .................................................................................... 92 University Health Service .......................................... ... .............. ...................... ... .... .. .. ... .............. . 93 Career Planning and Placement Activities .............. .. ..... .. ........ .. ................................................... 94 Student Financial Aid Programs: FY 1987-88 ................ ........ ........ .......... .. ...................... ..... ..... ... 95 Social Sororities and Fratern ities ............ .............................................. .... .. .. .. .. .... ....... ....... ... ....... 96
vi
Honorary Fraternities/Societies at the University of Georgia ..... ......... ... .... ......... ............ ... ............. 97 Student Housing ...... ... .... ...................... ....... ..... .... ..... ........ ... .. ..... ... .. ... ...... .............. ... .... .... .......... 98 Georgia Athletic Association Board of Directors .... .. ...... ... ...... ...... ....... ... .............. ............ ..... .... .. 1 01 Georgia Athletic Association Executives ........... .. .... .. ..... ............................. ............ ... ......... .... ... .. 1 01 Athletes at the University of Georgia: Fall Quarter 1988 ... .... .... .. ..... ................................... ... ..... .. 1 02 Academics Pertaining to Athletes on Scholarship ......... ... ..... ....... .. ...... .... .............. ..... ......... .. .. .... 1 02 Southeastern Conference Championships Won by Georgia ..... ... .... .................. .... ... .. .. .... ... .... .... 1 03 Georgia Athletic Training Facilities ..................... ................. .. ............. .... .............. ... ........... .... ... .. 1 03 Distribution of Georgia Alumni by State of Residence .......................... ................. ... ...... ...... ....... 1 04 Distribution of Resident Georgia Alumni by County of Residence:
November 14, 1988 .. ............................................... ................... .. ....................... ........ ............ 1 06 Alumni Statistics: November 14, 1988 .......... .. .. .. ............................... ... ............... .......... ... ........... 1 08 Number of Living Alumni by Class Year: November 14, 1988 ........ ..... .................. ............ .. .. ....... 1 08
FACULTY AND STAFF Faculty and Allied Professional Staff by Rank and Function:
Total University, May 11 , 1988, and October 31, 1988 ................... .. .... .... ................ .... ... .... .. ... 110 Faculty by Total Years of Service at UGA: Total University,
October 31 , 1988 .... .. ..... .. ... .. ..... .... .. .... ....... .... ... .............. ... ..... .. ............................ ..... ........... .. 111 Faculty by Years of Service in Rank at UGA: Total University,
October 31 , 1988 .................. .. .... ............ .......... ............ ................... ...... .. ...... ..... ..... ................ 111 Tenured and Non-Tenured Faculty by Age Range and Rank:
Total University, October 31, 1988 .... .............. .. .... .... .... ........................................................... 112 Graduate Faculty Membership by Rank: Total University, October 31, 1988 ............................... 112 Highest Earned Degrees of Faculty and Allied Professional Staff by Rank:
Total University, October 31 , 1988 .. .................. .......................................... .................... .... .... . 114 Universities Awarding Highest Degrees to Members of the Faculty:
October 31 , 1988 ... ......... ................. .. ... ....... .......... ..... ..... ...... ........ ......... .......... ....................... 115 Universities Awarding Highest Degrees to Members of the Graduate Faculty:
October31 , 1988 .... .. ... .. .......... .... ........ ...... .. ... .... ...... .. ............. .... .. ............. .. .. .. ............. ...... .. .. 116 Special Professorships .... .... ...... .. ..................... ...... .... .. ... ...... ... ...... ... ..... .... ....... ....... ... ....... ......... 117 Student Credit Hours by Instructional Level by Academic Staff: FY 1987-88 .... ..... .... ... ....... ....... .. 121 Institutional Activity by Academic Staff: FY 1987-88 ...... .... ...... .............. ........ .. .............. ... ............ 121 Average Faculty Salaries Based on Academic Year: 1977-78 - 1988-89 .. .... .. ........................ .. .... . 122 University Employees by Occupational Classification: 1988 ...... .......... .. .... .... .............................. 124
FINANCIAL INFORMATION Sources of Revenue: FY 1987-88 ..................... ....... .................... ................. .......... ...... ............... 126 Percent Distribution of Revenue by Source: FY 1978-79 - 1987-88 ............................... ... ............ 127 Expenditures by Budgetary Function: FY 1987-88 .................. .... ...... ... .... .... ....... ...................... ... 128 Percent Distribution of Expenditures by Budgetary Function:
FY 1978-79 - 1987-88 .......... .. .... .. ..................... .. ... ...... .... ... ........ .. .......... ...... ... .. .... ... .. ... ........... 129 Budgetary Distribution of State of Georgia Appropriations :
FY 1 979-80 - 1 988-89 ...... .. .... ... ....... ................. .. ...... ... .. .. ... .... ... ......... .... ....... .. ... .................. ... 130 Sources of Unrestricted Revenue for Resident Instruction:
FY 1968-69 - 1988-89 .... ........................ ..... ..... ........ .............. ..... .. .... .. .... .. ...................... ..... .... 131 Sources of Grant and Contract Instructional Funds: FY 1987-88 ............................ .... .. ........ ....... 132 Sources of Budgeted Research Funds: FY 1970-71 - 1987-88 .. .. ....... .. ............ .. .... .. .. .. .......... .... .. 133 Sources of Budgeted Public Service and Extension Funds:
FY 1977-78 - 1987-88 ....... .. ...... .. ... ... .... .. ................ ............ ................... ...... .................. ...... ..... 133
vii
Sources of All Research Funds: FY 1987-88 ................ ........... .. ... .. .......... .. ....... ............... .... .... .... 134 Sources of Research, Grant , and Contract Awards: FY 1987-88 ............... .. .................... .. .. .. ...... . 135 Sources of All Public Service and Extension Funds: FY 1987-88 ...... .. .......... .. .... ....... ... .. .. .... ....... 136 History of Contributions to the University of Georgia: FY 1973-74 - 1987-88 ...... . , .......... ... . : ........ 137
RESEARCH , SERVICE, AND AUXILIARY AND ADMINISTRATIVE UNITS Advanced Computational Methods Center ....... .............. ................. .. ..... .. .. .... .. ... .... .... .. ... ... , ....... 140 Agricultural Experiment Stations ..... ........ ..... .... .......... ..... ... .. .. ..... ............... .. .. ... .. .. ... .. ................. 140 Auxiliary Services .... ....................... .... ........................................ .... ... . : .... .. ... .......... .. .... .. ............... 140 Bureau of Educational Services ...... .... .. .. .. .... .... ..... ........ .......... ............................ .. .................. .... 141 Center for Advanced Ultrastructural Research ............................ ........ .................. .. ........... ..... .... . 141 Center for Applied Isotope Studies ........... .... .... ....................................... ............. .. ................. .... 141 Center for Archaeological Sciences ..... ...... .... ... .... ..................... .. ................................... .. ... ... ..... 141 Center for Audit Research ................ ......... .. ... .. .................. ........................... .... ............. .. .. ......... 141 Center for Biological Resource Recovery ...................... ..... .......... ... : .. .. .. ........ ............................. 141 Center for Computational Quantum Chemistry ... ............................... .. .......... ..... ......................... 141 Center for East-West Trade Policy ....... .. ................ ... .... .. ............... : .. ....... ........................ ..... ....... 142 Center for Economic Education .......... .... ..... ..................................... .... .... ........................... : ..... . 142 Center for Environmental Biotechnology ..................... ....... .. .. .. ............ ............ ............... : .......... . 142 Center for Family Research ........................... ............... ................ ..... ....... ... ... .. .... ..... ........ .... ..... . 142 Center for Global Policy Studies ....... ............... .... ........ .... ...... .................... ...... .. .............. .... .. ... .. . 142 Center for Insurance Education and Research ...................... ...... ............ ...... ... ............... .... ...... .. 142 Center for International Mass Communication Training and Research ...... .... ... , .. ...... .. .. .. .. .. .. .... .. 142 Center for Latin American Studies ................................... .. ... ..... .. .. ............... .......... , ........ ....... ..... 14f2 Center for Management Excellence ......... .. .... ........... ....... ... .... .. ... .................... ........ .. ...... ..... ...... , 142 Center for Marketing Studies ........... .. ...... , .................... ..... ... .. .... ...... .. ... ..... .. .... ... : .... : ...... .... ........ 143 Center for Plant Cellular and Molecular Biology ........... .... ............ .. ..... .......... .. ................... .. ....... 143 Center for Private Enterprise ................................ .. .. ....... .. ... .... .................... .. .. ...... .......... .. ........ 143 Center for Remote Sensing and Mapping Science .. .......................... .. .................... .' .. : ...... .. ........ 143 Center for Research on Deviance .... ...... .. ........ ...... ..... ..... .......... .... ... ... .. ... .. ....................... .. .... .. .. 143 Center for Research on Nitrogen Fixation and Metalloenzyme Catalysis .. ................................... 143 Center for Simulational Physics .... .. .. ... ............ ..... .. ... .. ..................... ... .... ......................... ..... ..... . 143 Child and Adolescent Clin jc ..... , ...... .. . , ... ..... .. , .. .................. .. ........... : .... .... ...... .. .......... .......... .... .... i43 Complex Carbohydrate Research Center ........ ..... ....... ....... .. .... .. .............. ......................... .... .. .... 144 Cooperative Extension Service .......... ...................................... ....... ... : ..... .. .. .......................... ...... 144 Developmental Disabilities Program ................ .. ............ .... .... ..... ... ................ .... ....... .............. .. ... 144 Division of Research: College of Business Administration ........................ .. ........ .... ..... : .. .... .. ... .... 144 J. W. Fanning Community Leadership Development Center ....................... .................... .. , .. ....... 144 Financial and Student Information Systems Division .......................................... .. ....................... 145 Georgia Center for Continuing Education ....................... .. ..... .. ...... .... .. ....... .......... ....................... 145 Georgia Museum of Art .... ... .... ..... ................. ........ ......... ..... .. .. : .. .............................. ......... .. .... .... 145 Georgia Review ........ ... .. .................... .... .. .... ...... ...... .. .. .. ...... .............. ... ...... , .. ..... ............... ... ...... . 145 Humanities Center ...... ........... .. ............................ , .............. .... .. ...... .. .. .. .... .' ................................. 145 Institute for Behavioral Research ................ .............. .............. .... ........... ... .................... , .... .. ........ 146 Institute for Business ................................... ....... ..... .. ... .. .... ... ................. ..... .. .... .. .................... ..... 146 Institute for Natural Products Research .... ... ... .. .... ..... ......... .... .. ... ... .. ........... .. ............ .. ......... .. .... . 146 Institute of Community and Area Development ........ ........ ............. .. ... ........... .... , ...... ............ ....... 146 Institute of Continuing Judicial Education of Georgia .... .... .. ... .. .. .... .................... .... ......... .. .. ..... ... 146 Institute of Continuing Legal Education in Georgia ........ ....... .................. , ........ ...... .... .... ........ .. .... 147 Institute of Ecology .. .... .. .................. .................. ....... .. ........ ... .............. .. .. .. .. .. .... .... ......... ..... ........ 147
viii
Institute of Higher Education .................. .. ........ ......................... .... ..... .. ... ......... .......... ................. 147 Institute of Natural Resources ... ............ ... .... .......... .......... ....... .... .. ................................ ......... .. ... 147 Learning Disabilities Adult Clinic .......... ........ ... ............................ ... ......... ....... ........... .. ... .. ...... .... . 147 Marine Sciences Program ...................... ....... ........ ... ..... ... ... .. .................. ................... ...... .. ......... 147 National Institute for Instructional Materials .... .......... .......... ......... ..... ............... .... ...... .. ............... . 148 Office of Campus Planning ....... ....................................... .... .......... ........ ... ........ ... ........ .... .... ........ 148 Office of Development and University Relations .... .. ....... ..... ................... ....... ..... .. ..... .. ..... .... ....... 148 Office of Institutional Research and Planning .. ....... .. ... ... ........ .... ...... .... ...... .......... .... .. .. ......... .. .. .. 148
·Office of Instructional Development ....... ....... .. ................. ...... ...... .... .......... ...................... .. ........ .. 148 Office of International Development .. .... ...... .... .................. ... .. , ........... .. ....... ............ ..... ... .. ..... .... . 149 Poultry Disease Research Center ........ ......................... ..... .. ...... ..... .. ......................... ........ .......... 149 Psychology Clinic ..... .................. .. ....... .. .. .. ................. ........ .......... .................. .. .. .. ........ .... .. ..... .... 149 Public Safety Division ......................... .. ..... .. ........... .... .................... ........... .. .... ... ..... .. ... .. .... ......... 149 Dean Rusk Center for International and Comparative Law ......... .. ......... .. .............. .... .......... ........ 150 Small Business Development Center .. ...... .... ........ .... .......... .. .. ............ ............. ........ ....... .. ..... ... ... 150 Speech and Hearing Clinic .... ... ...... .. ....... ........ .. .. ............... ..................................... ......... .... ....... 150 State Botanical Garden of Georgia ...... ... ... ... .................... ........... ................... .... .... ........ .... ......... 150 Survey Research Center ....... ...... .. .. ................... ...... ......... .... ... .. ...... ............................... ... .. ........ 151 University Computing and Networking Services .............. ... ......................................................... 151 University of Georgia Gerontology Center ..... ..... ........ ....... ........... ............................ ...... .. ... .. ...... 151 University of Georgia Libraries ........ ............ .... .... ........ ... .................... .... ......... .. ......... .. .. ..... .... .... 151 University of Georgia Museum of Natural History ...................... ........ ...... ..... .. .... .. .. .. .... .... ......... .. 152 University of Georgia Press .................................................... ........ .. ..... .. ... .................. ... ... .... ..... 152 University of Georgia Research Foundation, Inc .. ................................ .................. ........... ..... ..... 152 Veterinary Medical Diagnostic Assistance Laboratories .. .... ... ................................. .. ....... .. .. ........ 153 Veterinary Medical Experiment Station .......... .... ............. ............ ............ ... ... ... .... .. ...... ... ..... ...... .. 153 Carl Vinson Institute of Government .................. .. ... ............. ............... ...... ...... ..... ... ............ .. .... ... 153
PHYSICAL FACILITIES University Buildings by Use, Athens Campus ...... .... .. ...... ........ ........................................ .. .... .... .. 156 Number of Rooms by Basic Room Type, Athens Campus ....... ........................... .. ........ .. .. ........ ... 156 Utilization of Instructional Facilities: Fall Quarter 1988 ....... .. ........................ ................... .... .. ... ... 156 University Buildings by Room Use and Location: Area (Square Feet) ........... .. .... .. ...................... 157 University Buildings by Program Classification and Location:
Area (Square Feet) .. ... .... .... .... ..... ......... .... ......... ... ... .. ............................ ................................. . 157 Building Cost Summary by Years of Completion, Athens Campus ....................... .......... ..... ........ 158 Academic and Administrative Buildings, Date of Initial Occupancy,
Athens Campus ..... ......... ................................ ... ... ................ .... ..... ........ .. .. ... ..... .... .................. 159 Major Building Projects Completed 1960 - 1988 All University ............ .......................... .. .... .. ...... 160 Projects Currently Under Construction ................... ... ..... .... ... ............ ............................. ......... .... 169 Authorized Projects Being Planned ......... ......... ... .. ... ............ ..... .. ........................ ...... ..... .... .... ..... 169 Land Holdings .. .. ..... ............ .. .. ..... ..... ...................... .............. ............... ............... ......... .... .. .... ..... 170 University of Georgia Map: Legend ........ ............ ....... .. .. ....... ..... ... .. ............................. .. ....... .. .... 172
ix
~i gure 1 . ~igure 2. ~igure 3. ~i gure 4. Figure 5.
~ igure 6.
Figure 7.
Figure 8. Figure 9. Figure 10. Figure 11 . Figure 12. Figure 13. Figure 14. Figure 15. Figure 16. Figure 17. Figure 18.
Figure 19. Figure 20.
LIST OF FIGURES
Page University of Georgia Administrative Organization .. ...... .. .. .. .... .. .......... .... .... .. .... .. .......... . 21 Freshman Applicants by Admission Status: Fall Quarters 1960-1988 .............. .... .. .... .... . 27 SAT Scores for Entering Freshmen: Fall Quarters 1966 - 1988 .. ........................ .. ........ .. 29 Regular Enroll ment: Fall Quarters 1978-88 .. .. ...................... .. ...... .. ...... .. ........ .. .............. 45 Distribution of Fall Quarter 1988 Enrollment
by State of Origin .................... ........ .... .. .. .... .. .... .. ...... .............................................. . 49 Distribution of Fall Quarter 1988 Enrolled Georgia Residents
by County of Residence ........ ........ ...... , .. ....... ..... ......... .................. .. .... ........ .. ..... ..... .. 51 Enrollment Progression of UGA Freshmen Entering
Fall Quarters 1978 - 1987 ............ ............................ .. ...................... .. .......... ......... .. .. 55 Total Degrees Conferred: FY 1969 - 1988 ...... ........ ...... .. .. .. ........ ...................... .. ........ .. .. 65 Average Graduation Rates by Matriculation Type ...................................................... ..... 73 Estimated Cost of Attendance: 1976 - 1989 ...... ..... ..... .. ............ .............. ...... ............... ... 88 Georgia Alumni, Geographic Distribution by State .................................................... .. . 1 05 Distribution of Resident Georgia Alumni by County of Residence .......... .... .. .. ...... .. .... .. 1 07 Rank, Tenure, and Graduate Faculty Status of Professorial Faculty .. .. .... .. .... .... .... ....... 113 Highest Earned Degrees of Professorial Faculty ............. ... ................. .. .... ... .......... ...... . 113 Average Faculty Salaries Based on Academic Year .. .... .... ...... ...... .. .. ............... .... ......... 123 University Employees by EEO Category: November 1, 1988 ............ .. ........................ .. 123 Percent Distribution of Revenue by Source: FY 1987-88 .................. .. .................... .. .... . 127 Percent Distribution of Expenditures by Budgetary Function
FY 1987-88 .. ... ...... .... ............. .... ..... .. ...... .. ..... .......... ...... ....... .. .. ... .... ...... ..... .. ..... ...... 129 Location of Land Holdings .. ................. .... ...... .. ...................... .. .......... ... .. ............ .. ..... .. 171 University of Georgia Map: Athens Campus .......... ............ .......... .. ............. .. ................ 173
X
GENERAL INFORMATION (ffi) I 7 8 5 .,

CHARTER OF THE UNIVERSITY OF GEORGIA
PREAMBLE
As it is the distinguishing happiness of free governments that civil Order should be the Result of
choice and not necessity, and the common wishes of the People become the Laws of the Land, their
public prosperity and even existence very much depends upon suitably forming the minds and morals of
their Citizens. When the Minds of people in general are viciously disposed and unprincipled and their Con
duct disorderly, a free government will be attended with greater Confusions and with Evils more horrid
than the wild, uncultivated State of Nature . It can only be happy where the public principles and Opinions
are properly directed and their Manners regulated. This is an influence beyond the Stretch of Laws and
punishments and can be claimed only by Religion and Education. It should therefore be among the first
objects of those who wish well to the national prosperity to encourage and support the principles of
Religion and morality, and early to place the youth under the forming hand of Society that by instruction
they may be moulded to the love of Virtue and good Order. Sending them abroad to other countries for
their education will not answer these purposes, - is too humiliating an acknowledgement of the Ignorance
or Inferiority of our own, and will always be the Cause of so great foreign attachments that upon principles
of policy it is not admissible. This Country in the times of our common danger and distress found such
Security in the principles and abilities which wise regulations had before established in the minds of our
countrymen, that our present happiness joined to pleasing prospects should conspire to make us feel
ourselves under the strongest obligation to form the youth, the rising hope of our Land to render the like
glorious and essential Services to our country. And whereas for the great purpose of internal education,
divers allottments of land have, at different times, been made, particularly by the Legislature at their Ses
sion in July One thousand seven hundred and eighty three, and February One thousand seven hundred
and eighty four, all of which may be comprehended and made the basis of one general, and complete es
tablishment.
THEREFORE the Representatives of the Freemen of the State of Georgia in general Assembly met
this twenty seventh day of January in the Year of our Lord One Thousand seven hundred and eighty five
enact, ordain, and declare, and by these presents, it is ENACTED, ORDAINED and DECLARED.
3
Abraham Baldwin President, University of Georgia
1785 - 1801
UNIVERSITY OF GEORGIA PERSPECTIVE
Just after the close of the American Revolution, the Georgia legislature took a step that was to start another
revolution - this one in higher education . In 1785, Georgia became the first state in the nation to grant a
charter for a state-supported university, a decision setting the precedent whereby states would provide
for the higher education of their citizens .
The infant university existed for sixteen years on paper only, without campus, money, faculty, or students.
Finally in 1801 a site was selected for the campus, and the first few students began to trickle into the newly
formed frontier town of Athens. That first year the faculty consisted only of the college president, Josiah
Meigs. Classes were held in a primitive log structure while the university, then called Franklin College,
waited for its first permanent building.
From such tenuous beginnings, the University of Georgia has grown to become a major teaching, research,
and service institution with over 2,000 faculty members, 13 colleges , and a physical plant serving more
than 27,000 students. The campus, including forestry and agricultural areas, covers more than 43,000
acres. In addition, off-campus centers and experiment stations carry university services to all parts of the
state.
The rich heritage of the tree-shaded campus of Franklin College, now the university's Franklin College of
Arts and Sciences, has been preserved in spite of extensive campus expansion to provide the most modern
of classroom and laboratory facilities. The arch at the campus entrance, the 1806 Old College structure
which now houses administrative offices, and other early nineteenth-century buildings renovated for
continuing use offer quiet tribute to Georgia's 200-year commitment to provide quality education for its
citizens.
The most complete account of this institution's long and interesting history is T. G. Dyer's The University
of Georgia: A Bicentennial History, 1785 - 1985. F. N. Boney's Pictorial History of The University of Georgia
also covers this 200-year period . In addition, several other studies provide insight into various periods of
the university's history: E. M. Coulter, College Life in the Old South ; A. L. Hull, A Historical Sketch of the
University of Georgia; H. C. Tuck, Four Years at The University of Georgia, 1877 - 1881; R. P. Brooks, The
University of Georgia Under Sixteen Administrations, 1785 - 1955; and S. Abell 's, The University of Georgia,
a book of photographs commissioned by the Alumni Society in 1987.
4
PURPOSE
The University of Georgia is the state's oldest , most comprehensive, and most diversified educational
institution . As the capstone of the University System of Georgia, it influences the entire structure of
education ,in the state by leading the pace of achievement and creating a climate of intellectual and cultural
development for all units in the system . Through its teaching, research, and service missions, the university
focuses its enormous resources to improve the quality of life throughout Georgia and increasingly beyond
the state's boundaries as well .
Historically, teaching has been the primary purpose of the university and continues to be a vital
responsibility . A special strength of the university lies in the scope and diversity of degree programs it
offers. At the undergraduate level, the university provides two associate degrees and 18 baccalaureate
degrees with concentrations in 141 major fields . At the graduate level , it offers 25 master's degrees in 121
areas of concentration , 38 educational specialist degree programs, and doctoral degrees - Ph.D., Ed . D.;
D. M.A., or D PA - in 80 areas. In addition , professional degree programs are available in law (JD),
pharmacy (PHARMD), and veterinary medicine (DVM) .
The continuing vitality of the university 's graduate educational programs depends not only upon excellence
in teaching but also upon a strong commitment to basic and applied research in all academic disciplines.
In addition to training experts and scholars , the university seeks through research to expand the frontiers
of knowledge by providing the expertise and resources necessary to cope with increasingly complex and
difficult problems.
The university directly affects the lives of millions through its service capabilities . Entire industries have
come into being and flourished as a result of the university's ability to deliver new knowledge and
techniques directly to those who can put them to use. Thousands of adults annually are able to expand
their knowledge and skills through opportunities for continuing education provided by the University of
Georgia. Specialized institutes within the university make possible a timely response to problems arising
in any sector - from governmental structure to small businesses to the environment.
As a land-grant and sea-grant public institution. the University of Georgia has become a leader in the
successful integration of teaching , research , and service components. In each of these mutually enhancing
functions , the university has a stated commitment to excellence.
5
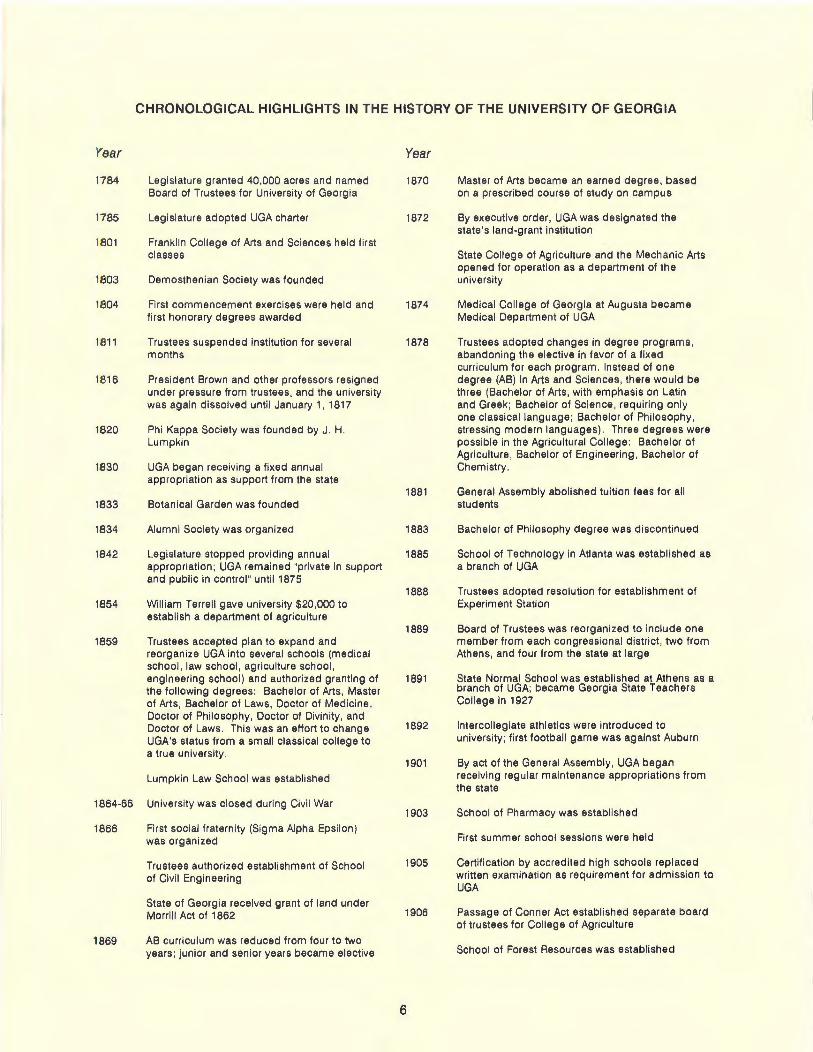
CHRONOLOGICAL HIGHLIGHTS IN THE HISTORY OF THE UNIVERSITY OF GEORGIA
Year Year
1784 Legislature granted 40,000 acres and named 1870 Master of Arts became an earned degree, based Board of Trustees for University of Georgia on a prescribed course of study on campus
1785 Legislature adopted UGA charter 1872 By executive order, UGA was designated the state's land-grant institution
1801 Franklin College of Arts and Sciences held first classes State College of Agriculture and the Mechanic Arts
opened for operation as a department of the 1803 Demosthenian Society was founded university
1804 First commencement exercises were held and 1874 Medical College of Georgia at Augusta became first honorary degrees awarded Medical Department of UGA
1811 Trustees suspended institution for several 1878 Trustees adopted changes in degree programs, months abandoning the elective in favor of a fixed
curriculum for each program. Instead of one 1816 President Brown and other professors resigned degree (AB) in Arts and Sciences, there would be
under pressure from trustees , and the university three (Bachelor of Arts, with emphasis on Latin was again dissolved until January 1, 1817 and Greek ; Bachelor of Science, requiring on ly
one classical language; Bachelor of Philosophy, 1820 Phi Kappa Society was founded by J. H. stressing modern languages). Three degrees were
Lumpkin possible in the Agricultural College : Bachelor of Agriculture , Bachelor of Engineering, Bachelor of
1830 UGA began receiving a fixed annual Chemistry. appropriation as support from the state
1881 General Assembly abolished tuition fees for all 1833 Botanical Garden was founded students
1834 Alumni Society was organized 1883 Bachelor of Philosophy degree was discontinued
1842 Legislature stopped providing annual 1885 School of Technology in Atlanta was established as appropriation; UGA remained "private in support a branch of UGA and public in control " until 1875
1888 Trustees adopted resolution for establishment of 1854 William Terrell gave university $20,000 to Experiment Station
establish a department of agriculture 1889 Board of Trustees was reorganized to include one
1859 Trustees accepted plan to expand and member from each congressional district, two from reorganize UGA into several schools (medical Athens, and four from the state at large school, law school, agriculture school , engineering school) and authorized granting of 1891 State Normal School was established at Athens as a the following degrees: Bachelor of Arts , Master branch of UGA; became Georgia State Teachers
of Arts, Bachelor of Laws , Doctor of Medicine , College in 1927
Doctor of Philosophy, Doctor of Divinity, and 1892 Intercollegiate athletics were introduced to Doctor of Laws. This was an effort to change
UGA's status from a small classical college to university; first football game was against Auburn
a true university. 1901 By act of the General Assembly , UGA began
Lumpkin Law School was established receiving regular maintenance appropriations from the state
1864-66 University was closed during Civil War 1903 School of Pharmacy was established
1866 First social fraternity (Sigma Alpha Epsilon) was organized First summer school sessions were held
Trustees authorized establishment of School 1905 Certification by accredited high schools replaced
of Civil Engineering writ1en examination as requirement for admission to UGA
State of Georgia received grant of land under 1906 Passage of Conner Act established separate board Morrill Act of 1862
of trustees for College of Agriculture
1869 AB curriculum was reduced from four to two years; junior and senior years became elective School of Forest Resources was established
6
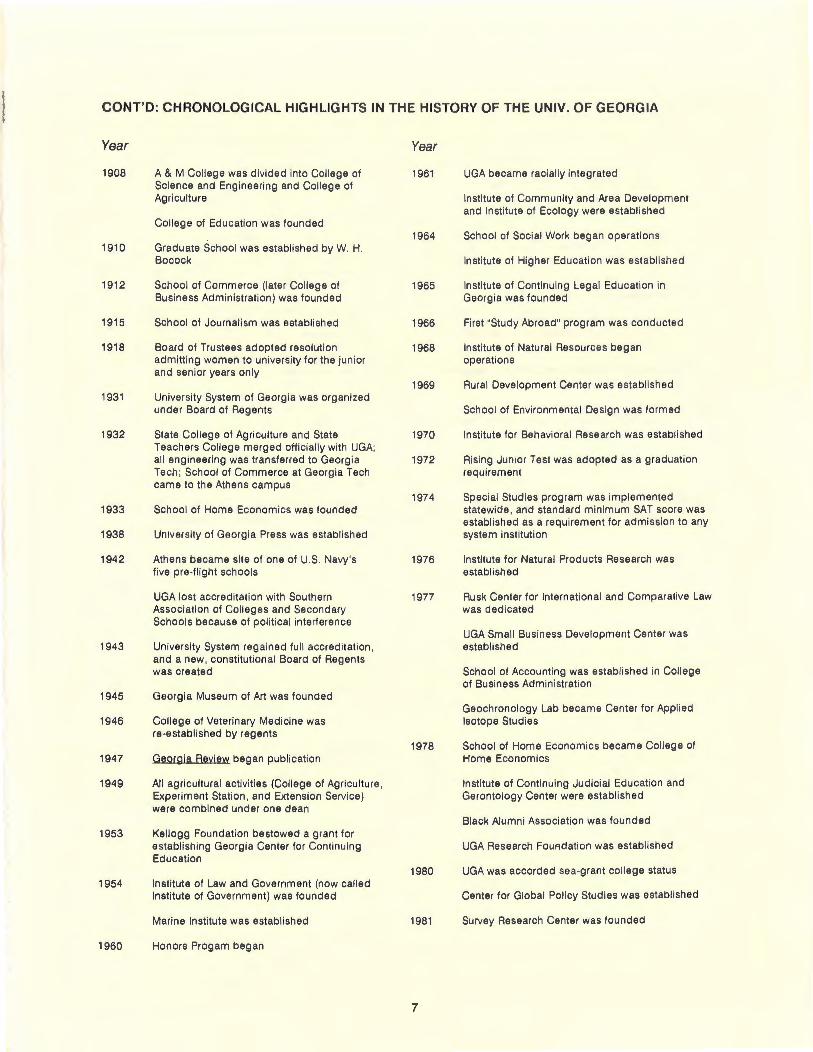
CONT'D: CHRONOLOGICAL HIGHLIGHTS IN THE HISTORY OF THE UNIV. OF GEORGIA
Year Year
1908 A & M College was divided into College of 1961 UGA became racially integrated Science and Engineering and College of Agriculture Institute of Community and Area Development
and Institute of Ecology were established College of Education was founded
1964 School of Social Work began operations 1910 Graduate School was established by W. H.
Bocock Institute of Higher Education was established
1912 School of Commerce (later College of 1965 Institute of Continuing Legal Education in Business Administration) was founded Georgia was founded
1915 School of Journalism was established 1966 First "Study Abroad" program was conducted
1918 Board of Trustees adopted resolution 1968 Institute of Natural Resources began admitting women to university for the junior operations and senior years only
1969 Rural Development Center was established 1931 University System of Georgia was organized
under Board of Regents School of Environmental Design was formed
1932 State College of Agriculture and State 1970 Institute for Behavioral Research was established Teachers College merged officially with UGA; all engineering was transferred to Georgia 1972 Rising Junior Test was adopted as a graduation Tech ; School of Commerce at Georgia Tech requirement came to the Athens campus
1974 Special Studies program was implemented 1933 School of Home Economics was founded statewide, and standard minimum SAT score was
established as a requirement for admission to any 1938 University of Georgia Press was established system institution
1942 Athens became site of one of U.S. Navy 's 1976 Institute for Natural Products Research was five pre-flight schools established
UGA lost accreditation with Southern 1977 Rusk Center for International and Comparative Law Association of Colleges and Secondary was dedicated Schools because of political interference
UGA Small Business Development Center was 1943 University System regained full accreditation , established
and a new, constitutional Board of Regents was created School of Accounting was established in College
of Business Administration 1945 Georgia Museum of Art was founded
Geochronology Lab became Center for Applied 1946 College of Veterinary Medicine was Isotope Studies
re-established by regents 1978 School of Home Economics became College of
1947 Georgia Reyjew began publication Home Economics
1949 Al l agricultural activities (College of Agriculture, Institute of Continuing Judicial Education and Experiment Station, and Extension Service) Gerontology Center were established were combined under one dean
Black Alumni Association was founded 1953 Kellogg Foundation bestowed a grant for
establishing Georgia Center for Continuing UGA Research FouAdation was established Education
1980 UGA was accorded sea-grant college status 1954 Institute of Law and Government (now called
Institute of Government) was founded Center for Global Policy Studies was established
Marine Institute was established 1981 Survey Research Center was founded
1960 Honors Progam began
7
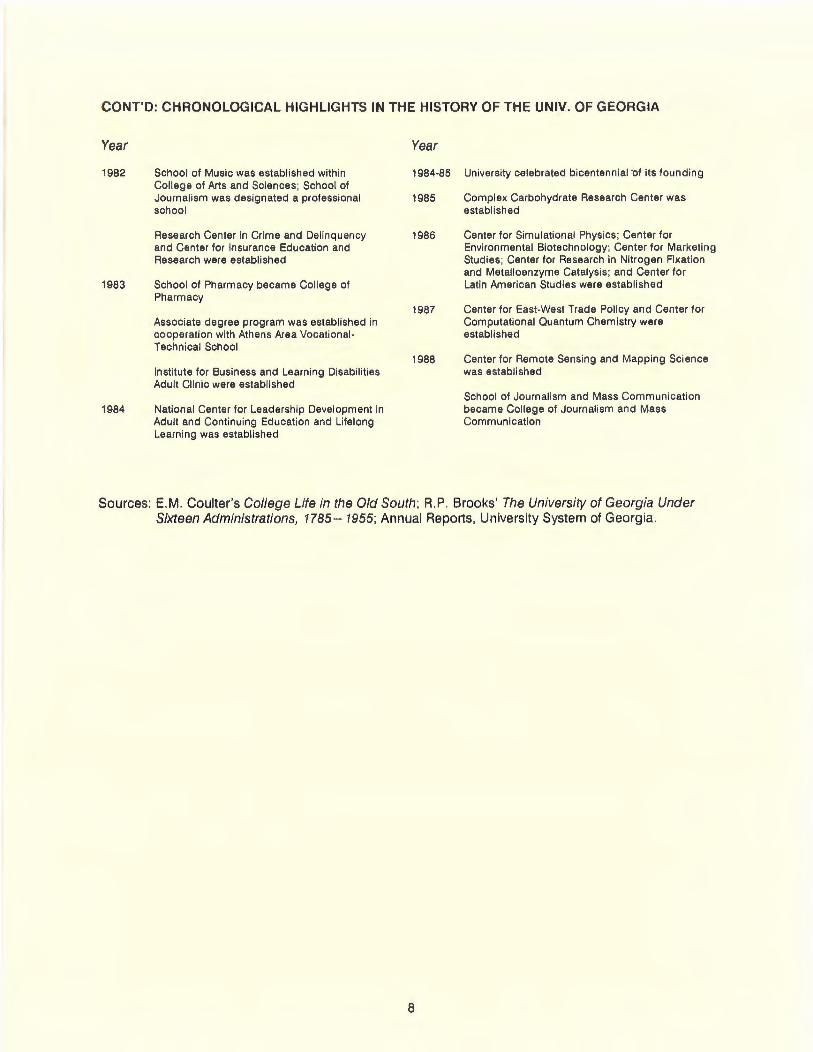
CONT'D: CHRONOLOGICAL HIGHLIGHTS IN THE HISTORY OF THE UNIV. OF GEORGIA
Year
1982
1983
1984
School of Music was established within College of Arts and Sciences; School of Journalism was designated a professional school
Research Center in Crime and Delinquency and Center for Insurance Education and Research were established
School of Pharmacy became College of Pharmacy
Associate degree program was established in cooperation with Athens Area VocationalTechnical School
Institute for Business and Learning Disabilities Adult Clinic were established
National Center for Leadership Development in Adult and Continuing Education and Lifelong Learning was established
Year
1984-85 University celebrated bicentennial ·of its founding
1985 Complex Carbohydrate Research Center was established
1986 Center for Simulational Physics; Center for Environmental Biotechnology; Center for Marketing Studies; Center for Research in Nitrogen Fixation and Metalloenzyme Catalysis; and Center for
1987
1988
Latin American Studies were established
Center for East-West Trade Policy and Center for Computational Quantum Chemistry were established
Center for Remote Sensing and Mapping Science was established
School of Journalism and Mass Communication became College of Journalism and Mass Communication
Sources: E.M. Coulter's College Life in the Old South; R.P. Brooks' The University of Georgia Under Sixteen Administrations, 1785-1955; Annual Reports, University System of Georgia.
8
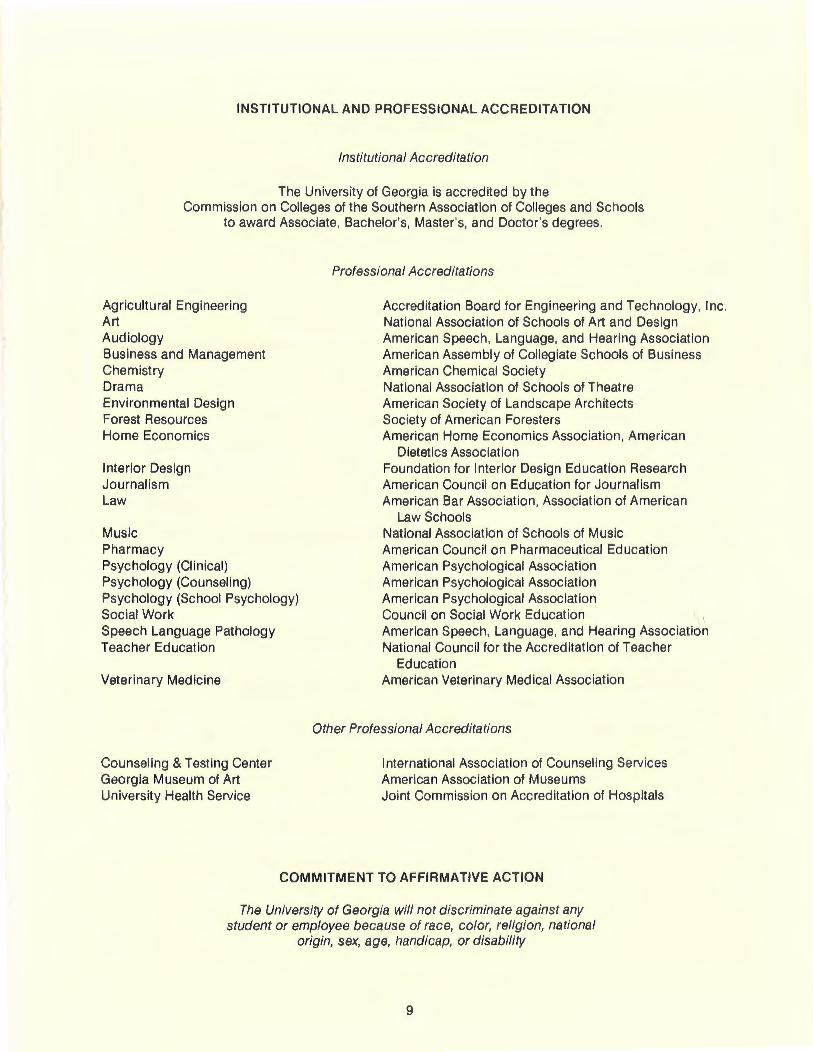
INSTITUTIONAL AND PROFESSIONAL ACCREDITATION
Institutional Accreditation
The University of Georgia is accredited by the Commission on Colleges of the Southern Association of Colleges and Schools
to award Associate. Bachelor's, Master's, and Doctor's degrees.
Agricultural Engineering Art Audiology Business and Management Chemistry Drama Environmental Design Forest Resources Home Economics
Interior Design Journalism Law
Music Pharmacy Psychology (Clinical) Psychology (Counseling) Psychology (School Psychology) Social Work Speech Language Pathology Teacher Education
Veterinary Medicine
Counseling & Testing Center Georgia Museum of Art University Health Service
Professional Accreditations
Accreditation Board for Engineering and Technology, Inc. National Association of Schools of Art and Design American Speech, Language, and Hearing Association American Assembly of Collegiate Schools of Business American Chemical Society National Association of Schools of Theatre American Society of Landscape Architects Society of American Foresters American Home Economics Association, American
Dietetics Association Foundation for Interior Design Education Research American Council on Education for Journalism American Bar Association, Association of American
Law Schools National Association of Schools of Music American Council on Pharmaceutical Education American Psychological Association American Psychological Association American Psychological Association Council on Social Work Education American Speech, Language, and Hearing Association National Council for the Accreditation of Teacher
Education American Veterinary Medical Association
Other Professional Accreditations
International Association of Counseling Services American Association of Museums Joint Commission on Accreditation of Hospitals
COMMITMENT TO AFFIRMATIVE ACTION
The University of Georgia will not discriminate against any student or employee because of race, color, religion, national
origin, sex, age, handicap, or disability
9
UNIVERSITY OF GEORGIA INTERNATIONAL AGREEMENTS
Country and Participating University or Group
Australia Royal Melbourne Institute of Technology
Belgium Institute of European Law, University of Brussels
Bolivia El Centro De Estudios Sociales (Cendes, La Paz)
Brazil Universidade Federal de Minas Gerais, Belo Horizonte
Universidade Federal de Pernambuco, Recife
Universidade Federal Rural de Pernambuco, Recife
IPA, Empresa Pernambucana de Pesquisa Agropecuaria, Recife
Burkina Faso (Upper Volta) University of Ouagadougou, Ouagadougou
Chile School of Business, University of Chile
China (People's Republic) Shanghai University of Commerce and Finance, Shanghai
England Oxford, Oriel College
France Group Commun d'Enzymologie, CNRS-CEA, Cadarache
lnstitut de Recherche et D'Action Commerciale, Montpellier
lnstitut Superieur du Commerce, Paris
Merieux Laboratories Inc. , Rhone
10
Type of Agreement
Landscape Architecture Student exchange
Student summer program in law
Graduate work at UGA for Bolivian students
Studies abroad program Center for Latin American Studies
Scientific cooperation and exchange in pharmacy
Faculty training, program development, and collaborative research in agriculture
Collaborative agricultural research
Institution building program
Faculty exchange
Facutly exchange, graduate study, collaborative research
History studies abroad program
Collaborative biomass conversion research
Student exchange
Student exchange in business administration
Collaboration in the production of animal rabies and poultry vaccine
CONT'D: UNIVERSITY OF GEORGIA INTERNATIONAL AGREEM ENTS
Country and Participating University or Group
Universite d'Orleans, Orleans
Universite Pierre et Marie Curie , Paris
Universite de Technologie de Compiegne, Compiegne
Universite de Paris-Nord (Paris XIII) Villetaneuse
Universite Jean Moulin-Lyon II , Lyon
Universite Jean Moulin (Lyon Ill)
University of Law, Economy and Sciences of Aix-Marseille , Marseille
Greece International Center for Business Studies, Thessaloniki
Anatolia College
Guatamala Universidad del Valle de Guatemala, Guatemala City
Hungary University of Horticulture and Food , Budapest
Israel Israeli Agricultural Research Organization (ARO) , Volcani Center, Bet Dagan
Italy Cortona
Rome (and Greece)
Japan Kagoshima University, Kagoshima
Yokohama National University, Yokohama
Korea Pusan Sanub University, Pusan
11
Type of Agreement
Educational and cultural exchange in the field of Earth Sciences and student exchange in business administration
Cooperation in development of research programs and scientific exchanges in entomology
Faculty exchange and collaborative research in microbiology and biomedical technology
Faculty exchange in comparative literature and American Studies
Exchange and research program in law, business administration, and foreign languages and literature
Student exchange
Faculty exchange and cooperative research in the field of Earth Sciences
Student exchange in business administration
Student exchange
Faculty exchange in microbiology
Faculty exchange and cooperative research
Cooperative educational research and exploration of UGA graduate program at ARO
Art, drama, environmental design studies abroad program
Student summer program in classical civilization
Faculty exchange in agriculture and veterinary medicine
Faculty exchange, collaborative research
Institution building program
CONT'D: UNIVERSITY OF GEORGIA INTERNATIONAL AGREEMENTS
Country and Participating University or Group
~ore a Pusan Sanub University, Pusan
Mexico Universidad I beroamericana, Mexico City
Jietherlands Nijenrode
Portugal Group of Molecular Biophysics and Department of Chemistry and Biotechnology; Group of Biology of Institute of Energy, Lisbon
Aomania Research and Biological Preparation for Poultry and Small Animals Center, Bucuresti
Spain Institute of Zaragoza, Zaragoza
Taiwan, Republic of China Tunghai University, Taichung
West Germany Hohenheim University, Stuttgart
German Academic Exchange Service, Bonn-Bad Godesberg
University of Erlangen-Nurnberg, Erlangen
Venezuela Universidad Nacional Experimental de Los Llanos Occidentales Ezequiel Zamora, Barinas and Guanare
Universidad Francisco de Miranda, Maracaibo
Universidad Centro Occidental, Barquisimeto
Source: Office of International Development
12
Type of Agreement
Institution building program
Faculty and graduate student exchange programs in Spanish and international and comparative law
Student exchange in business administration
Research collaboration with Biochemistry Department on biomass conversion
Faculty exchange with College of Veterinary Medicine
Faculty exchange, graduate programs, collaborative research in ecology
Faculty exchange and cooperative research
Student exchange in agriculture
Student exchange at post-baccalaureate level
Faculty and student exchange
Institution building program
Institution building program
Institution building program
FLAG OF THE UNIVERSITY OF GEORGIA
Designed in 1980 by Charles 0 . Johnson, the University of Georgia flag features the university arch and
thirteen white stars against a red background with rectangular black borders ._ The arch, which has long
been a symbol of the university, is the natural centerpiece for the flag . A black, three-columned,
wrought-iron arch modeled after the one on the State of Georgia Seal of 1799 has marked the entrance to
the campus since 1858. The stars represent the thirteen schools and colleges of the university, as well as
the thirteen original American colonies . The first flag (5 x 8 feet) was unfurled on September 20, 1980,
during the Georgia-Clemson football game.
13
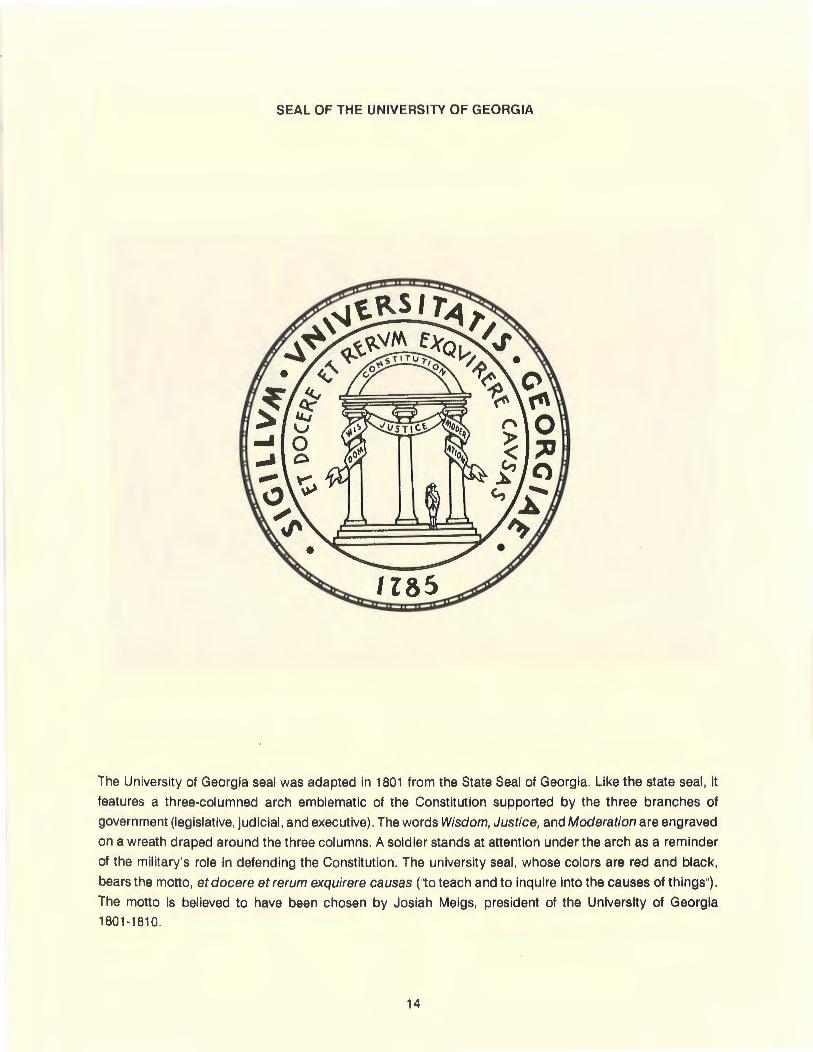
SEAL OF TH E UNIVERSITY OF GEORGIA
The University of Georgia seal was adapted in 1801 from the State Seal of Georgia. Like the state seal, it
features a three-columned arch emblematic of the Constitution supported by the three branches of
government (legislative, judicial , and executive) . The words Wisdom, Justice, and Moderation are engraved
on a wreath draped around the three columns. A soldier stands at attention under the arch as a reminder
of the military's role in defending the Constitution. The university seal , whose colors are red and black,
bears the motto, et docere et rerum exquirere causas ("to teach and to inquire into the causes of things") .
The motto is believed to have been chosen by Josiah Meigs, president of the University of Georgia , 801 -1810.
14

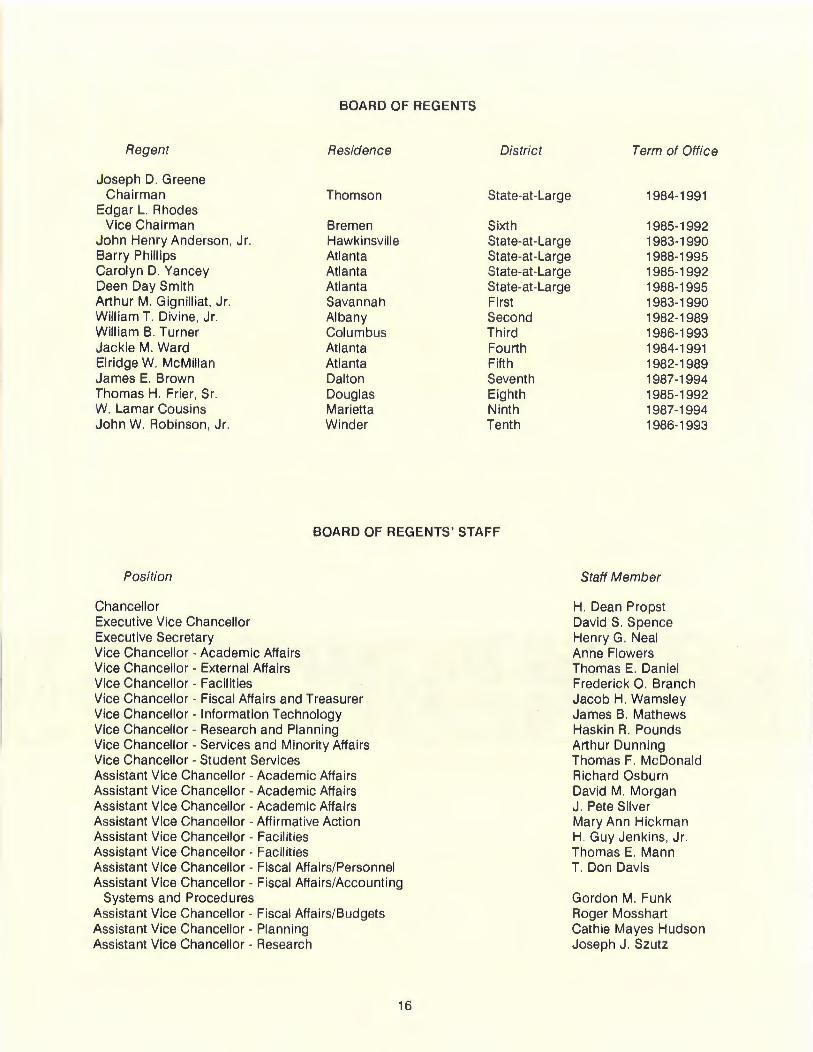
BOARD OF REGENTS
Regent Residence District
Joseph D. Greene Chairman Thomson State-at-Large
Edgar L. Rhodes Vice Cha irman Bremen Sixth
John Henry Anderson , Jr. Hawkinsville State-at-Large Barry Ph illips Atlanta State-at-Large Carolyn D. Yancey Atlanta State-at-Large Deen Day Smith Atlanta State-at-Large Arthur M. Gign illiat, Jr. Savannah First Will iam T. Divine, Jr. Albany Second William B. Turner Columbus Third Jackie M. Ward Atlanta Fourth Elridge W. McM illan Atlanta Fifth James E. Brown Dalton Seventh Thomas H. Frier, Sr. Douglas Eighth W. Lamar Cous ins Marietta Ninth John W. Robinson, Jr. Winder Tenth
BOARD OF REGENTS' STAFF
Position
Chancellor Executive Vice Chancellor Executive Secretary Vice Chancellor - Academic Affairs Vice Chancellor - External Affairs Vice Chancellor- Facilities Vice Chancellor - Fiscal Affairs and Treasurer Vice Chancellor - Information Technology Vice Chancellor - Research and Planning Vice Chancellor- Services and Minority Affairs Vice Chancellor - Student Services Assistant Vice Chancellor - Academic Affairs Assistant Vice Chancellor- Academ ic Affairs Ass istant Vice Chancellor - Academic Affairs Assistant Vice Chancellor - Affirmative Action Assistant Vice Chancellor - Fac ilities Assistant Vice Chancel lor - Fac il ities Assistant Vice Chancellor- Fiscal Affa irs/Personnel Assistant Vice Chancellor- Fiscal Affa irs/Account ing
Systems and Procedures Assistant Vice Chancellor - Fiscal Affairs/Budgets Assistant Vice Chancel lor - Planning Assistant Vice Chancellor - Research
16
Term of Office
1984-1991
1985-1992 1983-1990 1988-1995 1985-1992 1988-1995 1983-1990 1982-1989 1986-1993 1984-1991 1982-1989 1987-1994 1985-1992 1987-1994 1986-1993
Staff Member
H. Dean Propst David S. Spence Henry G. Neal Anne Flowers Thomas E. Dan iel Frederick 0. Branch Jacob H. Wamsley James B. Mathews Haskin A. Pounds Arthur Dunning Thomas F. McDonald Richard Osburn David M. Morgan J. Pete Silver Mary Ann Hickman H. Guy Jenkins, Jr. Thomas E. Mann T. Don Davis
Gordon M. Funk Roger Mosshart Cathie Mayes Hudson Joseph J. Szutz
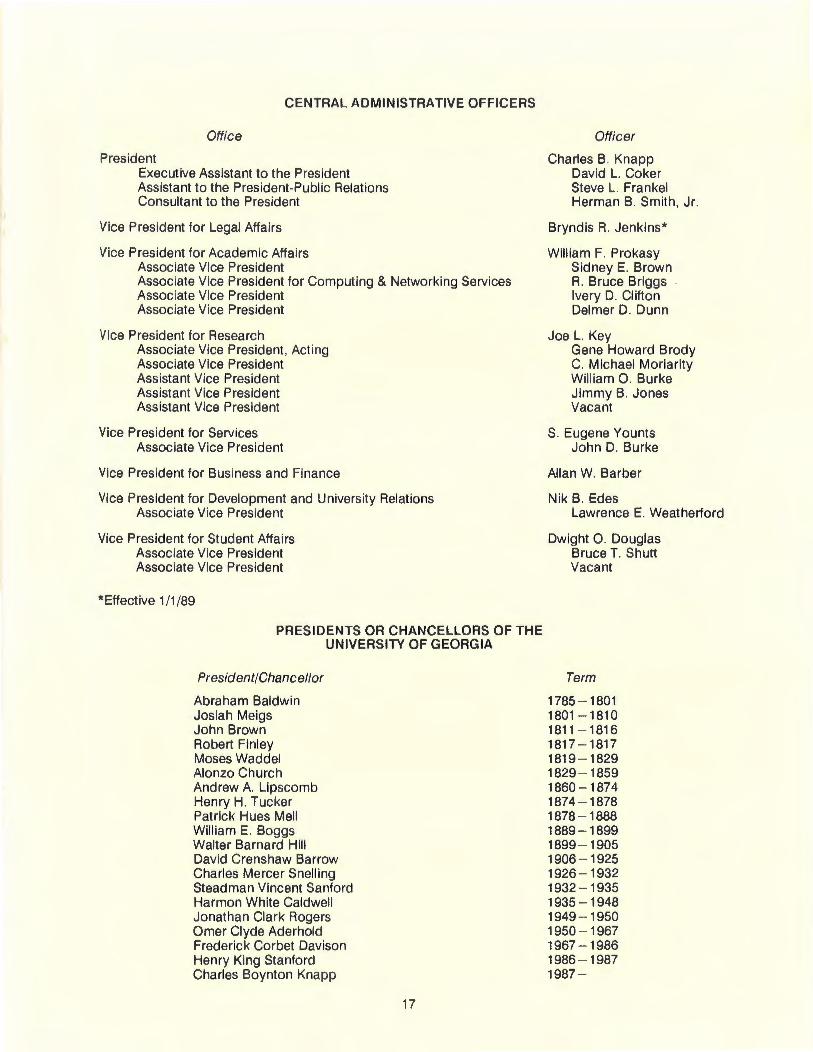
CENTRAL ADMINISTRATIVE OFFICERS
Office
President Executive Assistant to the President Assistant to the President-Public Relations Consultant to the President
Vice President for Legal Affairs
Vice President for Academic Affairs Associate Vice President Associate Vice President for Computing & Networking Services Associate Vice President Associate Vice President
Vice President for Research Associate Vice President, Acting Associate Vice President Assistant Vice President Assistant Vice President Assistant Vice President
Vice President for Services Associate Vice President
Vice President for Business and Finance
Vice President for Development and University Relations Associate Vice President
Vice President for Student Affairs Associate Vice President Associate Vice President
*Effective 1/1/89
PRESIDENTS OR CHANCELLORS OF THE UNIVERSITY OF GEORGIA
President/Chancellor
Abraham Baldwin Josiah Meigs John Brown Robert Finley Moses Waddel Alonzo Church Andrew A. Lipscomb Henry H. Tucker Patrick Hues Mell William E. Boggs Walter Barnard Hill David Crenshaw Barrow Charles Mercer Snelling Steadman Vincent Sanford Harmon White Caldwell Jonathan Clark Rogers Orner Clyde Aderhold Frederick Corbet Davison Henry King Stanford Charles Boynton Knapp
Officer
Charles B. Knapp David L. Coker Steve L. Frankel Herman B. Smith, Jr.
Bryndis R. Jenkins*
William F. Prokasy Sidney E. Brown A. Bruce Briggs Ivery D. Clifton Delmer D. Dunn
JoeL. Key Gene Howard Brody C. Michael Moriarity William 0 . Burke Jimmy B. Jones Vacant
S. Eugene Younts John D. Burke
Allan W. Barber
Nik B. Edes Lawrence E. Weatherford
Dwight 0 . Douglas Bruce T. Shutt Vacant
Term
1785 - 1801 1801 - 1810 1811 - 1816 1817 - 1817 1819 - 1829 1829 - 1859 1860 - 1874 1874 - 1878 1878 - 1888 1889 - 1899 1899 - 1905 1906 - 1925 1926 - 1932 1932 - 1935 1935 - 1948 1949 - 1950 1950 - 1967 1967 - 1986 1986 - 1987 1987 -
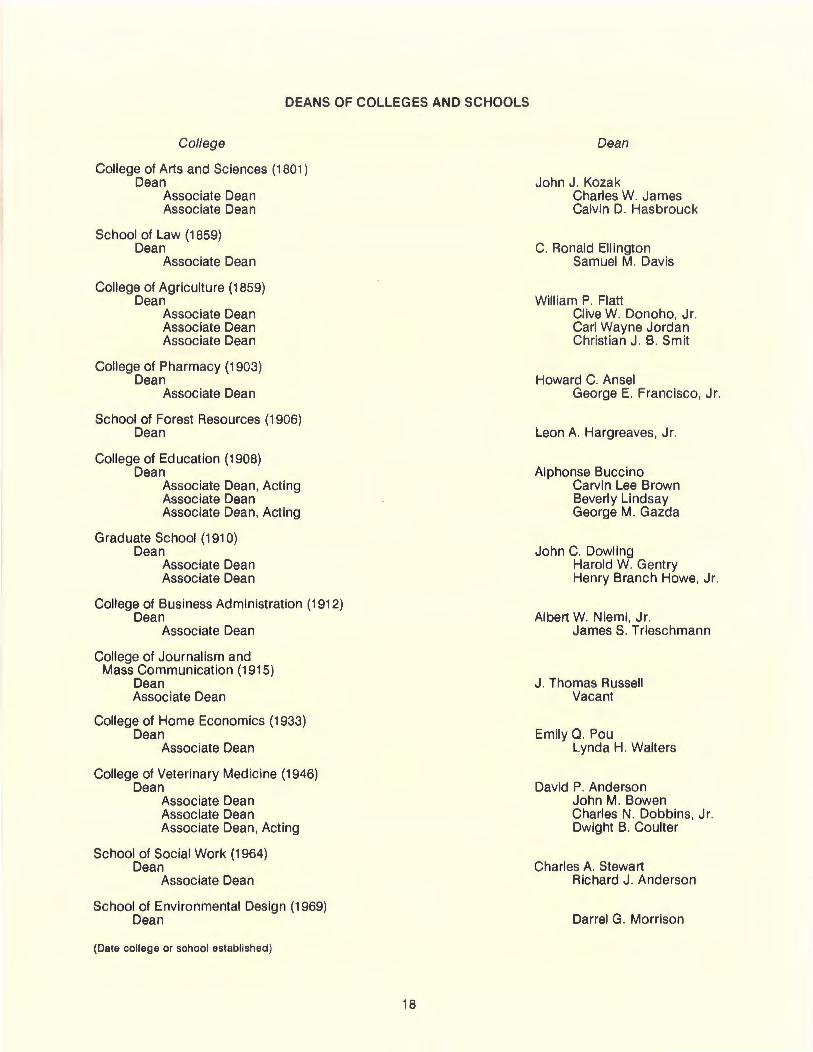
DEANS OF COLLEGES AND SCHOOLS
College
College of Arts and Sciences (1801) Dean
Associate Dean Associate Dean
School of Law (1859) Dean
Associate Dean
College of Agriculture (1859) Dean
Associate Dean Associate Dean Associate Dean
College of Pharmacy (1903) Dean
Associate Dean
School of Forest Resources (1906) Dean
College of Education (1908) Dean
Associate Dean, Acting Associate Dean Associate Dean, Acting
Graduate School (1910) Dean
Associate Dean Associate Dean
College of Business Administration (1912) Dean
Associate Dean
College of Journalism and Mass Communication (1915)
Dean Associate Dean
College of Home Economics (1933) Dean
Associate Dean
College of Veterinary Medicine (1946) Dean
Associate Dean Assoc iate Dean Associate Dean, Acting
School of Social Work (1964) Dean
Associate Dean
School of Environmental Design (1969) Dean
(Date college or school established)
18
Dean
John J. Kozak Charles W. James Calvin D. Hasbrouck
C. Ronald Ellington Samuel M. Davis
William P. Fiatt Clive W. Donoho, Jr. Carl Wayne Jordan Christian J. B. Smit
Howard C. Ansel George E. Francisco, Jr.
Leon A. Hargreaves, Jr.
Alphonse Buccino Carvin Lee Brown Beverly Lindsay George M. Gazda
John C. Dowling Harold W. Gentry Henry Branch Howe, Jr.
Albert W. Niemi, Jr. James S. Trieschmann
J. Thomas Russell Vacant
Emily Q. Pou Lynda H. Walters
David P. Anderson John M. Bowen Charles N. Dobbins, Jr. Dwight B. Coulter
Charles A. Stewart Richard J. Anderson
Darrel G. Morrison
DIRECTORS OF INSTITUTES AND SERVICE UNITS
Institute/Unit
Advanced Computational Methods Center Agricultural Experiment Stations Auxiliary Services Bureau of Educational Services Center for Advanced Ultrastructural Research Center for Applied Isotope Studies Center for Archaeological Sciences Center for Audit Research Center for Biological Resource Recovery Center for Computational Quantum Chemistry Center for East-West Trade Policy
Center for Economic Educat ion Center for Environmental Biotechnology Center for Family Research Center for Global Policy Studies Center for Insurance Education and Research Center for International Mass Communication Training and Research Center for Latin American Studies Center for Management Excellence Center for Marketing Studies Center for Plant Cellular and Molecular Biology Center for Private Enterprise Center for Remote Sensing and Mapping Science Center for Research on Deviance Center for Research on Nitrogen Fixation and
Metalloenzyme Catalysis Center for Simulational Physics Child and Adolescent Clinic Complex Carbohydrate Research Center
Cooperative Extension Service Developmental Disabilities Program (Georgia Retardation Center) Division of Research: College of Business Administration J. W. Fanning Community Leadership Development Center Financial and Student Information Systems Division Georgia Center for Continuing Educat ion Georgia Museum of Art Georgia Review Humanities Center Institute for Behavioral Research Institute for Business Institute for Natural Products Research Inst itute of Community and Area Development Institute of Continuing Judicial Education of Georgia
19
Director
Bruce Briggs Clive W. Donoho, Jr. Chester J. Malanoski, Jr. Carvin L. Brown Jerome J. Paulin John E. Noakes Norman Herz Johnny R. Johnson Lars G. Ljungdahl Henry F. Schaefer, Ill Gary K. Bertsch* Martin J. Hillenbrand* Elmer D. Williams Robert E. Hodson Rex Forehand Martin J. Hillenbrand Sandra G. Gustavson Albert L. Hester Carmen C. McClendon Richard C. Huseman Malcolm A. McNiven William E. Timberlake
Roy A. Welch Paul M. Roman
Leonard E. Mortenson David P. Landau Cheri Hoy Peter Albersheim* Alan Darvill* Carl Wayne Jordan
Albert W. Niemi, Jr. Walter A. Denero Thomas Archibald Edward G. Simpson, Jr. Jane K. Bledsoe Stanley W. Lindberg Bernard Dauenhauer Abraham Tesser James F. McGovern S. William Pelletier Joseph W. Whorton , Jr. Richard D. Reaves
CONT'D: DIRECTORS OF INSTITUTES AND SERVICE UNITS
Institute/Unit
Institute of Continuing Legal Education in Georgia I nstitute of Ecology Institute of Higher Education Institute of Natural Resources Learning Disabilities Adult Clinic Marine Sciences Program National Institute tor Instructional Materials Office of Campus Planning Office of Development and University Relations Office of Institutional Research and Planning Office of Instructional Development Office of International Development Poultry Disease Research Center Psychology Clinic Public Safety Division Dean Rusk Center tor International and Comparative Law Small Business Development Center Speech and Hearing Clinic State Botanical Garden of Georgia Survey Research Center University Computing and Networking Services University of Georgia Gerontology Center University of Georgia Libraries University of Georgia Museum of Natural History University of Georgia Press University of Georgia Research Foundation , Inc. Veterinary Medical Diagnostic Assistance Laboratory-Athens Veterinary Medical Diagnostic Assistance Laboratory-Tifton Veterinary Medical Experiment Station Carl Vinson Institute of Government
*Co-Directors **Acting Director
Director
Barney L. Brannen, Jr. H. Ronald Pulliam Cameron L. Fincher Ronald M. North K. Noel Gregg Edward Chin Richard M. Hylton David A. Lunde Nik B. Edes David G. Clements Ronald D. Simpson Darl E. Snyder Oscar J. Fletcher, Jr. Steven Beach Asa T. Boynton Thomas J. Schoenbaum William C. Flewellen Patricia A. McCarthy Roy A. Mecklenburg Dorothy W. Kingery R. Bruce Briggs Leonard Poon Bonnie J. Clemens** Joshua Laerm Malcolm Call William 0 . Burke Doris M. Miller Louis E. Newman Ill John M. Bowen Melvin B. Hill , Jr.
Descriptions of these institutes and service units can be found on pages 140-153.
20
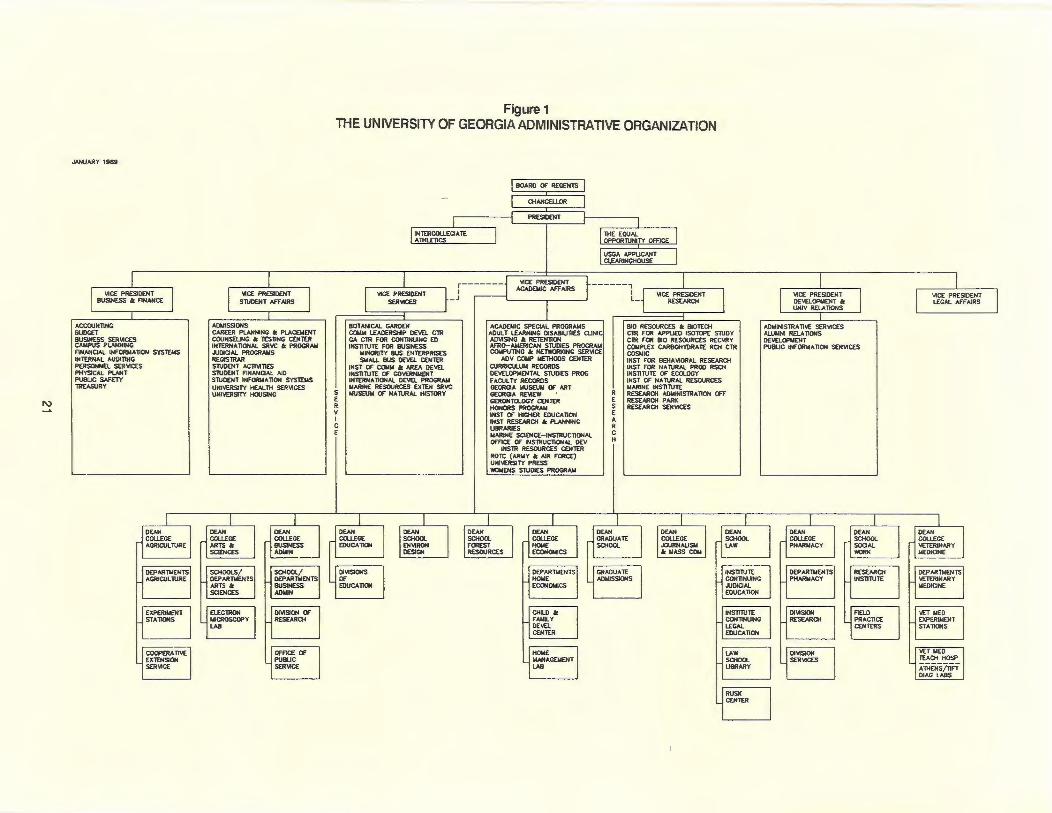
1\)
JANUARY 1989
ACCOUNT1NG BUDGET BUSINESS SER\ICES CAMPUS PLANNING ANANOAL INFORNA nON SYSIDIS INtERNAL AUDinNG PERSONNEL SER\ICES PHYSICAL PLANT PUBUC SAFETY lREASURY
ADWISSIONS CAREER PLANNING .. PLAC£NENT COUNSEUNG 1o TESnNG CENIDI INlERNAnONAL SRVC 1o PROGRAII JUDICIAL PROGRAMS REGISTRAR STUOENT ACnl.lnES STUDENT ANANOAL AID STUDENT INfORUA liON SYS'TEWS UNIVERSITY HEALTH SER..,C£5 UNI't£RSITY HOUSlNG
Figure 1 THE UNIVERSITY OF GEORGIA ADMINISTRATIVE ORGANIZATION
s E R v I c E
BOTANICAL GAROEN
INlERCOLLEGIA TE ATHL£l1CS
COWW lEADERSHIP 0~ ClR GA. CTR FOR CONTINUING EO INsnTUTE FOR BUSINESS
WINORITY BUS ENTERPRISES SMALL BUS OE\IEL OEHlER
JNST 0£ cc:.IW .. AREA DEYEL INSnTUTE OF GO'o£RN.WENT INTERNA110NAL OEVEL PROGRAW WARINE RESOURCES EXTEN SRVC .. USIEUW OF NATURAL HISTORY
ACA.l>OIIC SPECIAL PROGRAMS ADULT LEARNING DISABIUllES QJNI AD\ISING lo RETENnON AFRQ- AilE RICAN STUDIES PROGRAII COWPUnNG lo NET'OORKING SER\ICE
I>DV COWl' IIElHODS OEHlER CURRICULUN RECORDS OEVELOPNENTAL STUDIES PROG FACULTY RECORDS GEORGIA WUS£UW fE ART GEORGI_. RE\IEW ' GERONTOLOGY CENtER HONORS PROGRAII INST Of' HIGHER EDUCATION INST RESEARCH 6: P\..ANNING UBRARIES MARINE SOENCl:-INSlRUCllONAL OFACE OF INSTRUCnONAL OEV
INSTR RESOURCES CENTER ROTC (ARWY lo AIR FORCE) UNIVERSITY PRESS WOWENS STUDI£S PROGRAII
R E s E .. R c H
810 RESOURCES 1o BIOTECH CTR fOR APPUED ISOTOPE STUDY CTR FOR 810 RESOURCES RECVRY CONPLEX CARBOHYDRATE RCH CTR COSWIC INST FOR B&IA VIORAL RESEARCH INST FOR NA lURAL PROO RSOI INSnTUTE OF ECOLOGY INST Of NA lURAL RESOURCES WARINE INS111UTE RESEARCH I>D"INISTR_. nON 01T RESEARQ-1 PARI< RESEARCH SER\ICES
ADNINISTRA liVE SER..,CES AWNNI RELATIONS DEVELOPWENT PUBLIC INFORWATION SER'v1CES
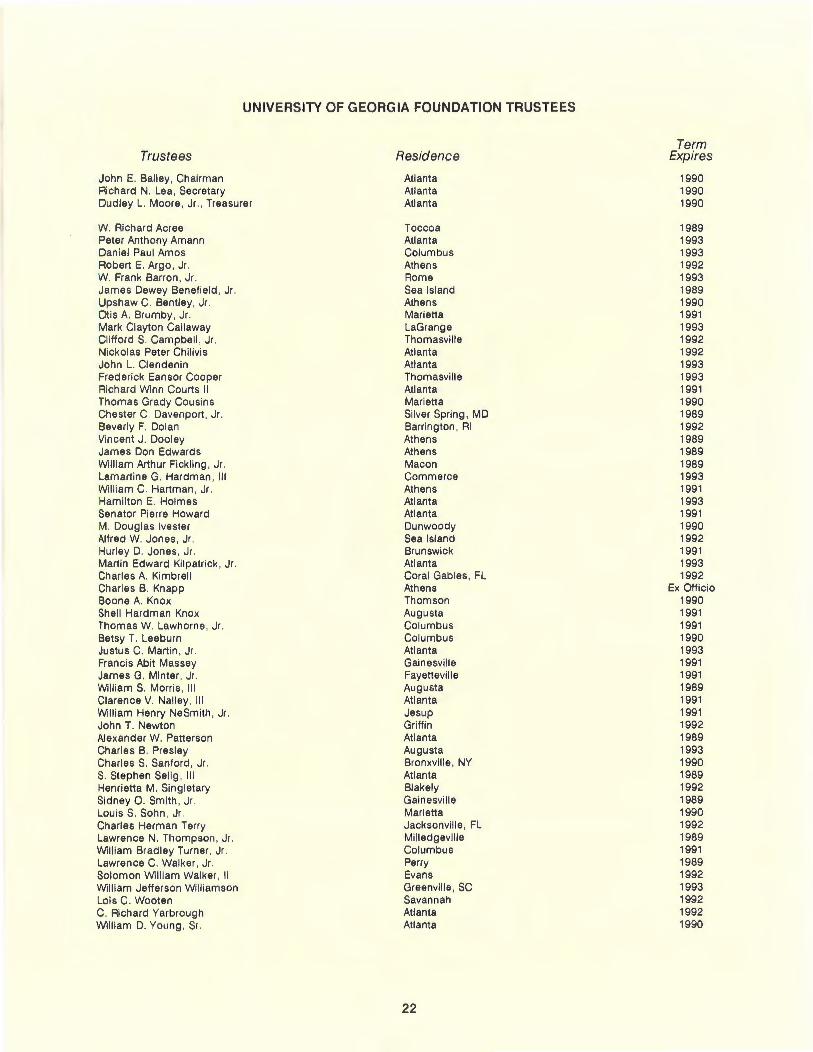
UNIVERSITY OF GEORGIA FOUNDATION TRUSTEES
Term Trustees Residence Expires
John E. Bailey, Chairman Atlanta 1990 Richard N. Lea , Secretary Atlanta 1990 Dudley L. Moore , Jr ., Treasurer Atlanta 1990
W. Richard Acree Toccoa 1989 Peter Anthony Amann Atlanta 1993 Daniel Paul Amos Columbus 1993 Robert E. Argo , Jr . Athens 1992 W. Frank Barron , Jr . Rome 1993 James Dewey Benefield , Jr . Sea Island 1989 Upshaw C. Bentley, Jr . Athens 1990 Otis A. Brumby, Jr . Marietta 1991 Mark Clayton Callaway LaGrange 1993 Clifford S. Campbell , Jr . Thomasville 1992 Nickolas Peter Chilivis Atlanta 1992 John L. Clendenin Atlanta 1993 Frederick Eansor Cooper Thomasville 1993 Richard Winn Courts II Atlanta 1991 Thomas Grady Cousins Marietta 1990 Chester C. Davenport , Jr . Silver Spring , MD 1989 Beverly F. Dolan Barrington, Rl 1992 Vincent J. Dooley Athens 1989 James Don Edwards Athens 1989 William Arthur Fickling , Jr . Macon 1989 Lamartine G. Hardman, Ill Commerce 1993 William C. Hartman, Jr . Athens 1991 Hamilton E. Holmes Atlanta 1993 Senator Pierre Howard Atlanta 1991 M. Douglas Ivester Dunwoody 1990 Alfred W. Jones , Jr . Sea Island 1992 Hurley D. Jones , Jr . Brunswick 1991 Martin Edward Kilpatrick , Jr . Atlanta 1993 Charles A. Kimbrell Coral Gables , FL 1992 Charles B. Knapp Athens Ex Officio Boone A. Knox Thomson 1990 Shell Hardman Knox Augusta 1991 Thomas W. Lawhorne , Jr . Columbus 1991 Betsy T. Leeburn Columbus 1990 Justus C. Martin , Jr . Atlanta 1993 Francis Abit Massey Gainesville 1991 James G. Minter , Jr . Fayetteville 1991 William S. Morris , Ill Augusta 1989 Clarence V. Nalley, Ill Atlanta 1991 William Henry NeSmith, Jr . Jesup 1991 John T. Newton Griffin 1992 Alexander W. Patterson Atlanta 1989 Charles B. Presley Augusta 1993 Charles S. Sanford , Jr . Bronxville , NY 1990 S. Stephen Selig , Ill Atlanta 1989 Henrietta M. Singletary Blakely 1992 Sidney 0 . Smith , Jr . Gainesville 1989 Louis S. Sohn , Jr . Marietta 1990 Charles Herman Terry Jacksonville, FL 1992 Lawrence N. Thompson , Jr . Milledgeville 1989 William Bradley Turner , Jr . Columbus 1991 Lawrence C. Walker , Jr . Perry 1989 Solomon William Walker , II Evans 1992 William Jefferson Williamson Greenville, SC 1993 Lois C. Wooten Savannah 1992 C. Richard Yarbrough Atlanta 1992 William D. Young , Sr . Atlanta 1990
22
UNIVERSITY OF GEORGIA RESEARCH FOUN DATION , INC. MEMBERS OF TH E BOARD OF DIRECTORS
Laurie K. Abbott Savannah, Georgia
Robert L. Anderson University of Georgia
Wyatt W. Anderson University of Georgia
Allan W. Barber University of Georgia
Gary K. Bertsch University of Georgia
Charles Harris Ocilla, Georgia
Lynne Billard Charles B. Knapp University of Georgia University of Georgia
Julius F. Bishop F. Abit Massey Athens, Georgia Gainesville, Georgia
E. Dunbar Harrison Roy L. Strange Athens, Georgia Moultrie, Georgia
Robert E. Hodson Sidney Topol University of Georgia Atlanta, Georgia
JoeL. Key University of Georgia
Emeritus
Honorable Carl E. Sanders Atlanta, Georgia
UNIVERSITY COUNCIL STANDING COMMITTEES
Committee
Admissions Committee
Committee on Intercollegiate Athletics
Committee on Facilities
Committee on Student Affairs
Curriculum Committee
Educational Affairs Committee
Executive Committee
Faculty Affairs Committee
Library and Instructional Aids Committee
Faculty Grievance Committee
23
Chairperson
Hugh 0 . Nourse
Joseph C. Hammock
William L. Ramsey, Jr.
Cynthia L. Frame
Ivery D. Clifton
Delmer D. Dunn
Paul M. Kurtz
Richard N. Westmacott
Susette M. Talarico
August W. Staub
UNIVERSITY SELF-STUDY STEERING COMMITTEE
Ted K. Miller, Chairman and Self-Study Director Sharon Price, Vice Chairman Robert L. Anderson William R. Bracewell Charles C. Clegg Betty Jean Craige Joseph Dominick C. Henry Edwards Mary M. Frasier Mary Beth Hartlage Thomas P. Holland
UNIVERSITY SELF-STUDY COMMITTEE CHAIRPERSONS
Committee
Institutional Purpose Institutional Effectiveness Educational Programs Research Programs Service Programs Faculty and Staff Educational Support Services Student Development Services Administrative Process Institutional Resources
24
Catherine Howett Arlene E. Luchsinger John F. Munnell W. Ray Phillips Ted Proffer L. L. Scruggs Klaus Steinbeck James S. Trieschmann Clyde W. Whitworth Larry G. Jones, Ex Officio Carol Nobles, Ex Officio
Chairperson
Cameron L. Fincher Bernard Dauenhauer F. Wen Williams Carolyn D. Berdanier E. Dale Threadgill Ronald D. Simpson A. Katherine Prestwood Gary A. Couvillon John G. Hollingsworth James Cantrell
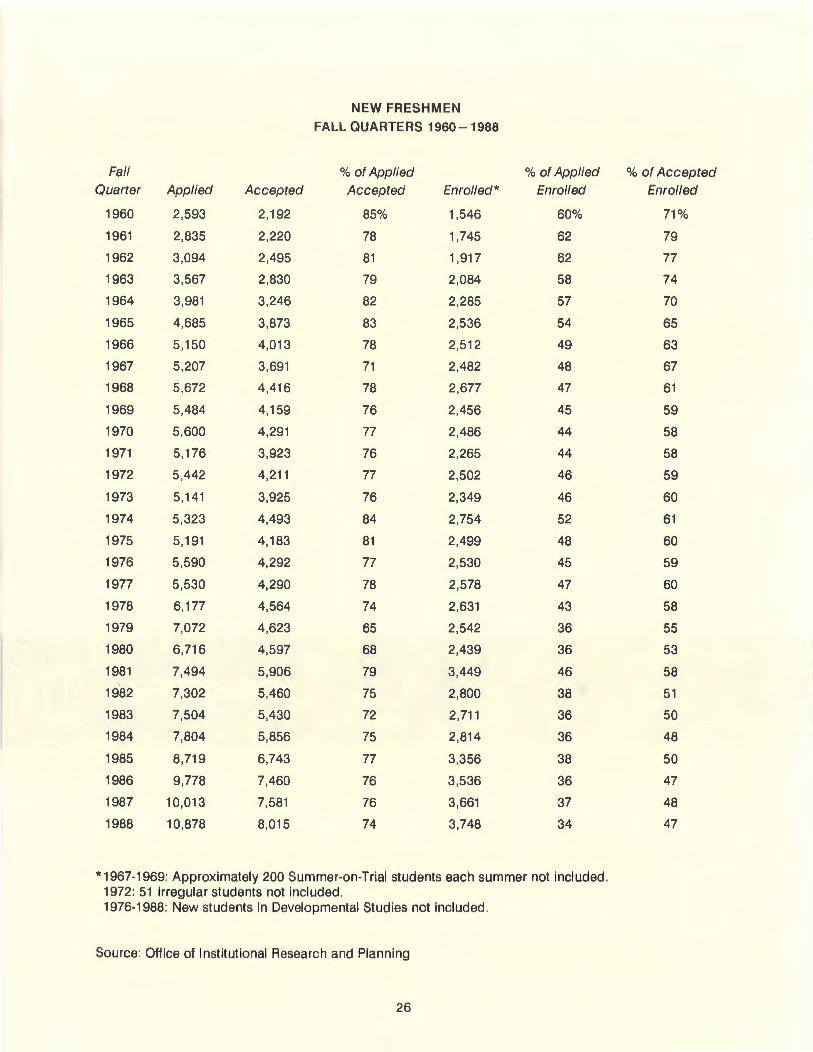
NEW FRESHMEN
FALL QUARTERS 1960 - 1988
Fall %of Applied %of Applied % of Accepted Quarter Applied Accepted Accepted Enrolled* Enrolled Enrolled
1960 2,593 2,192 85% 1,546 60% 71%
1961 2,835 2,220 78 1,745 62 79
1962 3,094 2,495 81 1,917 62 77
1963 3,567 2,830 79 2,084 58 74
1964 3,981 3,246 82 2,285 57 70
1965 4,685 3,873 83 2,536 54 65
1966 5,150 4,013 78 2,512 49 63
1967 5,207 3,691 71 2,482 48 67
1968 5,672 4,416 78 2,677 47 61
1969 5,484 4,159 76 2,456 45 59
1970 5,600 4,291 77 2,486 44 58
1971 5,176 3,923 76 2,265 44 58
1972 5,442 4,211 77 2,502 46 59
1973 5,141 3,925 76 2,349 46 60
1974 5,323 4,493 84 2,754 52 61
1975 5,191 4,183 81 2,499 48 60
1976 5,590 4,292 77 2,530 45 59
1977 5,530 4,290 78 2,578 47 60
1978 6,177 4,564 74 2,631 43 58
1979 7,072 4,623 65 2,542 36 55
1980 6,716 4,597 68 2,439 36 53
1981 7,494 5,906 79 3,449 46 58
1982 7,302 5,460 75 2,800 38 51
1983 7,504 5,430 72 2,711 36 50
1984 7,804 5,856 75 2,814 36 48
1985 8,719 6,743 77 3,356 38 50
1986 9,778 7,460 76 3,536 36 47
1987 10,013 7,581 76 3,661 37 48
1988 10,878 8,015 74 3,748 34 47
*1967-1969: Approximately 200 Summer-on-Trial students each summer not included. 1972: 51 irregular students not included . 1976-1988: New students in Developmental Studies not included .
Source: Office of Institutional Research and Planning
26
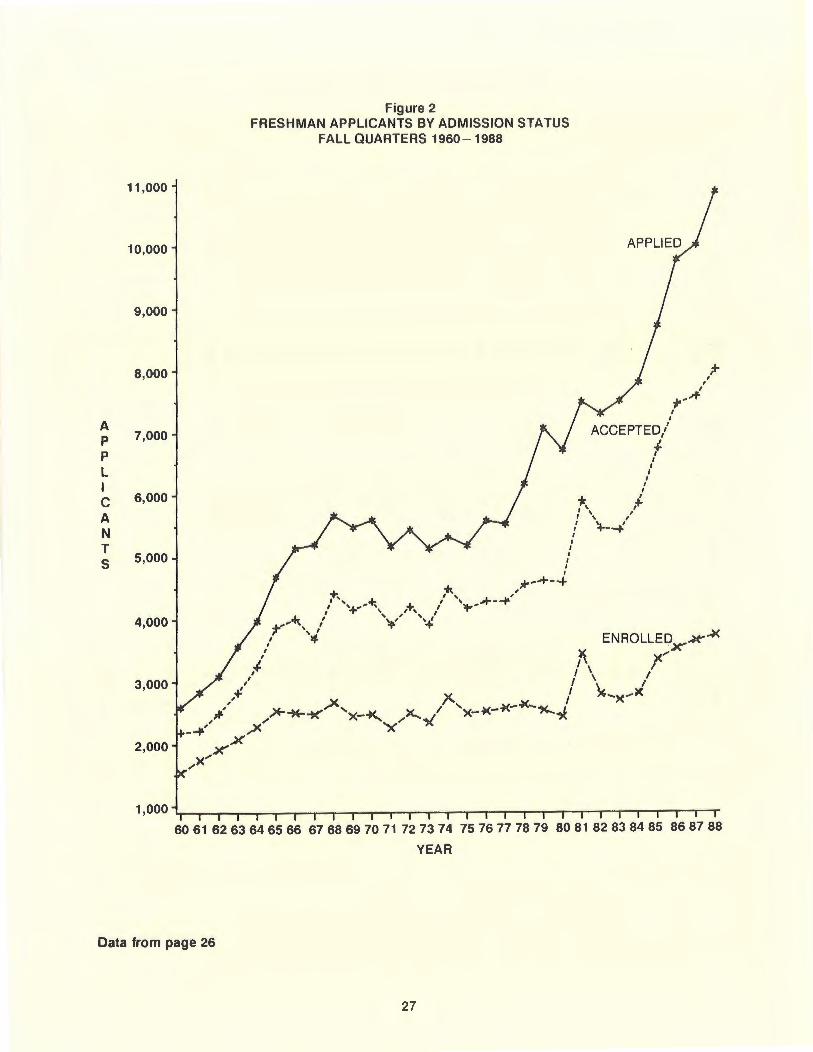
A p p L I c A N T s
11,000
10,000
9,000
8,000
7,000
6,000
5,000
4,000
3,000
2,000
Figure 2 FRESHMAN APPLICANTS BY ADMISSION STATUS
FALL QUARTERS 1960-1988
1 I ,
.;-A-I
I
ACCEPTED/
f I
I I
I I
I
t, ,+ I \ I I \ I
: l---+' I I I
;+-
60 61 62 63 64 65 66 67 68 69 70 71 72 73 74 75 76 77 78 79 80 81 82 83 84 85 86 87 88
YEAR
Data from page 26
27
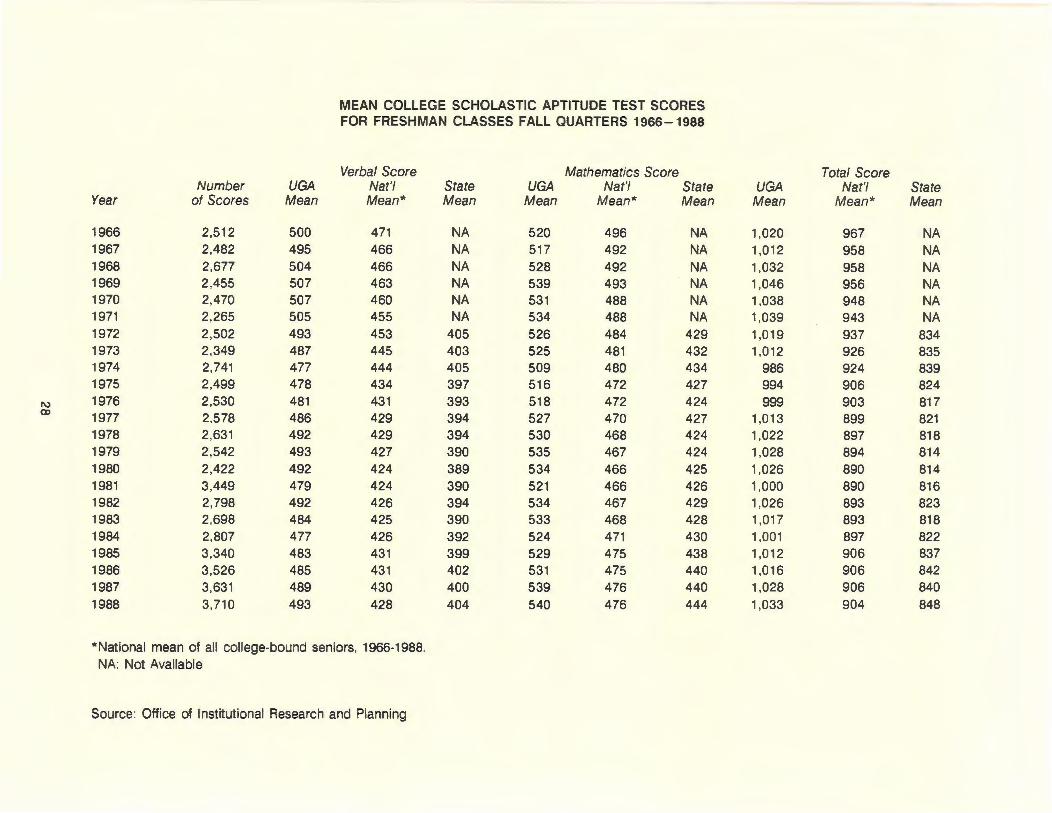
MEAN COLLEGE SCHOLASTIC APTITUDE TEST SCORES FOR FRESHMAN CLASSES FALL QUARTERS 1966-1988
Verbal Score Mathematics Score Total Score Number UGA Nat'! State UGA Nat' I State UGA Nat'! State
Year of Scores Mean Mean* Mean Mean Mean* Mean Mean Mean* Mean
1966 2,512 500 471 NA 520 496 NA 1,020 967 NA 1967 2,482 495 466 NA 517 492 NA 1,012 958 NA 1968 2,677 504 466 NA 528 492 NA 1,032 958 NA 1969 2,455 507 463 NA 539 493 NA 1,046 956 NA 1970 2,470 507 460 NA 531 488 NA 1,038 948 NA 1971 2,265 505 455 NA 534 488 NA 1,039 943 NA 1972 2,502 493 453 405 526 484 429 1,019 937 834 1973 2,349 487 445 403 525 481 432 1,012 926 835 1974 2,741 477 444 405 509 480 434 986 924 839 1975 2,499 478 434 397 516 472 427 994 906 824
1\) 1976 2,530 481 431 393 518 472 424 999 903 817 (X)
1977 2.578 486 429 394 527 470 427 1,013 899 821 1978 2,631 492 429 394 530 468 424 1,022 897 818 1979 2,542 493 427 390 535 467 424 1,028 894 814 1980 2,422 492 424 389 534 466 425 1,026 890 814 1981 3,449 479 424 390 521 466 426 1,000 890 816 1982 2,798 492 426 394 534 467 429 1,026 893 823 1983 2,698 484 425 390 533 468 428 1,017 893 818 1984 2,807 477 426 392 524 471 430 1,001 897 822 1985 3,340 483 431 399 529 475 438 1,012 906 837 1986 3,526 485 431 402 531 475 440 1,016 906 842 1987 3,631 489 430 400 539 476 440 1,028 906 840 1988 3,710 493 428 404 540 476 444 1,033 904 848
*National mean of all college-bound seniors, 1966-1988. NA: Not Available
Source: Office of Institutional Research and Planning
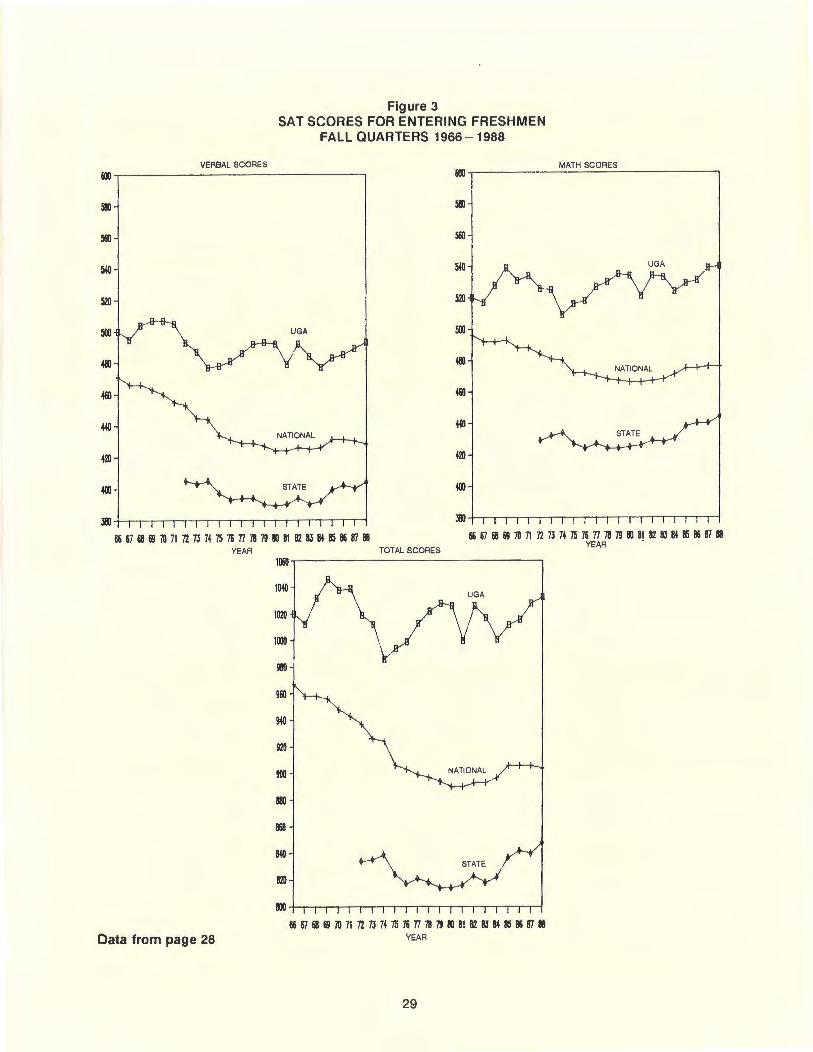
VERBAL SCORE S
Figure 3 SAT SCORES FOR ENTERING FRESHM EN
FALL QUARTERS 1966 - 1988
tm ~------------------------------~ IDJ
520
Data from page 28
5lll
560
540
520
UGA 500
4Ml
460
440
420
400
YEAR TOTAL SCORE S
1~ .------------------------------,
1040
1020
1000
980
960
940
920
900
880
86ll
840
820
UGA
/\
~~~~mnnDHD~n~~~~82MM~~~~ YEAR
29
MATH SCORES
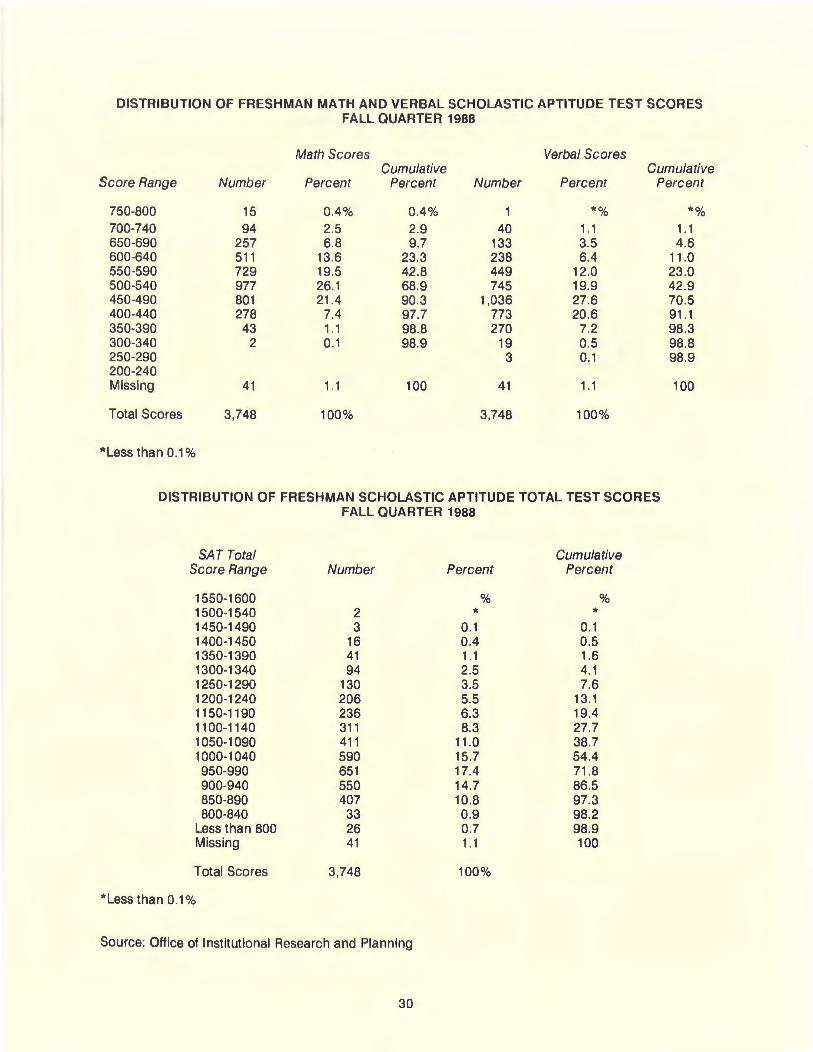
DISTRIBUTION OF FRESHMAN MATH AND VERBAL SCHOLASTIC APTITUDE TEST SCORES FALL QUARTER 1988
Math Scores Verba l Scores Cumulative Cumulative
Score Range Number Percent Percent Number Percent Percent
750-800 15 0.4% 0.4% 1 *% * % 700-740 94 2.5 2.9 40 1 .1 1 .1 650-690 257 6.8 9.7 133 3.5 4.6 600-640 511 13.6 23.3 238 6.4 11 .0 550-590 729 19.5 42.8 449 12.0 23.0 500-540 977 26.1 68.9 745 19.9 42.9 450-490 801 21.4 90 .3 1,036 27.6 70.5 400-440 278 7.4 97.7 773 20.6 91 .1 350-390 43 1 .1 98.8 270 7.2 98.3 300-340 2 0.1 98.9 19 0.5 98.8 250-290 3 0.1 98.9 200-240 Missing 41 1 .1 100 41 1 .1 100
Total Scores 3,748 100% 3,748 100%
* Less than 0.1%
DISTRIBUTION OF FRESHMAN SCHOLASTIC APTITUDE TOTAL TEST SCORES FALL QUARTER 1988
SAT Total Cumulative Score Range Number Percent Percent
1550-1600 % % 1500-1540 2 * * 1450-1490 3 0.1 0.1 1400-1450 16 0.4 0.5 1350-1390 41 1 .1 1.6 1300-1340 94 2.5 4.1 1250-1290 130 3.5 7.6 1200-1240 206 5.5 13.1 1150-1190 236 6.3 19.4 1100-1140 311 8.3 27.7 1050-1090 411 11 .0 38.7 1000-1040 590 15.7 54.4 950-990 651 17.4 71 .8 900-940 550 14.7 86.5 850-890 407 10.8 97.3 800-840 33 0.9 98.2
Less than 800 26 0.7 98.9 Missing 41 1 .1 100
Total Scores 3,748 100%
*Less than 0.1%
Source: Office of Institutional Research and Planning
30
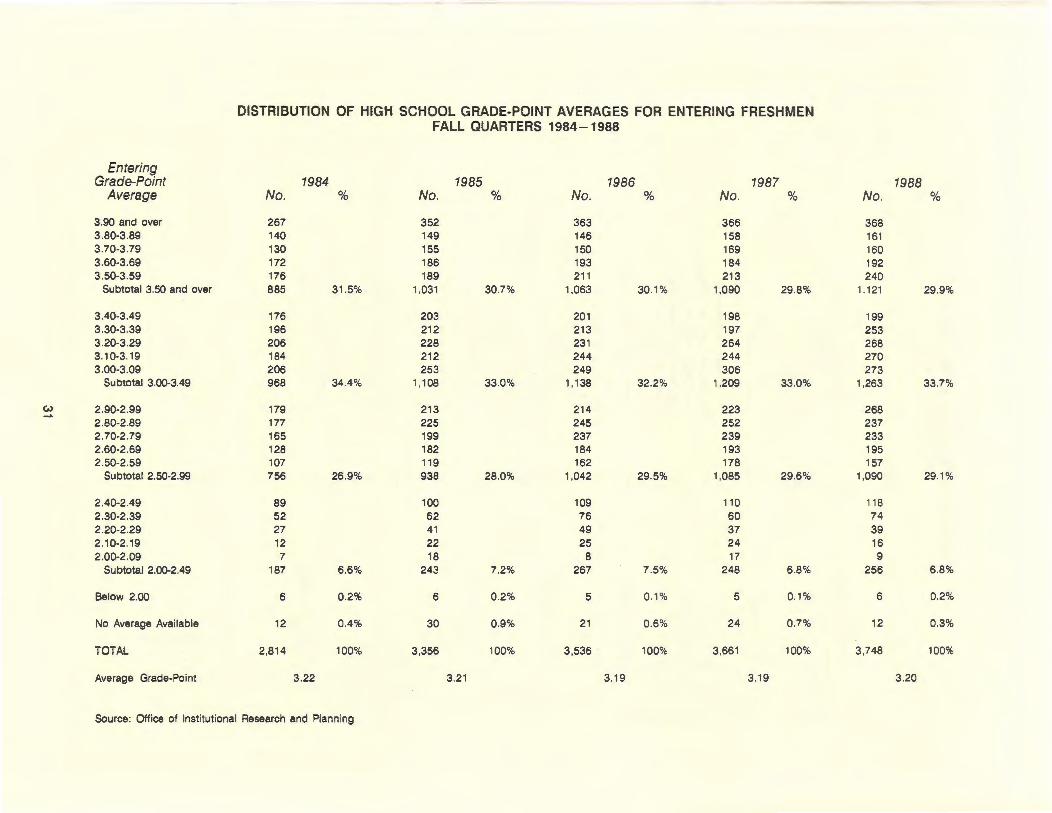
DISTRIBUTION OF HIGH SCHOOL GRADE-POINT AVERAGES FOR ENTERING FRESHMEN FALL QUARTERS 1984-1988
Entering Grade-Point 1984 1985 1986 1987 1988
Average No. % No. % No. % No. % No. %
3.90 and over 267 352 363 366 368 3.80-3.89 140 149 146 158 161 3.70-3.79 130 155 150 169 160 3.60-3.69 172 186 193 184 192 3.50-3.59 176 189 211 213 240
Subtotal 3.50 and over 885 31 .5% 1.031 30.7% 1,063 30.1% 1,090 29.8% 1.121 29.9%
3.40-3.49 176 203 201 198 199 3.30-3.39 196 212 213 197 253 3 .20-3.29 206 228 231 264 268 3.1 0-3 .1 9 184 212 244 244 270 3.00-3.09 206 253 249 306 273
Subtotal 3.00-3.49 968 34.4% 1 ' 108 33.0% 1 '1 38 32 .2% 1,209 33.0% 1,263 33.7%
(.,) 2.90-2.99 179 213 214 223 268 2.80-2.89 177 225 245 252 237 2.70-2.79 165 199 237 239 233 2.60-2.69 128 182 184 193 195 2.50-2.59 107 119 162 178 157
Subtotal 2.50-2.99 756 26.9% 938 28.0% 1,042 29 .5% 1,085 29.6% 1,090 29.1%
2.40-2.49 89 100 109 110 11 8 2.30-2.39 52 62 76 60 74 2.20-2.29 27 41 49 37 39 2.10-2.19 12 22 25 24 16 2.00-2.09 7 18 8 17 9
Subtotal 2.00-2.49 187 6.6% 243 7.2% 267 7.5% 248 6.8% 256 6.8%
Below 2.00 6 0.2% 6 0.2% 5 0.1% 5 0.1% 6 0.2%
No Average Available 12 0.4% 30 0.9% 21 0.6% 24 0.7% 12 0.3%
TOTAL 2,814 100% 3,356 100% 3,536 100% 3,661 100% 3,748 100%
Average Grade-Point 3.22 3.21 3.1 9 3.1 9 3.20
Source: Office of Institutional Research and Planning
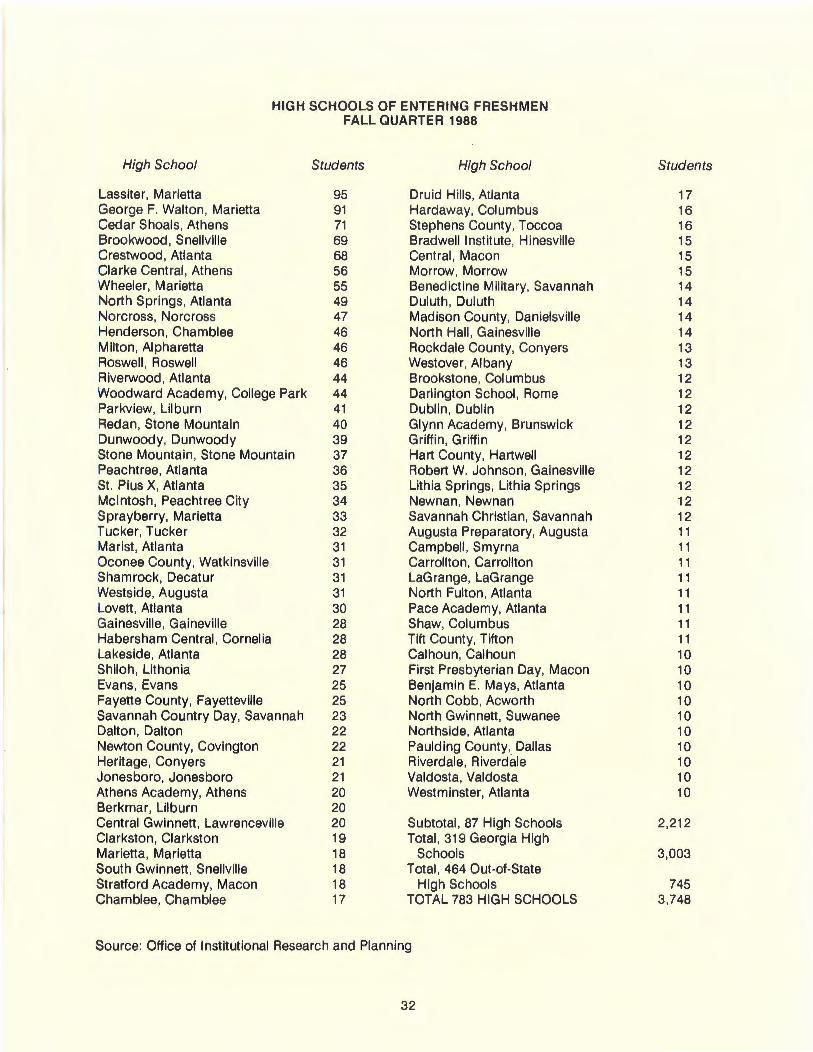
HIGH SCHOOLS OF ENTERING FRESHMEN FALL QUARTER 1988
High School Students High School Students
Lassiter, Marietta 95 Druid Hills, Atlanta 17 George F. Walton, Marietta 91 Hardaway, Columbus 16 Cedar Shoals, Athens 71 Stephens County, Toccoa 16 Brookwood, Snellville 69 Bradwell Institute, Hinesville 15 Crestwood, Atlanta 68 Central, Macon 15 Clarke Central, Athens 56 Morrow, Morrow 15 Wheeler, Marietta 55 Benedictine Military, Savannah 14 North Springs, Atlanta 49 Duluth, Duluth 14 Norcross, Norcross 47 Madison County, Danielsville 14 Henderson, Chamblee 46 North Hall, Gainesville 14 Milton, Alpharetta 46 Rockdale County, Conyers 13 Roswell, Roswell 46 Westover, Albany 13 Riverwood, Atlanta 44 Brookstone, Columbus 12 Woodward Academy, College Park 44 Darlington School, Rome 12 Parkview, Lilburn 41 Dublin, Dublin 12 Redan, Stone Mountain 40 Glynn Academy, Brunswick 12 Dunwoody, Dunwoody 39 Griffin, Griffin 12 Stone Mountain, Stone Mountain 37 Hart County, Hartwell 12 Peachtree, Atlanta 36 Robert W. Johnson, Gainesville 12 St . Pius X, Atlanta 35 Lithia Springs, Lithia Springs 12 Mcintosh, Peachtree City 34 Newnan, Newnan 12 Sprayberry, Marietta 33 Savannah Christian, Savannah 12 Tucker, Tucker 32 Augusta Preparatory, Augusta 11 Marist, Atlanta 31 Campbell, Smyrna 11 Oconee County, Watkinsville 31 Carrollton, Carrollton 11 Shamrock, Decatur 31 LaGrange, LaGrange 11 Westside, Augusta 31 North Fulton, Atlanta 11 Lovett, Atlanta 30 Pace Academy, Atlanta 11 Gainesville, Gaineville 28 Shaw, Columbus 11 Habersham Central, Cornelia 28 Tift County, Tifton 11 Lakeside, Atlanta 28 Calhoun, Calhoun 10 Shiloh, Lithonia 27 First Presbyterian Day, Macon 10 Evans, Evans 25 Benjamin E. Mays, Atlanta 10 Fayette County, Fayetteville 25 North Cobb, Acworth 10 Savannah Country Day, Savannah 23 North Gwinnett, Suwanee 10 Dalton, Dalton 22 Northside, Atlanta 10 Newton County, Covington 22 Paulding County, Dallas 10 Heritage, Conyers 21 Riverdale, Riverdale 10 Jonesboro, Jonesboro 21 Valdosta, Valdosta 10 Athens Academy, Athens 20 Westminster, Atlanta 10 Berkmar, Lilburn 20 Central Gwinnett, Lawrenceville 20 Subtotal, 87 High Schools 2,212 Clarkston, Clarkston 19 Total, 319 Georgia High Marietta, Marietta 18 Schools 3,003 South Gwinnett, Snellville 18 Total, 464 Out-of-State Stratford Academy, Macon 18 High Schools 745 Chamblee, Chamblee 17 TOTAL 783 HIGH SCHOOLS 3,748
Source: Office of Institutional Research and Planning
32
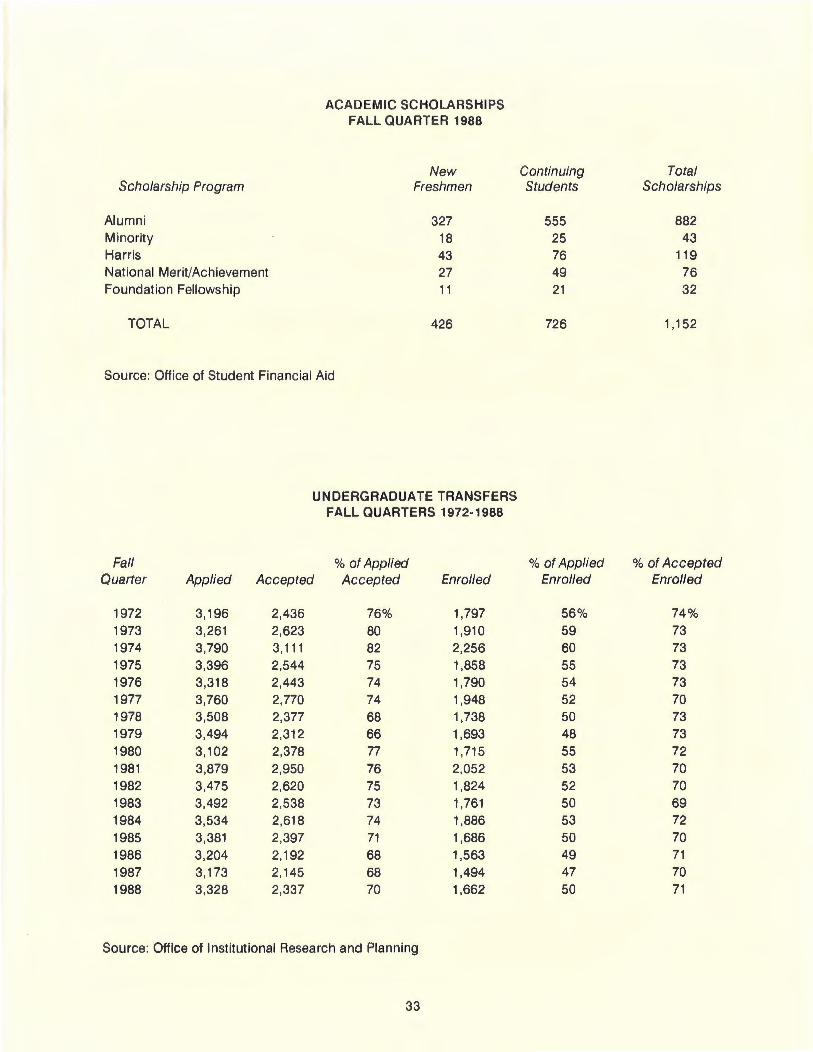
ACADEMIC SCHOLARSHIPS FALL QUARTER 1988
New Scholarship Program Freshmen
Alumni 327 Minority 18 Harris 43 National Merit/Achievement 27 Foundation Fellowship 11
TOTAL 426
Source: Office of Student Financial Aid
UNDERGRADUATE TRANSFERS FALL QUARTERS 1972-1988
Fall %of Applied Quarter Applied Accepted Accepted Enrolled
1972 3,196 2,436 76% 1,797 1973 3,261 2,623 80 1,910 1974 3,790 3,111 82 2,256 1975 3,396 2,544 75 1,858 1976 3,318 2,443 74 1,790 1977 3,760 2,770 74 1,948 1978 3,508 2,377 68 1,738 1979 3,494 2,312 66 1,693 1980 3,102 2,378 77 1 '715 1981 3,879 2,950 76 2,052 1982 3,475 2,620 75 1,824 1983 3,492 2,538 73 1,761 1984 3,534 2,618 74 1,886 1985 3,381 2,397 71 1,686 1986 3,204 2,192 68 1,563 1987 3,173 2,145 68 1,494 1988 3,328 2,337 70 1,662
Source: Office of Institutional Research and Planning
33
Continuing Students
555 25 76 49 21
726
%of Applied Enrolled
56% 59 60 55 54 52 50 48 55 53 52 50 53 50 49 47 50
Total Scholarships
882 43
119 76 32
1 '152
% of Accepted Enrolled
74% 73 73 73 73 70 73 73 72 70 70 69 72 70 71 70 71
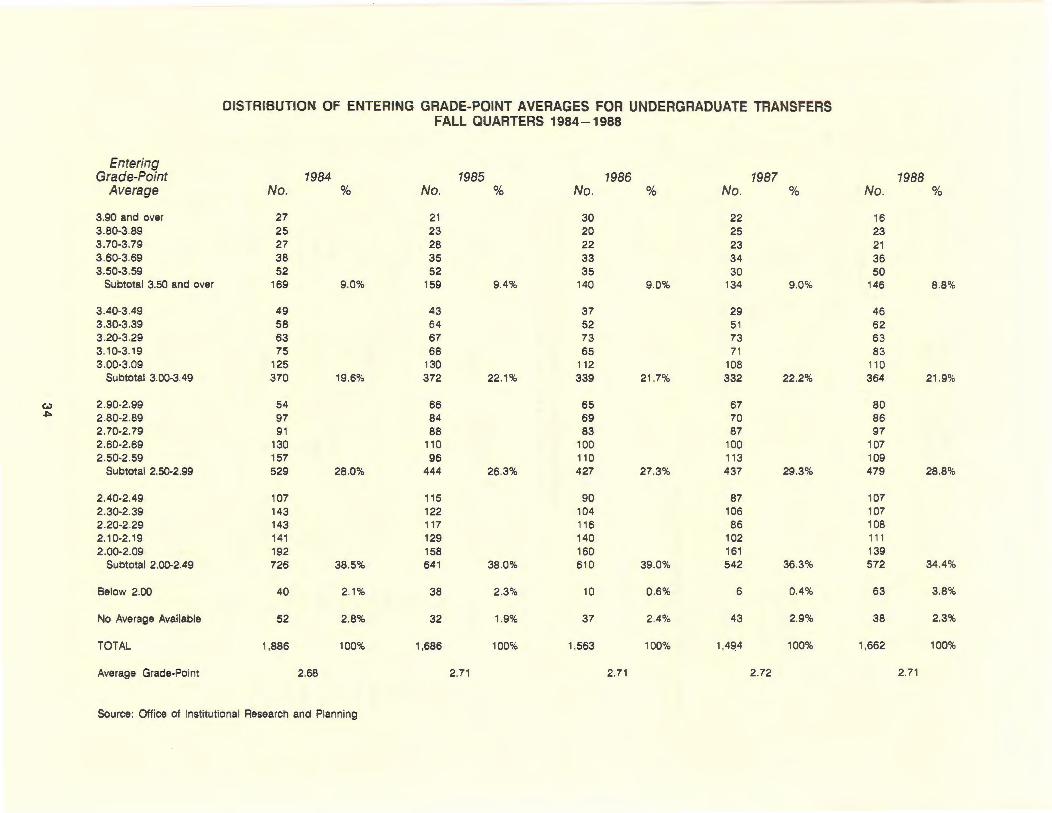
DISTRIBUTION OF ENTERING GRADE-POINT AVERAGES FOR UNDERGRADUATE TRANSFERS FALL QUARTERS 1984 - 1988
Entering Grade-Point 1984 1985 1986 1987 1988
Average No. % No. % No. % No. % No. %
3.90 and over 27 21 30 22 16 3.80-3.89 25 23 20 25 23 3.70-3.79 27 28 22 23 21 3.60-3.69 38 35 33 34 36 3.50-3.59 52 52 35 30 50
Subtotal 3.50 and over 169 9.0% 159 9.4% 140 9.0% 134 9.0% 146 8.8%
3.40-3.49 49 43 37 29 46 3.30-3.39 58 64 52 51 62 3.20-3.29 63 67 73 73 63 3.10-3.19 75 68 65 71 83 3.00-3.09 125 130 112 108 110
Subtotal 3.00-3.49 370 19.6% 372 22.1% 339 21 .7% 332 22.2% 364 21 .9%
(,) 2 .90-2.99 54 66 65 67 80 ~ 2 .80-2.89 97 84 69 70 86
2 .70-2.79 91 88 83 87 97 2.60-2.69 130 110 100 100 107 2.50-2.59 157 96 110 113 109
Subtotal 2.50-2.99 529 28.0% 444 26.3% 427 27.3% 437 29.3% 479 28.8%
2.40-2.49 107 115 90 87 107 2.30-2.39 143 122 104 106 107 2.20-2.29 143 117 116 86 108 2.10-2.19 141 129 140 102 111 2.00-2.09 192 158 160 161 139
Subtotal 2.00-2.49 726 38.5% 641 38 .0% 610 39.0% 542 36.3% 572 34.4%
Below 2.00 40 2.1% 38 2.3% 10 0.6% 6 0.4% 63 3.8%
No Average Available 52 2.8% 32 1.9% 37 2.4% 43 2.9% 38 2.3%
TOTAL 1,886 100% 1,686 100% 1,563 100% 1.494 100% 1,662 100%
Average Grade-Point 2.68 2.71 2.71 2.72 2.71
Source: Office of Institutional Research and Planning
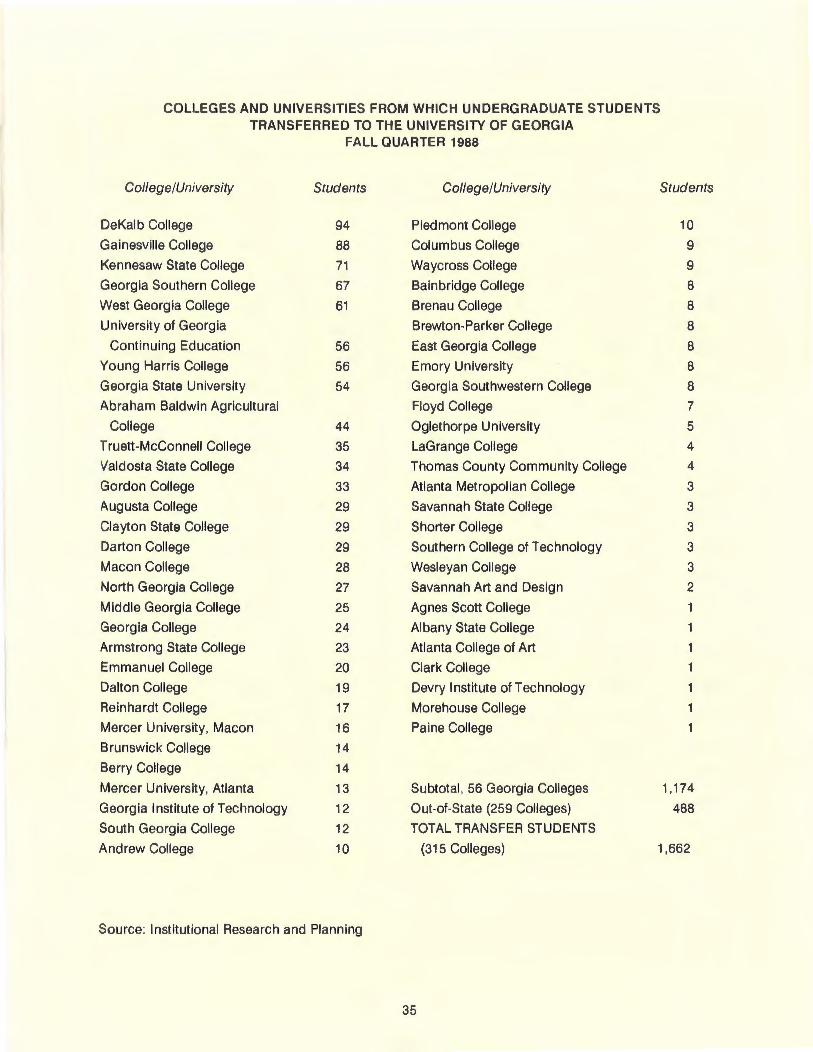
COLLEGES AND UNIVERSITIES FROM WHICH UNDERGRADUATE STUDENTS TRANSFERRED TO THE UNIVERSITY OF GEORGIA
FALL QUARTER 1988
Co/lege/University Students College/University Students
DeKalb College 94 Piedmont College 10
Gainesville College 88 Columbus College 9
Kennesaw State College 71 Waycross College 9
Georgia Southern College 67 Bainbridge College 8
West Georgia College 61 Brenau College 8
University of Georgia Brewton-Parker College 8
Continuing Education 56 East Georgia College 8
Young Harris College 56 Emory University 8
Georgia State University 54 Georgia Southwestern College 8
Abraham Baldwin Agricultural Floyd College 7
College 44 Oglethorpe University 5
Truett-McConnell College 35 LaGrange College 4
Valdosta State College 34 Thomas County Community College 4
Gordon College 33 Atlanta Metropolian College 3
Augusta College 29 Savannah State College 3
Clayton State College 29 Shorter College 3
Darton College 29 Southern College of Technology 3
Macon College 28 Wesleyan College 3
North Georgia College 27 Savannah Art and Design 2
Middle Georgia College 25 Agnes Scott College
Georgia College 24 Albany State College
Armstrong State College 23 Atlanta College of Art
Emmanuel College 20 Clark College
Dalton College 19 Devry Institute of Technology
Reinhardt College 17 Morehouse College
Mercer University, Macon 16 Paine College
Brunswick College 14
Berry College 14
Mercer University, Atlanta 13 Subtotal, 56 Georgia Colleges 1 '174
Georgia Institute of Technology 12 Out-of-State (259 Colleges) 488
South Georgia College 12 TOTALTRANSFERSTUDENTS
Andrew College 10 (315 Colleges) 1,662
Source: Institutional Research and Planning
35
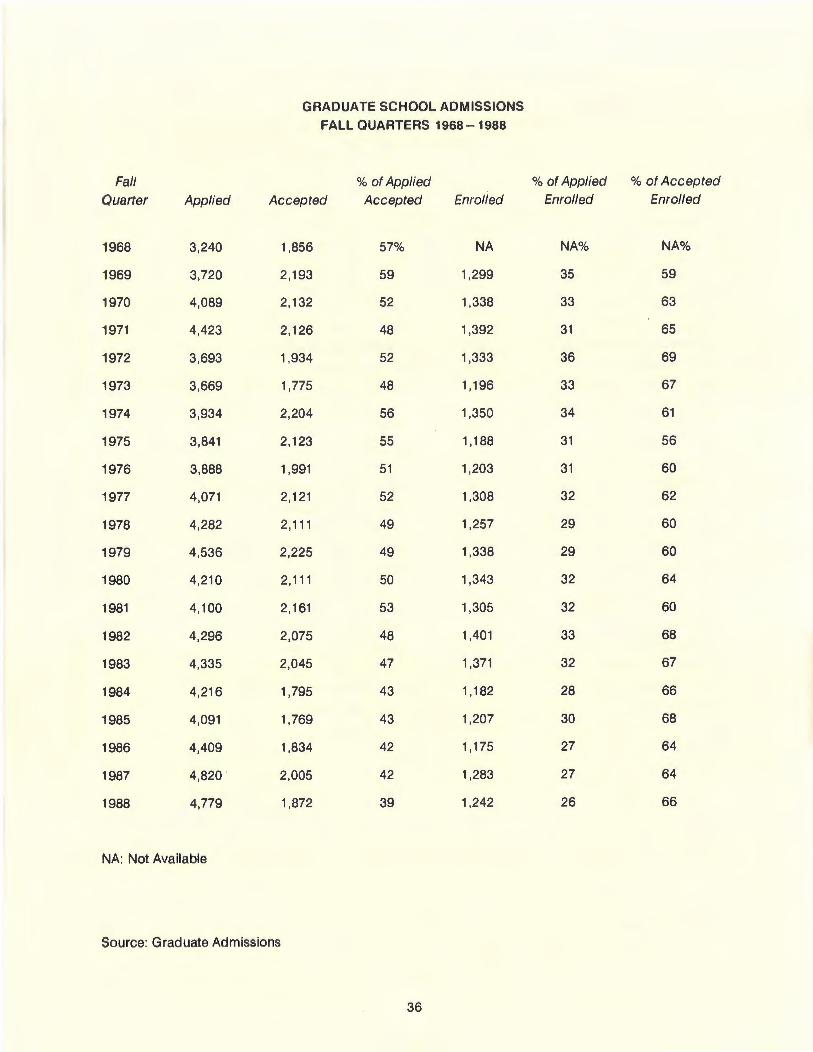
Fall Quarter Applied
1968 3,240
1969 3,720
1970 4,089
1971 4,423
1972 3,693
1973 3,669
1974 3,934
1975 3,841
1976 3,888
1977 4,071
1978 4,282
1979 4,536
1980 4,210
1981 4,100
1982 4,296
1983 4,335
1984 4,216
1985 4,091
1986 4,409
1987 4,820
1988 4,779
NA: Not Available
GRADUATE SCHOOL ADMISSIONS FALL QUARTERS 1968-1988
%of Applied Accepted Accepted Enrolled
1,856 57% NA
2,193 59 1,299
2,132 52 1,338
2,126 48 1,392
1,934 52 1,333
1,775 48 1,196
2,204 56 1,350
2,123 55 1 '188
1,991 51 1,203
2,121 52 1,308
2,111 49 1,257
2,225 49 1,338
2,111 50 1,343
2,161 53 1,305
2,075 48 1 ,401
2,045 47 1,371
1,795 43 1 '182
1,769 43 1,207
1,834 42 1 '175
2,005 42 1,283
1,872 39 1,242
Source: Graduate Admissions
36
%of Applied % of Accepted Enrolled Enrolled
NA% NA%
35 59
33 63
31 65
36 69
33 67
34 61
31 56
31 60
32 62
29 60
29 60
32 64
32 60
33 68
32 67
28 66
30 68
27 64
27 64
26 66
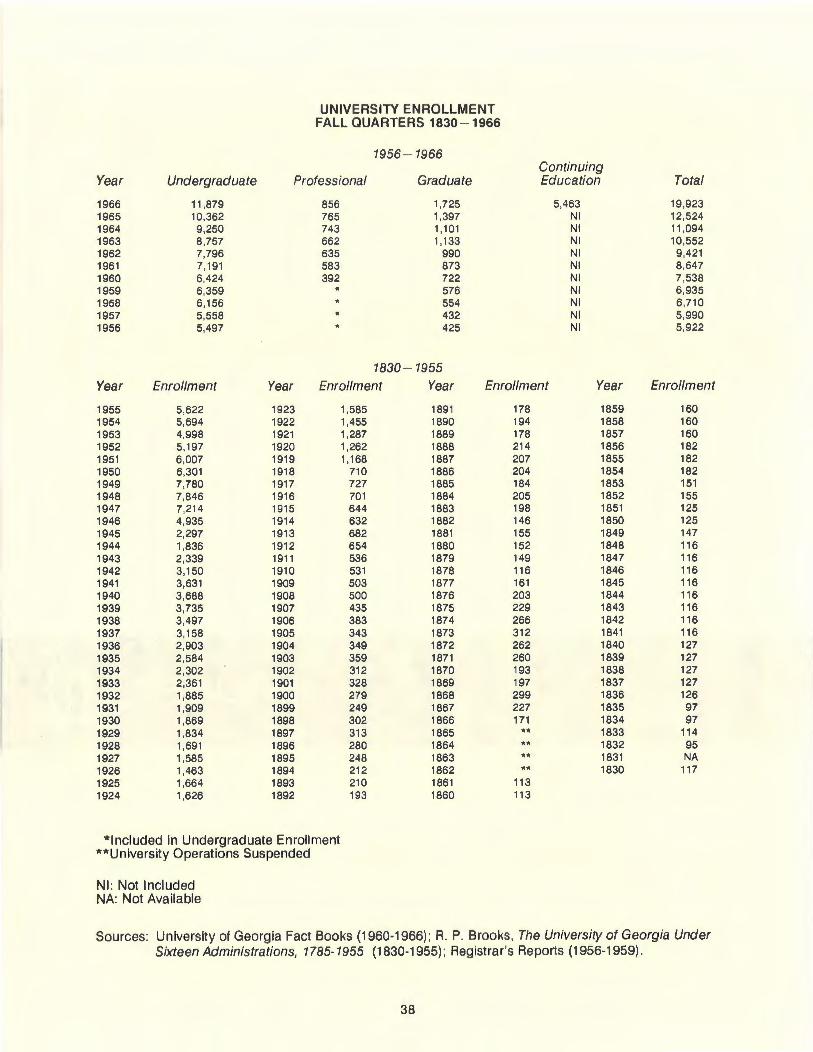
UNIVERSITY ENROLLMENT FALL QUARTERS 1830 - 1966
1956 - 1966 Continuing
Year Undergraduate Professional Graduate Education Total
1966 11,879 856 1,725 5,463 19,923 1965 10,362 765 1,397 Nl 12 ,524 1964 9,250 743 1,101 Nl 11,094 1963 8,757 662 1,133 Nl 10,552 1962 7,796 635 990 Nl 9,421 1961 7,191 583 873 Nl 8,647 1960 6,424 392 722 Nl 7,538 1959 6,359 * 576 Nl 6,935 1958 6,156 554 Nl 6,710 1957 5,558 432 Nl 5,990 1956 5,497 425 Nl 5,922
1830 - 1955 Year Enrollment Year Enrollment Year Enrollment Year Enrollment
1955 5,622 1923 1,585 1891 178 1859 160 1954 5,694 1922 1,455 1890 194 1858 160 1953 4,998 1921 1,287 1889 178 1857 160 1952 5,197 1920 1,262 1888 214 1856 182 1951 6,007 1919 1 '168 1887 207 1855 182 1950 6,301 1918 710 1886 204 1854 182 1949 7,780 1917 727 1885 184 1853 151 1948 7,846 1916 701 1884 205 1852 155 1947 7,214 1915 644 1883 198 1851 125 1946 4,935 1914 632 1882 146 1850 125 1945 2,297 1913 682 1881 155 1849 147 1944 1,836 1912 654 1880 152 1848 116 1943 2,339 1911 536 1879 149 1847 116 1942 3,150 1910 531 1878 116 1846 116 1941 3,631 1909 503 1877 161 1845 116 1940 3,688 1908 500 1876 203 1844 116 1939 3,735 1907 435 1875 229 1843 116 1938 3,497 1906 383 1874 266 1842 116 1937 3,158 1905 343 1873 312 1841 116 1936 2,903 1904 349 1872 262 1840 127 1935 2,584 1903 359 1871 260 1839 127 1934 2,302 1902 312 1870 193 1838 127 1933 2,361 1901 328 1869 197 1837 127 1932 1,885 1900 279 1868 299 1836 126 1931 1,909 1899 249 1867 227 1835 97 1930 1,869 1898 302 1866 171 1834 97 1929 1,834 1897 313 1865 ** 1833 114 1928 1,691 1896 280 1864 ** 1832 95 1927 1,585 1895 248 1863 ** 1831 NA 1926 1,463 1894 212 1862 1830 117 1925 1,664 1893 210 1861 113 1924 1,626 1892 193 1860 113
* Included in Undergraduate Enroll ment **University Operations Suspended
Nl: Not Included NA: Not Available
Sources: University of Georgia Fact Books (1960-1966); A. P. Brooks, The University of Georgia Under Sixteen Administrations, 1785-1955 (1830-1955); Registrar's Reports (1956-1959) .
38
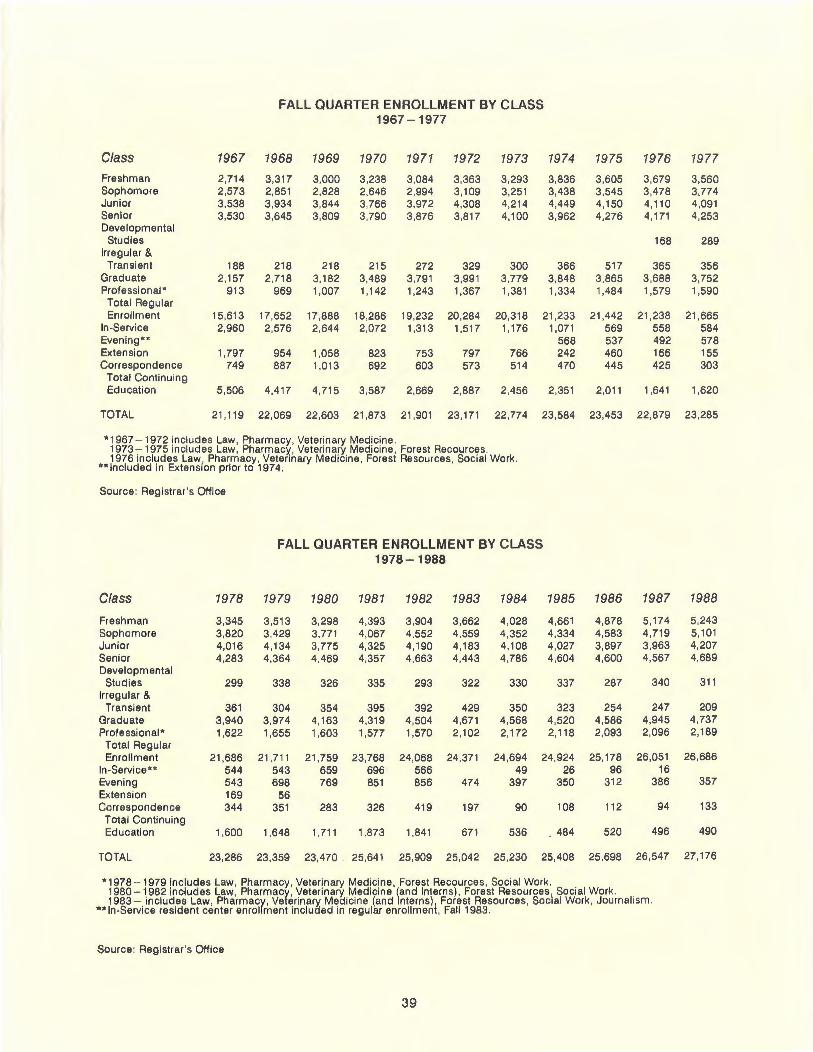
FALL QUARTER ENROLLMENT BY CLASS 1967- 1977
Class 1967 1968 1969 1970 1971 1972 1973 1974 1975 1976 1977
Freshman 2,714 3,317 3,000 3,238 3,084 3,363 3,293 3,836 3,605 3,679 3,560 Sophomore 2,573 2,851 2,828 2,646 2,994 3,109 3,251 3,438 3,545 3,478 3,774 Junior 3,538 3,934 3,844 3,766 3,972 4,308 4,214 4,449 4,150 4,110 4,091 Senior 3,530 3,645 3,809 3,790 3,876 3,817 4,100 3,962 4,276 4,171 4,253 Developmental Studies 168 289
Irregular & Transient 188 218 218 215 272 329 300 366 517 365 356
Graduate 2,157 2,718 3,182 3,489 3,791 3,991 3,779 3,848 3,865 3,688 3,752 Professional• 913 969 1,007 1,142 1,243 1,367 1,381 1,334 1,484 1,579 1,590
Total Regular Enrollment 15,613 17,652 17,888 18,286 19,232 20,284 20,318 21,233 21 ,442 21,238 21,665
In-Service 2,960 2,576 2,644 2,072 1,313 1,517 1,176 1,071 569 558 584 Evening*- 568 537 492 578 Extension 1,797 954 1,058 823 753 797 766 242 460 166 155 Correspondence 749 887 1,013 692 603 573 514 470 445 425 303
Total Continuing Education 5,506 4,417 4,715 3,587 2,669 2,887 2,456 2,351 2,011 1,641 1,620
TOTAL 21,119 22,069 22,603 21 ,873 21 ,901 23,171 22,774 23,584 23,453 22 ,879 23,285
* 1967 - 1972 includes Law, Pharmacy, Veterinary Medicine . 1973 - 1975 includes Law, Pharmacy, Veterinary Medicine , Forest Recources . 1976 includes Law, Pharmacy, Veterinary Medicine, Forest Resources, Social Work .
**Included in Extens1on prior to 1974.
Source: Registrar's Office
FALL QUARTER ENROLLMENT BY CLASS 1978-1988
Class 1978 1979 1980 1981 1982 1983 1984 1985 1986 1987 1988
Freshman 3 ,345 3,513 3,298 4,393 3,904 3,662 4,028 4,661 4,878 5,174 5,243 Sophomore 3,820 3,429 3,771 4,067 4,552 4,559 4,352 4,334 4,583 4,719 5,101 Junior 4,016 4,134 3,775 4,325 4,190 4,183 4,108 4,027 3,897 3,963 4,207 Senior 4,283 4,364 4,469 4,357 4,663 4,443 4,786 4,604 4,600 4,567 4,689 Developmental
Studies 299 338 326 335 293 322 330 337 287 340 311 Irregular &
Transient 361 304 354 395 392 429 350 323 254 247 209 Graduate 3,940 3,974 4,163 4,319 4,504 4,671 4,568 4,520 4,586 4,945 4,737 Professional* 1,622 1,655 1,603 1,577 1,570 2,102 2,172 2,118 2,093 2,096 2,189
Total Regular Enrollment 21,686 21,711 21 ,759 23,768 24,068 24,371 24,694 24 ,924 25,178 26,051 26,686
In-Service** 544 543 659 696 566 49 26 96 16 Evening 543 698 769 851 856 474 397 350 312 386 357 Extension 169 56 Correspondence 344 351 283 326 419 197 90 108 112 94 133
Total Continuing Education 1,600 1,648 1,711 1,873 1,841 671 536 - 484 520 496 490
TOTAL 23,286 23,359 23,470 25,641 25,909 25,042 25,230 25 ,408 25,698 26,547 27,176
* 1978 - 1979 includes Law, Pharmacy, Veterinary Medicine, Forest Recources , Social Work. 1980-1982 includes Law, Pharmac~, Veterin ary Medicine \and Interns), Forest Resources, Social Work. 1983- includes Law, Pharmacy,. Ve erin ary Medicine (and nterns), Forest Resources, Soc1al Work, Journ ali sm.
"'* In -Service resident center enrolment included in regular enrollment, Fall 1983.
Source : Registrar 's Office
39
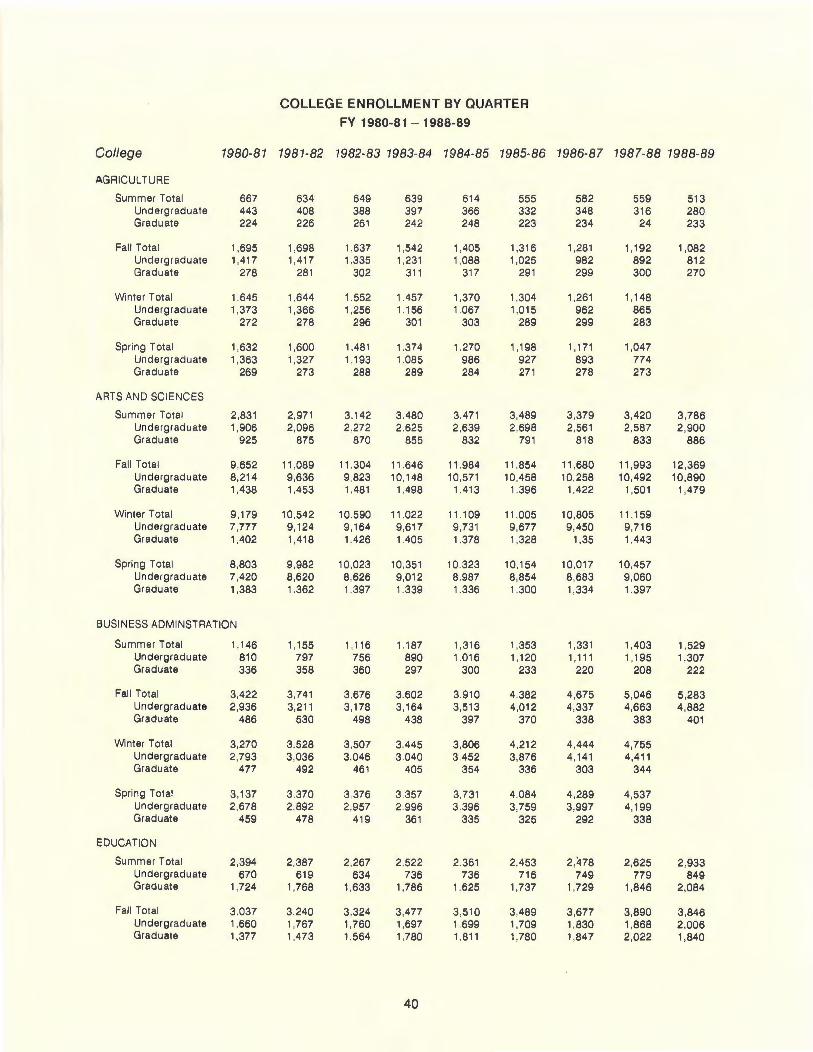
COLLEGE ENROLLMENT BY QUARTER
FY 1980-81 - 1988-89
College 1980-81 1981-82 1982-83 1983-84 1984-85 1985-86 1986-87 1987-88 1988-89
AGRICULTURE
Summer Total 667 634 649 639 6t4 555 582 559 513 Undergraduate 443 408 388 397 366 332 348 316 280 Graduate 224 226 261 242 248 223 234 24 233
Fall Total 1,695 1,698 1,637 1,542 1,405 1,316 1,281 1,192 1,082 Undergraduate 1.417 1,417 1.335 1,231 1,088 1,025 982 892 812 Graduate 278 281 302 311 317 291 299 300 270
Winter Total 1.645 1,644 1.552 1.457 1,370 1,304 1,261 1,148 Undergraduate 1,373 1,366 1,256 1.156 1.067 1,015 962 865 Graduate 272 278 296 301 303 289 299 283
Spring Total 1,632 1,600 1,481 1 374 1.270 1,198 1,171 1,047 Undergraduate 1,363 1,327 1.193 1.085 986 927 893 774 Graduate 269 273 288 289 284 271 278 273
ARTS AND SCIENCES
Summer Total 2,831 2,971 3.142 3.480 3.471 3,489 3,379 3,420 3 .786 Undergraduate 1,906 2,096 2.272 2.625 2,639 2,698 2,561 2,587 2,900 Graduate 925 875 870 855 832 791 818 833 886
Fall Total 9,652 11 ,089 11 .304 11 646 11 .984 11 ,854 11 ,680 11 ,993 12,369 Undergraduate 8,214 9,636 9,823 10,148 10,571 10,458 10,258 10,492 10,890 Graduate 1,438 1,453 1.481 1,498 1.413 1.396 1,422 1,501 1,479
Winter Total 9,179 10,542 10.590 11 .022 11 .109 11 .005 10,805 11 ,159 Undergraduate 7,777 9,124 9.164 9,617 9,731 9,677 9,450 9,716 Graduate 1,402 1,418 1,426 1.405 1,378 1,328 1,35 1,443
Spring Total 8,803 9,982 10,023 10.351 10.323 10,154 10,017 10,457 Undergraduate 7,420 8,620 8,626 9,01 2 8.987 8,854 8,683 9,060 Graduate 1,383 1,362 1,397 1.339 1.336 1.300 1,334 1.397
BUSINESS ADMINSTRATION
Summer Total 1,146 1,155 1 116 1 187 1.316 1,353 1,331 1,403 1,529 Undergraduate 810 797 756 890 1.016 1,120 1,111 1,195 1,307 Graduate 336 358 360 297 300 233 220 208 222
Fall Total 3,422 3,741 3,676 3,602 3.910 4,382 4,675 5,046 5,283 Undergraduate 2,936 3,211 3,178 3,164 3,513 4,012 4,337 4,663 4,882 Graduate 486 530 498 438 397 370 338 383 401
Winter Total 3,270 3,528 3,507 3.445 3,806 4,212 4,444 4,755 Undergraduate 2,793 3,036 3.046 3040 3.452 3,876 4.141 4,411 Graduate 477 492 461 405 354 336 303 344
Spring Total 3,137 3.370 3 376 3.357 3,731 4.084 4,289 4,537 Undergraduate 2,678 2,892 2,957 2 996 3,396 3,759 3,997 4,199 Graduate 459 478 419 361 335 325 292 338
EDUCATION
Summer Total 2,394 2,387 2,267 2,522 2 361 2,453 2,478 2,625 2,933 Undergraduate 670 619 634 736 736 716 749 779 849 Graduate 1,724 1,768 1,633 1.786 1,625 1,737 1,729 1,846 2,084
Fall Total 3.037 3,240 3,324 3,477 3.510 3,489 3,677 3,890 3,846 Undergraduate 1,660 1,767 1,760 1,697 1,699 1,709 1,830 1,868 2,006 Graduate 1,377 1,473 1,564 1,780 1,811 1,780 1,847 2,022 1,840
40
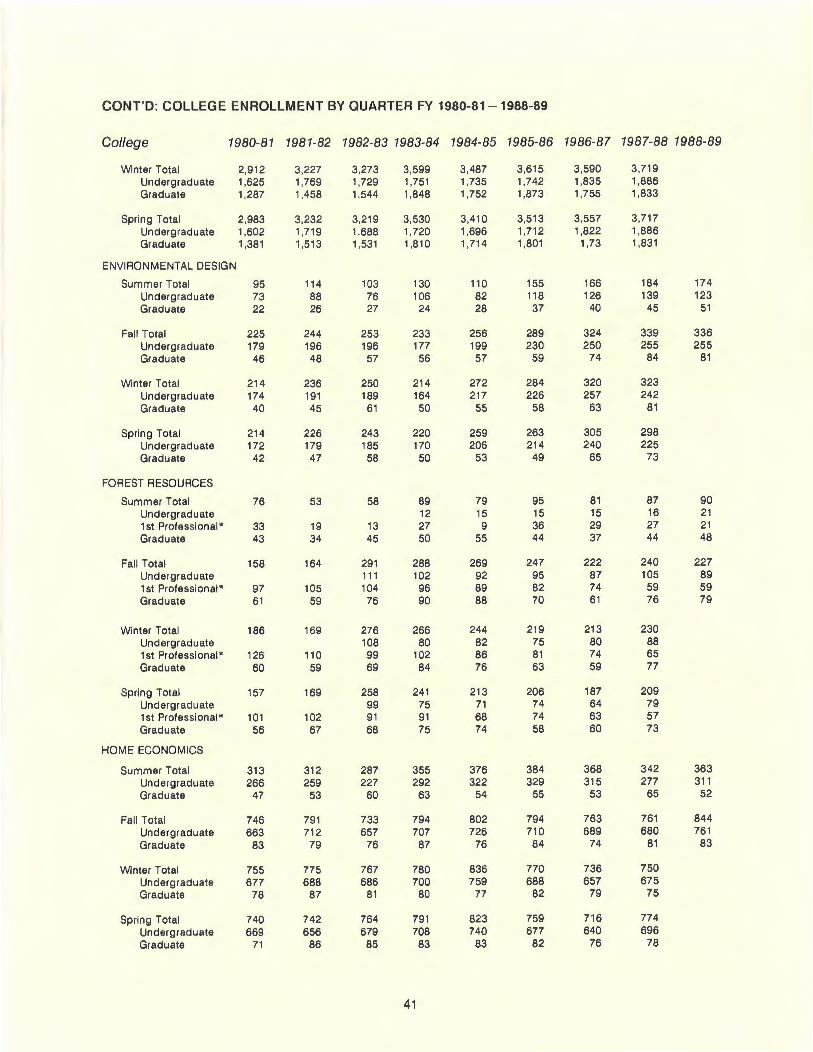
CONT'D: COLLEGE ENROLLMENT BY QUARTER FY 1980-81-1988-89
College 1980-81 1981-82 1982-83 1983-84 1984-85 1985-86 1986-87 1987-88 1988-89
Winter Total 2,912 3,227 3,273 3,599 3,487 3,615 3,590 3,719 Undergraduate 1,625 1,769 1,729 1,751 1,735 1,742 1,835 1,886 Graduate 1,287 1,458 1,544 1,848 1,752 1,873 1,755 1,833
Spring Total 2,983 3,232 3,219 3,530 3,410 3,513 3,557 3,717 Undergraduate 1,602 1,719 1,688 1,720 1,696 1,712 1,822 1,886 Graduate 1,381 1,513 1,531 1,810 1,714 1,801 1,73 1,831
ENVIRONMENTAL DESIGN
Summer Total 95 114 103 130 110 155 166 184 174 Undergraduate 73 88 76 106 82 118 126 139 123 Graduate 22 26 27 24 28 37 40 45 51
Fall Total 225 244 253 233 256 289 324 339 336 Undergraduate 179 196 196 177 199 230 250 255 255 Graduate 46 48 57 56 57 59 74 84 81
Winter Total 214 236 250 214 272 284 320 323 Undergraduate 174 191 189 164 217 226 257 242 Graduate 40 45 61 50 55 58 63 81
Spring Total 214 226 243 220 259 263 305 298 Undergraduate 172 179 185 170 206 214 240 225 Graduate 42 47 58 50 53 49 65 73
FOREST RESOURCES
Summer Total 76 53 58 89 79 95 81 87 90 Undergraduate 12 15 15 15 16 21 1st Professional * 33 19 13 27 9 36 29 27 21 Graduate 43 34 45 50 55 44 37 44 48
Fall Total 158 164 291 288 269 247 222 240 227 Undergraduate 111 102 92 95 87 105 89 1st Professional* 97 105 104 96 89 82 74 59 59 Graduate 61 59 76 90 88 70 61 76 79
Winter Total 186 169 276 266 244 219 213 230 Undergraduate 108 80 82 75 80 88 1st Professional* 126 110 99 102 86 81 74 65 Graduate 60 59 69 84 76 63 59 77
Spring Total 157 169 258 241 213 206 187 209 Undergraduate 99 75 71 74 64 79 1st Professional * 101 102 91 91 68 74 63 57 Graduate 56 67 68 75 74 58 60 73
HOME ECONOMICS
Summer Total 313 312 287 355 376 384 368 342 363 Undergraduate 266 259 227 292 322 329 315 277 311 Graduate 47 53 60 63 54 55 53 65 52
Fall Total 746 791 733 794 802 794 763 761 844 Undergraduate 663 712 657 707 726 710 689 680 761
Graduate 83 79 76 87 76 84 74 81 83
Winter Total 755 775 767 780 836 770 736 750 Undergraduate 677 688 686 700 759 688 657 675 Graduate 78 87 81 80 77 82 79 75
Spring Total 740 742 764 791 823 759 716 774 Undergraduate 669 656 679 708 740 677 640 696 Graduate 71 86 85 83 83 82 76 78
41
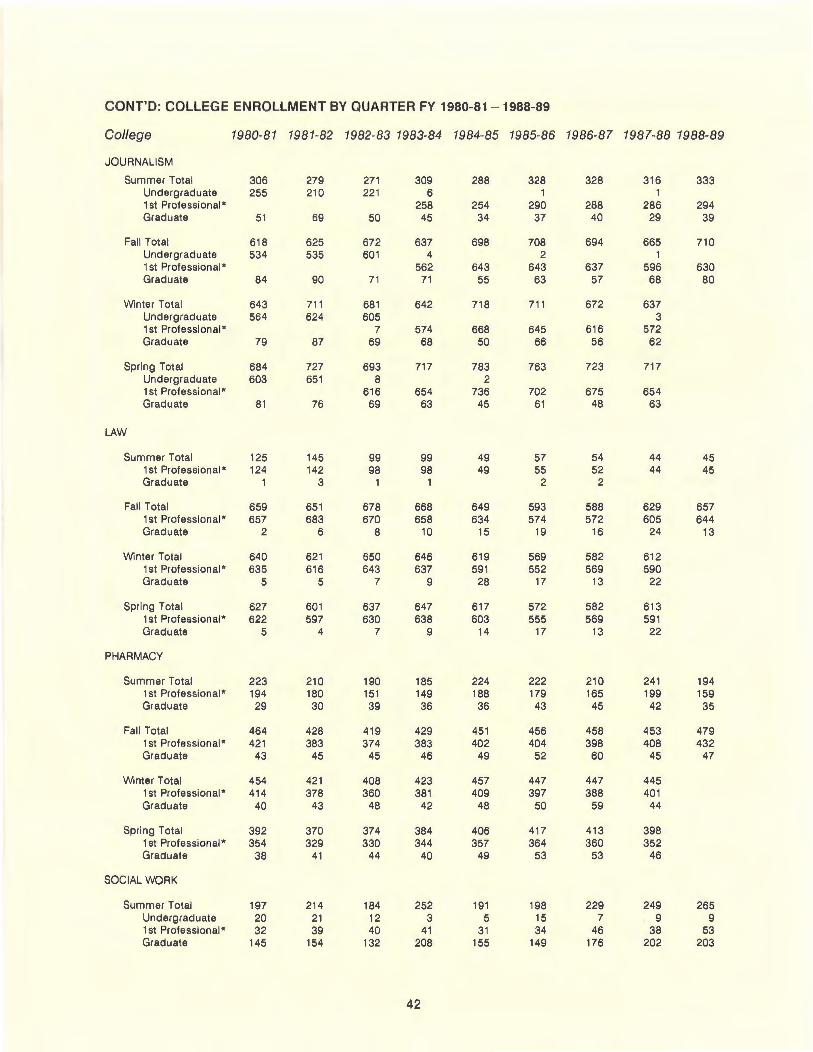
CONT'D: COLLEGE ENROLLMENT BY QUARTER FY 1980-81-1988-89
College 1980-81 1981-82 1982-83 1983-84 1984-85 1985-86 1986-87 1987-88 1988-89
JOURNALISM
Summer Total 306 279 271 309 288 328 328 316 333 Undergraduate 255 210 221 6 1 1 1st Professional* 258 254 290 288 286 294 Graduate 51 69 50 45 34 37 40 29 39
Fall Total 618 625 672 637 698 708 694 665 710 Undergraduate 534 535 601 4 2 1 1st Professional* 562 643 643 637 596 630 Graduate 84 90 71 71 55 63 57 68 80
Winter Total 643 711 681 642 718 711 672 637 Undergraduate 564 624 605 3 1st Professional* 7 574 668 645 616 572 Graduate 79 87 69 68 50 66 56 62
Spring Total 684 727 693 717 783 763 723 717 Undergraduate 603 651 8 2 1st Professional* 616 654 736 702 675 654 Graduate 81 76 69 63 45 61 48 63
LAW
Summer Total 125 145 99 99 49 57 54 44 45 1st Professional* 124 142 98 98 49 55 52 44 45 Graduate 1 3 1 2 2
Fall Total 659 651 678 668 649 593 588 629 657 1st Professional* 657 683 670 658 634 574 572 605 644 Graduate 2 6 8 10 15 19 16 24 13
Winter Total 640 621 650 646 619 569 582 612 1st Professional* 635 616 643 637 591 552 569 590 Graduate 5 5 7 9 28 17 13 22
Spring Total 627 601 637 647 617 572 582 613 1st Professional* 622 597 630 638 603 555 569 591 Graduate 5 4 7 9 14 17 13 22
PHARMACY
Summer Total 223 21 0 190 185 224 222 210 241 194 1st Professional* 194 180 151 149 188 179 165 199 159 Graduate 29 30 39 36 36 43 45 42 35
Fall Total 464 428 419 429 451 456 458 453 479 1st Professional* 421 383 374 383 402 404 398 408 432 Graduate 43 45 45 46 49 52 60 45 47
Winter Total 454 421 408 423 457 447 447 445 1st Professional" 414 378 360 381 409 397 388 401 Graduate 40 43 48 42 48 50 59 44
Spring Total 392 370 374 384 406 417 413 398 1st Professional * 354 329 330 344 357 364 360 352 Graduate 38 41 44 40 49 53 53 46
SOCIAL WORK
Summer Total 197 214 184 252 191 198 229 249 265 Undergraduate 20 21 12 3 5 15 7 9 9 1st Professional* 32 39 40 41 31 34 46 38 53 Graduate 145 154 132 208 155 149 176 202 203
42
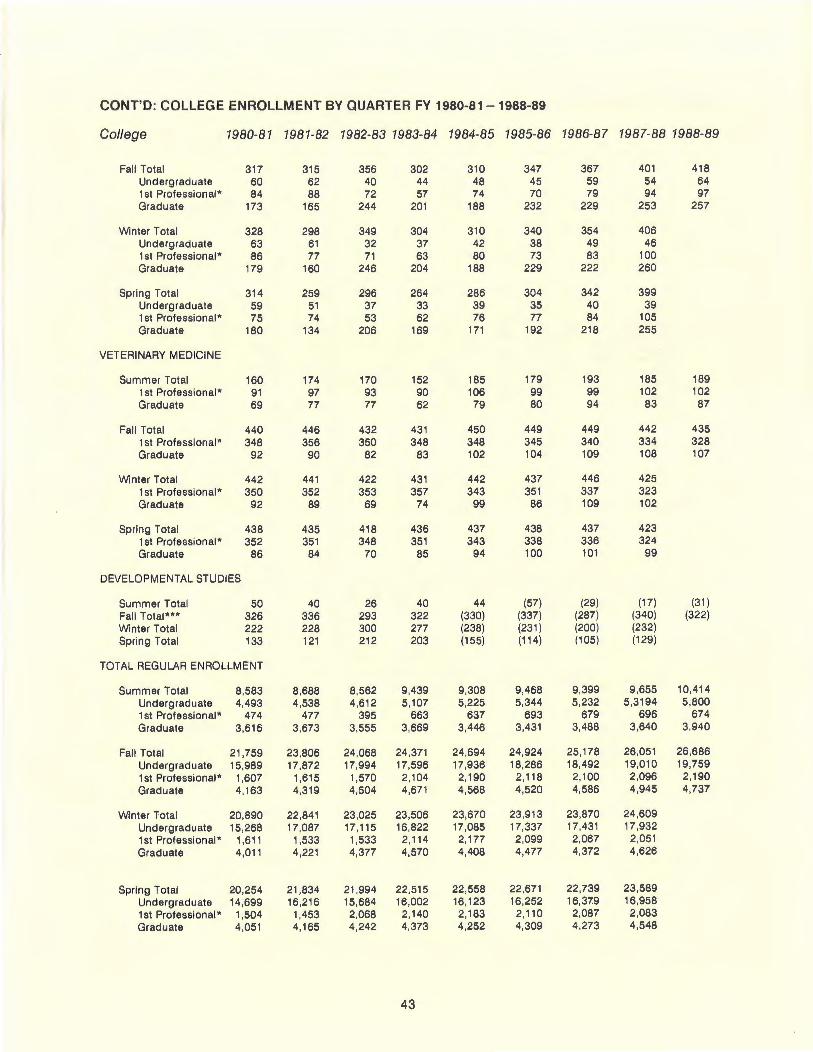
CONT'D: COLLEGE ENROLLMENT BY QUARTER FY 1980-81 - 1988-89
College 1980-81 1981-82 1982-83 1983-84 1984-85 1985-86 1986-87 1987-88 1988-89
Fall Total 317 315 356 302 310 347 367 401 418 Undergraduate 60 62 40 44 48 45 59 54 64 1st Professional * 84 88 72 57 74 70 79 94 97 Graduate 173 165 244 201 188 232 229 253 257
Winter Total 328 298 349 304 310 340 354 406 Undergraduate 63 61 32 37 42 38 49 46 1st Professional * 86 77 71 63 80 73 83 100 Graduate 179 160 246 204 188 229 222 260
Spring Total 314 259 296 264 286 304 342 399 Undergraduate 59 51 37 33 39 35 40 39 1st Professional * 75 74 53 62 76 77 84 105 Graduate 180 134 206 169 171 192 218 255
VETERINARY MEDICINE
Summer Total 160 174 170 152 185 179 193 185 189 1st Professional * 91 97 93 90 106 99 99 102 102 Graduate 69 77 77 62 79 80 94 83 87
Fall Total 440 446 432 431 450 449 449 442 435 1st Professional* 348 356 350 348 348 345 340 334 328 Graduate 92 90 82 83 102 104 109 108 107
Winter Total 442 441 422 431 442 437 446 425 1st Professional* 350 352 353 357 343 351 337 323 Graduate 92 89 69 74 99 86 109 102
Spring Total 438 435 418 436 437 438 437 423 1st Professional* 352 351 348 351 343 338 336 324 Graduate 86 84 70 85 94 100 101 99
DEVELOPMENTAL STUDIES
Summer Total 50 40 26 40 44 (57) (29) (17) (31) Fall Total*** 326 336 293 322 (330) (337) (287) (340) (322) Winter Total 222 228 300 277 (238) (231) (200) (232) Spring Total 133 121 212 203 (155) (114) (105) (129)
TOTAL REGULAR ENROLLMENT
Summer Total 8,583 8,688 8,562 9,439 9,308 9,468 9,399 9,655 10,414 Undergraduate 4,493 4,538 4,612 5,107 5,225 5,344 5,232 5,3194 5,800 1st Professional* 474 477 395 663 637 693 679 696 674 Graduate 3,616 3,673 3,555 3,669 3,446 3,431 3,488 3,640 3,940
Fall Total 21,759 23 ,806 24 ,068 24 ,371 24 ,694 24,924 25,178 26,051 26,686 Undergraduate 15,989 17,872 17,994 17,596 17,936 18,286 18,492 19,010 19,759 1st Professional* 1,607 1,615 1,570 2,104 2,190 2, 118 2,100 2,096 2,190 Graduate 4,163 4,319 4,504 4,671 4,568 4,520 4,586 4,945 4,737
Winter Total 20,890 22,841 23,025 23,506 23,670 23,913 23,870 24,609 Undergraduate 15,268 17,087 17,115 16,822 17,085 17,337 17,431 17,932 1st Professional* 1,611 1,533 1,533 2,114 2,177 2,099 2,067 2,051 Graduate 4,011 4,221 4,377 4,570 4,408 4,477 4,372 4,626
Spring Total 20,254 21,834 21 ,994 22,515 22,558 22,671 22,739 23,589 Undergraduate 14,699 16,216 15,684 16,002 16,123 16,252 16,379 16,958 1st Professional * 1,504 1,453 2,068 2, 140 2,1 83 2,110 2,087 2,083 Graduate 4,051 4,165 4,242 4,373 4,252 4,309 4,273 4,548
43
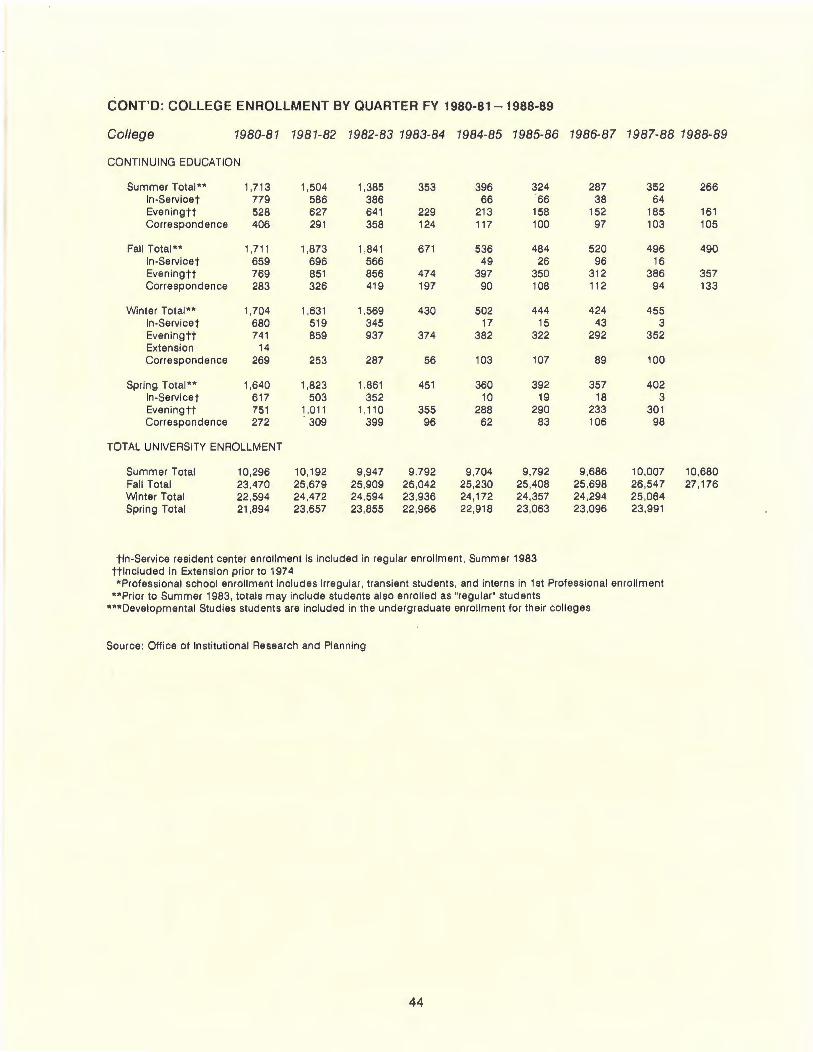
CONT'D: COLLEGE ENROLLMENT BY QUARTER FY 1980-81-1988-89
College 1980-81 1981-82 1982-83 1983-84 1984-85 1985-86 1986-87 1987-88 1988-89
CONTINU ING EDUCATION
Summer Total .. 1,713 1,504 1,385 353 396 324 287 352 266 ln-Servicet 779 586 386 66 66 38 64 Eveningtt 528 627 641 229 213 158 152 185 161 Correspondence 406 291 358 124 117 100 97 103 105
Fall Total** 1,711 1,873 1.841 671 536 484 520 496 490 ln-Servicet 659 696 566 49 26 96 16 Eveningtt 769 851 856 474 397 350 312 386 357 Correspondence 283 326 419 197 90 108 112 94 133
Winter Total** 1,704 1,631 1,569 430 502 444 424 455 ln -Servicet 680 519 345 17 15 43 3 Eveningtt 741 859 937 374 382 322 292 352 Extension 14 Correspondence 269 253 287 56 103 107 89 100
Spring Total .. 1,640 1,823 1.861 451 360 392 357 402 ln-Servicet 617 503 352 10 19 18 3 Evening tt 751 1,011 1,110 355 288 290 233 301 Correspondence 272 309 399 96 62 83 106 98
TOTAL UNIVERSITY ENROLLMENT
Summer Total 10,296 10,192 9,947 9,792 9,704 9,792 9,686 10,007 10,680 Fall Total 23 ,470 25,679 25,909 25,042 25,230 25,408 25,698 26,547 27,176 Winter Total 22 ,594 24,472 24,594 23,936 24,172 24,357 24,294 25,064 Spring Total 21 ,894 23,657 23,855 22,966 22,918 23,063 23,096 23,991
tin-Service resident center enrollment is included in regular enrollment , Summer 1983 ttlncluded in Extension prior to 1974 *Professional school enrollment includes irregular , transient students , and interns in 1st Professional enrollment
*"Prior to Summer 1983, totals may include students also enrolled as "regular" students "**Developmental Studies students are included in the undergraduate enrollment for their colleges
Source: Office of Institutional Research and Planning
44
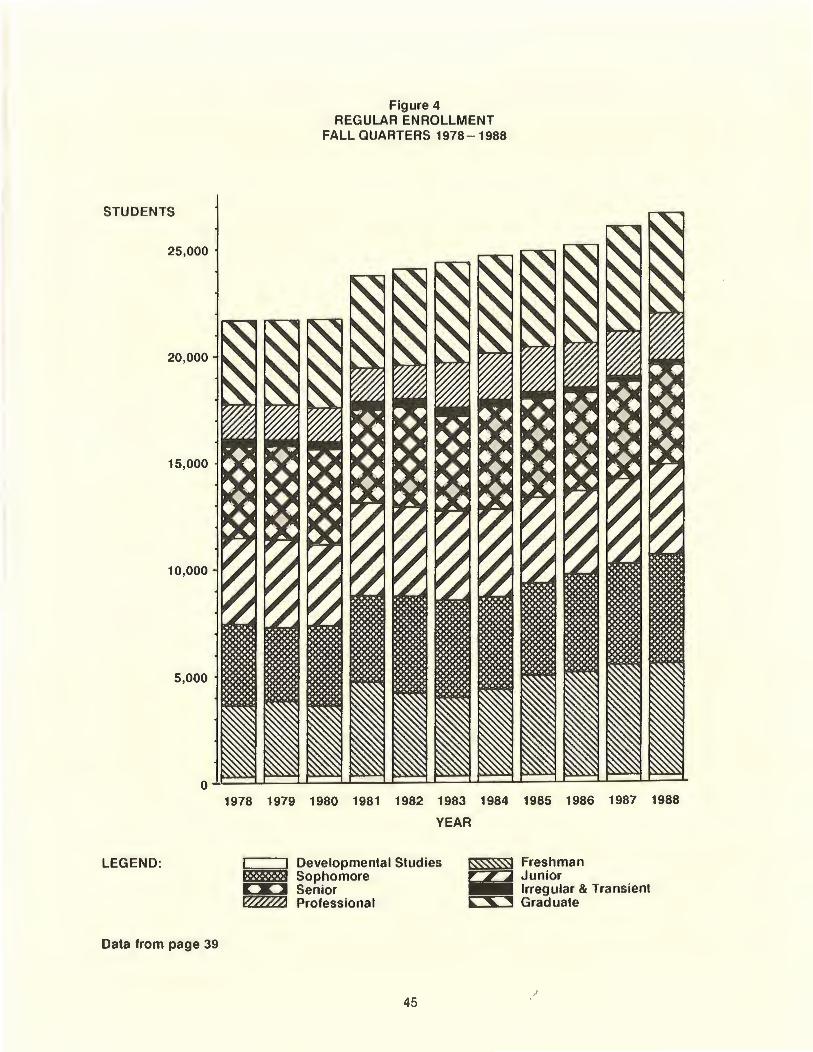
STUDENTS
25,000
20,000
15,000
10,000
5,000
LEGEND:
Data from page 39
Figure 4 REGULAR ENROLLMENT
FALL QUARTERS 1978 - 1988
1978 1979 1980 1981 1982 1983 1984 1985 1986 1987 1988
YEAR
I I Developmental Studies D®OOOOI Sophomore C X J Senior V/////4 Professional
45
~~Freshman ~Junior - Irregular & Transient "" S ""! Graduate
)
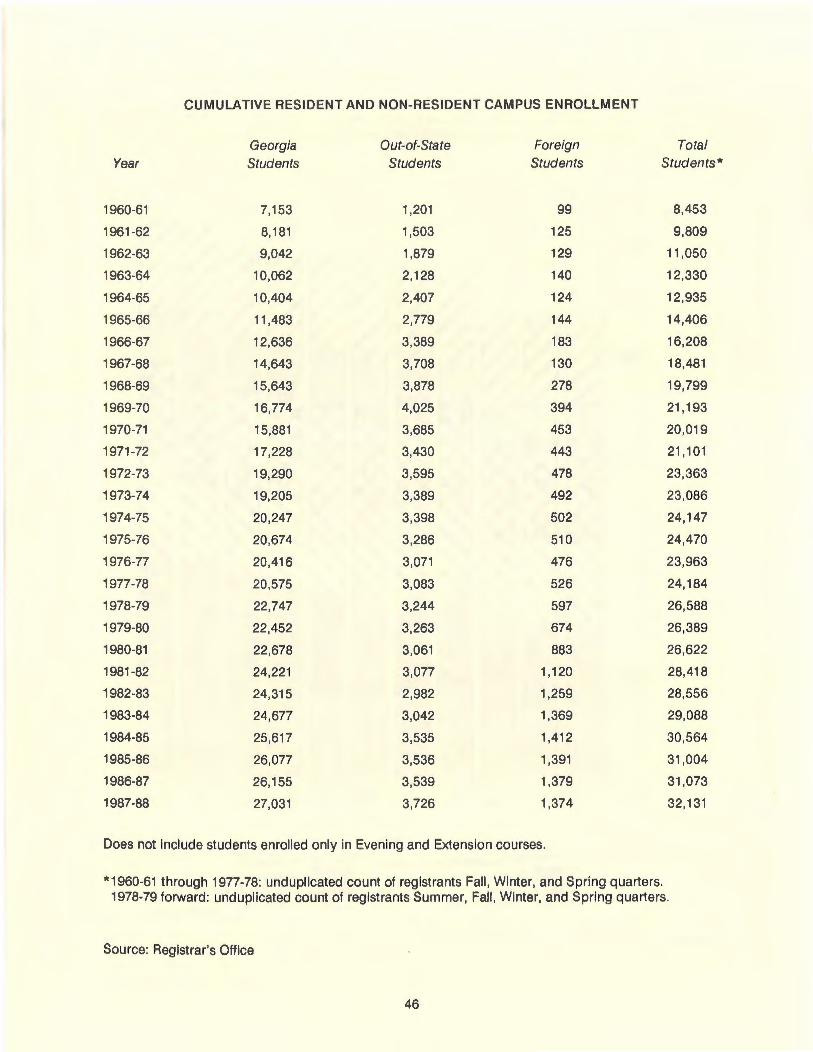
CUMULATIVE RESIDENT AND NON-RESIDENT CAMPUS ENROLLMENT
Georgia Out-of-State Foreign Total
Year Students Students Students Students*
1960-61 7,153 1,201 99 8,453
1961-62 8,181 1,503 125 9,809
1962-63 9,042 1,879 129 11 ,050
1963-64 10,062 2,128 140 12,330
1964-65 10,404 2,407 124 12,935
1965-66 11 ,483 2,779 144 14,406
1966-67 12,636 3,389 183 16,208
1967-68 14,643 3,708 130 18,481
1968-69 15,643 3,878 278 19,799
1969-70 16,774 4,025 394 21 '193
1970-71 15,881 3,685 453 20,019
1971-72 17,228 3,430 443 21 '1 01
1972-73 19,290 3,595 478 23,363
1973-74 19,205 3,389 492 23,086
1974-75 20,247 3,398 502 24,147
1975-76 20,674 3,286 510 24,470
1976-77 20,416 3,071 476 23,963
1977-78 20,575 3,083 526 24,184
1978-79 22,747 3,244 597 26,588
1979-80 22,452 3,263 674 26,389
1980-81 22,678 3,061 883 26,622
1981-82 24,221 3,077 1 '120 28,418
1982-83 24,315 2,982 1,259 28,556
1983-84 24,677 3,042 1,369 29,088
1984-85 25,617 3,535 1 ,412 30,564
1985-86 26,077 3,536 1,391 31,004
1986-87 26,155 3,539 1,379 31,073
1987-88 27,031 3,726 1,374 32,131
Does not include students enrolled only in Evening and Extension courses.
*1960-61 through 1977-78: unduplicated count of registrants Fall, Winter, and Spring quarters. 1978-79 forward: unduplicated count of registrants Summer, Fall, Winter, and Spring quarters.
Source: Registrar's Office
46
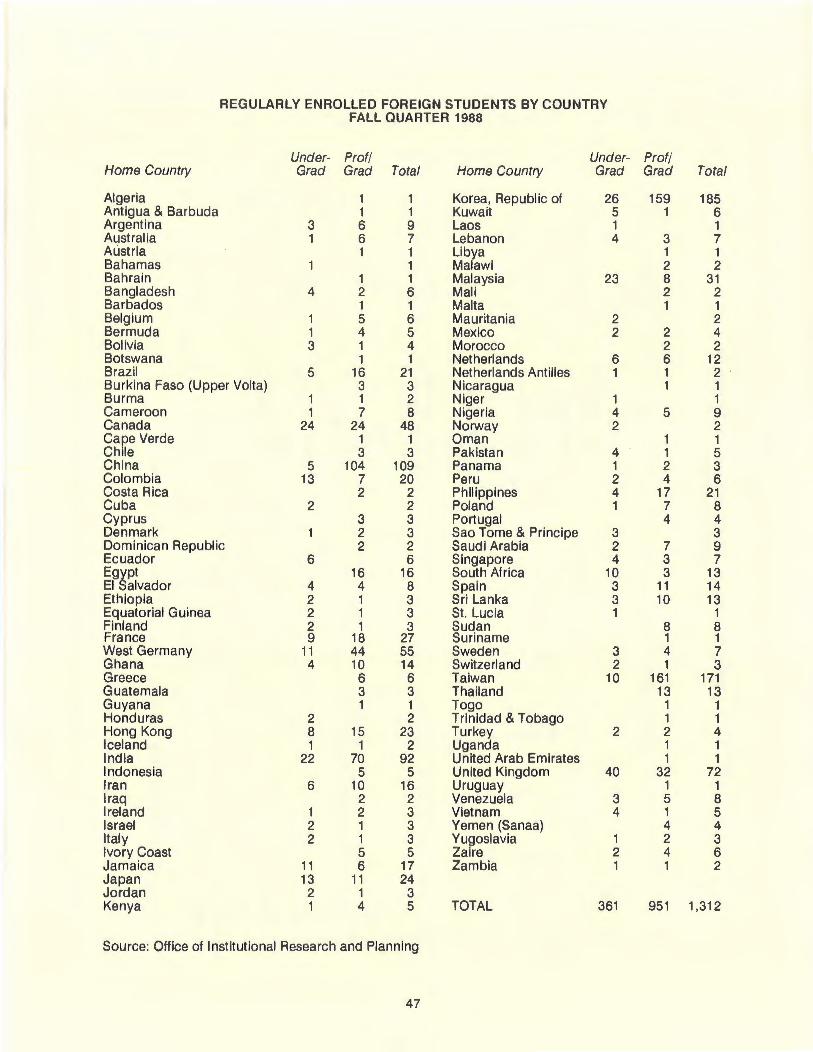
REGULARLY ENROLLED FOREIGN STUDENTS BY COUNTRY FALL QUARTER 1988
Under- Prof/ Under- Prof/ Home Country Grad Grad Total Home Country Grad Grad Total
Algeria 1 1 Korea, Republic of 26 159 185 Antigua & Barbuda 1 1 Kuwait 5 1 6 Argentina 3 6 9 Laos 1 1 Australia 1 6 7 Lebanon 4 3 7 Austria 1 1 Libya 1 1 Bahamas 1 Malawi 2 2 Bahrain 1 1 Malaysia 23 8 31 Bangladesh 4 2 6 Mali 2 2 Barbados 1 1 Malta 1 1 Belgium 1 5 6 Mauritania 2 2 Bermuda 1 4 5 Mexico 2 2 4 Bolivia 3 1 4 Morocco 2 2 Botswana 1 1 Netherlands 6 6 12 Brazil 5 16 21 Netherlands Antilles 1 1 2 Burkina Faso (Upper Volta) 3 3 Nicaragua 1 1 Burma 1 1 2 Niger 1 1 Cameroon 1 7 8 Nigeria 4 5 9 Canada 24 24 48 Norway 2 2 Cape Verde 1 1 Oman 1 1 Chile 3 3 Pakistan 4 1 5 China 5 104 109 Panama 1 2 3 Colombia 13 7 20 Peru 2 4 6 Costa Rica 2 2 Philippines 4 17 21 Cuba 2 2 Poland 1 7 8 Cyprus 3 3 Portugal 4 4 Denmark 2 3 Sao Tome & Principe 3 3 Dominican Republic 2 2 Saudi Arabia 2 7 9 Ecuador 6 6 Singapore 4 3 7 Eg~pt 16 16 South Africa 10 3 13 El alvador 4 4 8 Spain 3 11 14 Ethiopia 2 1 3 Sri Lanka 3 10 13 Equatorial Guinea 2 1 3 St. Lucia 1 1 Finland 2 1 3 Sudan 8 8 France 9 18 27 Suriname 1 1 West Germany 11 44 55 Sweden 3 4 7 Ghana 4 10 14 Switzerland 2 1 3 Greece 6 6 Taiwan 10 161 171 Guatemala 3 3 Thailand 13 13 Guyana 1 1 Togo 1 1 Honduras 2 2 Trinidad & Tobago 1 1 Hong Kong 8 15 23 Turkey 2 2 4 Iceland 1 1 2 Uganda 1 1 India 22 70 92 United Arab Emirates 1 1 Indonesia 5 5 United Kingdom 40 32 72 Iran 6 10 16 Uruguay 1 1 Iraq 2 2 Venezuela 3 5 8 Ireland 1 2 3 Vietnam 4 1 5 Israel 2 1 3 Yemen (Sanaa) 4 4 Italy 2 1 3 Yugoslavia 1 2 3 Ivory Coast 5 5 Zaire 2 4 6 Jamaica 11 6 17 Zambia 1 1 2 Japan 13 11 24 Jordan 2 1 3 Kenya 1 4 5 TOTAL 361 951 1,312
Source: Office of Institutional Research and Planning
47
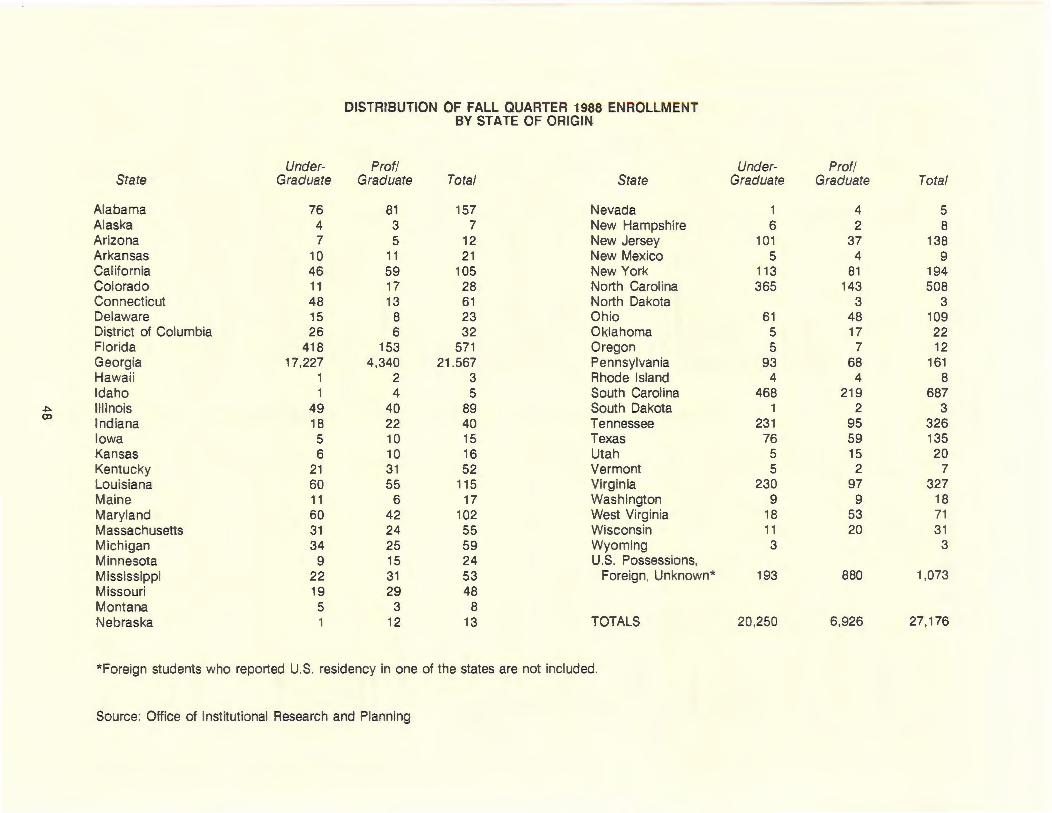
DISTRIBUTION OF FALL QUARTER 1988 ENROLLMENT BY STATE OF ORIGIN
Under- Prof/ Under- Prof! State Graduate Graduate Total State Graduate Graduate Total
Alabama 76 81 157 Nevada 1 4 5 Alaska 4 3 7 New Hampshire 6 2 8 Arizona 7 5 12 New Jersey 101 37 138 Arkansas 10 11 21 New Mexico 5 4 9 California 46 59 105 New York 113 81 194 Colorado 11 17 28 North Carolina 365 143 508 Connecticut 48 13 61 North Dakota 3 3 Delaware 15 8 23 Ohio 61 48 109 District of Columbia 26 6 32 Oklahoma 5 17 22 Florida 418 153 571 Oregon 5 7 12 Georgia 17,227 4,340 21.567 Pennsylvania 93 68 161 Hawaii 1 2 3 Rhode Island 4 4 8 Idaho 1 4 5 South Carolina 468 219 687
~ Illinois 49 40 89 South Dakota 1 2 3 (X)
Indiana 18 22 40 Tennessee 231 95 326 Iowa 5 10 15 Texas 76 59 135 Kansas 6 10 16 Utah 5 15 20 Kentucky 21 31 52 Vermont 5 2 7 Louisiana 60 55 115 Virginia 230 97 327 Maine 11 6 17 Washington 9 9 18 Maryland 60 42 102 West Virginia 18 53 71 Massachusetts 31 24 55 Wisconsin 11 20 31 Michigan 34 25 59 Wyoming 3 3 Minnesota 9 15 24 U.S. Possessions, Mississippi 22 31 53 Foreign, Unknown* 193 880 1,073 Missouri 19 29 48 Montana 5 3 8 Nebraska 1 12 13 TOTALS 20,250 6,926 27 ,176
*Foreign students who reported U.S. residency in one of the states are not included.
Source: Office of Institutional Research and Planning
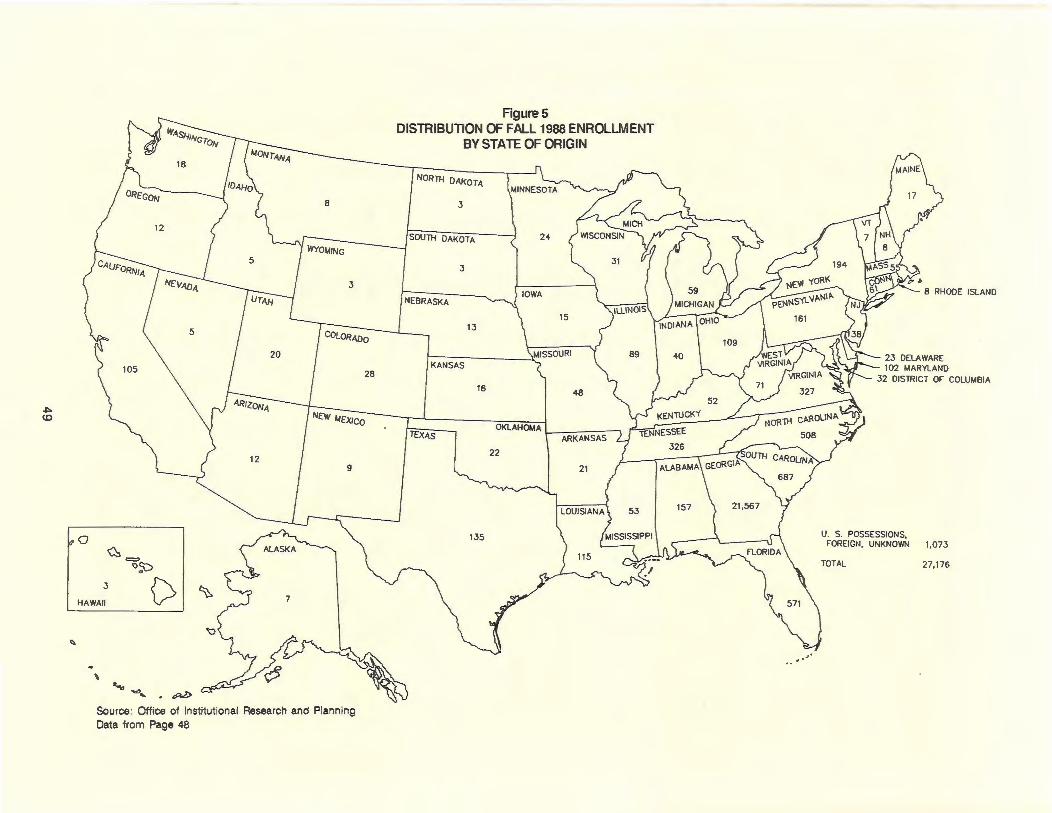
.l:> co
""
0 <Q.=
<:>s:>
"{) 3
HAWAII
II .. " ~, • t:P.l>
~
Source: Office of Institutional Data from Page 48
28
9
7
9 Research and Plann ing
Figures DISTRIBUTION OF FALL 1988 ENROLLMENT
BY STATE OF ORIGIN
NORTH DAKOTA
3
SOUTH DAKOTA
3
13
KANSAS
16 48
TEXAS OKLAHOMA ARKANSAS
22
21
, .
8 RHODE ISLAND
23 DELAWARE 102 MARYLAND
32 DISTRICT OF COLUMBIA
U. S. POSSESSIONS, FOREIGN, UNKNOWN 1,073
TOTAL 27,176
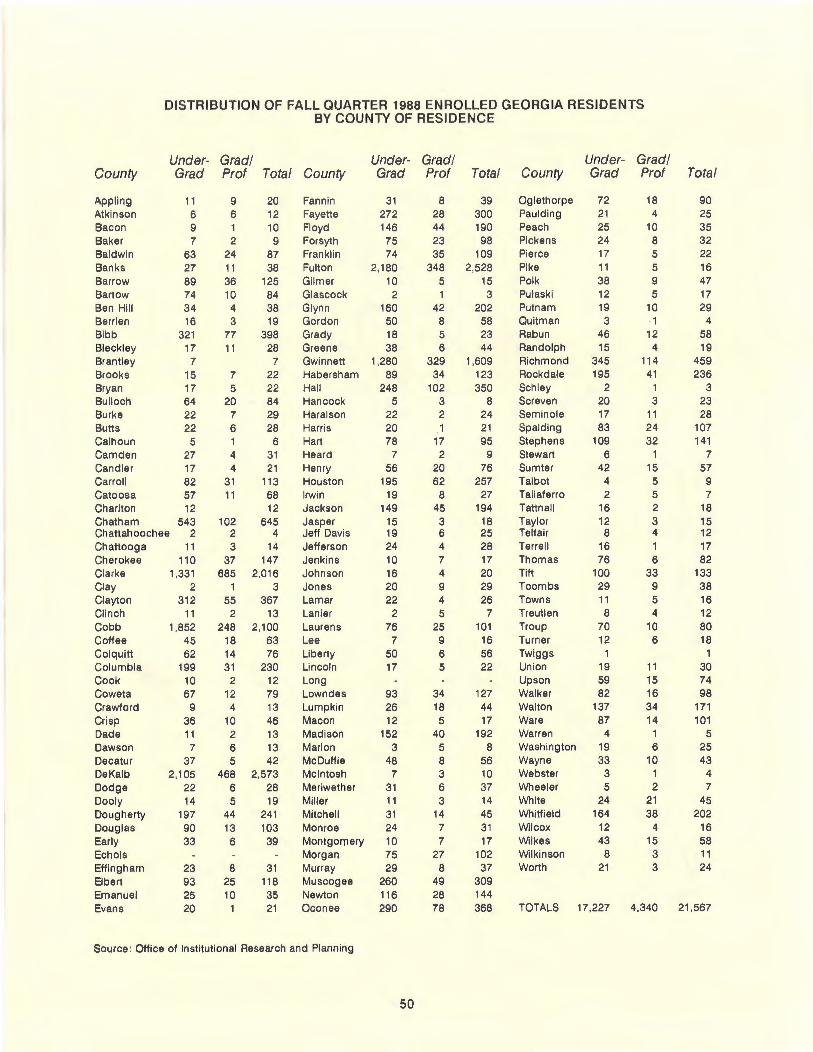
DISTRIBUTION OF FALL QUARTER 1988 ENROLLED GEORGIA RESIDENTS BY COUNTY OF RESIDENCE
Under- Grad/ Under- Grad/ Under- Grad/ County Grad Prof Total County Grad Prof Tota l County Grad Prof Total
Appling 11 Atkinson 6 Bacon 9 Baker 7 Baldwin 63 Banks 27 Barrow 89 Bartow 74 Ben Hill 34 Berrien 16 Bibb 321 Blackley 17 Brantley 7 Brooks 15 Bryan 17 Bu lloch 64 Burke 22 Butts 22 Calhoun 5 Camden 27 Candler 17 Carroll 82 Catoosa 57 Charlton 12 Chatham 543 Chattahoochee 2 Chattooga 11 Cherokee 110 Clarke 1,331 Clay 2 Clayton 312 Clinch 11 Cobb 1,852 Coffee 45 Colquitt 62 Columbia 199 Cook 10 Coweta 67 Crawford 9 Crisp 36 Dade 11 Dawson 7 Decatur 37 DeKalb 2,105 Dodge 22 Dooly 14 Dougherty 197 Douglas 90 Early 33 Echols Effingham 23 Elbert 93 Emanuel 25 Evans 20
9 6 1 2
24 11 36 10 4 3
77 11
7 5
20 7 6
4 4
31 11
102 2 3
37 685
1 55
2 248
18 14 31
2 12
4 10 2 6 5
468 6 5
44 13 6
8 25 10
20 12 10
9 87 38
125 84 38 19
398 28
7 22 22 84 29 28
6 31 21
113 68 12
645 4
14 147
2,016 3
367 13
2,100 63 76
230 12 79 13 46 13 13 42
2,573 28 19
241 103 39
31 118 35 21
Fannin Fayette Floyd Forsyth Franklin Fulton Gilmer Glascock Glynn Gordon Grady Greene Gwinnett Habersham Hall Hancock Haralson Harris Hart Heard Henry Houston Irwin Jackson Jasper Jeff Davis Jefferson Jenkins Johnson Jones Lamar Lanier Laurens Lee Liberty Lincoln Long Lowndes Lumpkin Macon Madison Marion McDuffie Mcintosh Meriwether Miller Mitchell Monroe Montgomery Morgan Murray Muscogee Newton Oconee
Source : Office of Institutional Research and Planning
31 272 146 75 74
2,180 10 2
160 50 18 38
1,280 89
248 5
22 20 78
7 56
195 19
149 15 19 24 10 16 20 22
2 76
7 50 17
93 26 12
152 3
48 7
31 11 31 24 10 75 29
260 116 290
50
8 28 44 23 35
348 5 1
42 8 5 6
329 34
102 3 2
.1 17 2
20 62
8 45
3 6 4 7 4 9 4 5
25 9 6 5
34 18 5
40 5 8 3 6 3
14 7 7
27 8
49 28 78
39 300 190 98
109 2,528
15 3
202 58 23 44
1,609 123 350
8 24 21 95
9 76
257 27
194 18 25 28 17 20 29 26
7 101
16 56 22
127 44 17
192 8
56 10 37 14 45 31 17
102 37
309 144 368
Oglethorpe 72 Paulding 21 Peach 25 Pickens 24 Pierce 17 Pike 11 Polk 38 Pulaski 12 Putnam 19 Quitman 3 Rabun 46 Randolph 15 Richmond 345 Rockdale 195 Schley 2 Screven 20 Seminole 17 Spalding 83 Stephens 109 Stewart 6 Sumter 42 Talbot 4 Taliaferro 2 Tattnall 16 Taylor 12 Telfair 8 Terrell 16 Thomas 76 Tift 100 Toombs 29 Towns 11 Treutlen 8 Troup 70 Turner 12 Twiggs 1 Union 19 Upson 59 Walker 82 Walton 137 Ware 87 Warren 4 Washington 19 Wayne 33 Webster 3 Wheeler 5 White 24 Whitfield 164 Wilcox 12 Wilkes 43 Wilkinson 8 Worth 21
TOTALS 17,227
18 4
10 8 5 5 9 5
10 ·1 12
4 114
41 1 3
11 24 32
15 5 5 2 3 4 1 6
33 9 5 4
10 6
11 15 16 34 14
1
6 10
1 2
21 38
4 15 3 3
4,340
90 25 35 32 22 16 47 17 29
4 58 19
459 236
3 23 28
107 141
7 57
9 7
18 15 12 17 82
133 38 16 12 80 18
1 30 74 98
171 101
5 25 43
4 7
45 202
16 58 11 24
21,567
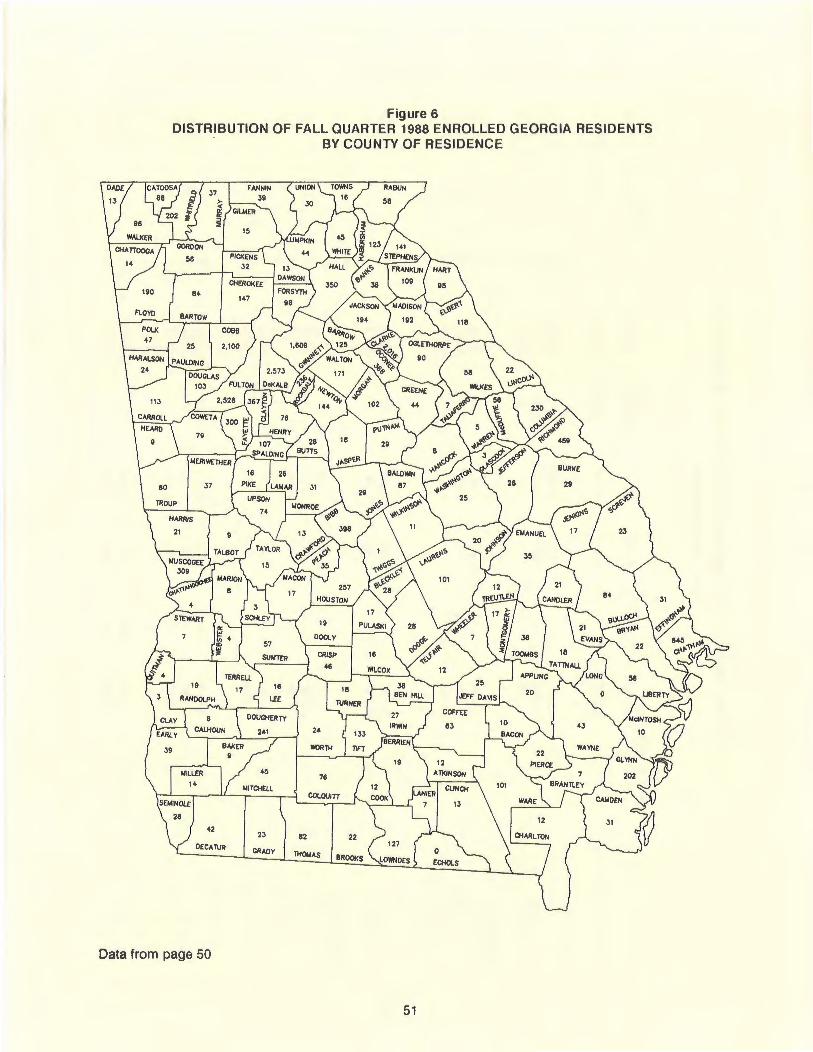
Figure 6 DISTRIBUTION OF FALL QUARTER 1988 ENROLLED GEORGIA RESIDENTS
BY COUNTY OF RESIDENCE
Data from page 50
51
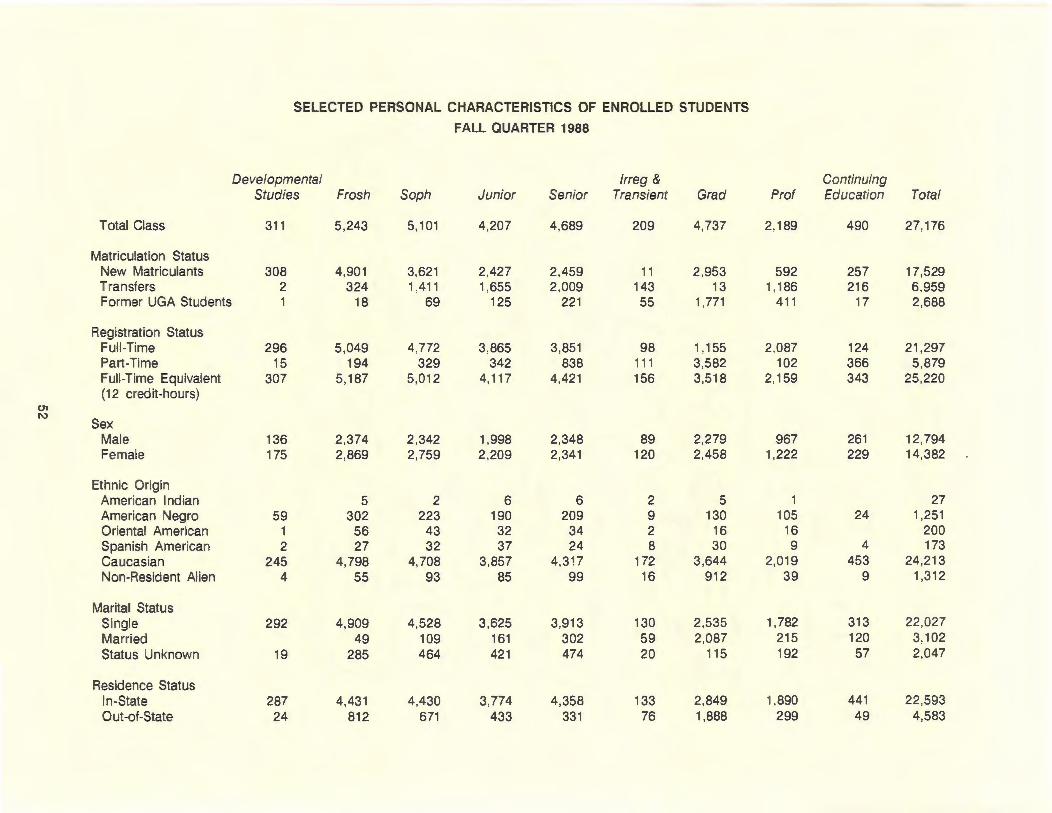
SELECTED PERSONAL CHARACTERISTICS OF ENROLLED STUDENTS
FALL QUARTER 1988
Developmental /rreg & Continuing Studies Frosh Soph Junior Senior Transient Grad Prof Education Total
Total Class 311 5,243 5,101 4,207 4,689 209 4,737 2,189 490 27,176
Matriculation Status New Matriculants 308 4,901 3,621 2,427 2,459 1 1 2,953 592 257 17,529 Transfers 2 324 1 ,41 1 1,655 2,009 143 13 1 '186 216 6,959 Former UGA Students 1 18 69 125 221 55 1,771 411 17 2,688
Registration Status Full-Time 296 5,049 4.772 3,865 3,851 98 1 ' 1 55 2.087 124 21 ,297 Part-Time 15 194 329 342 838 1 11 3,582 102 366 5,879 Full-Time Equivalent 307 5,187 5,012 4,117 4,421 156 3,518 2,159 343 25,220 (12 credit-hours)
(11 1\)
Sex Male 136 2,374 2,342 1,998 2,348 89 2,279 967 261 12,794 Female 175 2,869 2,759 2,209 2,341 120 2,458 1,222 229 14,382
Ethnic Origin American Indian 5 2 6 6 2 5 1 27 American Negro 59 302 223 190 209 9 130 105 24 1,251 Oriental American 1 56 43 32 34 2 16 16 200 Spanish American 2 27 32 37 24 8 30 9 4 173 Caucasian 245 4,798 4,708 3,857 4,317 172 3,644 2,019 453 24,213 Non-Resident Alien 4 55 93 85 99 16 912 39 9 1,312
Marital Status Single 292 4,909 4,528 3,625 3,913 130 2,535 1,782 313 22,027 Married 49 109 161 302 59 2,087 215 120 3,102 Status Unknown 19 285 464 421 474 20 115 192 57 2,047
Residence Status In-State 287 4,431 4,430 3,774 4,358 133 2,849 1,890 441 22 ,593 0 ut -of -State 24 812 671 433 331 76 1,888 299 49 4,583
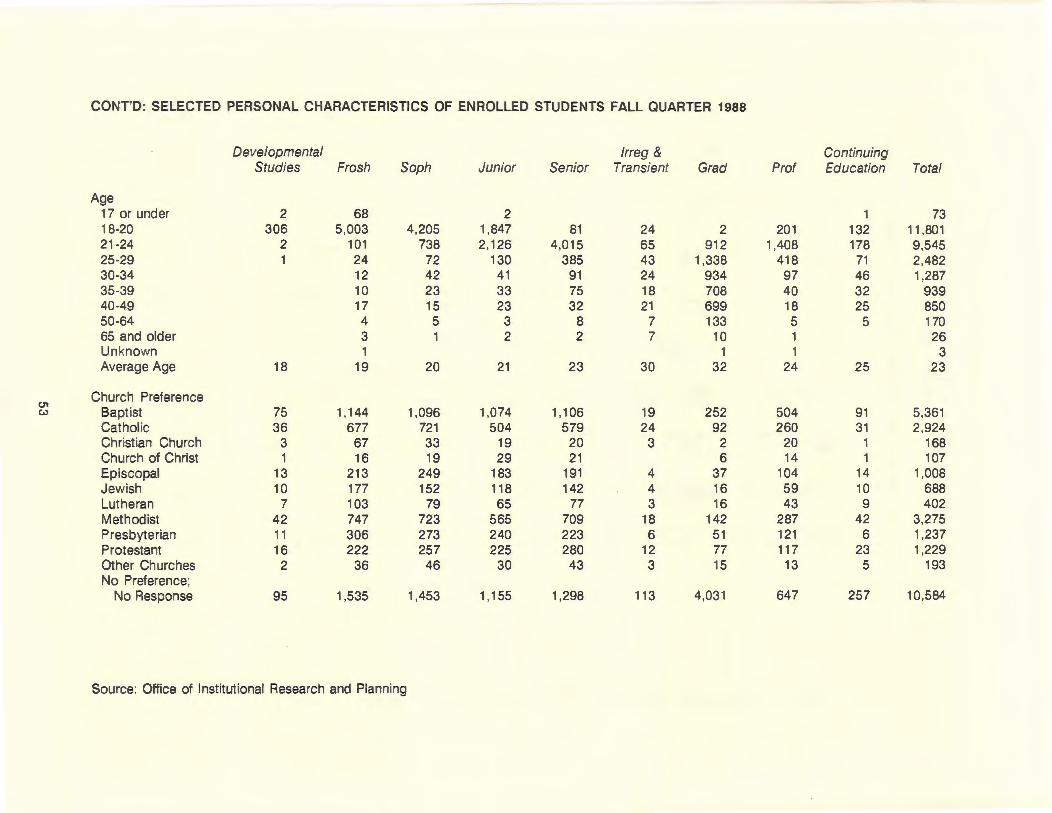
CONT'D: SELECTED PERSONAL CHARACTERISTICS OF ENROLLED STUDENTS FALL QUARTER 1988
Developmental lrreg & Continuing Studies Frosh Soph Junior Senior Transient Grad Prof Education Total
Age 17 or under 2 68 2 1 73 18-20 306 5,003 4,205 1,847 81 24 2 201 132 11 ,801 21-24 2 101 738 2,126 4,015 65 912 1,408 178 9,545 25-29 1 24 72 130 385 43 1,338 418 71 2,482 30-34 12 42 41 91 24 934 97 46 1,287 35-39 10 23 33 75 18 708 40 32 939 40-49 17 15 23 32 21 699 18 25 850 50-64 4 5 3 8 7 133 5 5 170 65 and older 3 1 2 2 7 10 1 26 Unknown 1 1 1 3 Average Age 18 19 20 21 23 30 32 24 25 23
Church Preference 01
Baptist (.) 75 1 '144 1,096 1,074 1 '1 06 19 252 504 91 5,361 Catholic 36 677 721 504 579 24 92 260 31 2,924 Christian Church 3 67 33 19 20 3 2 20 1 168 Church of Christ 1 16 19 29 21 6 14 1 107 Episcopal 13 213 249 183 191 4 37 104 14 1,008 Jewish 10 177 152 118 142 4 16 59 10 688 Lutheran 7 103 79 65 77 3 16 43 9 402 Methodist 42 747 723 565 709 18 142 287 42 3,275 Presbyterian 11 306 273 240 223 6 51 121 6 1,237 Protestant 16 222 257 225 280 12 77 117 23 1,229 Other Churches 2 36 46 30 43 3 15 13 5 193 No Preference;
No Response 95 1,535 1,453 1 '155 1,298 113 4,031 647 257 10,584
Source: Office of Institutional Research and Planning
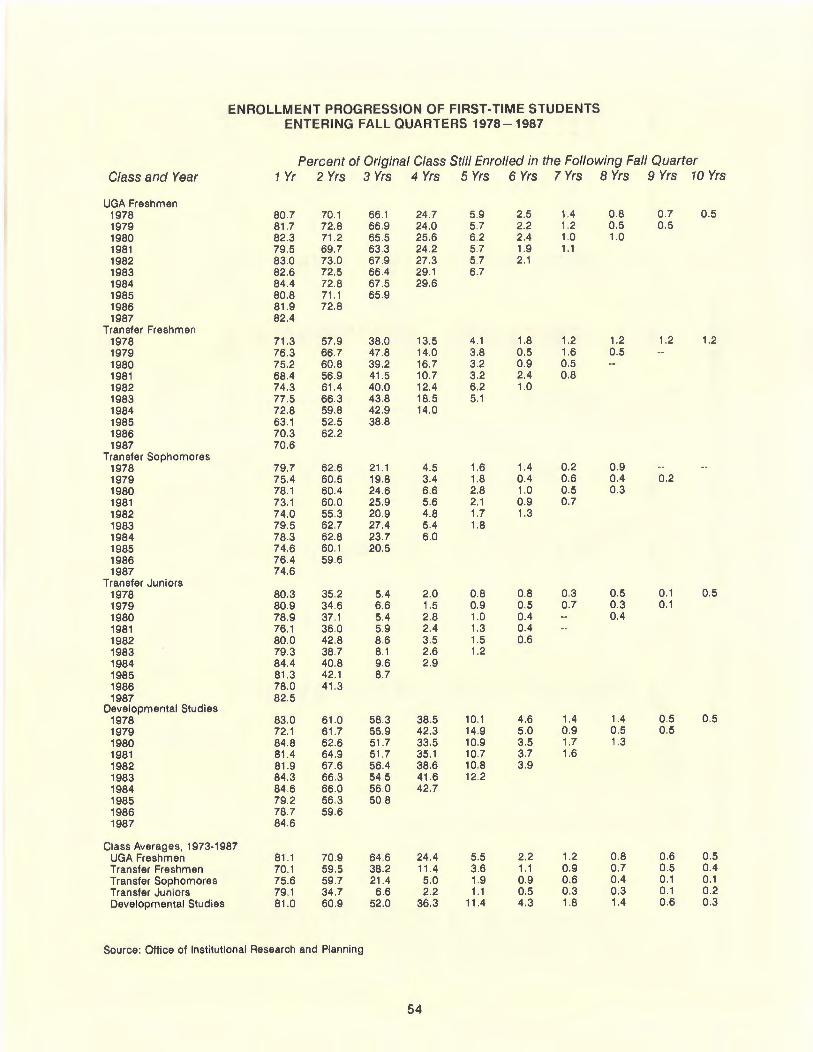
ENROLLMENT PROGRESSION OF FIRST-TIME STUDENTS ENTERING FALL QUARTERS 1978-1987
Percent of Original Class Still Enrolled in the Following Fall Quarter Class and Year 1 Yr 2 Yrs 3 Yrs 4 Yrs 5 Yrs 6 Yrs 7 Yrs 8 Yrs 9 Yrs 10 Yrs
UGA Freshmen 1978 80.7 70 1 66 .1 24 .7 5.9 2.5 1.4 0.8 0.7 0.5 1979 81 .7 72 8 66.9 24.0 5.7 2.2 1.2 0.5 0.5 1980 82 .3 71.2 65 .5 25.6 62 2.4 1.0 1.0 1981 79.5 69.7 63 .3 24.2 5.7 1.9 1 .1 1982 83 .0 73.0 67 .9 27.3 5.7 2.1 1983 82.6 72.5 66.4 29.1 6.7 1984 84.4 72.8 67 .5 29.6 1985 80.8 71.1 65 9 1986 81 9 72.8 1987 82.4
Transfer Freshmen 1978 71.3 57.9 38 0 13.5 4.1 1.8 1.2 1.2 1.2 1.2 1979 76.3 66.7 47 8 14.0 3.8 0.5 1.6 0.5 1980 75.2 60.8 39.2 16 7 3.2 0.9 0.5 1981 68.4 56 9 41.5 10.7 3.2 2.4 0.8 1982 74.3 61 .4 40.0 12.4 6.2 1.0 1983 77.5 66.3 43.8 18.5 5.1 1984 72.8 59.8 42.9 14.0 1985 63.1 52.5 38.8 1986 70.3 62.2 1987 70.6
Transfer Sophomores 1978 79.7 62 6 21 .1 4.5 1 6 1.4 0.2 0.9 1979 75.4 60.5 19.8 3.4 1.8 0.4 0.6 0.4 0.2 1980 78.1 60.4 24 .6 66 2.8 1 0 0.5 0.3 1981 73.1 60.0 25.9 5.6 2.1 0.9 0.7 1982 74.0 55.3 20 9 4.8 1.7 1.3 1983 79.5 62.7 27.4 5.4 1.8 1984 78 3 62.8 23.7 6.0 1985 74.6 60 1 20.5 1986 76.4 59 6 1987 74.6
Transfer Juniors 1978 80.3 35.2 5.4 2.0 0.8 0.8 0.3 0.5 0.1 0.5 1979 80.9 34 6 6.6 1.5 0.9 05 0.7 0.3 0.1 1980 78.9 37 1 5.4 2.8 1.0 0.4 0.4 1981 76.1 360 59 2.4 1.3 0.4 1982 80 .0 42.8 8.6 3.5 1.5 06 1983 79.3 38.7 8 1 2.6 1.2 1984 84.4 40.8 9.6 2.9 1985 81 .3 42.1 87 1986 78.0 41.3 1987 82.5
Developmental Studies 1978 83.0 61 0 58.3 38.5 10.1 4.6 1.4 1.4 0.5 0.5 1979 72.1 61.7 55.9 42.3 14.9 5.0 09 0.5 0.5 1980 84.8 62.6 51 7 33.5 10.9 3.5 1.7 1.3 1981 81.4 64.9 51 7 35.1 10.7 3.7 1.6 1982 81.9 67.6 56.4 38.6 10.8 3.9 1983 84.3 66.3 54.5 41.6 12.2 1984 84 6 66.0 56 0 42.7 1985 79.2 56.3 50 8 1986 78.7 59.6 1987 84.6
Class Averages, 1973-1987 UGA Freshmen 81 .1 70.9 64 .6 24.4 5.5 2.2 1 2 08 0.6 0.5 Transfer Freshmen 70.1 59.5 38.2 11 .4 3.6 1.1 09 0.7 0.5 0.4 Transfer Sophomores 75.6 59 7 21.4 50 1.9 0.9 06 0.4 0.1 0.1 Transfer Juniors 79.1 34 .7 6.6 2.2 1.1 05 0.3 0.3 0.1 0.2 Developmental Studies 81.0 60.9 52 .0 36.3 11.4 4.3 1.8 1.4 0.6 0.3
Source: Office of Institutional Research and Planning
54
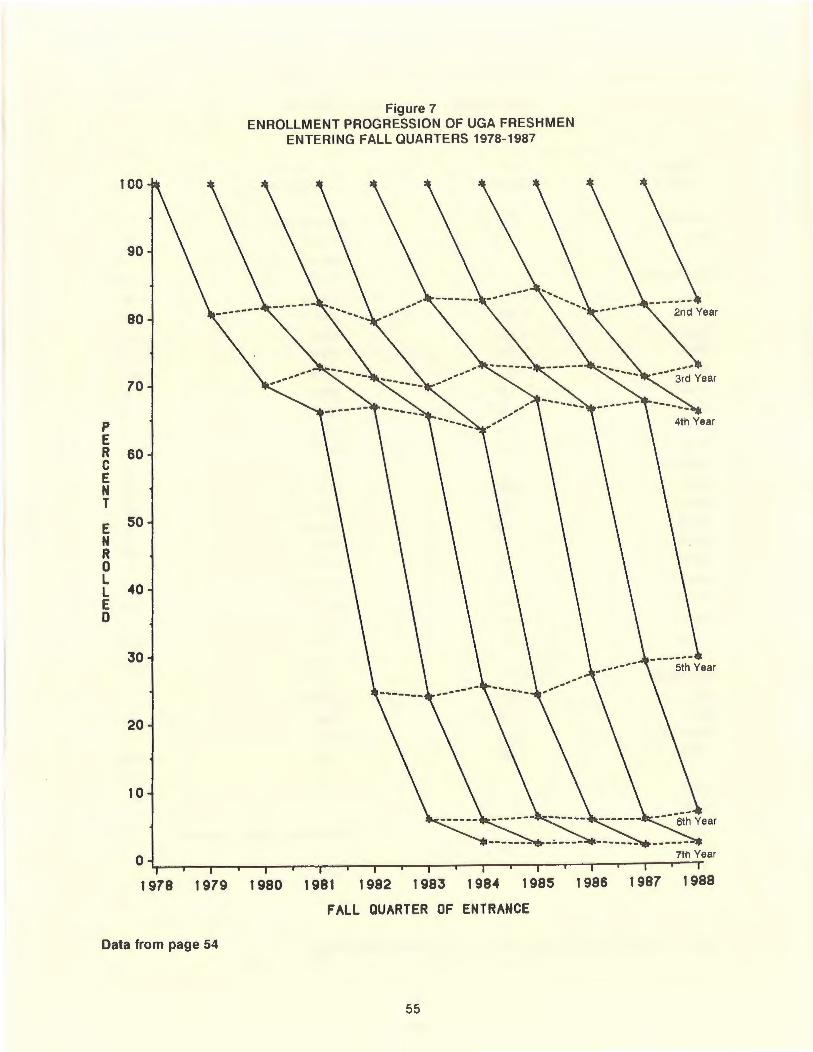
p E R c E N T
E N R 0 L L E 0
100
90
80
70
60
50
40
30
20
10
0
Figure 7 ENROLLMENT PROGRESSION OF UGA FRESHMEN
ENTERING FALL QUARTERS 1978-1987
7th Year
1 978 1 979 1 980 1 981 1 982 1 983 1 984 1 985 1 986 1 987 1 988
FALL QUARTER OF ENTRANCE
Data from page 54
55
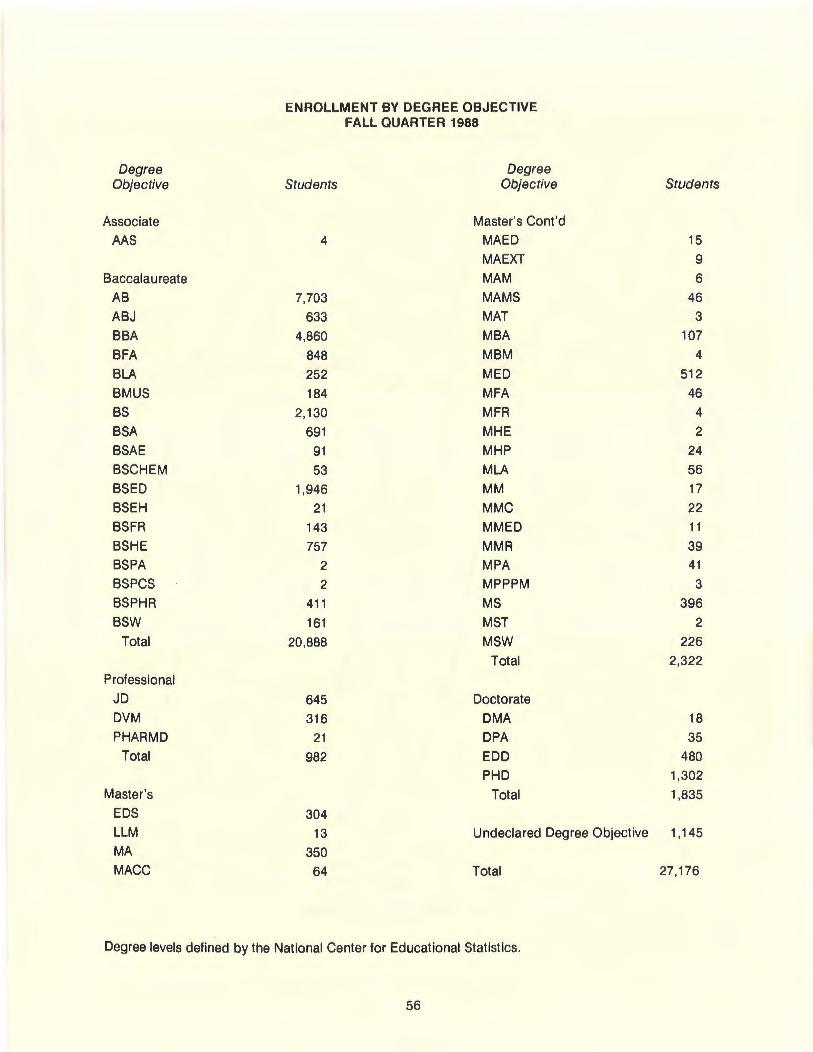
ENROLLMENT BY DEGREE OBJECTIVE FALL QUARTER 1988
Degree Degree Objective Students Objective Students
Associate Master's Cont'd
AAS 4 MAED 15 MAEXT 9
Baccalaureate MAM 6 AB 7,703 MAMS 46 ABJ 633 MAT 3 BBA 4,860 MBA 107 BFA 848 MBM 4 BLA 252 MED 512 BMUS 184 MFA 46 BS 2,130 MFA 4 BSA 691 MHE 2 BSAE 91 MHP 24 BSCHEM 53 MLA 56 BSED 1,946 MM 17 BSEH 21 MMC 22 BSFR 143 MMED 11 BSHE 757 MMR 39 BSPA 2 MPA 41 BSPCS 2 MPPPM 3 BSPHR 411 MS 396 ssw 161 MST 2
Total 20,888 MSW 226 Total 2,322
Professional
JD 645 Doctorate
DVM 316 DMA 18 PHARMD 21 DPA 35
Total 982 EDD 480 PHD 1,302
Master's Total 1,835 EDS 304 LLM 13 Undeclared Degree Objective 1,145 MA 350 MACC 64 Total 27,176
Degree levels defined by the National Center for Educational Statistics.
56
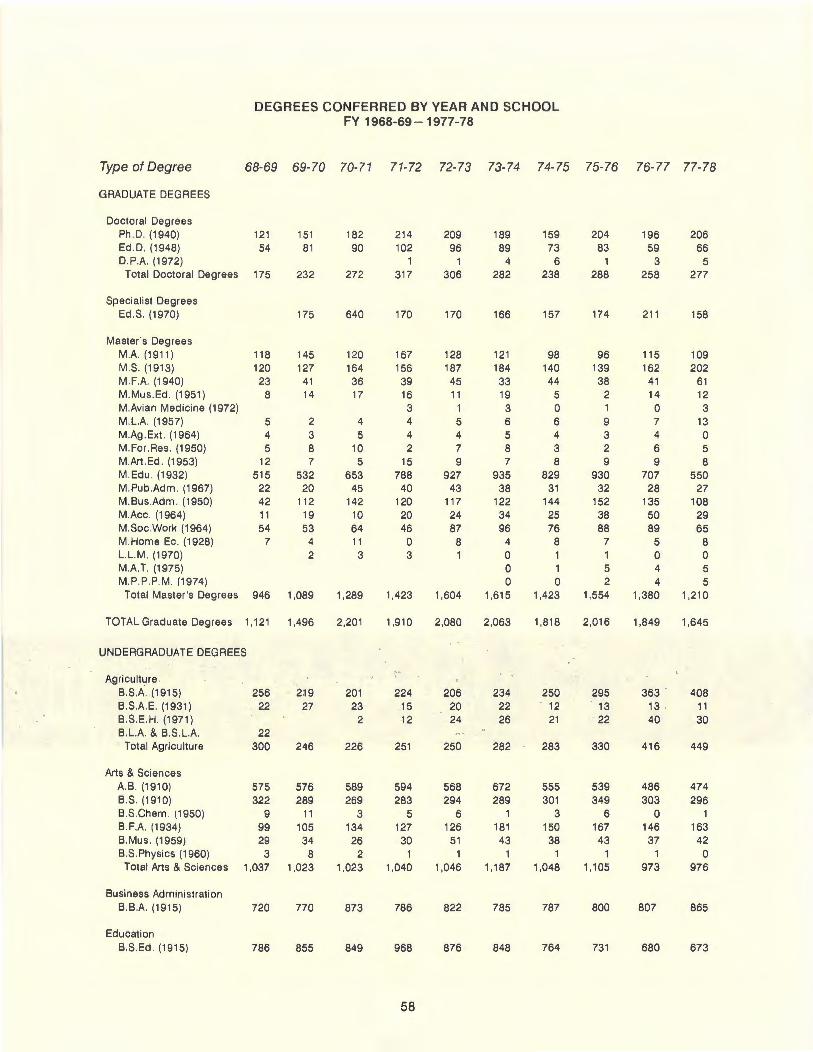
DEGREES CONFERRED BY YEAR AND SCHOOL FY 1968-69- 1977-78
Type of Degree 68-69 69-70 70-71 71-72 72-73 73-74 74-75 75-76 76-77 77-78
GRADUATE DEGREES
Doctoral Degrees Ph .D. (1940) 121 Ed .D. (1948) 54 D.P.A. (1972)
Total Doctoral Degrees 175
Specialist Degrees Ed.S (1970)
Master 's Degrees
151 81
232
175
M.A. (1911) 118 145 M.S. (1913) 120 127 M.F.A. (1940) 23 41 M.Mus.Ed. (1951) 8 14 M.Avian Medicine (1972) M.L.A. (1957) 5 2 M.Ag.Ext. (1964) 4 3 M.For.Res . (1950) 5 8 M.Art .Ed . (1953) 12 7 M.Edu . (1932) 515 532 M.Pub.Adm. (1967) 22 20 M.Bus .Adm. (1950) 42 112 M.Acc . (1964) 11 19 M.Soc.Work (1964) 54 53 M.Home Ec. (1928) 7 4 L.L.M. (1970) 2 M.A.T. (1975) M.P.P.P.M . (1974)
Total Master's Degrees 946 1,089
TOTAL Graduate Degrees 1,121 1 ,496
UNDERGRADUATE DEGREES
Agriculture B.S.A. (1915) 256 B.S.A.E . (1931) 22 B.S.E.H. (1971) B.L.A. & B.S.L.A. 22
Total Agriculture 300
Arts & Sciences A.B. (1910) 575 B.S. (1910) 322 B.SChem . (1950) 9 B.F.A. (1934) 99 B.Mus . (1959) 29 B.S.Physics (1960) 3
Total Arts & Sciences 1,037
Business Administration B.B.A. (1915) 720
Education B.S.Ed . (1915) 786
219 27
246
576 289
11 105 34
8 1,023
770
855
182 90
272
640
120 164
36 17
4 5
10 5
653 45
142 10 64 11 3
1,289
2,201
201 23
2
226
589 269
3 134 26
2 1,023
873
849
214 102
317
170
167 156 39 16 3 4 4 2
15 788
40 120
20 46
0 3
1,423
1,910
224 15 12
251
594 283
5 127 30
1,040
786
968
58
209 96
1 306
170
189 89
4 282
166
128 121 187 184 45 33 11 19
1 3 5 6 4 5 7 8 9 7
927 935 43 38
117 122 24 34 87 96
8 4 0 0 0
1,604 1,615
2,080 2,063
206 20 24
250
568 294
6 126
51 1
1,046
822
876
234 22 26
282
672 289
1 181 43
1,187
785
848
159 73
6 238
157
98 140 44
5 0 6 4 3 8
829 31
144 25 76
8
1
0 1,423
1,818
250 12 21
283
555 301
3 150 38
1 1,048
787
764
204 83
1 288
174
96 139 38
2 1 9 3 2 9
930 32
152 38 88
7 1 5 2
1,554
2,016
295 13 22
330
539 349
6 167 43
1,105
800
731
196 59
3 258
211
206 66
5 277
158
115 109 162 202
41 61 14 12
0 3 7 13 4 0 6 5 9 8
707 550 28 27
135 108 50 29 89 65
5 8 0 0 4 5 4 5
1,380 1,210
1,849 1,645
363 13 40
416
486 303
0 146 37
1 973
807
680
408 11 30
449
474 296
1 163 42
0 976
865
673
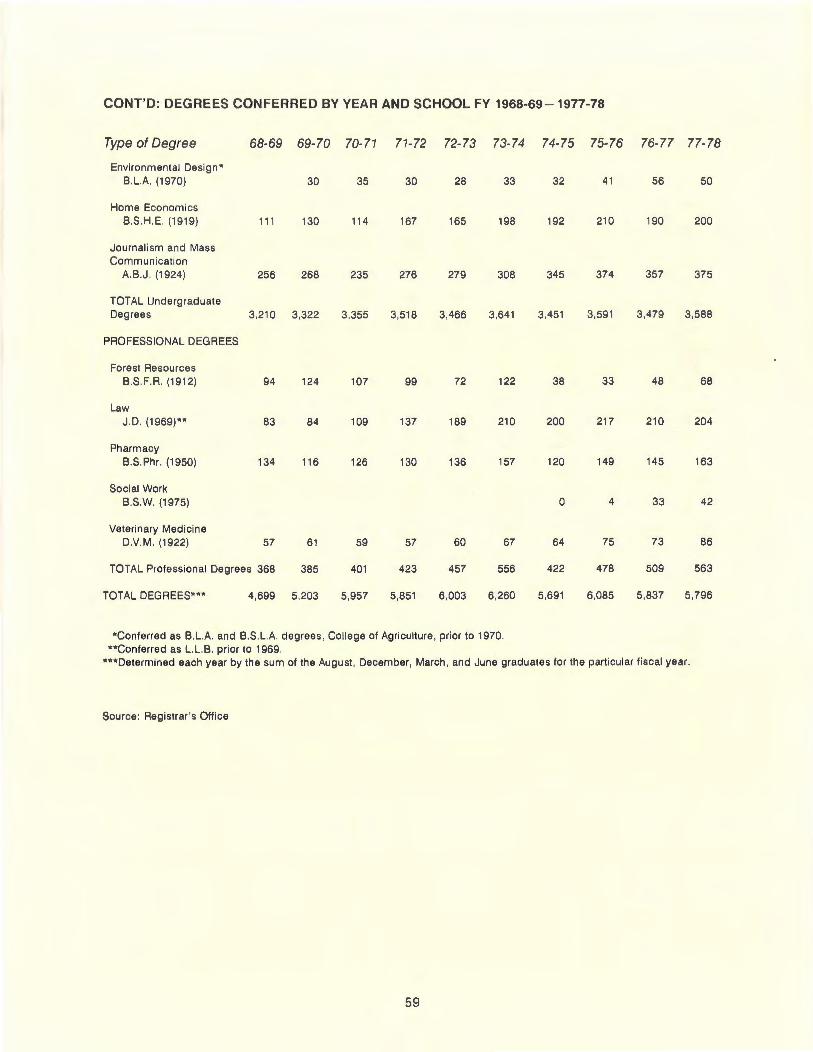
CONT'D: DEGREES CONFERRED BY YEAR AND SCHOOL FY 1968-69 - 1977-78
Type of Degree 68-69 69-70 70-71 71-72 72-73 73-74 74-75 75-76 76-77 77-78
Environmental Design• B.L.A (1970) 30 35 30 28 33 32 41 56 50
Home Economics B.S.H.E. (1919) 111 130 114 167 165 198 192 210 190 200
Journalism and Mass Communication
A.B.J . (1924) 256 268 235 276 279 308 345 374 357 375
TOTAL Undergraduate Degrees 3,210 3,322 3,355 3,518 3,466 3,641 3,451 3,591 3,479 3,588
PROFESSIONAL DEGREES
Forest Resources B S.F.R (1912) 94 124 107 99 72 122 38 33 48 68
Law J.D. (1969)** 83 84 109 137 189 210 200 217 210 204
Pharmacy B.S.Phr . (1950) 134 116 126 130 136 157 120 149 145 163
Social Work B.S.W. (1975) 0 4 33 42
Veterinary Medicine D.V.M. (1922) 57 61 59 57 60 67 64 75 73 86
TOTAL Professional Degrees 368 385 401 423 457 556 422 478 509 563
TOTAL DEGREES••• 4,699 5,203 5,957 5,851 6,003 6,260 5,691 6,085 5,837 5,796
•conferred as B. L.A. and B.S. LA degrees , College of Agriculture, prior to 1970. ••conferred as L.L.B. prior to 1969.
•••Determined each year by the sum of the August , December, March, and June graduates for the particular fiscal year .
Source : Registrar's Office
59
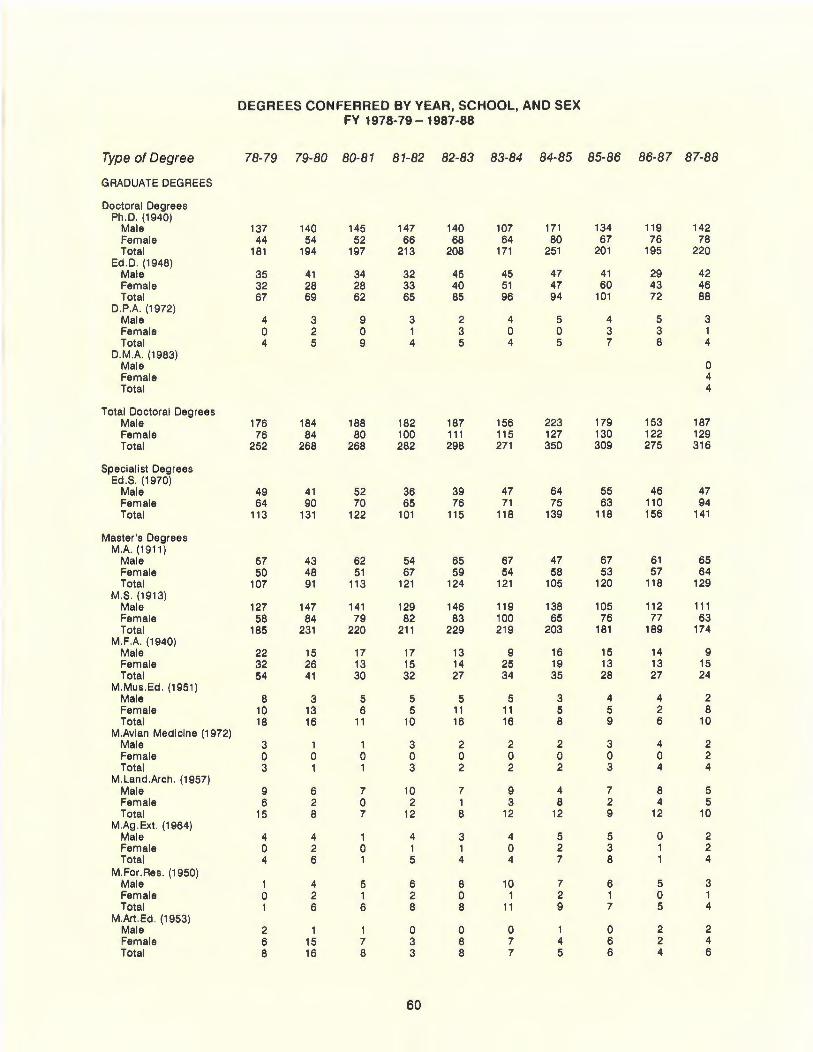
DEGREES CONFERRED BY YEAR, SCHOOL, AND SEX FY 1978-79 - 1987-88
Type of Degree 78-79 79-80 80-81 81-82 82-83 83-84 84-85 85-86 86-87 87-88
GRADUATE DEGREES
Doctoral Degrees Ph.D. (1940)
Male 137 140 145 147 140 107 171 134 119 142 Female 44 54 52 66 68 64 80 67 76 78 Total 181 194 197 213 208 171 251 201 195 220
Ed .D. (1948) Male 35 41 34 32 45 45 47 41 29 42 Female 32 28 28 33 40 51 47 60 43 46 Total 67 69 62 65 85 96 94 101 72 88
D.P.A. (1972) Male 4 3 9 3 2 4 5 4 5 3 Female 0 2 0 1 3 0 0 3 3 1 Total 4 5 9 4 5 4 5 7 8 4
D.M.A. (1983) Male 0 Female 4 Total 4
Total Doctoral Degrees Male 176 184 188 182 187 156 223 179 153 187 Female 76 84 80 100 111 115 127 130 122 129 Total 252 268 268 282 298 271 350 309 275 316
Specialist Degrees Ed.S. (1970)
Male 49 41 52 36 39 47 64 55 46 47 Female 64 90 70 65 76 71 75 63 110 94 Total 113 131 122 101 115 118 139 118 156 141
Master's Degrees M.A. (1911)
Male 57 43 62 54 65 67 47 67 61 65 Female 50 48 51 67 59 54 58 53 57 64 Total 107 91 113 121 124 121 105 120 118 129
M.S. (1913) Male 127 147 141 129 146 119 138 105 112 111 Female 58 84 79 82 83 100 65 76 77 63 Total 185 231 220 211 229 219 203 181 189 174
M.F.A. (1940) Male 22 15 17 17 13 9 16 15 14 9 Female 32 26 13 15 14 25 19 13 13 15 Total 54 41 30 32 27 34 35 28 27 24
M.Mus .Ed. (1951) Male 8 3 5 5 5 5 3 4 4 2 Female 10 13 6 5 11 11 5 5 2 8 Total 18 16 11 10 16 16 8 9 6 10
M.Avian Medicine (1972) Male 3 1 1 3 2 2 2 3 4 2 Female 0 0 0 0 0 0 0 0 0 2 Total 3 1 1 3 2 2 2 3 4 4
M.Land.Arch. (1957) Male 9 6 7 10 7 9 4 7 8 5 Female 6 2 0 2 1 3 8 2 4 5 Total 15 8 7 12 8 12 12 9 12 10
M.Ag.Ext. (1964) Male 4 4 1 4 3 4 5 5 0 2 Female 0 2 0 1 1 0 2 3 1 2 Total 4 6 1 5 4 4 7 8 1 4
M.For .Res. (1950) Male 1 4 5 6 8 10 7 6 5 3 Female 0 2 1 2 0 1 2 1 0 1 Total 1 6 6 8 8 11 9 7 5 4
M.Art .Ed. (1953) Male 2 1 1 0 0 0 1 0 2 2 Female 6 15 7 3 8 7 4 6 2 4 Total 8 16 8 3 8 7 5 6 4 6
60
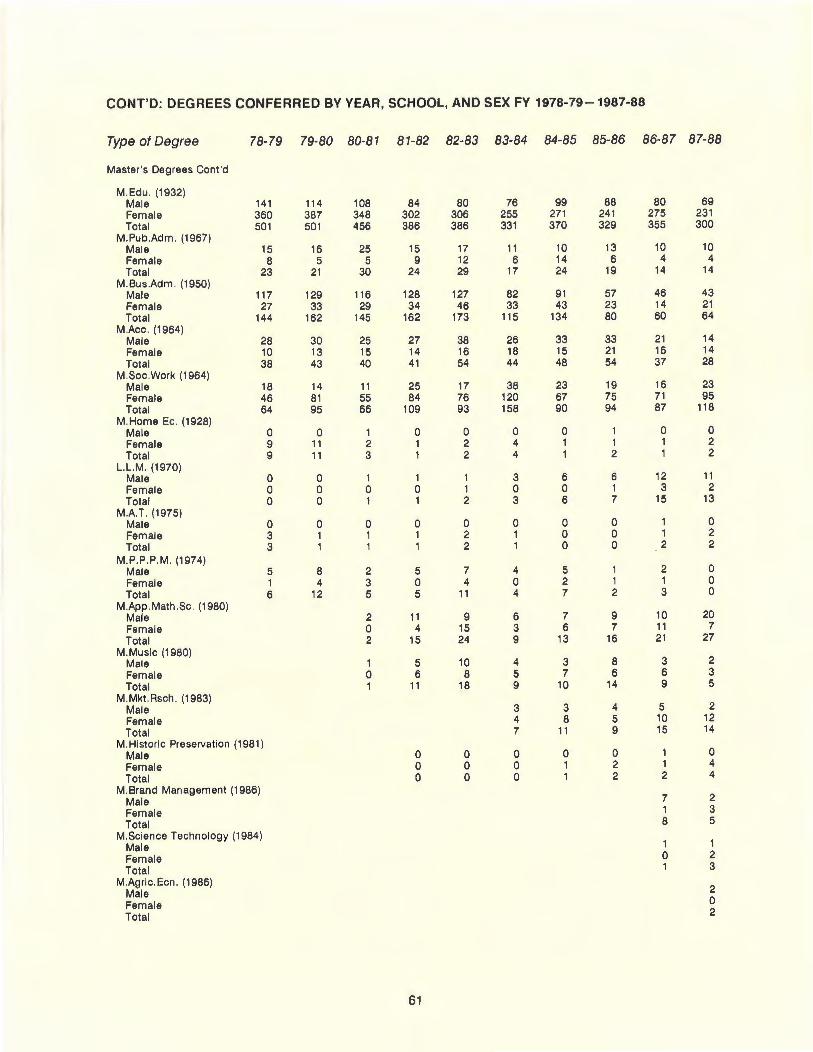
CONT'D: DEGREES CONFERRED BY YEAR, SCHOOL, AND SEX FY 1978-79-1987-88
Type of Degree 78-79 79-80 80-81 81-82 82-83 83-84 84-85 85-86 86-87 87-88
Master's Degrees Cont 'd
M.Edu. (1932) Male 141 114 108 84 80 76 99 88 80 69 Female 360 387 348 302 306 255 271 241 275 231 Total 501 501 456 386 386 331 370 329 355 300
M.Pub .Adm. (196'7) Male 15 16 25 15 17 11 10 13 10 10 Female 8 5 5 9 12 6 14 6 4 4 Total 23 21 30 24 29 17 24 19 14 14
M.Bus.Adm . (1950) Male 117 129 116 128 127 82 91 57 46 43 Female 27 33 29 34 46 33 43 23 14 21 Total 144 162 145 162 173 115 134 80 60 64
M.Acc. (1964) Male 28 30 25 27 38 26 33 33 21 14 Female 10 13 15 14 16 18 15 21 16 14 Total 38 43 40 41 54 44 48 54 37 28
M.Soc.Work (1964) Male 18 14 11 25 17 38 23 19 16 23 Female 46 81 55 84 76 120 67 75 71 95 Total 64 95 66 109 93 158 90 94 87 118
M.Home Ec . (1928) Male 0 0 1 0 0 0 0 1 0 0 Female 9 11 2 1 2 4 1 1 1 2 Total 9 11 3 1 2 4 1 2 1 2
L.L.M. (1970) Male 0 0 1 1 1 3 6 6 12 11 Female 0 0 0 0 1 0 0 1 3 2 Total 0 0 1 1 2 3 6 7 15 13
M.A.T. (1975) Male 0 0 0 0 0 0 0 0 1 0 Female 3 1 1 1 2 1 0 0 1 2 Total 3 1 1 1 2 1 0 0 2 2
M.P.P.P.M. (1974) Male 5 8 2 5 7 4 5 1 2 0 Female 1 4 3 0 4 0 2 1 1 0 Total 6 12 5 5 11 4 7 2 3 0
M.App .Math .Sc . (1980) Male 2 11 9 6 7 9 10 20
Female 0 4 15 3 6 7 11 7 Total 2 15 24 9 13 16 21 27
M. Music (1980) Male 1 5 10 4 3 8 3 2
Female 0 6 8 5 7 6 6 3 Total 1 11 18 9 10 14 9 5
M.Mkt.Rsch . (1983) Male 3 3 4 5 2
Female 4 8 5 10 12
Total 7 11 9 15 14
M. Historic Preservation (1981) 0 Male 0 0 0 0 0 1
Female 0 0 0 1 2 1 4
Total 0 0 0 1 2 2 4
M.Brand Management (1986) 2 Male 7
Female 1 3
Total 8 5
M.Science Technology (1984) 1 Male 1
Female 0 2
Total 1 3
M.Agric .Ecn . (1986) 2 Male
Female 0
Total 2
61
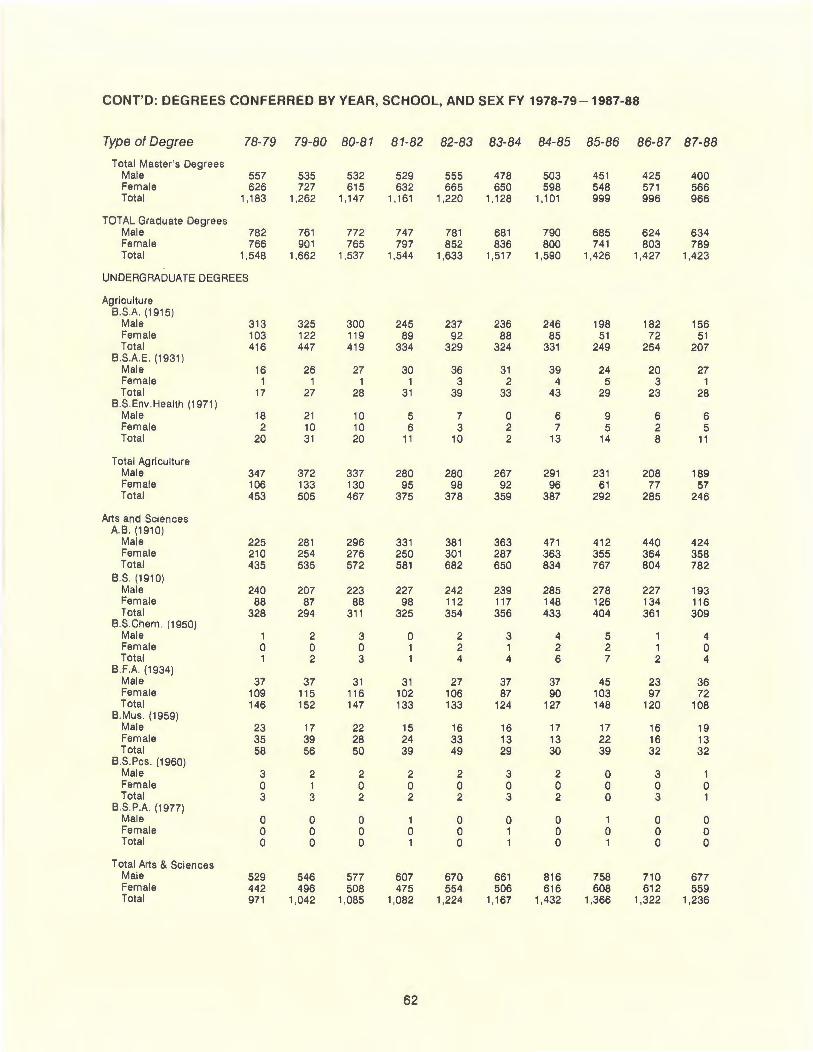
CONT'D: DEGREES CONFERRED BY YEAR, SCHOOL, AND SEX FY 1978-79-1987-88
Type of Degree 78-79 79-80 80-81 81-82 82-83 83-84 84-85 85-86 86-87 87-88
Total Master 's Degrees Male 557 535 532 529 555 478 503 451 425 400 Female 626 727 615 632 665 650 598 548 571 566 Total 1,183 1,262 1,147 1,161 1,220 1,128 1,101 999 996 966
TOTAL Graduate Degrees Male 782 761 772 747 781 681 790 685 624 634 Female 766 901 765 797 852 836 800 741 803 789 Total 1,548 1,662 1,537 1,544 1,633 1,517 1,590 1,426 1,427 1,423
UNDERGRADUAT E DEGREES
Agriculture B.S.A. (1915)
Male 313 325 300 245 237 236 246 198 182 156 Female 103 122 119 89 92 88 85 51 72 51 Total 416 447 419 334 329 324 33 1 249 254 207
B.S.A.E. (1931) Male 16 26 27 30 36 31 39 24 20 27 Female 1 1 1 1 3 2 4 5 3 1 Total 17 27 28 31 39 33 43 29 23 28
B.S.Env.Health (1971) Male 18 21 10 5 7 0 6 9 6 6 Female 2 10 10 6 3 2 7 5 2 5 Total 20 31 20 11 10 2 13 14 8 11
Total Agriculture Male 347 372 337 280 280 267 291 231 208 189 Female 106 133 130 95 98 92 96 61 77 57 Total 453 505 467 375 378 359 387 292 285 246
Arts and Sciences A.B . (1910)
Male 225 281 296 331 381 363 471 412 440 424 Female 210 254 276 250 301 287 363 355 364 358 Total 435 535 572 581 682 650 834 767 804 782
B.S. (1910) Male 240 207 223 227 242 239 285 278 227 193 Female 88 87 88 98 11 2 117 148 126 134 116 Total 328 294 311 325 354 356 433 404 361 309
B.S.Chem . (1950) Male 1 2 3 0 2 3 4 5 1 4 Female 0 0 0 1 2 1 2 2 1 0 Total 1 2 3 1 4 4 6 7 2 4
B.FA. (1934) Male 37 37 31 31 27 37 37 45 23 36 Female 109 115 116 102 106 87 90 103 97 72 Total 146 152 147 133 133 124 127 148 120 108
B.Mus. (1959) Male 23 17 22 15 16 16 17 17 16 19 Female 35 39 28 24 33 13 13 22 16 13 Total 58 56 50 39 49 29 30 39 32 32
B.S.Pcs . (1960) Male 3 2 2 2 2 3 2 0 3 1 Female 0 1 0 0 0 0 0 0 0 0 Total 3 3 2 2 2 3 2 0 3 1
B SPA (1977) Male 0 0 0 1 0 0 0 1 0 0 Female 0 0 0 0 0 1 0 0 0 0 Total 0 0 0 1 0 1 0 1 0 0
Total Arts & Sciences Male 529 546 577 607 670 661 816 758 710 677 Female 442 496 508 475 554 506 616 608 612 559 Total 971 1,042 1,085 1,082 1,224 1,167 1,432 1,366 1,322 1,236
62
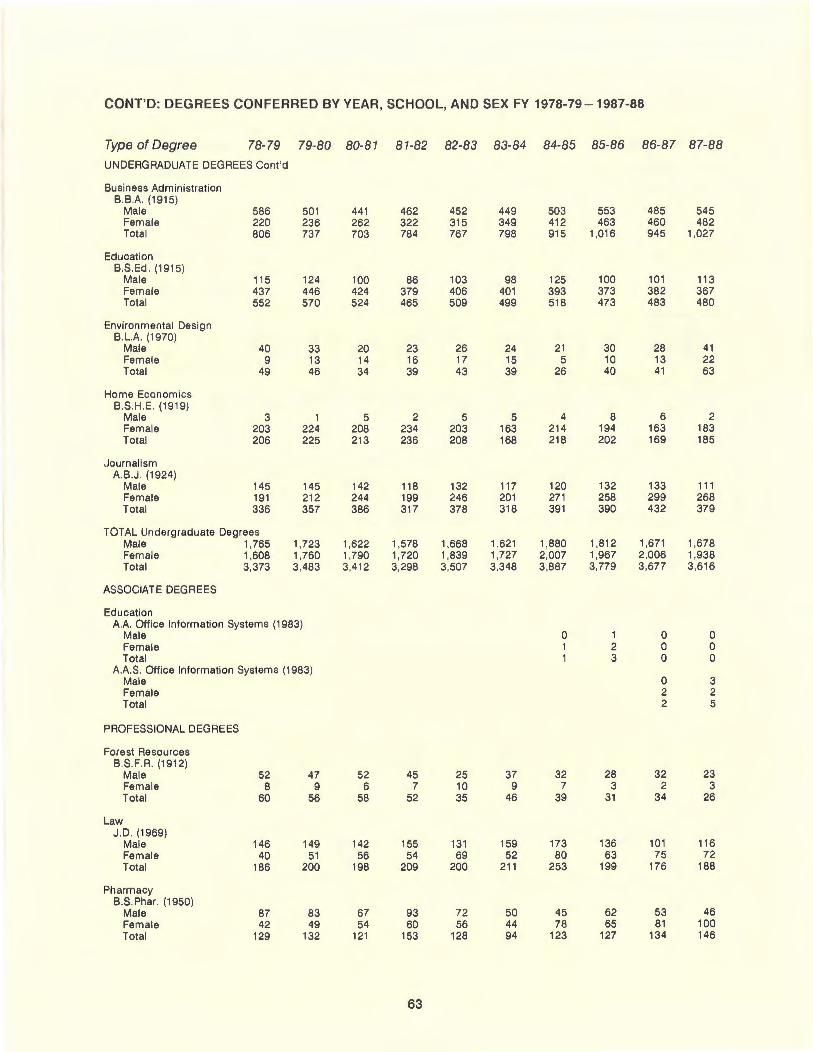
CONT'D: DEGREES CONFERRED BY YEAR, SCHOOL, AND SEX FY 1978-79 - 1987-88
Type of Degree 78-79 79-80 80-81 81-82 82-83 83-84 84-85 85-86 86-87 87-88
UNDERGRADUATE DEGREES Cont'd
Business Administration B.B.A. (1915)
Male 586 501 441 462 452 449 503 553 485 545 Female 220 236 262 322 315 349 412 463 460 482 Total 806 737 703 784 767 798 915 1,016 945 1,027
Education B.S.Ed. (1915)
Male 115 124 100 86 103 98 125 100 101 113 Female 437 446 424 379 406 401 393 373 382 367 Total 552 570 524 465 509 499 518 473 483 480
Environmental Design B.L.A. (1970)
Male 40 33 20 23 26 24 21 30 28 41 Female 9 13 14 16 17 15 5 10 13 22 Total 49 46 34 39 43 39 26 40 41 63
Home Economics B.S.H.E (1919)
Male 3 1 5 2 5 5 4 8 6 2 Female 203 224 208 234 203 163 214 194 163 183 Total 206 225 213 236 208 168 218 202 169 185
Journalism A.B.J . (1924)
Male 145 145 142 118 132 117 120 132 133 111 Female 191 212 244 199 246 201 271 258 299 268 Total 336 357 386 317 378 318 391 390 432 379
TOTAL Undergraduate Degrees Male 1,765 1,723 1,622 1,578 1,668 1,621 1,880 1,812 1,671 1,678 Female 1,608 1,760 1,790 1,720 1,839 1,727 2,007 1,967 2,006 1,938 Total 3,373 3,483 3,412 3,298 3,507 3,348 3,887 3,779 3,677 3,616
ASSOCIATE DEGREES
Education A.A. Office Information Systems (1983)
Male 0 1 0 0 Female 1 2 0 0 Total 1 3 0 0
A.A.S. Office Information Systems (1983) Male 0 3 Female 2 2 Total 2 5
PROFESSIONAL DEGREES
Forest Resources B.S .F.R. (1912)
Male 52 47 52 45 25 37 32 28 32 23 Female 8 9 6 7 10 9 7 3 2 3 Total 60 56 58 52 35 46 39 31 34 26
Law J.D . (1969)
Male 146 149 142 155 131 159 173 136 101 116 Female 40 51 56 54 69 52 80 63 75 72 Total 186 200 198 209 200 211 253 199 176 188
Pharmacy B.S.Phar. (1950)
Male 87 83 67 93 72 50 45 62 53 46 Female 42 49 54 60 56 44 78 65 81 100 Total 129 132 121 153 128 94 123 127 134 146
63
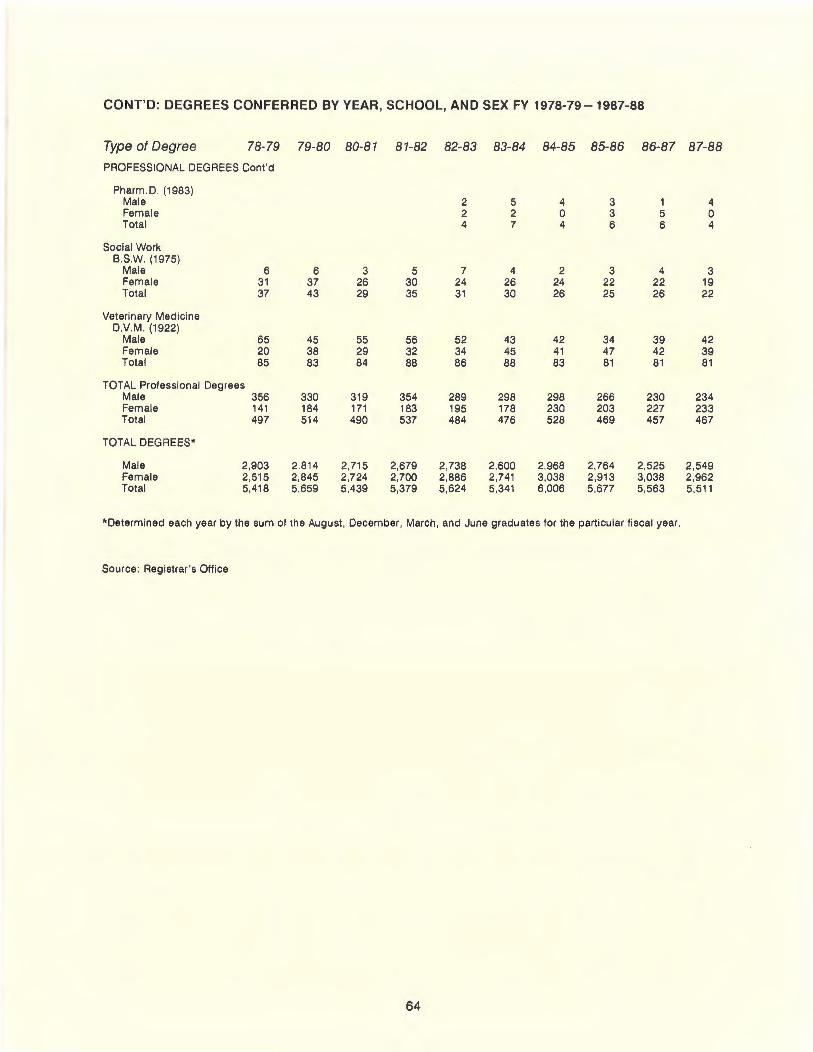
CONT'D: DEGREES CONFERRED BY YEAR, SCHOOL, AND SEX FY 1978-79 - 1987-88
Type of Degree 78-79 79-80 80-81 81-82 82-83 83-84 84-85 85-86 86-87 87-88
PROFESSIONAL DEGREES Cont 'd
Pharm .D. (1983) Male 2 5 4 3 1 4 Female 2 2 0 3 5 0 Total 4 7 4 6 6 4
Social Work B.S.W. (1975)
Male 6 6 3 5 7 4 2 3 4 3 Female 31 37 26 30 24 26 24 22 22 19 Total 37 43 29 35 31 30 26 25 26 22
Veterinary Medicine D.V.M. (1922)
Male 65 45 55 56 52 43 42 34 39 42 Female 20 38 29 32 34 45 41 47 42 39 Total 85 83 84 88 86 88 83 81 81 81
TOTAL Professional Degrees Male 356 330 319 354 289 298 298 266 230 234 Female 141 184 171 183 195 178 230 203 227 233 Total 497 514 490 537 484 476 528 469 457 467
TOTAL DEGREES•
Male 2,903 2,814 2,715 2,679 2, 738 2,600 2,968 2,764 2,525 2,549 Female 2,515 2,845 2,724 2,700 2,886 2,741 3,038 2,913 3,038 2,962 Total 5,418 5,659 5,439 5,379 5,624 5,341 6,006 5,677 5,563 5,511
*Determined each year by the sum of the August , December , March, and June graduates for the particular fiscal year .
Source : Registrar's Office
64
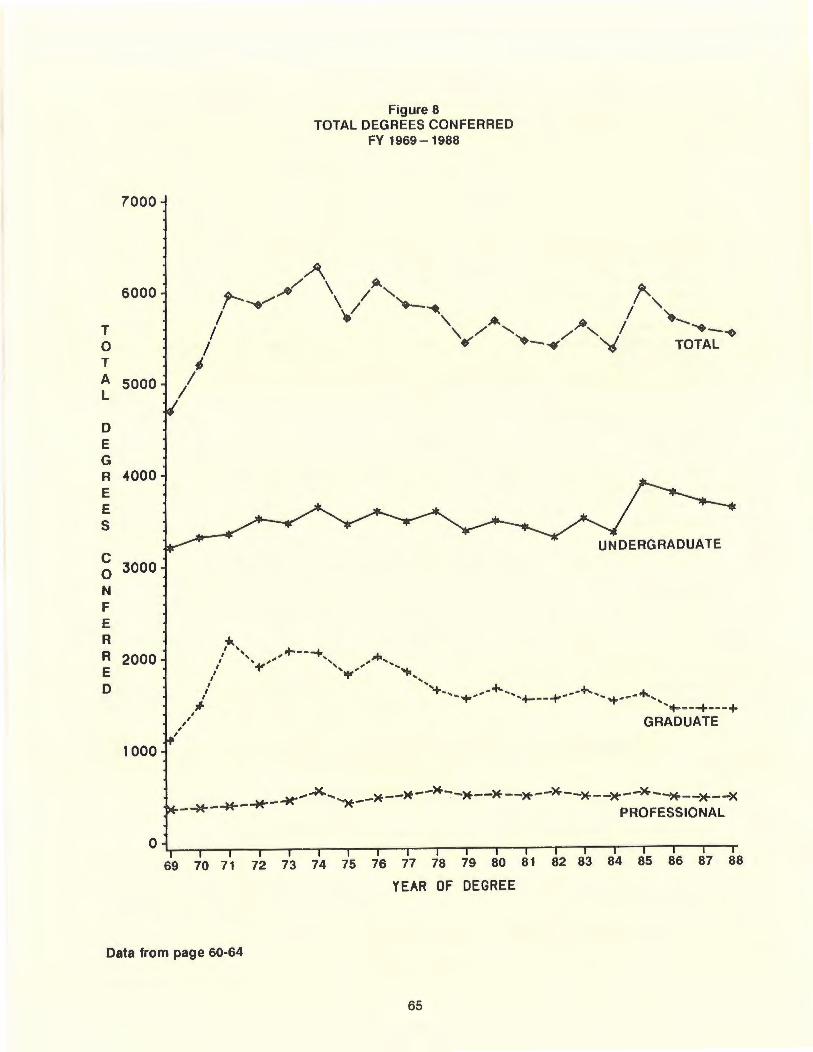
7000
6000
T 0 T A 5000 L
D E G R 4000 E E s
g 3000
N F E R
R 2000 E D
1000
Figure 8 TOTAL DEGREES CONFERRED
FY 1969-1988
~'~' ~-->+-->+-->+-->+--~-->+--~--~--*--~ ~ ~ - --M---M--....... ')+--"' ,.. ,... " ,...--....---" "* PROFESSIONAL
69 70 71 72 73 74 75 76 77 78 79 80 81 82 83 84 85 86 87 88
YEAR OF DEGREE
Data from page 60-64
65
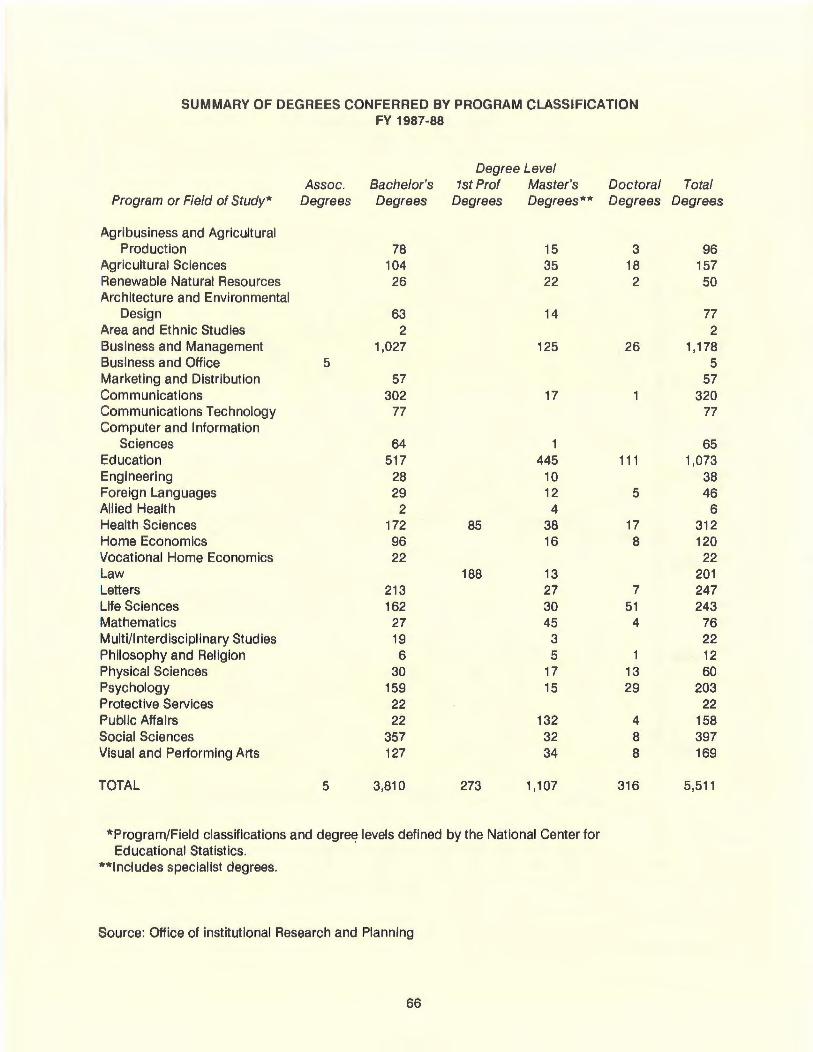
SUMMARY OF DEGREES CONFERRED BY PROGRAM CLASSIFICATION FY 1987-88
Degree Level Assoc. Bachelor's 1st Prof Master's Doctoral Total
Program or Field of Study* Degrees Degrees Degrees Degrees** Degrees Degrees
Agribusiness and Agricultural Production 78 15 3 96
Agricultural Sciences 104 35 18 157 Renewable Natural Resources 26 22 2 50 Architecture and Environmental
Design 63 14 77 Area and Ethnic Studies 2 2 Business and Management 1,027 125 26 1 '178 Business and Office 5 5 Marketing and Distribution 57 57 Communications 302 17 320 Communications Technology 77 77 Computer and Information
Sciences 64 65 Education 517 445 111 1,073 Engineering 28 10 38 Foreign Languages 29 12 5 46 Allied Health 2 4 6 Health Sciences 172 85 38 17 312 Home Economics 96 16 8 120 Vocational Home Economics 22 22 Law 188 13 201 Letters 213 27 7 247 Life Sciences 162 30 51 243 Mathematics 27 45 4 76 Multi/Interdisciplinary Studies 19 3 22 Philosophy and Religion 6 5 12 Physical Sciences 30 17 13 60 Psychology 159 15 29 203 Protective Services 22 22 Public Affairs 22 132 4 158 Social Sciences 357 32 8 397 Visual and Performing Arts 127 34 8 169
TOTAL 5 3,810 273 1 '1 07 316 5,511
*Program/Field classifications and degree levels defined by the National Center for Educational Statistics.
** Includes specialist degrees.
Source: Office of institutional Research and Planning
66
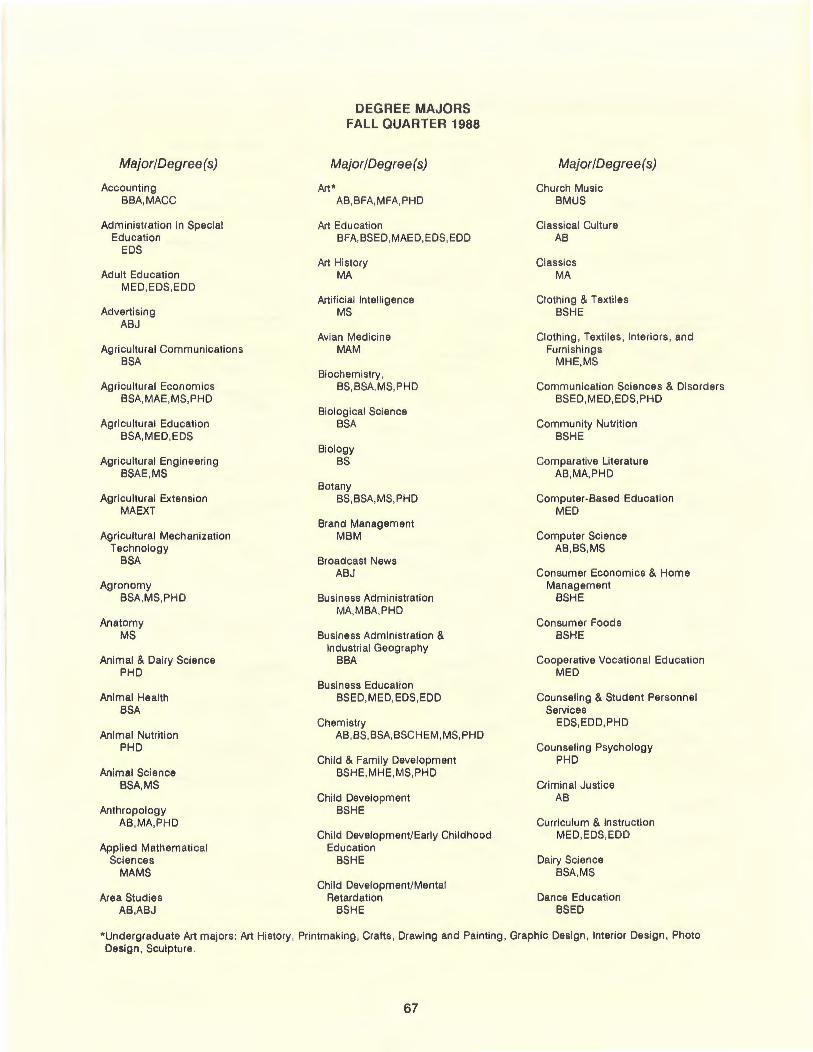
Major/Degree(s)
Accounting BBA,MACC
Administration in Special Education
EDS
Adult Education MED,EDS,EDD
Advertising ABJ
Agricultural Communications BSA
Agricultural Economics BSA,MAE,MS,PHD
Agricultural Education BSA,MED,EDS
Agricultural Engineering BSAE,MS
Agricultural Extension MAEXT
Agricultural Mechanization Technology
BSA
Agronomy BSA,MS,PHD
Anatomy MS
Animal & Dairy Science PHD
Animal Health BSA
Animal Nutrition PHD
Animal Science BSA,MS
Anthropology AB,MA,PHD
Applied Mathematical Sciences
MAMS
Area Studies AB,ABJ
DEGREE MAJORS FALL QUARTER 1988
Major/Degree(s)
Art* AB,BFA,MFA,PHD
Art Education BFA,BSED,MAED,EDS,EDD
Art History MA
Artificial Intelligence MS
Avian Medicine MAM
Biochemistry , BS, BSA, MS, PHD
Biological Science BSA
Biology BS
Botany BS,BSA,MS,PHD
Brand Management MBM
Broadcast News ABJ
Business Administration MA,MBA,PHD
Business Administration & Indu strial Geography
BBA
Business Education BSED,MED,EDS,EDD
Chemistry AB,BS,BSA,BSCHEM,MS,PHD
Child & Family Development BSHE,MHE,MS,PHD
Child Development BSHE
Child Development/Early Childhood Education
BSHE
Child Development/Mental Retardation
BSHE
Major/Degree(s)
Church Music BMUS
Classical Culture AB
Classics MA
Clothing & Textiles BSHE
Clothing, Textiles , Interiors , and Furnishings
MHE,MS
Communication Sciences & Disorders BSED,MED,EDS,PHD
Community Nutrition BSHE
Comparative Literature AB,MA,PHD
Computer-Based Education MED
Computer Science AB,BS,MS
Consumer Economics & Home Management
BSHE
Consumer Foods BSHE
Cooperative Vocational Education MED
Counseling & Student Personnel Services
EDS,EDD,PHD
Counseling Psychology PHD
Criminal Justice AB
Curricu lum & Instruction MED,EDS,EDD
Dairy Science BSA,MS
Dance Education BSED
*Undergraduate Art majors: Art History, Printmaking , Crafts, Drawing and Painting, Graphic Design, Interior Design, Photo Design, Scu lpture.
67
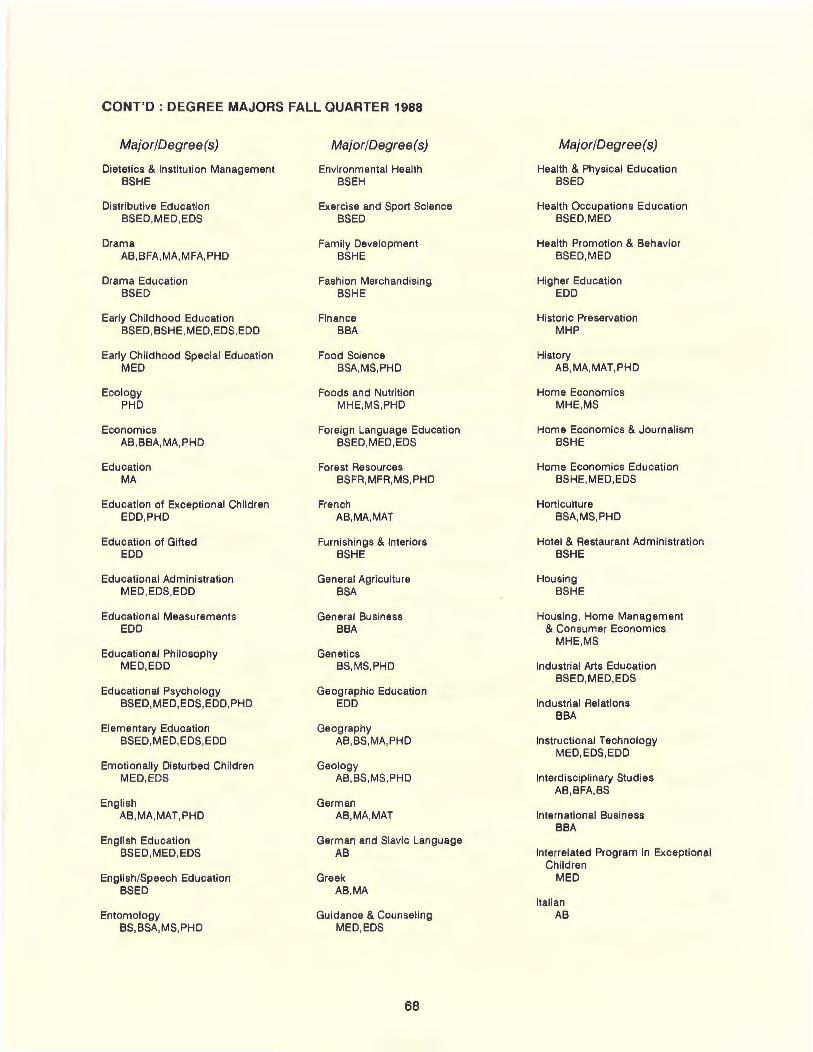
CONT'D: DEGREE MAJORS FALL QUARTER 1988
Major/Degree(s)
Dietetics & Institution Management BSHE
Distributive Education BSED,MED,EDS
Drama AB,BFA,MA,MFA,PHD
Drama Education BSED
Early Childhood Education BSED, BSHE, MED, EDS,EDD
Early Childhood Special Education MED
Ecology PHD
Economics AB,BBA,MA,PHD
Education MA
Education of Exceptional Children EDD,PHD
Education of Gifted EDD
Educational Administration MED,EDS,EDD
Educational Measurements EDD
Educational Philosophy MED,EDD
Educational Psychology BSED,MED,EDS,EDD,PHD
Elementary Education BSED,MED,EDS,EDD
Emotionally Disturbed Children MED,EDS
English AB,MA,MAT,PHD
English Education BSED,MED,EDS
English/Speech Education BSED
Entomology BS,BSA,MS,PHD
Major/Degree(s)
Environmental Health BSEH
Exercise and Sport Science BSED
Family Development BSHE
Fashion Merchandising BSHE
Finance BBA
Food Science BSA,MS,PHD
Foods and Nutrition MHE,MS,PHD
Foreign Language Education BSED,MED,EDS
Forest Resources BSFR,MFR,MS,PHD
French AB,MA,MAT
Furnishings & Interiors BSHE
General Agriculture BSA
General Business BBA
Genetics BS,MS,PHD
Geographic Education EDD
Geography AB,BS,MA,PHD
Geology AB,BS,MS,PHD
German AB,MA,MAT
German and Slavic Language AB
Greek AB,MA
Guidance & Counseling MED,EDS
68
Major/Degree(s)
Health & Physical Education BSED
Health Occupations Education BSED,MED
Health Promotion & Behavior BSED,MED
Higher Education EDD
Historic Preservation MHP
History AB,MA,MAT,PHD
Home Economics MHE,MS
Home Economics & Journalism BSHE
Home Economics Education BSHE,MED,EDS
Horticulture BSA,MS,PHD
Hotel & Restaurant Administration BSHE
Housing BSHE
Housing , Home Management & Consumer Economics
MHE,MS
Industrial Arts Education BSED,MED,EDS
Industrial Relations BBA
Instructional Technology MED,EDS,EDD
Interdisciplinary Studies AB,BFA,BS
International Business BBA
Interrelated Program in Exceptional Children
MED
Italian AB
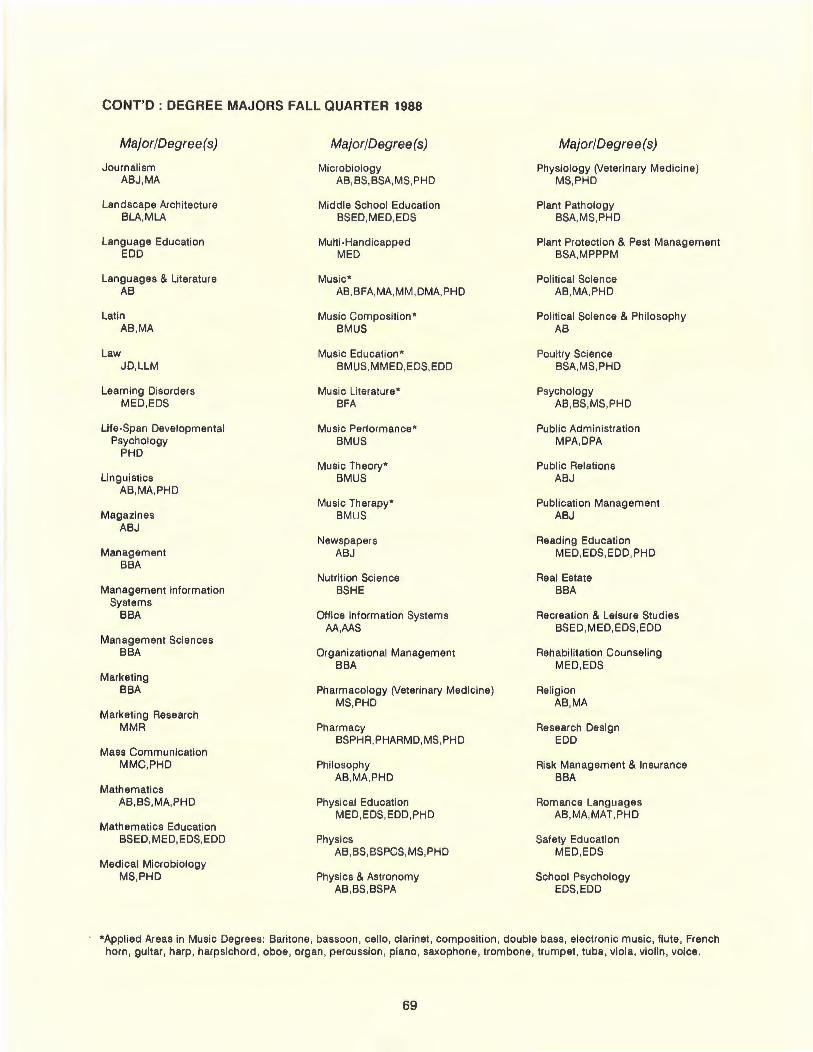
CONT'D: DEGREE MAJORS FALL QUARTER 1988
Major/Degree(s)
Journalism ABJ,MA
Landscape Architecture BLA,MLA
Language Education EDD
Languages & Literature AB
Latin AB,MA
Law JD,LLM
Learning Disorders MED,EDS
Life-Span Developmental Psychology
PHD
Linguistics AB,MA,PHD
Magazines ABJ
Management BBA
Management Information Systems
BBA
Management Sciences BBA
Marketing BBA
Marketing Research MMR
Mass Communication MMC,PHD
Mathematics AB,BS,MA,PHD
Mathematics Education BSED,MED,EDS,EDD
Medical Microbiology MS,PHD
Major/Degree(s)
Microbiology AB,BS,BSA,MS,PHD
Middle School Education BSED,MED,EDS
Multi-Handicapped MED
Music* AB ,BFA,MA,MM,DMA,PHD
Music Composition* BMUS
Music Education * BMUS,MMED,EDS,EDD
Music Literature* BFA
Music Pertormance* BMUS
Music Theory* BMUS
Music Therapy* BMLJS
Newspapers ABJ
Nutrition Science BSHE
Office Information Systems AA,AAS
Organizational Management BBA
Pharmacology (Veterinary Medicine) MS,PHD
Pharmacy BSPHR,PHARMD,MS,PHD
Philosophy AB ,MA,PHD
Physical Education MED,EDS,EDD,PHD
Physics AB, BS, BSPCS, MS, PHD
Physics & Astronomy AB,BS,BSPA
Major/Degree(s)
Physiology (Veterinary Medicine) MS,PHD
Plant Pathology BSA,MS,PHD
Plant Protection & Pest Management BSA,MPPPM
Political Science AB,MA,PHD
Political Science & Philosophy AB
Poultry Science BSA,MS,PHD
Psychology AB,BS,MS,PHD
Public Administration MPA,DPA
Public Relations ABJ
Publication Management ABJ
Reading Education MED,EDS,EDD ,PHD
Real Estate BBA
Recreation & Leisure Studies BSED,MED,EDS,EDD
Rehabilitation Counseling MED,EDS
Religion AB,MA
Research Design EDD
Risk Management & Insurance BBA
Romance Languages AB,MA,MAT,PHD
Safety Education MED,EDS
School Psychology EDS,EDD
*Applied Areas in Music Degrees: Baritone , bassoon , cello , clarinet, composition, double bass , electronic music , flute, French horn , guitar, harp, harpsichord, oboe , organ, percussion , piano, saxophone, trombone, trumpet , tuba, viola, violin , voice.
69
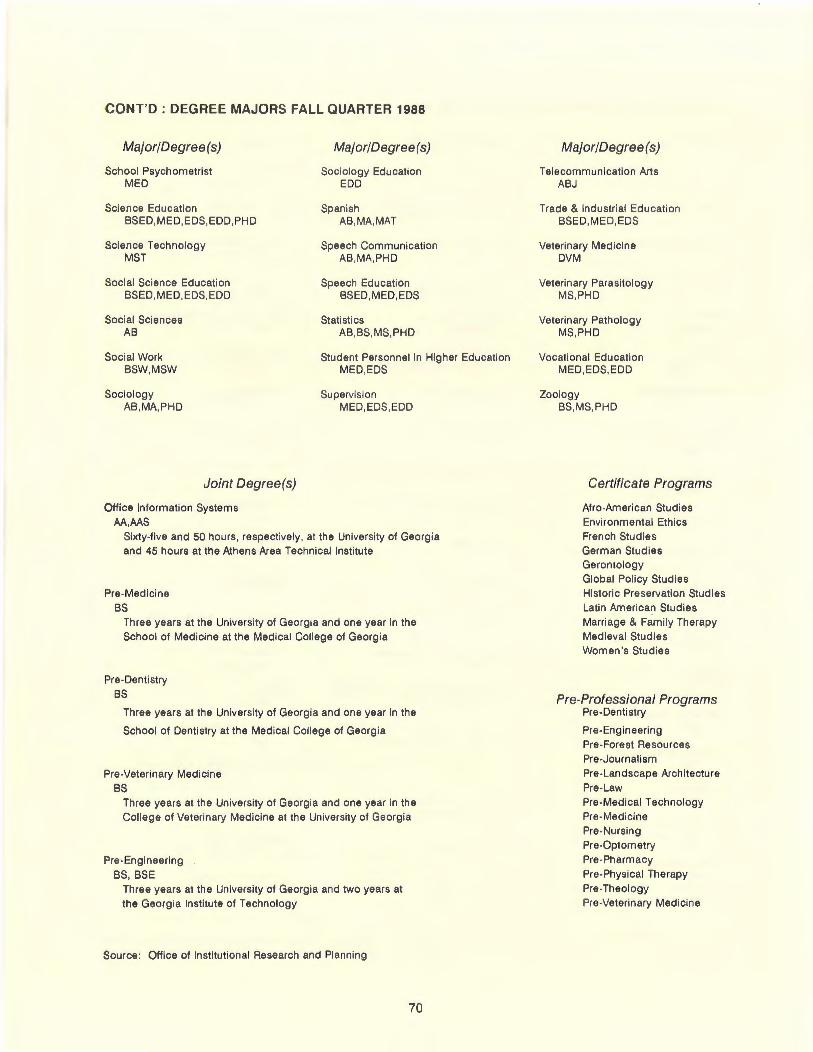
CONT'D: DEGREE MAJORS FALL QUARTER 1988
Major/Degree(s)
School Psychometrist MED
Science Education BSED,MED,EDS,EDD,PHD
Science Technology MST
Social Science Education BSED,MED,EDS,EDD
Social Sciences AB
Social Work BSW,MSW
Sociology AB ,MA,PHD
Joint Degree(s)
Office Information Systems AA,AAS
Major/Degree(s)
Sociology Education EDD
Spanish AB ,MA,MAT
Speech Communication AB,MA,PHD
Speech Education BSED,MED,EDS
Statistics AB ,BS,MS ,PHD
Student Personnel in Higher Education MED,EDS
Supervision MED ,EDS,EDD
Sixty-five and 50 hours, respectively , at th e University of Georgia and 45 hours at the Athens Area Technical Institute
Pre-Medicine
BS Three years at the University of Georgi a and one year in the School of Medicine at the Medical College of Georgia
Pre-Dentistry
BS
Three years at the University of Georgia and one year in the
School of Dentistry at the Medical College of Georgia
Pre -Veterinary Medicine
BS Three years at the University of Georgia and one year in the College of Veterinary Medicine at the University of Georg ia
Pre-Engineering
BS, BSE Three years at the University of Georgia and two years at
the Georgia Institute of Technology
Source: Office of Institutional Research and Planning
70
Major/Degree(s)
Telecommunication Arts ABJ
Trade & Indu strial Education BSED,MED,EDS
Veterinary Medicine DVM
Veterinary Parasitology MS,PHD
Veterinary Pathology MS,PHD
Vocational Education MED,EDS,EDD
Zoology BS,MS,PHD
Certificate Programs
Afro-American Studies Environmental Ethics French Studies German Stud ies Gerontology Global Policy Studies Historic Preservation Studies Latin American Studies Marriage & Family Therapy Medieval Studies Women's Studies
Pre-Professional Programs Pre-Dentistry
Pre-Engineering Pre-Forest Resources Pre-Journalism Pre-Landscape Architecture Pre -Law Pre-Medical Technology Pre-Medicine Pre-Nursing Pre-Optometry Pre-Pharmacy Pre-Physical Therapy Pre-Theology Pre-Veterinary Medicine
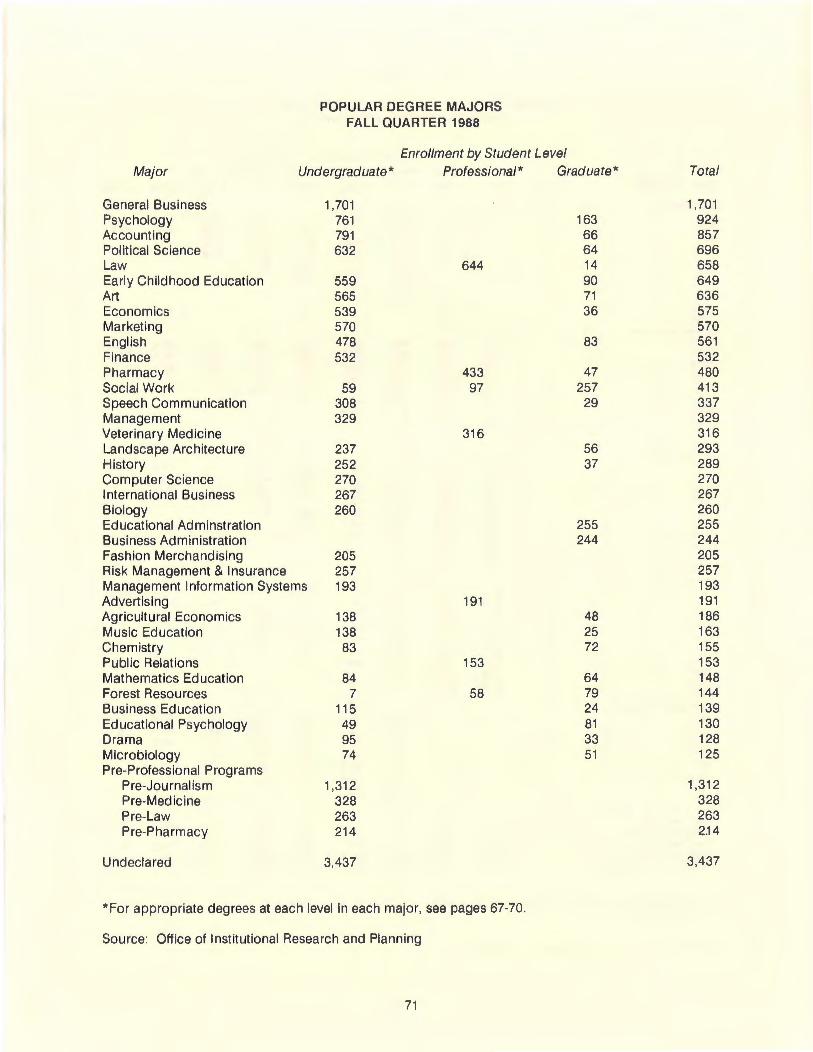
POPULAR DEGREE MAJORS FALL QUARTER 1988
Enrollment by Student Level Major Undergraduate* Professional* Graduate * Total
General Business 1,701 1,701 Psychology 761 163 924 Accounting 791 66 857 Political Science 632 64 696 Law 644 14 658 Early Childhood Education 559 90 649 Art 565 71 636 Economics 539 36 575 Marketing 570 570 English 478 83 561 Finance 532 532 Pharmacy 433 47 480 Social Work 59 97 257 413 Speech Communication 308 29 337 Management 329 329 Veterinary Medicine 316 316 Landscape Architecture 237 56 293 History 252 37 289 Computer Science 270 270 International Business 267 267 Biology 260 260 Educational Adminstration 255 255 Business Administration 244 244 Fashion Merchandising 205 205 Risk Management & Insurance 257 257 Management Information Systems 193 193 Advertising 191 191 Agricultural Economics 138 48 186 Music Education 138 25 163 Chemistry 83 72 155 Public Relations 153 153 Mathematics Education 84 64 148 Forest Resources 7 58 79 144 Business Education 115 24 139 Educational Psychology 49 81 130 Drama 95 33 128 Microbiology 74 51 125 Pre-Professional Programs
Pre-Journalism 1 ,312 1,312 Pre-Medicine 328 328 Pre-Law 263 263 Pre-Pharmacy 214 214
Undeclared 3,437 3,437
* For appropriate degrees at each level in each major, see pages 67-70.
Source: Office of Institutional Research and Planning
71
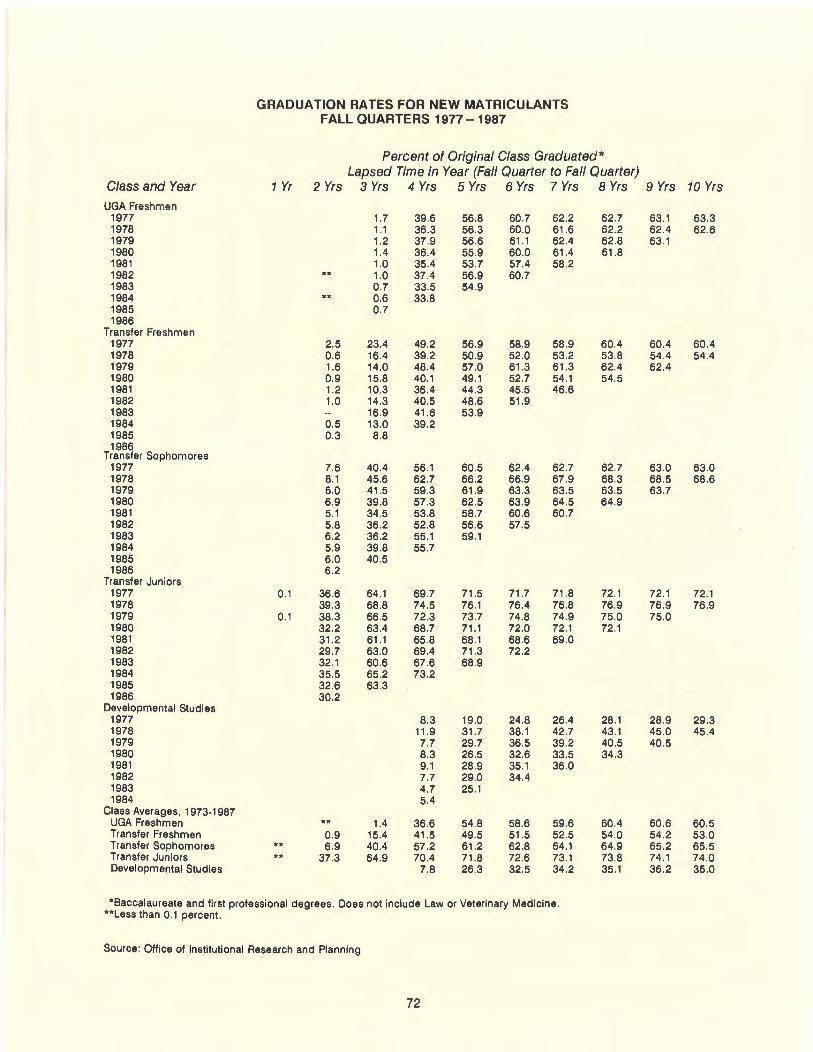
GRADUATION RATES FOR NEW MATRICULANTS FALL QUARTERS 1977 - 1987
Percent of Original Class Graduated* Lapsed Time in Year (Fall Quarter to Fall Quarter)
Class and Year 1 Yr 2 Yrs 3 Yrs 4 Yrs 5 Yrs 6 Yrs 7 Yrs 8 Yrs 9 Yrs 10 Yrs UGA Freshmen
1977 1.7 39.6 568 60 7 62 2 62.7 63.1 63.3 1978 1.1 36 3 56.3 60.0 61 .6 62.2 62.4 62.6 1979 1.2 37 .9 56.6 61.1 62.4 62.8 63.1 1980 1.4 36.4 55.9 60.0 61 .4 61 .8 1981 1.0 35.4 53.7 57.4 58.2 1982 1.0 37.4 56.9 60.7 1983 0.7 33 .5 54.9 1984 ** 06 33.8 1985 0.7 1986
Transfer Freshmen 1977 2.5 23.4 49.2 56.9 58.9 58.9 60.4 60.4 60.4 1978 0.6 16.4 39.2 50.9 52 .0 53.2 53.8 54.4 54.4 1979 1.6 14.0 48.4 57.0 61 .3 61.3 62.4 62.4 1980 0.9 15.8 40.1 49.1 52.7 54.1 54.5 1981 1.2 10.3 36.4 44.3 45.5 46.6 1982 1.0 14.3 40.5 48.6 51 .9 1983 16.9 41 .6 53.9 1984 0.5 13.0 39.2 1985 0.3 8.8 1986
Transfer Sophomores 1977 7.6 40.4 56.1 60.5 62.4 62.7 62.7 63.0 63 0 1978 8.1 45.6 62 .7 66.2 66.9 67.9 68.3 68.5 68.6 1979 6.0 41 .5 59.3 61.9 63.3 63.5 63.5 63.7 1980 6.9 39.8 57.3 62.5 639 64.5 64.9 1981 51 34 .5 53.8 58.7 606 60.7 1982 5.8 36.2 52.8 56.6 57.5 1983 62 36.2 55.1 59.1 1984 5. 9 39.8 55.7 1985 6.0 40.5 1986 62
Transfer Juniors 1977 0.1 36.6 64 .1 69.7 71 .5 71 .7 71 .8 72.1 72.1 72.1 1978 39.3 68.8 74.5 76.1 76.4 76.8 76.9 76.9 76.9 1979 0.1 38.3 665 72.3 73.7 74.8 74.9 75.0 75.0 1980 32.2 63.4 68.7 71 .1 72.0 72.1 72.1 1981 31 .2 61 .1 65.8 68.1 68.6 69.0 1982 29.7 63 0 69.4 71 .3 72.2 1983 32.1 60.6 67.6 68.9 1984 35.5 65 2 73.2 1985 32.6 63 3 1986 30.2
Developmental Studies 1977 8.3 19.0 24 .8 26.4 28.1 28.9 29.3 1978 11 .9 31.7 38.1 42.7 43.1 45.0 45.4 1979 7.7 29.7 36.5 39.2 40.5 40.5 1980 8.3 26.5 32.6 33.5 34.3 1981 9.1 28.9 35.1 36.0 1982 7.7 29.0 34.4 1983 4.7 25.1 1984 5.4
Class Averages , 1973-1987 UGA Freshmen ** 1.4 36.6 54.8 58.6 59.6 60.4 60.6 60.5 Transfer Freshmen 0.9 15.4 41 .5 49.5 51.5 52.5 54.0 54. 2 53.0 Transfer Sophomores ** 6.9 40.4 57.2 61 .2 62.8 64.1 64 .9 65.2 65.5 Transfer Juniors ** 37 .3 64 .9 70.4 71 .8 72.6 73.1 73.8 74. 1 74.0 Developmental Studies 7.8 26 3 32.5 34.2 35.1 36.2 35.0
*Baccalaureate and first professional degrees. Does not include Law or Veterinary Medicine. **Less than 0.1 percent.
Source: Office of Institutional Research and Planning
72
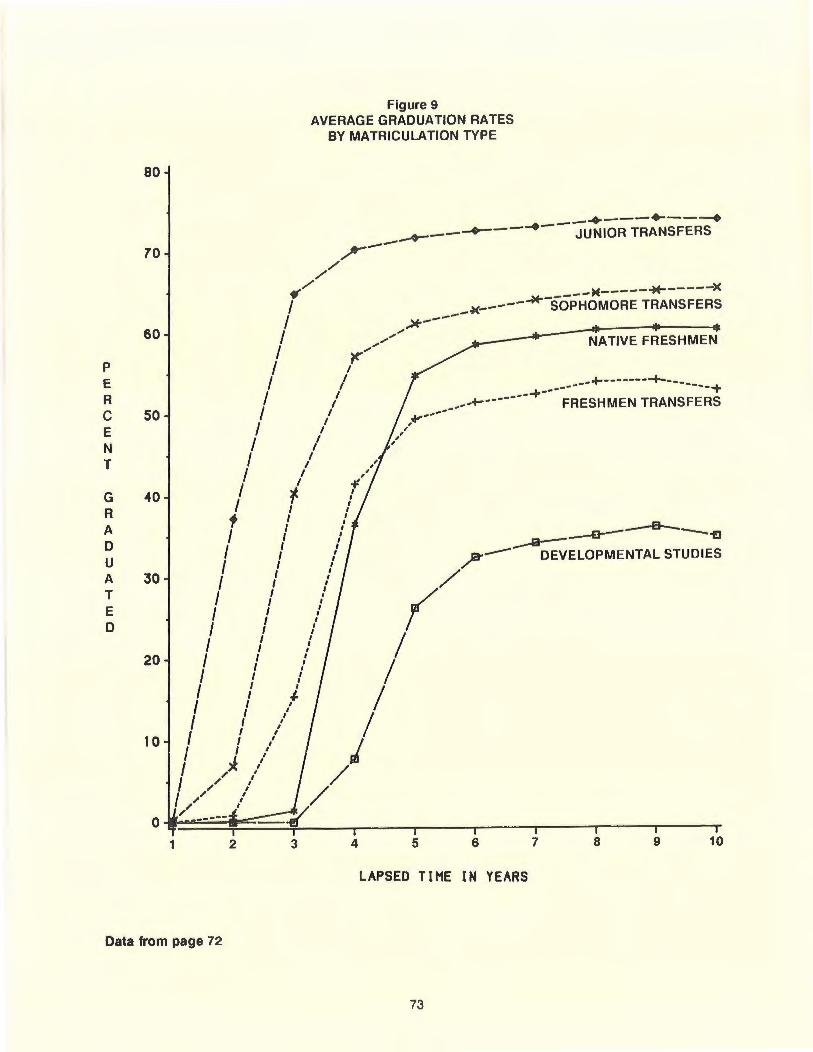
80
70
60
p
E R c 50 E N T
G -40 R A D u A JO T E D
20
10
0 1
Figure 9 AVERAGE GRADUATION RATES
BY MATRICULATION TYPE
·---+-----. _._--.....---... --JUNIOR TRANSFERS
fl'////'--
-w------w------x --~-----~-SOPHOMORE TRANSFERS I
I ,>f- ............
I ,.,. NATIVE FRESHMEN ,. .....
I ~;
I I I -------~--------+--------~ I I
I I ----+-I ••• -+-···· FRESHMEN TRANSFERS
I I ..., ... .,.-.. I I ,
I , , I I , ,
I
I I I , ,
I I , ,
I I of! ~ I
I I I
I I
t I I I
I I --o-----s-----'£1 I I I I
I I I __.a-I I .)it"-- DEVELOPMENTAL STUDIES I
I I I I I
(/ I I I I
I I
I I I I
I I I I
I I
I I I I
I I I I I I I
I I I
I I I I I
I I
I I
I I
I I + I I I
I I
I I I I I
I
I I I
I I I
' I I I
I ~
I
I I
I
/ " ,
I " I
I
" I / I " "" I
I , " -~
2 3 4 5 6 7 8 9 10
LAPSED TIME IN YEARS
Data from page 72
73
ACADEMIC INFORMATION (ffi) I 7 8 5
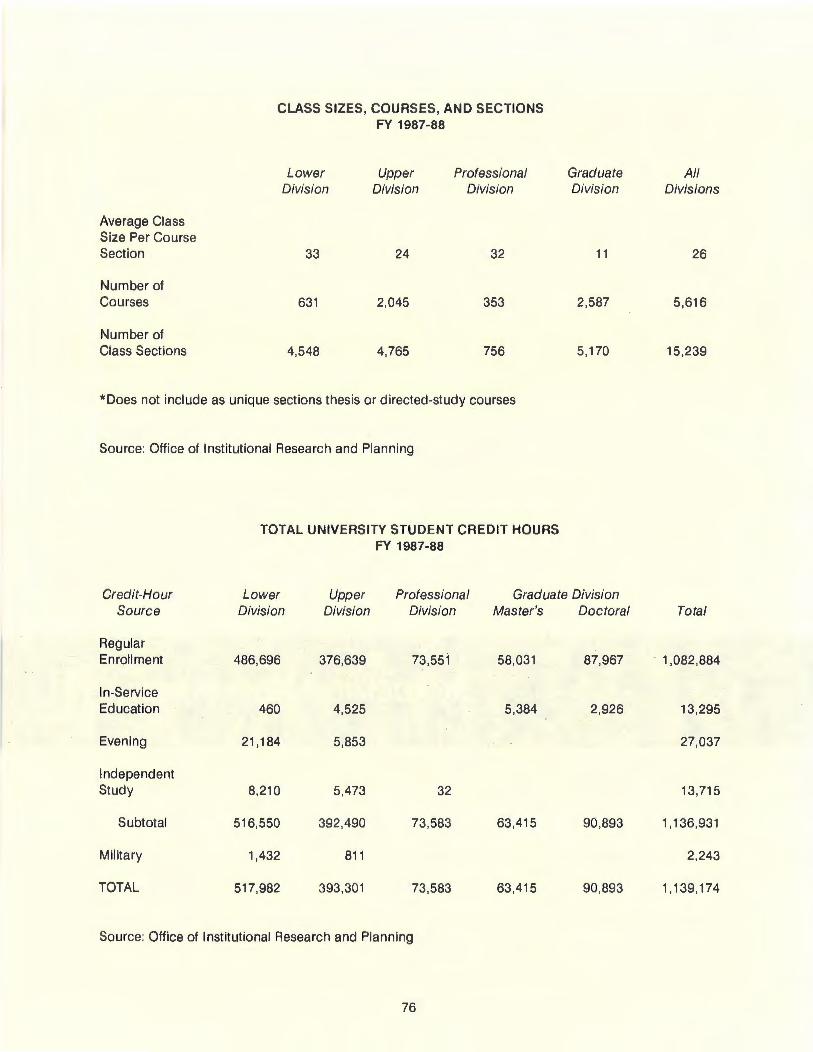
CLASS SIZES, COURSES, AND SECTIONS FY 1987-88
Lower Upper Professional Graduate All Division Division Division Division Divisions
Average Class Size Per Course Section 33 24 32 11 26
Number of Courses 631 2,045 353 2,587 5,616
Number of Class Sections 4,548 4,765 756 5,170 15,239
*Does not include as unique sections thesis or directed-study courses
Source: Office of Institutional Research and Planning
TOTAL UNIVERSITY STUDENT CREDIT HOURS FY 1987-88
Credit-Hour Lower Upper Professional Graduate Division Source Division Division Division Master's Doctoral Total
Regular Enroll ment 486,696 376,639 73,551 58,031 87,967 1,082,884
In-Service Education 460 4,525 5,384 2,926 13,295
Evening 21,184 5,853 27,037
Independent Study 8,210 5,473 32 13,715
Subtotal 516,550 392,490 73,583 63,415 90,893 1,136,931
Military 1,432 811 2,243
TOTAL 517,982 393,301 73 ,583 63,415 90,893 1,139,174
Source: Off ice of Institutional Research and Planning
76
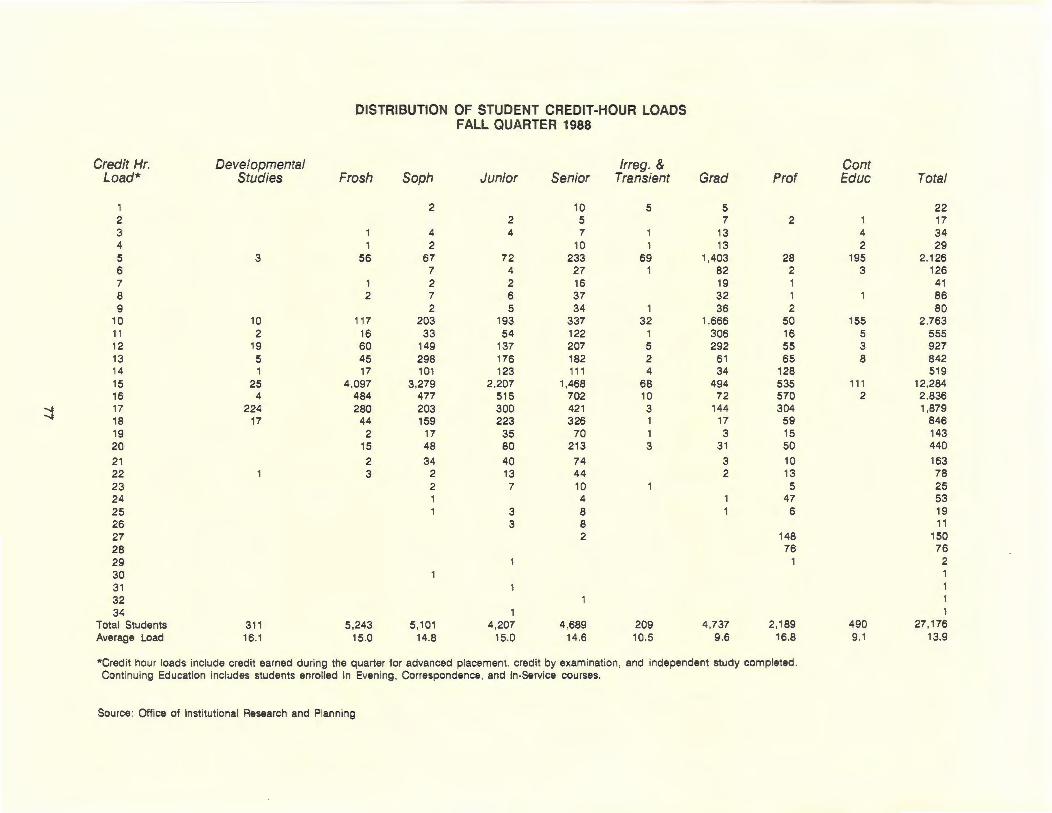
DISTRIBUTION OF STUDENT CREDIT-HOUR LOADS FALL QUARTER 1988
Credit Hr. Developmental lrreg. & Cont Load* Studies Frosh Soph Junior Senior Transient Grad Prof Educ Total
1 2 10 5 5 22 2 2 5 7 2 1 17 3 1 4 4 7 1 13 4 34 4 1 2 10 1 13 2 29 5 3 56 67 72 233 69 1,403 28 195 2.126 6 7 4 27 1 82 2 3 126 7 1 2 2 16 19 1 41 8 2 7 6 37 32 1 1 86 9 2 5 34 1 36 2 80
10 10 117 203 193 337 32 1,666 50 155 2.763 11 2 16 33 54 122 1 306 16 5 555 12 19 60 149 137 207 5 292 55 3 927 13 5 45 298 176 182 2 61 65 8 842 14 1 17 101 123 111 4 34 128 519 15 25 4,097 3,279 2.207 1,468 68 494 535 111 12,284 16 4 484 477 515 702 10 72 570 2 2,836
....... 17 224 280 203 300 421 3 144 304 1,879
....... 18 17 44 159 223 326 1 17 59 846 19 2 17 35 70 1 3 15 143 20 15 48 80 213 3 31 50 440 21 2 34 40 74 3 10 163 22 1 3 2 13 44 2 13 78 23 2 7 10 1 5 25 24 1 4 1 47 53 25 1 3 8 1 6 19 26 3 8 11 27 2 148 150 28 76 76 29 1 1 2 30 1 1 31 32 1 1 34 1 1
Total Students 311 5,243 5,101 4,207 4,689 209 4,737 2,189 490 27 ,176 Average Load 16.1 15.0 14 .8 15.0 14.6 10.5 9.6 16.8 9.1 13.9
*Credit hour loads include credit earned during the quarter for advanced placement. credit by examination , and independent study completed . Continuing Education includes students enrolled in Evening. Correspondence, and In-Service courses .
Source: Office of Institutional Research and Planning
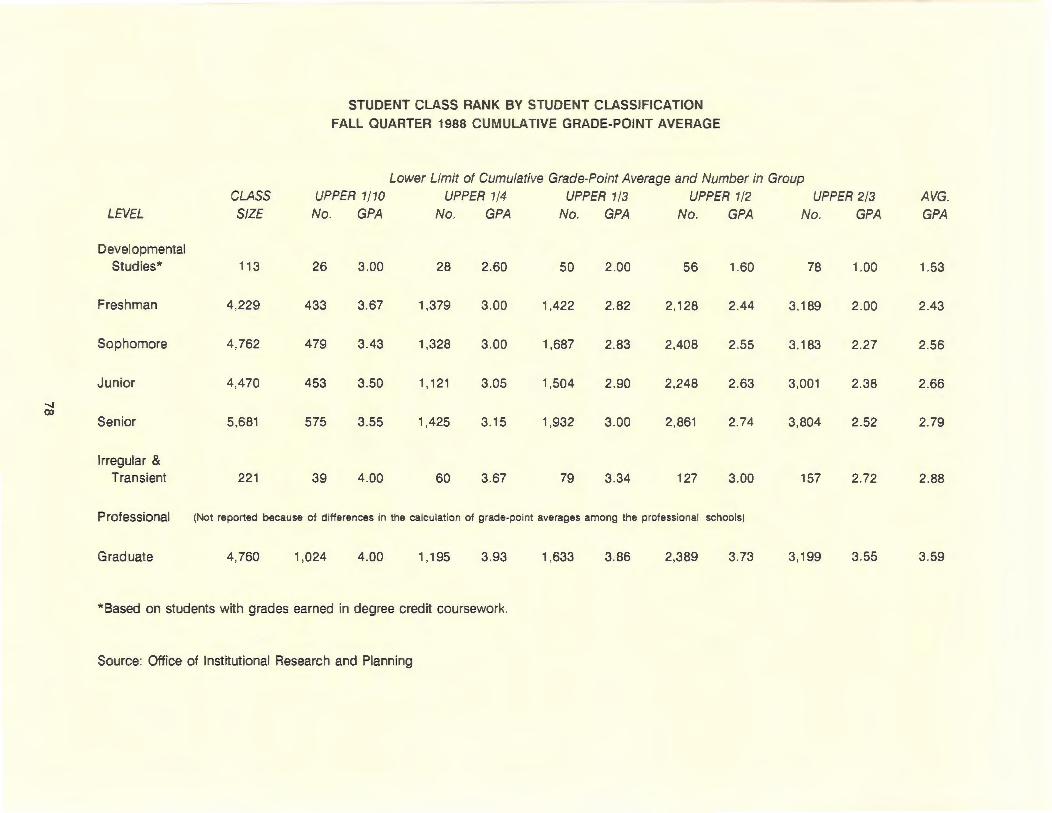
...... (X)
STUDENT CLASS RANK BY STUDENT CLASSIFICATION
FALL QUARTER 1988 CUMULATIVE GRADE-POINT AVERAGE
Lower Limit of Cumulative Grade-Point Average and Number in Group CLASS UPPER 1/10 UPPER 1/4 UPPER 1/3 UPPER 1/2 UPPER 2/3
LEVEL SIZE No. GPA No. GPA No. GPA No. GPA No. GPA
Developmental Stud ies* 11 3 26 3.00 28 2.60 50 2.00 56 1.60 78 1.00
Freshman 4,229 433 3.67 1,379 3.00 1,422 2.82 2,128 2.44 3.189 2.00
Sophomore 4,762 479 3.43 1,328 3.00 1,687 2.83 2,408 2.55 3,183 2.27
Junior 4,470 453 3.50 1 ' 121 3.05 1,504 2.90 2,248 2.63 3,001 2.38
Senior 5,681 575 3.55 1,425 3.15 1,932 3.00 2,861 2.74 3,804 2.52
Irregular & Transient 221 39 4.00 60 3.67 79 3.34 127 3.00 157 2.72
Professional (Not reported because of d ifferences in the calcu lation of grade-po int averages among the professional schools)
Graduate 4,760 1,024 4.00 1 ' 195 3.93 1,633 3.86 2,389 3.73 3,1 99 3.55
*Based on students with grades earned in degree credit coursework.
Source: Office of Institutional Research and Planning
AVG. GPA
1.53
2.43
2.56
2.66
2.79
2.88
3.59
DISTRIBUTION OF GRADES BY CLASS FALL QUARTERS 1986-1988
AVG. Quarter and Class A B c D F WF s u v I w NA GRADE
Fall 1986
Undergraduate Developmental
Studies 7 .2% 27.6% 21 .5% 9.8% 5.9% 1.3% 22 .7% 1.6% * 0.4% 1.5% 0 .2% 2.24 Freshman 19.5 30.6 27 .7 10.0 4.3 0.4 2 .7 0 .2 * 0 .7 3.8 0 .2 2.54 Sophomore 20 .1 32.3 24 .9 6 .9 3.2 0.3 4.2 0.5 0 .1 0 .7 6.4 0 .2 2.66 Junior 22.1 32.5 21 .8 5.7 3.0 0.3 5.8 1.2 0 .2 0.9 6.2 03 2.75 Senior 25.7 30.5 17.6 3.8 1.7 0.3 11.2 1.4 0.3 1.5 5.1 0 .7 2.92 Irregu lar 40.2 24 .6 12.6 3.9 2.1 0.8 3.9 * 2 .2 1.1 7.1 1.3 3. 13
Total Undergraduate 21.8% 31 .3% 22.9% 6.7% 3.1% 0.3% 6.3% 0.8% 0 .2% 1.0% 5.3% 0.4% 2.71 Professional** 23.9% 34.4% 15.1% 1.8% 0.4% 0.1% 12.2% 0.6% 0 .2% 0.8% 2.8% 7.6% 3.04 Graduate 48.8% 20.1% 2.3% 0.3% 0 .2% 0.1% 19.0% 0.3% 0.7% 4. 2% 1.8% 2.2% 3.62
Fall 1987
Undergraduate Developmental
Studies 3.9% 31.6% 25.0% 7.4% 3.6% 1.0% 24 .5% 0.7% 0.0% 0.2% 2.0% 0.0% 2.31 Freshman 18.6 31 .5 27 .6 9.2 4.5 0.5 2 .7 0 .2 * 0.9 4.0 0.2 2.54 ..... Sophomore 19.4 31.8 24 .8 7.1 2.9 0.3 5 .1 0 .7 0.1 0.5 7.1 0.3 2.66 <0 Junior 22.2 32.6 21.3 5.2 2.4 0.3 6.1 1.4 0.1 0.9 7.1 0 .3 2.79 Senior 25.5 31 .3 17.1 3.4 1.6 0.4 12.0 1.3 0.3 1.5 4.8 0.8 2.94 Irregular 41 .0 27.4 9.4 2.0 1.4 0.6 3.8 0.4 3.0 2.4 7.8 0.8 3.26
Total Undergraduate 21 .2% 31 .7% 22 .7% 6.3% 2.9% 0.4% 6.8% 0.9% 0 .2% 1.0% 5.6% 0.4% 2.72 Professional ** 23.8% 34.6% 15.0% 2.2% 0.8% * 7.3% 0.6% 0.1% 0.4% 2 .1 % 13.0% 3.02 Graduate 49.8% 20.0% 2.9% 0.3% 0.1 % * 18.5% 0.3% 0.6% 4.0% 2.2% 1.2% 3.62
Fall 1988
Undergraduate Developmental
Studies 5.6% 32.5% 20.5% 6.9% 5.8% 2.0% 22 .8% 0.6% 0.4% * 2.8% 0.0% 2.29 Freshman 18.2 32.1 27.4 9.6 5.1 0.5 2 .7 0.1 0.1 0.6 3.3 02 2.51 Sophomore 20.5 32.4 24.0 6.9 3.2 0.34 4.0 0 .7 0.1 0.6 7.1 0.3 2.68 Junior 23.1 33 .2 20.6 5.4 2.2 0.2 6.0 1.3 0 .2 0.7 6.3 0.6 2.81 Sen ior 26.4 30.5 16.7 3.8 1.5 0.2 12.2 1.4 0 .2 1.2 48 0.9 2.96 Irregular 37.1 26.9 15.3 2.4 2 .2 0.4 5.1 0 .2 2 .2 1.4 59 0.8 3.1 1
Total Undergraduate 21 .8% 32.0% 22 .2% 6.4% 3.1% 0.3% 6.5% 0.8% 0 .2% 0.8% 5.3% 0.5% 2.72 Professional** 28.1% 32.1% 13.7% 2.0% 0.5% 0.1% 8.2% 0.7% 0 .2% 0.5% 2.3% 11.5% 3 11 Graduate 48.6% 20.8% 2.4% 0.3% 0 .2% ** 19.6% 0.3% 0.8% 3.0% 2.5% 1.5% 3.62
*Less than 0.1 percent. ""Law grades were not included in the professional grade distributions.
Totals may not equal 100% because of rounding. Key: WF =Withdrew Fail ing; S =Satisfactory; U = Unsatisfactory; V =Audit; I = Incomplete; W =Withdrew; NR =None Reported
Source: Office of Institutional Research and Planning
HONORS PROGRAM ENROLLMENT AND SECTIONS FY 1987-88
School/Students/Sections Summer Fa ll Winter
Arts & Sciences Students 66 857 756 Sections 11 62 58
Business Students 189 247 Sections 6 11
Total Students 66 1,046 1,003 Sections 11 68 69
Average Students Per Section Arts & Sciences 6.0 13.8 13.0 Business 31 .5 22.5 Total 6.0 15.4 14.5
Note: Does not include enrollment in directed study honors courses.
Source: Office of Institutional Research and Planning
HONORS PROGRAM AWARDS
Year
1963 1964 1965 1966 1967 1968 1969 1970 1971 1972 1973 1974 1975 1976 1977 1978 1979 1980 1981 1982 1983 1984 1985 1986 1987 1988
General Honors
19 20 31 39 35 46 55 82 94
121 137 111 138 158 140 143 146 151 188 124
91 118 99 65 84
* First awarded in June 1983.
FY 1963-64 - 1987-88
Junior Certificate Winners
40 44 70 66 84 71 94 84
127 182 165 193 199 184 192 202 219 183 126 172 182 199 171 161 149 212
Source: Annual Report of Honors Program 1987-88
80
Graduates With High Honors *
12 15 32 46 35 37
Spring Tota l
456 41
162 10
618 51
11 .1 16.2 12.1
2,136 172
598 27
2,733 199
12.4 22 .1 13.7
Graduates With Highest Honors*
8 9 9
12 13
7
DISTRIBUTION OF HONORS STUDENTS BY MAJOR AND CLASS FALL QUARTER 1988
CLASS Fr. So. Jr. Sr.
College & Major (1st) (2nd) (3rd) (4th) Total
Agriculture 16 8 4 2 30 Arts and Sciences
Anthropology 0 1 2 2 5 Area Studies 0 0 1 3 4 Art 9 6 7 7 29 Biochemistry 5 1 4 5 15 Biology 10 8 4 3 25 Chemistry 2 2 9 2 15 Classical Cultures 0 0 0 2 2 Comparative Literature 1 0 2 1 4 Computer Science 9 4 4 0 17 Criminal Justice 0 0 2 1 3 Drama 1 1 2 0 4 Economics 3 1 5 2 11 English 13 11 16 13 53 French 1 2 2 0 5 Genetics 0 1 1 2 4 Geography 1 0 1 2 4 History 4 6 3 4 17 Interdisciplinary Studies 0 0 0 2 2 Languages & Literature 1 0 0 0 1 Latin 0 0 1 2 3 Linguistics 0 0 0 1 1 Mathematics 4 3 6 1 14 Microbiology 1 3 1 7 12 Music 4 9 5 6 24 Philosophy 0 0 1 1 2 Physics and Astronomy 0 1 0 0 1 Political Science 22 13 13 13 61 Pre-Dentistry 2 1 0 0 3 Pre-Engineering 4 2 1 0 7 Pre-Journalism 45 53 11 0 109 Pre-Law 22 19 0 1 42 Pre-Medicine 31 29 11 13 84 Pre-Pharmacy 9 6 0 0 15 Pre-Veterinary Medicine 2 2 1 0 5 Psychology 11 6 5 5 27 Romance Languages 1 1 1 0 3 Social Sciences 1 0 1 0 2 Sociology 0 0 0 0 0 Spanish 0 1 2 0 3 Speech Communication 0 0 1 0 1 Statistics 0 0 1 0 1 Unspecified 50 35 11 0 96 Zoology 0 4 4 1 9
Total Arts and Sciences 269 232 142 102 745
Business Administration 126 127 80 76 409 Education 7 9 7 7 30 Environmental Design 2 0 0 3 5 Forest Resources 1 1 2 0 4 Home Economics 1 3 5 1 10 Journalism 0 0 22 33 55 Pharmacy 0 0 1 1 2 Social Work 1 2 0 0 3 Veterinary Medicine 0 0 0 2 2
TOTAL 423 382 263 227 1,295
Source: Honors Program
81
STATISTICAL ANALYSIS OF ADVANCED PLACEMENT
July 1986-June 1987 July 1987- June 1988 Total Total
Exemption With Without Total Exemption With Without Total Subject Tests Credit Credit Exemptions Tests Credit Credit Exemptions
Art 21 9 -- 9 18 20 -- 20 Biology 95 17 -- 17 131 63 -- 63 Chemistry 163 53 -- 53 162 71 -- 71 Computer Science 12 5 -- 5 11 6 -- 6 English 4,405 709 2,538 3,247 4,642 836 2,693 3,529 French 277 36 162 198 396 91 338 429 German 37 16 30 46 51 25 41 66 History 1,284 267 733* 267 1,489 334 907* 334 Italian 2 2 4 6 1 Latin 24 3 4 7 48 14 17 31 Math 4.696 2,283 -- 2.283 5,141 2.391 1 2.392 Music 2 3 -- 3 2 1 -- 1
(X) Physics 15 3 3 16 2 -- 2 1\) --Political Science 15 1 -- 1 29 4 -- 4 Psychology 2 Russian -- -- -- -- 1 1 2 3 Spanish 294 58 180 238 438 87 250 337
TOTAL 11,342 3,465 2,918 6.383 12,578 3.946 3,342 7,288
Percent of credits and exemptions 100% 31% 26% 56% 100% 31% 27% 58%
*U.S./Georgia History requirement satisfied; no course credit or exemption earned.
Source: Annual Reports of Honors Program 1987-88
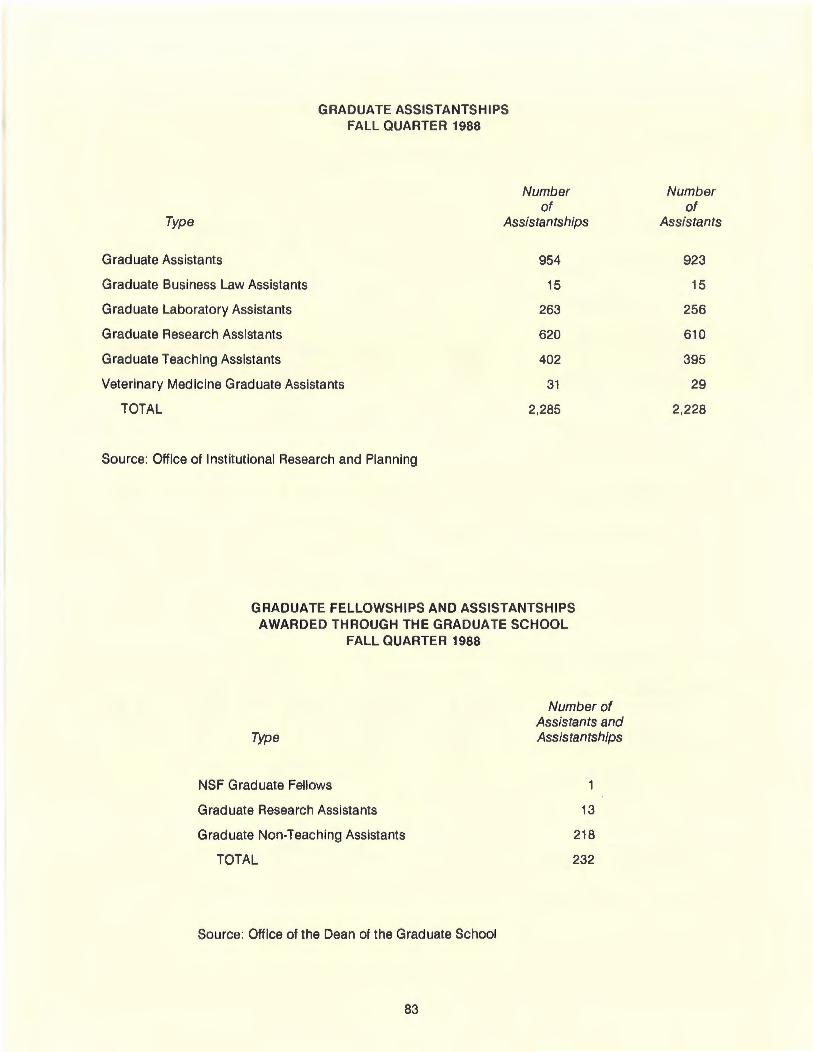
GRADUATE ASSISTANTSHIPS FALL QUARTER 1988
Number of
Type Assistantships
Graduate Assistants
Graduate Business Law Assistants
Graduate Laboratory Assistants
Graduate Research Assistants
Graduate Teaching Assistants
Veterinary Medicine Graduate Assistants
TOTAL
Source: Office of Institutional Research and Planning
954
15
263
620
402
31
2,285
GRADUATE FELLOWSHIPS AND ASSISTANTSHIPS AWARDED THROUGH THE GRADUATE SCHOOL
FALL QUARTER 1988
Type
NSF Graduate Fellows
Graduate Research Assistants
Graduate Non-Teaching Assistants
TOTAL
Source: Office of the Dean of the Graduate School
83
Number of Assistants and Assistantships
13
218
232
Number of
Assistants
923
15
256
610
395
29
2,228
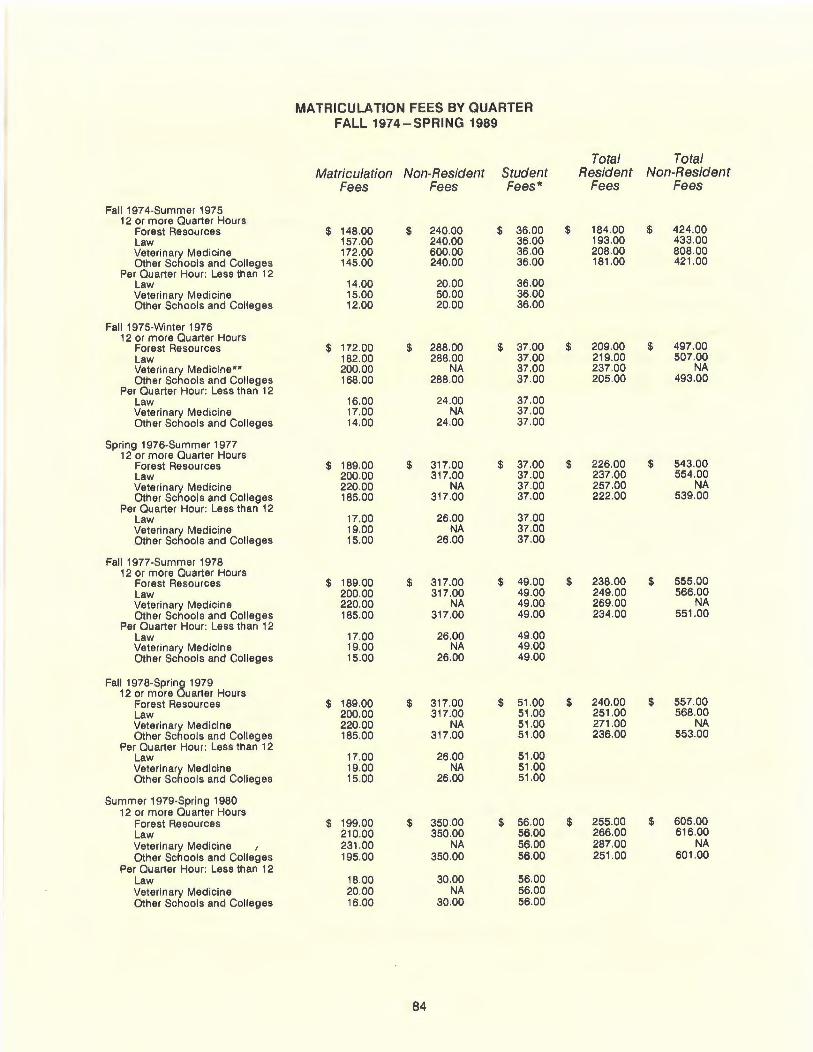
MATRICULATION FEES BY QUARTER FALL 1974-SPRING 1989
Total Tota l Matriculation Non-Resident Student Resident Non-Resident
Fees Fees Fees* Fees Fees
Fall 1974-Summer 1975 12 or more Quarter Hours
Forest Resources $ 148.00 $ 240 00 $ 36.00 $ 184.00 $ 424.00 Law 157.00 240.00 36.00 193.00 433.00 Veterinary Medicine 172.00 600.00 36.00 208.00 808.00 Other Schools and Colleges 145.00 240.00 36.00 181.00 421.00
Per Quarter Hour : Less than 12 Law 14.00 20.00 36.00 Veterinary Medicine 15.00 50.00 36.00 Other Schools and Colleges 12.00 20.00 36.00
Fall 1975-Winter 1976 12 or more Quarter Hours
Forest Resources $ 172.00 $ 288.00 $ 37.00 $ 209.00 $ 497.00 Law 182.00 288.00 37.00 219.00 507.00 Veterinary Medicine.,. 200.00 NA 37 .00 237.00 NA Other Schools and Colleges 168.00 288.00 37.00 205.00 493.00
Per Quarter Hour: Less than 12 Law 16.00 24.00 37.00 Veterinary Medicine 17.00 NA 37.00 Other Schools and Colleges 14.00 24 .00 37.00
Spring 1976-Summer 1977 12 or more Quarter Hours
Forest Resources $ 189.00 $ 317.00 $ 37.00 $ 226.00 $ 543.00 Law 200.00 317.00 37.00 237.00 554.00 Veterinary Medicine 220.00 NA 37.00 257.00 NA Other Schools and Colleges 185.00 317 .00 37.00 222.00 539.00
Per Quarter Hour: Less than 12 Law 17.00 26.00 37.00 Veterinary Medicine 19.00 NA 37.00 .Other Schools and Col leges 15. 00 26.00 37.00
Fall 1977-Summer 1978 12 or more Quarter Hours
Forest Resources $ 18900 $ 317.00 $ 49.00 $ 238.00 $ 555.00 Law 200.00 317.00 49.00 249.00 566.00 Veterinary Medicine 220.00 NA 49.00 269.00 NA Other Schools and Colleges 185.00 317.00 49.00 234 .00 551 .00
Per Quarter Hour: Less than 12 Law 17.00 26.00 49.00 Veterinary Medicine 19.00 NA 49.00 Other Schools and Colleges 15.00 26.00 49.00
Fall 1978-SprinO 1979 12 or more uarter Hours
Forest Resources $ 189.00 $ 317.00 $ 51.00 $ 240.00 $ 557.00 Law 200.00 317.00 51.00 251.00 568.00 Veterinary Medicine 220.00 NA 51.00 271.00 NA Other Schools and Colleges 185.00 317.00 51.00 236.00 553.00
Per Quarter Hour: Less than 12 Law 17.00 26.00 51.00 Veterinary Medicine 19.00 NA 51.00 Other Schools and Colleges 15.00 26.00 51.00
Summer 1979-Spring 1980 12 or more Quarter Hours
Forest Resources $ 199.00 $ 350.00 $ 56.00 $ 255.00 $ 605.00 Law 210.00 350.00 56.00 266.00 616.00 Veterinary Medicine I 231.00 NA 56.00 287.00 NA Other Schools and Colleges 195.00 350.00 56.00 251.00 601 .00
Per Quarter Hour: Less than 12 Law 18 00 30.00 56.00 Veterinary Medicine 20.00 NA 56.00 Other Schools and Colleges 16 00 30.00 56.00
84
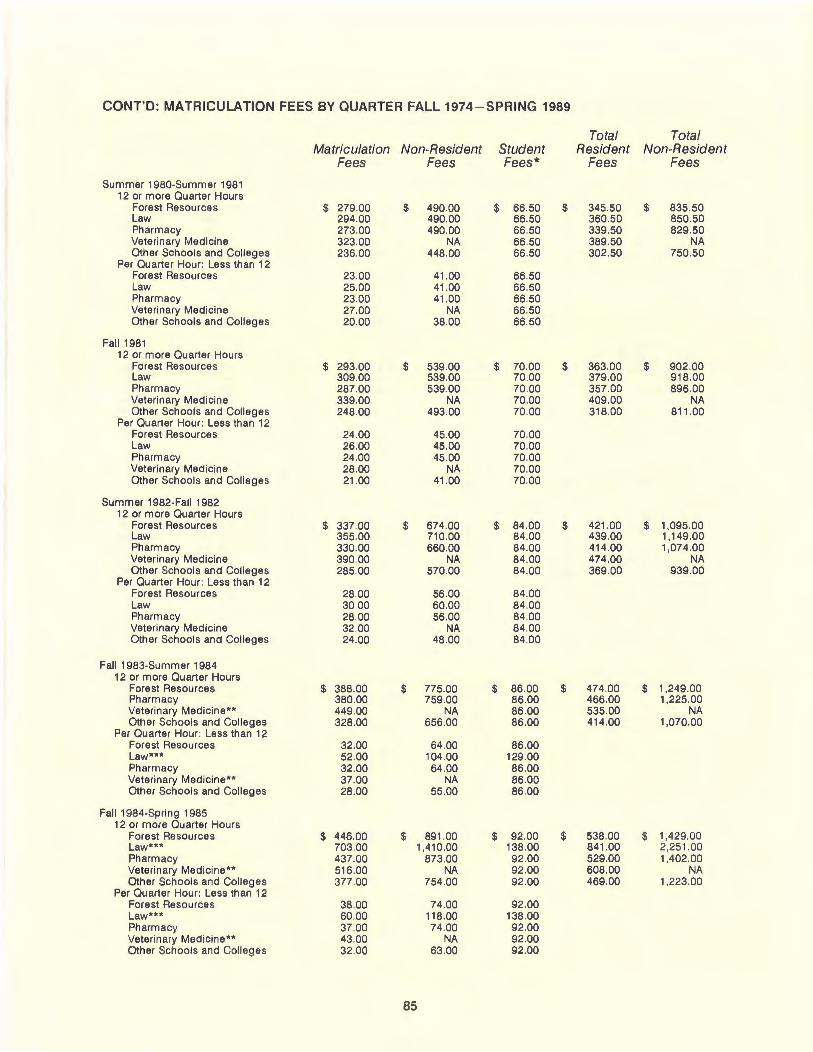
CONT'D: MATRICULATION FEES BY QUARTER FALL 1974 - SPRING 1989
Total Total Matriculation Non-Resident Student Resident Non-Resident
Fees Fees Fees* Fees Fees
Summer 1980-Summer 1981 12 or more Quarter Hours
Forest R~;~sources $ 279.00 $ 490.00 $ 66.50 $ 345.50 $ 835.50 Law 294.00 490.00 66.50 360.50 850.50 Pharmacy 273.00 490.00 66.50 339 50 829.50 Veterinary Medicine 323.00 NA 66.50 389.50 NA Other Schools and Colleges 236.00 448 .00 66.50 302.50 750.50
Per Quarter Hour: Less than 12 Forest Resources 23.00 41 .00 66.50 Law 2500 41 .00 66.50 Pharmacy 23.00 41.00 66.50 Veterinary Medicine 27 00 NA 66.50 Other Schools and Colleges 20 00 38 00 66.50
Fall 1981 12 or more Quarter Hours
Forest Resources $ 293.00 $ 539.00 $ 70.00 $ 363.00 $ 902.00 Law 30900 539.00 7000 379 .00 918.00 Pharmacy 287.00 539.00 70.00 357 .00 896.00 Veterinary Medicine 339.00 NA 70.00 409.00 NA Other Schools and Colleges 248.00 493.00 70.00 318.00 811 .00
Per Quarter Hour: Less than 12 Forest Resources 24 .00 45 .00 70.00 Law 26.00 45.00 70.00 Pharmacy 24 .00 45.00 70.00 Veterinary Medicine 28.00 NA 70.00 Other Schools and Colleges 21.00 41.00 70.00
Summer 1982-Fall 1982 12 or more Quarter Hours
Forest Resources $ 337 00 $ 674 .00 $ 84 .00 $ 421 .00 $ 1,095.00 Law 355.00 710.00 84.00 439.00 1,149.00 Pharmacy 330.00 660.00 84 .00 414.00 1,074.00 Veterinary Medicine 390.00 NA 84.00 474 .00 NA Other Schools and Colleges 285.00 570.00 84.00 369.00 939.00
Per Quarter Hour: Less than 12 Forest Resources 28.00 56.00 84 .00 Law 30.00 60.00 84 00 Pharmacy 28.00 56 .00 84.00 Veterinary Medicine 32 .00 NA 84.00 Other Schools and Colleges 24 00 48.00 84 .00
Fall 1983-Summer 1984 12 or more Quarter Hours
Forest Resources $ 388.00 $ 775.00 $ 86.00 $ 474 .00 $ 1,249.00 Pharmacy 38000 75900 86.00 466 .00 1,225.00 Veterinary Medicine** 449.00 NA 86.00 535 .00 NA Other Schools and Colleges 328.00 65600 86.00 414.00 1,070.00
Per Quarter Hour: Less than 12 Forest Resources 32.00 64 00 86.00 Law*** 52.00 104.00 129.00 Pharmacy 32.00 64.00 86.00 Veterinary Medicine** 37.00 NA 86.00 Other Schools and Colleges 28.00 55.00 86.00
Fall 1984-Spring 1985 12 or more Quarter Hours
Forest Resources $ 446.00 $ 891 .00 $ 92.00 $ 538 .00 $ 1,429.00 Law**" 703 .00 1,410.00 138.00 841 .00 2,251.00 Pharmacy 437.00 873.00 92.00 529.00 1,402.00 Veterinary Medicine** 516.00 NA 92.00 608.00 NA Other Schools and Colleges 377.00 754 .00 92.00 469.00 1,223.00
Per Quarter Hour : Less than 12 Forest Resources 38.00 74 .00 92 .00 Law*** 60.00 118.00 138.00 Pharmacy 37.00 74 .00 92.00 Veterinary Medicine** 43.00 NA 92 .00 Other Schools and Colleges 32.00 63.00 92.00
85
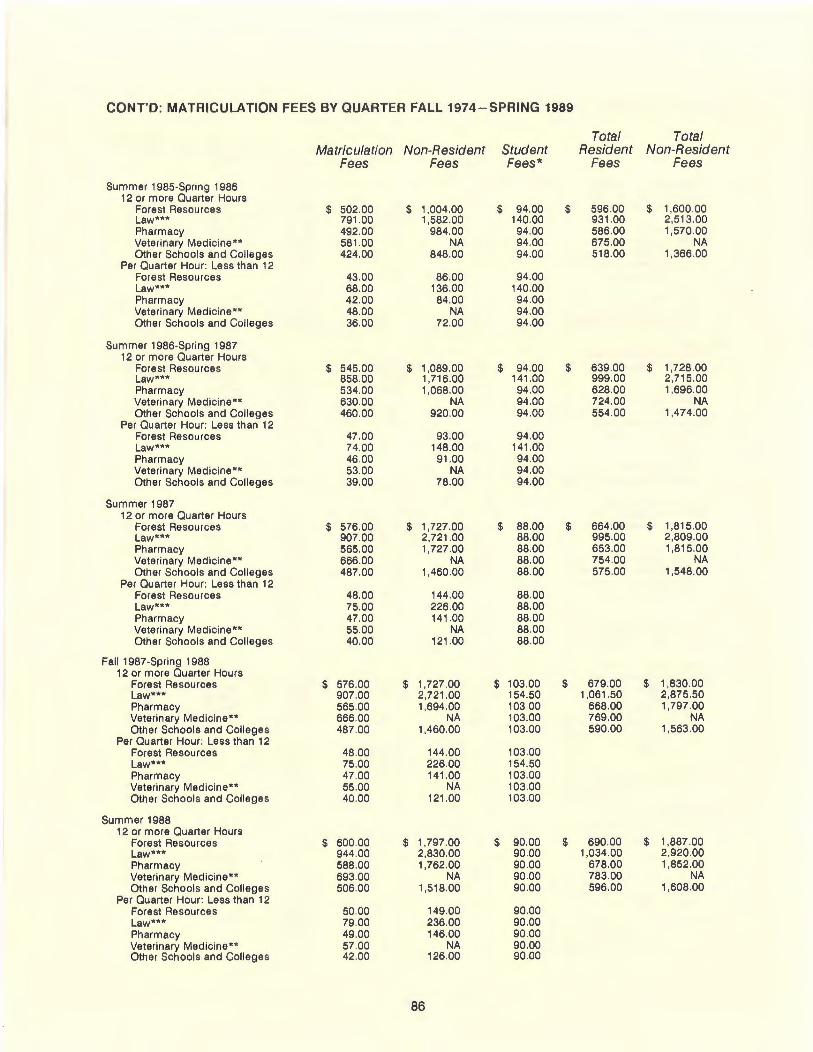
CONT'D: MATRICULATION FEES BY QUARTER FALL 1974 -SPRING 1989
Total Total Matriculation Non-Resident Student Resident Non-Resident
Fees Fees Fees* Fees Fees
Summer 1985-Spring 1986 12 or more Quarter Hours
Forest Resources $ 502.00 $ 1,004.00 $ 94.00 $ 596 00 $ 1,600.00 Law"** 791 .00 1,582.00 140.00 931.00 2,513.00 Pharmacy 492.00 984.00 94.00 586.00 1,570.00 Veterinary Medicine"" 581 .00 NA 94.00 675.00 NA Other Schools and Colleges 424.00 848.00 94.00 518.00 1,366.00
Per Quarter Hour: Less than 12 Forest Resources 43.00 86.00 94 .00 Law""* 68.00 136.00 140.00 Pharmacy 42.00 84.00 94.00 Veterinary Medicine"" 48.00 NA 94.00 Other Schools and Colleges 36.00 72.00 94.00
Summer 1986-Spring 1987 12 or more Quarter Hours
Forest Resources $ 545.00 $ 1,089.00 $ 94.00 $ 639.00 $ 1,728.00 Law""" 858.00 1,716.00 141 .00 999.00 2,715.00 Pharmacy 534.00 1,068.00 94.00 628.00 1,696.00 Veterinary Medicine"" 630.00 NA 94.00 724 .00 NA Other Schools and Colleges 460.00 920.00 94.00 554.00 1,474.00
Per Quarter Hour : Less than 12 Forest Resources 47.00 93.00 94.00 Law""" 74.00 148.00 141.00 Pharmacy 46.00 91.00 94.00 Veterinary Medicine"" 53.00 NA 94.00 Other Schools and Colleges 39.00 78.00 94.00
Summer 1987 12 or more Quarter Hours
Forest Resources $ 576.00 $ 1,727.00 $ 88.00 $ 664.00 $ 1,815.00 Law""" 907 00 2,721.00 88.00 995.00 2,809.00 Pharmacy 565.00 1,727.00 88.00 653.00 1,815.00 Veterinary Medicine *" 666.00 NA 88.00 754.00 NA Other Schools and Colleges 487.00 1,460.00 88.00 575.00 1,548.00
Per Quarter Hour: Less than 12 Forest Resources 48.00 144.00 88.00 Law""" 75.00 226.00 88.00 Pharmacy 47.00 141 .00 88.00 Veterinary Medicine"" 55.00 NA 88.00 Other Schools and Colleges 40.00 121.00 88.00
Fall 1987-Spring 1988 12 or more Quarter Hours
Forest Resources $ 576.00 $ 1,727.00 $ 103 00 $ 679.00 $ 1,830.00 Law""" 907.00 2,721.00 154 50 1,061.50 2,875.50 Pharmacy 565.00 1,694.00 103.00 668.00 1,797 .00 Veterinary Medicine"" 666 00 NA 103.00 769.00 NA Other Schools and Colleges 487 00 1,460.00 103.00 590.00 1,563.00
Per Quarter Hour: Less than 12 Forest Resources 48 00 144.00 103.00 Law""" 75.00 226.00 154.50 Pharmacy 47 .00 141 .00 103.00 Veterinary Medicine"" 55.00 NA 103.00 Other Schools and Colleges 40.00 121 .00 103 00
Summer 1988 12 or more Quarter Hours
Forest Resources $ 600.00 $ 1,797.00 $ 90.00 $ 690.00 $ 1,887 .00 Law"*" 944 .00 2,830.00 90.00 1,034.00 2,920.00 Pharmacy 588.00 1,762.00 90.00 678.00 1,852.00 Veterinary Medicine"" 693.00 NA 90.00 783.00 NA Other Schools and Colleges 506.00 1,518.00 90.00 596.00 1,608.00
Per Quarter Hour : Less than 12 Forest Resources 5000 149.00 90.00 Law""" 79.00 236 00 90.00 Pharmacy 49.00 146.00 90.00 Veterinary Medicine "" 57 00 NA 90.00 Other Schools and Colleges 42.00 126.00 90.00
86
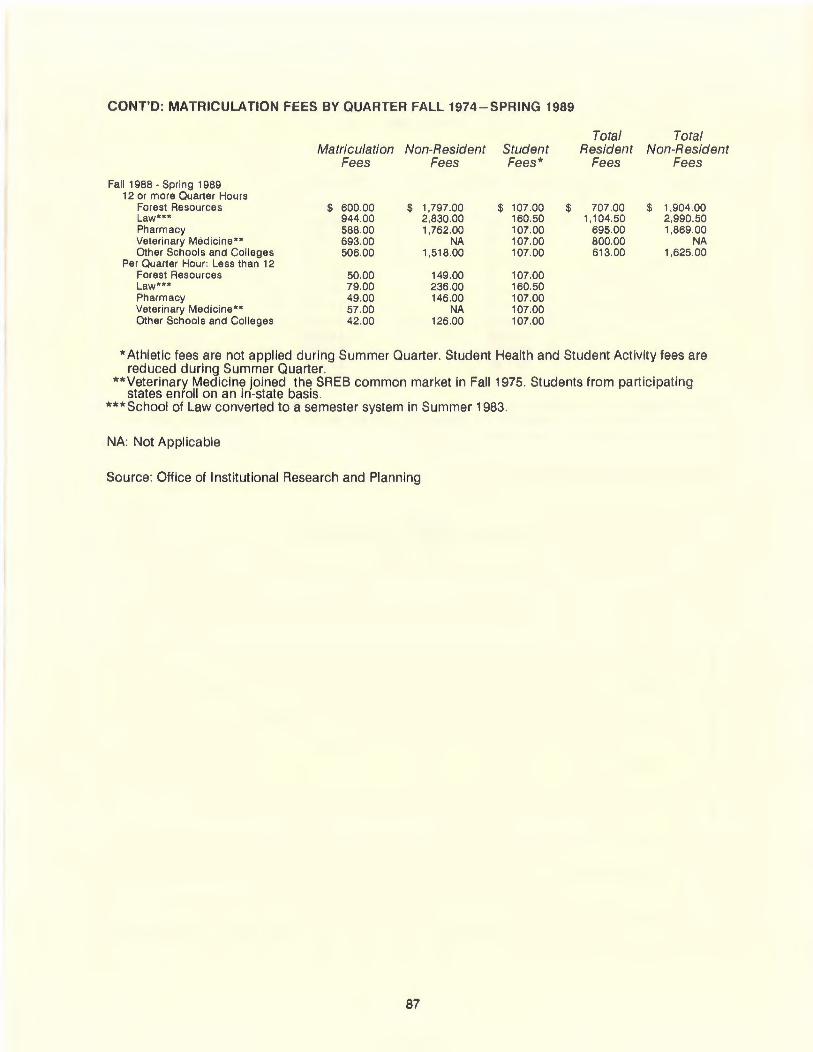
CONT'D: MATRICULATION FEES BY QUARTER FALL 1974-SPRING 1989
Fall 1988 - Spring 1989 12 or more Quarter Hours
Forest Resources Law•u Pharmacy Veterinary Medicine** Other Schools and Colleges
Per Quarter Hour : Less than 12 Forest Resources Law*** Pharmacy Veterinary Medicine u Other Schools and Colleges
Matriculation Fees
$ 600.00 944 .00 58800 693 00 506 .00
50.00 79 00 49 00 57 00 42 00
Non-Resident Student Fees Fees*
$ 1,797 .00 $ 107.00 $ 2,830.00 160.50 1,762.00 107.00
NA 107.00 1,518.00 107.00
14900 107.00 236.00 160.50 146.00 107.00
NA 107.00 126.00 107.00
Total Tota l Resident Non-Resident
Fees Fees
707.00 $ 1,904.00 1,104.50 2,990.50
695.00 1,869.00 800.00 NA 613.00 1,625.00
*Athlet ic fees are not applied during Summer Quarter. Student Health and Student Activity fees are reduced during Summer Quarter.
**Veterinary Medicine joined the SREB common market in Fall 1975. Students from participating states enroll on an in-state basis .
***School of Law converted to a semester system in Summer 1983.
NA: Not Applicable
Source: Office of Institutional Research and Planning
87
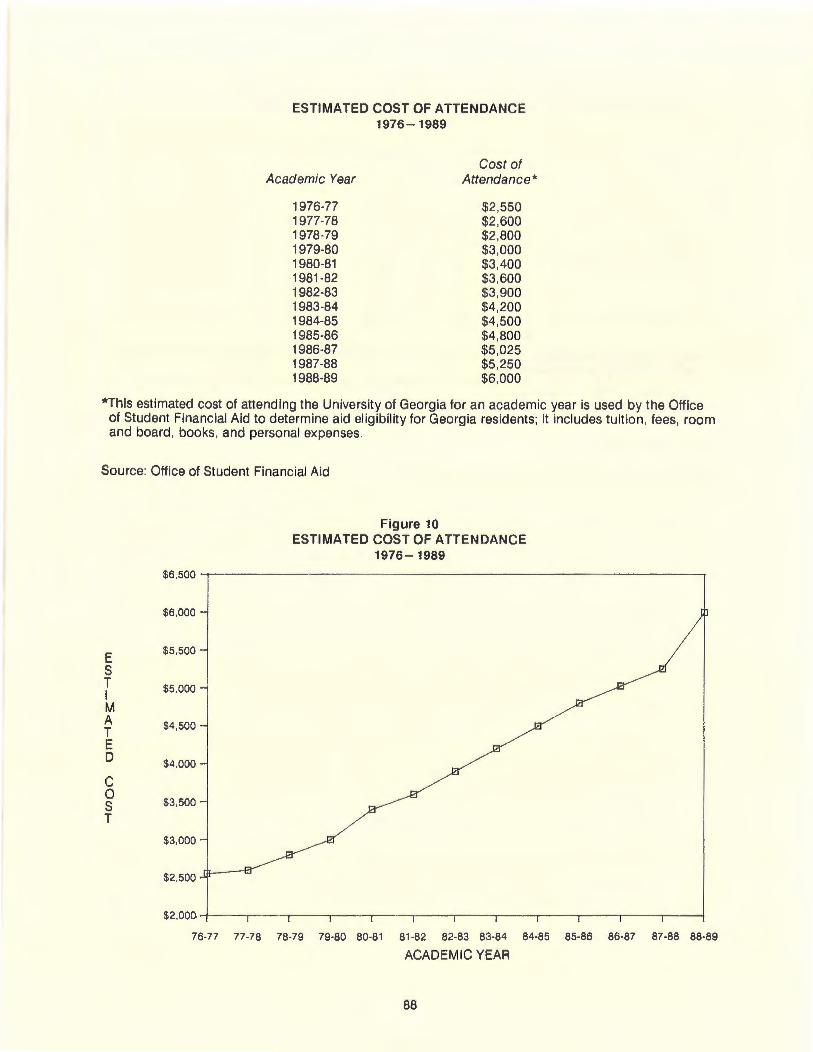
ESTIMATED COST OF ATTENDANCE 1976-1989
Academic Year
1976-77 1977-78 1978-79 1979-80 1980-81 1981-82 1982-83 1983-84 1984-85 1985-86 1986-87 1987-88 1988-89
Cost of Attendance*
$2,550 $2,600 $2,800 $3,000 $3,400 $3,600 $3,900 $4,200 $4,500 $4,800 $5,025 $5,250 $6,000
*This estimated cost of attending the University of Georgia for an academic year is used by the Office of Student Financial Aid to determine aid eligibility for Georgia residents; it includes tuition, fees, room and board, books, and personal expenses.
Source: Office of Student Financial Aid
E s T I M A T E D
c 0 s T
$6,000
$5,500
$5,000
$4 ,500
$4.000
$3,500
$3 ,000
$2,500
Figure 10 ESTIMATED COST OF ATTENDANCE
1976-1989
$2,000. +---.----..------.-------,.-------,---.---..----,-------,,-------,---.-----j
76-77 77-78 78-79 79-80 80-81 81-82 82-83 83-84 84-85 85-86 86-87 87-88 88-89
ACADEMIC YEAR
88
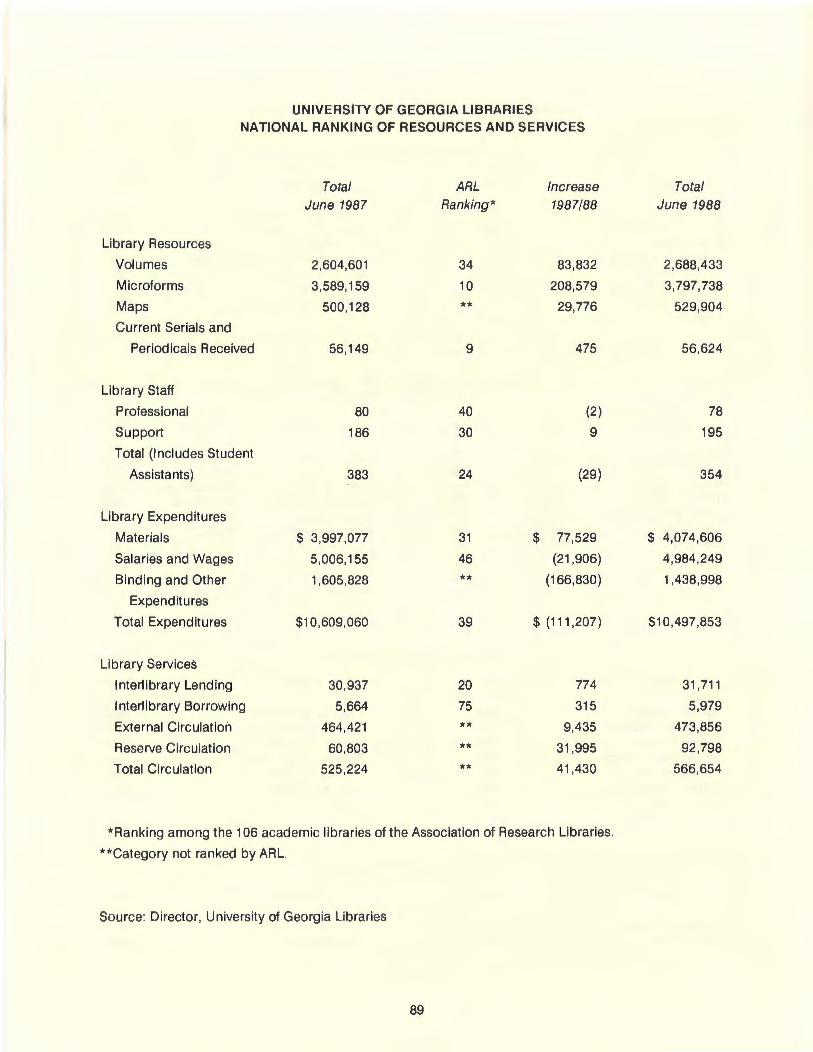
UNIVERSITY OF GEORGIA LIBRARIES NATIONAL RANKING OF RESOURCES AND SERVICES
Total ARL Increase
June 1987 Ranking* 1987/88
Library Resources
Volumes 2,604,601 34 83,832
Microforms 3,589,159 10 208,579
Maps 500,128 ** 29,776
Current Serials and
Periodicals Received 56,149 9 475
Library Staff
Professional 80 40 (2)
Support 186 30 9
Total (Includes Student
Assistants) 383 24 (29)
Library Expenditures
Materials $ 3,997,077 31 $ 77,529
Salaries and Wages 5,006,155 46 (21 ,906)
Binding and Other 1,605,828 ** (166,830)
Expenditures
Total Expenditures $10,609,060 39 $ (111 ,207)
Library Services
Interlibrary Lending 30,937 20 774
Interlibrary Borrowing 5,664 75 315
External Circulation 464,421 ** 9,435
Reserve Circulation 60,803 ** 31,995
Total Circulation 525,224 ** 41,430
*Ranking among the 106 academic libraries of the Association of Research Libraries.
**Category not ranked by ARL.
Source: Director, University of Georgia Libraries
89
Total
June 1988
2,688,433
3,797,738
529,904
56,624
78
195
354
$ 4,074,606
4,984,249
1,438,998
$10,497,853
31 '711
5,979
473,856
92,798
566,654
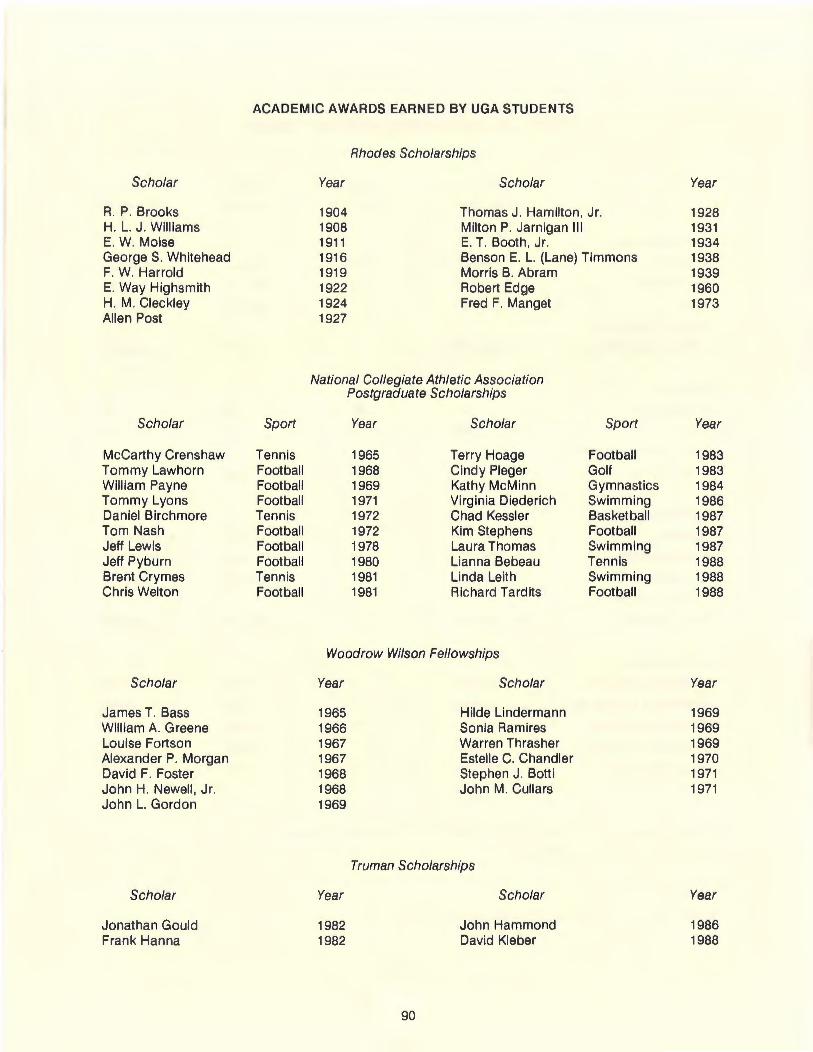
Scholar
A. P. Brooks H. L. J. Williams E. W. Moise George S. Whitehead F. W. Harrold E. Way Highsmith H. M. Cleckley Allen Post
Scholar
McCarthy Crenshaw Tommy Lawhorn William Payne Tommy Lyons Daniel Birchmore Tom Nash Jeff Lewis Jeff Pyburn Brent Crymes Chris Welton
Scholar
James T. Bass William A. Greene Louise Fortson Alexander P. Morgan David F. Foster John H. Newell, Jr. John L. Gordon
Scholar
Jonathan Gould Frank Hanna
ACADEMIC AWARDS EARNED BY UGA STUDENTS
Sport
Tennis Football Football Football Tennis Football Football Football Tennis Football
Year
1904 1908 1911 1916 1919 1922 1924 1927
Rhodes Scholarships
Scholar
Thomas J. Hamilton, Jr. Milton P. Jarnigan Ill E. T. Booth, Jr. Benson E. L. (Lane) Timmons Morris B. Abram Robert Edge Fred F. Manget
National Collegiate Athletic Association Postgraduate Scholarships
Year Scholar
1965 Terry Hoage 1968 Cindy Pleger 1969 Kathy McMinn 1971 Virginia Diederich 1972 Chad Kessler 1972 Kim Stephens 1978 Laura Thomas 1980 Lianna Bebeau 1981 Linda Leith 1981 Richard Tardits
Woodrow Wilson Fellowships
Year
1965 1966 1967 1967 1968 1968 1969
Year
1982 1982
Scholar
Hilde Lindermann Sonia Ramires Warren Thrasher Estelle C. Chandler Stephen J. Botti John M. Cullars
Truman Scholarships
90
Scholar
John Hammond David Kleber
Sport
Football Golf Gymnastics Swimming Basketball Football Swimming Tennis Swimming Football
Year
1928 1931 1934 1938 1939 1960 1973
Year
1983 1983 1984 1986 1987 1987 1987 1988 1988 1988
Year
1969 1969 1969 1970 1971 1971
Year
1986 1988
STUDENT RELATED INFORMATION (ffi) I 7 8 5
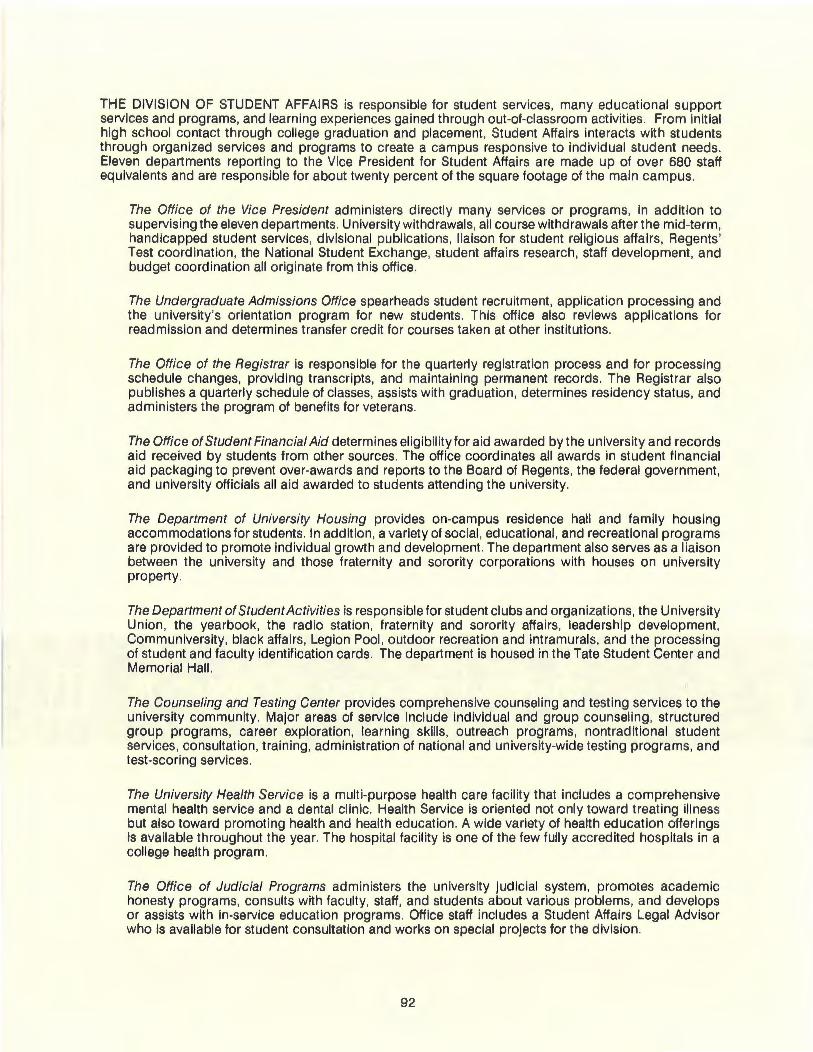
THE DIVISION OF STUDENT AFFAIRS is responsible for student services, many educational support services and programs, and learning experiences gained through out-of-classroom activities. From initial high school contact through college graduation and placement, Student Affairs interacts with students through organized services and programs to create a campus responsive to individual student needs. Eleven departments reporting to the Vice President for Student Affairs are made up of over 680 staff equivalents and are responsible for about twenty percent of the square footage of the main campus.
The Office of the Vice President administers directly many services or programs, in addition to supervising the eleven departments. University withdrawals, all course withdrawals after the mid-term, handicapped student services, divisional publications, liaison for student religious affairs, Regents' Test coordination , the National Student Exchange, student affairs research, staff development, and budget coordination all originate from this office.
The Undergraduate Admissions Office spearheads student recruitment, application processing and the university's orientation program for new students. This office also reviews applications for readmission and determines transfer credit for courses taken at other institutions.
The Office of the Registrar is responsible for the quarterly registration process and for processing schedule changes, providing transcripts, and maintaining permanent records. The Registrar also publishes a quarterly schedule of classes, assists with graduation, determines residency status, and administers the program of benefits for veterans.
The Office of Student Financial Aid determines eligibility for aid awarded by the university and records aid received by students from other sources. The office coordinates all awards in student financial aid packaging to prevent over-awards and reports to the Board of Regents, the federal government, and university officials all aid awarded to students attending the university.
The Department of University Housing provides on-campus residence hall and family housing accommodations for students. In addition, a variety of social, educational , and recreational programs are provided to promote individual growth and development. The department also serves as a liaison between the university and those fraternity and sorority corporations with houses on university property .
The Department of Student Activities is responsible for student clubs and organizations, the University Union, the yearbook, the radio station, fraternity and sorority affairs , leadership development, Communiversity, black affairs, Legion Pool, outdoor recreation and intramurals, and the processing of student and faculty identification cards. The department is housed in the Tate Student Center and Memorial Hall.
The Counseling and Testing Center provides comprehensive counseling and testing services to the university community. Major areas of service include individual and group counseling , structured group programs, career exploration, learning skills, outreach programs, nontraditional student services, consultation , training, administration of national and university-wide testing programs, and test-scoring services.
The University Health Service is a multi-purpose health care facility that includes a comprehensive mental health service and a dental clinic . Health Service is oriented not only toward treating illness but also toward promoting health and health education. A wide variety of health education offerings is available throughout the year. The hospital facility is one of the few fully accredited hospitals in a college health program.
The Office of Judicial Programs administers the university judicial system, promotes academic honesty programs, consults with faculty , staff, and students about various problems, and develops or assists with in-service education programs. Office staff includes a Student Affairs Legal Advisor who is available for student consultation and works on special projects for the division.
92
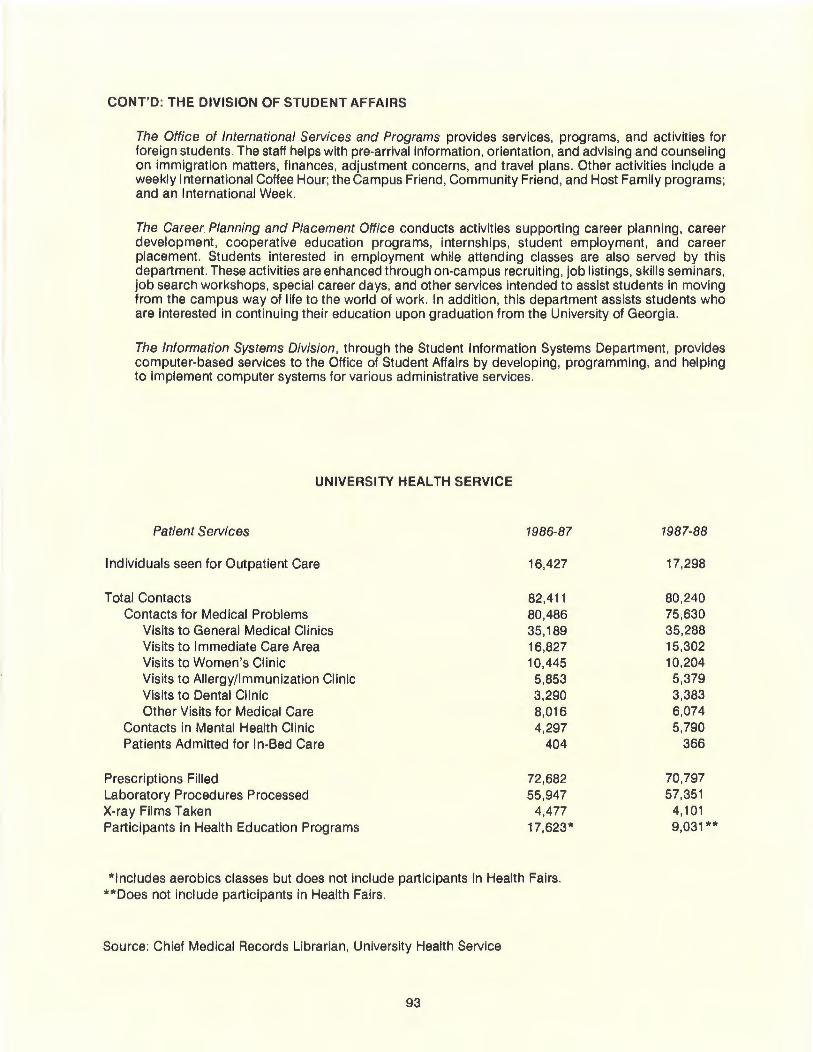
CONT'D: THE DIVISION OF STUDENT AFFAIRS
The Office of International Services and Programs provides services, programs, and activities for foreign students. The staff helps with pre-arrival information, orientation, and advising and counseling on immigration matters, finances, adjustment concerns, and travel plans. Other activities include a weekly International Coffee Hour: the Campus Friend, Community Friend, and Host Family programs: and an International Week.
The Career Planning and Placement Office conducts activities supporting career planning, career development, cooperative education programs, internships, student employment, and career placement. Students interested in employment while attending classes are also served by this department. These activities are enhanced through on-campus recruiting, job listings, skills seminars, job search workshops, special career days, and other services intended to assist students in moving from the campus way of life to the world of work. In addition, this department assists students who are interested in continuing their education upon graduation from the University of Georgia.
The Information Systems Division, through the Student Information Systems Department, provides computer-based services to the Office of Student Affairs by developing, programming, and helping to implement computer systems for various administrative services.
UNIVERSITY HEALTH SERVICE
Patient Services
Individuals seen for Outpatient Care
Total Contacts Contacts for Medical Problems
Visits to General Medical Clinics Visits to Immediate Care Area Visits to Women's Clinic Visits to Allergy/Immunization Clinic Visits to Dental Clinic Other Visits for Medical Care
Contacts in Mental Health Clinic Patients Admitted for In-Bed Care
Prescriptions Filled Laboratory Procedures Processed X-ray Films Taken Participants in Health Education Programs
1986-87
16,427
82,411 80,486 35,189 16,827 10,445 5,853 3,290 8,016 4,297
404
72,682 55,947
4,477 17,623*
* Includes aerobics classes but does not include participants in Health Fairs . **Does not include participants in Health Fairs.
Source: Chief Medical Records Librarian, University Health Service
93
1987-88
17,298
80,240 75,630 35,288 15,302 10,204 5,379 3,383 6,074 5,790
366
70,797 57,351
4,101 9,031 **
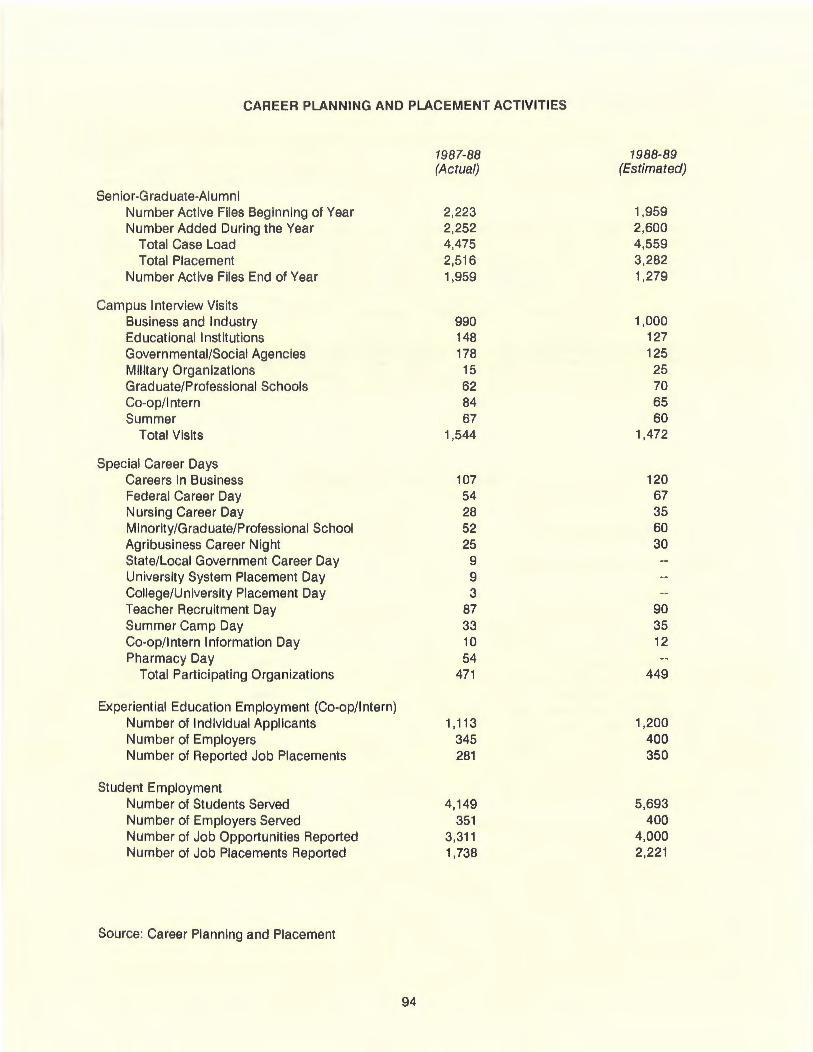
CAREER PLANNING AND PLACEMENT ACTIVITIES
Senior-Grad uate-AI u m n i Number Active Files Beginning of Year Number Added During the Year
Total Case Load Total Placement
Number Active Files End of Year
Campus Interview Visits Business and Industry Educational Institutions Governmental/Social Agencies Military Organizations Graduate/Professional Schools Co-op/1 ntern Summer
Total Visits
Special Career Days Careers in Business Federal Career Day Nursing Career Day Minority/Graduate/Professional School Agribusiness Career Night State/Local Government Career Day University System Placement Day College/University Placement Day Teacher Recruitment Day Summer Camp Day Co-op/Intern information Day Pharmacy Day
Total Participating Organizations
Experiential Education Employment (Co-op/Intern) Number of Individual Applicants Number of Employers Number of Reported Job Placements
Student Employment Number of Students Served Number of Employers Served Number of Job Opportunities Reported Number of Job Placements Reported
Source: Career Planning and Placement
94
1987-88 (Actual)
2,223 2,252 4,475 2,516 1,959
990 148 178 15 62 84 67
1,544
107 54 28 52 25
9 9 3
87 33 10 54
471
1 '113 345 281
4,149 351
3,311 1,738
1988-89 (Estimated)
1,959 2,600 4,559 3,282 1,279
1,000 127 125 25 70 65 60
1,472
120 67 35 60 30
90 35 12
449
1,200 400 350
5,693 400
4,000 2,221
STUDENT FINANCIAL AID PROGRAMS FY 1987-88
Student Aid Program
Scholarships (no repayment required) Inst itutional Scholarship Private Scholarship All Other Scholarships
Subtotal
Grants (no payment required) Pell Grant Supplemental Educational Opportunity Grant Vocat ional Rehabilitation Student Incentive Grant Tuition Waivers Institutional Grants
Subtotal
Loans Repayable by Cash Only Perkins Guaranteed Student Loan Parent Loan Institutional Loans Private Sources All Other Cash Repayment Loans
Subtotal
Repayable by Cash or Service Regents Scholarship Federal Health Professional Loan State Health Careers Loan
Subtotal
Student Employment College Work-Study Program Graduate Assistants Student Assistants
Subtotal
TOTAL
Number of Awards
929 585
1,480 2,994
2,180 231 22
1,618 1 '129
26 5,206
641 3,596
709 55 53
3,023 8,077
79 55 22
156
503 1,814 4,399 6,716
23,149
Amount
$ 2,013,890 895,853
1,340,624 $ 4,250,367
$ 3,110,202 150,853 37,325
585,750 2,438,895
123,320 $ 6,446,345
$ 1,096,095 10,100,943 2,144,032
150,100 115,336 358,650
$13,965,156
$ 52,325 163,875 37,864
$ 254,064
$ 455,076 11,476,708 4,883,297
$16,815,081
$41,731,013
Note: Includes aid administered by the Office of Student Financial Aid, as well as aid reported to OSFA by students, donors, colleges/schools, etc .; does not include aid received by non-resident aliens.
Source: Office of Student Financial Aid
95
SOCIAL SORORITIES AND FRATERNITIES
Date Established Total Members Sororities on Campus Fall 1988
Alpha Chi Omega 1938 150 Alpha Delta Pi 1933 180 Alpha Gamma Delta 1923 130 Alpha Kappa Alpha 1971 30 Alpha Omicron Pi 1934 160 Chi Omega 1922 170 Delta Delta Delta 1933 180 Delta Gamma 1967 120 Delta Phi Epsilon 1935 110 Delta Sigma Theta 1969 40 Delta Zeta 1987 140 Gamma Phi Beta 1982 130 Kappa Alpha Theta 1937 180 Kappa Delta 1924 150 Kappa Kappa Gamma 1947 200 Phi Mu 1921 170 Pi Beta Phi 1936 140 Sigma Delta Tau 1924 100 Sigma Kappa 1964 90 Zeta Tau Alpha 1949 170
TOTAL 2,740
Date Established Total Members Fraternities on Campus Fall 1988
ACACIA 1988 32 Alpha Epsilon Pi 1926 80 Alpha Gamma Rho 1927 35 Alpha Phi Alpha 1969 10 Alpha Tau Omega 85 Beta Theta Pi 1984 60 Chi Psi 1890 60 Delta Tau Delta 1882 60 Kappa Alpha 1868 100 Kappa Alpha Psi 1970 20 Kappa Sigma 1901 80 Lambda Chi Alpha 1915 60 Omega Psi Phi 1973 8 Phi Beta Sigma 1975 5 Phi Delta Theta 1871 60 Phi Gamma Delta 1968 90 Phi Kappa Psi 1974 30 Phi Kappa Tau 1950 40 Phi Kappa Theta 1967 30 Pi Kappa Alpha 1908 100 Pi Kappa Phi 1915 110 Sigma Alpha Epsilon 1866 100 Sigma Chi 1872 90 Sigma Nu 1873 85 Sigma Phi Epsilon 1963 80 Sigma Tau Gamma 22 Tau Epsilon Phi 1919 60 Tau Kappa Epsilon 1971 80 Theta Chi 1948 50
TOTAL 1,722
Source: Coordinator for Clubs and Organizations, Department of Student Activities
96
HONORARY FRATERNITIES/SOCIETIES AT THE UNIVERSITY OF GEORGIA
National Honorary Fraternities/Societies
Alpha Epsilon Delta Alpha Kappa Delta Alpha Lambda Delta Alpha Zeta
Beta Alpha Psi Beta Beta Beta Beta Gamma Sigma Blue Key Brass Gavel Eta Sigma Gamma Gamma Beta Phi Gamma Iota Sigma Gamma Sigma Delta
Gamma Theta Upsilon Golden Key Kappa Delta Epsilon Kappa Delta Pi Kappa Tau Alpha Mortar Board Mu Kappa Tau Omicron Delta Epsilon Omicron Delta Kappa Order of Omega
National Residence Hall Honorary Phi Alpha Theta Phi Beta Delta Phi Beta Kappa Phi Kappa Phi Phi Lambda Sigma Phi Sigma Tau Phi Upsilon Omicron Phi Zeta Pi Alpha Alpha Pi Kappa Lambda Pi Sigma Alpha Psi Chi Rho Chi Sigma Delta Pi Sigma Iota Epsilon Sigma Xi Xi Sigma Pi
Pre-medical Sociology
Type
Freshman Academic Agriculture , Forestry, Veterinary
Medicine, Home Economics, and Environmental Design
Accounting Biological Sciences Commerce and Business Administration Student Activities Leadership (Agriculture) Health and Safety General Risk Management and Insurance Agriculture, Forestry, Home Economics,
and Veterinary Medicine Geography Scholastic Education Education Journalism Leadership Marketing Economics Leadership Leadership (Fraternities and
Sororities) Leadership History International Interests Liberal Arts General Pharmacy Philosophy Home Economics Veterinary Medicine Public Administration Music Government and Political Science Psychology Pharmacy Spanish Management Scientific Research Forestry
In addition to the national honoraries, the following local honorary fraternities exist to recognize student achievement:
Abeneefoo Kuo Society Aghon Society
Source: Department of Student Activities
General Agriculture, Forest Resources,
Veterinary Medicine
97
Date Established on Campus
1932 1965 1934 1914
1963 1987 1918 1926 1983 1983 1981 1975 1961
1966 1978 1956 1929 1929 1939 1966 1963 1934 1980
1979 1956 1987 1914 1923 1974 1973 1936 1925 1977 1968 1948 1929 1949 1955 1971 1946 1941
1987 1920
STUDENT HOUSING
Residence Halls
Date of Date of Women's Initial Fall 1988 Men's Initial Fall 1988
Dorms Occupancy Occupancy Capacity Dorms Occupancy Occupancy Capacity
Boggs 1961 159 161 Hill 1961 162 165 Brumby 1966 945 952 Lipscomb 1961 159 159 Church 1961 158 161 McWhorter 1967 183 238 Mary Lyndon 1937 118 120 Milledge 1921 135 147 Mel I 1961 159 161 Morris 1957 131 141 Payne 1939 217 217 Russell 1967 948 974 Rutherford 1938 156 156 Subtotal 1 ,718 1,824 Soule 1982 0 0
Subtotal 1 ,912 1,928
Date of Women Men Total Coeducational Initial Fall 1988 Fall 1988 Fall 1988
Dorms Occupancy Occupancy Capacity Occupancy Capacity Occupancy Capacity
Creswell 1963 824 857 116 121 940 978 Myers 1953 158 161 306 317 464 478 Oglethorpe House 1979 288 289 215 216 503 505 Reed 1953 248 244 192 197 440 441
Subtotal 1 ,518 1 ,551 829 851 2,347 2,402
Occupancy Capacity
Women's Total 3,430 3,479 Men's Total 2,547 2,675
TOTAL 5,977 6,154
Student Family Housing
Fall 1988 Fall 1988 Date of Initial Occupancy Capacity
Building Occupancy (Units) (Units)
University Village A 1964 28 28 University Village B 1964 24 24 University Village C 1964 24 24 University Village D 1964 29 29 University Village E 1966 28 28 University Village F 1966 24 24 University Village G 1966 24 24 University Village H 1966 24 24 University Village J 1966 36 36 University Village K 1966 34 34 University Village L 1966 30 30 University Village M 1973 36 36 University Village N 1973 36 36 University Village P 1973 42 42 University Village Q 1973 42 42 University Village A 1973 42 42 University Village S 1973 42 42
TOTAL 545 545
98
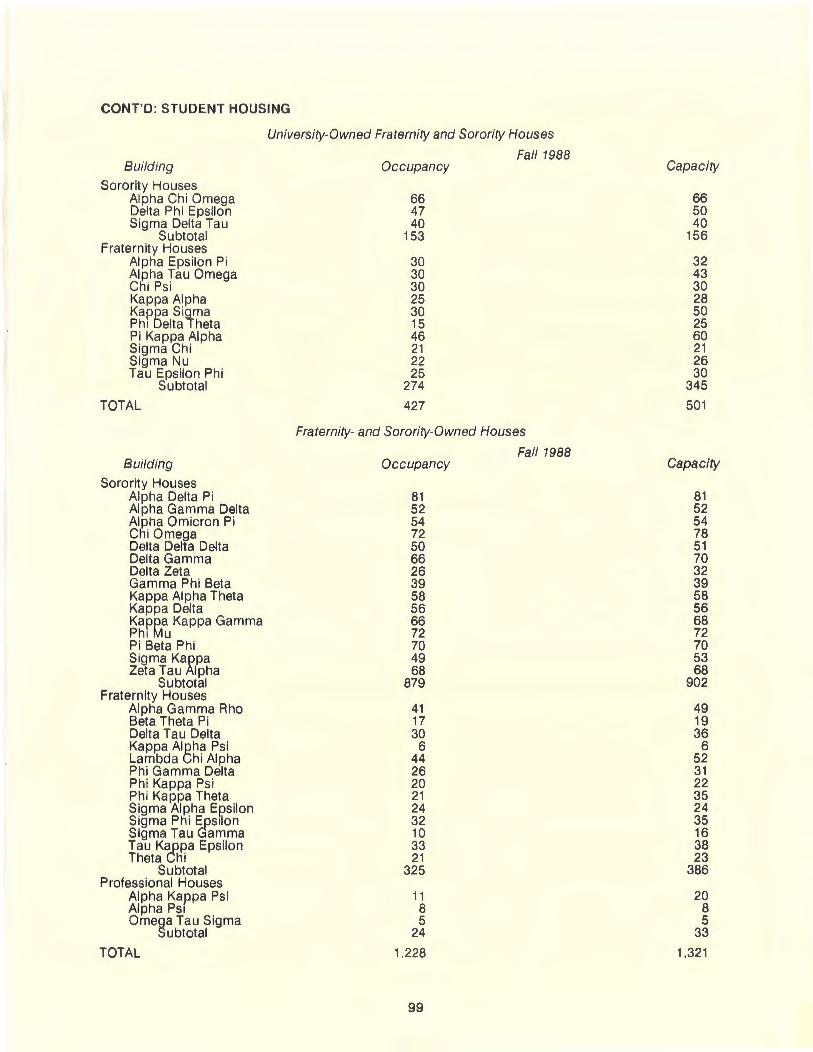
CONT'D: STUDENT HOUSING
University-Owned Fraternity and Sorority Houses
Fall 1988 Building Occupancy Capacity
Sorority Houses Alpha Chi Omega 66 66 Delta Phi Epsilon 47 50 Sigma Delta Tau 40 40
Subtotal 153 156 Fraternity Houses
Alpha Epsilon Pi 30 32 Alpha Tau Omega 30 43 Chi Psi 30 30 Kappa Alpha 25 28 Kapga Si~ma 30 50 Ph1 elta heta 15 25 Pi Kappa Alpha 46 60 Sigma Chi 21 21 Sigma Nu 22 26 Tau Epsilon Phi 25 30
Subtotal 274 345
TOTAL 427 501
Fraternity- and Sorority-Owned Houses
Fall 1988 Building Occupancy Capacity
Sorority Houses Alpha Delta Pi 81 81 Alpha Gamma Delta 52 52 Alpha Omicron Pi 54 54 Chi Omega 72 78 Delta Delta Delta 50 51 Delta Gamma 66 70 Delta Zeta 26 32 Gamma Phi Beta 39 39 Kappa Alpha Theta 58 58 Kappa Delta 56 56 Kap~a Kappa Gamma 66 68 Ph1 u 72 72 Pi Beta Phi 70 70 Sigma Ka~pa 49 53 Zeta Tau lpha 68 68
Subtotal 879 902 Fraternity Houses
Alpha Gamma Rho 41 49 Beta Theta Pi 17 19 Delta Tau Delta 30 36 Kappa Algha Psi 6 6 Lambda hi Alpha 44 52 Phi Gamma Delta 26 31 Phi Kappa Psi 20 22 Phi Kappa Theta 21 35 Sigma Alpha Epsilon 24 24 Sigma Phi ~s1lon 32 35 Sigma Tau amma 10 16 Tau K~pa Epsilon 33 38 Theta hi 21 23
Subtotal 325 386 Professional Houses
Alpha Kappa Psi 11 20 Alpha PSI 8 8 Ome~a Tau Sigma 5 5
ubtotal 24 33
TOTAL 1.228 1,321
99
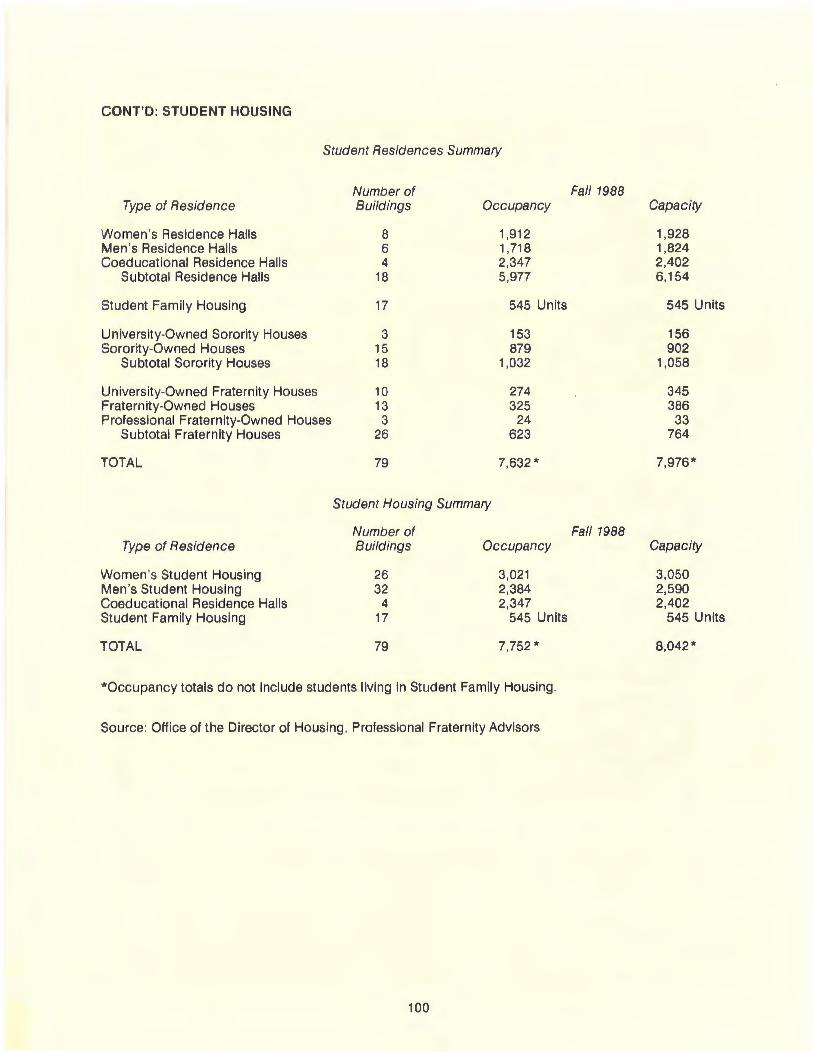
CONT'D: STUDENT HOUSING
Student Residences Summary
Number of Fa ll 1988 Type of Residence Buildings Occupancy Capacity
Women's Res idence Hall s 8 1,912 1,928 Men's Residence Hall s 6 1 ,718 1,824 Coeducational Residence Halls 4 2,347 2,402
Subtotal Residence Halls 18 5,977 6,154
Student Family Housing 17 545 Units 545 Units
University-Owned Sorority Houses 3 153 156 Sorority-Owned Houses 15 879 902
Subtotal Sorority Houses 18 1,032 1,058
University-Owned Fraternity Houses 10 274 345 Fraternity-Owned Houses 13 325 386 Professional Fraternity-Owned Houses 3 24 33
Subtotal Fraternity Houses 26 623 764
TOTAL 79 7,632 * 7,976*
Student Housing Summary
Number of Fa ll 1988 Type of Residence Buildings Occupancy Capacity
Women's Student Housing 26 3,021 3,050 Men 's Student Housing 32 2,384 2,590 Coeducational Residence Halls 4 2,347 2,402 Student Family Housing 17 545 Units 545 Units
TOTAL 79 7,752 * 8,042*
*Occupancy totals do not include students living in Student Family Housing.
Source: Office of the Director of Housing, Professional Fraternity Advisors
100
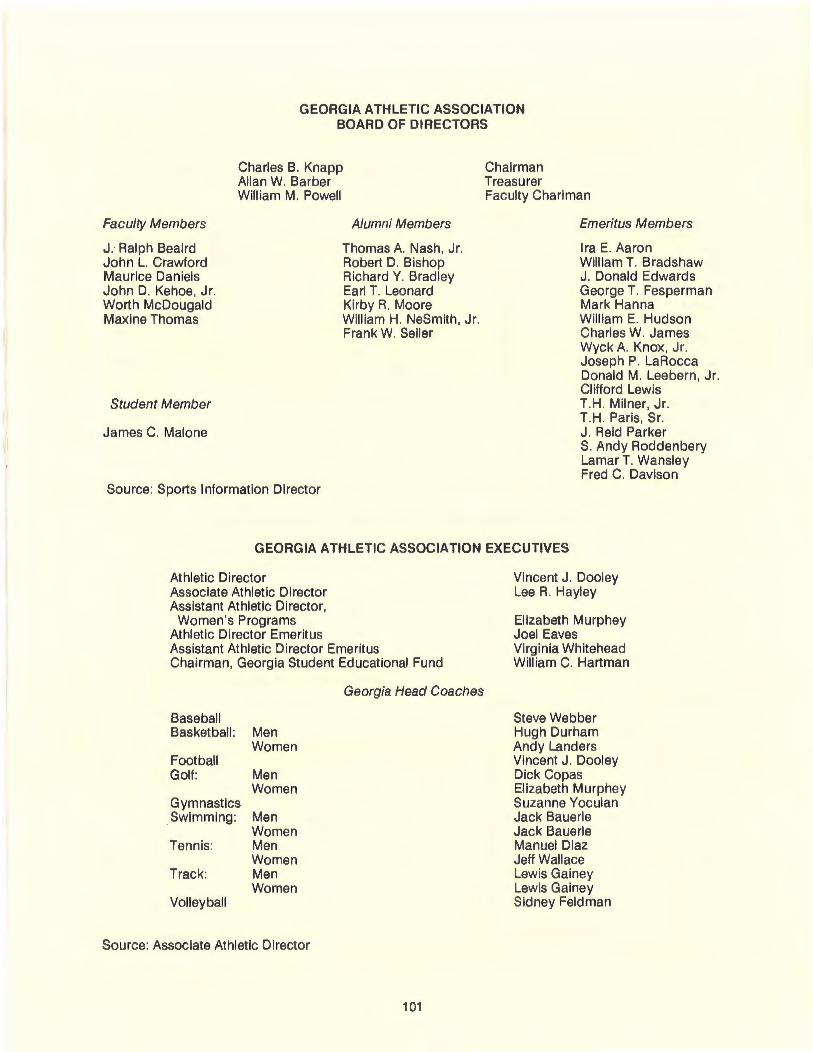
GEORGIA ATHLETIC ASSOCIATION BOARD OF DIRECTORS
Faculty Members
J. Ralph Beaird John L. Crawford Maurice Daniels John D. Kehoe, Jr. Worth McDougald Maxine Thomas
Student Member
James C. Malone
Charles B. Knapp Allan W. Barber William M. Powell
Alumni Members
Thomas A. Nash, Jr. Robert D. Bishop Richard Y. Bradley Earl T. Leonard Kirby R. Moore William H. NeSmith, Jr. Frank W. Seiler
Source: Sports Information Director
Chairman Treasurer Faculty Chariman
Emeritus Members
Ira E. Aaron William T. Bradshaw J. Donald Edwards George T. Fesperman Mark Hanna William E. Hudson Charles W. James Wyck A. Knox, Jr. Joseph P. LaRocca Donald M. Leebern, Jr. Clifford Lewis T.H. Milner, Jr. T.H. Paris, Sr. J. Reid Parker S. Andy Roddenbery Lamar T. Wansley Fred C. Davison
GEORGIA ATHLETIC ASSOCIATION EXECUTIVES
Athletic Director Associate Athletic Director Assistant Athletic Director,
Women's Programs Athletic Director Emeritus Assistant Athletic Director Emeritus Chairman, Georgia Student Educational Fund
Baseball Basketball:
Football Golf:
Gymnastics .Swimming:
Tennis:
Track:
Volleyball
Men Women
Men Women
Men Women Men Women Men Women
Source: Associate Athletic Director
Georgia Head Coaches
101
Vincent J. Dooley LeeR. Hayley
Elizabeth Murphey Joel Eaves Virginia Whitehead William C. Hartman
Steve Webber Hugh Durham Andy Landers Vincent J. Dooley Dick Copas Elizabeth Murphey Suzanne Yoculan Jack Bauerle Jack Bauerle Manuel Diaz Jeff Wallace Lewis Gainey Lewis Gainey Sidney Feldman
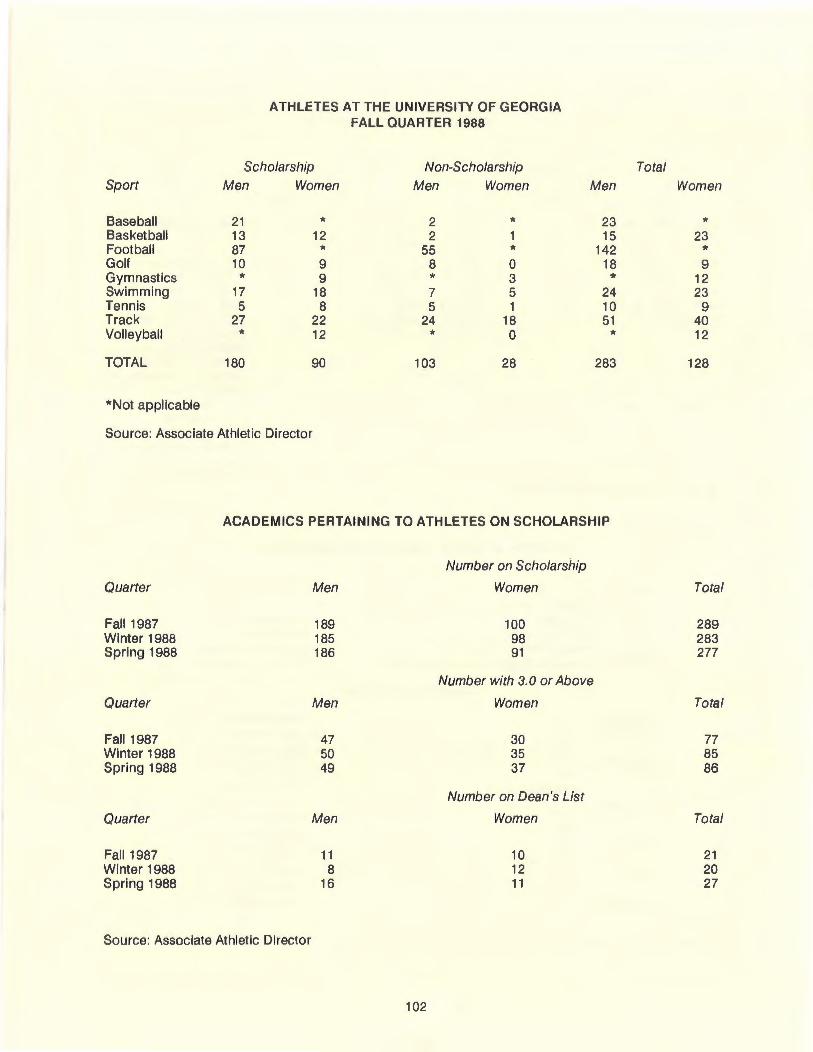
Sport
Baseball Basketball Football Golf Gymnastics Swimming Tennis Track Volleyball
TOTAL
*Not applicable
ATHLETES AT THE UNIVERSITY OF GEORGIA FALL QUARTER 1988
Scholarship Non-Scholarship
Men Women Men Women
21 * 2 * 13 12 2 87 * 55 * 10 9 8 0
* 9 * 3 17 18 7 5 5 8 5 1
27 22 24 18 * 12 * 0
180 90 103 28
Men
23 15
142 18
* 24 10 51 *
283
Source: Associate Athletic Director
ACADEMICS PERTAINING TO ATHLETES ON SCHOLARSHIP
Number on Scholarship
Quarter Men Women
Fall 1987 189 100 Winter 1988 185 98 Spring 1988 186 91
Number with 3.0 or Above
Quarter Men Women
Fall 1987 47 30 Winter 1988 50 35 Spring 1988 49 37
Number on Dean's List
Quarter Men Women
Fall1987 11 10 Winter 1988 8 12 Spring 1988 16 11
Source: Associate Athletic Director
102
Total
Women
* 23
* 9
12 23
9 40 12
128
Total
289 283 277
Total
77 85 86
Total
21 20 27
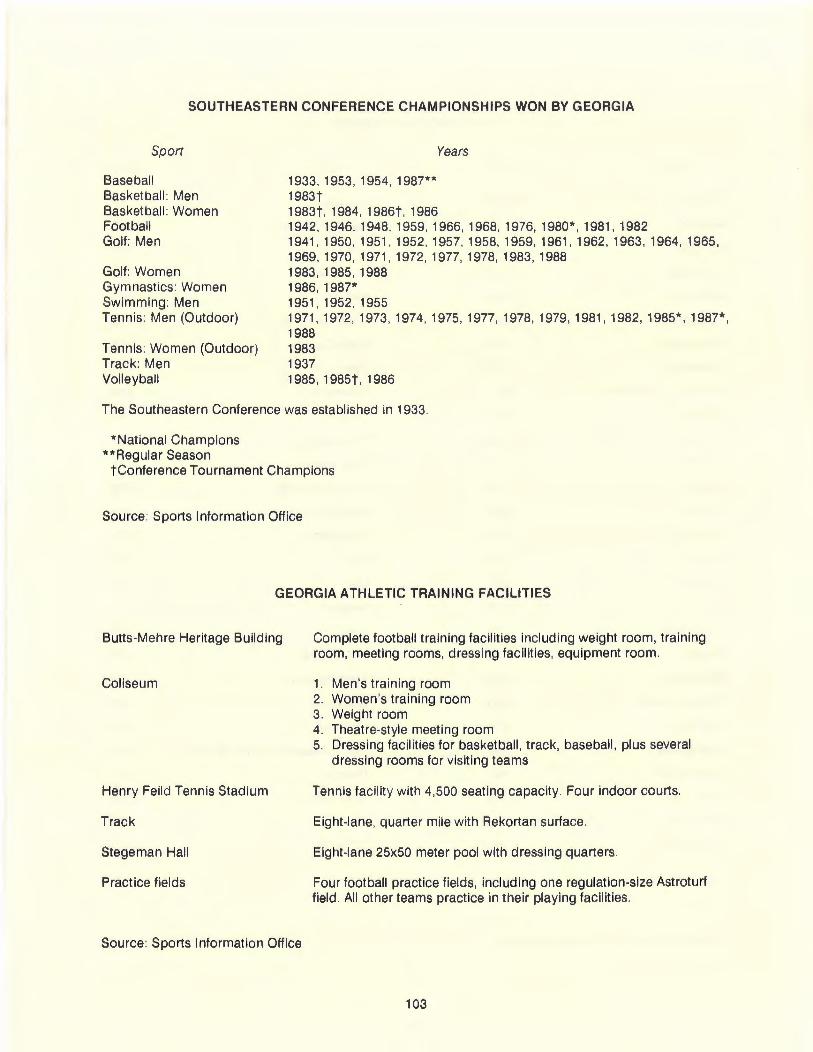
SOUTHEASTERN CONFERENCE CHAMPIONSHIPS WON BY GEORGIA
Sport
Baseball Basketball Men Basketball : Women Football Golf: Men
Golf: Women Gymnastics: Women Swimming : Men Tennis: Men (Outdoor)
Tennis : Women (Outdoor) Track: Men Volleyball
1933, 1953, 1954, 1987** 1983t
Years
1983t, 1984, 1986t, 1986 1942, 1946, 1948, 1959, 1966, 1968, 1976, 1980*, 1981,1982 1941 , 1950, 1951 , 1952, 1957, 1958, 1959, 1961,1962, 1963, 1964, 1965, 1969, 1970, 1971 , 1972, 1977, 1978, 1983, 1988 1983, 1985, 1988 1986, 1987* 1951 , 1952, 1955 1971,1972,1973, 1974, 1975,1977,1978,1979,1981,1982, 1985*, 1987*, 1988 1983 1937 1985, 1985t, 1986
The Southeastern Conference was established in 1933.
* National Champions **Regular Season
tConference Tournament Champions
Source: Sports Information Office
GEORGIA ATHLETIC TRAINING FACILITIES
Butts-Mehre Heritage Building
Coliseum
Henry Feild Tennis Stadium
Track
Stegeman Hall
Practice fields
Source: Sports Information Office
Complete football training facilities including weight room, training room, meeting rooms, dressing facilities, equipment room.
1. Men's training room 2. Women's training room 3. Weight room 4. Theatre-style meeting room 5. Dressing facilities for basketball, track, baseball, plus several
dressing rooms for visiting teams
Tennis facility with 4,500 seating capacity. Four indoor courts.
Eight-lane, quarter mile with Rekortan surface.
Eight-lane 25x50 meter pool with dressing quarters.
Four football practice fields, including one regulation-size Astroturf field All other teams practice in their playing facilities.
103
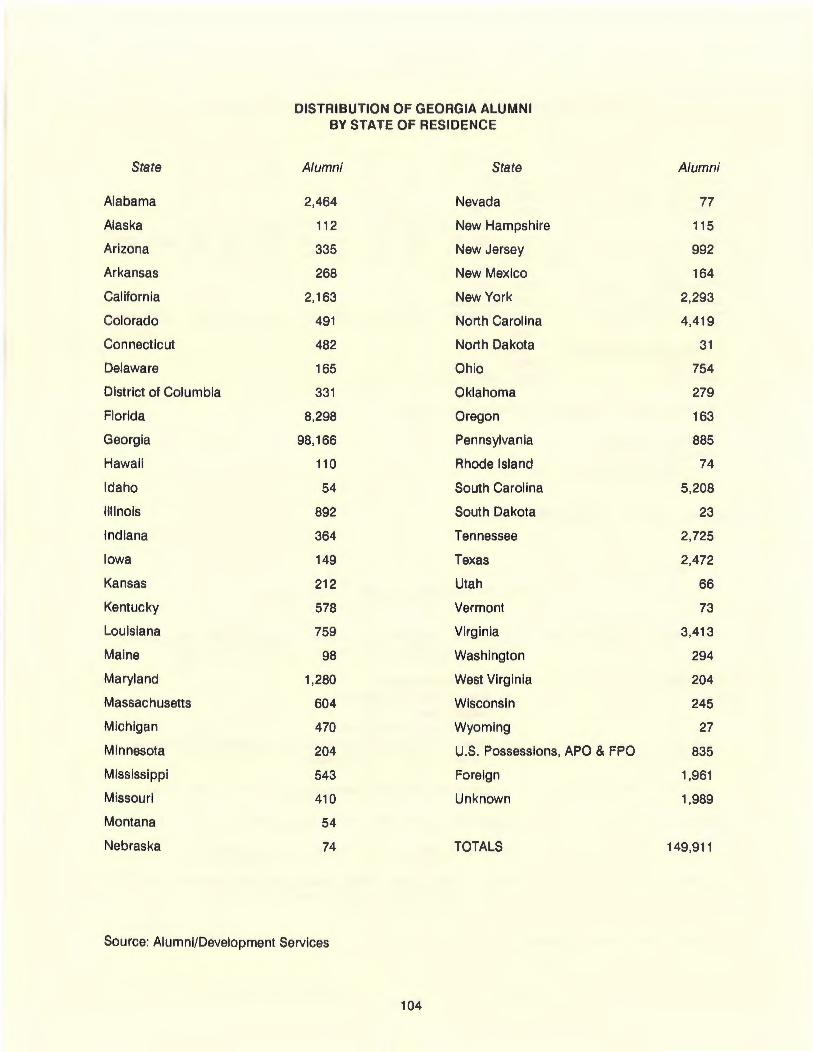
DISTRIBUTION OF GEORGIA ALUMNI BY STATE OF RESIDENCE
State Alumni State Alumni
Alabama 2,464 Nevada 77
Alaska 112 New Hampshire 115
Arizona 335 New Jersey 992
Arkansas 268 New Mexico 164
California 2,163 New York 2,293
Colorado 491 North Carolina 4,419
Connecticut 482 North Dakota 31
Delaware 165 Ohio 754
District of Columbia 331 Oklahoma 279
Florida 8,298 Oregon 163
Georgia 98,166 Pennsylvania 885
Hawaii 110 Rhode Island 74
Idaho 54 South Carolina 5,208
Illinois 892 South Dakota 23
Indiana 364 Tennessee 2,725
Iowa 149 Texas 2,472
Kansas 212 Utah 66
Kentucky 578 Vermont 73
Louisiana 759 Virginia 3,413
Maine 98 Washington 294
Maryland 1,280 West Virginia 204
Massachusetts 604 Wisconsin 245
Michigan 470 Wyoming 27
Minnesota 204 U.S. Possessions, APO & FPO 835
Mississippi 543 Foreign 1,961
Missouri 410 Unknown 1,989
Montana 54
Nebraska 74 TOTALS 149,911
Source: Alumni/Development Services
104
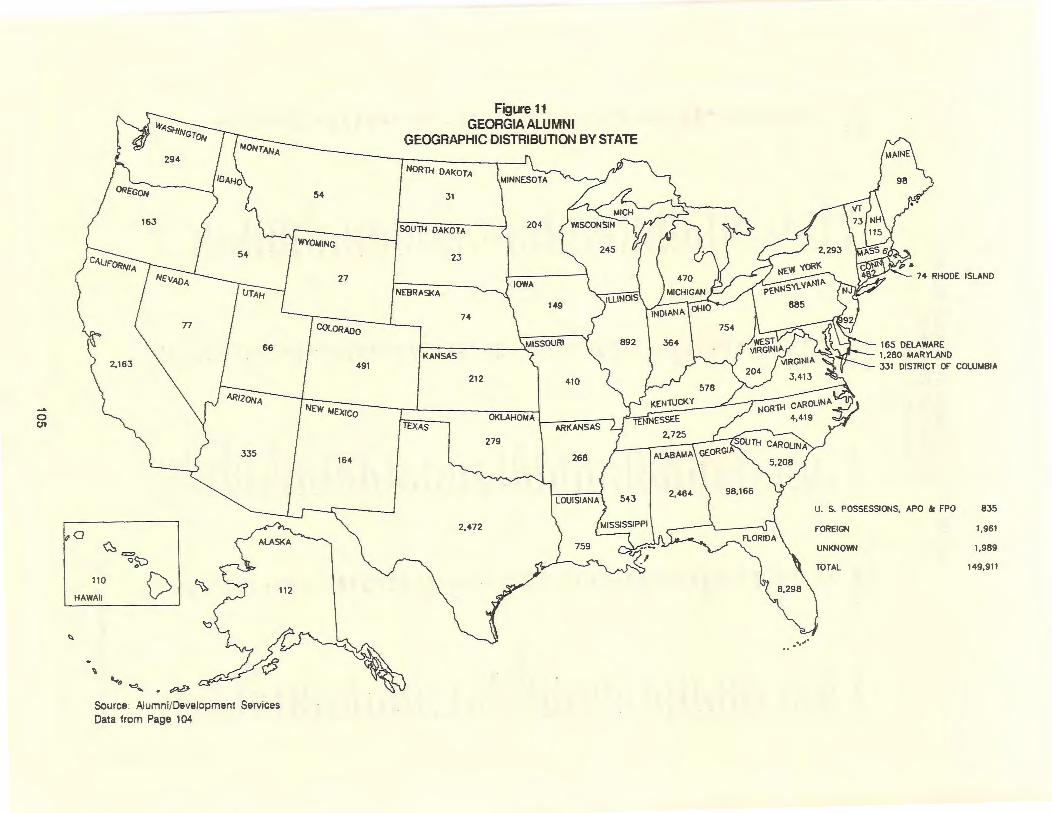
0 (11
335
0 ~ = <v$:)
110 ~ 112
HAWAII {)I
"' \
·~ .. ""'... • eP.h
Source : Alumni /Development Services Data from Page 104
Figure 11 GEORGIA ALUMNI
GEOGRAPHIC DISTRIBUTION BY STATE
NORTH DAKOTA
31
~SOUTH DAKOTA
23
27
NEBRASKA
74 COLORADO
KANSAS 491
212 410
TEXAS OKLAHOMA ~ ARKANSAS I
279
164 268
2,472
......
165 DELAWARE 1,280 MARYLAND 331 DISTRICT OF COLUMBIA
U. S. POSSESSIONS, APO & FPO 835
FOREIGN
UNKNOWN
TOTAL
1,961
1,989
149,911
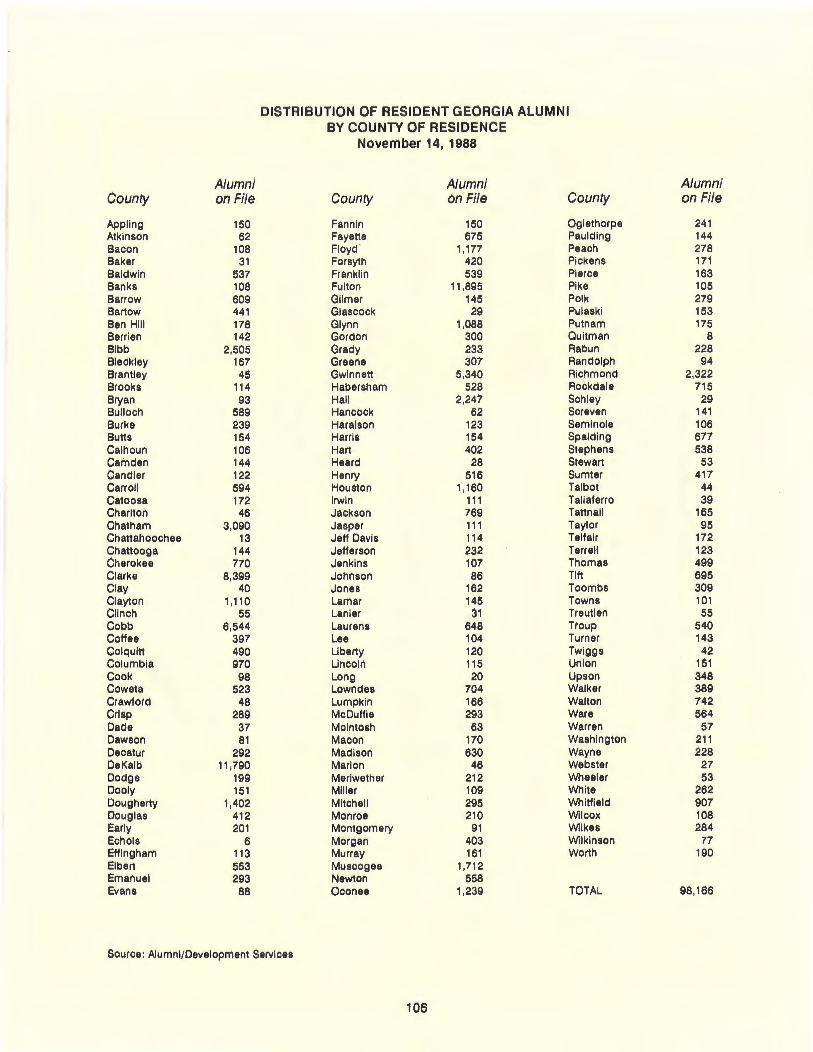
OISTRIBUTION OF RESIDENT GEORGIA ALUMNI BY COUNTY OF RESIDENCf:
November 14, 1988
Alumni Alumni Alumni County on File County on File County on File
Appling 150 Fannin 150 Oglethorpe 241 Atkinson 62 Fayette 675 Paulding 144 Bacon 108 Floyd 1,177 Peach 278 Baker 31 Forsyth 420 Pickens 171 Baldwin 537 Franklin 539 Pierce 163 Banks 108 Fulton 11,895 Pike 105 Barrow 609 Gilmer 145 Polk 279 Bartow 441 Glascock 29 Pulaski 153 Ben Hill 178 Glynn 1,088 Putnam 175 Berrien 142 Gordon 300 Quitman 8 Bibb 2,505 Grady 233 Rabun 228 Bledkley 167 Greene 307 Randolph 94 Brantley 45 Gwinnett 5,340 Richmond 2,322 Brooks 114 Habersham 528 Rockdale 715 Bryan 93 Hall 2,247 Schley 29 Bulloch 589 Hancock 62 Screven 141 Burke 239 Haralson 123 Seminole 106 Butts 154 Harris 154 Spalding 677 Calhoun 106 Hart 402 Stephens 538 Camden 144 Heard 28 Stewart 53 Candler 122 Henry 516 Sumter 417 Carroll 594 Houston 1,160 Talbot 44 Catoosa 172 Irwin 111 Taliaferro 39 Charlton 46 Jackson 769 Tattnall 165 Chatham 3,090 Jasper 111 Taylor 95 Chattahoochee 13 Jeff Davis 114 Telfair 172 Chattooga 144 Jefferson 232 Terrell 123 Cherokee 770 Jenkins 107 Thomas 499 Clarke 8,399 Johnson 86 Tif1 695 Clay 40 Jones 162 Toombs 309 Clayton 1 '1 10 Lamar 145 Towns 101 Clinch 55 Lanier 31 Treutlen 55 Cobb 6,544 Laurens 648 Troup 540 Coffee 397 Lee 104 Turner 143 Colquitt 490 Liberty 120 Twiggs 42 Columbia 970 Lincoln 115 Union 151 Cook 98 Long 20 Upson 348 Coweta 523 Lowndes 704 Walker 389 Crawford 48 Lumpkin 166 Walton 742 Crisp 289 McDuffie 293 Ware 564 Dade 37 Me Intosh 63 Warren 57 Dawson 81 Macon 170 Washington 211 Decatur 292 Madison 630 Wayne 228 DeKalb 11,190 Marl on 46 Webster 27 Dodge 199 Meriwether 212 Wheeler 53 Dooly 151 Miller 109 White 262 Dougherty 1,402 MitChell 295 Whitfield 907 Douglas 412 Monroe 210 Wilcox 108 Early 201 Montgomery 91 Wilkes 284 Echols 6 Morgan 403 Wilkinson 77 Effingham 113 Murray 161 Worth 190 Elbert 553 Muscogee 1,712 Emanuel 293 Newton 558 Evans 88 Oconee 1,239 TOTAL 98,166
Source: Alumni/Development Services
106
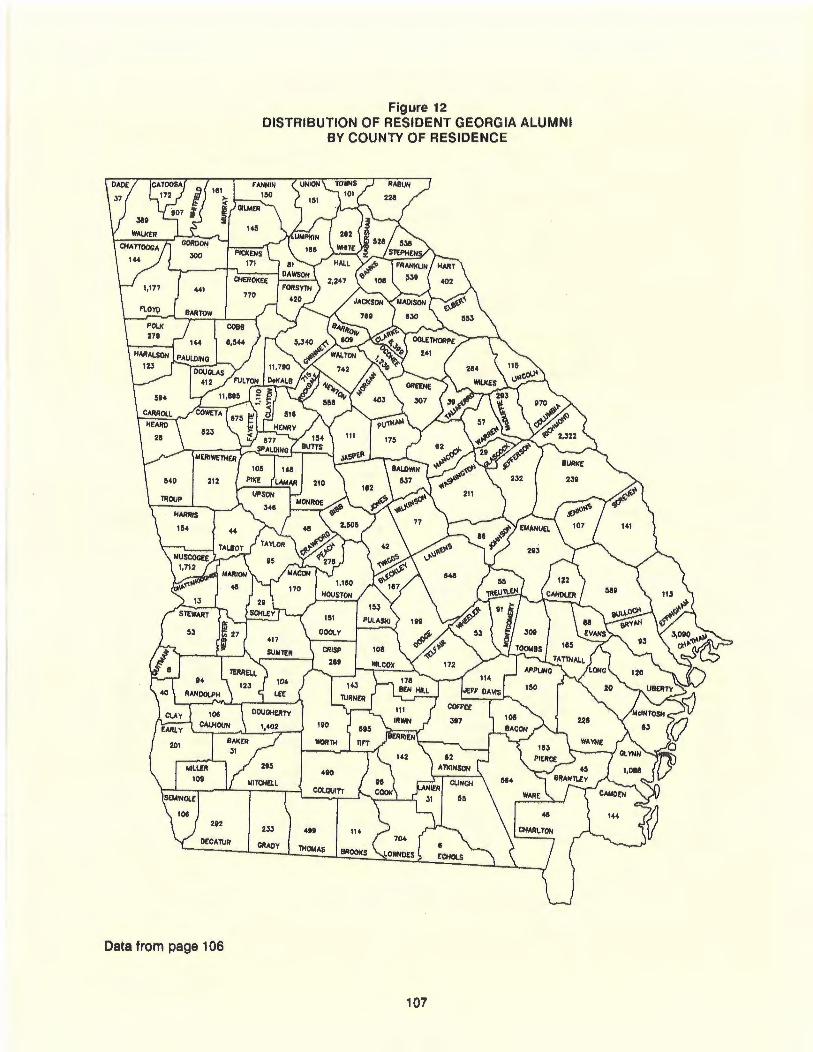
Data from page 1 06
Figure 12 DISTRIBUTION OF RESIDENT GEORGIA ALUMNI
BY COUNTY OF RESIDENCE
107
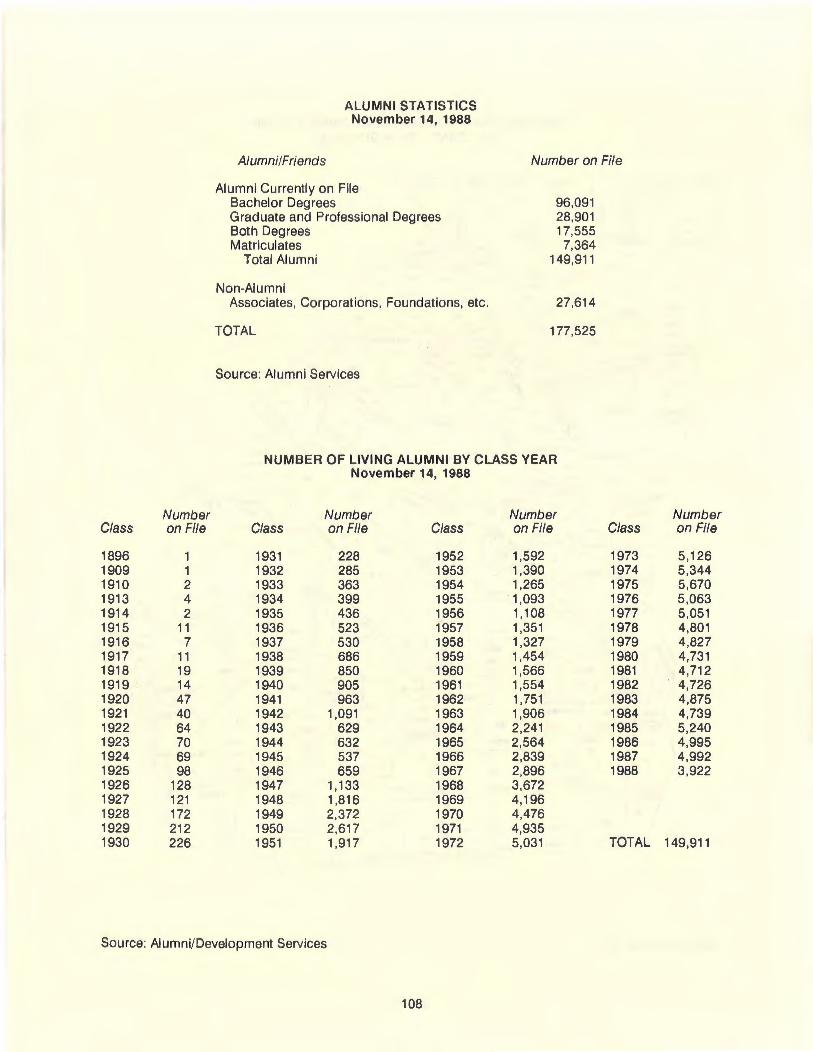
Alumni/Friends
ALUMNI STATISTICS November 14, 1988
Alumni Currently on File Bachelor Degrees Graduate and Professional Degrees Both Degrees Matriculates
Total Alumni
Non-Alumni Associates , Corporations, Foundations, etc .
TOTAL
Source: Alumni Services
Number on File
96,091 28,901 17,555 7,364
149,911
27,614
177,525
NUMBER OF LIVING ALUMNI BY CLASS YEAR November 14, 1988
Number Number Number Class on File Class on File Class on File Class
1896 1 1931 228 1952 1,592 1973 1909 1 1932 285 1953 1,390 1974 1910 2 1933 363 1954 1,265 1975 1913 4 1934 399 1955 1,093 1976 1914 2 1935 436 1956 1 '1 08 1977 1915 11 1936 523 1957 1,351 1978 1916 7 1937 530 1958 1,327 1979 1917 11 1938 686 1959 1,454 1980 1918 19 1939 850 1960 1,566 1981 1919 14 1940 905 1961 1,554 1982 1920 47 1941 963 1962 1,751 1983 1921 40 1942 1,091 1963 1,906 1984 1922 64 1943 629 1964 2,241 1985 1923 70 1944 632 1965 2,564 1986 1924 69 1945 537 1966 2,839 1987 1925 98 1946 659 1967 2,896 1988 1926 128 1947 1 '133 1968 3,672 1927 121 1948 1,816 1969 4,196 1928 172 1949 2,372 1970 4,476 1929 212 1950 2,617 1971 4,935 1930 226 1951 1,917 1972 5,031 TOTAL
Source: Alumni/Development Services
108
Number on File
5,126 5,344 5,670 5,063 5,051 4,801 4,827 4,731 4,712 4,726 4,875 4,739 5,240 4,995 4,992 3,922
149,911
FACULTY AND STAFF (ffi I 7 8 5
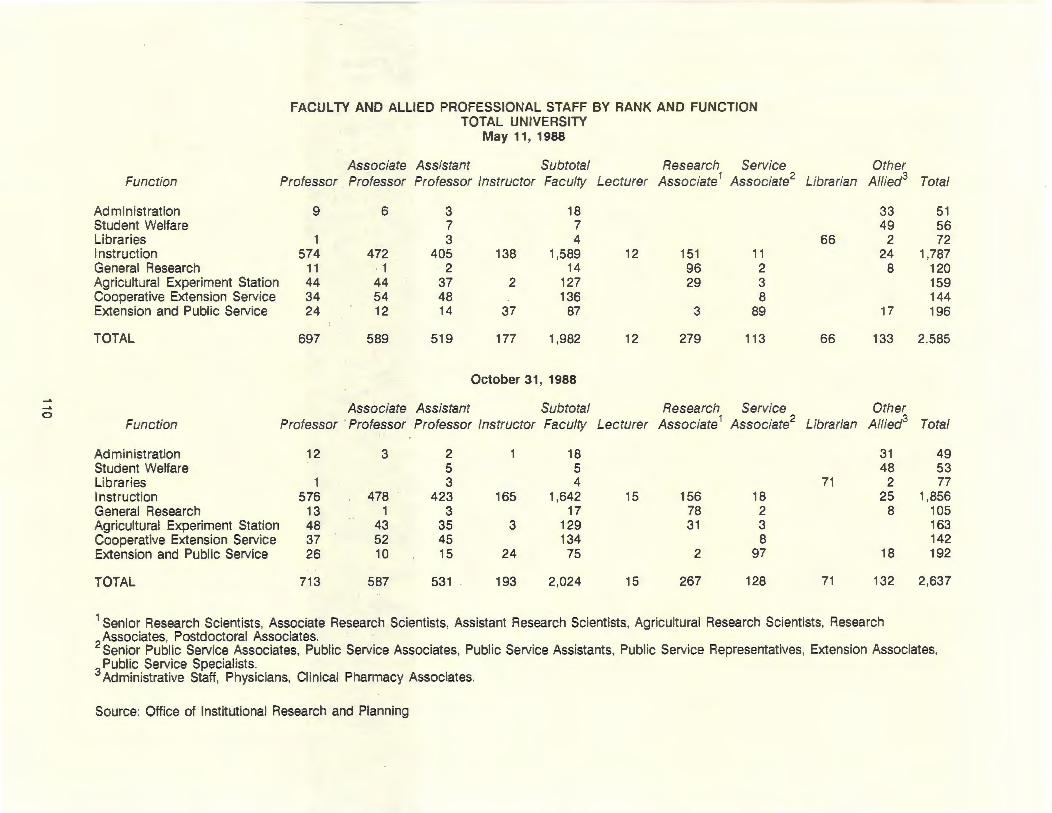
FACUL TV AND ALLIED PROFESSIONAL STAFF BY RANK AND FUNCTION TOTAL UNIVERSITY
May 11, 1988
Associate Assistant Subtotal Research Service Other Function Professor Professor Professor Instructor Faculty Lecturer Associate 1 Associate2 Librarian Allied3 Total
Administration 9 6 3 18 33 51 Student Welfare 7 7 49 56 Libraries 1 3 4 66 2 72 Instruction 574 472 405 138 1,589 12 151 11 24 1,787 General Research 11 ' 1 2 14 96 2 8 120 Agricultural Experiment Station 44 44 37 2 127 29 3 159 Cooperative Extension Service 34 54 48 136 8 144 Extension and Public Service 24 12 14 37 87 3 89 17 196
TOTAL 697 589 519 177 1,982 12 279 113 66 133 2,585
October 31, 1988
0 Associate Assistant Subtotal Research Service Other
Function Professor ·Professor Professor Instructor Faculty Lecturer Associate 1 Associate2 Librarian Allied3 Total
Administration 12 3 2 1 18 31 49 Student Welfare 5 5 48 53 Libraries 1 3 4 71 2 77 Instruction 576 478 423 165 1,642 15 156 18 25 1,856 General Research 13 1 3 17 78 2 8 105 Agricultural Experiment Station 48 43 35 3 129 31 3 163 Cooperative Extension Service 37 52 45 134 8 142 Extension and Public Service 26 10 15 24 75 2 97 18 192
TOTAL 713 !:)87 531 193 2,024 15 267 128 71 132 2,637
1 Senior Research Scientists, Associate Research Scientists, Assistant Research Scientists, Agricultural Research Scientists, Research Associates, Postdoctoral Associates. ·
2 Senior Public Service Associates, Public Service Associates, Public Service Assistants, Public Service Representatives, Extension Associates, Public Service Specialists.
3 Administrative Staff, Physicians, Clinical Pharmacy Associates.
Source: Office of Institutional Research and Planning
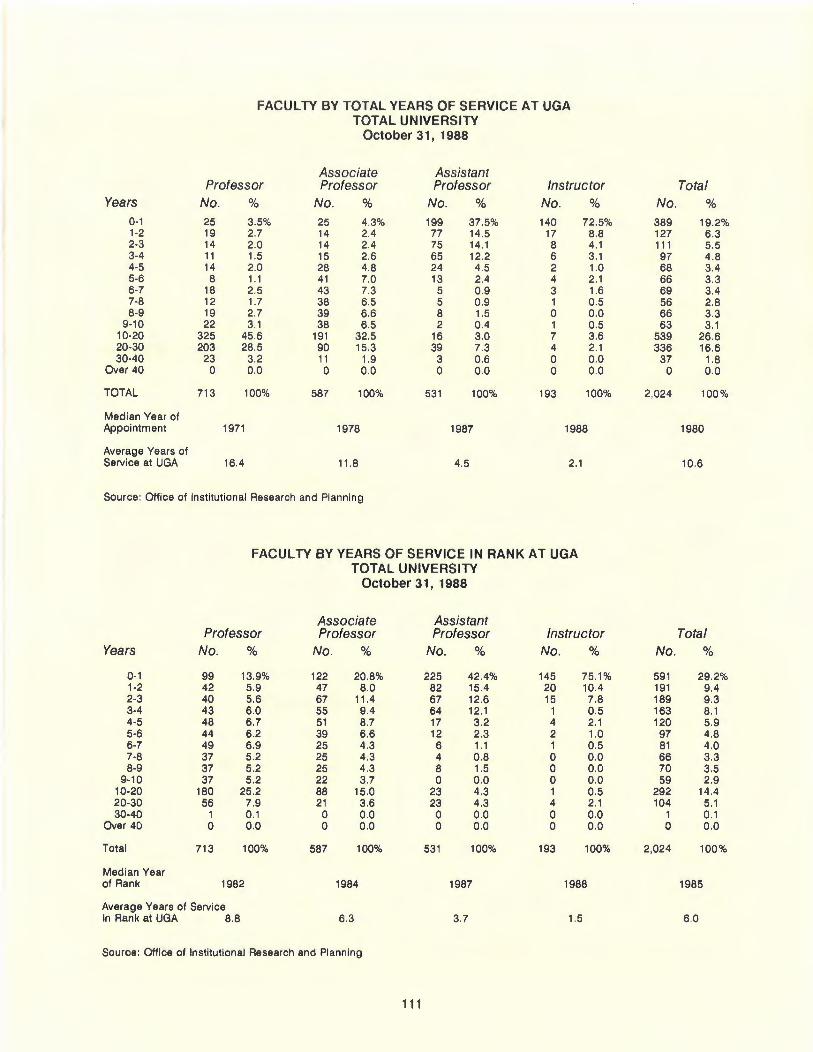
FACULTY BY TOTAL YEARS OF SERVICE AT UGA TOTAL UNIVERSITY
October 31, 1988
Associate Assistant Professor Professor Professor Instructor
Years No. % No. % No. % No. %
0-1 25 3.5% 25 4.3% 199 37.5% 140 72.5% 1-2 19 2.7 14 2.4 77 14.5 17 88 2-3 14 2.0 14 2.4 75 14.1 8 4.1 3-4 11 1.5 15 2.6 65 12.2 6 3.1 4-5 14 2.0 28 4.8 24 4.5 2 1.0 5-6 8 1.1 41 7.0 13 2.4 4 2.1 6-7 18 2.5 43 7.3 5 0.9 3 1.6 7-8 12 1.7 38 6.5 5 0.9 1 0.5 8-9 19 2.7 39 6.6 8 1.5 0 0.0
9-10 22 3.1 38 6.5 2 0.4 1 0.5 10-20 325 45.6 191 32.5 16 3.0 7 3.6 20-30 203 28 5 90 15.3 39 7.3 4 2.1 30-40 23 3.2 11 1.9 3 0.6 0 0.0
Over 40 0 0.0 0 0.0 0 0.0 0 0.0
TOTAL 713 100% 587 100% 531 100% 193 100%
Median Year of Appointment 1971 1978 1987 1988
Average Years of Service at UGA 16.4 11 .8 4.5 2.1
Source: Office of Institutional Research and Plann ing
FACUL TV BY YEARS OF SERVICE IN RANK AT UGA TOTAL UNIVERSITY
October 31, 1988
Associate Assistant Professor Professor Professor Instructor
Years No. % No. % No. % No. %
0-1 99 13.9% 122 20.8% 225 42.4% 145 75.1% 1-2 42 5.9 47 8.0 82 15.4 20 10.4 2-3 40 5.6 67 11.4 67 12.6 15 7.8 3-4 43 6.0 55 9.4 64 12.1 1 0.5 4-5 48 6.7 51 8.7 17 3.2 4 2.1 5·6 44 6.2 39 6.6 12 2.3 2 1.0 6-7 49 6.9 25 4.3 6 1.1 1 0.5 7-8 37 5.2 25 4.3 4 0.8 0 0.0 8-9 37 5.2 25 4.3 8 1.5 0 0.0
9-10 37 5.2 22 3.7 0 0.0 0 0.0 10-20 180 25.2 88 15.0 23 4.3 1 0.5 20-30 56 7.9 21 3.6 23 4.3 4 2.1 30-40 1 0.1 0 0.0 0 0.0 0 0.0
Over 40 0 0.0 0 0.0 0 0.0 0 0.0
Total 713 100% 587 100% 531 100% 193 100%
Median Year of Rank 1982 1984 1987 1988
Average Years of Service In Rank at UGA 8.8 6.3 3.7 1.5
Source : Office of Institutional Research and Planning
111
Total No. %
389 19.2% 127 6.3 111 5.5 97 4.8 68 3.4 66 33 69 3.4 56 2.8 66 3.3 63 3.1
539 26.6 336 16.6
37 1.8 0 0.0
2,024 100%
1980
10.6
Tota l No. %
591 29.2% 191 9.4 189 9.3 163 8.1 120 5.9 97 4.8 81 4.0 66 3.3 70 3.5 59 2.9
292 14.4 104 5.1
1 0.1 0 0.0
2,024 100%
1985
6.0
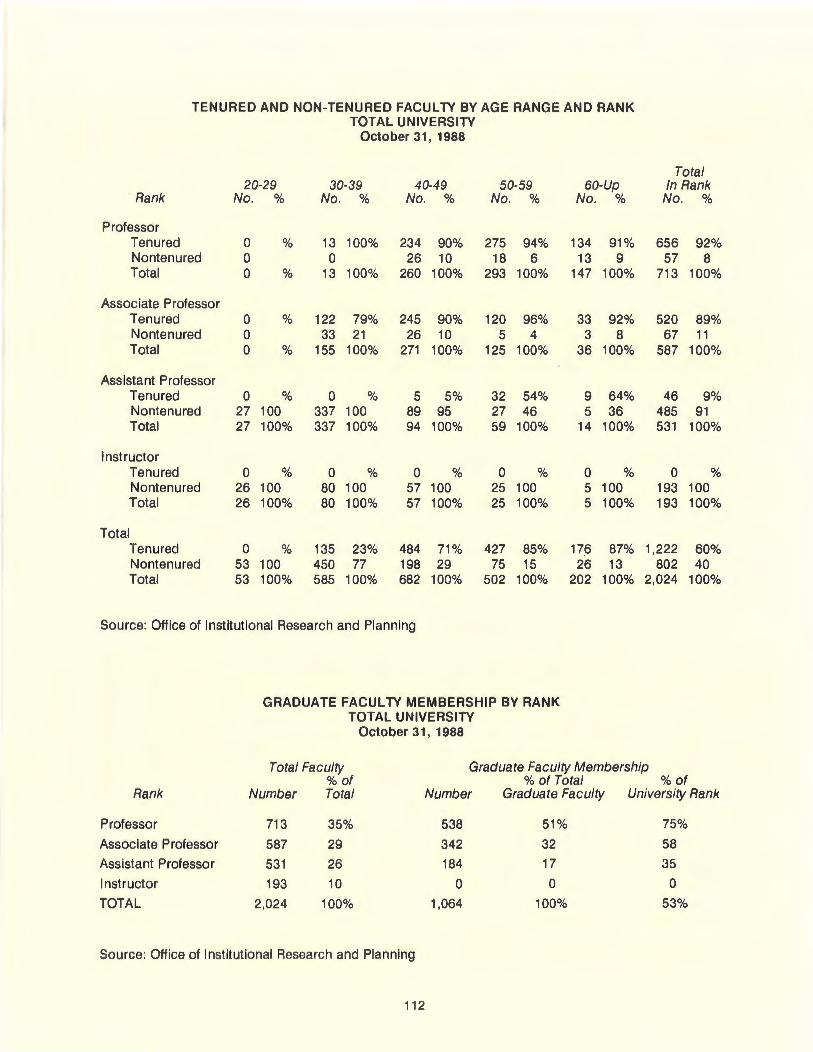
TENURED AND NON-TENURED FACULTY BY AGE RANGE AND RANK TOTAL UNIVERSITY
October 31, 1988
20-29 30-39 40-49 50-59 Rank No. % No. % No. % No. %
Professor Tenured 0 % 13 100% 234 90% 275 94% Nontenured 0 0 26 10 18 6 Total 0 % 13 100% 260 100% 293 100%
Associate Professor Tenured 0 % 122 79% 245 90% 120 96% Nontenured 0 33 21 26 10 5 4 Total 0 % 155 100% 271 100% 125 100%
Assistant Professor Tenured 0 % 0 % 5 5% 32 54% Nontenured 27 100 337 100 89 95 27 46 Total 27 100% 337 100% 94 100% 59 100%
Instructor Tenured 0 % 0 % 0 % 0 % Nontenured 26 100 80 100 57 100 25 100 Total 26 100% 80 100% 57 100% 25 100%
Total Tenured 0 % 135 23% 484 71% 427 85% Nontenured 53 100 450 77 198 29 75 15 Total 53 100% 585 100% 682 100% 502 100%
Source: Office of Institutional Research and Planning
GRADUATE FACULTY MEMBERSHIP BY RANK TOTAL UNIVERSITY
October 31, 1988
60-Up No. %
134 91% 13 9
147 100%
33 92% 3 8
36 100%
9 64% 5 36
14 100%
0 % 5 100 5 100%
176 87% 26 13
202 100%
Tota l In Rank No. %
656 92% 57 8
713 100%
520 89% 67 11
587 100%
46 9% 485 91 531 100%
0 % 193 100 193 100%
1,222 60% 802 40
2,024 100%
Total Faculty Graduate Faculty Membership %of %of Total %of
Rank Number Total Number Graduate Faculty University Rank
Professor 713 35% 538 51% 75%
Associate Professor 587 29 342 32 58
Assistant Professor 531 26 184 17 35
Instructor 193 10 0 0 0
TOTAL 2,024 100% 1,064 100% 53%
Source: Office of Institutional Research and Planning
112
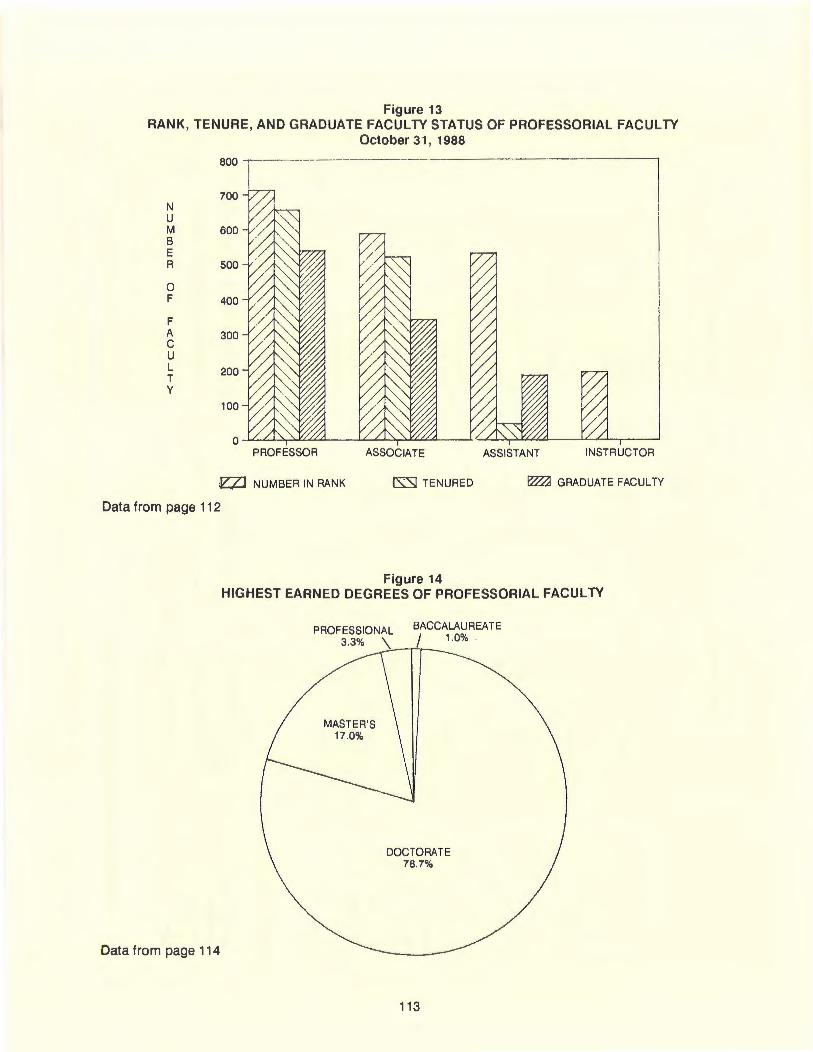
Figure 13 RANK, TENURE, AND GRADUATE FACUL TV STATUS OF PROFESSORIAL FACUL TV
October 31, 1988
800 ~---------------
N u M B E R
0 F
F A c u L T y
700
600
500
400
300
200
100
PROFESSOR
Jl:Z] NUMBER IN RANK
Data from page 112
ASSOCIATE
CSSJ TENURED
Figure 14
I I
ASSISTANT INSTRUCTOR
~ GRADUATE FACULTY
HIGHEST EARNED DEGREES OF PROFESSORIAL FACUL TV
Data from page 114
PROFESSIONAL 3.3% \
MASTER'S 17.0%
BACCALAUREATE 1 1.o%
DOCTORATE 78.7%
113
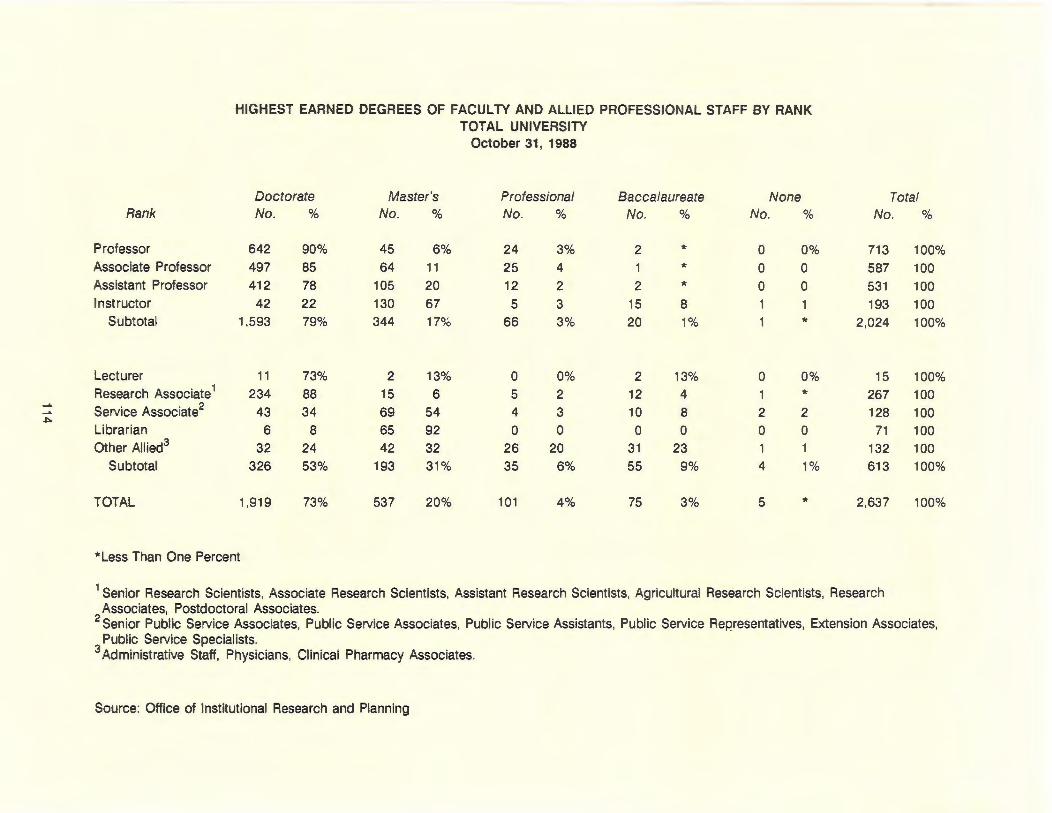
..... ..... ~
HIGHEST EARNED DEGREES OF FACUL TV AND ALLIED PROFESSIONAL STAFF BY RANK TOTAL UNIVERSITY
October 31, 1988
Doctorate Master's Professional Baccalaureate None Total Rank No. % No. % No. % No. % No. % No. %
Professor 642 90% 45 6% 24 3% 2 * 0 0% 713 100% Associate Professor 497 85 64 11 25 4 1 * 0 0 587 100 Assistant Professor 412 78 105 20 12 2 2 * 0 0 531 100 Instructor 42 22 130 67 5 3 15 8 1 1 193 100
Subtotal 1,593 79% 344 17% 66 3% 20 1% 1 * 2,024 100%
Lecturer 11 73% 2 13% 0 0% 2 13% 0 0% 15 100% Research Associate 1 234 88 15 6 5 2 12 4 1 * 267 100 Service Associate2 43 34 69 54 4 3 10 8 2 2 128 100 Librarian 6 8 65 92 0 0 0 0 0 0 71 100 Other All ied3 32 24 42 32 26 20 31 23 1 1 132 100
Subtotal 326 53% 193 31% 35 6% 55 9% 4 1% 613 100%
TOTAL 1,919 73% 537 20% 101 4% 75 3% 5 * 2,637 100%
*Less Than One Percent
1 Senior Research Scientists, Associate Research Scientists, Assistant Research Scientists, Agricultural Research Scientists, Research Associates, Postdoctoral Associates.
2 Senior Public Service Associates, Public Service Associates, Public Service Assistants, Public Service Representatives, Extension Associates, Public Service Specialists.
3 Administrative Staff, Physicians, Clinical Pharmacy Associates.
Source: Office of Institutional Research and Planning
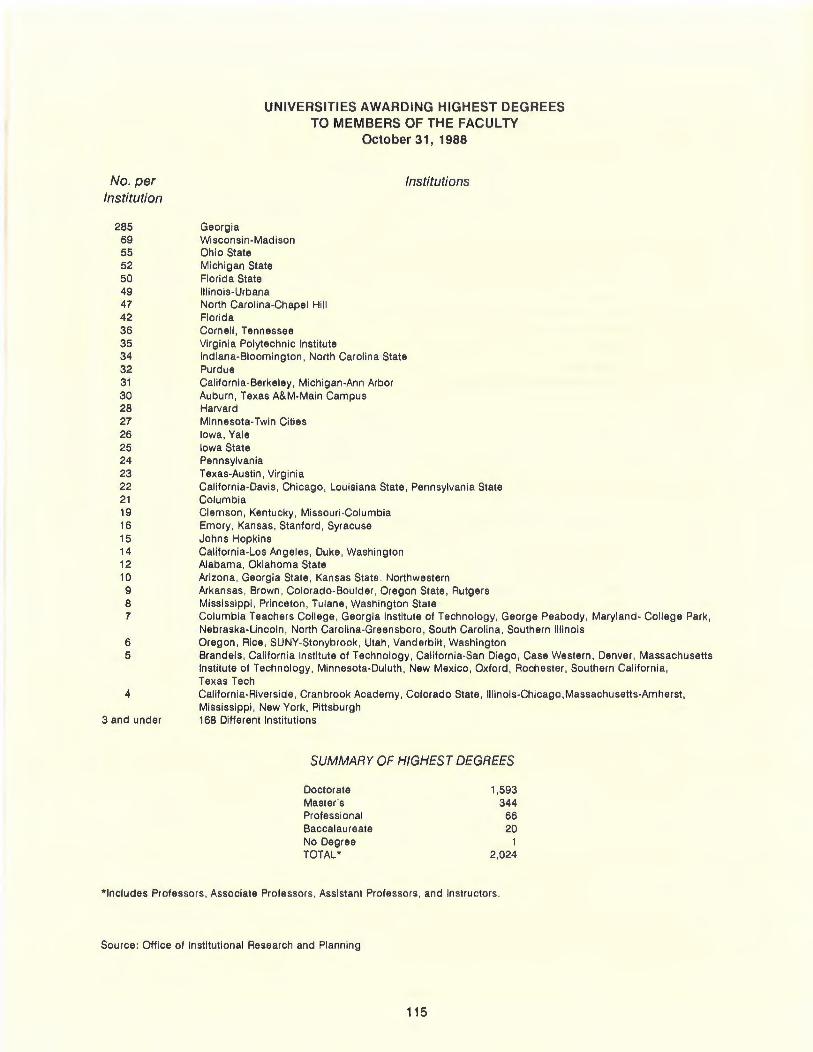
No. per Institution
285 69 55 52 50 49 47 42 36 35 34 32 31 30 28 27 26 25 24 23 22 21 19 16 15 14 12 10 9 8 7
6 5
4
3 and under
UNIVERSITIES AWARDING HIGHEST DEGREES TO MEMBERS OF THE FACUL TV
October 31, 1988
Georgia Wisconsin -Madison Ohio State Michigan State Florida State Illinois-Urbana North Carolina-Chapel Hill Florida Cornell, Tennessee
Institutions
Virginia Polytechnic In stitute Indiana-Bloomington, North Carolina State Purdue California-Berkeley, Michigan-Ann Arbor Auburn, Texas A&M-Main Campus Harvard Minnesota· Twin Cities Iowa, Yale Iowa State Pennsylvania Texas-Austin, Virginia California-Davis , Chicago , Louisiana State, Pennsylvania State Columbia Clemson, Kentucky, Missouri -Columbia Emory, Kansas, Stanford, Syracuse Johns Hopkins California-Los Angeles , Duke , Washington Alabama, Oklahoma State Arizona , Georgia State , Kansas State . Northwestern Arkansas , Brown, Colorado-Boulder, Oregon State , Rutgers Mississippi, Princeton, Tulane, Washington State Columbia Teachers College, Georgia Institute of Technology , George Peabody, Maryland- College Park, Nebraska-Lincoln , North Carolina-Greensboro, South Carolina, Southern Illinois Oregon, Rice, SUNY-Stonybrook , Utah , Vanderbilt, Washington Brandeis, California Institute of Technology, California-San Diego, Case Western, Denver, Massachusetts Institute of Technology , Minnesota-Duluth, New Mexico, Oxford, Rochester, Southern California, Texas Tech California-Riverside, Cranbrook Academy, Colorado State, lllinois-Chicago,Massachusetts-Amherst, Mississippi , New York , Pittsburgh 168 Different Institutions
SUMMARY OF HIGHEST DEGREES
Doctorate 1,593 Master 's 344 Professional 66 Baccalaureate 20 No Degree 1 TOTAL• 2,024
*Includes Professors, Associate Professors , Assistant Professors , and Instructors.
Source: Office of Institutional Research and Planning
115
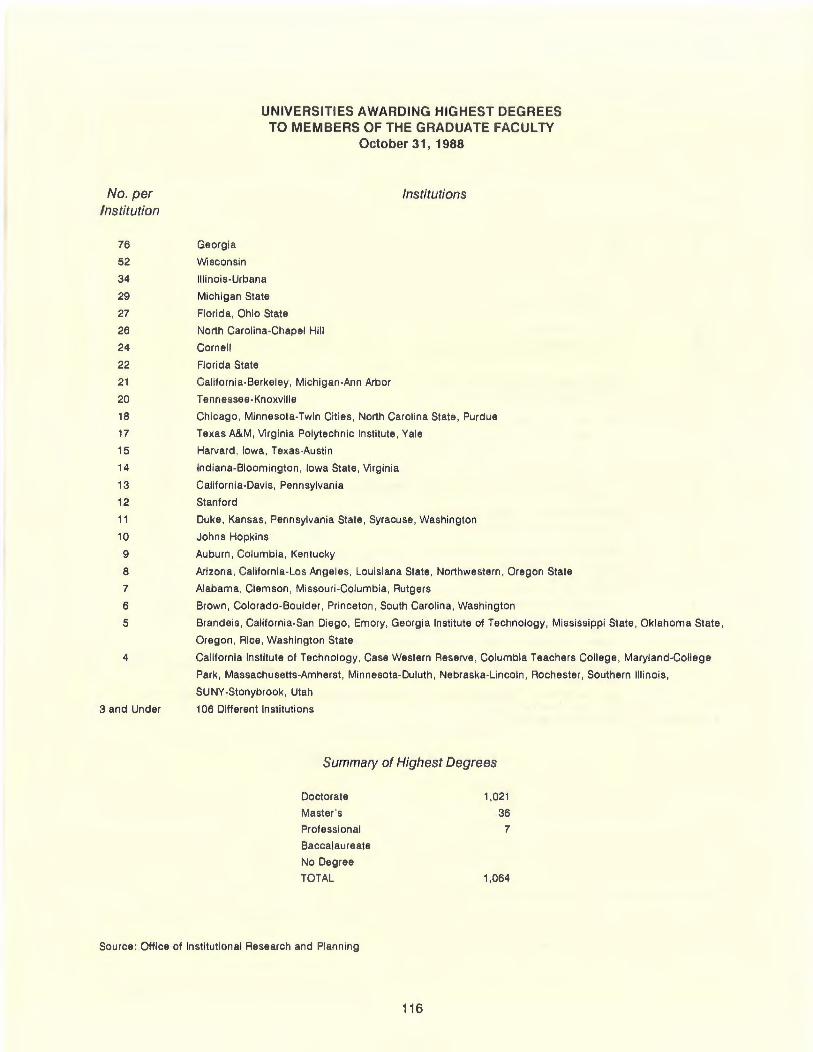
No. per Institution
76
52
34
29
27
26
24
22
21
20
18
17
15
14
13
12
11
10
9
8
7
6
5
4
3 and Under
UNIVERSITIES AWARDING HIGHEST DEGREES TO MEMBERS OF THE GRADUATE FACUL TV
October 31, 1988
Georgia
Wisconsin
Illinois-Urbana
Michigan State
Florida, Ohio State
North Carolina-Chapel Hill
Cornell
Florida State
California-Berkeley , Michigan-Ann Arbor
Tennessee-Knoxville
Institutions
Chicago , Minnesota-Twin Cities, North Carolina State, Purdue
Texas A&M, Virginia Polytechnic Institute , Yale
Harvard, Iowa , Texas-Austin
Indiana-Bloomington, Iowa State, Virginia
California-Davis, Pennsylvania
Stanford
Duke, Kansas, Pennsylvania State , Syracuse, Washington
Johns Hopkins
Auburn, Columbia, Kentucky
Arizona, California-Los Angeles , Louisiana State, Northwestern, Oregon State
Alabama, Clemson , Missouri -Columbia, Rutgers
Brown, Colorado-Boulder , Princeton , South Carolina, Washington
Brandeis, California-San Diego, Emory , Georgia Institute of Technology, Mississippi State, Oklahoma State,
Oregon, Rice, Washington State
California Institute of Technology, Case Western Reserve , Columbia Teachers College, Maryland -College
Park, Massachusetts-Amherst, Minnesota-Duluth, Nebraska-Lincoln, Rochester, Southern Illinois ,
SUNY-Stonybrook , Utah
106 Different Institutions
Summary of Highest Degrees
Doctorate
Master 's
Professional
Baccalaureate
No Degree
TOTAL
1,021
36 7
1,064
Source : Office of Institutional Research and Planning
116
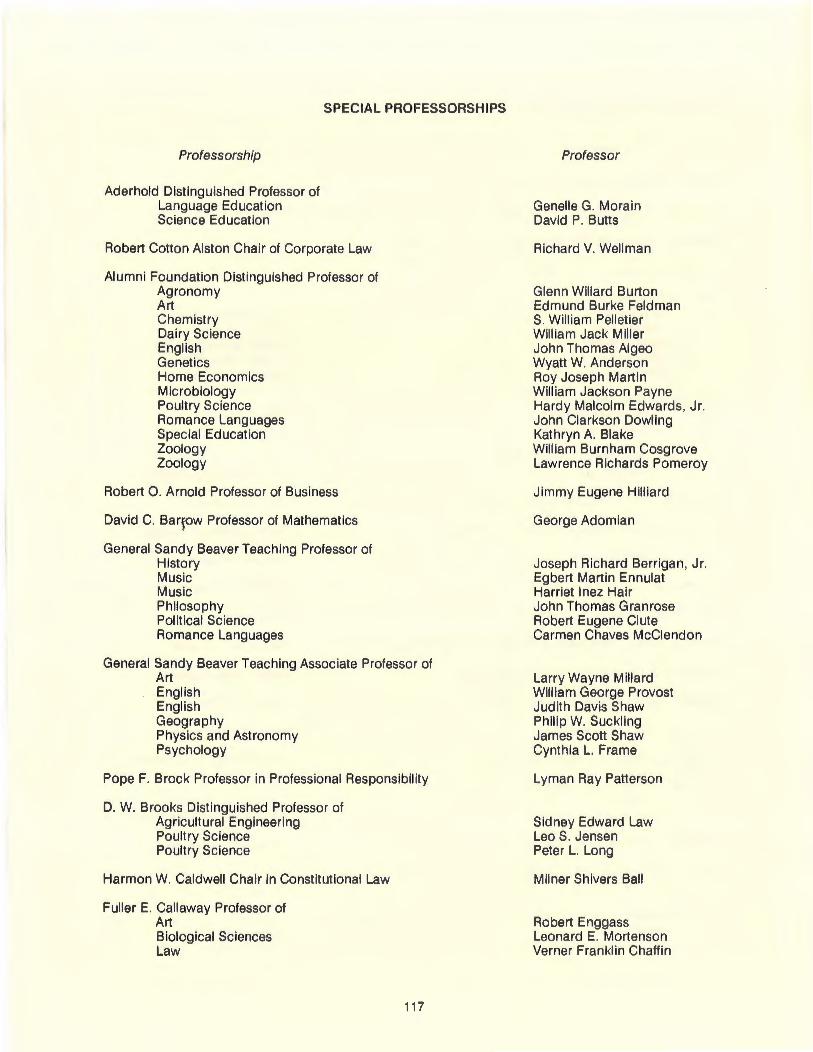
SPECIAL PROFESSORSHIPS
Professorship
Aderhold Distinguished Professor of Language Education Science Education
Robert Cotton Alston Chair of Corporate Law
Alumni Foundation Distinguished Professor of Agronomy Art Chemistry Dairy Science English Genetics Home Economics Microbiology Poultry Science Romance Languages Special Education Zoology Zoology
Robert 0. Arnold Professor of Business
David C. BarfOw Professor of Mathematics
General Sandy Beaver Teaching Professor of History Music Music Philosophy Political Science Romance Languages
General Sandy Beaver Teaching Associate Professor of Art English English Geography Physics and Astronomy Psychology
Pope F. Brock Professor in Professional Responsibility
D. W. Brooks Distinguished Professor of Agricultural Engineering Poultry Science Poultry Science
Harmon W. Caldwell Chair in Constitutional Law
Fuller E. Callaway Professor of Art Biological Sciences Law
117
Professor
Genelle G. Morain David P. Buns
Richard V. Wellman
Glenn Willard Burton Edmund Burke Feldman S. William Pelletier William Jack Miller John Thomas Algeo Wyatt W. Anderson Roy Joseph Martin William Jackson Payne Hardy Malcolm Edwards, Jr. John Clarkson Dowling Kathryn A. Blake William Burnham Cosgrove Lawrence Richards Pomeroy
Jimmy Eugene Hilliard
George Adomian
Joseph Richard Berrigan, Jr. Egbert Martin Ennulat Harriet Inez Hair John Thomas Granrose Robert Eugene Clute Carmen Chaves McClendon
Larry Wayne Millard William George Provost Judith Davis Shaw Philip W. Suckling James Scott Shaw Cynthia L. Frame
Lyman Ray Patterson
Sidney Edward Law LeoS . Jensen Peter L. Long
Milner Shivers Ball
Robert Enggass Leonard E. Mortenson Verner Franklin Chaffin
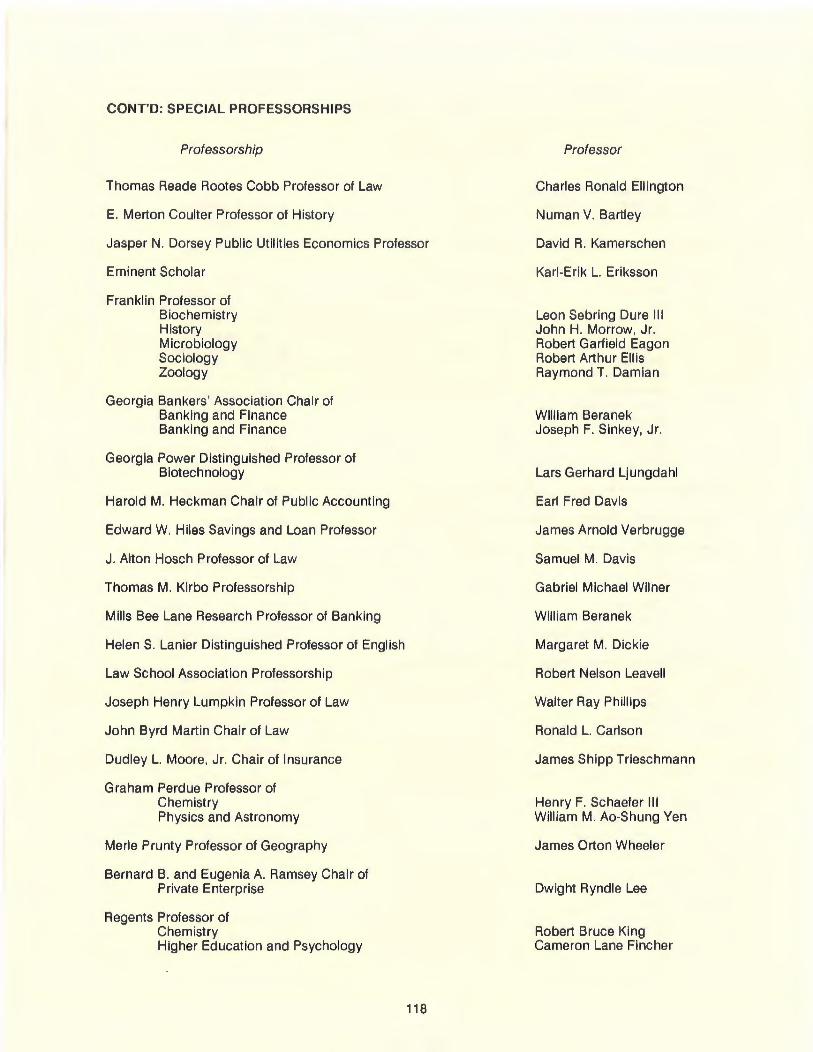
CONT'D: SPECIAL PROFESSORSHIPS
Professorship
Thomas Reade Rootes Cobb Professor of Law
E. Merton Coulter Professor of History
Jasper N. Dorsey Public Utilities Economics Professor
Eminent Scholar
Franklin Professor of Biochemistry History Microbiology Sociology Zoology
Georgia Bankers' Association Chair of Banking and Finance Banking and Finance
Georgia Power Distinguished Professor of Biotechnology
Harold M. Heckman Chair of Public Accounting
Edward W. Hiles Savings and Loan Professor
J. Alton Hosch Professor of Law
Thomas M. Kirbo Professorship
Mills Bee Lane Research Professor of Banking
Helen S. Lanier Distinguished Professor of English
Law School Association Professorship
Joseph Henry Lumpkin Professor of Law
John Byrd Martin Chair of Law
Dudley L. Moore, Jr. Chair of Insurance
Graham Perdue Professor of Chemistry Physics and Astronomy
Merle Prunty Professor of Geography
Bernard B. and Eugenia A. Ramsey Chair of Private Enterprise
Regents Professor of Chemistry Higher Education and Psychology
118
Professor
Charles Ronald Ellington
Numan V. Bartley
David R. Kamerschen
Karl-Erik L. Eriksson
Leon Sebring Dure Ill John H. Morrow, Jr. Robert Garfield Eagon Robert Arthur Ellis Raymond T. Damian
William Beranek Joseph F. Sinkey, Jr.
Lars Gerhard Ljungdahl
Earl Fred Davis
James Arnold Verbrugge
Samuel M. Davis
Gabriel Michael Wilner
William Beranek
Margaret M. Dickie
Robert Nelson Leavell
Walter Ray Phillips
Ronald L. Carlson
James Shipp Trieschmann
Henry F. Schaefer Ill William M. Ao-Shung Yen
James Orton Wheeler
Dwight Ryndle Lee
Robert Bruce King Cameron Lane Fincher
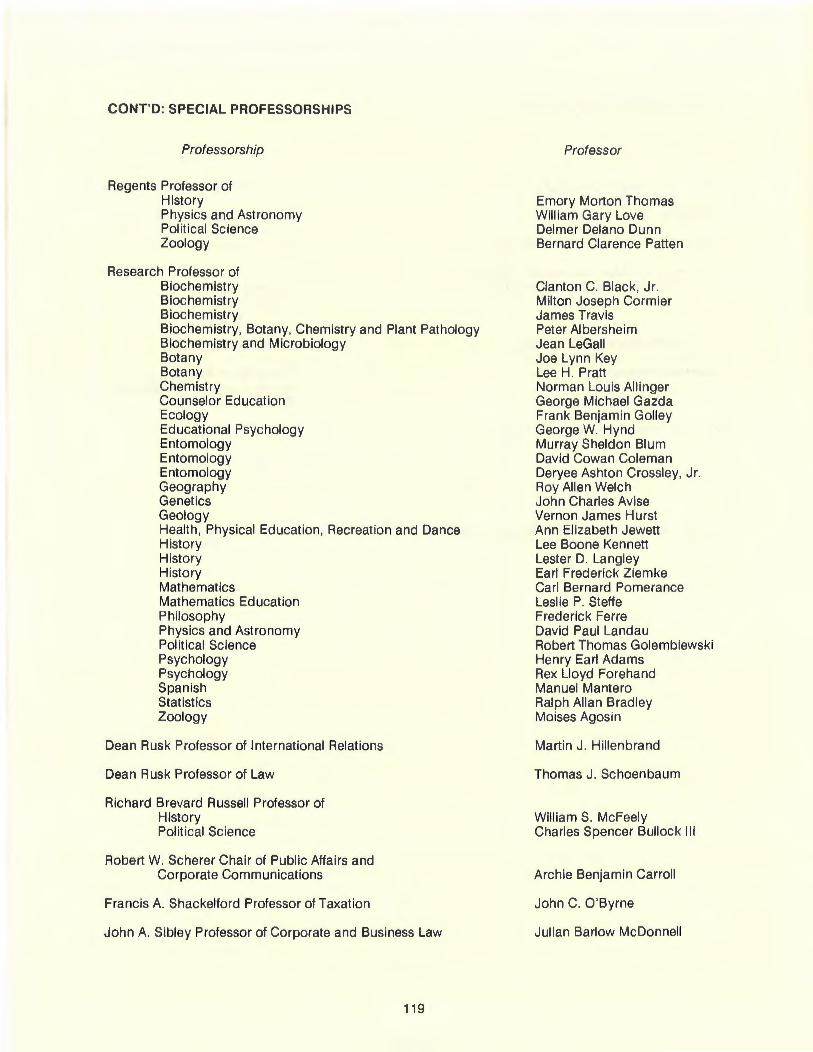
CONT'D: SPECIAL PROFESSORSHIPS
Professorship
Regents Professor of History Physics and Astronomy Political Science Zoology
Research Professor of Biochemistry Biochemistry Biochemistry Biochemistry, Botany, Chemistry and Plant Pathology Biochemistry and Microbiology Botany Botany Chemistry Counselor Education Ecology Educational Psychology Entomology Entomology Entomology Geography Genetics Geology Health, Physical Education, Recreation and Dance History History History Mathematics Mathematics Education Philosophy Physics and Astronomy Political Science Psychology Psychology Spanish Statistics Zoology
Dean Rusk Professor of International Relations
Dean Rusk Professor of Law
Richard Brevard Russell Professor of History Political Science
Robert W. Scherer Chair of Public Affairs and Corporate Communications
Francis A. Shackelford Professor of Taxation
John A. Sibley Professor of Corporate and Business Law
119
Professor
Emory Morton Thomas William Gary Love Delmer Delano Dunn Bernard Clarence Patten
Clanton C. Black, Jr. Milton Joseph Cormier James Travis Peter Albersheim Jean LeGall Joe Lynn Key Lee H. Pratt Norman Louis Allinger George Michael Gazda Frank Benjamin Galley George W. Hynd Murray Sheldon Blum David Cowan Coleman Deryee Ashton Crossley, Jr. Roy Allen Welch John Charles Avise Vernon James Hurst Ann Elizabeth Jewett Lee Boone Kennett Lester D. Langley Earl Frederick Ziemke Carl Bernard Pomerance Leslie P. Steffe Frederick Ferre David Paul Landau Robert Thomas Golembiewski Henry Earl Adams Rex Lloyd Forehand Manuel Mantero Ralph Allan Bradley Moises Agosin
Martin J. Hillenbrand
Thomas J. Schoenbaum
William S. McFeely Charles Spencer Bullock Ill
Archie Benjamin Carroll
John C. O'Byrne
Julian Barlow McDonnell
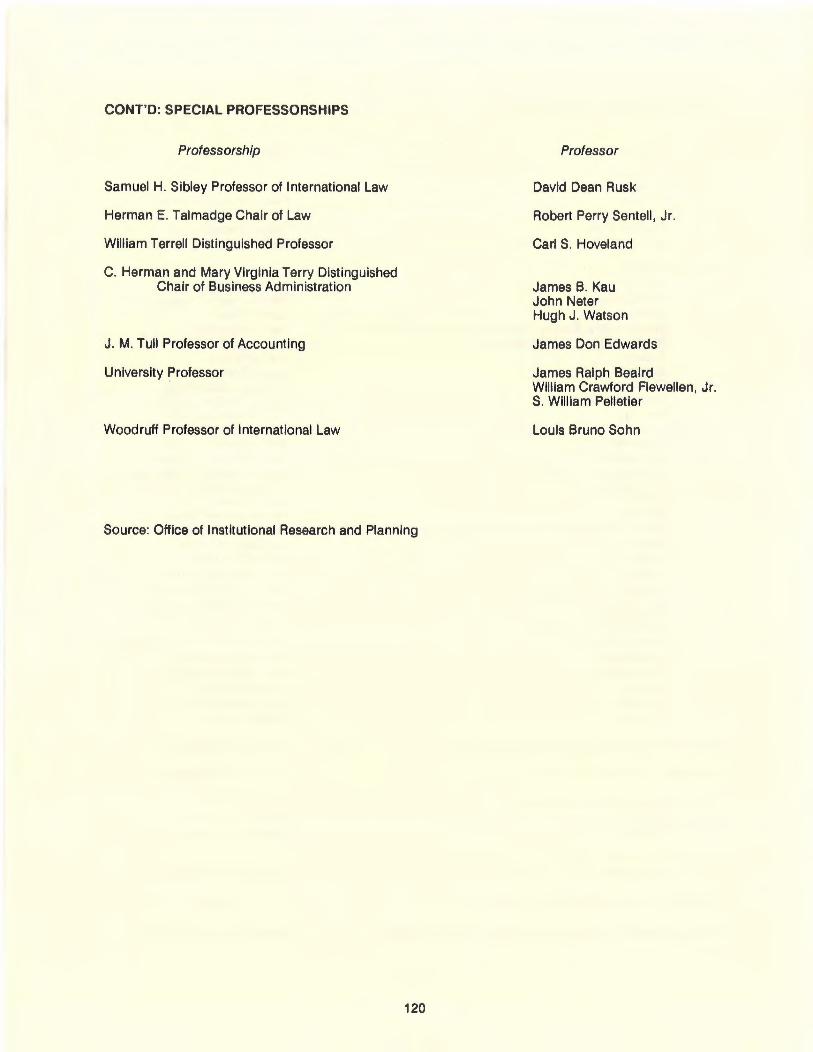
CONT'D: SPECIAL PROFESSORSHIPS
Professorship
Samuel H. Sibley Professor of International Law
Herman E. Talmadge Chair of Law
William Terrell Distinguished Professor
C. Herman and Mary Virginia Terry Distinguished Chair of Business Administration
J. M. Tull Professor of Accounting
University Professor
Woodruff Professor of International Law
Source: Office of Institutional Research and Planning
120
Professor
David Dean Rusk
Robert Perry Sentell, Jr.
Carl S. Hoveland
James B. Kau John Neter Hugh J. Watson
James Don Edwards
James Ralph Beaird William Crawford Flewellen, Jr. S. William Pelletier
Louis Bruno Sohn
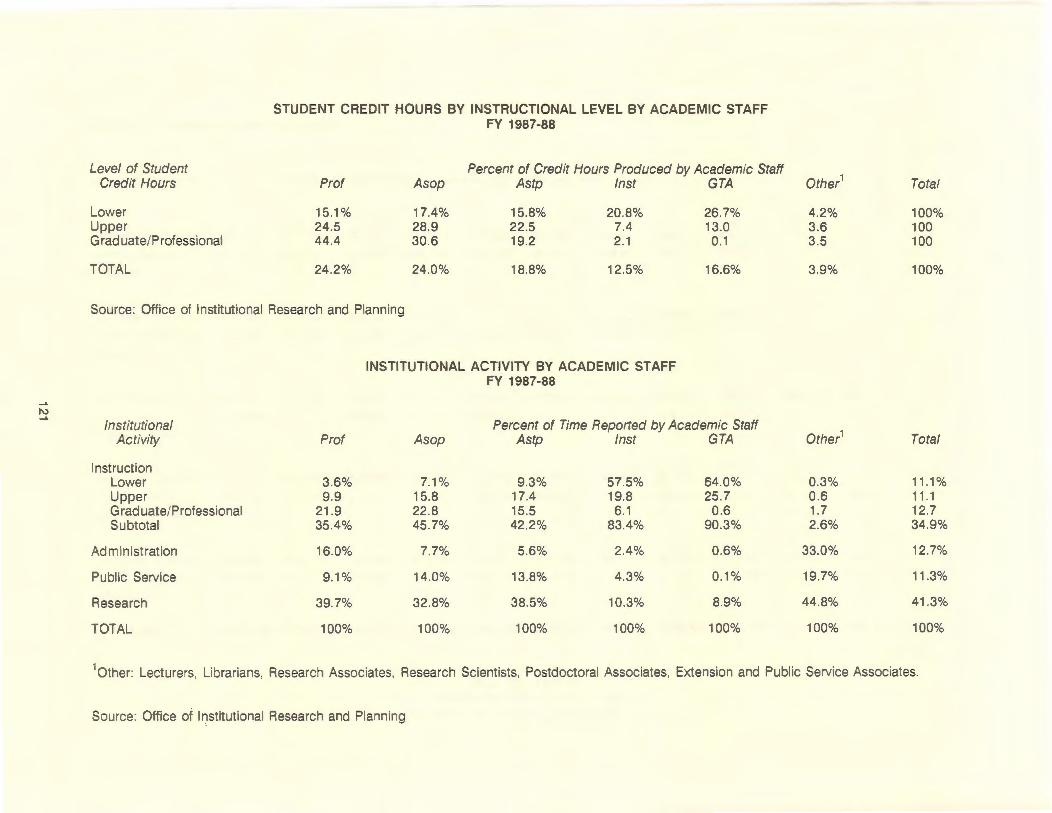
.... ~
Level of Student Credit Hours
Lower Upper Graduate/Professional
TOTAL
STUDENT CREDIT HOURS BY INSTRUCTIONAL LEVEL BY ACADEMIC STAFF FY 1987-88
Percent of Credit Hours Produced by Academic Staff Prof A sop Astp lnst GTA
15.1% 17.4% 15.8% 20.8% 26.7% 24.5 28.9 22.5 7.4 13.0 44.4 30.6 19.2 2.1 0.1
24.2% 24.0% 18.8% 12.5% 16.6%
Source: Office of Institutional Research and Planning
INSTITUTIONAL ACTIVITY BY ACADEMIC STAFF FY 1987-88
Institutional Percent of Time Reported by Academic Staff Activity Prof A sop Astp /nst GTA
Instruction Lower 3.6% 7.1% 9.3% 57.5% 64.0% Upper 9.9 15.8 17.4 19.8 25 .7 Graduate/Professional 21 .9 22.8 15.5 6.1 0.6 Subtotal 35.4% 45.7% 42.2% 83.4% 90 .3%
Administration 16.0% 7.7% 5.6% 2.4% 0.6%
Public Service 9.1% 14.0% 13.8% 4.3% 0.1%
Research 39.7% 32.8% 38.5% 10.3% 8.9%
TOTAL 100% 100% 100% 100% 100%
Other1 Total
4.2% 100% 3.6 100 3.5 100
3.9% 100%
Other1 Total
0.3% 11.1% 0.6 11.1 1.7 12.7 2.6% 34.9%
33.0% 12.7%
19.7% 11.3%
44.8% 41 .3%
100% 100%
10ther: Lecturers, Librarians, Research Associates, Research Scientists, Postdoctoral Associates, Extension and Public Service Associates.
Source: Office of l~stitutional Research and Planning
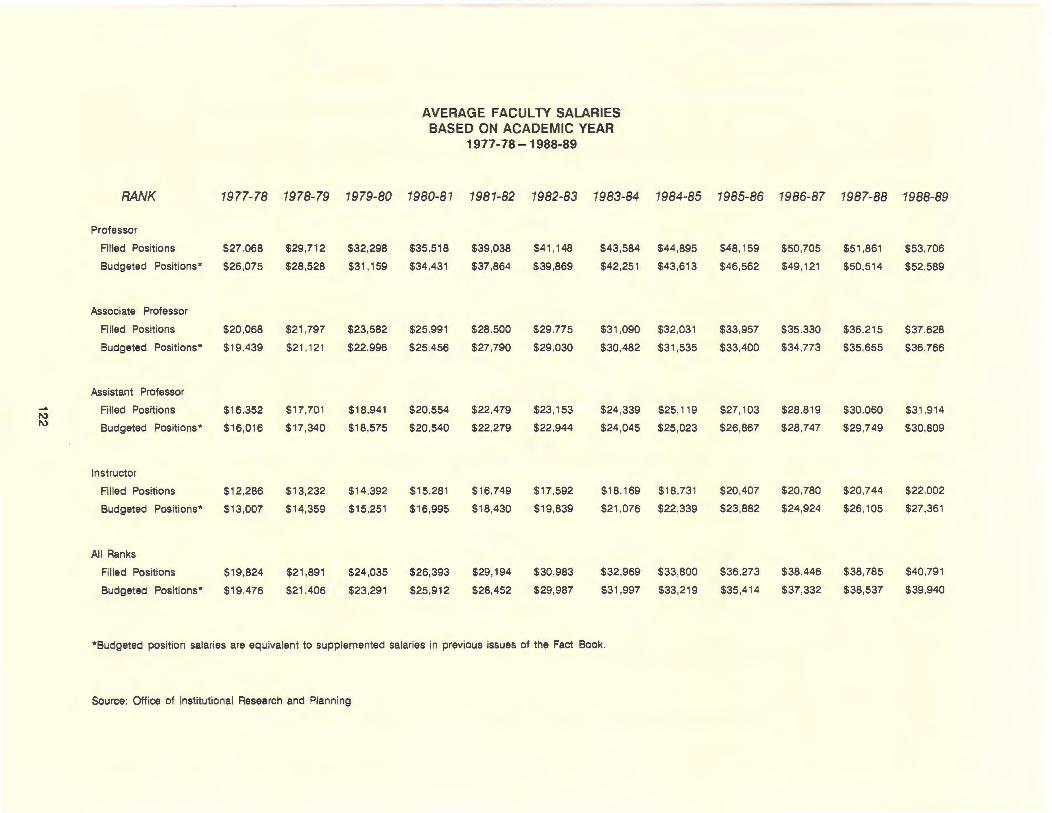
I\) I\)
RANK 1977-78 1978-79 1979-80
Professor
Filled Positions $27 .068 $29,712 $32,298
Budgeted Positions• $26,075 $28 ,528 $31 ,159
Associate Professor
Filled Positions $20,068 $21 ,797 $23,582
Budgeted Positions• $19.439 $21 .121 $22.996
Assistant Professor
Filled Positions $16.352 $17,701 $18,941
Budgeted Positions• $16,016 $17,340 $18,575
Instructor
Filled Positions $12,286 $13,232 $14 ,392
Budgeted Positions• $13.007 $14,359 $15,251
Al l Ranks
Filled Positions $19,824 $21 ,891 $24,035
Budgeted Positions• $19.476 $21,406 $23,291
AVERAGE FACULTY SALARIES BASED ON ACADEMIC YEAR
1977-78- 1988-89
1980-81 1981-82 1982-83 1983-84
$35 ,518 $39,038 $41 ,148 $43,584
$34 ,431 $37,864 $39,869 $42 ,251
$25 .991 $28 .500 $29.775 $31 ,090
$25,456 $27,790 $29,030 $30,482
$20.554 $22.479 $23,153 $24 ,339
$20,540 $22,279 $22.944 $24,045
$15,281 $16,749 $17 ,592 $18,169
$16 ,995 $18,430 $19,839 $21 ,076
$26,393 $29,194 $30,983 $32,969
$25,912 $28,452 $29,987 $31 ,997
*Budgeted position salaries are equivalent to supplemented salaries in previous issues of the Fact Book.
Source: Office of Institutional Research and Planning
1984-85 1985-86 1986-87 1987-88 1988-89
$44 ,895 $48,159 $50,705 $51 ,861 $53,706
$43,613 $46 ,562 $49,121 $50,514 $52,589
$32,031 $33,957 $35.330 $36 ,215 $37.628
$31 ,535 $33,400 $34,773 $35,655 $36.766
$25,119 $27 ,103 $28,819 $30,060 $31 ,914
$25,023 $26,867 $28,747 $29,749 $30,809
$18,731 $20,407 $20,780 $20 ,744 $22,002
$22,339 $23,882 $24,924 $26,105 $27,361
$33,800 $36,273 $38,446 $38,785 $40,791
$33,219 $35,414 $37,332 $38 ,537 $39,940
$55
$50
$45
Cii 0 $40 z <( en ::::J 0 $35 I f-
z $30 en w a: $25 :) <( en
$20
$15
$10 78 79
Data from page 122
Data from page 124
80
Figure 15 AVERAGE FACUL TV SALARIES BASED ON ACADEMIC YEAR
81 82 83 84 85 86 ACADEM IC YEAR
Figure 16
87
UNIVERSITY EMPLOYEES BY EEO CATEGORY November 1, 1988
SKILLED CRAFTS
5.2% "
SECRETARIAL/ CLERICAL
20.5%
123
EXECUTIVE/ ADMINISTRATIVE/ / MANAGERIAL
6.9%
INSTRUCTIONAL FACULTY
22.2%
PROFESSIONAL NON-FACULTY
17.9%
88 89
PROFESSOR
ALL RANKS
ASSOCIATE
ASSISTANT
INSTRUCTOR
1\) ~
UNIVERSITY EMPLOYEES BY OCCUPATIONAL CLASSIFICATION
1988
Employees As Of 11/01 /88 New Employees 11/87- 10/88
Occupational Classification* Full-Time Part-Time Total Full-Time Part-Time Total
Executive/Administrative/Managerial 539 2 541 25 0 25
Instructional Faculty 1,726 131 1,857 199 51 250
Professional Non-Faculty 1,391 96 1,487 188 28 216
Secretarial/Clerical 1,598 241 1,839 310 89 399
T echn icai/Paraprofessional 1,043 143 1 '186 220 50 270
Skilled Crafts 405 3 408 51 1 52
Service Maintenance 1,079 142 1,221 239 75 314
TOTAL 7,781 758 8,539 1,232 294 1,526
*Office of Civil Rights Occupational Classifications
Source: Office of Institutional Research and Planning
Percent New Employees
4.62%
13.46
14.53
21.70
22.77
12.75
25.72
17.87%

FINANCIAL INFORMATION CUD I 7 8 5
SOURCES OF REVENUE FY 1987-88
Sources
rom the State of Georgia for Resident Instruction for Agricultural Experiment Station for Cooperative Extension Service for Marine Extension Service for Marine Institute for Veterinary Medical Experiment Station for Veterinary Medical Teaching Hospital for Minority Business Enterprises for Athens & Tifton Veterinary Laboratories
Total State of Georgia From the Counties of Georgia for Cooperative Extension Service
From Federal Appropriations for Resident Instruction for Agricultural Experiment Station for Cooperative Extension Service
Total Federal Appropriations From Student Tuition and Fees From Sales, Services, and Miscellaneous Sources
of Teaching and Service Departments of Agricultural Experiment Station of Cooperative Extension Service of Marine Extension Service of Marine Institute of Veterinary Medjcal Experiment Station · of Veterinary Medical Teaching Hospital of Athens & Tifton Veterinary Laboratories Total Sales, Services, and Miscellaneous Sources
From Gifts , Grants, and Research Contracts (State Federal , and Private)*
From Auxiliary Enterprises From Endowment
TOTAL
*Includes Student Aid
Source: Office of the Vice President for Business and Finance
126
Revenue
$158,097.043
31 '153,368 29,945 ,880
1 '135,483 815.631
2,735,358 435 ,262 321,481
34,105 $224,673,611
$ 7,585,459
$ 36,125 3,778,650 6,874,242
$ 10,689,017 $ 46,087,927
$ 7,669,121
2,197,863 59,892
149,173
43,641 642
1,938,360 4,015
. $ 12,062,707
$ 80,302,353 $ 40,374,984 $ 1,073,284
$422,849,342
Percent of Total
53.1%
1.8%
2.5% 10.9%
2.9%
19.0% 9.5% 0.3%
100%
Source
State of Ge.orgia Counties of Georgia Federal Appropriations Student Tuition and Fees
PERCENT DISTRIBUTION OF REVENUE BY SOURCE FY 1978-79-1987-88
Fiscal Year 78-79 79-80 80-81 81-82 82-83 83-84 84-85
52.8% 53 .1% 53.1% 55.0% 53.1 % 55.0% 55.3% 1.7 1.8 1.7 1.6 1.7 1.9 2.1 4.0 3.8 3.6 3.2 3.3 3.1 3.0 8.7 8.3 9.2 9.4 10.1 10.1 10.4
Sales, Services, Miscellaneous 3.6 3.9 3.1 2.9 3.1 2.8 2.9 Gifts, Grants, Contracts 18.9 18.7 18.5 16.8 17.7 17.0 16 7 Auxiliary Enterprises 10.1 10.2 10.6 10.9 10.8 99 9.4 Endowment 0.2 0.2 0.2 0.2 0.2 0.2 0.2
Source: Office of the Vice President for Business and Finance
Figure 17 PERCENT DISTRIBUTION OF REVENUE BY SOURCE
FY 1987-88
SALES, SERVICES, MISCELLANEOUS ,.....-
2.9%
ENDOWMENT
AUX. ENT. 9.5%
GIFTS, GRANTS, CONTRACTS
19.0%
FEDERAL I APPROPRIATIONS
STATE OF GEORGIA 53 .1%
2.5% COUNTIES OF GEORGIA 1.8%
127
85-86 86-87 87-88
54.7% 54.4% 53.1% 1.9 1.9 1.8 2.7 2.5 2.5
10.9 11 .1 10.9 2.9 2.9 2 .9
17 9 18.4 19.0 8.7 8.5 9 .5 0.3 0.3 0 .3
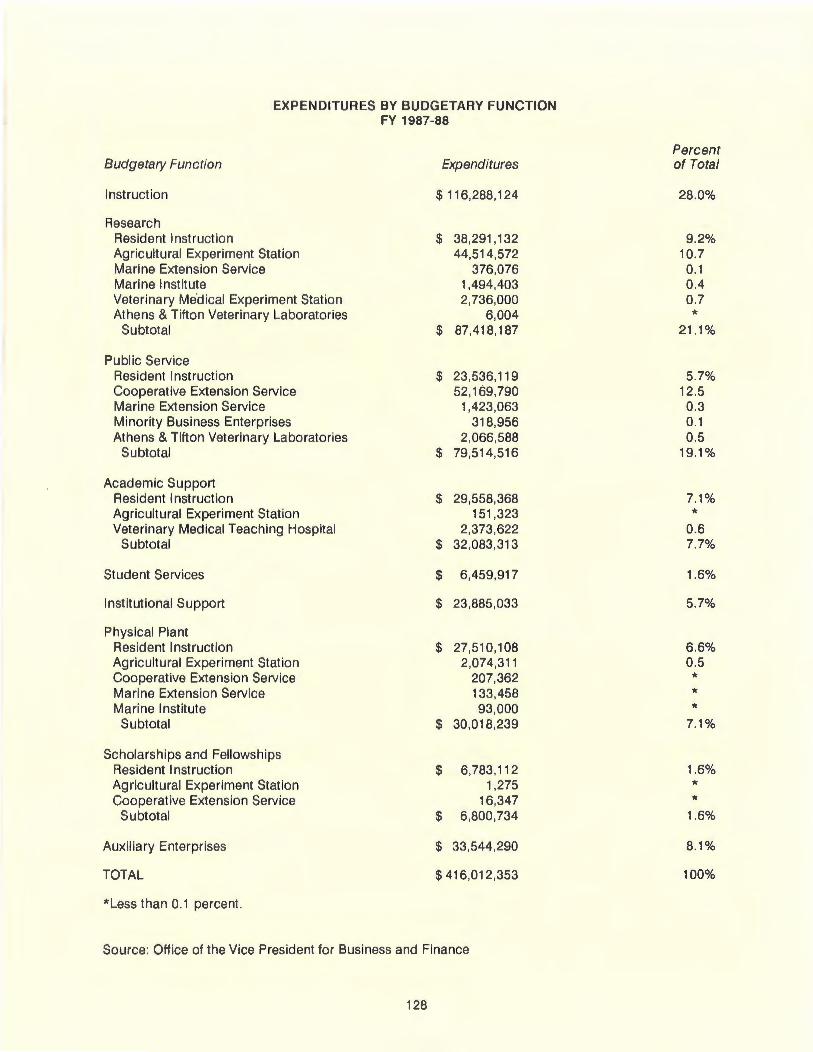
EXPENDITURES BY BUDGETARY FUNCTION FY 1987-88
Percent Budgetary Function Expenditures of Total
Instruction $116,288,124 28.0%
Research Resident Instruction $ 38,291 '132 9.2% Agricultural Experiment Station 44,514,572 10.7 Marine Extension Service 376,076 0.1 Marine Institute 1 ,494,403 0.4 Veterinary Medical Experiment Station 2,736,000 0.7 Athens & Tifton Veterinary Laboratories 6,004 *
Subtotal $ 87,418,187 21.1%
Public Service Resident Instruction $ 23,536,119 5.7% Cooperative Extension Service 52,169,790 12.5 Marine Extension Service 1,423,063 0.3 Minority Business Enterprises 318,956 0.1 Athens & Tifton Veterinary Laboratories 2,066,588 0.5
Subtotal $ 79,514,516 19.1%
Academic Support Resident Instruction $ 29,558,368 7.1% Agricultural Experiment Station 151,323 * Veterinary Medical Teaching Hospital 2,373,622 0.6
Subtotal $ 32,083,313 7.7%
Student Services $ 6,459,917 1.6%
Institutional Support $ 23,885,033 5.7%
Physical Plant Resident Instruction $ 27,510,108 6.6% Agricultural Experiment Station 2,074,311 0.5 Cooperative Extension Service 207,362 * Marine Extension Service 133,458 * Marine Institute 93,000 *
Subtotal $ 30,018,239 7.1%
Scholarships and Fellowships Resident Instruction $ 6,783,112 1.6% Agricultural Experiment Station 1,275 * Cooperative Extension Service 16,347 *
Subtotal $ 6,800,734 1.6%
Auxiliary Enterprises $ 33 ,544,290 8.1%
TOTAL $416,012,353 100%
* Less than 0.1 percent.
Source: Office of the Vice President for Business and Finance
128
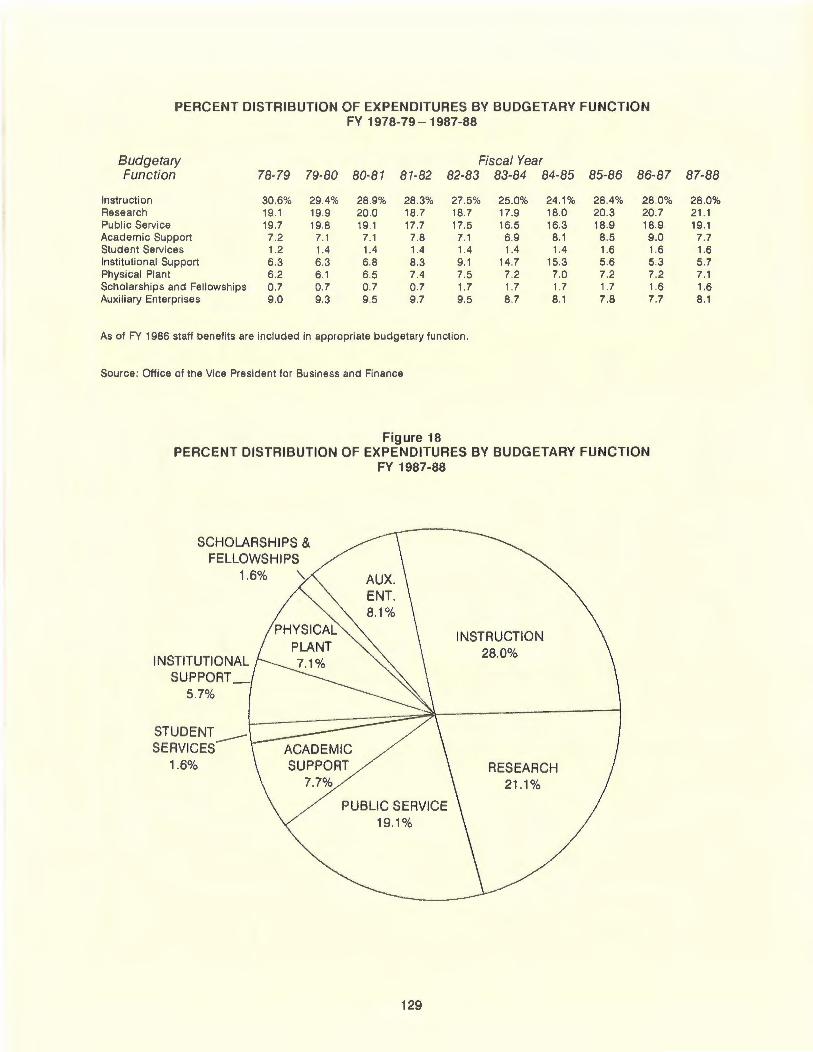
PERCENT DISTRIBUTION OF EXPENDITURES BY BUDGETARY FUNCTION FY 1978-79 - 1987-88
Budgetary Fiscal Year Function 78-79 79-80 80-81 81-82 82-83 83-84 84-85 85-86 86-87
Instruction 30.6% 29.4% 28.9% 28.3% 27.5% 25.0% 24 .1% 28.4% 28.0% Research 19.1 19 9 20 0 18.7 18.7 17.9 18.0 20.3 20 7 Public Service 19.7 19.8 191 17.7 17.5 16.5 16.3 18.9 18.9 Academic Support 7.2 7.1 7.1 7.8 7.1 69 8.1 8.5 9.0 Student Services 1.2 1.4 1.4 1.4 1.4 1.4 1.4 1.6 1.6 Institutional Support 6.3 6.3 6.8 8.3 9.1 14.7 15.3 5.6 5.3 Physical Plant 6.2 6.1 6.5 7.4 7.5 7.2 7.0 7.2 7.2 Scholarships and Fell owships 0.7 07 0.7 0.7 1.7 1.7 1.7 1.7 1.6 Auxi liary Enterprises 9.0 9.3 95 9.7 9.5 8.7 8.1 7.8 7.7
As of FY 1986 staff benefits are included in appropriate budgetary function.
Source: Office of the Vice President for Business and Finance
Figure 18 PERCENT DISTRIBUTION OF EXPENDITURES BY BUDGETARY FUNCTION
FY 1987-88
SCHOLARSHIPS & FELLOWSHIPS
1.6% "
INSTITUTIONAL SUPPORT_
5.7%
STUDENT-SERVICES
1.6% 7.7%
PUBLIC SERVICE 19.1%
129
INSTRUCTION 28.0%
RESEARCH 21.1%
87-88
28.0% 21 .1 19.1 7.7 1.6 5.7 7.1 1.6 8.1
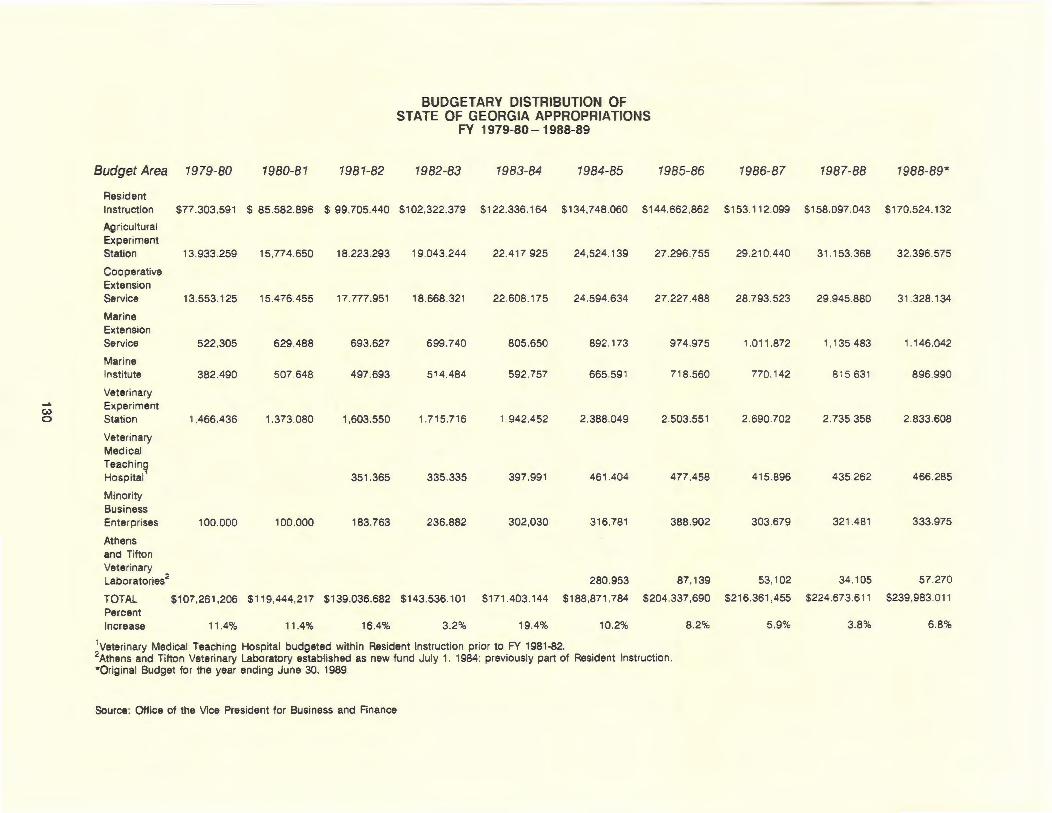
BUDGETARY DISTRIBUTION OF STATE OF GEORGIA APPROPRIATIONS
FV 1979-80- 1988-89
Budget Area 1979-80 1980-81 1981-82 1982-83 1983-84 1984-85 1985-86 1986-87 1987-88 1988-89*
Resident Instruction $77 .303.591 $ 85.582 .896 $ 99,705.440 $102,322.379 $122.336.164 $134,748.060 $144.662 ,862 $153 .112.099 $158.097.043 $170 .524.132
Agricultural Experiment Station 13,933.259 15.774 650 18.223.293 19.043.244 22.417 .925 24 ,524.139 27 .296.755 29.210.440 31 .153.368 32.396.575
Cooperative Extension Service 13.553.125 15.476.455 17.777.951 18.668 .321 22.608.175 24.594 .634 27.227.488 28.793.523 29.945 .880 31 .328 134
Marine Extension Service 522.305 629.488 693.627 699 .740 805.650 892.173 974.975 1.011 .872 1.1 35.483 1.146.042
Marine Institute 382.490 507 648 497 693 514.484 592 .757 665.59 1 718 560 770.142 815 63 1 896.990
Veterinary
(.,) Experiment
0 Station 1,466.436 1.373 .080 1,603 .550 1.715.716 1 .942.452 2 .388 .049 2.503 .55 1 2 .690.702 2 .735 358 2 .833.608
Veterinary Medical Teaching Hospital ' 351 .365 335 .335 397.991 461 .404 477.458 415.896 435262 466 .285
Minority Business Enterprises 100.000 100.000 183,763 236 .882 302,030 316.781 388.902 303.679 321.481 333.975
Athens and Tifton Veterinary Laboratories2 280 953 87.139 53 ,102 34.105 57 .270
TOTAL $107,261 ,206 $119.444,217 $139,036,682 $143,536.101 $171.403.144 $188,871 .784 $204.337 ,690 $216.361 ,455 $224 .673.611 $239,983 .011
Percent Increase 11.4% 11.4% 16.4% 3.2% 19.4% 10.2% 8.2% 5.9% 3.8% 6.8%
: veterinary Medical Teaching Hospital budgeted within Resident Instruction prior to FY 1981-82. ~Athens and Tifton Veterinary Laboratory established as new fund July 1. 1984: previously part of Resident Instruction . •Original Budget for the year ending June 30, 1989.
Source: Office of the Vice President for Business and Finance
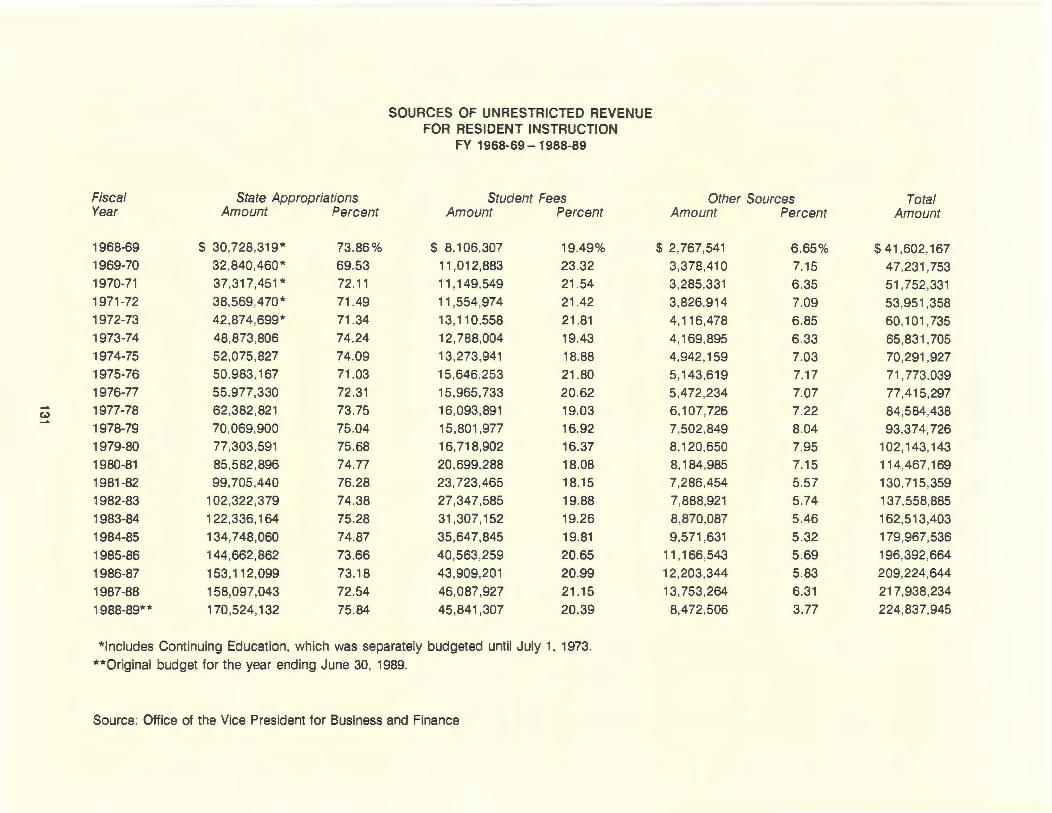
"?
Fiscal State Appropriations Year Amount Percent
1968-69 $ 30,728,319* 73.86% 1969-70 32,840,460* 69.53 1970-71 37,317,451 * 72.11
1971-72 38,569,470* 71.49 1972-73 42,874,699* 71.34
1973-74 48,873,806 74.24 1974-75 52,075,827 74.09 1975-76 50.983,167 71 .03 1976-77 55,977,330 72.31 1977-78 62,382,821 73.75 1978-79 70 ,069,900 75.04
1979-80 77,303 ,591 75.68 1980-81 85,582,896 74.77
1981 -82 99,705,440 76.28
1982-83 102,322,379 74.38
1983-84 122,336,164 75.28
1984-85 134,748,060 74.87
1985-86 144,662,862 73.66
1986-87 153,112,099 73.18
1987-88 158,097,043 72.54
1988-89** 170,524,132 75.84
SOURCES OF UNRESTRICTED REVENUE FOR RESIDENT INSTRUCTION
FY 1968-69- 1988-89
Student Fees Amount Percent
$ 8,106,307 19.49% 11 ,012,883 23.32
11 '149,549 21.54
11 ,554,974 21.42 13,110,558 21.81
12,788,004 19.43 13,273 ,941 18.88 15,646.253 21.80 15,965,733 20.62 16,093,891 19.03 15,801,977 16.92 16,718,902 16.37 20,699,288 18.08 23,723,465 18.15
27,347,585 19.88
31,307,152 19.26
35,647,845 19.81
40,563 ,259 20.65
43,909,201 20.99
46,087,927 21.15
45 ,841 ,307 20.39
*Includes Continuing Education, which was separately budgeted until July 1, 1973.
**Original budget for the year ending June 30, 1989.
Source: Office of the Vice President for Business and Finance
Other Sources Total Amount Percent Amount
$ 2,767,541 6 .65% $41 ,602,167 3,378,410 7.15 47,231 ,753 3,285,331 6 .35 51 ,752,331 3,826,914 7.09 53 ,951 ,358 4,116,478 6.85 60,101 '735 4,169,895 6.33 65,831 ,705 4,942 ,159 7.03 70 ,291 ,927 5,143,619 7.17 71 ,773.039 5,472,234 7.07 77,415 ,297 6,107,726 7.22 84,584,438 7,502,849 8.04 93,374,726 8,120,650 7.95 102,143,143 8,184,985 7.15 114,467,169
7,286,454 5.57 130,715,359 7,888,921 5.74 137,558,885 8,870,087 5.46 162,513,403 9,571 ,631 5.32 179,967,536
11 '166,543 5.69 196,392,664
12,203,344 5.83 209,224,644
13,753,264 6.31 217,938,234
8,472,506 3.77 224,837,945
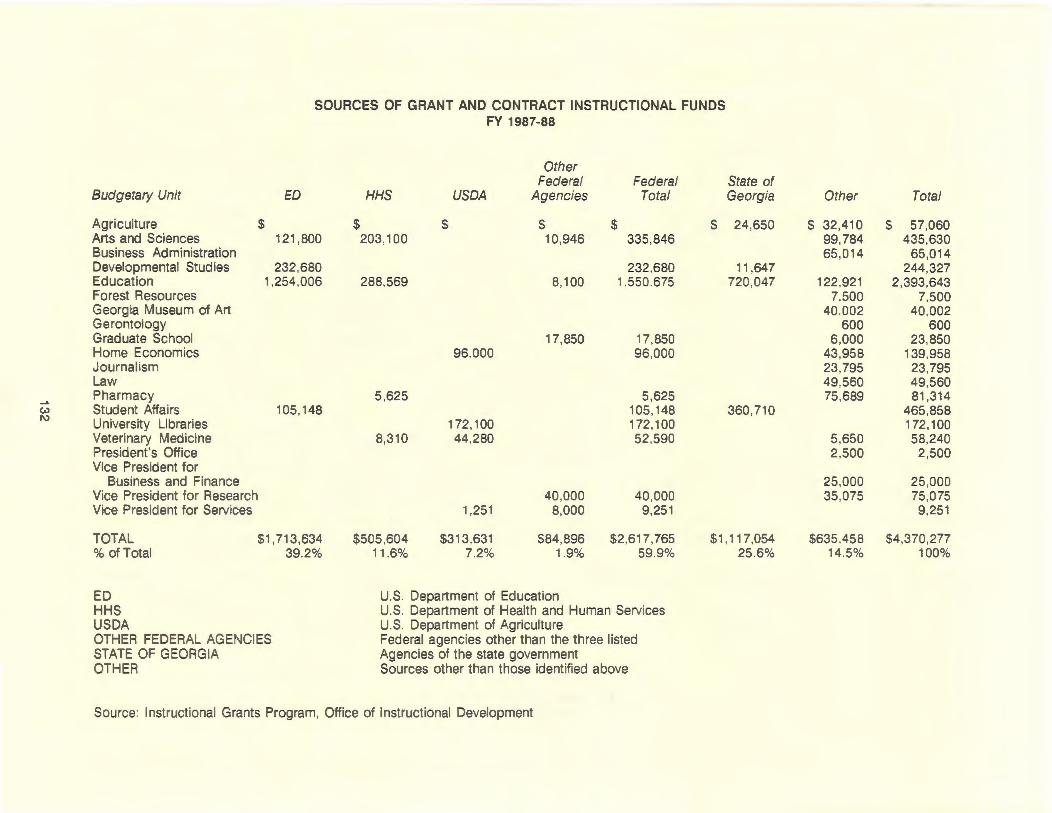
SOURCES OF GRANT AND CONTRACT INSTRUCTIONAL FUNDS FY 1987-88
Other Federal Federal State of
Budgetary Unit ED HHS USDA Agencies Total Georgia Other Total
Agriculture $ $ $ $ $ $ 24,650 $ 32,410 $ 57,060 Arts and Sciences 121 ,800 203,100 10,946 335,846 99,784 435,630 Business Administration 65 ,014 65,014 Developmental Studies 232,680 232,680 11 ,647 244,327 Education 1,254,006 288,569 8,100 1.550.675 720,047 122,921 2,393 ,643 Forest Resources 7.500 7,500 Georgia Museum of Art 40.002 40,002 Gerontology 600 600 Graduate School 17,850 17,850 6,000 23 ,850 Home Economics 96.000 96,000 43,958 139,958 Journalism 23,795 23 ,795 Law 49,560 49,560 Pharmacy 5,625 5,625 75,689 81 ,314
(..) Student Affairs 105,148 105,148 360,710 465,858 1\)
University Libraries 172,100 172,100 172,100 Veterinary Medicine 8,310 44,280 52,590 5,650 58,240 President's Office 2,500 2,500 Vice President for
Business and Finance 25,000 25,000 Vice President tor Research 40 ,000 40,000 35,075 75,075 Vice President for Services 1,251 8,000 9,251 9,251
TOTAL $1 ,713,634 $505,604 $313.631 $84,896 $2,617,765 $1 '117,054 $635,458 $4,370,277 %of Total 39.2% 11.6% 7.2% 1.9% 59.9% 25.6% 14.5% 100%
ED U.S. Department of Education HHS U.S. Department of Health and Human Services USDA U.S. Department of Agriculture OTHER FEDERAL AGENCIES Federal agencies other than the three listed STATE OF GEORGIA Agencies of the state government OTHER Sources other than those identified above
Source: Instructional Grants Program, Office of Instructional Development
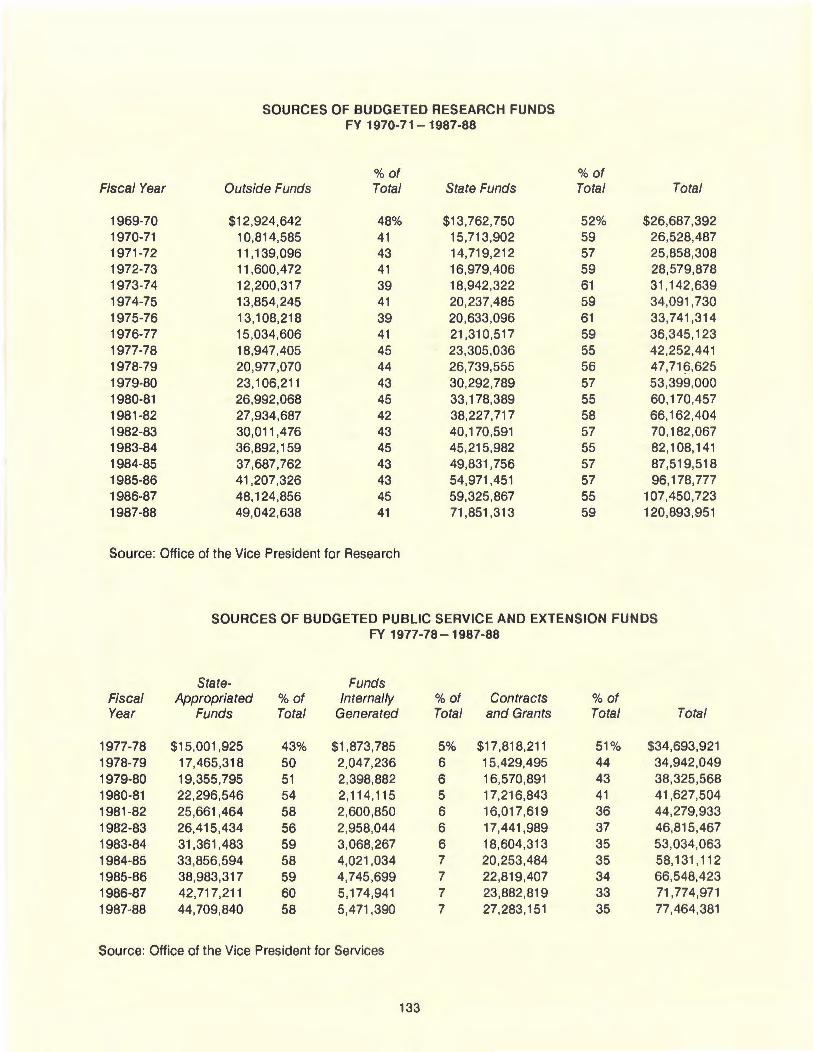
SOURCES OF BUDGETED RESEARCH FUNDS FY 1970-71-1987-88
%of %of Fiscal Year Outside Funds Total State Funds Total Total
1969-70 $12,924,642 48% $13,762,750 52% $26,687,392 1970-71 10,814,585 41 15,713,902 59 26,528,487 1971 -72 11,139,096 43 14,719,212 57 25,858,308 1972-73 11,600,472 41 16,979,406 59 28,579,878 1973-74 12,200,317 39 18,942,322 61 31,142,639 1974-75 13,854,245 41 20,237,485 59 34,091,730 1975-76 13,108,218 39 20,633,096 61 33,741,314 1976-77 15,034,606 41 21,310,517 59 36,345,123 1977-78 18,947,405 45 23,305,036 55 42,252,441 1978-79 20,977,070 44 26,739,555 56 47,716,625 1979-80 23,106,211 43 30,292,789 57 53,399,000 1980-81 26,992,068 45 33,178,389 55 60,170,457 1981 -82 27,934,687 42 38,227,717 58 66,162,404 1982-83 30,011,476 43 40,170,591 57 70,182,067 1983-84 36,892,159 45 45,215,982 55 82,108,141 1984-85 37,687,762 43 49,831,756 57 87,519,518 1985-86 41,207,326 43 54,971,451 57 96,178,777 1986-87 48,124,856 45 59,325,867 55 107,450,723 1987-88 49,042,638 41 71,851,313 59 120,893,951
Source: Office of the Vice President for Research
SOURCES OF BUDGETED PUBLIC SERVICE AND EXTENSION FUNDS FY 1977-78-1987-88
State- Funds Fiscal Appropriated %of Internally %of Contracts %of Year Funds Total Generated Total and Grants Total Total
1977-78 $15,001 ,925 43% $1,873,785 5% $17,818,211 51% $34,693,921 1978-79 17,465,318 50 2,047,236 6 15,429,495 44 34,942,049 1979-80 19,355,795 51 2,398,882 6 16,570,891 43 38,325,568 1980-81 22,296,546 54 2,114,115 5 17,216,843 41 41,627,504 1981-82 25,661,464 58 2,600,850 6 16,017,619 36 44,279,933 1982-83 26,415,434 56 2,958,044 6 17,441 ,989 37 46,815,467 1983-84 31,361,483 59 3,068,267 6 18,604,313 35 53,034,063 1984-85 33,856,594 58 4,021,034 7 20,253,484 35 58,131,112 1985-86 38,983,317 59 4,745,699 7 22,819,407 34 66,548,423 1986-87 42,717,211 60 5,174,941 7 23,882,819 33 71,774,971 1987-88 44,709,840 58 5,471,390 7 27,283,151 35 77,464,381
Source: Office of the Vice President for Services
133
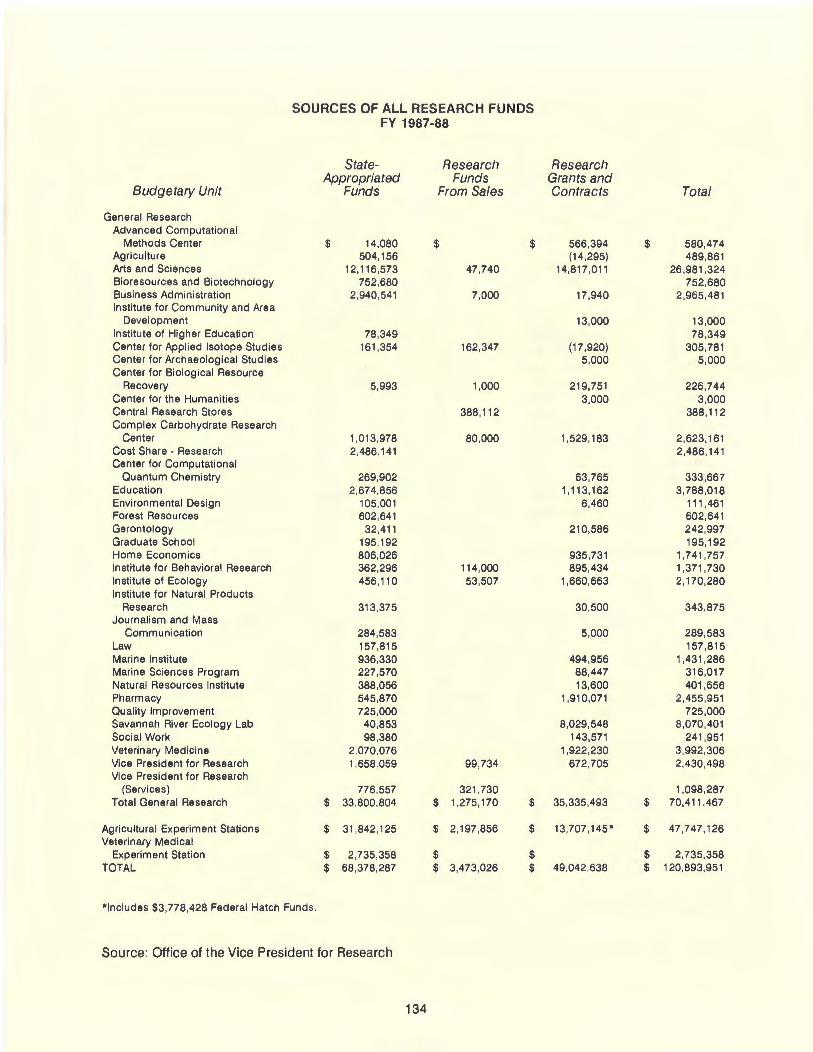
SOURCES OF ALL RESEARCH FUNDS FY 1987-88
State- Research Research Appropriated Funds Grants and
Budgetary Unit Funds From Sales Contracts Total
General Research Advanced Computational
Methods Center $ 14,080 $ $ 566,394 $ 580,474 Agriculture 504 ,156 (14 ,295) 489,861 Arts and Sciences 12,116,573 47,740 14,817,011 26 ,981 ,324 Bioresources and Biotechnology 752,680 752,680 Business Administration 2,940,541 7,000 17,940 2,965,481 Institute for Community and Area
Development 13,000 13,000 Institute of Higher Education 78,349 78,349 Center for Applied Isotope Studies 161 ,354 162,347 (17,920) 305,781 Center for Archaeological Studies 5,000 5,000 Center for Biological Resource
Recovery 5,993 1,000 219,751 226,744 Center for the Humanities 3,000 3,000 Central Research Stores 388 ,112 388,112 Complex Carbohydrate Research
Center 1,013,978 80,000 1,529,183 2,623,161 Cost Share - Research 2,486.141 2,486,141 Center for Computational
Quantum Chemistry 269,902 63,765 333,667 Education 2,674,856 1,113,162 3,788,018 Environmental Design 105,001 6,460 111,461 Forest Resources 602,641 602,641 Gerontology 32,411 210,586 242,997 Graduate School 195,192 195,192 Home Economics 806,026 935,731 1,741 ,757 Institute for Behavioral Research 362,296 114,000 895,434 1,371 ,730 Institute of Ecology 456,110 53,507 1,660,663 2,170,280 Institute for Natural Products
Research 313 ,375 30,500 343 ,875 Journalism and Mass
Communication 284,583 5,000 289,583 Law 157,815 157,815 Marine Institute 936,330 494,956 1,431,286 Marine Sciences Program 227,570 88,447 316,017 Natural Resources Institute 388,056 13,600 401,656 Pharmacy 545,870 1,910,071 2,455,951 Quality Improvement 725,000 725 ,000 Savannah River Ecology Lab 40,853 8,029,548 8,070,401 Social Work 98,380 143,571 241 ,951 Veterinary Medicine 2,070,076 1,922,230 3,992,306 Vice President for Research 1,658,059 99,734 672,705 2,430,498 Vice President for Research
(Services) 776,557 321 ,730 1,098,287 Total General Research $ 33,800,804 $ 1,275,170 $ 35,335,493 $ 70,411 ,467
Agricu ltural Experiment Stations $ 31 ,842 ,125 $ 2,197,856 $ 13,707 ,145. $ 47,747,126 Veterinary Medical
Experiment Station $ 2,735,358 $ $ $ 2,735,358 TOTAL $ 68,378,287 $ 3,473,026 $ 49,042,638 $ 120,893,951
* Includes $3,778,428 Federal Hatch Funds .
Source: Office of the Vice President for Research
134
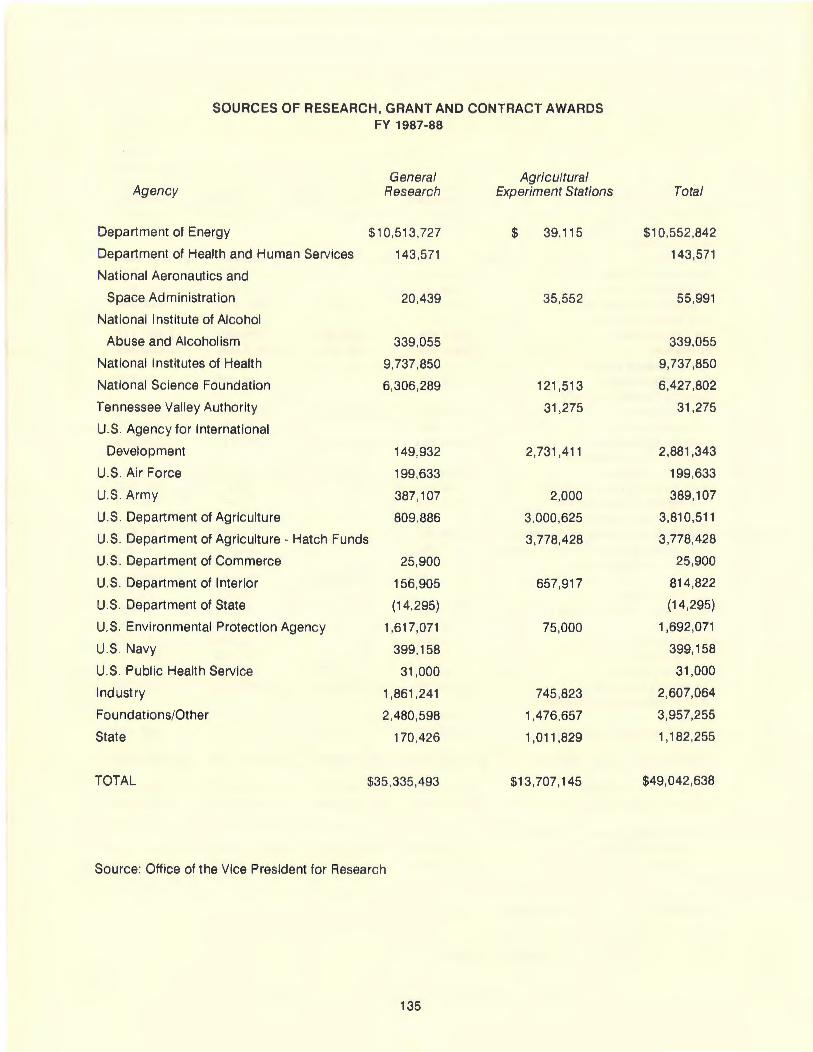
SOURCES OF RESEARCH, GRANT AND CONTRACT AWARDS FY 1987-88
General Agricultura l Agency Research Experiment Stations
Department of Energy $10,513 ,727 $ 39,115
Department of Health and Human Services 143,571
National Aeronautics and
Space Admin istration 20 ,439 35 ,552
National Inst itute of Alcohol
Abuse and Alcoholism 339,055
National Institutes of Health 9,737,850
National Science Foundation 6,306,289 121 ,513
Tennessee Valley Authority 31,275
U.S. Agency for International
Development 149,932 2,731,411
U.S. Air Force 199,633
U.S. Army 387,107 2,000
U.S. Department of Agriculture 809,886 3,000,625
U.S. Department of Agriculture - Hatch Funds 3,778,428
U.S. Department of Commerce 25 ,900
U.S. Department of Interior 156,905 657,917
U.S. Department of State (14 ,295)
U.S. Environmental Protection Agency 1 ,617,071 75,000
U.S. Navy 399,158
U.S . Public Health Service 31 ,000
Industry 1 ,861 ,241 745,823
Foundations/Other 2,480 ,598 1,476,657
State 170,426 1 ,011 ,829
TOTAL $35 ,335,493 $13,707,145
Source: Office of the Vice President for Research
135
Total
$10,552,842
143,571
55 ,991
339,055
9,737,850
6,427,802
31,275
2,881 ,343
199,633
389,107
3,810,511
3,778,428
25,900
814,822
(14,295)
1 ,692,071
399,158
31,000
2,607,064
3,957,255
1 '182,255
$49,042,638
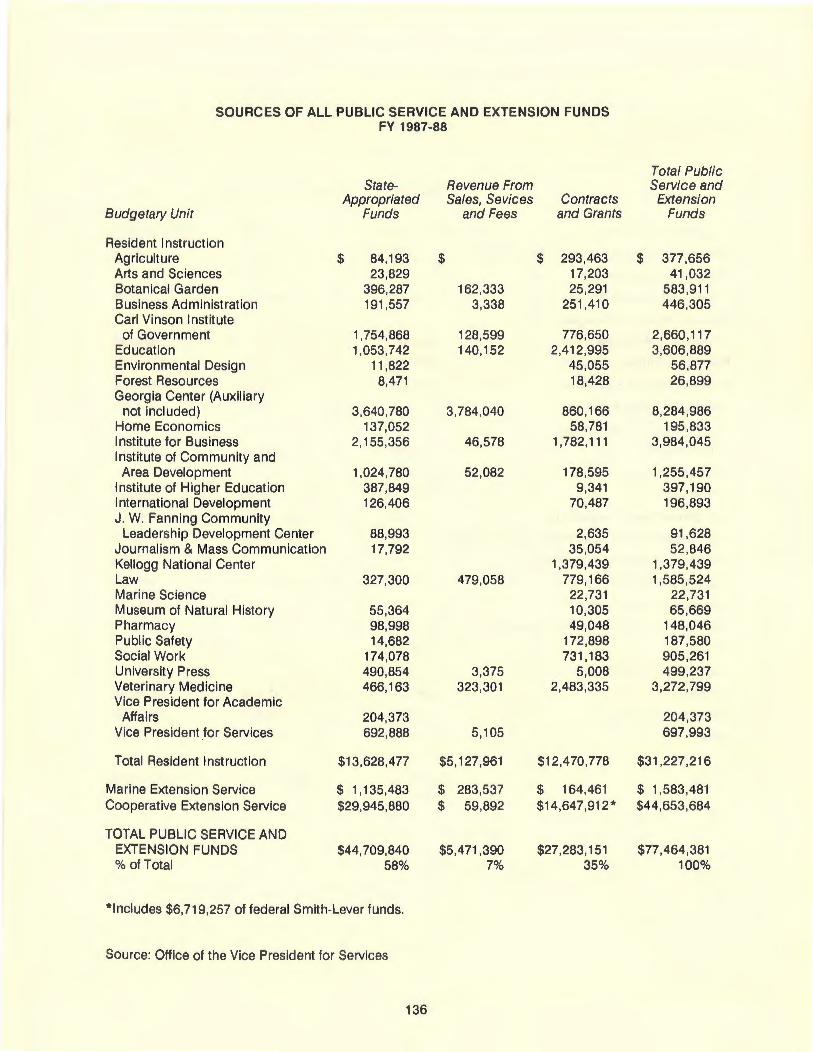
SOURCES OF ALL PUBLIC SERVICE AND EXTENSION FUNDS FY 1987-88
State- Revenue From Appropriated Sales, Sevices Contracts
Budgetary Unit Funds and Fees and Grants
Resident Instruction Agriculture $ 84,193 $ $ 293,463 Arts and Sciences 23,829 17,203 Botanical Garden 396,287 162,333 25,291 Business Administration 191,557 3,338 251,410 Carl Vinson Institute
of Government 1,754,868 128,599 776,650 Education 1,053,742 140,152 2,412,995 Environmental Design 11,822 45,055 Forest Resources 8,471 18,428 Georgia Center (Auxiliary
not included) 3,640,780 3,784,040 860,166 Home Economics 137,052 58,781 Institute for Business 2,155,356 46,578 1,782,111 Institute of Community and Area Development 1,024,780 52,082 178,595
Institute of Higher Education 387,849 9,341 International Development 126,406 70,487 J. W. Fanning Community
Leadership Development Center 88,993 2,635 Journalism & Mass Communication 17,792 35,054 Kellogg National Center 1,379,439 Law 327,300 479,058 779,166 Marine Science 22,731 Museum of Natural History 55,364 10,305 Pharmacy 98,998 49,048 Public Safety 14,682 172,898 Social Work 174,078 731,183 University Press 490,854 3,375 5,008 Veterinary Medicine 466,163 323,301 2,483,335 Vice President for Academic
Affairs 204,373 Vice President for Services 692,888 5,105
Total Resident Instruction $13,628,477 $5,127,961 $12,470,778
Marine Extension Service $ 1,135,483 $ 283,537 $ 164,461 Cooperative Extension Service $29,945,880 $ 59,892 $14,647,912*
TOTAL PUBLIC SERVICE AND EXTENSION FUNDS $44,709,840 $5,471,390 $27,283,151 %of Total 58% 7% 35%
* Includes $6,719,257 of federal Smith-Lever funds.
Source: Office of the Vice President for Services
136
Total Public Service and
Extension Funds
$ 377,656 41,032
583,911 446,305
2,660,117 3,606,889
56,877 26,899
8,284,986 195,833
3,984,045
1,255,457 397,190 196,893
91,628 52,846
1,379,439 1,585,524
22,731 65,669
148,046 187,580 905,261 499,237
3,272,799
204,373 697,993
$31 ,227,216
$ 1,583,481 $44,653,684
$77,464,381 100%
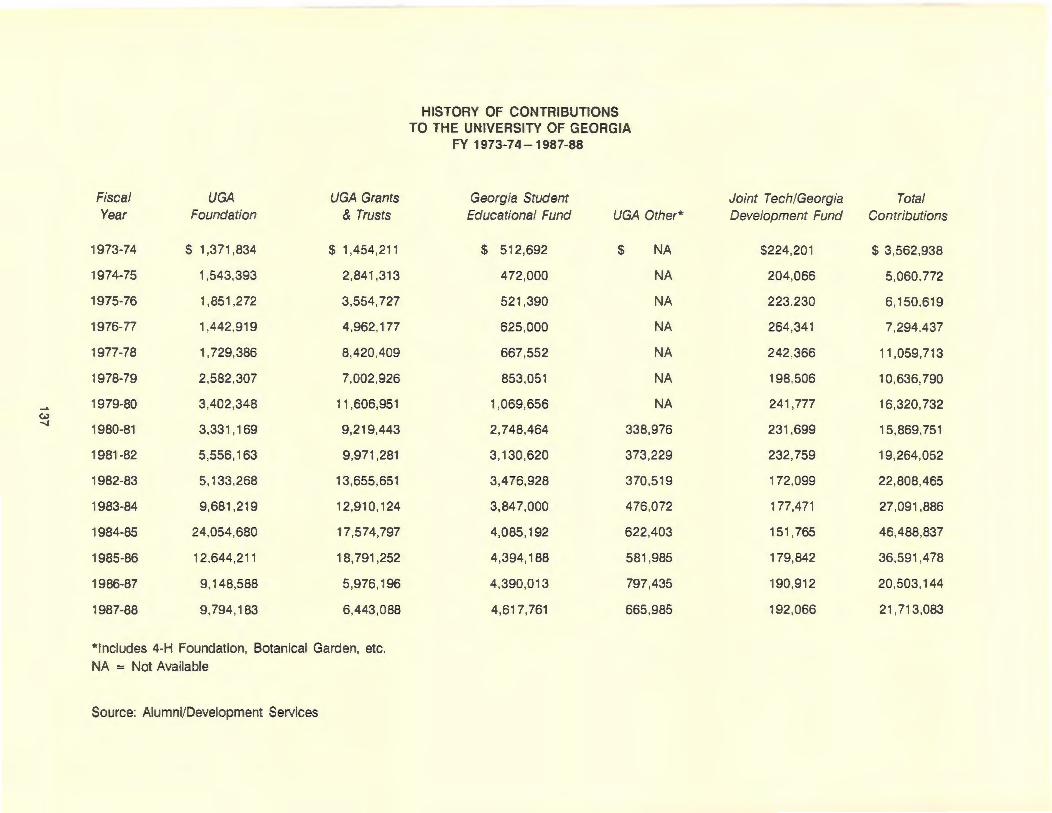
Fiscal UGA UGA Grants Year Foundation & Trusts
1973-74 $ 1,371 ,834 $ 1,454,211
1974-75 1,543,393 2,841 ,313
1975-76 1,851 ,272 3,554,727
1976-77 1,442,919 4,962,177
1977-78 1,729,386 8,420,409
1978-79 2,582,307 7,002,926
1979-80 3,402,348 11 ,606,951 (.,) ....,
1980-81 3,331,169 9,219,443
1981-82 5,556,163 9,971 ,281
1982-83 5,133,268 13,655,651
1983-84 9,681 ,219 12,910,124
1984-85 24,054,680 17,574,797
1985-86 12,644,211 18,791 ,252
1986-87 9,148,588 5,976,196
1987-88 9,794,183 6,443,088
*Includes 4-H Foundation, Botanical Garden, etc.
NA = Not Available
Source: Alumni/Development Services
HISTORY OF CONTRIBUTIONS TO THE UNIVERSITY OF GEORGIA
FY 1973-74-1987-88
Georgia Student Educational Fund UGA Other*
$ 512,692 $ NA
472,000 NA
521 ,390 NA
625 ,000 NA
667,552 NA
853,051 NA
1,069,656 NA
2,748,464 338,976
3,130,620 373,229
3,476,928 370,519
3,847,000 476,072
4,085,192 622,403
4,394,188 581 ,985
4,390,013 797,435
4,617,761 665,985
Joint Tech/Georgia Total Development Fund Contributions
$224,201 $ 3,562,938
204,066 5,060.772
223.230 6,150.619
264,341 7,294.437
242,366 11 ,059,713
198,506 10,636,790
241 ,777 16,320,732
231 ,699 15,869,751
232,759 19,264,052
172,099 22,808,465
177,471 27,091 ,886
151,765 46,488,837
179,842 36,591 ,478
190,912 20,503,144
192,066 21 ,713,083

THE ADVANCED COMPUTATIONAL METHODS CENTER (ACMC) is the unit of the University Computing and Networking Services organization responsible for facilitating use of advanced computing technologies and methods in support of institutional research programs. ACMC activities currently focus on support of high performance vector computational science, prototypical parallel algorithm development, basic and applied research in artificial intelligence, and scientific data visualization. The ACMC emphasizes training researchers in the use of advanced computing technologies, sponsoring collaborative research init iatives using these technologies, and acquiring and managing the supporting computing resources.
THE AGRICULTURAL EXPERIMENT STATIONS seek and verify new knowledge through research in the many fields related to agriculture. There are three main stations at Athens, Griffin, and Tifton; five branch stations at Blairsville, Calhoun, Plains, Midville, and Eatonton; and extension-research centers at Attapulgus and Savannah. Research projects are conducted in agricultural economics, agricultural engineering, agronomy, animal and dairy science, entomology, food science, forest resources, home economics, horticulture, plant pathology, and poultry science.
AUXILIARY SERVICES, including the University Bookstore, Campus Transit System, Food Services, University Golf Course, University Printing, University Vending, and University Parking Services, are supported by income generated from the sale of merchandise and services to students, faculty, and staff. Financially self-supporting, these auxiliary units are related to the educational objectives of the university.
Campus Transit System operates a fleet of 29 buses for students and staff. Service is provided on seven routes from 7:00a.m. to 6:00 p.m., and two buses provide night service from 6:00 p.m. to 12:00 a.m. Monday through Friday . Van service for handicapped students unable to use regularly-scheduled buses is provided during the week. Charter bus service is available for educationally-related purposes.
University Bookstore is a retail facility specializing in textbooks, general books, specialized and general school supplies, personal computers, UGA clothing and novelties, and convenience items. Books not carried in stock may be procured through special order.
University Food Services seeks to satisfy the food service needs of students, faculty, and staff with a variety of wholesome foods served at reasonable prices. Five dining facilities - Bolton Hall, Snelling Hall, Oglethorpe Hall , Tate Center, and Botanical Garden - are maintained by the University Food Services for its customers. McWhorter Dining Hall serves participants in athletic programs. The University Food Services also provides banquet services and catering from the Tate Center facility .
University Golf Course is a teaching and recreational facility available to students, faculty, staff, alumni, and their dependents, plus conferees. The 18-hole championship course, designed by Robert Trent Jones, also includes driving range, putting greens, and chipping green. "Golfing weather" hours are Monday through Friday from 8:00 a.m. until sundown, and weekends and holidays from 7:30 a.m. until sundown. The Pro Shop carries a complete line of golfing equipment and supplies.
University Printing is designed and equipped to provide quality offset printing services for all offices and departments of the University. Basic services include design assistance and consultation, phototypesetting (either from manuscript or from word processing disk), paste-up, negative and plate work, press work, and bindery/finishing work. The plant is staffed and equipped to produce stationery, business cards, office forms, brochures, booklets, programs, posters, journals, and perfect-bound books. A mix of several sizes and types of presses enables University Printing to produce everything from simple single-color jobs to sophisticated four-color process work in whatever quantity is required .
University Vending locates vending machines throughout campus for the benefit of students, faculty, and staff. The equipment and service are operated and maintained by private contractors . In addition to food, beverage, and tobacco vending, the program includes coin-operated telephones and change machines.
140
University Parking Services provides specified parking lots for commuter students, campus housing residents, graduate students, faculty, staff, and handicapped persons. In addition to the lots for registered vehicles, a high-rise parking deck next to the Georgia Center for Continuing Education and several pay-by-the-hour lots in heavy traffic areas of campus are provided for visitors and to accommodate university personnel for short periods of time.
THE BUREAU OF EDUCATIONAL SERVICES (previously the Bureau of Educational Studies and Field Services) provides educational consultants and technical assistance as requested by the public schools of Georgia, the region, other colleges, and the State Department of Education. The services of the bureau are available on a continuing basis to local school boards and other educational agencies for analyzing problems, improving educational practices, and continually updating the knowledge and skills of administrative, supervisory, and teaching personnel.
THE CENTER FOR ADVANCED ULTRASTRUCTURAL RESEARCH serves the University System by providing a repository of facilities and expertise to assist in pursuing and achieving research and instructional needs employing electron optical systems. The center, which reports to the Dean of Arts and Sciences, also serves the private sector.
THE CENTER FOR APPLIED ISOTOPE STUDIES, an applied research group under the direct supervision of the Office of the Vice President for Research, is located in the university's Research Park in the Center for Applied Isotope Studies Building . The primary activities of the center are to assist the academic, scientific, and industrial communities in applied and basic research . Emphasis is placed on applied research, assisted by a unique array of nuclear analytical tools, directed toward the resolution of critical contemporary problems. A service laboratory is maintained for age dating, radiometric analyses, and stable isotope measurements.
THE CENTER FOR ARCHAEOLOGICAL SCIENCES promotes and coordinates research between the humanities - archaeology, anthropology, and art history - and the sciences - geology, geochemistry, organic chemistry, inorganic chemistry, and the biological sciences. The center coordinates the research of university scholars in fields relating to archaeology and art history, facilitates collaboration with experts outside the university, serves as a resource center of laboratory equipment and technical support for archaeologists and art historians worldwide, and coordinates interdisciplinary undergraduate and graduate degree programs in the archaeological sciences.
THE CENTER FOR AUDIT RESEARCH within the School of Accounting seeks to stimulate a continuing commitment to audit research that has practical implications. In the broad context of governmental, internal, and financial statement auditing, the center encourages practitioners and academicians jointly to explore implementation issues of audit research, and it disseminates research ideas and findings.
THE CENTER FOR BIOLOGICAL RESOURCE RECOVERY is comprised of investigators from the departments of biochemistry, botany, microbiology, and food science at the university and from the Richard B. Russell Agricultural Research Center. These investigators have in common an interest in the ecology, physiology, and biochemistry of microorganisms, with emphasis on those microorganisms that can be used in agricultural and industrial processes for the degradation of cellulose, hemicellulose, and lignin and for the fermentation of the degradation products to industrial feed-stock chemicals.
THE CENTER FOR COMPUTATIONAL QUANTUM CHEMISTRY seeks to develop theoretical and computational methods through mathematical models for describing and understanding the movement and function of subatomic particles in molecules and to apply the theoreti~al methods to significant problems of broad chemical interest.
Currently several areas of chemistry are of special concern: (1) organosilicon chemistry, specifically the prediction and understanding of the properties of silicon analogs of common hydrocarbon compounds; (2) the potential energy hypersurfaces that govern elementary gas-phase chemical reactions; (3) new high energy density molecular systems; (4) fundamental problems in physical organic chemistry involving, for
141
example, carbenes and other biradical species and systems such as the [n] paracyclophanes; and (5) hydrogen bonding in systems such as the formic acid dimer and the guaine-cytosine base pair.
THE CENTER FOR EAST-WEST TRADE POLICY is an interdisciplinary and interuniversity research, teaching, and service project designed to promote more informed trade policy and further national and state economic interests. Its primary function is to study and produce policy-relevant research on U.S. and Western alliance trade policy vis-a-vis communist countries, most importantly the Soviet Union, Eastern Europe, and the Peoples Republic of China. The center encourages and coordinates collaborative research, teaching, and service related activities within the university, the state, and nation .
THE CENTER FOR ECONOMIC EDUCATION, an ongoing program of the Department of Social Science Education, with assistance from the College of Business Administration, exists to increase the level of economic literacy in Georgia through the improvement of economics instruction in Georgia schools. The center provides in-service teacher training, develops instructional materials, and encourages innovation in economics education.
THE CENTER FOR ENVIRONMENTAL BIOTECHNOLOGY, a part of the Institute of Ecology, is made up of an integrated team of scientists, staff, and graduate students. The center has as major objectives to address basic questions in microbial ecology via a series of laboratory, field and modeling studies, to develop protocols for risk assessment and product advisement using bioengineered organisms, and to develop long-term linkages between university researchers and industrial users of bioengineered microbes and products.
THE CENTER FOR FAMILY RESEARCH, a component of the Institute for Behavioral Research located in the Boyd Graduate Studies Building, seeks to promote the understanding of the family through research conducted by interdisciplinary teams of scientists. An emphasis is placed upon data-based research and collaboration .
THE CENTER FOR GLOBAL POLICY STUDIES explores and develops interdisciplinary and interprofessional programs of instruction, research, and service on a range of global issues. It administers undergraduate and graduate certificate programs in global policy studies; sponsors instructional and research-oriented symposia, lectures, and publications; and serves as a focal point for those with an interest in foreign languages and international studies both inside and outside the university.
THE CENTER FOR INSURANCE EDUCATION AND RESEARCH is designed to conduct research on questions of short- and long-term interest to the insurance community and to provide periodic seminars and conferences on issues facing that industry. The center also sponsors continuing education programs for the insurance industry in Georgia and gives financial support to undergraduate and graduate students, as well as faculty of risk management and insurance.
THE CENTER FOR INTERNATIONAL MASS COMMUNICATION TRAINING AND RESEARCH serves to facilitate international mass communication training and research programs in which scholars from the United States and foreign countries, students, and mass communication professionals can cooperate. The center helps to coordinate efforts to improve the state of knowledge in the field and to encourage practical training, education, and service projects.
THE CENTER FOR LATIN AMERICAN STUDIES, coordinates interdisciplinary research, curriculum offerings, and public programs which deal with Latin America. Through colloquia, conferences, and an undergraduate certificate program, the center seeks to bring together faculty from all colleges and schools in the university currently engaged in work related to this region of the world . The center publishes a monograph series and an annual bibliography of Latin American thought.
THE CENTER FOR MANAGEMENT EXCELLENCE has as its overall goal managerial and organizational productivity increases for Georgia, the Southeast, and the nation through the improvement of human performance in organizations. Functioning as a part of the Department of Management, the center's overriding purpose is to focus on the human element in productivity and performance.
142
THE CENTER FOR MARKETING STUDIES, established in 1986, seeks to advance professional marketing education and to identify and develop new programs and methods which will better serve the marketing community's needs for education and information. A part of the College of Business Administration, the center also works to maintain and strengthen relations with the business community.
THE CENTER FOR PLANT CELLULAR AND MOLECULAR BIOLOGY is designed to foster and support interactions between those members of the University of Georgia research community who share a common interest in molecular aspects of plant growth and development. While members of the center carry out individual research programs, the center provides a base for joint and cooperative projects. It also provides a cohesive, broadly based training program for those interested in the molecular aspects of plant science.
THE CENTER FOR PRIVATE ENTERPRISE has as its major mission the furtherance of understanding of the principles of private enterprise. The center engages in research studies that demonstrate the benefits of economic decisions made in a competitive environment and in teaching undergraduate and graduate students the principles of private enterprise, the theoretical underpinnings of market economies, and other appropriate subjects. In addition to its teaching and research functions, the center also carries on an active service program involving public lectures and seminars dealing with the private enterprise system.
THE CENTER FOR REMOTE SENSING AND MAPPING SCIENCE (CAMS) undertakes research and training in the fields of remote sensing, geographic information systems (GIS), photogrammetry, digital image processing, and computer graphics, particularly as applied to the physical and biological sciences. Typical research topics include quantitative methodologies for measuring soil erosion from agricultural lands by photogrammetric techniques, mapping environmental disturbances from aerial photographs, and satellite images, development of integrated image processing/GIS software and advanced technologies for monitoring the earth's surface from digital image data. Close associations are maintained with remote sensing organizations and scientists in Canada, Europe, South America, and Asia. The CAMS provides technical assistance to universities and to local, state, and federal agencies.
THE CENTER FOR RESEARCH ON DEVIANCE is a part of the Institute for Behavioral Research. It supports and encourages interdisciplinary research activities concerning deviance, health, and the management of productivity problems in the workplace. Its staff, consisting of faculty, postdoctoral fellows, staff, and graduate students from a variety of departments, assists investigators who are conducting research or seeking research funds from federal agencies and private foundations. Primary research topics of the center include alcoholism, psychiatric illness, drug abuse, problem (acting-out) children, family violence, and the examination of criminal justice and other intervention system operations.
THE CENTER FOR RESEARCH ON NITROGEN FIXATION AND METALLOENZYME CATALYSIS was established to encourage cooperative research on related biochemical problems, by gathering basic knowledge about the working of enzymes that catalyze a variety of life-supporting reactions like nitrogen fixation, sulfur metabolism, carbon monoxide metabolism, and hydrogen production. Using the latest technologies and state-of-the-art analytical equipment, faculty researchers and postdoctorate and graduate students are able to teach and train in genetics, enzymology, fermentation technology, and anaerobic techniques.
THE CENTER FOR Sl MULATIONAL PHYSICS functions as a center for research and training in simulational physics, with emphasis on the use of supercomputers. Because of this work, close interaction with the Advanced Computational Methods Center is maintained, and collaborative research programs with major institutions in the United States and Europe are developed. The center's staff consists of research and adjunct professors, visiting research scientists, and postdoctoral associates.
THE CHILD AND ADOLESCENT CLINIC, a service of the College of Education's Department of Special Education, provides file reviews and diagnostic assessments for children and adolescents from preschool through high school who may need special services. During a file review the clinic staff examines the individual's records to determine whether more assessment is needed and whether special education
143
placement seems appropriate. The diagnostic assessment entails a two-day evaluation of the child's cognitive, language, social-emotional , and academic abilit ies. The information is used to help parents and teachers understand the individual's specific strengths and weaknesses and to develop recommendations for teaching and home management.
THE COMPLEX CARBOHYDRATE RESEARCH CENTER (CCRC) , chosen by the U. S. Department of Energy, the National Science Foundation, and the United States Department of Agriculture as the nation's first three-agency sponsored plant science center, studies the structure and functions of the complex carbohydrates of plants and microbes. Scientists at the CCRC investigate the chemistry and the physiological, developmental, and molecular biology of complex carbohydrates having biological importance, using the most advanced analytical techniques, including mass spectrometry and nuclear magnetic resonance (NMR) spectroscopy. CCRC personnel are presently engaged in over 60 collaborations with scientists in North America , Europe, Asia, and Australia.
THE COOPERATIVE EXTENSION SERVICE acts as an educational service arm for the university, providing information and training to Georgia citizens. Staff members, representing both the University of Georgia College of Agriculture and the U.S. Department of Agriculture , present educational programs in agriculture, home economics, community development, and 4-H and youth development. Programs are based on the most current research and coordinated at the local level by county extension agents in response to needs articulated by local citizens.
The Rural Development Center, located at Tifton, is an educational and public service unit of the Cooperative Extension Service of the University of Georgia College of Agriculture. The program of the center is directed toward the realization of four principal objectives: agricultural and forest production efficiency, advanced marketing techniques and utilization of farm and forest commodities, comprehensive community development, and human resource training and development.
THE DEVELOPMENTAL DISABILITIES PROGRAM (formerly the Georgia Retardation Center-Athens) is a joint federal, state, and university service that provides residential care and related service programs for children and youth with mental retardation and other developmental disabilities. The center is a branch of the Department of Human Resources, the unit responsible for administration of the center. The Developmental Disabilities Program (DDP) and the University Affiliated Program (UAP), both a part of the Division for Exceptional Children in the College of Education, work with the center to achieve interdisciplinary training, research, and dissemination in the area of developmental disabilities.
THE DIVISION OF RESEARCH: COLLEGE OF BUSINESS ADMINISTRATION serves the state through research projects on problems of economic growth and development in Georgia and the Southeast. It provides a current collection of business and economic reference materials and offers editorial and administrative support to faculty engaged in business and economic research . In addition, the Division of Research offers computer operation support to both faculty and students.
The division publishes Georgia Business and Economic Conditions, a bi-monthly magazine composed of research papers and business and economic statistics; The Georgia Statistical Abstract; monographs on the Georgia economy; and a working paper series of faculty research . Recent additions to division publications include an annual Georgia Economic Outlook, which highlights the state's economic forecast , and the monthly series of Leading and Coincident Economic Indicators. In addition, the division conducts a program of state and regional economic analysis and supports the Georgia Economic Forecasting Project.
THE J.W. FANNING COMMUNITY LEADERSHIP DEVELOPMENT CENTER has the development of effective community leadership as its primary purpose. Coordinating the university's teaching, research, and service opportunities, the center works with local chambers of commerce and other civic organizations to provide community leaders with opportunities for identifying local issues and building skills to enhance life in their communities.
144
THE FINANCIAL AND STUDENT INFORMATION SYSTEMS DIVISION provides computer-based information system services to designated administrative departments of the University of Georgia. This service primarily involves maintenance of existing computer applications systems; modification and expansion of those systems to meet changing user requirements; assistance and/or training of user departments to obtain various ad hoc or short-term reports; development of new state-of-the-art user-oriented applications systems; data base planning; coordination and consultation; provision of data entry and control services; and microcomputer support to include applications development and micro-mainframe interface assistance. These services are provided through three departments: Student Information Systems, Financial Information Systems, and Control and Data Entry. The division utilizes hardware jointly with the University Computing and Networking Services.
THE GEORGIA CENTER FOR CONTINUING EDUCATION pl<;ms and implements educational programs in response to the diverse needs of adults throughout Georgia, the nation, and many foreign lands. These needs are expressed individually or through a range of governmental agencies, business and professional organizations, and civic, cultural, and educational groups. The center 's staff works with university faculty, other experts , and clientele groups to extend the relevant resources of the University System to adult learners.
The center delivers a complex, comprehensive educational program through residential conferences and short courses; on-campus and off-campus programs for credit , non-credit , and certification; credit and non-credit audioconferences and teleconferences; independent study; mass media; and National Public Radio (WUGA-FM, 91 .7) . Other services include cooperative programming with other institutions of higher education; television and film production; print design and production; media library operations; and consultation and supportive services to organizations and agencies.
Over a six-year period (1984-1990), funding from the W.K. Kellogg Foundation will provide the impetus for the center to expand its programming and to develop technological advances in service delivery. A matching grant from the state of Georgia has funded a major addition to the center's facilities. The center's food and lodging facilities may be reserved by alumni, student parents, and others visiting the university for administrative and academic purposes.
THE GEORGIA MUSEUM OF ART, founded in 1945 by Alfred H. Holbrook, serves the university, the community, and the state. In recognition of the museum's statewide outreach and growing national prominence, it was designated the State Museum of Art by the Georgia General Assembly in 1982. The permanent collection of the museum now numbers over 5,000 works, with primary emphasis on 19th- and early 20th-century American art . Works in the collection and curatorial files are available for study by students and scholars. An active publications program includes a quarterly museum newsletter, three scholarly bulletins, and catalogs for selected exhibitions organized by the museum. Changing exhibits feature major traveling exhibitions and works from the collection. Lectures, gallery talks, films, family days, and other events are scheduled to complement these exhibitions. Except for national holidays, the museum is open seven days a week. Admission is free.
THE GEORGIA REVIEW, winner of the 1986 National Magazine Award in Fiction, is an internationally known journal of arts and letters, published by the university since 1947. Its quarterly issues feature a blend of the best in contemporary thought and writing - essays, poetry, fiction, and book reviews - together with inviting art works . Accessible to the informed, nonspecialist reader, The Review appeals across disciplinary lines by drawing from a wide range of interests, including literature, history, philosophy, science, architecture, film, and the musical and visual arts .
THE HUMANITIES CENTER function is to promote and facilitate interdisciplinary research concerning conceptual and methodological issues prominent in the humanities.
Among the issues considered by the center are both those which are at the theoretical core of all humanities scholarship and those which ask what contribution can the humanities make to critical contemporary
145
questions about norms and values. The center pursues its objectives by offering faculty research fellowships, by organizing conferences and discussion groups, and by presenting lectures.
THE INSTITUTE FOR BEHAVIORAL RESEARCH is an interdisciplinary umbrella organization for the social and behavioral sciences on campus. Its constituent centers and research groups include the Center for Family Research, the Center for Research on Deviance, the Cognitive Studies group, and the Survey Research Center. Faculty from across the university make up the institute's professional staff. The institute facilitates high-quality, interdisciplinary research in the behavioral sciences by providing an atmosphere in which scholars from different disciplines meet frequently to share information about ongoing research.
THE INSTITUTE FOR BUSINESS, founded in 1983, serves as the coordinating unit for the statewide network of Small Business Development Centers and as a corporate education program to develop and promote relationships between the University of Georgia and the business community.
The Small Business Development Center works in conjunction with local, state, and federal governments, universities and colleges, and the private sector to provide management assistance to small businesses and potential entrepreneurs. Through its 18 regional and district centers statewide, the SBDC's basic services are counseling, management training, and business research .
The Corporate Education Division provides a public service to industries and businesses in Georgia by conducting management and supervisory programs designed to meet the specific needs of individual companies. The IFB has a film library in conjunction with its management development programs; the films are available for exchange or rent.
The UGA Innovation/Incubation Center provides inexpensive office space, management counseling, and business services on an "as-used, at cost" basis for new businesses, particularly those in the biotechnology field.
THE INSTITUTE FOR NATURAL PRODUCTS RESEARCH carries out a broad range of research on naturally occurring substances of plant origin, with particular attention to plant species of Georgia and the Southeast. Projects involve research on alkaloids, terpenes, antitumor agents, phytoalexins; the development of new synthetic methods; and the application of modern spectroscopic methods to structure elucidation problems. Research involves the isolation and elucidation of chemical structures of new compounds possibly useful as drugs for the treatment of human disease. The institute serves as a training center tor visiting faculty and for postdoctorate and graduate students who are working in natural products research.
THE INSTITUTE OF COMMUNITY AND AREA DEVELOPMENT uses university resources to help solve the problems of Georgia's communities by providing services to regional planning commissions, state agencies, local governments, and other community client groups. Focusing on community growth and issues related to the quality of community life, faculty and staff from sixteen academic disciplines skilled in group process and strategic planning provide consultation and technical assistance, workshops, conferences, seminars, and specially designed research studies. ICAD publishes its findings and recommendations in monographs, reports, manuals and books, including The Atlas of Georgia, audiovisual materials and four periodicals to aid all community developers and public policy officials. Recent topics of I CAD research and consultation include community investment, creative problem solving, natural resource management, recreation technical assistance, human resource development, and area planning and development.
THE INSTITUTE OF CONTINUING JUDICIAL EDUCATION OF GEORGIA, housed at the University of Georgia School of Law, plans and conducts more than 40 seminars each year tor the basic professional development and continuing education of judges and other personnel of the Georgia court system. It supports participation by selected personnel of the judicial branch in programs conducted by national training agencies. This past year its programs reached more than 2,000 judges and court support personnel.
146
THE INSTITUTE OF CONTINUING LEGAL EDUCATION IN GEORGIA, organized in 1965, is a consortium of the Law Schools of the University of Georgia, Emory, Mercer, Georgia State and the State Bar of Georgia. Approximately 65 seminars in over 50 areas of the law are conducted each year and range from six to twelve hours of training each. More than 14,300 registrants attended seminars in person. More than 20 of the live courses are telephone conferenced to 23 locations around the state . ICLE cosponsors approximately 35 live via satellite programs a year with national CLE providers. Several law firms, local bar associations and colleges make use of the institute's video tape inventory, assisting more than 200 attorneys each year in getting their 12 hours of mandatory training. The institute's print shop prepares more than 70 publications per year.
THE INSTITUTE OF ECOLOGY supports and encourages multidisciplinary research and service activities in ecology involving faculty and graduate students from a variety of departments, schools, and research sites. Besides laboratory facilities on campus in the Ecology Building, the institute also has excellent research facilities at the Savannah River Ecology Laboratory for the U.S. Department of Energy. Other field sites include the U.S. Forest Service Coweta Hydrologic Laboratory, the Okefenokee National Wildlife Refuge, Yellowstone National Park, and Sapelo Island. The institute supports research in marine and freshwater ecology, thermal ecology, radiation ecology, population and community ecology, mineral cycling, tropical and temperate forests, old field dynamics, agroecosystems, granite outcrops, and swamps. Its service program aids industry and government in making environmental assessments, teaches short courses in ecology, and provides other ecological services.
THE INSTITUTE OF HIGHER EDUCATION provides numerous services and resources, including a doctoral program in higher education, for the professional development of college administrators and faculty members. The staff works with two- and four-year colleges on curriculum development, program evaluation, institutional research, leadership and management support skills, and overall administrative effectiveness. Under cooperative arrangements with other agencies and institutions, the institute contributes to the development and improvement of higher education throughout the state and the nation. Each year the Faculty Development in Georgia (FDIG) program provides opportunities for eleven faculty members in Georgia colleges, public and private, to continue their graduate education at the University of Georgia. The institute's staff works closely with other educational agencies and organizations in research, assessment, and evaluation projects and in the development of public policy for education beyond high school. The institute cooperates with the University System of Georgia in its Regents Administrative Development Program, and the institute staff has recently completed a needs assessment study of 26 health professions for the Georgia Student Finance Authority.
THE INSTITUTE OF NATURAL RESOURCES is an interdisciplinary unit designed to synthesize relevant aspects of the biological, physical, and social sciences, law and the humanities to solve complex natural resource management problems. The institute's faculty conduct research and coordinate university programs and activities pertaining to development, use, and management of fish, wildlife, forest, water, land, and energy resources. Research is focused on applications of science to issues affecting natural resource management and policy analyses. The institute maintains the Office of State Climatologist and a program in Natural Resources Management. It cooperates closely with other units of the University System of Georgia and, upon request, acts in an advisory capacity to government and private organizations on matters relating to natural resources.
THE LEARNING DISABILITIES ADULT CLINIC provides diagnostic assessment, counseling, academic therapy, and assistance to University of Georgia students demonstrating specific learning disabilities. Faculty and administration consultation relevant to serving the learning disabled in the academic setting is also a service of the clinic.
THE MARINE SCIENCES PROGRAM, established by the university in 1976, is responsible for the coordination and general management of the Marine Institute, Marine Extension Service, Marine Sciences Faculty, and the Georgia Sea Grant College Program.
147
The Marine Institute, located on Sapelo Island, was established in 1953 to serve as a research facility for resident staff and for campus-based faculty members. Research has centered mainly on basic marsh ecology to provide an understanding of energy flow, cycling of minerals and nutrients through the marshes and nearby ocean, and factors regulating the metabolism of the salt marsh ecosystem.
The Marine Extension Service helps to solve problems related to the state's marine resources. The Marine Resources Center on Skidaway Island is the major marine education facility for schools and colleges in the state. At the Brunswick Extension Station, specialists work directly with the fishing and seafood processing industry to solve problems of resource management and utilization.
The Georgia Sea Grant College Program, part of the National Sea Grant College Program, was established in 1971 . In an approach roughly analogous to that of the Land Grant System in working with agriculture, Sea Grant promotes the wise use of marine resources through a coordinated program of research, education, and advisory services. Sustained excellence in all three areas of activity earned Sea Grant College status for the university in 1980, when it became the fifteenth institution in the nation to atta in that rank.
THE NATIONAL INSTITUTE FOR INSTRUCTIONAL MATERIALS has as its objective to develop quality vocational instructional materials. The staff develops and produces various types of materials in several areas, includ ing performance-based teacher education, computer software, vocational resources, and competency-based administrator education. This institute operates as the American Association for Vocational Instructional Materials on an international basis and is so incorporated in the state of Georgia.
THE OFFICE OF CAMPUS PLANNING assists the university administration in planning the physical development of the University of Georgia and its related agencies. It plans, coordinates, and implements construction projects both on and off campus and serves as liaison agent between the university and the Board of Regents Office of Facilities. More specifically, this office helps departments conceptualize proposed projects and assists in site determination, selection of architects and engineers, preparation of detailed project programs, coordination of preliminary and final plans, and development of master plans.
THE OFFICE OF DEVELOPMENT AND UNIVERSITY RELATIONS is responsible for the planning, coordination, and conduct of all programs involving alumni and friends of the university, including institutional public information and fund -raising. The Office of the Vice President embraces three functional areas. The Office of Alumni Relat ions works with the Alumni Society and school and college groups to conduct year-round programs involving alumni and friends throughout the United States and in several foreign countries. The Development Office is concerned with all aspects of fund-raising for the university and works closely with the various schools and colleges, their alumni constituents and friends. The Office of Public Information is the university's news and publicity outlet. Its news service and broadcast staff communicate items of interest to the commericial news media on the local, state, and national level to further public appreciation and understanding of the university and its goals, and the publication staff produces numerous publications in support of development, alumni relations , and student recruitment and admissions.
THE OFFICE OF INSTITUTIONAL RESEARCH AND PLANNING has as a primary responsibility the collection, organization, and analysis of data to serve all aspects of the operation and management of the university. In addition to student, faculty, staff and space utilization analyses, this unit conducts studies related to projected needs, program objectives, and efficiency and effectiveness in the use of institutional resources.
THE OFFICE OF INSTRUCTIONAL DEVELOPMENT, a unit of Academic Affairs, coordinates campus-wide services for instructional improvement and faculty development. The office is advised by the Instructional Advisory Committee, comprised of representatives appointed by the Vice President for Academic Affairs from all the university's colleges and schools and from services and student affairs. The OlD administers the university's Josiah Meigs Awards for Excellence in Teaching, the Lilly Teaching Fellows Program, the Sarah Moss Fellowships, the Senior Teaching Fellows Program, and the Teaching Improvement Program
148
(TIPS) for new faculty. This office provides instructional improvement grants to faculty wishing to develop new approaches to teaching and, through its Instructional Grants Programs, helps faculty locate and obtain external funds for instruction. It also provides consultation for faculty and department heads who seek assistance with any aspect of teaching, including computer-assisted instruction. Other university-wide activities, such as regular noon seminars, conferences, and various faculty development activities are listed in the quarterly OlD publication Teaching at UGA. Services, including a handbook and a special course on college teaching, are available to graduate teaching assistants.
The Instructional Resources Center (IRC), a major unit within the OlD, provides the following media equipment and materials for staff use: a media library of films, slides, and audio and video tapes, as well as audiovisual and television equipment for loan; black-and-white copy services; audio and videotape duplication; passport photos; photographic services; materials for instruction, including slide tape presentations, graphic aids, and videotape segments. lAC also operates a closed -circuit television system limited to the Journalism Building, with a color television studio and a color mobile production unit to provide the university with capabilities of recording events on campus and original programs for classroom use. Though lAC was created to serve the instructional needs of the university, services are available to all units on a charge basis.
The Bioscience Learning Center (BLC), also administered by the OlD, provides assistance at all levels of bioscience education in addition to supporting other instructional needs across campus. Located in the Biological Sciences Building, the center contains 22 audiovisual carrels and 24 Apple and IBM microcomputers.
THE OFFICE OF INTERNATIONAL DEVELOPMENT serves as a liaison between the University of Georgia and ministries and educational institutions in other countries and initiates and facilitates the preparation of memoranda of agreement between the university and the foreign agencies. It seeks ways to answer academic and technological requests of developing countries through the expertise available in the faculty, programs and services of the university. Services are delivered directly to potential recipients or through governmental agencies, consortia , visitors ' councils or private groups with United States government, private or international funding . Management is provided for domestic and/or international agencies who place foreign nationals in U.S. universities for short-term and degree-training programs. In addition, the office works with other units of the university to encourage and enhance an international perspective and the preparation of students to function in a global economy.
THE POULTRY DISEASE RESEARCH CENTER carries out basic and applied research programs on the diseases which are of economic importance to the poultry industry of Georgia. Diagnostic, laboratory, and consultative services are provided to individuals and groups in all phases of poultry production.
THE PSYCHOLOGY CLINIC is an independent community mental health facility operated by the Clinical Training Program of the Department of Psychology at the University of Georgia. The clinic seeks to provide specialized psychological services to the community and to serve as a training facility for the Clinical Psychology program. The Psychology Clinic offers a wide range of treatment and assessment services to meet the varied psychological needs of the people in the northeast Georgia area.
THE PUBLIC SAFETY DIVISION, through the Director of Public Safety, administers functional, educational, and community service programs which respond to hazards of life and property arising out of activities in the university community. Crime prevention and control, as well as traffic analyses, accident prevention, and pedestrian safety programs, are carried out by the University of Georgia Police Department headed by a chief of police and staffed by 50 sworn police officers with full peace officer authority. The UGA Police Department personnel conduct the Northeast Georgia Police Academy to provide basic, in-service, and advanced/specialized training for city, county, and state law enforcement agencies in twenty-four counties of northeast Georgia. Supervised internship opportunities tor Criminal Justice Studies majors are available.
The professional staff for Environmental Safety Services administers a comprehensive safety program designed to promote university operations within federal, state, and local laws and regulations related to
149
hazardous materials, chemical carcinogens, toxic hazards, ionizing and nonionizing sources of radiation, radioactive and nonradioactive wastes, pesticides, water and air quality, noise pollution, and food sanitation . A Hazardous Materials Treatment Facility is operated for proper disposal of hazardous materials generated principally in research activities . Many faculty as well as graduate students enroll each year in the Radiation Safety Course. The Occupational Health and Safety program is designed to reduce physical dangers resulting from occupational hazards and facility design through an accident prevention program. Additionally, the university's Fire Safety officer works with university officials to improve the status of fire safety in facilities owned by the University of Georgia. The program entails physical checks for defects as well as recommendations for corrective action. Supervised internships are available for Environmental Health majors.
THE DEAN RUSK CENTER FOR INTERNATIONAL AND COMPARATIVE LAW was founded in 1977 as part of the School of Law to improve the effectiveness of relations among citizens, private sector entities, and government at the local, state, federal, and international levels . Using advanced electronic, information-processing techniques, the center's professional staff and part-time researchers mobilize university, business, and governmental resources to develop theoretical and practical approaches to improve the efficiency of governance, trade, and investment. On occasion the center also helps implement the approaches by providing the private and public sectors with essential manpower and information. In t he past the Dean Rusk Center has developed several major initiatives for federal action concerning North American cooperation and overseas trade regulation and representation . It has also analyzed new approaches for expanding Georgia agricultural exports. The center publishes research reports, holds conferences, and sponsors research for Georgia citizens that cover fiscal and monetary policy, international arrangements, and domestic affairs.
THE SMALL BUSINESS DEVELOPMENT CENTER, established in 1977, is an innovative, university-based extension effort which provides counseling, management training, continuing education, procurement networking, applied and basic research, and advocacy to small businesses and prospective entrepreneurs. The SBDC offers its services through a network of 18 district and regional centers statewide.
The SBDC's major divisions include: 1) Center Operations - one-on-one counseling and learning programs utilizing seminar and workshop formats; 2) Center for Business and Economic Studies - basic and applied small business research; 3) Office of Minority Business Development - minority and disadvantaged business assistance; 4)1nternational Trade and Development Center - promotion of small business export programs; 5) Community Education - high school based education programs; 6) Management Information Systems - generation of reports based upon computerized data; and 7) Public Awareness - promotion of effective communication for the organization, its programs and clients.
THE SPEECH AND HEARING CLINIC, a service of the Department of Communication Sciences and Disorders, provides comprehensive evaluation and therapy for individuals of all ages with speech, language or hearing problems. Individuals may refer themselves or their children to the clinic or may be referred by other professionals such as physicians or teachers. The clinic also sponsors a support group for hearing-impaired university students.
TH E STATE BOTANICAL GARDEN OF GEORGIA comprises 293 acres that represent a broad cross-section of Georgia's Piedmont. It includes more than one mile of scenic river frontage along the Middle Oconee. A large flood plain gives way to slopes and upland forests of oak, hickory, pine, and beech ravines where wildflowers abound. Spring bulbs, azaleas, rhododendrons , roses, annuals, and perennials provide color from March to November. The garden is committed to research and public service but also serves as an outdoor laboratory for university classes in the plant sciences and environmental design. Short courses and other educational activities are conducted by staff members and other highly qualified instructors. The new Visitor Center/Conservatory Complex houses tropical and semi-tropical plants and is open to the public daily until 4:30 p.m. This building houses a gift shop, and the Garden Room, located in the lower level of the Conservatory Complex, serves lunch while the visitor enjoys a tropical environment and the sounds of a rippling stream winding through the lush indoor forest. This beautiful complex is available for
150
private and university events, dinners, and conferences and attracts local , regional, and international visitors. The Callaway Building is also available for rental.
The Garden is located at 2450 South Milledge Avenue, one mile south of the Athens South Bypass (U .S. 129, 441) . The grounds are open daily, free of charge at this time, from 8 a.m. to 5 p.m. October-April and from 8 a.m. to 8 p.m. May-September.
THE SURVEY RESEARCH CENTER serves the needs of academic, educational, governmental, and business clients in the area of information collection and analysis. The center's services include construction of an overall study design; creation and pretest of questionnaires; selection of an appropriate probability sample; collection of data through telephone interviews, personal interviews, or mail questionnaires; development of appropriate coding schemes; coding and cleaning of data; transfer of data into machine-readable form; execution of any desired analysis of the data; production of the report; and provision of follow-up consultation to interpret the report. These combined services are available tor the execution of complete studies; any single service can also be contracted. In addition, the center conducts the Georgia Poll, a regular omnibus survey of the state's population, in the fall and spring of each year. Individuals may subscribe to a particular poll by purchasing a question or questions of their choice. The responses to these questions, plus nine demographic variables, are returned to the subscriber in the form of frequencies in a codebook format and cross-tabulations.
THE UNIVERSITY COMPUTING AND NETWORKING SERVICES (UCNS) is responsible for the planning, management, and operation of the university's central -site computing facilities, campus-wide data commun ications and associated services. These facilities are used both on the university campus and at all schools in the University System.
The central -site computing facilities include the following complexes:
IBM Complex: Numerous language compilers, statistical analysis packages, and data management utilities for varying instruction, administrative, and research activities; the database for library automation; a student-oriented computing system geared to instruction; access to campus and world-wide electronic mail service.
CDC Complex: Software to support instruction and research for faculty and students throughout all schools in the University System and computer-based instructional units through PLATO.
DEC VAX Complex: Access to information on research activities of the Southeastern Universities Research Association and the National Science Foundation.
Supercomputer Complex: Advanced computational capability for use by University System schools and by technology-oriented industry users in the region.
In addition to hardware, UCNS provides a variety of services to computer users: (1) operation of several labs on campus with central-site access and microcomputer equipment; (2) the Help Desk as a central contact source for computing-related questions and problems; (3) specialized consulting support to both central-site and microcomputer users; (4) documentation services explaining access and use of the computer systems; and (5) introductory training services.
THE UNIVERSITY OF GEORGIA GERONTOLOGY CENTER was established in 1978 to promote and coordinate activities relating to aging throughout the university. The center's primary responsibilities are to coordinate graduate training and research to promote faculty development in Gerontology. Approximately 35 faculty members from 14 different academic departments on campus are associated with the Gerontology Center. The center staff administers a certificate program in Gerontology at the graduate level. The center provides leadership in the systematic growth of Gerontology on both regional and national bases.
THE UNIVERSITY OF GEORGIA LIBRARIES are composed of three major on-campus libraries - the Main Library, Science Library and Law Library, which is administered by the School of Law. There are several
151
small collections such as those at the Curriculum Materials Center (Education), the Georgia Center for Continuing Education Library, the Veterinary Medicine reading room, and various lab collections. The UGA Libraries' system also includes libraries at the experiment stations in Griffin and Tifton, and the marine stations at Sapelo and Skidaway.
The UGA Library is the largest university library in the state of Georgia. It is a member of the prestigious Association of Research Libraries consisting of the largest research libraries in North America, and ranks in the top twenty of these libraries.
The Libraries contain over 2.6 million books, serials, and documents, and many other items including manuscripts, photographs, drawings, music scores, audio/video materials, and newspapers. The map collection incorporates over 250,000 items and the microform collection numbers more than 3.5 million. The collections support the instructional, research, and public service activities of the university and are available to library users both on the campus and across the state.
An outstanding feature of the Main Library is the Hargren Rare Book and Manuscript Library, a repository of rare and priceless relics. Among the special collections are the works and memorabilia of Erskine Caldwell and Margaret Mitchell, the original Confederate Constitution, Confederate imprints, a notable Georgiana collection, many Southern historical manuscripts, and the sheet music of many well-known musicians.
The Richard B. Russell Memorial Library, an annex to the Main Library, houses the papers and memorabilia of the late Senator Russell, as well as the papers of former Secretary of State Dean Rusk, Senator Herman E. Talmadge, and many other elected officials and government appointees.
More than 387,000 volumes are housed in the University's Law Library. Its collection of British Commonwealth materials is considered one of the finest of its kind in the nation.
THE UNIVERSITY OF GEORGIA MUSEUM OF NATURAL HISTORY, which contains the most extensive collection of Georgia natural history artifacts and specimens, is one of the largest natural history museums in the Southeast. It ranks in the top 70 in the nation. The museum comprises seven extensive research collections: Anthropology (3 .5 million artifacts); Botany (185,000 plant specimens); Entomology (500,000 insects and the world's largest feather mite collection - over 6 million mites); Mycology (25,000 fungi); Geology (mineralogical, economic geology ore, fossil vertebrate and invertebrate fossil collections); Zoology (125,000 vertebrates, 5,000 invertebrates, 5,000 reef corals), and Zooarcheology (3,200 comparative reference skeletons).
THE UNIVERSITY OF GEORGIA PRESS was founded in 1938 as the publishing unit of the University of Georgia. Its primary mission is to support and enhance the university's place as a major research institution by publishing the best works of scholarship developed by its faculty and scholars and writers throughout the world . In the fifty years since its founding, the Press has published over a thousand titles. In recent years the Press has become national and international in scope and currently publishes between sixty and seventy new titles each year. The publishing program, while remaining primarily scholarly in nature, has expanded to include short fiction, creative non-fiction, novels (primarily in translation or as reprints), and poetry - as well as Georgiana and Southern regional works of more general utility to the citizenry of the state and region. Scholarly fields of particular distinction are literary studies, history, anthropology, folklore, Afro-American studies, the social sciences, and the natural sciences.
THE UNIVERSITY OF GEORGIA RESEARCH FOUNDATION, INC. administers the sponsored research program for the university. Most research proposals seeking external funding are submitted through the Research Foundation, and awards are made to the Foundation. In turn, the Foundation subcontracts with the university. The University of Georgia Research Foundation also provides assistance to faculty members through a variety of internal programs such as Faculty Research Grants, Foreign Travel Allocations, Book Subsidies, etc. The University of Georgia Research Foundation also serves as the university's invention administration organization.
152
THE VETERINARY MEDICAL DIAGNOSTIC ASSISTANCE LABORATORIES at Athens and Tifton handle over 90,000 specimen submissions each year. The laboratories are staffed and equipped to give diagnostic assistance to the Georgia Department of Agriculture, the livestock industry, and animal owners of Georgia through a policy of referral from local veterinarians.
THE VETERINARY MEDICAL EXPERIMENT STATION coordinates and conducts research on disease problems of food- and fiber-producing animals, including poultry, and companion animals. The research programs, which have applied, basic, and comparative medical orientation, are divided broadly into four main categories: infectious diseases, noninfectious diseases, diagnostic techniques, and therapeutic procedures. Research facilities are located within the College of Veterinary Medicine at Athens, in the Poultry Disease Research Center at Athens, and in the Veterinary Diagnostic Assistance Laboratories at Athens and Tifton. Opportunities for graduate training in the biomedical sciences are provided by the station's research programs.
THE CARL VINSON INSTITUTE OF GOVERNMENT is dedicated to improving the understanding, policy-making, and admirtistration of government, and particularly of state and local government in Georgia. To accomplish its purposes, the Vinson Institute conducts a variety of continuing education programs for state and local officials, engages in an extensive research and publications program, offers technical assistance to public officials, and provides educational opportunities for public school teachers and others to improve the level of understanding about the structure and processes of government at all levels. Its various services are conducted through four divisions: Governmental Training, Governmental Research and Services, Human Services, and Governmental Education. The institute also cooperates with the Department of Political Science in offering the Master of Public Administration degree.
153

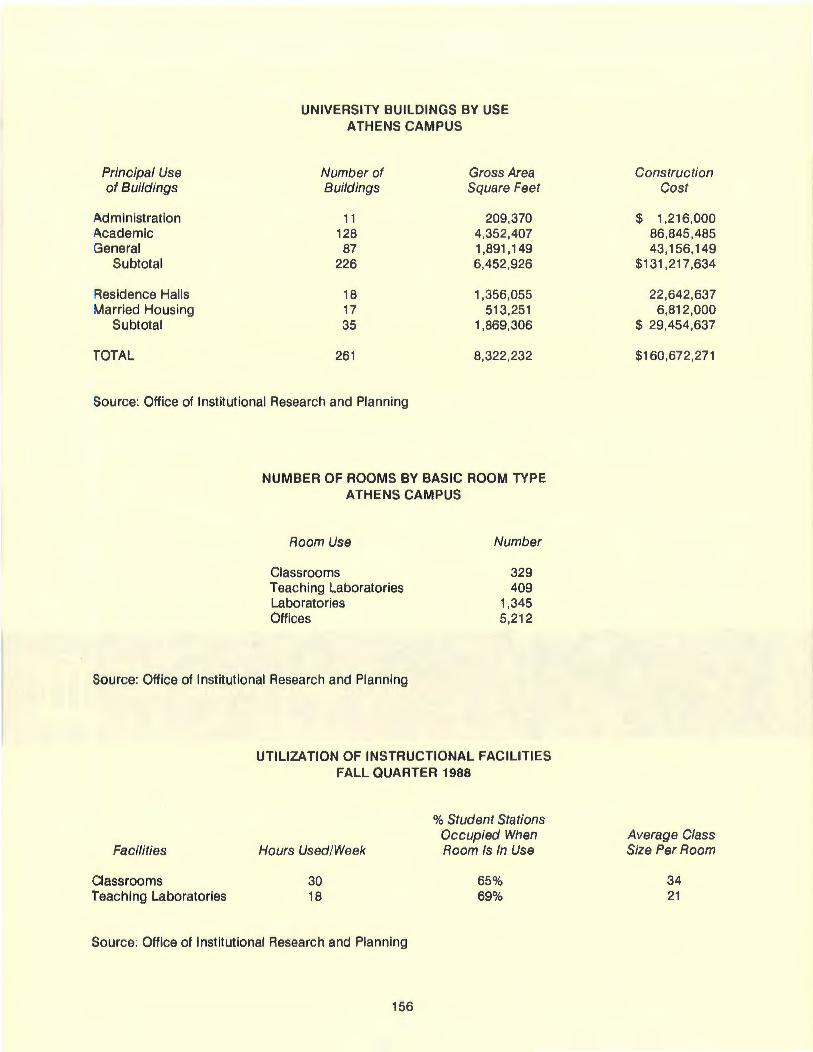
UNIVERSITY BUILDINGS BY USE ATHENS CAMPUS
Principal Use Number of Gross Area of Buildings Buildings Square Feet
Administration 11 209,370 Academic 128 4,352,407 General 87 1,891,149
Subtotal 226 6,452,926
Residence Halls 18 1,356,055 Married Housing 17 513,251
Subtotal 35 1,869,306
TOTAL 261 8,322,232
Source: Office of Institutional Research and Planning
NUMBER OF ROOMS BY BASIC ROOM TYPE ATHENS CAMPUS
Room Use
Classrooms Teaching Laboratories Laboratories Offices
Number
329 409
1,345 5,212
Source: Office of Institutional Research and Planning
Facilities
Classrooms Teaching Laboratories
UTILIZATION OF INSTRUCTIONAL FACILITIES FALL QUARTER 1988
Hours Used/Week
30 18
% Student Stations Occupied When Room Is In Use
65% 69%
Source: Office of Institutional Research and Planning
156
Construction Cost
$ 1 ,216,000 86,845,485 43,156,149
$131,217,634
22,642,637 6,812,000
$ 29,454,637
$160,672,271
Average Class Size Per Room
34 21
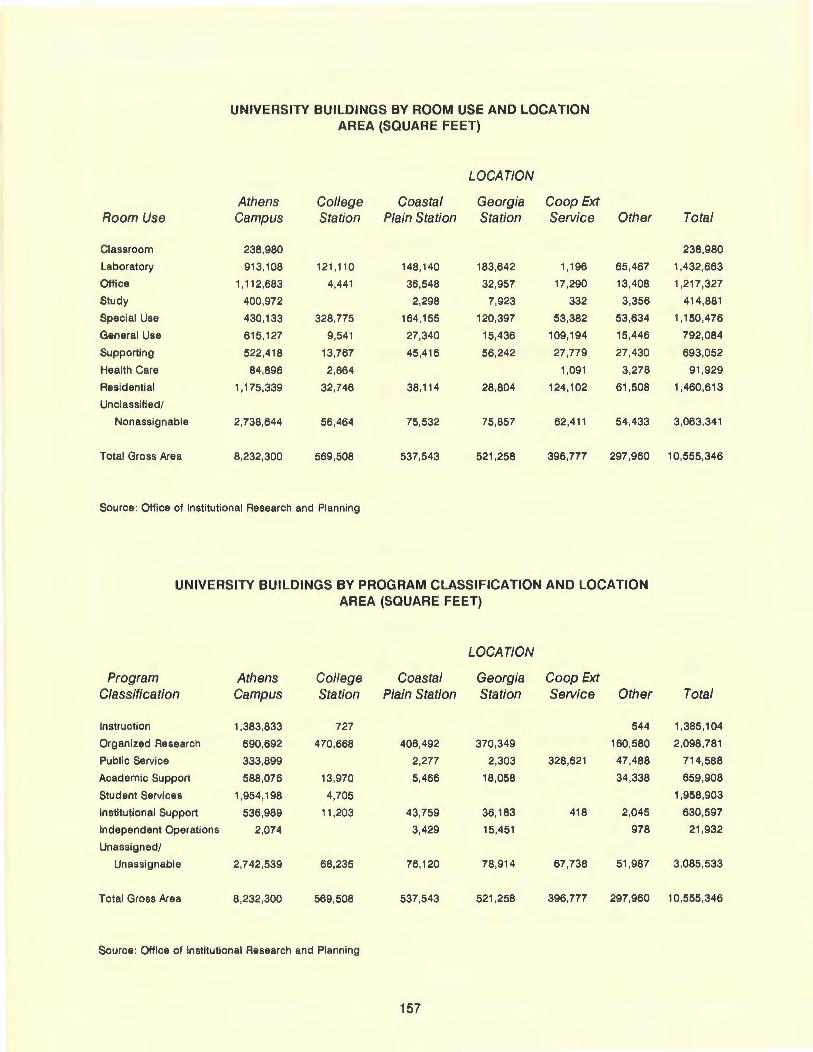
UNIVERSITY BUILDINGS BY ROOM USE AND LOCATION AREA (SQUARE FEET)
LOCATION
Athens College Coastal Georgia Coop Ext Room Use Campus Station Plain Station Station Service Other Total
Classroom 238,980 238,980
Laboratory 913,108 121 ,110 148,140 183,642 1,196 65,467 1,432,663
Office 1 '112,683 4,441 36,548 32,957 17,290 13,408 1,217,327
Study 400,972 2,298 7,923 332 3,356 414,881
Special Use 430,133 328,775 164,155 120,397 53,382 53,634 1,150,476
General Use 615,127 9,541 27,340 15,436 109,194 15,446 792,084
Supporting 522,418 13,767 45,416 56,242 27,779 27,430 693,052
Health Care 84,896 2,664 1,091 3,278 91,929
Residential 1,175,339 32,746 38,114 28,804 124,102 61,508 1,460,613
Unclassified/
Nonassignable 2,738,644 56,464 75,532 75,857 62,411 54,433 3,063,341
Total Gross Area 8,232,300 569,508 537,543 521,258 396,777 297,960 10,555,346
Source : Office of Institutional Research and Planning
UNIVERSITY BUILDINGS BY PROGRAM CLASSIFICATION AND LOCATION AREA (SQUARE FEET)
LOCATION
Program Athens College Coastal Georgia Coop Ext Classification Campus Station Plain Station Station Service Other Total
Instruction 1,383,833 727 544 1,385,104
Organized Research 690,692 470,668 406,492 370,349 160,580 2,098,781
Public Service 333,899 2,277 2,303 328,621 47,488 714,588
Academic Support 588,076 13,970 5,466 18,058 34,338 659,908
Student Services 1,954,198 4,705 1,958,903
Institutional Support 536,989 11 ,203 43,759 36,183 418 2,045 630,597
Independent Operations 2,074 3,429 15,451 978 21,932
Unassigned/
Unassignable 2,742,539 68,235 76,120 78,914 67,738 51 ,987 3,085,533
Total Gross Area 8,232,300 569,508 537,543 521,258 396,777 297,960 10,555,346
Source : Office of Institutional Research and Planning
157
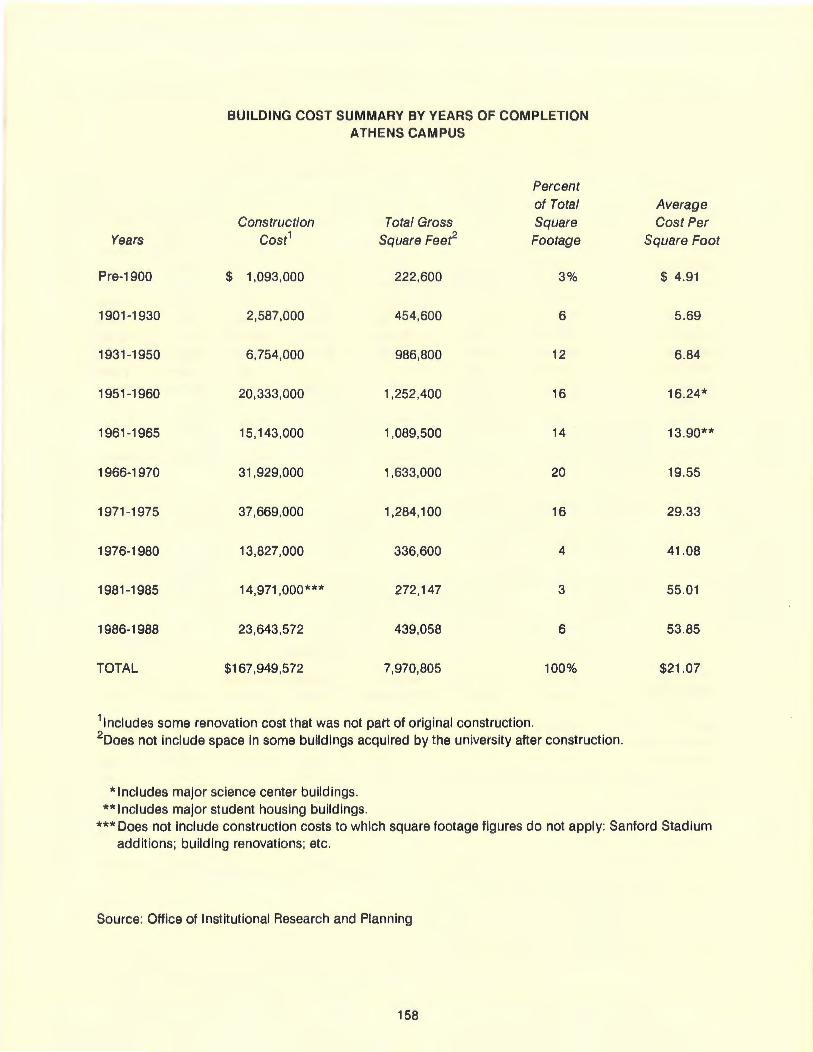
BUILDING COST SUMMARY BY YEARS OF COMPLETION ATH ENS CAMPUS
Percent of Total
Construction Total Gross Square Years Cost1 Square Feer2 Footage
Pre-1900 $ 1,093,000 222,600 3%
1901 -1930 2,587,000 454,600 6
1931 -1950 6,754,000 986,800 12
1951 -1960 20,333,000 1 ,252,400 16
1961 -1965 15,143,000 1,089,500 14
1966-1970 31 ,929,000 1,633,000 20
1971 -1975 37,669,000 1 ,284, 100 16
1976-1980 13,827,000 336,600 4
1981 -1985 14,971 ,000 *** 272,147 3
1986-1988 23,643,572 439,058 6
TOTAL $167,949,572 7,970,805 100%
11ncludes some renovation cost that was not part of original construction. 2Does not include space in some buildings acquired by the university after construction.
* Includes major science center buildings. ** Includes major student housing buildings.
Average Cost Per
Square Foot
$ 4.91
5.69
6.84
16.24*
13.90**
19.55
29.33
41.08
55 .01
53 .85
$21.07
*** Does not include construction costs to which square footage figures do not apply: Sanford Stadium additions; building renovations ; etc .
Source: Office of Institutional Research and Planning
158
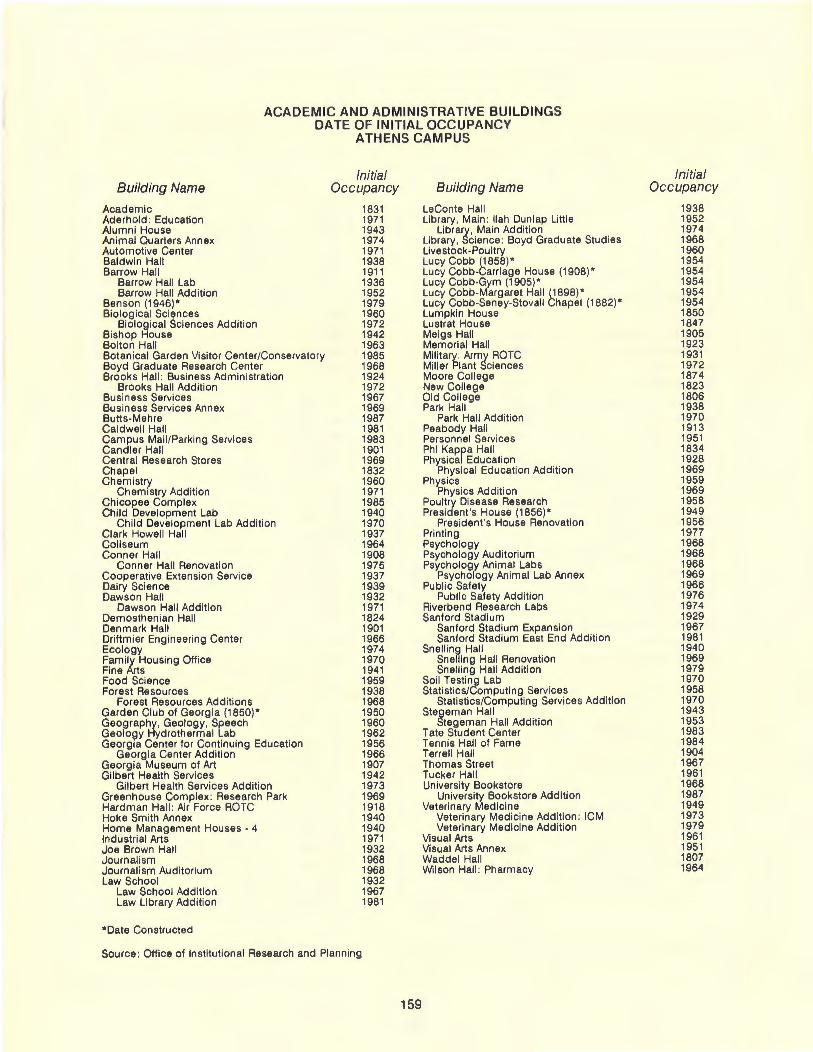
ACADEMIC AND ADMINISTRATIVE BUILDINGS DATE OF INITIAL OCCUPANCY
ATHENS CAMPUS
Building Name
Academic Aderhold : Education Alumni House Animal Quarters Annex Automotive Center Baldwin Hall Barrow Hall
Barrow Hall Lab Barrow Hall Addition
Benson (1946)* Biological Sciences
Biological Sciences Addition Bishop House Bolton Hall Botanical Garden Visitor Center/Conservatory Boyd Graduate Research Center Brooks Hall: Business Administration
Brooks Hall Addition Business Services Business Services Annex Butts-Mehre Caldwell Hall Campus Mail/Parking Services Candler Hall Central Research Stores Chapel Chemistry
Chemistry Addition Chicopee Complex Child Development Lab
Child Development Lab Addition Clark Howell Hall Coliseum Conner Hall
Conner Hall Renovation Cooperative Extension Service Dairy Science Dawson Hall
Dawson Hall Addition Demosthenian Hall Denmark Hall Driftmier Eng ineering Center Ecology Family Housing Office Fine Arts Food Science Forest Resources
Forest Resources Additions Garden Club of Georgia (1850) * Geography, Geology, Speech GeoiOIJY Hydrothermal Lab Georg1a Center for Continuing Education
Georgia Center Addition Georgia Museum of Art Gilbert Health Services
Gilbert Health Services Addition Greenhouse Complex : Research Park Hardman Hall : Air Force ROTC Hoke Smith Annex Home Management Houses - 4 Industrial Arts Joe Brown Hall Journalism Journalism Auditorium Law School
Law School Addition Law Library Addition
*Date Constructed
Initial Occupancy
1831 1971 1943 1974 1971 1938 1911 1936 1952 1979 1960 1972 1942 1963 1985 1968 1924 1972 1967 1969 1987 1981 1983 1901 1969 1832 1960 1971 1985 1940 1970 1937 1964 1908 1975 1937 1939 1932 1971 1824 1901 1966 1974 1970 1941 1959 1938 1968 1950 1960 1962 1956 1966 1907 1942 1973 1969 1918 1940 1940 1971 1932 1968 1968 1932 1967 1981
Source: Office of Institutional Research and Planning
159
Building Name
LeConte Hall Library , Main : llah Dunlap Littl e
Library , Main Addition Library, Science : Boyd Graduate Studies Livestock- Poultry Lucy Cobb (1858)* Lucy Cobb-Carriage House (1908) * Lucy Cobb-Gym (1905)* Lucy Cobb-Margaret Hall (1898)" Lucy Cobb-Seney-Stovall Chapel (1882) * Lumpkin House Lustral House Meigs Hall Memorial Hall Military : Army ROTC Miller Plant Sciences Moore College New College Old College Park Hall
Park Hall Addition Peabody Hall Personnel Services Phi Kappa Hall Physical Education
Physical Education Addition Physics
Physics Addition Poultry Disease Research President 's House (1856) *
President 's House Renovation Printing Psychology Psychology Auditorium Psychology Animal Labs
Psychology Animal Lab Annex Public Safety
Public Safety Addition Riverbend Research Labs Sanford Stadium
Sanford Stadium Expansion Sanford Stadium East End Addition
Snelling Hall Snelling Hall Renovation Snelling Hall Addition
Soil Testing Lab Statistics/Computing Services
Statistics/Computing Services Addition Stegeman Hall
Stegeman Hall Addition Tate Student Center Tennis Hall of Fame Terrell Hall Thomas Street Tucker Hall University Bookstore
University Bookstore Addition Veterinary Medicine
Veterinary Medicine Addition : ICM Veterinary Medicine Addition
Visual Arts Visual Arts Annex Waddel Hall Wilson Hall : Pharmacy
Initia l Occupancy
1938 1952 1974 1968 1960 1954 1954 1954 1954 1954 1850 1847 1905 1923 1931 1972 1874 1823 1806 1938 1970 1913 1951 1834 1928 1969 1959 1969 1958 1949 1956 1977 1968 1968 1968 1969 1966 1976 1974 1929 1967 1981 1940 1969 1979 1970 1958 1970 1943 1953 1983 1984 1904 1967 1961 1968 1987 1949 1973 1979 1961 1951 1807 1964
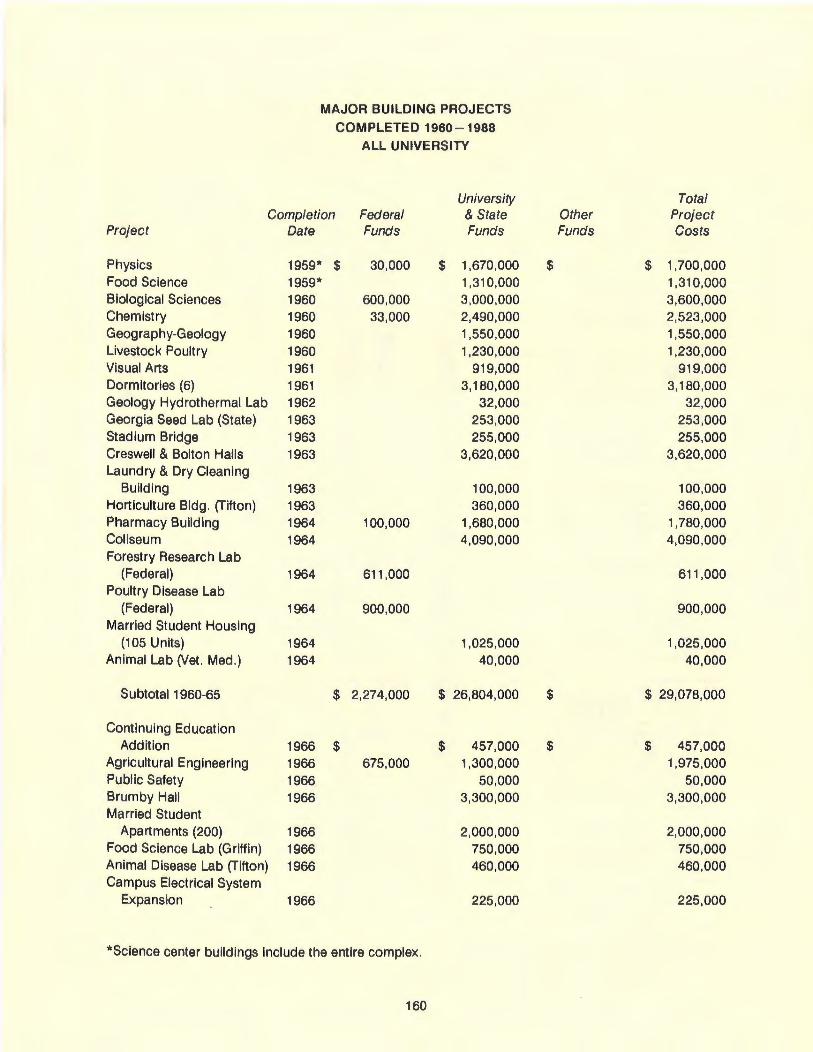
Project
Physics Food Science Biolog ical Sciences Chemistry Geography-Geology Livestock Poultry Visual Arts Dormitories (6) Geology Hydrothermal Lab Georgia Seed Lab (State) Stadium Bridge Creswell & Bolton Halls Laundry & Dry Cleaning
Build ing Horticulture Bldg. (f itton) Pharmacy Build ing Coliseum Forestry Research Lab
(Federal) Poultry Disease Lab
(Federal) Married Student Housing
(105 Units) An imal Lab (Vet. Med.)
Subtotal 1960-65
Continuing Education Add ition
Agricultural Engineering Public Safety Brumby Hall Married Student
Apartments (200) Food Science Lab (Griffin) Animal Disease Lab (fitton) Campus Electrical System
Expansion
MAJOR BUILDING PROJECTS COMPLETED 1960-1988
ALL UNIVERSITY
University Completion Federal & State
Date Funds Funds
1959* $ 30,000 $ 1,670,000 1959* 1,310,000 1960 600,000 3,000,000 1960 33,000 2,490,000 1960 1,550,000 1960 1,230,000 1961 919,000 1961 3,180,000 1962 32,000 1963 253,000 1963 255,000 1963 3,620,000
1963 100,000 1963 360,000 1964 100,000 1,680,000 1964 4,090,000
1964 611,000
1964 900,000
1964 1,025,000 1964 40,000
$ 2,274,000 $ 26,804,000
1966 $ $ 457,000 1966 675,000 1,300,000 1966 50,000 1966 3,300,000
1966 2,000,000 1966 750,000 1966 460 ,000
1966 225,000
*Science center buildings include the entire complex .
160
Total Other Project Funds Costs
$ $ 1,700,000 1,310,000 3,600,000 2,523,000 1,550,000 1,230,000
919,000 3,180,000
32,000 253,000 255 ,000
3,620,000
100,000 360,000
1,780,000 4,090,000
611 ,000
900,000
1,025,000 40,000
$ $ 29,078,000
$ $ 457,000 1,975,000
50,000 3,300,000
2,000,000 750,000 460,000
225,000
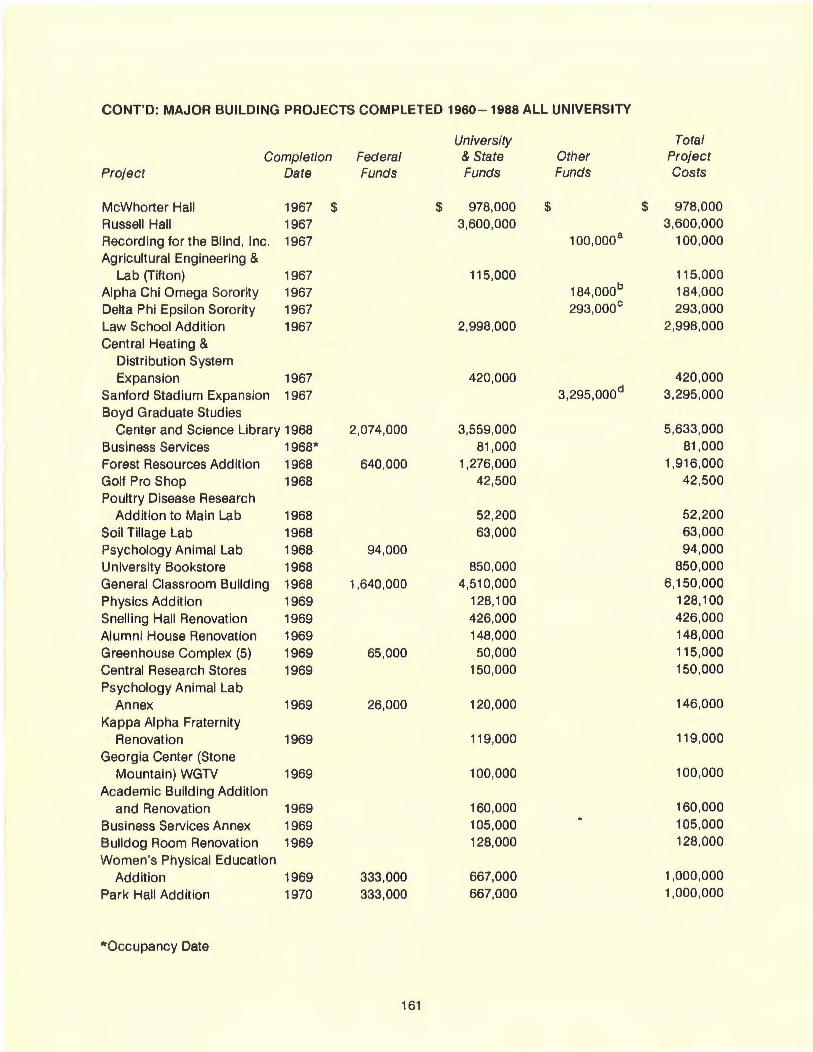
CONT'D: MAJOR BUILDING PROJECTS COMPLETED 1960-1988 ALL UNIVERSITY
University Total Completion Federal & State Other Project
Project Date Funds Funds Funds Costs
McWhorter Hall 1967 $ $ 978,000 $ $ 978,000 Russell Hall 1967 3,600,000 3,600,000 Recording for the Blind, Inc. 1967 100,000a 100,000 Agricultural Engineering &
Lab (Tifton) 1967 115,000 115,000 Alpha Chi Omega Sorority 1967 184,000b 184,000 Delta Phi Epsilon Sorority 1967 293,000° 293,000 Law School Addition 1967 2,998,000 2,998,000 Central Heating &
Distribution System Expansion 1967 420,000 420,000
Sanford Stadium Expansion 1967 d 3,295,000 3,295,000
Boyd Graduate Studies Center and Science Library 1968 2,074,000 3,559,000 5,633,000
Business Services 1968* 81,000 81,000 Forest Resources Addition 1968 640,000 1,276,000 1,916,000 Golf Pro Shop 1968 42,500 42,500 Poultry Disease Research
Addition to Main Lab 1968 52,200 52,200
Soil Tillage Lab 1968 63,000 63,000
Psychology Animal Lab 1968 94,000 94,000 University Bookstore 1968 850,000 850,000
General Classroom Building 1968 1,640,000 4,510,000 6,150,000
Physics Addition 1969 128,100 128,100
Snelling Hall Renovation 1969 426,000 426,000
Alumni House Renovation 1969 148,000 148,000
Greenhouse Complex (5) 1969 65,000 50,000 115,000
Central Research Stores 1969 150,000 150,000
Psychology Animal Lab Annex 1969 26,000 120,000 146,000
Kappa Alpha Fraternity Renovation 1969 119,000 119,000
Georgia Center (Stone Mountain) WGTV 1969 100,000 100,000
Academic Building Addition and Renovation 1969 160,000 160,000
Business Services Annex 1969 105,000 105,000
Bulldog Room Renovation 1969 128,000 128,000
Women's Physical Education Addition 1969 333,000 667,000 1,000,000
Park Hall Addition 1970 333,000 667,000 1,000,000
*Occupancy Date
161
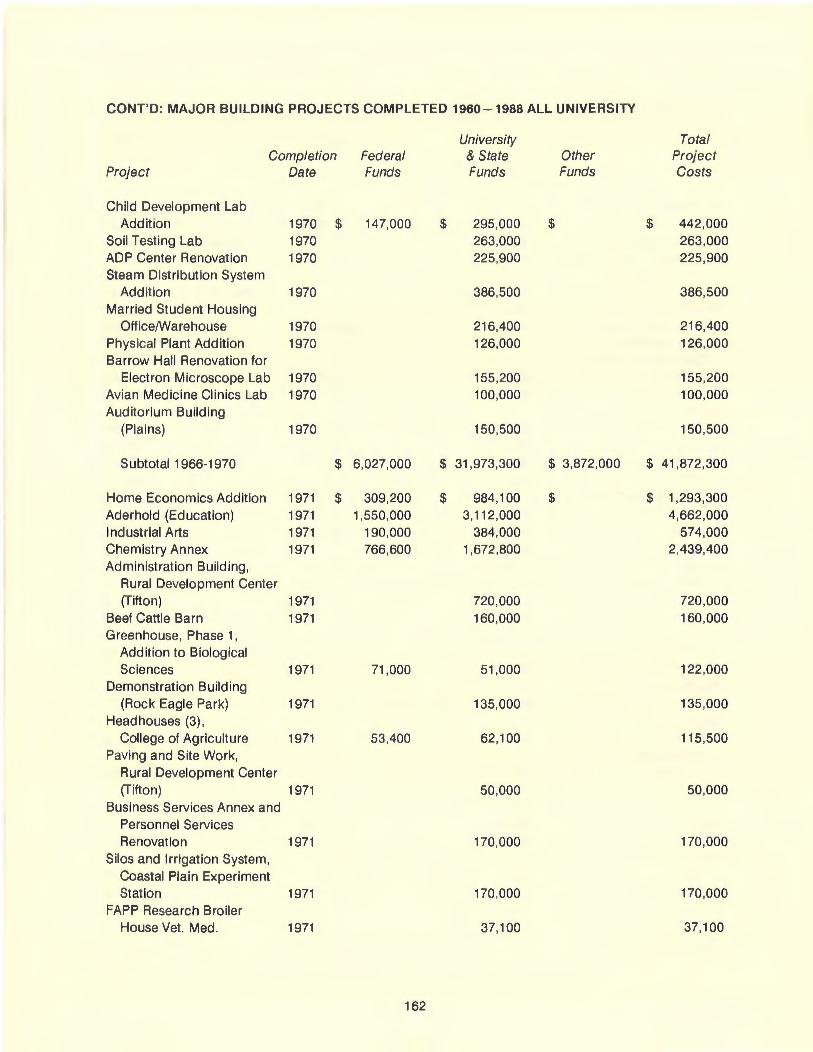
CONT'D: MAJOR BUILDING PROJECTS COMPLETED 1960-1988 ALL UNIVERSITY
University Total Completion Federal & State Other Project
Project Date Funds Funds Funds Costs
Child Development Lab Addition 1970 $ 147,000 $ 295,000 $ $ 442,000
Soil Testing Lab 1970 263,000 263,000 ADP Center Renovation 1970 225,900 225,900 Steam Distribution System
Addition 1970 386,500 386,500 Married Student Housing
Office/Warehouse 1970 216,400 216,400 Physical Plant Addition 1970 126,000 126,000 Barrow Hall Renovation for
Electron Microscope Lab 1970 155,200 155,200 Avian Medicine Clinics Lab 1970 100,000 100,000 Auditorium Building
(Plains) 1970 150,500 150,500
Subtotal 1966-1970 $ 6,027,000 $ 31,973,300 $ 3,872,000 $ 41,872,300
Home Economics Addition 1971 $ 309,200 $ 984,100 $ $ 1,293,300 Aderhold (Education) 1971 1,550,000 3,112,000 4,662,000 Industrial Arts 1971 190,000 384,000 574,000 Chemistry Annex 1971 766,600 1,672,800 2,439,400 Administration Building,
Rural Development Center (Tifton) 1971 720,000 720,000
Beef Cattle Barn 1971 160,000 160,000 Greenhouse, Phase 1,
Addition to Biological Sciences 1971 71 ,000 51,000 122,000
Demonstration Building (Rock Eagle Park) 1971 135,000 135,000
Headhouses (3}, College of Agriculture 1971 53,400 62 ,100 115,500
Paving and Site Work, Rural Development Center (Tifton) 1971 50,000 50,000
Business Services Annex and Personnel Services Renovation 1971 170,000 170,000
Silos and Irrigation System, Coastal Plain Experiment Station 1971 170,000 170,000
FAPP Research Broiler House Vet. Med. 1971 37,100 37,100
162
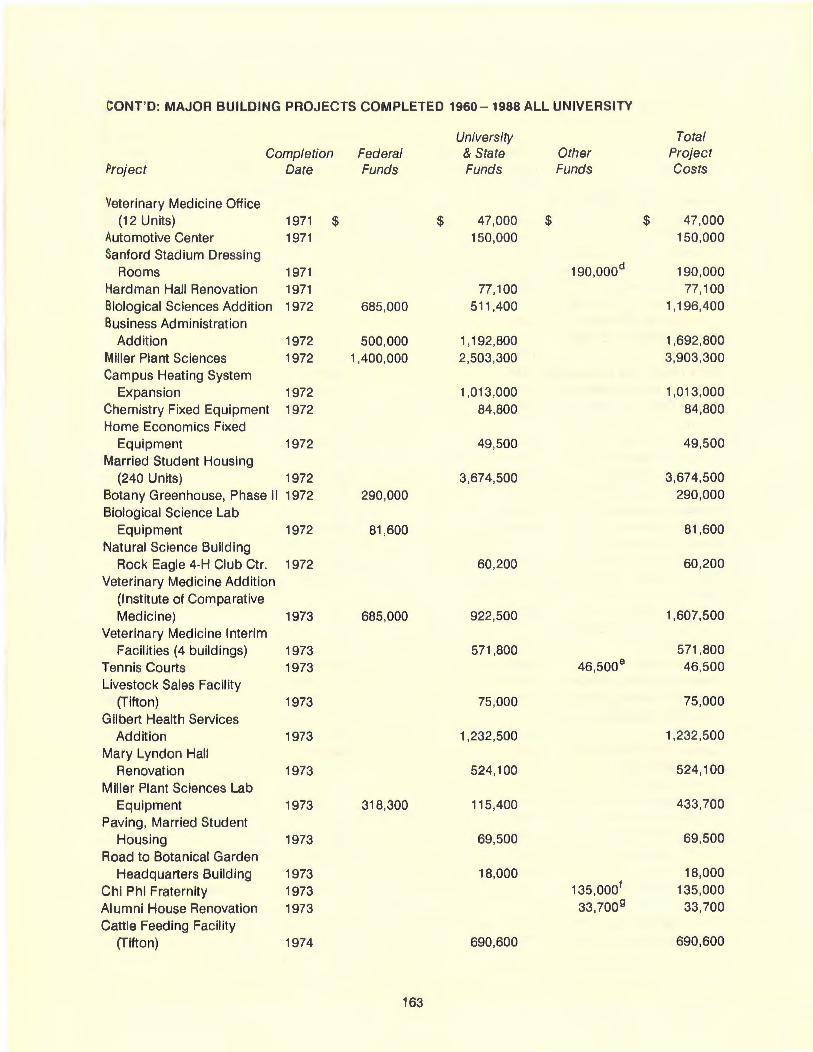
CONT'D: MAJOR BUILDING PROJECTS COMPLETED 1960-1988 ALL UNIVERSITY
University Total Completion Federal & State Other Project
Project Date Funds Funds Funds Costs
Veterinary Medicine Office (12 Units) 1971 $ $ 47,000 $ $ 47,000
Automotive Center 1971 150,000 150,000 Sanford Stadium Dressing
Rooms 1971 190,000d 190,000 Hardman Hall Renovation 1971 77,100 77,100 Biological Sciences Addition 1972 685,000 511,400 1,196,400 Business Administration
Addition 1972 500,000 1 '192,800 1,692,800 Miller Plant Sciences 1972 1 ,400,000 2,503,300 3,903,300 Campus Heating System
Expansion 1972 1 ,013,000 1 ,013,000 Chemistry Fixed Equipment 1972 84,800 84,800 Home Economics Fixed
Equipment 1972 49,500 49,500 Married Student Housing
(240 Units) 1972 3,674,500 3,674,500 Botany Greenhouse, Phase II 1972 290,000 290,000 Biological Science Lab
Equipment 1972 81,600 81,600 Natural Science Building
Rock Eagle 4-H Club Ctr. 1972 60,200 60,200 Veterinary Medicine Addition
(Institute of Comparative Medicine) 1973 685,000 922,500 1,607,500
Veterinary Medicine Interim Facilities (4 buildings) 1973 571,800 571,800
Tennis Courts 1973 46,500 8 46,500 Livestock Sales Facility
(Tifton) 1973 75,000 75,000 Gilbert Health Services
Addition 1973 1,232,500 1,232,500 Mary Lyndon Hall
Renovation 1973 524,100 524,100 Miller Plant Sciences Lab
Equipment 1973 318,300 115,400 433,700
Paving, Married Student Housing 1973 69,500 69,500
Road to Botanical Garden Headquarters Building 1973 18,000 18,000
Chi Phi Fraternity 1973 135,000f 135,000
Alumni House Renovation 1973 33,700 9 33,700
Cattle Feeding Facility (Tifton) 1974 690,600 690,600
163
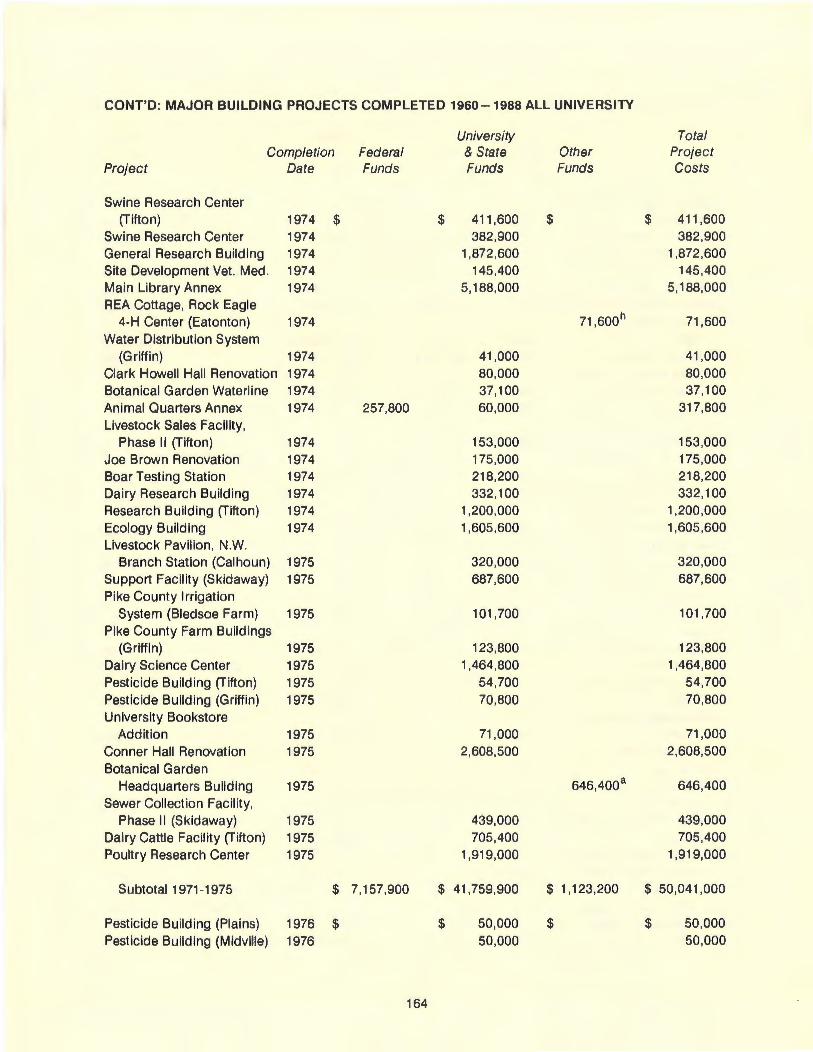
CONT'D: MAJOR BUILDING PROJECTS COMPLETED 1960-1988 ALL UNIVERSITY
University Total Completion Federal & State Other Project
Project Date Funds Funds Funds Costs
Swine Research Center (Tifton) 1974 $ $ 411,600 $ $ 411,600
Swine Research Center 1974 382,900 382,900 General Research Building 1974 1,872,600 1,872,600 Site Development Vet. Med. 1974 145,400 145,400 Main Library Annex 1974 5,188,000 5,188,000 REA Cottage, Rock Eagle
4-H Center (Eatonton) 1974 71 ,600h 71,600 Water Distribution System
(Griffin) 1974 41,000 41,000 Clark Howell Hall Renovation 1974 80,000 80,000 Botanical Garden Waterline 1974 37,100 37,100 Animal Quarters Annex 1974 257,800 60,000 317,800 Livestock Sales Facility,
Phase II (Tifton) 1974 153,000 153,000 Joe Brown Renovation 1974 175,000 175,000 Boar Testing Station 1974 218,200 218,200 Dairy Research Building 1974 332,100 332,100 Research Building (Tifton) 1974 1,200,000 1,200,000 Ecology Building 1974 1,605,600 1,605,600 Livestock Pavilion, N.W.
Branch Station (Calhoun) 1975 320,000 320,000 Support Facility (Skidaway) 1975 687,600 687,600 Pike County Irrigation
System (Bledsoe Farm) 1975 101,700 101,700 Pike County Farm Buildings
(Griffin) 1975 123,800 123,800 Dairy Science Center 1975 1,464,800 1,464,800 Pesticide Building (Tifton) 1975 54,700 54,700 Pesticide Building (Griffin) 1975 70,800 70,800 University Bookstore
Addition 1975 71,000 71,000 Conner Hall Renovation 1975 2,608,500 2,608,500 Botanical Garden
Headquarters Building 1975 646,400 8 646,400 Sewer Collection Facility,
Phase II (Skidaway) 1975 439,000 439,000 Dairy Cattle Facility (Tifton) 1975 705,400 705,400 Poultry Research Center 1975 1,919,000 1,919,000
Subtotal 1971-1975 $ 7,157,900 $ 41,759,900 $1,123,200 $ 50,041,000
Pesticide Building (Plains) 1976 $ $ 50,000 $ $ 50,000 Pesticide Building (Midville) 1976 50,000 50,000
164
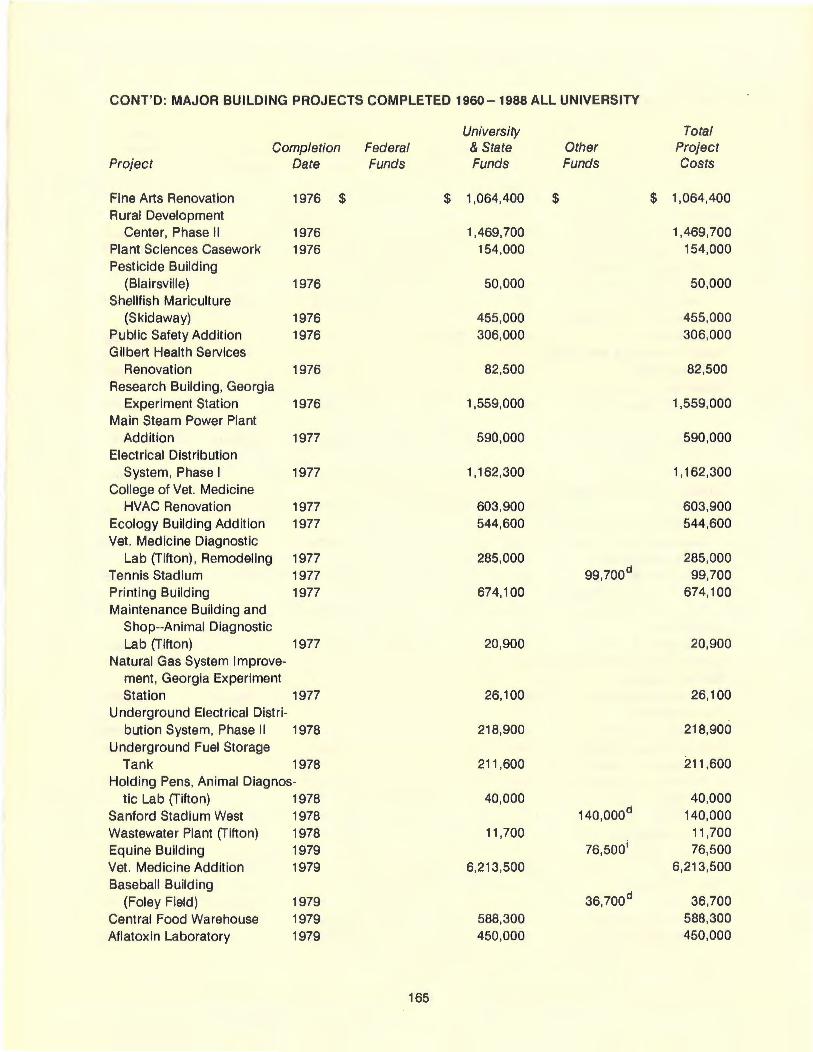
CONT'D: MAJOR BUILDING PROJECTS COMPLETED 1960 - 1988 ALL UNIVERSITY
University Total Completion Federal & State Other Project
Project Date Funds Funds Funds Costs
Fine Arts Renovation 1976 $ $ 1,064,400 $ $ 1,064,400 Rural Development
Center, Phase II 1976 1,469,700 1,469,700 Plant Sciences Casework 1976 154,000 154,000 Pesticide Building
(Blairsville) 1976 50,000 50,000 Shellfish Mariculture
(Skidaway) 1976 455,000 455,000 Public Safety Addition 1976 306,000 306,000 Gilbert Health Services
Renovation 1976 82,500 82,500 Research Building, Georgia
Experiment Station 1976 1,559,000 1,559,000 Main Steam Power Plant
Addition 1977 590,000 590,000 Electrical Distribution
System, Phase I 1977 1,162,300 1,162,300 College of Vet. Medicine
HVAC Renovation 1977 603,900 603,900 Ecology Building Addition 1977 544,600 544,600 Vet. Medicine Diagnostic
Lab (Tifton), Remodeling 1977 285,000 285,000 Tennis Stadium 1977 99,700d 99,700 Printing Building 1977 674,100 674,100 Maintenance Building and
Shop--Animal Diagnostic Lab (Tifton) 1977 20,900 20,900
Natural Gas System Improve-ment, Georgia Experiment Station 1977 26,100 26,100
Underground Electrical Distri-bution System, Phase II 1978 218,900 218,900
Underground Fuel Storage Tank 1978 211 ,600 211 ,600
Holding Pens. Animal Diagnos-tic Lab (Tifton) 1978 40,000 40,000
Sanford Stadium West 1978 140,000d 140,000 Wastewater Plant (Tifton) 1978 11,700 11,700 Equine Building 1979 76,500i 76,500 Vet. Medicine Addition 1979 6,213 ,500 6,213,500 Baseball Building
36,700d (Foley Field) 1979 36,700 Central Food Warehouse 1979 588,300 588,300 Aflatoxin Laboratory 1979 450,000 450,000
165
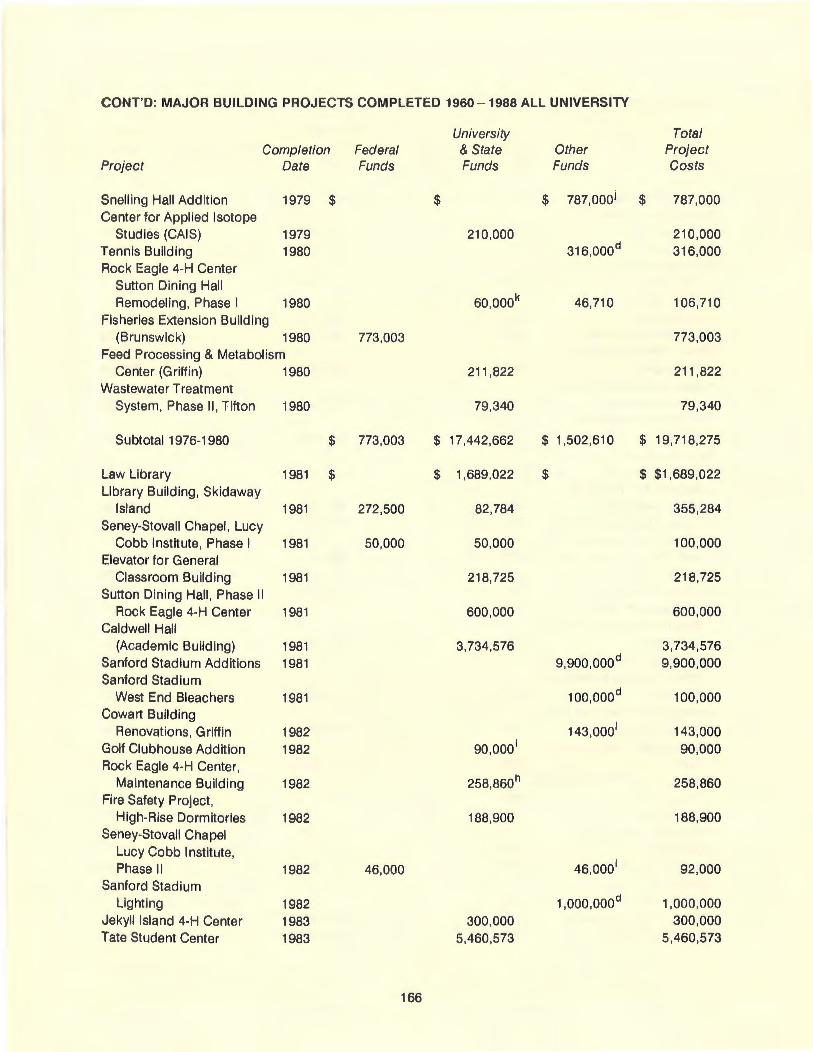
CONT'D: MAJOR BUILDING PROJECTS COMPLETED 1960-1988 ALL UNIVERSITY
University Tota l Completion Federal & State Other Project
Project Date Funds Funds Funds Costs
Snelling Hall Addit ion 1979 $ $ $ 787,oooi $ 787,000 Center for Applied Isotope
Studies (CAIS) 1979 210,000 210,000 Tennis Building 1980 316,000d 316,000 Rock Eagle 4-H Center
Sutton Dining Hall Remodeling, Phase I 1980 60,000k 46,710 106,710
Fisheries Extension Building (Brunswick) 1980 773,003 773,003
Feed Processing & Metabolism Center (Griffin) 1980 211,822 211,822
Wastewater Treatment System, Phase II, Tifton 1980 79,340 79,340
Subtotal 1976-1980 $ 773,003 $ 17,442,662 $ 1,502,610 $ 19,718,275
Law Library 1981 $ $ 1,689,022 $ $ $1 ,689,022 Library Building, Skidaway
Island 1981 272,500 82,784 355,284 Seney-Stovall Chapel, Lucy
Cobb Institute, Phase I 1981 50,000 50,000 100,000 Elevator for General
Classroom Building 1981 218,725 218,725 Sutton Dining Hall, Phase II
Rock Eagle 4-H Center 1981 600,000 600,000 Caldwell Hall
(Academic Building) 1981 3,734,576 3,734,576 Sanford Stadium Additions 1981 d 9,900,000 9,900,000 Sanford Stadium
West End Bleachers 1981 100,000d 100,000 Cowart Building
Renovations, Griffin 1982 143,0001 143,000 Golf Clubhouse Addition 1982 90,000i 90,000 Rock Eagle 4-H Center,
Maintenance Building 1982 258,860h 258,860 Fire Safety Project,
High-Rise Dormitories 1982 188,900 188,900 Seney-Stovall Chapel
Lucy Cobb Institute, Phase II 1982 46,000 46,000i 92,000
Sanford Stadium Lighting 1982 1,000,000 d 1,000,000
Jekyll Island 4-H Center 1983 300,000 300,000 Tate Student Center 1983 5,460,573 5,460,573
166
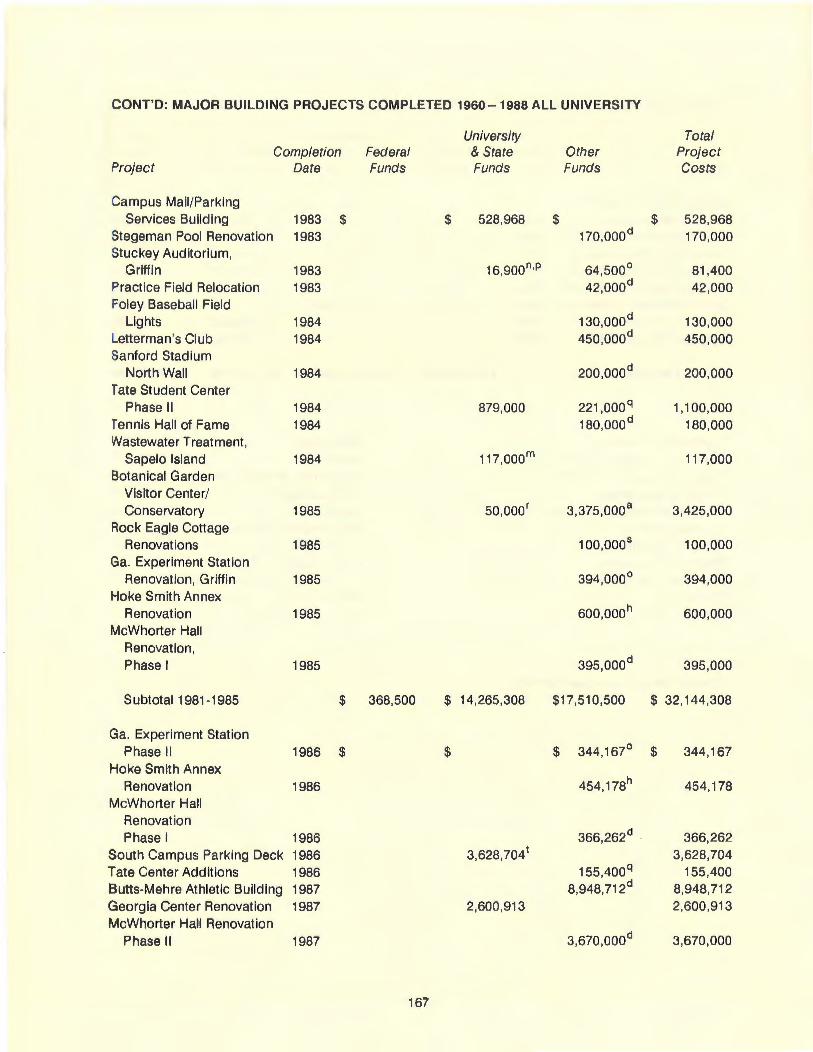
CONT'D: MAJOR BUILDING PROJECTS COMPLETED 1960 - 1988 ALL UNIVERSITY
University Total Completion Federal & State Other Project
Project Date Funds Funds Funds Costs
Campus Mail/Parking Services Building 1983 $ $ 528,968 $ $ 528,968
Stegeman Pool Renovation 1983 170,000d 170,000 Stuckey Auditorium,
Griffin 1983 16,900n,p 64,500° 81 ,400 Practice Field Relocation 1983 42,000d 42,000 Foley Baseball Field
Lights 1984 130,000d 130,000 Letterman's Club 1984 450,000d 450,000 Sanford Stadium
North Wall 1984 200 ,000d 200,000 Tate Student Center
Phase II 1984 879,000 221 .oooq 1 '1 00,000 Tennis Hall of Fame 1984 180,000d 180,000 Wastewater Treatment,
Sapelo Island 1984 117,000m 117,000 Botanical Garden
Visitor Center/ Conservatory 1985 50,000r 3,375,000a 3,425,000
Rock Eagle Cottage Renovations 1985 100,000s 100,000
Ga. Experiment Station Renovation, Griffin 1985 394,000° 394,000
Hoke Smith Annex Renovation 1985 600,000h 600,000
McWhorter Hall Renovation, Phase I 1985 395,000d 395,000
Subtotal 1981 -1985 $ 368,500 $ 14,265,308 $17,510,500 $ 32,144,308
Ga. Experiment Station Phase II 1986 $ $ $ 344,167° $ 344,167
Hoke Smith Annex Renovation 1986 454, 178h 454,178
McWhorter Hall Renovation Phase I 1986 366,262d 366,262
South Campus Parking Deck 1986 3,628,7041 3,628,704 Tate Center Additions 1986 155,400q 155,400 Butts-Mehre Athletic Building 1987 8,948,712 d 8,948,712 Georgia Center Renovation 1987 2,600,913 2,600,913 McWhorter Hall Renovation
Phase II 1987 3,670,000 d 3,670,000
167
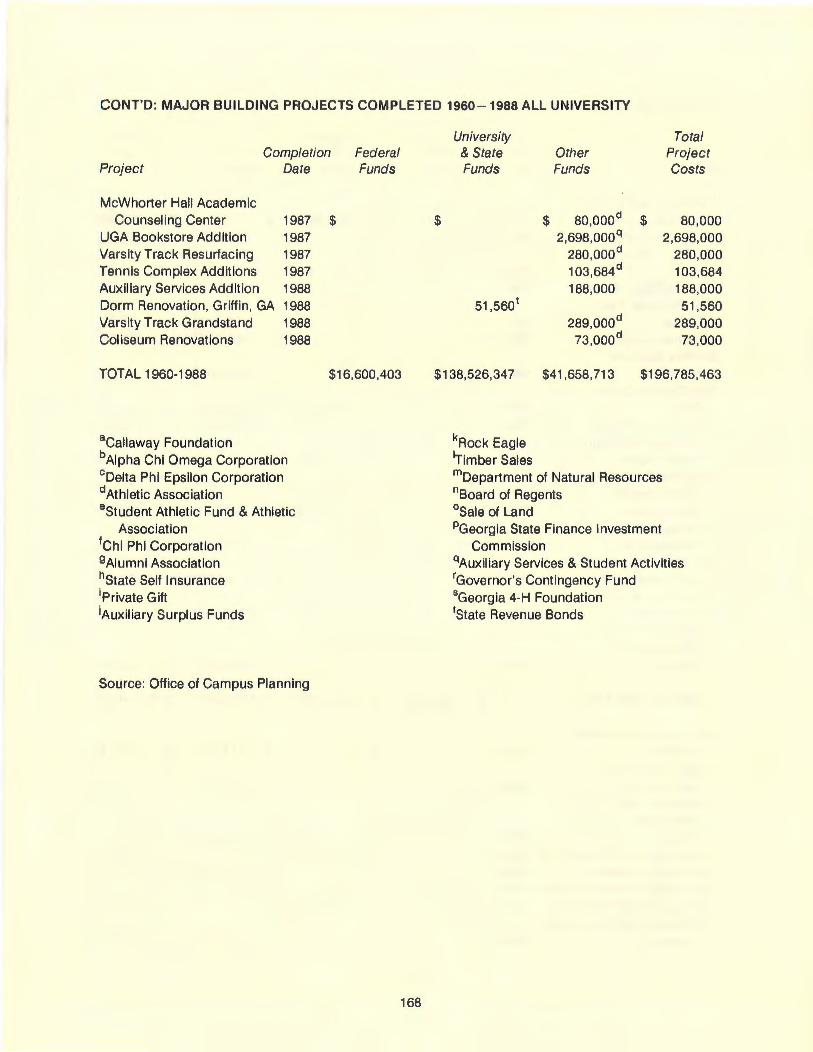
CONT'D: MAJOR BUILDING PROJECTS COMPLETED 1960-1988 ALL UNIVERSITY
Completion Federal Project Date
McWhorter Hall Academic Counseling Center 1987
UGA Bookstore Addition 1987 Varsity Track Resurfacing 1987 Tennis Complex Additions 1987 Auxiliary Services Addition 1988 Dorm Renovation , Griffin, GA 1988 Varsity Track Grandstand 1988 Coliseum Renovations 1988
TOTAL 1960-1988
aCallaway Foundation bAipha Chi Omega Corporation 0 Delta Phi Epsilon Corporation d Athletic Association 8 Student Athletic Fund & Athletic
Association 1Chi Phi Corporation 9Aiumni Association hstate Self Insurance 1Private Gift iAuxiliary Surplus Funds
Source: Office of Campus Planning
Funds
$
$16,600,403
168
University Total & State Other Project Funds Funds Costs
$ $ 80,000d $ 80,000 2,698,000q 2,698,000
280,000d 280,000 103,684d 103,684 188,000 188,000
51,560 1 51,560 289,000d 289,000
73,000d 73,000
$138,526,347 $41 ,658,713 $196,785,463
kRock Eagle 1Timber Sales mDepartment of Natural Resources 0 Board of Regents 0 Sale of Land PGeorgia State Finance Investment
Commission qAuxiliary Services & Student Activities rGovernor's Contingency Fund sGeorgia 4-H Foundation 1State Revenue Bonds
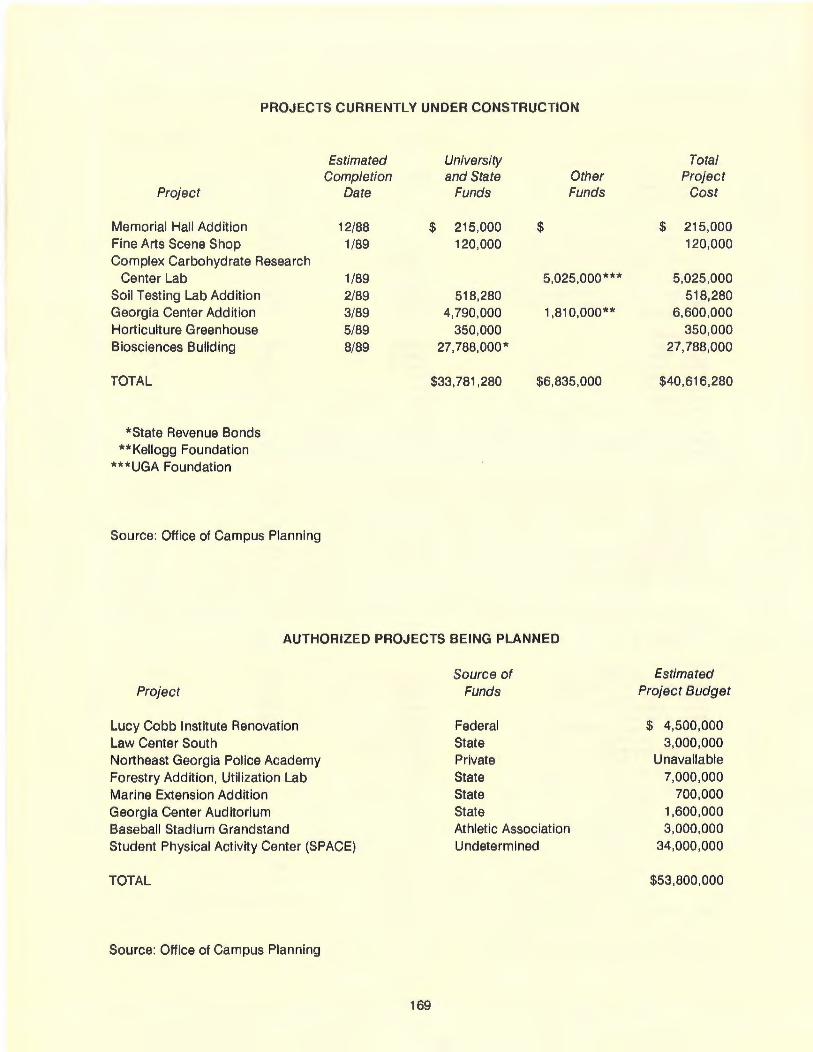
PROJECTS CURRENTLY UNDER CONSTRUCTION
Project
Memorial Hall Add ition Fine Arts Scene Shop Complex Carbohydrate Research
Center Lab Soil Testing Lab Addition Georgia Center Addition Horticulture Greenhouse Biosciences Building
TOTAL
*State Revenue Bonds **Kellogg Foundation
***UGA Foundation
Source: Office of Campus Planning
Estimated Completion
Date
12/88 1/89
1/89 2/89 3/89 5/89 8/89
University and State Other
Funds Funds
$ 215,000 $ 120,000
5,025,000*** 518,280
4,790,000 1 ,81 0,000** 350,000
27,788,000*
$33,781,280 $6,835,000
AUTHORIZED PROJECTS BEING PLANNED
Project
Lucy Cobb Institute Renovation Law Center South Northeast Georgia Police Academy Forestry Addit ion, Utilization Lab Marine Extension Addit ion Georgia Center Auditorium Baseball Stadium Grandstand Student Physical Activity Center (SPACE)
TOTAL
Source: Office of Campus Planning
169
Source of Funds
Federal State Private State State State Athletic Association Undetermined
Total Project
Cost
$ 215,000 120,000
5,025,000 518,280
6,600,000 350,000
27,788,000
$40,616,280
Estimated Project Budget
$ 4,500,000 3,000,000
Unavailable 7,000,000
700,000 1,600,000 3,000,000
34,000,000
$53,800,000
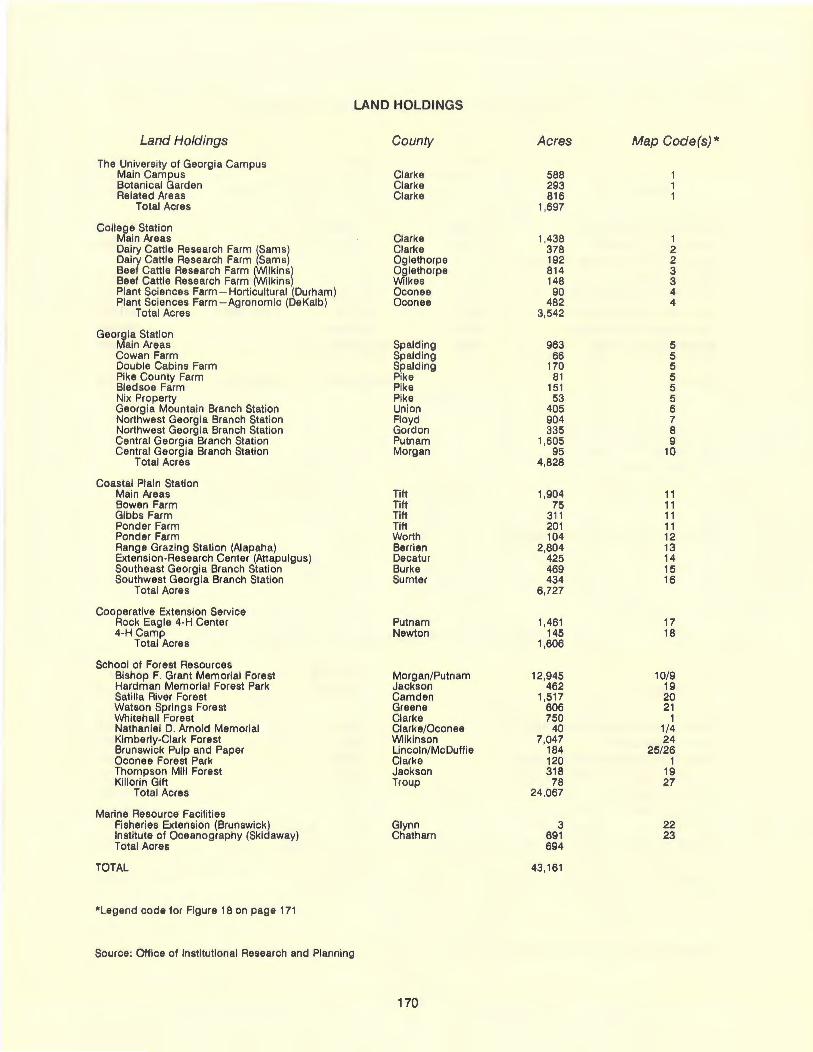
LAND HOLDINGS
Land Holdings County Acres Map Code(s) *
The University of Georgia Campus Main Campus Clarke 588 Botan ical Garden Clarke 293 Related Areas Clarke 816
Total Acres 1,697
College Station Main Areas Clarke 1,438 1 Dairy Cattle Research Farm !Samsl Clarke 378 2 Dairy Cattle Research Farm Sams Oglethorpe 192 2 Beef Cattle Research Farm ~lkinsl ~lethorpe 814 3 Beef Cattle Research Farm tlkins kes 148 3 Plant Sciences Farm - Horticultural (Durham) Oconee 90 4 Plant Sciences Farm -Agronomic (DeKalb) Oconee 482 4
Total Acres 3,542
Geo~ia Station ain Areas Spalding 963 5
Cowan Farm Spalding 66 5 Double Cabins Farm Spalding 170 5 Pike County Farm Pike 81 5 Bledsoe Farm Pike 151 5 Nix Property Pike 53 5 Georgia Mountain Branch Station Union 405 6 Northwest Georgia Branch Station Floyd 904 7 Northwest Georgia Branch Station Gordon 335 8 Central Georg ia Branch Station Putnam 1,605 9 Central Georgia Branch Station Morgan 95 10
Total Acres 4,828
Coastal Plain Station Main Areas Tift 1,904 11 Bowen Farm Tift 75 11 Gibbs Farm Tift 311 11 Ponder Farm Tift 201 11 Ponder Farm Worth 104 12 Range Grazing Station (Alapaha) Berrien 2,804 13 Extension-Research Center (Attapu lgus) Decatur 425 14 Southeast Georgia Branch Station Burke 469 15 Southwest Georgia Branch Station Sumter 434 16
Total Acres 6,727
Coo~erative Extension Service ock Eagle 4-H Center Putnam 1,461 17
4-H Camp Newton 145 18 Total Acres 1,606
School of Forest Resources Bishop F. Grant Memorial Forest Morgan/Putnam 12,945 10/9 Hardman Memorial Forest Park Jackson 462 19 Satilla River Forest Camden 1,517 20 Watson Springs Forest Greene 606 21 Whitehall Forest Clarke 750 1 Nathaniel D. Arnold Memorial Clarke/Oconee 40 1/4 Kimberly-Clark Forest Wilkinson 7,047 24 Brunswick Pu lp and Paper Lincoln/McDuffie 184 25/26 Oconee Forest Park Clarke 120 1 Thompson Mill Forest Jackson 318 19 Killorin Gift Troup 78 27
Total Acres 24,067
Marine Resource Faci lities Fisheries Extension (Brunswick) Glynn 3 22 Institute of Oceanography (Skidaway) Chatham 691 23 Total Acres 694
TOTAL 43,161
*Legend code for Figure 18 on page 171
Source: Office of Institutional Research and Planning
170
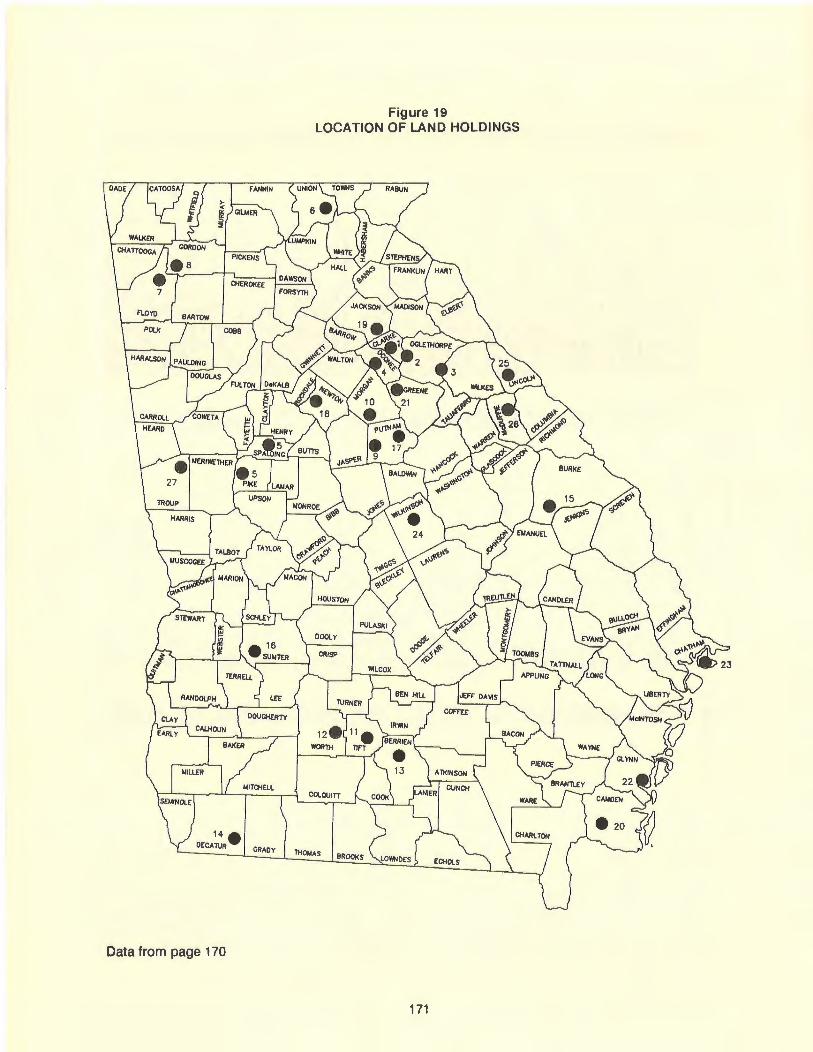
Figure 19 LOCATION OF LAND HOLDINGS
14. D£CATUR CRADY
Data from page 170
171
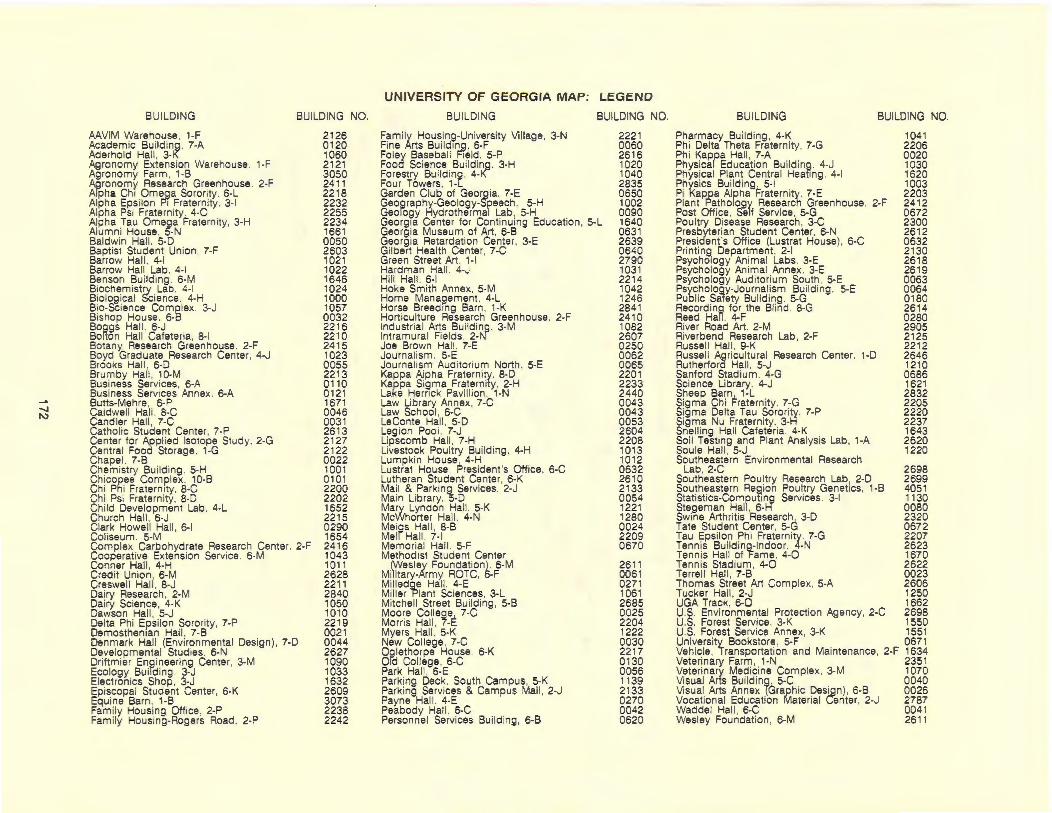
....... 1\)
BUILDING
AAVIM Warehouse , 1-F
BUILDING NO.
Academic Build ing . 7-A Aderhold Hall , 3-K Agronomy Extension Warehouse . 1-F Agronomy Farm , 1-B Aoronomy Research Greenhouse. 2-F Arpha Ch1 Omega Sorority. 6-L Alpha Epsilon Pi Fraternity. 3-1 Alpha Psi Fratern ity. 4-0 Alpha Tau Omega f=raternity , 3-H Alumni House, 5-N Baldwin Hall. 5-D Baptist Student Union , 7-F Barrow Hall. 4-1 Barrow Hall Lab, 4-1 Benson Build ing. 6-M Biochemistry Lab. 4-1 Biolog ical Science . 4-H Bio-Science Complex. 3-J Bishop House. 6-8 Boggs Hall. 6-J Bolton Hall Cafeteria , 8-1 Botany Research Greenhouse . 2-F Boyd Graduate Research Center, 4-J Brooks Hall . 6-D Brumby Hall , 10-M Business Services , 6-A Business Services Annex . 6-A Butts-Mehre, 6-P Caldwell Hall . 8-C Cand ler Hall , 7-C Catholic Student Center , 7-P Center for Appl ied Isotope Study, 2-G Central Food Storage. 1-G Chapel. 7-B Chemistry Building . 5-H Ch icopee Complex. 10-B Chi Phi Fraternity. 8-C Ch i Psi Fraternity, 8-D Ch ild Development Lab , 4-L Church Hall , 6-J Clark Howel l Hall, 6-1 Coliseum . 5-M Complex Carbohydrate Research Center. 2-F Cooperat ive Extension Service. 6-M Conner Hall , 4-H Credit Union . 6-M Creswell Half, 8-J Dairy Research , 2-M Dairy Science, 4-K Dawson Hall , 5-J Delta Phi Epsilon Sorority, 7-P Demostheman Hall, 7-B Denmark Hall (Enwonmental Design), 7-D Developmental Studies. 6-N Drittmier Engineering Center. 3-M Ecology Buifd ing. ~-J Electron ics Shop , 3-J Episcopal Student Center , 6-K Equine Barn , 1-B Fami ly Housing Office, 2-P Fami ly Housing-Rogers Road , 2-P
2126 0120 1060 2121 3050 2411 2218 2232 2255 2234 1661 0050 2603 1021 1022 1646 1024 1000 1057 0032 2216 2210 2415 1023 0055 2213 0110 0121 1671 0046 0031 2613 2127 2122 0022 1001 0101 2200 2202 1652 2215 0290 1654 2416 1043 1011 2628 2211 2840 1050 1010 2219 0021 0044 2627 1090 1033 1632 2609 3073 2238 2242
UNIVERSITY OF GEORGIA MAP: LEGEND
BU ILDING
Family Housing-University Village, 3-N Fine Arts Building . 6-F Foley Baseball Field. 5-P Food Science Building. 3-H Forestry Bu ilding . 4-1\ Four Towers , 1-[
BUILDING NO.
2221 0060 2616 1020 1040 2835 0650 1002
Garden Club of Georgia. 7-E Geography-Geology-Speech , 5-H Geology Hydrothermal Lab, 5-H Georg1a Center for Continuing Education , 5-L Georgia Museum of Art , 6-B Georg ia Retardation Center. 3-E
0090 1640 0631
Gi lbert Health Center. 7-C Green Street Art , 1-1 Hardman Hal l. 4-J Hill Hall. 6-1 Hoke Smith Annex , 5-M Home Management. 4-L Horse Breeding Barn , 1-K Horticulture Research Greenhouse. 2-F Industrial Arts Bu ilding . 3-M Intramural Fields. 2-~ Joe Brown Hall. 7-E Journalism. 5-E Journalism Auditorium North . 5-E Kappa Alpha Fraternity. 8-D Kappa Sigma Fraternity. 2-H Lake Hernck Pavil lion , 1-N Law Library Annex , 7-C Law School , 6-C LeConte Hall , 5-D Leg ion Pool, 7-J Lipscomb Hall , 7-H Livestock Pou ltry Bu ilding . 4-H Lumpkin House 4-H Lustrat House. President's Office , 6-C Lutheran Student Center , 6-K Mail & Parking Services. 2-J Main Library. 5-D Mary Lyndon Hall. 5-K McWhorter Hal l. 4-N Meigs Hal l, 8-B Mell Hall. 7-1 Memorial Hall. 5-F Methodist Student Center
(Wesley Foundation). 6-M Military-Army ROTC, 15-F Milledge Hall. 4-E Miller Plant Sciences, 3-L Mitchel l Street Building , 5-B Moore Col lege,. 7-C Morris Hal l, 7-t: Myers Hall. 5-K New Co llege , 7-C Og lethorpe House. 6-K Old College , 6-C Park Hall , 6-E Parking Deck. South Campus, 5-K Parking Services & Campus Mail , 2-J Payne Hall. 4-E Peabody Hall , 6-C Personnel Services Building, 6-B
2639 0640 2790 1031 2214 1042 1246 2841 2410 1082 2607 0250 0062 0065 2201 2233 2440 0043 0043 0053 2604 2208 1013 1012 0632 2610 2133 0054 1221 1280 0024 2209 0670
2611 0061 0271 1061 2685 0025 2204 1222 0030 2217 0130 0056 1139 2133 0270 0042 0620
BUILDING BUILDING NO.
Pharmacy Building , 4-K Phi Delta Theta Fraternity, 7-G Phi Kappa Hall , 7-A Physical Education Build ing. 4-J Physical Plant Central Heating . 4-1 Physics Building. 5-1 Pi Kappa Alpha f=raternity. 7-E Plant Pathology Research Greenhouse. 2-F Post Office, Self Service, 5-G Poultry Disease Research , 3-C Presbyterian Student Center, 6-N President's Office (Lustra! House), 6-C Printing Department, 2-1 Psychology Animal Labs. 3-E Psychology Animal Annex. 3-E Psychology Auditorium South , 5-E Psychology-Journalism Bu ilding , 5-E Public Sarety Bu ilding . 5-G Recording for the Blind , 8-G Reed Han . 4-F River Road Art. 2-M Riverbend Research Lab, 2-F Russell Hall , 9-K Russell Aqricu ltural Research Center . 1-D Rutherford Hall, 5-J Sanford Stadium . 4-G Science Library, 4-J Sheep Barn 1-L Sigma Chi Fraternity. 7-G Sigma De lta Tau Sorority, 7-P Sigma Nu Fratern ity, 3-H Snelling Hall Cafeteria. 4-K Soil Testing and Plant Analysis Lab, 1-A Sou le Hall , 5-J Southeastern Environmental Research
1041 2206 0020 1030 1620 1003 2203 2412 0672 2300 2612 0632 2130 2618 2619 0063 0064 0180 2614 0280 2905 2125 2212 2646 1210 0686 1621 2832 2205 2220 2237 1643 2620 1220
Lab, 2-C 2698 Southeastern Poultry Research Lab, 2-D 2699 Southeastern Region Poultry Genet1cs. 1-B 4051 Statistics-Computing Services. 3-1 1130 Stegeman HaiL 6-K 0080 Swine Arthritis Research,.,. 3-D 2320 Tate Student Center, 5-u 0672 Tau Epsilon Phi Fraternity . 7-G 2207 Tenn is Build ing-Indoor, 4-N 2623 Tennis Hall of fame. 4-0 1670 Tennis Stadium , 4-0 2622 Terrell Hall , 7-B 0023 Thomas Street Art Complex, 5-A 2606 Tucker Hall , 2-J 1250 UGA Track, 6-0 1662 U.S. Environmental Protection Agency, 2-C 2698 U.S. Forest Service , 3-K 1550 U.S. Forest Service Annex , 3-K 1551 Universit}' Bookstore. 5-F 0671 Vehicle , Transportation and Maintenance , 2-F 1634 Veterinary Farm , 1-N 2351 Veterinary Medicine Complex, 3-M 1070 Visual Arts Building . 5-C 0040 Visual Arts Annex (Graphic Design ), 6-B 0026 Vocational Education Material Center, 2-J 2787 Waddel Hall , 6-C 0041 Wesley Foundation , 6-M 261 1
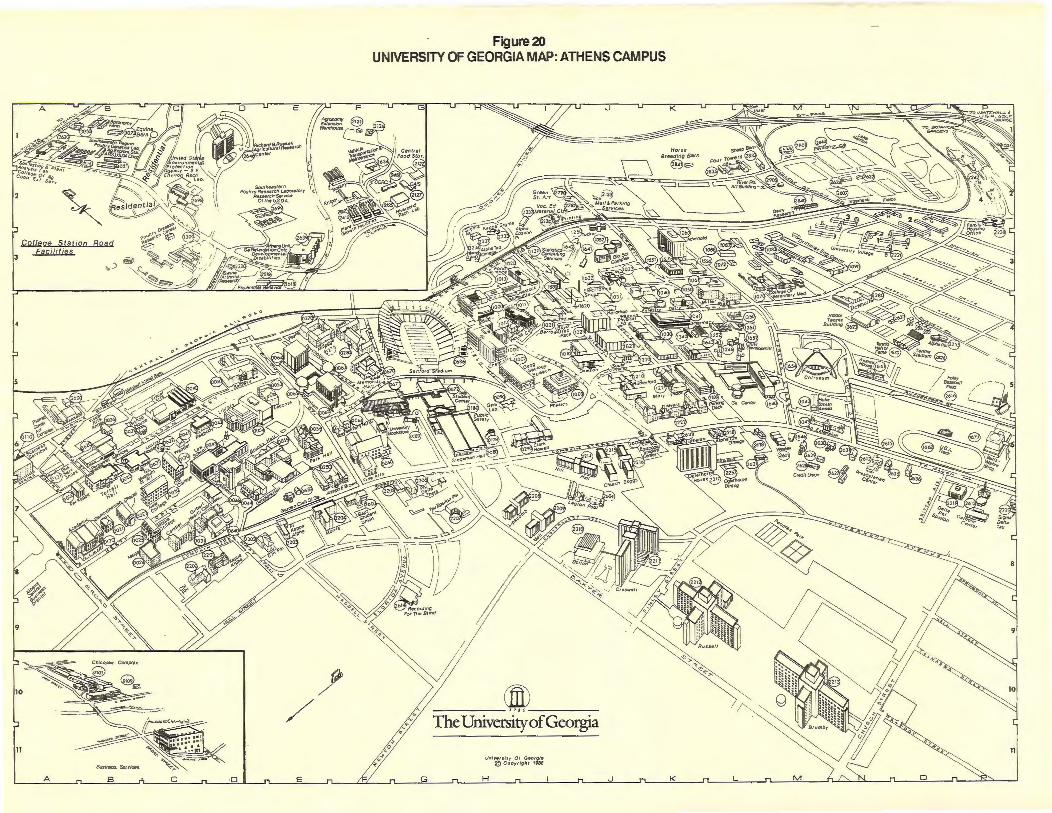
A
A
~ /
Figure20 UNIVERSITY OF GEORGIA MAP: ATHENS CAMPUS
diD --I?IS--
Ufll~erstty 01 Georgi• @Copr"P"' Jlil88

NOTES