Embed Size (px)
Citation preview
Fact Book
2014-2015
Produced by the Office of Institutional Research
Fact Book ContentsOverview
Mission and Vision StatementsAccreditationBoard of Regents and Administrative OfficersInventory of Approved Majors by CollegeInventory of Approved Minors and Certificates by College
Student Body Demographics and DataTotal Student Headcount Enrollment by Gender & EthnicityUndergraduate Student Headcount Enrollment by Gender & EthnicityGraduate Student Headcount Enrollment by Gender & EthnicityTotal Student Enrollment by Age RangeAverage Age of StudentsTotal Student Enrollment by Class SessionTotal Student Enrollment by ClassificationFull-Time (FT), Part-Time (PT), and Full-Time Equivalent (FTE) Enrollment Total MajorsTotal Student Headcount Enrollment by ResidencyTop Counties, States and Countries of OriginUndergraduate Applications Received, Accepted & EnrolledNew First Time in College (FTIC) Student ProfileNew Undergraduate Transfer Student Profile
Student Retention and PerformanceOne Year Retention Rate of First-Time, Full-Time, Degree-Seeking FreshmenSix Year Graduation Rate of First-Time, Full-Time Degree Seeking Freshmen
Course DataAverage Class SizeStudent to Faculty RatioSemester Credit Hours by Lower (LD), Upper (UD) & Graduate (GR) DivisionPercentage of Total LD, UD, and GR Semester Credit Hours by CollegeSemester Credit Hours by LocationSemester Credit Hours by Instruction ModeSemester Credit Hours by SessionPercentage of Lower Division Courses Taught by Tenured/ Tenure Track FacultySemester Credit Hours Taught by Tenure Status (University-Wide)Semester Credit Hours Taught by Tenure Status by CollegesAll Course Completers Based on Semester Credit HoursAll Course Completers by Department and CollegeUndergraduate Course Completers Based on Semester Credit HoursUndergraduate Course Completers by Department and CollegeGraduate Course Completers Based on Semester Credit HoursGraduate Course Completers by Department and College
Degree DataBaccalaureate Degrees Awarded by CollegeBaccalaureate Degree Graduates by Gender and EthnicityMasters Degrees Awarded by CollegeTotal DegreesMasters Degree Graduates by Gender and EthnicityTotal Graduates by Gender and EthnicityAlumni
Faculty DataFaculty Headcount by CategoryTenured/Tenure Track Faculty Headcount by CategoryStudent/ Faculty FTE and Ratio
Staff DataStaff Headcount by Category
Facilities DataClassroom and Laboratory Use
Financial DataExternal or Sponsored ResearchEndowmentOperating BudgetTuition and Mandatory Fees
AppendixAppendix A - DefinitionsAppendix B - Notes
Mission Statement
The University of Houston-Downtown is a comprehensive four-year university offering bachelor’s and selected master’s degree programs and providing strong academic and career preparation as well as life-long learning opportunities. Located in the heart of the city, the University reflects the diversity of the Greater Houston Metropolitan Area and, through its academic programs, engages with the community to address the needs and advance the development of the region. UHD is an inclusive community dedicated to integrating teaching, service, and scholarly research to develop students’ talents and prepare them for success in a dynamic global society.
Vision Statement
The University of Houston-Downtown will be a premier city university engaging every student in high-impact educational experiences and ensuring that students graduate with 21st century skills.

Accreditation
The University of Houston-Downtown is accredited by the Southern Association of Colleges and Schools Commission on Colleges (1866 Southern Lane, Decatur, Georgia, 30033-4097; Telephone: 404-679-4501; Internet: www.sacscoc.org) to award bachelor’s and master’s degrees. The College of Business's Bachelor of Business Administration and Master of Business Administration degree programs are accredited by the Association to Advance Collegiate Schools of Business (AACSB International, 777 South Harbour Island Boulevard, Suite 750, Tampa, FL 33602-5730; Telephone: 813-769-6500; FAX: 813-769-6559; Internet: www.aacsb.edu). The Engineering Technology Department’s Bachelor of Science in Engineering Technology degree programs in Control and Instrumentation Engineering Technology, Fire Protection Engineering Technology, and Structural Analysis and Design are accredited by the Technology Accreditation Commission of the Accreditation Board for Engineering and Technology, Inc. (415 North Charles Street, Baltimore, MD 21201; Telephone 410-347-7700; Internet:www.abet.org). The Urban Education Department's programs that lead to teacher certification are accredited by the Texas Education Agency (1701 N. Congress Avenue Austin, Texas, 78701; Telephone: 512-463-9734; Internet: www.tea.state.tx.us). The Natural Science Department's Bachelor of Science program in Chemistry is approved by the American Chemical Society (1155 Sixteenth Street, NW Washington, DC 20036; Telephone: 800-227-5558; Internet: www.acs.org). The Criminal Justice Department's Bachelor of Social Work degree program is accredited by the Council on Social Work Education (Council on Social Work Education 1701 Duke Street, Suite 200 Alexandria, VA 22314; Telephone: 703-683-8080; Fax: 703-683-8099; Internet: www.cswe.org).
Board of Regents and Administrative Officers University of Houston System Board of Regents Tilman J. Fertitta, Chair Welcome W. Wilson, Jr., Vice Chair Beth Madison, Secretary Jarvis V. Hollingsworth, Immediate Past Chair Durga D. Agrawal Spencer D. Armour, III Paula M. Mendoza Asit R. Shah Peter K. Taaffe Roger F. Welder Chancellor Renu Khator University of Houston-Downtown Executive Council William V. Flores President Ed Hugetz Interim Provost and Senior Vice President for Academic
Affairs and Student Affairs David M. Bradley Vice President for Administration and Finance Ivonne Montalbano Vice President for Employment Services and Operations Johanna Wolfe Vice President for Advancement and External Relations Faiza Khoja Associate Vice President, Institutional Effectiveness D. Michael Fields Dean, College of Business DoVeanna Fulton Dean, College of Humanities & Social Sciences Leigh Van Horn Interim Dean, College of Public Service Akif Uzman Dean, College of Sciences and Technology Chris Birchak Dean, University College Robert Jarrett Dean, Mentoring and Academic Advising Tomikia LeGrande Dean, Enrollment Management Sara Jahansouz Dean, Students Diane Summers Executive Director, University Relations Hossein Shahrokhi Associate Vice President for Information Technology Susan Henney President, Faculty Senate Ryan Pepper President-Elect, Faculty Senate Liza Alonzo Executive Director, Presidential Affairs and Operations Gene Preuss Special Assistant to the President
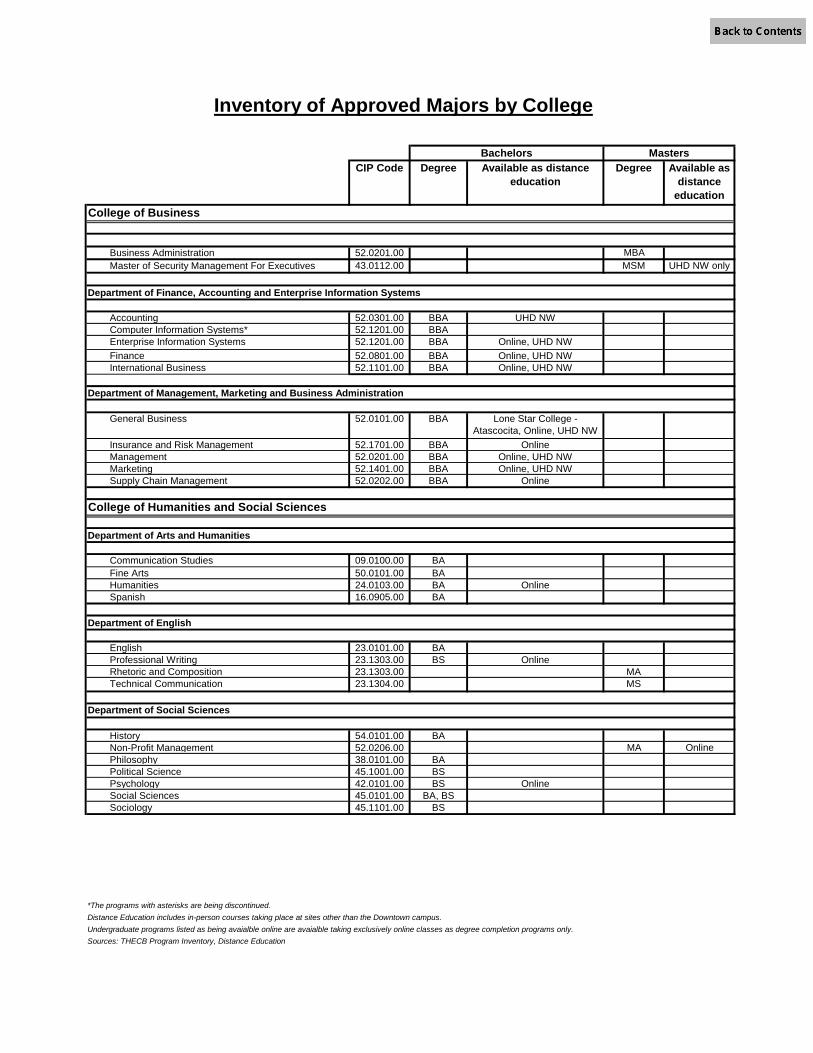
CIP Code Degree Available as distance education
Degree Available as distance
educationCollege of Business
Business Administration 52.0201.00 MBAMaster of Security Management For Executives 43.0112.00 MSM UHD NW only
Department of Finance, Accounting and Enterprise Information Systems
Accounting 52.0301.00 BBA UHD NWComputer Information Systems* 52.1201.00 BBAEnterprise Information Systems 52.1201.00 BBA Online, UHD NWFinance 52.0801.00 BBA Online, UHD NWInternational Business 52.1101.00 BBA Online, UHD NW
Department of Management, Marketing and Business Administration
General Business 52.0101.00 BBA Lone Star College - Atascocita, Online, UHD NW
Insurance and Risk Management 52.1701.00 BBA OnlineManagement 52.0201.00 BBA Online, UHD NWMarketing 52.1401.00 BBA Online, UHD NWSupply Chain Management 52.0202.00 BBA Online
College of Humanities and Social Sciences
Department of Arts and Humanities
Communication Studies 09.0100.00 BAFine Arts 50.0101.00 BAHumanities 24.0103.00 BA OnlineSpanish 16.0905.00 BA
Department of English
English 23.0101.00 BAProfessional Writing 23.1303.00 BS OnlineRhetoric and Composition 23.1303.00 MATechnical Communication 23.1304.00 MS
Department of Social Sciences
History 54.0101.00 BANon-Profit Management 52.0206.00 MA OnlinePhilosophy 38.0101.00 BAPolitical Science 45.1001.00 BSPsychology 42.0101.00 BS OnlineSocial Sciences 45.0101.00 BA, BSSociology 45.1101.00 BS
*The programs with asterisks are being discontinued.Distance Education includes in-person courses taking place at sites other than the Downtown campus.Undergraduate programs listed as being avaialble online are avaialble taking exclusively online classes as degree completion programs only.Sources: THECB Program Inventory, Distance Education
Bachelors Masters
Inventory of Approved Majors by College

CIP Code Degree Available as distance education
Degree Available as distance
education
Bachelors Masters
Inventory of Approved Majors by College
College of Public Service
Department of Criminal Justice
Criminal Justice 43.0104.00 BAAS, BS Online, UHD NW MS Online, UHD NW
Social Work 44.0701.00 BSW
Department of Urban Education
Interdisciplinary Studies 30.9999.01 BA Lone Star College - CyFair, Lone Star College - Kingwood,
UHD NWMaster of Arts in Teaching: Curriculum and Instruction 13.0301.00 MAT Online, UHD
NWMaster of Arts in Teaching: Curriculum and Instruction with certification
13.0301.00 MAT Online, UHD NW
College of Sciences and Technology
Department of Computer Science and Engineering Technology
Computer Science 11.0101.00 BSControl and Instrumentation Engineering Technology 15.1201.00 BSETFire Protection Engineering Technology* 15.0701.00 BSETSafety Management 15.0703.00 BAAS UHD NWStructural Analysis and Design 15.0201.00 BSET
Department of Mathematics and Statistics
Applied Mathematics* 27.0301.00 BSApplied Statistics 27.0301.00 BSMathematics 27.0101.00 BA, BS UHD NW
Department of Natural Sciences
Applied Physics* 40.0801.01 BSBiological and Physical Sciences 30.0101.00 BS UHD NWBiology 26.0101.00 BSBiotechnology 26.1201.10 BSChemistry 40.0501.00 BSGeosciences 40.0601.00 BSIndustrial Chemistry* 40.0599.10 BSMicrobiology* 26.0502.00 BS
University College
Applied Administration 30.9999.40 BAAS Online, UHD NWInterdisciplinary Studies 30.9999.01 BS Online, UHD NW
*The programs with asterisks are being discontinued.Distance Education includes in-person courses taking place at sites other than the Downtown campus.Undergraduate programs listed as being available online are available taking exclusively online classes as degree completion programs only.Sources: THECB Program Inventory, Distance Education
Source: UHD catalog
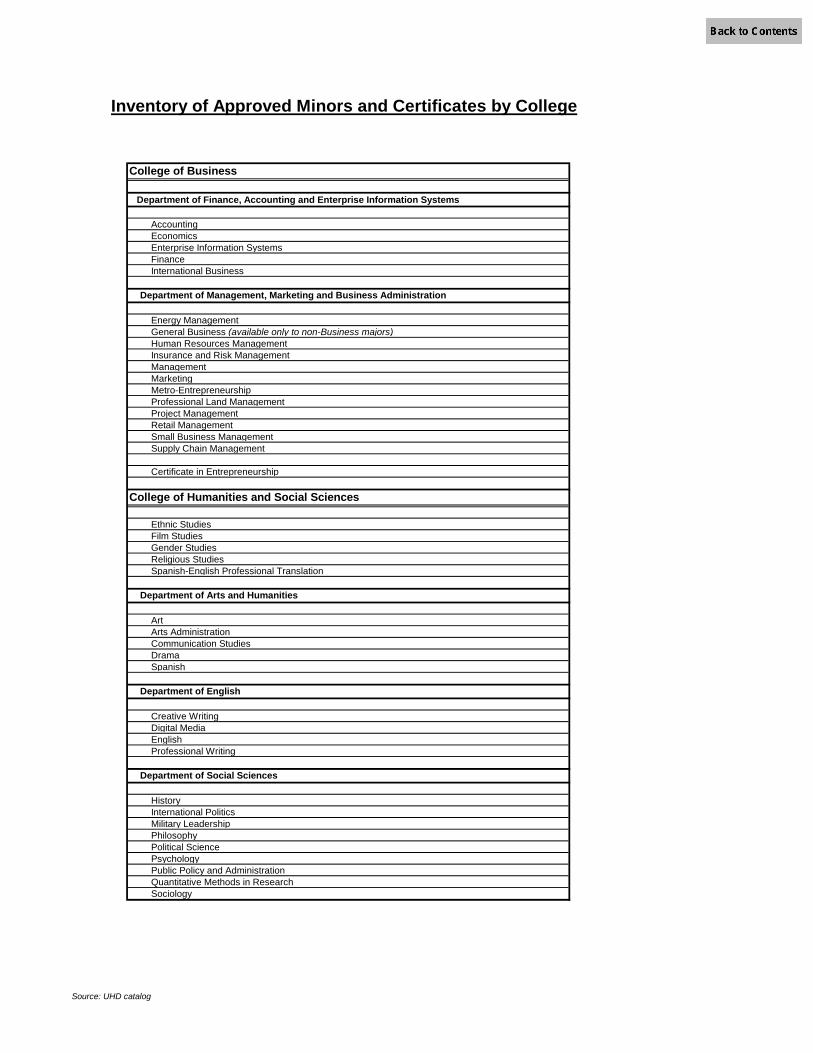
College of Business
Department of Finance, Accounting and Enterprise Information Systems
AccountingEconomicsEnterprise Information SystemsFinanceInternational Business
Department of Management, Marketing and Business Administration
Energy ManagementGeneral Business (available only to non-Business majors)Human Resources Management Insurance and Risk ManagementManagementMarketingMetro-EntrepreneurshipProfessional Land ManagementProject ManagementRetail ManagementSmall Business ManagementSupply Chain Management
Certificate in Entrepreneurship
College of Humanities and Social Sciences
Ethnic StudiesFilm StudiesGender StudiesReligious StudiesSpanish-English Professional Translation
Department of Arts and Humanities
ArtArts AdministrationCommunication StudiesDramaSpanish
Department of English
Creative WritingDigital MediaEnglishProfessional Writing
Department of Social Sciences
HistoryInternational PoliticsMilitary LeadershipPhilosophyPolitical SciencePsychologyPublic Policy and AdministrationQuantitative Methods in ResearchSociology
Inventory of Approved Minors and Certificates by College

Source: UHD catalog
Inventory of Approved Minors and Certificates by College
College of Public Service
Department of Criminal Justice
Criminal JusticeSecurity Management
College of Sciences and Technology
Department of Computer Science and Engineering Technology
BioinformaticsComputer ScienceEngineering Technology
Department of Mathematics and Statistics
Applied StatisticsBioinformaticsMathematics
Department of Natural Sciences
Applied PhysicsBioinformaticsBiologyChemistryEnvironmental SciencesGeologyMicrobiology
College of Business
Graduate certificate in Business Administration with concentrations in the following:
FinanceHuman Resource ManagementInvestment ManagementLeadershipSales Management & Business DevelopmentSupply Chain Management
Graduate Certificates

# % # % # % # % # %
American Indian 48 0.6% 35 0.4% 47 0.6% 43 0.5% 48 0.6% 11.6%Asian or Pacific Islander 568 7.1% 546 6.9% 607 7.3% 653 8.0% 699 8.1% 7.0%Black 2,567 32.2% 2,526 31.8% 2,616 31.4% 2,402 29.3% 2,485 28.7% 3.5%Hispanic 3,189 40.0% 3,146 39.7% 3,406 40.9% 3,496 42.7% 3,796 43.9% 8.6%White 1,471 18.4% 1,503 19.0% 1,450 17.4% 1,382 16.9% 1,393 16.1% 0.8%International 112 1.4% 124 1.6% 140 1.7% 131 1.6% 136 1.6% 3.8%Unknown 21 0.3% 51 0.6% 59 0.7% 82 1.0% 92 1.1% 12.2%
Total Females 7,976 100.0% 7,931 100.0% 8,325 100.0% 8,189 100.0% 8,649 100.0% 5.6%
# % # % # % # % # %
American Indian 17 0.3% 17 0.3% 35 0.6% 35 0.6% 37 0.6% 5.7%Asian or Pacific Islander 620 12.6% 632 12.7% 646 11.6% 743 13.3% 768 13.3% 3.4%Black 1,170 23.8% 1,187 23.8% 1,209 21.6% 1,172 21.0% 1,196 20.7% 2.0%Hispanic 1,823 37.0% 1,839 36.9% 2,184 39.1% 2,227 40.0% 2,373 41.0% 6.6%White 1,112 22.6% 1,123 22.5% 1,269 22.7% 1,168 21.0% 1,177 20.3% 0.8%International 154 3.1% 156 3.1% 175 3.1% 137 2.5% 147 2.5% 7.3%Unknown 28 0.6% 33 0.7% 73 1.3% 86 1.5% 92 1.6% 7.0%
Total Males 4,924 100.0% 4,987 100.0% 5,591 100.0% 5,568 100.0% 5,790 100.0% 4.0%
# % # % # % # % # %
American Indian 65 0.5% 52 0.4% 82 0.6% 78 0.6% 85 0.6% 9.0%Asian or Pacific Islander 1,188 9.2% 1,178 9.1% 1,253 9.0% 1,396 10.1% 1,467 10.2% 5.1%Black 3,737 29.0% 3,713 28.7% 3,825 27.5% 3,574 26.0% 3,681 25.5% 3.0%Hispanic 5,012 38.9% 4,985 38.6% 5,590 40.2% 5,723 41.6% 6,169 42.7% 7.8%White 2,583 20.0% 2,626 20.3% 2,719 19.5% 2,550 18.5% 2,570 17.8% 0.8%International 266 2.1% 280 2.2% 315 2.3% 268 1.9% 283 2.0% 5.6%Unknown 49 0.4% 84 0.7% 132 0.9% 168 1.2% 184 1.3% 9.5%
Total 12,900 100.0% 12,918 100.0% 13,916 100.0% 13,757 100.0% 14,439 100.0% 5.0%
Source: CBM001
Total Student Headcount Enrollment by Gender & Ethnicity(Includes Undergraduate and Graduate Students)
Fall 2012
Fall 2012
Fall 2011 Fall 2014
Fall 2014
Female
% change from Previous Year
Fall 2013Fall 2010
Overall
% change from Previous Year
Fall 2010 Fall 2011 Fall 2012
Male
Fall 2010 Fall 2011 % change from Previous Year
Fall 2013
Fall 2014Fall 2013
40.1%
61.4%
Enrollment by Gender Fall 2014
Male
Female
0.6%
10.2%
25.5%
42.7%
17.8%
2.0%
1.3% Enrollment by Ethnicity
Fall 2014
American Indian
Asian or Pacific Islander
Black
Hispanic
White
International
Unknown
Source: CBM001Includes Post-Baccalaureate students
# % # % # % # % # %
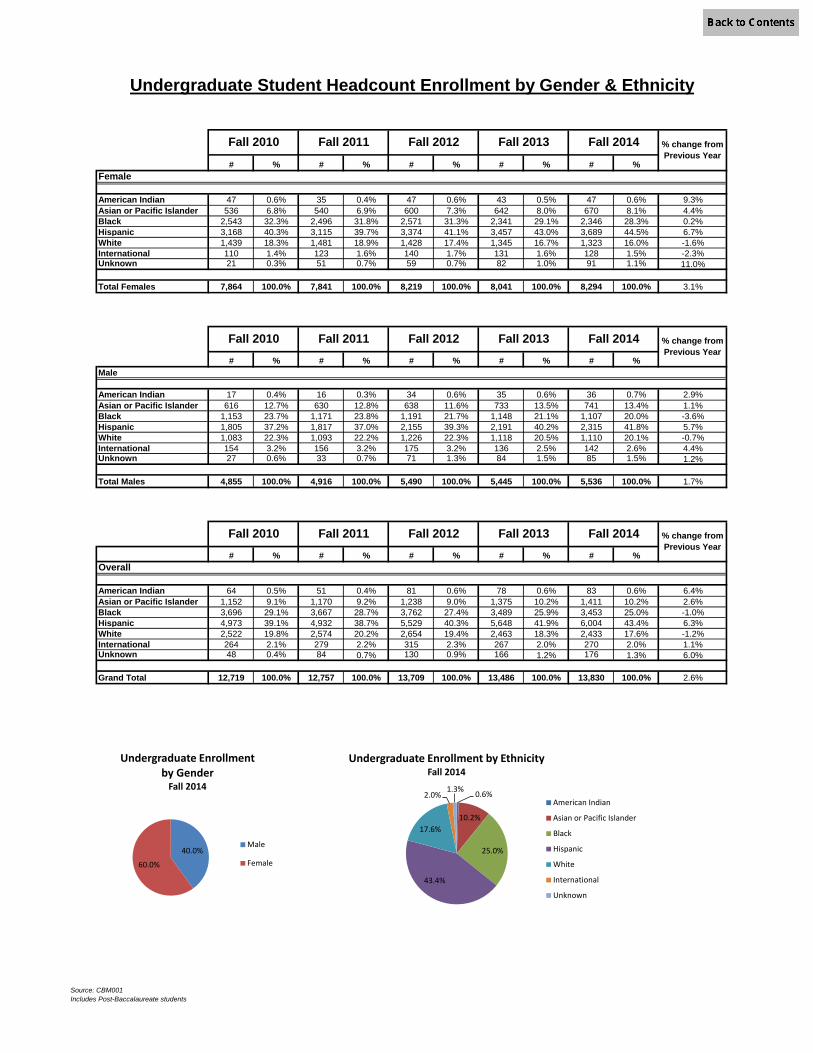
American Indian 47 0.6% 35 0.4% 47 0.6% 43 0.5% 47 0.6% 9.3%Asian or Pacific Islander 536 6.8% 540 6.9% 600 7.3% 642 8.0% 670 8.1% 4.4%Black 2,543 32.3% 2,496 31.8% 2,571 31.3% 2,341 29.1% 2,346 28.3% 0.2%Hispanic 3,168 40.3% 3,115 39.7% 3,374 41.1% 3,457 43.0% 3,689 44.5% 6.7%White 1,439 18.3% 1,481 18.9% 1,428 17.4% 1,345 16.7% 1,323 16.0% -1.6%International 110 1.4% 123 1.6% 140 1.7% 131 1.6% 128 1.5% -2.3%Unknown 21 0.3% 51 0.7% 59 0.7% 82 1.0% 91 1.1% 11.0%
Total Females 7,864 100.0% 7,841 100.0% 8,219 100.0% 8,041 100.0% 8,294 100.0% 3.1%
# % # % # % # % # %
American Indian 17 0.4% 16 0.3% 34 0.6% 35 0.6% 36 0.7% 2.9%Asian or Pacific Islander 616 12.7% 630 12.8% 638 11.6% 733 13.5% 741 13.4% 1.1%Black 1,153 23.7% 1,171 23.8% 1,191 21.7% 1,148 21.1% 1,107 20.0% -3.6%Hispanic 1,805 37.2% 1,817 37.0% 2,155 39.3% 2,191 40.2% 2,315 41.8% 5.7%White 1,083 22.3% 1,093 22.2% 1,226 22.3% 1,118 20.5% 1,110 20.1% -0.7%International 154 3.2% 156 3.2% 175 3.2% 136 2.5% 142 2.6% 4.4%Unknown 27 0.6% 33 0.7% 71 1.3% 84 1.5% 85 1.5% 1.2%
Total Males 4,855 100.0% 4,916 100.0% 5,490 100.0% 5,445 100.0% 5,536 100.0% 1.7%
# % # % # % # % # %
American Indian 64 0.5% 51 0.4% 81 0.6% 78 0.6% 83 0.6% 6.4%Asian or Pacific Islander 1,152 9.1% 1,170 9.2% 1,238 9.0% 1,375 10.2% 1,411 10.2% 2.6%Black 3,696 29.1% 3,667 28.7% 3,762 27.4% 3,489 25.9% 3,453 25.0% -1.0%Hispanic 4,973 39.1% 4,932 38.7% 5,529 40.3% 5,648 41.9% 6,004 43.4% 6.3%White 2,522 19.8% 2,574 20.2% 2,654 19.4% 2,463 18.3% 2,433 17.6% -1.2%International 264 2.1% 279 2.2% 315 2.3% 267 2.0% 270 2.0% 1.1%Unknown 48 0.4% 84 0.7% 130 0.9% 166 1.2% 176 1.3% 6.0%
Grand Total 12,719 100.0% 12,757 100.0% 13,709 100.0% 13,486 100.0% 13,830 100.0% 2.6%
Fall 2014
Fall 2014
Fall 2014
Female
% change from Previous Year
Fall 2011 Fall 2013
Fall 2013
Fall 2010 Fall 2012
Fall 2012Fall 2011
Overall
% change from Previous Year
Fall 2013Fall 2010 Fall 2012
Undergraduate Student Headcount Enrollment by Gender & Ethnicity
Male
Fall 2010
Fall 2011
% change from Previous Year
40.0%
60.0%
Undergraduate Enrollment by Gender
Fall 2014
Male
Female
0.6%
10.2%
25.0%
43.4%
17.6%
2.0% 1.3%
Undergraduate Enrollment by Ethnicity Fall 2014
American Indian
Asian or Pacific Islander
Black
Hispanic
White
International
Unknown

# % # % # % # % # %
American Indian 1 1.2% 0 0.0% 0 0.0% 0 0.0% 1 0.3% -Asian or Pacific Islander 5 5.9% 6 6.7% 7 6.6% 11 7.4% 29 8.2% 163.6%Black 24 28.2% 30 33.3% 45 42.5% 61 41.2% 139 39.2% 127.9%Hispanic 21 24.7% 31 34.4% 32 30.2% 39 26.4% 107 30.1% 174.4%White 32 37.6% 22 24.4% 22 20.8% 37 25.0% 70 19.7% 89.2%International 2 2.4% 1 1.1% 0 0.0% 0 0.0% 8 2.3% -Unknown 0 0.0% 0 0.0% 0 0.0% 0 0.0% 1 0.3% -
Total Females 85 100.0% 90 100.0% 106 100.0% 148 100.0% 355 100.0% 139.9%
# % # % # % # % # %
American Indian 0 0.0% 1 1.4% 1 1.0% 0 0.0% 1 0.4% -Asian or Pacific Islander 4 5.8% 2 2.8% 8 7.9% 10 8.1% 27 10.6% 170.0%Black 17 24.6% 16 22.5% 18 17.8% 24 19.5% 89 35.0% 270.8%Hispanic 18 26.1% 22 31.0% 29 28.7% 36 29.3% 58 22.8% 61.1%White 29 42.0% 30 42.3% 43 42.6% 50 40.7% 67 26.4% 34.0%International 0 0.0% 0 0.0% 0 0.0% 1 0.8% 5 2.0% 400.0%Unknown 1 1.4% 0 0.0% 2 2.0% 2 1.6% 7 2.8% 250.0%
Total Males 69 100.0% 71 100.0% 101 100.0% 123 100.0% 254 100.0% 106.5%
# % # % # % # % # %
American Indian 1 0.6% 1 0.6% 1 0.5% 0 0.0% 2 0.3% -Asian or Pacific Islander 9 5.8% 8 5.0% 15 7.2% 21 7.7% 56 9.2% 166.7%Black 41 26.6% 46 28.6% 63 30.4% 85 31.4% 228 37.4% 168.2%Hispanic 39 25.3% 53 32.9% 61 29.5% 75 27.7% 165 27.1% 120.0%White 61 39.6% 52 32.3% 65 31.4% 87 32.1% 137 22.5% 57.5%International 2 1.3% 1 0.6% 0 0.0% 1 0.4% 13 2.1% 1200.0%Unknown 1 0.6% 0 0.0% 2 1.0% 2 0.7% 8 1.3% 300.0%
Grand Total 154 100.0% 161 100.0% 207 100.0% 271 100.0% 609 100.0% 124.7%
Source: CBM001
Fall 2011
Male
Fall 2011
Fall 2013
Fall 2014
Fall 2014
Overall
% change from Previous Year
Fall 2010 Fall 2012
Female
% change from Previous Year
% change from Previous Year
Fall 2010 Fall 2012
Fall 2011
Fall 2013
Graduate Student Headcount Enrollment by Gender & Ethnicity
Fall 2010 Fall 2012 Fall 2013 Fall 2014
41.7% 58.3%
Graduate Enrollment by Gender Fall 2014
Male
Female
0.3%
9.2%
37.4%
27.1%
22.5%
2.1%
1.3%
Graduate Enrollment by Ethnicity Fall 2014
American Indian
Asian or Pacific Islander
Black
Hispanic
White
International
Unknown
Sources: CBM001, WDAYNIG Internal report
# % # % # % # % # %
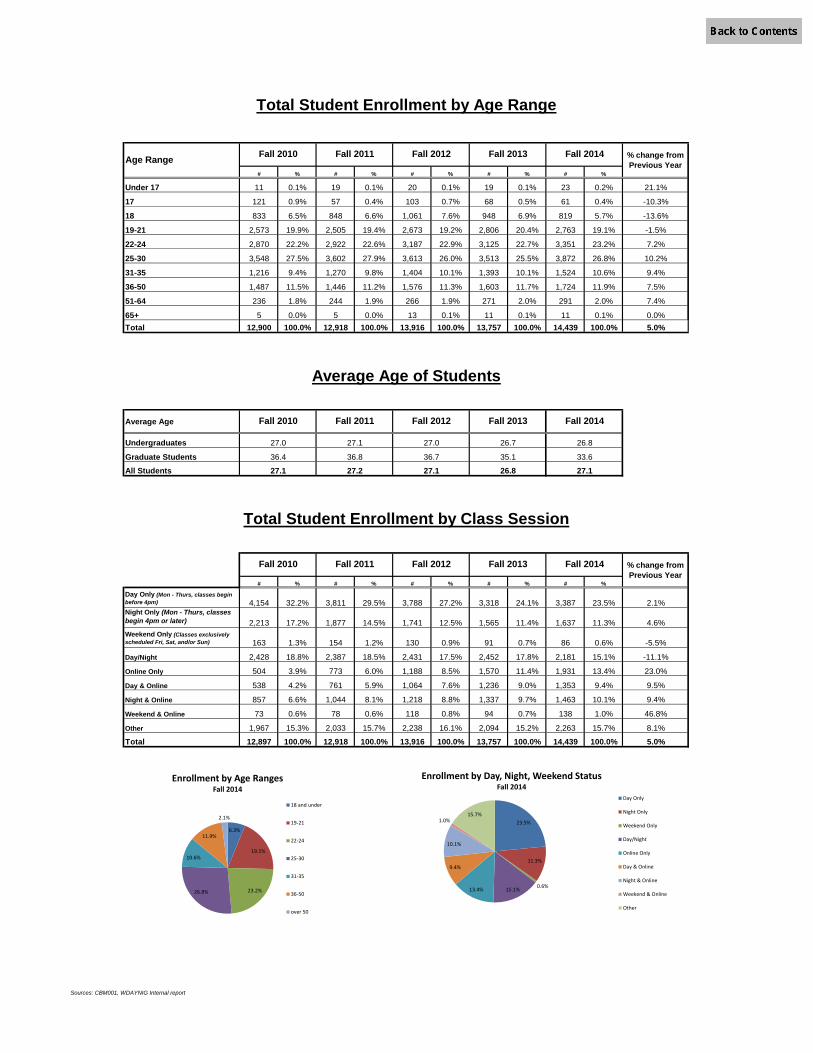
Under 17 11 0.1% 19 0.1% 20 0.1% 19 0.1% 23 0.2% 21.1%
17 121 0.9% 57 0.4% 103 0.7% 68 0.5% 61 0.4% -10.3%
18 833 6.5% 848 6.6% 1,061 7.6% 948 6.9% 819 5.7% -13.6%
19-21 2,573 19.9% 2,505 19.4% 2,673 19.2% 2,806 20.4% 2,763 19.1% -1.5%
22-24 2,870 22.2% 2,922 22.6% 3,187 22.9% 3,125 22.7% 3,351 23.2% 7.2%
25-30 3,548 27.5% 3,602 27.9% 3,613 26.0% 3,513 25.5% 3,872 26.8% 10.2%
31-35 1,216 9.4% 1,270 9.8% 1,404 10.1% 1,393 10.1% 1,524 10.6% 9.4%
36-50 1,487 11.5% 1,446 11.2% 1,576 11.3% 1,603 11.7% 1,724 11.9% 7.5%
51-64 236 1.8% 244 1.9% 266 1.9% 271 2.0% 291 2.0% 7.4%
65+ 5 0.0% 5 0.0% 13 0.1% 11 0.1% 11 0.1% 0.0%Total 12,900 100.0% 12,918 100.0% 13,916 100.0% 13,757 100.0% 14,439 100.0% 5.0%
Average Age
Undergraduates
Graduate StudentsAll Students
# % # % # % # % # %
Day Only (Mon - Thurs, classes begin before 4pm) 4,154 32.2% 3,811 29.5% 3,788 27.2% 3,318 24.1% 3,387 23.5% 2.1%Night Only (Mon - Thurs, classes begin 4pm or later) 2,213 17.2% 1,877 14.5% 1,741 12.5% 1,565 11.4% 1,637 11.3% 4.6%Weekend Only (Classes exclusively scheduled Fri, Sat, and/or Sun) 163 1.3% 154 1.2% 130 0.9% 91 0.7% 86 0.6% -5.5%
Day/Night 2,428 18.8% 2,387 18.5% 2,431 17.5% 2,452 17.8% 2,181 15.1% -11.1%
Online Only 504 3.9% 773 6.0% 1,188 8.5% 1,570 11.4% 1,931 13.4% 23.0%
Day & Online 538 4.2% 761 5.9% 1,064 7.6% 1,236 9.0% 1,353 9.4% 9.5%
Night & Online 857 6.6% 1,044 8.1% 1,218 8.8% 1,337 9.7% 1,463 10.1% 9.4%
Weekend & Online 73 0.6% 78 0.6% 118 0.8% 94 0.7% 138 1.0% 46.8%
Other 1,967 15.3% 2,033 15.7% 2,238 16.1% 2,094 15.2% 2,263 15.7% 8.1%
Total 12,897 100.0% 12,918 100.0% 13,916 100.0% 13,757 100.0% 14,439 100.0% 5.0%
Fall 2014
Fall 2014
26.8
33.6
27.1
Average Age of Students
Fall 2012
27.0
Fall 2011
Fall 2011
27.1
36.8
27.2
% change from Previous Year
Fall 2010 Fall 2012Fall 2011 Fall 2013 Fall 2014
Total Student Enrollment by Age Range
% change from Previous YearAge Range Fall 2010 Fall 2012 Fall 2013
36.7
27.1
Fall 2010
27.0
36.4
27.1
Total Student Enrollment by Class Session
Fall 2013
26.7
35.1
26.8
23.5%
11.3%
0.6% 15.1% 13.4%
9.4%
10.1%
1.0% 15.7%
Enrollment by Day, Night, Weekend Status Fall 2014
Day Only
Night Only
Weekend Only
Day/Night
Online Only
Day & Online
Night & Online
Weekend & Online
Other
6.3%
19.1%
23.2% 26.8%
10.6%
11.9%
2.1%
Enrollment by Age Ranges Fall 2014
18 and under
19-21
22-24
25-30
31-35
36-50
over 50

Source: CBM001
# % # % # % # % # %Freshman 2,495 19.3% 2,392 18.5% 2,768 19.9% 2,447 17.8% 2,034 14.1% -16.9%Sophomore 1,569 12.2% 1,634 12.6% 1,743 12.5% 1,847 13.4% 1,940 13.4% 5.0%Junior 2,544 19.7% 2,585 20.0% 2,940 21.1% 3,029 22.0% 3,589 24.9% 18.5%Senior 5,630 43.6% 5,640 43.7% 5,738 41.2% 5,663 41.2% 5,810 40.2% 2.6%Post Bac 508 3.9% 506 3.9% 520 3.7% 500 3.6% 457 3.2% -8.6%Masters 154 1.2% 161 1.2% 207 1.5% 271 2.0% 609 4.2% 124.7%Total 12,900 100.0% 12,918 100.0% 13,916 100.0% 13,757 100.0% 14,439 100.0% 5.0%
Fall 2014
Total Student Enrollment by Classification
% change from Previous YearClassification Fall 2010 Fall 2012Fall 2011 Fall 2013
0
2000
4000
6000
8000
10000
12000
14000
16000
Fall 2010 Fall 2011 Fall 2012 Fall 2013 Fall 2014
Enrollment by Classification
Masters
Post Bac
Senior
Junior
Sophomore
Freshman
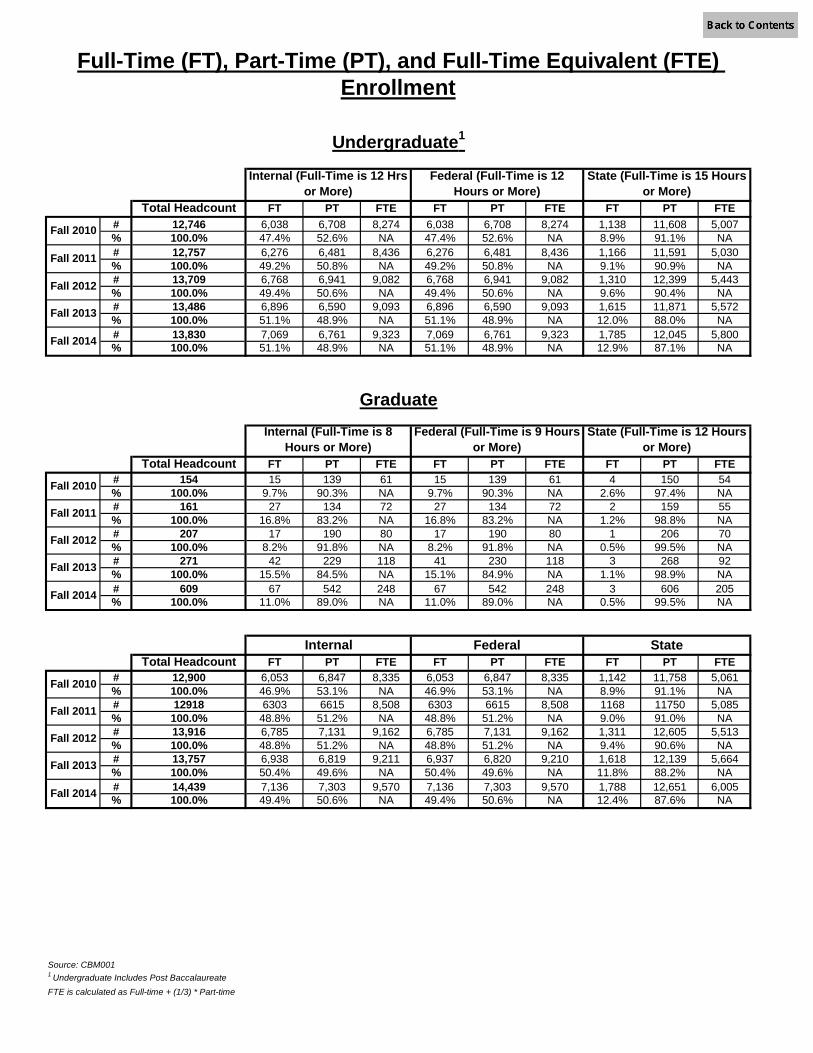
Total Headcount FT PT FTE FT PT FTE FT PT FTE# 12,746 6,038 6,708 8,274 6,038 6,708 8,274 1,138 11,608 5,007% 100.0% 47.4% 52.6% NA 47.4% 52.6% NA 8.9% 91.1% NA# 12,757 6,276 6,481 8,436 6,276 6,481 8,436 1,166 11,591 5,030% 100.0% 49.2% 50.8% NA 49.2% 50.8% NA 9.1% 90.9% NA# 13,709 6,768 6,941 9,082 6,768 6,941 9,082 1,310 12,399 5,443% 100.0% 49.4% 50.6% NA 49.4% 50.6% NA 9.6% 90.4% NA# 13,486 6,896 6,590 9,093 6,896 6,590 9,093 1,615 11,871 5,572% 100.0% 51.1% 48.9% NA 51.1% 48.9% NA 12.0% 88.0% NA# 13,830 7,069 6,761 9,323 7,069 6,761 9,323 1,785 12,045 5,800% 100.0% 51.1% 48.9% NA 51.1% 48.9% NA 12.9% 87.1% NA
Total Headcount FT PT FTE FT PT FTE FT PT FTE# 154 15 139 61 15 139 61 4 150 54% 100.0% 9.7% 90.3% NA 9.7% 90.3% NA 2.6% 97.4% NA# 161 27 134 72 27 134 72 2 159 55% 100.0% 16.8% 83.2% NA 16.8% 83.2% NA 1.2% 98.8% NA# 207 17 190 80 17 190 80 1 206 70% 100.0% 8.2% 91.8% NA 8.2% 91.8% NA 0.5% 99.5% NA# 271 42 229 118 41 230 118 3 268 92% 100.0% 15.5% 84.5% NA 15.1% 84.9% NA 1.1% 98.9% NA# 609 67 542 248 67 542 248 3 606 205% 100.0% 11.0% 89.0% NA 11.0% 89.0% NA 0.5% 99.5% NA
Total Headcount FT PT FTE FT PT FTE FT PT FTE# 12,900 6,053 6,847 8,335 6,053 6,847 8,335 1,142 11,758 5,061% 100.0% 46.9% 53.1% NA 46.9% 53.1% NA 8.9% 91.1% NA# 12918 6303 6615 8,508 6303 6615 8,508 1168 11750 5,085% 100.0% 48.8% 51.2% NA 48.8% 51.2% NA 9.0% 91.0% NA# 13,916 6,785 7,131 9,162 6,785 7,131 9,162 1,311 12,605 5,513% 100.0% 48.8% 51.2% NA 48.8% 51.2% NA 9.4% 90.6% NA# 13,757 6,938 6,819 9,211 6,937 6,820 9,210 1,618 12,139 5,664% 100.0% 50.4% 49.6% NA 50.4% 49.6% NA 11.8% 88.2% NA# 14,439 7,136 7,303 9,570 7,136 7,303 9,570 1,788 12,651 6,005% 100.0% 49.4% 50.6% NA 49.4% 50.6% NA 12.4% 87.6% NA
Source: CBM0011 Undergraduate Includes Post BaccalaureateFTE is calculated as Full-time + (1/3) * Part-time
Fall 2014
Fall 2011
Fall 2012
Federal (Full-Time is 9 Hours or More)
State (Full-Time is 12 Hours or More)
Fall 2012
Fall 2014
Fall 2014
Fall 2010
Fall 2013
Fall 2013
Internal Federal State
Fall 2011
Fall 2012
Federal (Full-Time is 12 Hours or More)
State (Full-Time is 15 Hours or More)
Fall 2011
Full-Time (FT), Part-Time (PT), and Full-Time Equivalent (FTE) Enrollment
Fall 2010
Fall 2013
Graduate
Fall 2010
Internal (Full-Time is 8 Hours or More)
Undergraduate1
Internal (Full-Time is 12 Hrs or More)
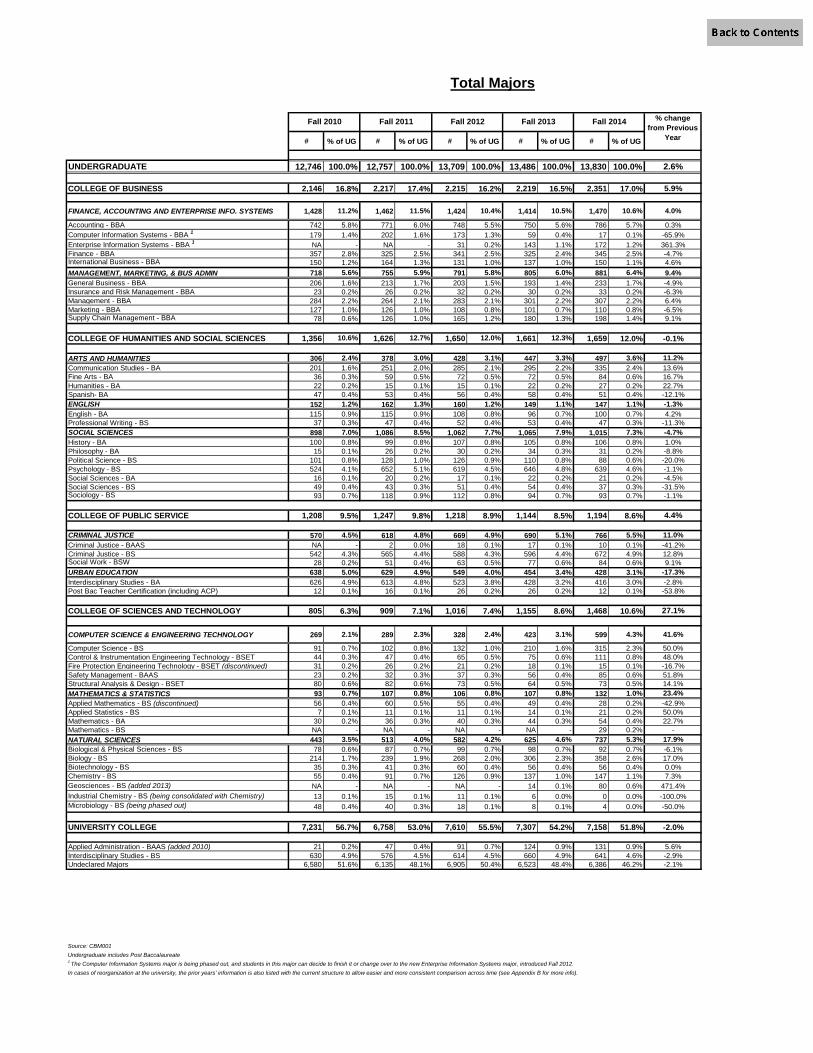
# % of UG # % of UG # % of UG # % of UG # % of UG
UNDERGRADUATE 12,746 100.0% 12,757 100.0% 13,709 100.0% 13,486 100.0% 13,830 100.0% 2.6%
COLLEGE OF BUSINESS 2,146 16.8% 2,217 17.4% 2,215 16.2% 2,219 16.5% 2,351 17.0% 5.9%
FINANCE, ACCOUNTING AND ENTERPRISE INFO. SYSTEMS 1,428 11.2% 1,462 11.5% 1,424 10.4% 1,414 10.5% 1,470 10.6% 4.0%
Accounting - BBA 742 5.8% 771 6.0% 748 5.5% 750 5.6% 786 5.7% 0.3%Computer Information Systems - BBA 1 179 1.4% 202 1.6% 173 1.3% 59 0.4% 17 0.1% -65.9%Enterprise Information Systems - BBA 1 NA - NA - 31 0.2% 143 1.1% 172 1.2% 361.3%Finance - BBA 357 2.8% 325 2.5% 341 2.5% 325 2.4% 345 2.5% -4.7%International Business - BBA 150 1.2% 164 1.3% 131 1.0% 137 1.0% 150 1.1% 4.6%MANAGEMENT, MARKETING, & BUS ADMIN 718 5.6% 755 5.9% 791 5.8% 805 6.0% 881 6.4% 9.4%General Business - BBA 206 1.6% 213 1.7% 203 1.5% 193 1.4% 233 1.7% -4.9%Insurance and Risk Management - BBA 23 0.2% 26 0.2% 32 0.2% 30 0.2% 33 0.2% -6.3%Management - BBA 284 2.2% 264 2.1% 283 2.1% 301 2.2% 307 2.2% 6.4%Marketing - BBA 127 1.0% 126 1.0% 108 0.8% 101 0.7% 110 0.8% -6.5%Supply Chain Management - BBA 78 0.6% 126 1.0% 165 1.2% 180 1.3% 198 1.4% 9.1%
COLLEGE OF HUMANITIES AND SOCIAL SCIENCES 1,356 10.6% 1,626 12.7% 1,650 12.0% 1,661 12.3% 1,659 12.0% -0.1%
ARTS AND HUMANITIES 306 2.4% 378 3.0% 428 3.1% 447 3.3% 497 3.6% 11.2%Communication Studies - BA 201 1.6% 251 2.0% 285 2.1% 295 2.2% 335 2.4% 13.6%Fine Arts - BA 36 0.3% 59 0.5% 72 0.5% 72 0.5% 84 0.6% 16.7%Humanities - BA 22 0.2% 15 0.1% 15 0.1% 22 0.2% 27 0.2% 22.7%Spanish- BA 47 0.4% 53 0.4% 56 0.4% 58 0.4% 51 0.4% -12.1%ENGLISH 152 1.2% 162 1.3% 160 1.2% 149 1.1% 147 1.1% -1.3%English - BA 115 0.9% 115 0.9% 108 0.8% 96 0.7% 100 0.7% 4.2%Professional Writing - BS 37 0.3% 47 0.4% 52 0.4% 53 0.4% 47 0.3% -11.3%SOCIAL SCIENCES 898 7.0% 1,086 8.5% 1,062 7.7% 1,065 7.9% 1,015 7.3% -4.7%History - BA 100 0.8% 99 0.8% 107 0.8% 105 0.8% 106 0.8% 1.0%Philosophy - BA 15 0.1% 26 0.2% 30 0.2% 34 0.3% 31 0.2% -8.8%Political Science - BS 101 0.8% 128 1.0% 126 0.9% 110 0.8% 88 0.6% -20.0%Psychology - BS 524 4.1% 652 5.1% 619 4.5% 646 4.8% 639 4.6% -1.1%Social Sciences - BA 16 0.1% 20 0.2% 17 0.1% 22 0.2% 21 0.2% -4.5%Social Sciences - BS 49 0.4% 43 0.3% 51 0.4% 54 0.4% 37 0.3% -31.5%Sociology - BS 93 0.7% 118 0.9% 112 0.8% 94 0.7% 93 0.7% -1.1%
COLLEGE OF PUBLIC SERVICE 1,208 9.5% 1,247 9.8% 1,218 8.9% 1,144 8.5% 1,194 8.6% 4.4%
CRIMINAL JUSTICE 570 4.5% 618 4.8% 669 4.9% 690 5.1% 766 5.5% 11.0%Criminal Justice - BAAS NA - 2 0.0% 18 0.1% 17 0.1% 10 0.1% -41.2%Criminal Justice - BS 542 4.3% 565 4.4% 588 4.3% 596 4.4% 672 4.9% 12.8%Social Work - BSW 28 0.2% 51 0.4% 63 0.5% 77 0.6% 84 0.6% 9.1%URBAN EDUCATION 638 5.0% 629 4.9% 549 4.0% 454 3.4% 428 3.1% -17.3%Interdisciplinary Studies - BA 626 4.9% 613 4.8% 523 3.8% 428 3.2% 416 3.0% -2.8%Post Bac Teacher Certification (including ACP) 12 0.1% 16 0.1% 26 0.2% 26 0.2% 12 0.1% -53.8%
COLLEGE OF SCIENCES AND TECHNOLOGY 805 6.3% 909 7.1% 1,016 7.4% 1,155 8.6% 1,468 10.6% 27.1%
COMPUTER SCIENCE & ENGINEERING TECHNOLOGY 269 2.1% 289 2.3% 328 2.4% 423 3.1% 599 4.3% 41.6%
Computer Science - BS 91 0.7% 102 0.8% 132 1.0% 210 1.6% 315 2.3% 50.0%Control & Instrumentation Engineering Technology - BSET 44 0.3% 47 0.4% 65 0.5% 75 0.6% 111 0.8% 48.0%Fire Protection Engineering Technology - BSET (discontinued) 31 0.2% 26 0.2% 21 0.2% 18 0.1% 15 0.1% -16.7%Safety Management - BAAS 23 0.2% 32 0.3% 37 0.3% 56 0.4% 85 0.6% 51.8%Structural Analysis & Design - BSET 80 0.6% 82 0.6% 73 0.5% 64 0.5% 73 0.5% 14.1%MATHEMATICS & STATISTICS 93 0.7% 107 0.8% 106 0.8% 107 0.8% 132 1.0% 23.4%Applied Mathematics - BS (discontinued) 56 0.4% 60 0.5% 55 0.4% 49 0.4% 28 0.2% -42.9%Applied Statistics - BS 7 0.1% 11 0.1% 11 0.1% 14 0.1% 21 0.2% 50.0%Mathematics - BA 30 0.2% 36 0.3% 40 0.3% 44 0.3% 54 0.4% 22.7%Mathematics - BS NA - NA - NA - NA - 29 0.2% -NATURAL SCIENCES 443 3.5% 513 4.0% 582 4.2% 625 4.6% 737 5.3% 17.9%Biological & Physical Sciences - BS 78 0.6% 87 0.7% 99 0.7% 98 0.7% 92 0.7% -6.1%Biology - BS 214 1.7% 239 1.9% 268 2.0% 306 2.3% 358 2.6% 17.0%Biotechnology - BS 35 0.3% 41 0.3% 60 0.4% 56 0.4% 56 0.4% 0.0%Chemistry - BS 55 0.4% 91 0.7% 126 0.9% 137 1.0% 147 1.1% 7.3%Geosciences - BS (added 2013) NA - NA - NA - 14 0.1% 80 0.6% 471.4%Industrial Chemistry - BS (being consolidated with Chemistry) 13 0.1% 15 0.1% 11 0.1% 6 0.0% 0 0.0% -100.0%Microbiology - BS (being phased out) 48 0.4% 40 0.3% 18 0.1% 8 0.1% 4 0.0% -50.0%
UNIVERSITY COLLEGE 7,231 56.7% 6,758 53.0% 7,610 55.5% 7,307 54.2% 7,158 51.8% -2.0%
Applied Administration - BAAS (added 2010) 21 0.2% 47 0.4% 91 0.7% 124 0.9% 131 0.9% 5.6%Interdisciplinary Studies - BS 630 4.9% 576 4.5% 614 4.5% 660 4.9% 641 4.6% -2.9%Undeclared Majors 6,580 51.6% 6,135 48.1% 6,905 50.4% 6,523 48.4% 6,386 46.2% -2.1%
Source: CBM001Undergraduate includes Post Baccalaureate1 The Computer Information Systems major is being phased out, and students in this major can decide to finish it or change over to the new Enterprise Information Systems major, introduced Fall 2012.In cases of reorganization at the university, the prior years’ information is also listed with the current structure to allow easier and more consistent comparison across time (see Appendix B for more info).
% change from Previous
Year
Fall 2010 Fall 2011
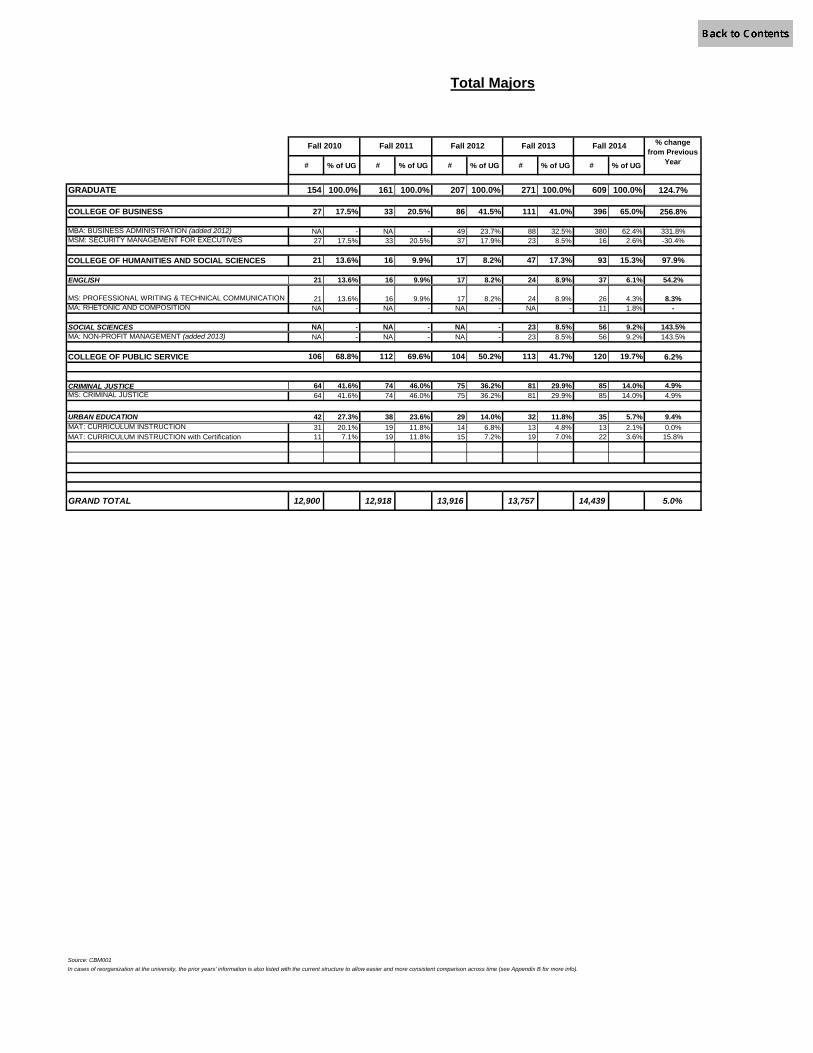
Total Majors
Fall 2012 Fall 2013 Fall 2014
Total Majors
# % of UG # % of UG # % of UG # % of UG # % of UG
GRADUATE 154 100.0% 161 100.0% 207 100.0% 271 100.0% 609 100.0% 124.7%
COLLEGE OF BUSINESS 27 17.5% 33 20.5% 86 41.5% 111 41.0% 396 65.0% 256.8%
MBA: BUSINESS ADMINISTRATION (added 2012) NA - NA - 49 23.7% 88 32.5% 380 62.4% 331.8%MSM: SECURITY MANAGEMENT FOR EXECUTIVES 27 17.5% 33 20.5% 37 17.9% 23 8.5% 16 2.6% -30.4%
21 13.6% 16 9.9% 17 8.2% 47 17.3% 93 15.3% 97.9%
ENGLISH 21 13.6% 16 9.9% 17 8.2% 24 8.9% 37 6.1% 54.2%
MS: PROFESSIONAL WRITING & TECHNICAL COMMUNICATION 21 13.6% 16 9.9% 17 8.2% 24 8.9% 26 4.3% 8.3%MA: RHETONIC AND COMPOSITION NA - NA - NA - NA - 11 1.8% -
SOCIAL SCIENCES NA - NA - NA - 23 8.5% 56 9.2% 143.5%MA: NON-PROFIT MANAGEMENT (added 2013) NA - NA - NA - 23 8.5% 56 9.2% 143.5%
COLLEGE OF PUBLIC SERVICE 106 68.8% 112 69.6% 104 50.2% 113 41.7% 120 19.7% 6.2%
CRIMINAL JUSTICE 64 41.6% 74 46.0% 75 36.2% 81 29.9% 85 14.0% 4.9%MS: CRIMINAL JUSTICE 64 41.6% 74 46.0% 75 36.2% 81 29.9% 85 14.0% 4.9%
URBAN EDUCATION 42 27.3% 38 23.6% 29 14.0% 32 11.8% 35 5.7% 9.4%MAT: CURRICULUM INSTRUCTION 31 20.1% 19 11.8% 14 6.8% 13 4.8% 13 2.1% 0.0%MAT: CURRICULUM INSTRUCTION with Certification 11 7.1% 19 11.8% 15 7.2% 19 7.0% 22 3.6% 15.8%
GRAND TOTAL 12,900 12,918 13,916 13,757 14,439 5.0%
Source: CBM001In cases of reorganization at the university, the prior years’ information is also listed with the current structure to allow easier and more consistent comparison across time (see Appendix B for more info).
COLLEGE OF HUMANITIES AND SOCIAL SCIENCES
Fall 2010 Fall 2011 Fall 2012 Fall 2013 Fall 2014 % change from Previous
Year
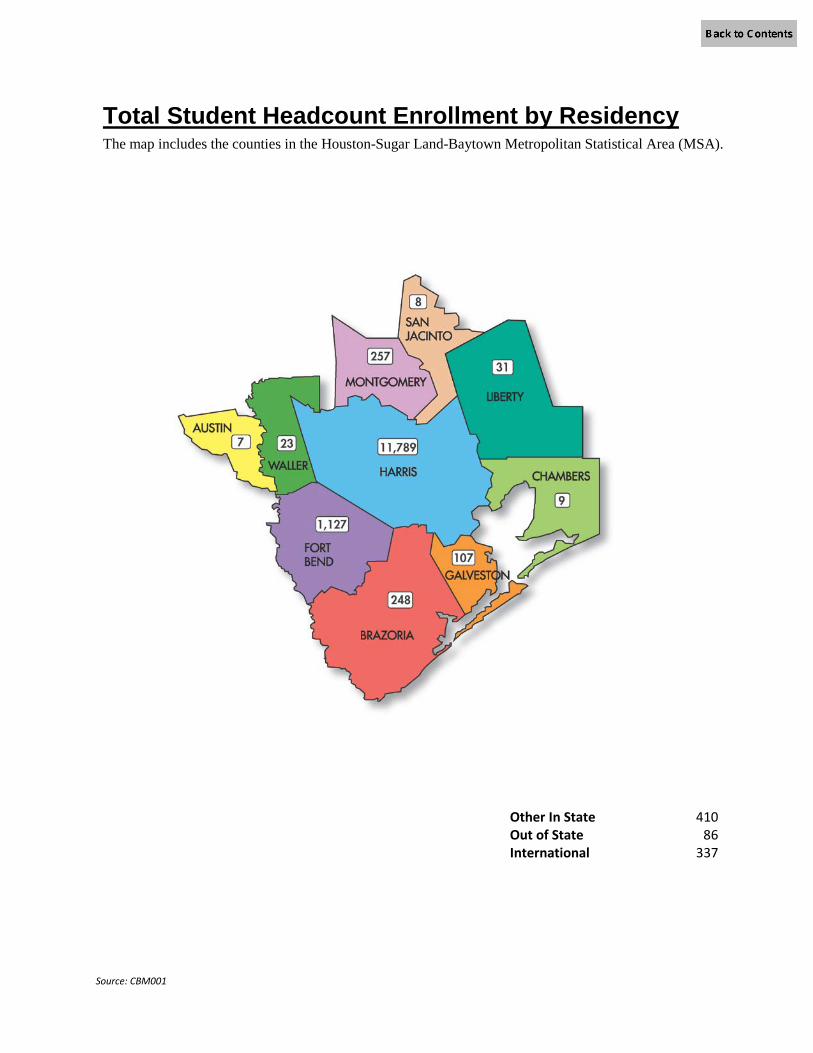
Total Student Headcount Enrollment by Residency The map includes the counties in the Houston-Sugar Land-Baytown Metropolitan Statistical Area (MSA).
Other In State 410 Out of State 86 International 337
Source: CBM001

Texas County # States* # Country #Harris 11,789 Louisiana 10 Vietnam 42Fort Bend 1,127 California 7 Angola 27Montgomery 257 Illinois 6 Nepal 26Brazoria 248 Oklahoma 6 China 21Galveston 107 Florida 4 Pakistan 21Houston 95 Pennsylvania 4 Kazakhstan 17Travis 33 Maryland 3 India 14Liberty 31 New York 3 Mexico 14Dallas 25 Tennessee 3 Nigeria 11Bexar 24 Wisconsin 3 Venezuela 9
Total number of Texas counties represented: 80
Total number of states represented (including Texas): 28
Total number of other countries represented: 62
Source: CBM001
* The states listing includes only those students who have an out of state residency. Texas students are included in the county breakdown.
Top Counties, States and Countries of Origin

First Time in College (FTIC)1 Fall 2010 Fall 2011 Fall 2012 Fall 2013 Fall 2014
# of Applications Received 2,485 2,883 4,194 3,096 3,235# of Applications Accepted 2,480 2,794 3,837 2,944 2,723% Accepted (Acceptance Rate) 99.8% 96.9% 91.5% 95.1% 84.2%
# Accepted who enrolled as of 12th Day 1,114 1,138 1,442 1,130 993% Enrolled (Yield Rate) 44.9% 40.7% 37.6% 38.4% 36.5%
Transfer2 Fall 2010 Fall 2011 Fall 2012 Fall 2013 Fall 2014
# of New Transfer Applications Received 3,052 2,829 3,236 3,565 3,631# of Applications Accepted 3,051 2,820 3,232 3,538 3,589% Accepted (Acceptance Rate) 100.0% 99.7% 99.9% 99.2% 98.8%
# Accepted who enrolled as of 12th Day 1,990 1,898 2,211 2,201 2,368% Enrolled (Yield Rate) 65.2% 67.3% 68.4% 62.2% 66.0%
Sources: CBM001 and CBM00B1 FTIC includes those who began in the summer and continued in the fall2 Transfer excludes Post Baccalaureate and beginning in 2010 only includes degree-seeking applicants and studentsNote: Starting in Fall 2013, the FTIC applications received and accepted, include only those applying for fall and those who started in summer and continued in the fall to align with Common Data Set definitions.
Undergraduate Applications Received, Accepted & Enrolled
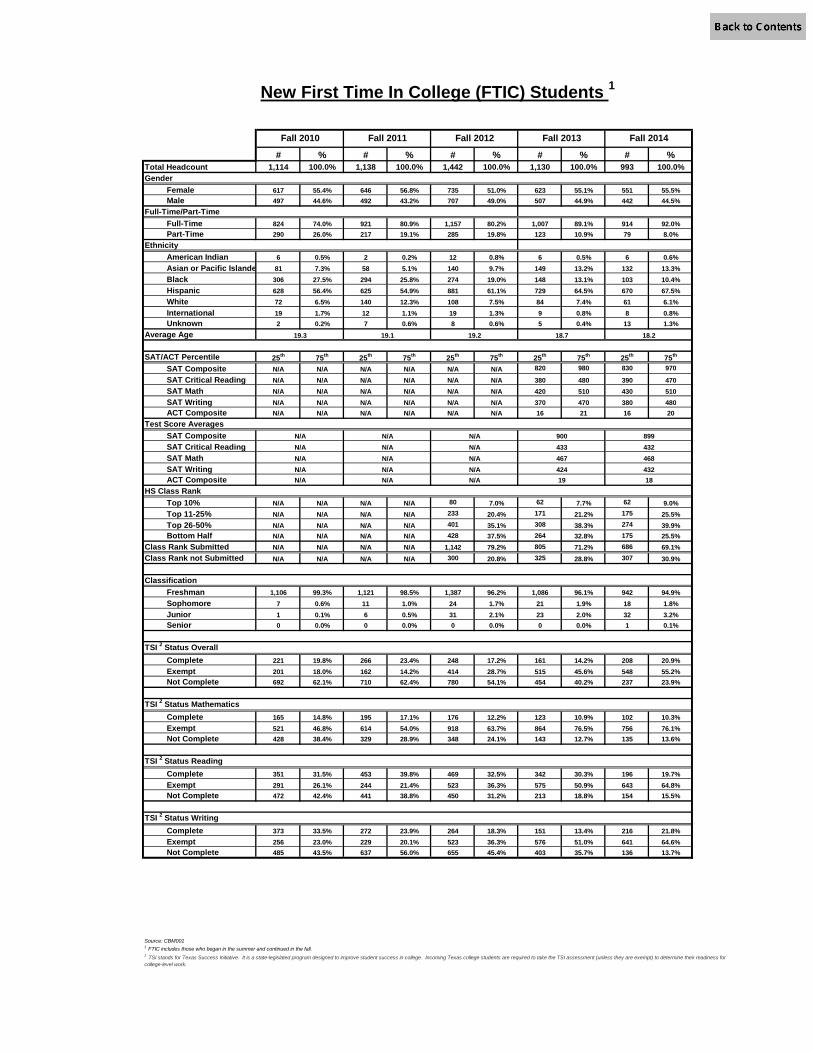
# % # % # % # % # %Total Headcount 1,114 100.0% 1,138 100.0% 1,442 100.0% 1,130 100.0% 993 100.0%Gender
Female 617 55.4% 646 56.8% 735 51.0% 623 55.1% 551 55.5%Male 497 44.6% 492 43.2% 707 49.0% 507 44.9% 442 44.5%
Full-Time/Part-TimeFull-Time 824 74.0% 921 80.9% 1,157 80.2% 1,007 89.1% 914 92.0%Part-Time 290 26.0% 217 19.1% 285 19.8% 123 10.9% 79 8.0%
EthnicityAmerican Indian 6 0.5% 2 0.2% 12 0.8% 6 0.5% 6 0.6%Asian or Pacific Islande 81 7.3% 58 5.1% 140 9.7% 149 13.2% 132 13.3%Black 306 27.5% 294 25.8% 274 19.0% 148 13.1% 103 10.4%Hispanic 628 56.4% 625 54.9% 881 61.1% 729 64.5% 670 67.5%White 72 6.5% 140 12.3% 108 7.5% 84 7.4% 61 6.1%International 19 1.7% 12 1.1% 19 1.3% 9 0.8% 8 0.8%Unknown 2 0.2% 7 0.6% 8 0.6% 5 0.4% 13 1.3%
Average Age
SAT/ACT Percentile 25th 75th 25th 75th 25th 75th 25th 75th 25th 75th
SAT Composite N/A N/A N/A N/A N/A N/A 820 980 830 970
SAT Critical Reading N/A N/A N/A N/A N/A N/A 380 480 390 470SAT Math N/A N/A N/A N/A N/A N/A 420 510 430 510SAT Writing N/A N/A N/A N/A N/A N/A 370 470 380 480ACT Composite N/A N/A N/A N/A N/A N/A 16 21 16 20
Test Score AveragesSAT CompositeSAT Critical ReadingSAT MathSAT WritingACT Composite
HS Class RankTop 10% N/A N/A N/A N/A 80 7.0% 62 7.7% 62 9.0%Top 11-25% N/A N/A N/A N/A 233 20.4% 171 21.2% 175 25.5%Top 26-50% N/A N/A N/A N/A 401 35.1% 308 38.3% 274 39.9%Bottom Half N/A N/A N/A N/A 428 37.5% 264 32.8% 175 25.5%
Class Rank Submitted N/A N/A N/A N/A 1,142 79.2% 805 71.2% 686 69.1%Class Rank not Submitted N/A N/A N/A N/A 300 20.8% 325 28.8% 307 30.9%
ClassificationFreshman 1,106 99.3% 1,121 98.5% 1,387 96.2% 1,086 96.1% 942 94.9%Sophomore 7 0.6% 11 1.0% 24 1.7% 21 1.9% 18 1.8%Junior 1 0.1% 6 0.5% 31 2.1% 23 2.0% 32 3.2%Senior 0 0.0% 0 0.0% 0 0.0% 0 0.0% 1 0.1%
TSI 2 Status OverallComplete 221 19.8% 266 23.4% 248 17.2% 161 14.2% 208 20.9%Exempt 201 18.0% 162 14.2% 414 28.7% 515 45.6% 548 55.2%Not Complete 692 62.1% 710 62.4% 780 54.1% 454 40.2% 237 23.9%
TSI 2 Status MathematicsComplete 165 14.8% 195 17.1% 176 12.2% 123 10.9% 102 10.3%Exempt 521 46.8% 614 54.0% 918 63.7% 864 76.5% 756 76.1%Not Complete 428 38.4% 329 28.9% 348 24.1% 143 12.7% 135 13.6%
TSI 2 Status ReadingComplete 351 31.5% 453 39.8% 469 32.5% 342 30.3% 196 19.7%Exempt 291 26.1% 244 21.4% 523 36.3% 575 50.9% 643 64.8%Not Complete 472 42.4% 441 38.8% 450 31.2% 213 18.8% 154 15.5%
TSI 2 Status WritingComplete 373 33.5% 272 23.9% 264 18.3% 151 13.4% 216 21.8%Exempt 256 23.0% 229 20.1% 523 36.3% 576 51.0% 641 64.6%Not Complete 485 43.5% 637 56.0% 655 45.4% 403 35.7% 136 13.7%
Source: CBM0011 FTIC includes those who began in the summer and continued in the fall.2 TSI stands for Texas Success Initiative. It is a state-legislated program designed to improve student success in college. Incoming Texas college students are required to take the TSI assessment (unless they are exempt) to determine their readiness for college-level work.
89943246843218
90043346742419
N/A
New First Time In College (FTIC) Students 1
19.3 18.7
Fall 2010 Fall 2014
18.219.2
Fall 2013Fall 2012
N/AN/AN/A N/A
N/AN/AN/A
N/A
Fall 2011
19.1
N/AN/AN/AN/A
N/AN/A
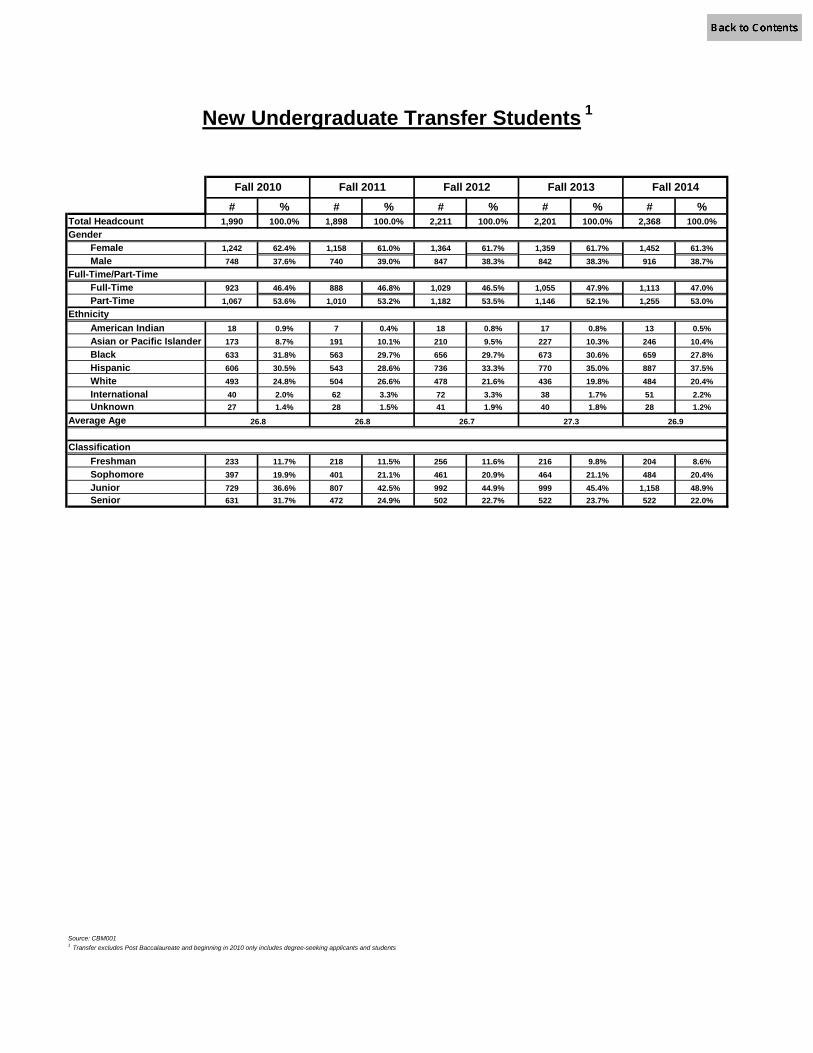
# % # % # % # % # %Total Headcount 1,990 100.0% 1,898 100.0% 2,211 100.0% 2,201 100.0% 2,368 100.0%Gender
Female 1,242 62.4% 1,158 61.0% 1,364 61.7% 1,359 61.7% 1,452 61.3%Male 748 37.6% 740 39.0% 847 38.3% 842 38.3% 916 38.7%
Full-Time/Part-TimeFull-Time 923 46.4% 888 46.8% 1,029 46.5% 1,055 47.9% 1,113 47.0%Part-Time 1,067 53.6% 1,010 53.2% 1,182 53.5% 1,146 52.1% 1,255 53.0%
EthnicityAmerican Indian 18 0.9% 7 0.4% 18 0.8% 17 0.8% 13 0.5%Asian or Pacific Islander 173 8.7% 191 10.1% 210 9.5% 227 10.3% 246 10.4%Black 633 31.8% 563 29.7% 656 29.7% 673 30.6% 659 27.8%Hispanic 606 30.5% 543 28.6% 736 33.3% 770 35.0% 887 37.5%White 493 24.8% 504 26.6% 478 21.6% 436 19.8% 484 20.4%International 40 2.0% 62 3.3% 72 3.3% 38 1.7% 51 2.2%Unknown 27 1.4% 28 1.5% 41 1.9% 40 1.8% 28 1.2%
Average Age
ClassificationFreshman 233 11.7% 218 11.5% 256 11.6% 216 9.8% 204 8.6%Sophomore 397 19.9% 401 21.1% 461 20.9% 464 21.1% 484 20.4%Junior 729 36.6% 807 42.5% 992 44.9% 999 45.4% 1,158 48.9%Senior 631 31.7% 472 24.9% 502 22.7% 522 23.7% 522 22.0%
Source: CBM0011 Transfer excludes Post Baccalaureate and beginning in 2010 only includes degree-seeking applicants and students
New Undergraduate Transfer Students 1
Fall 2010
27.3 26.9
Fall 2011 Fall 2012 Fall 2013 Fall 2014
26.8 26.8 26.7
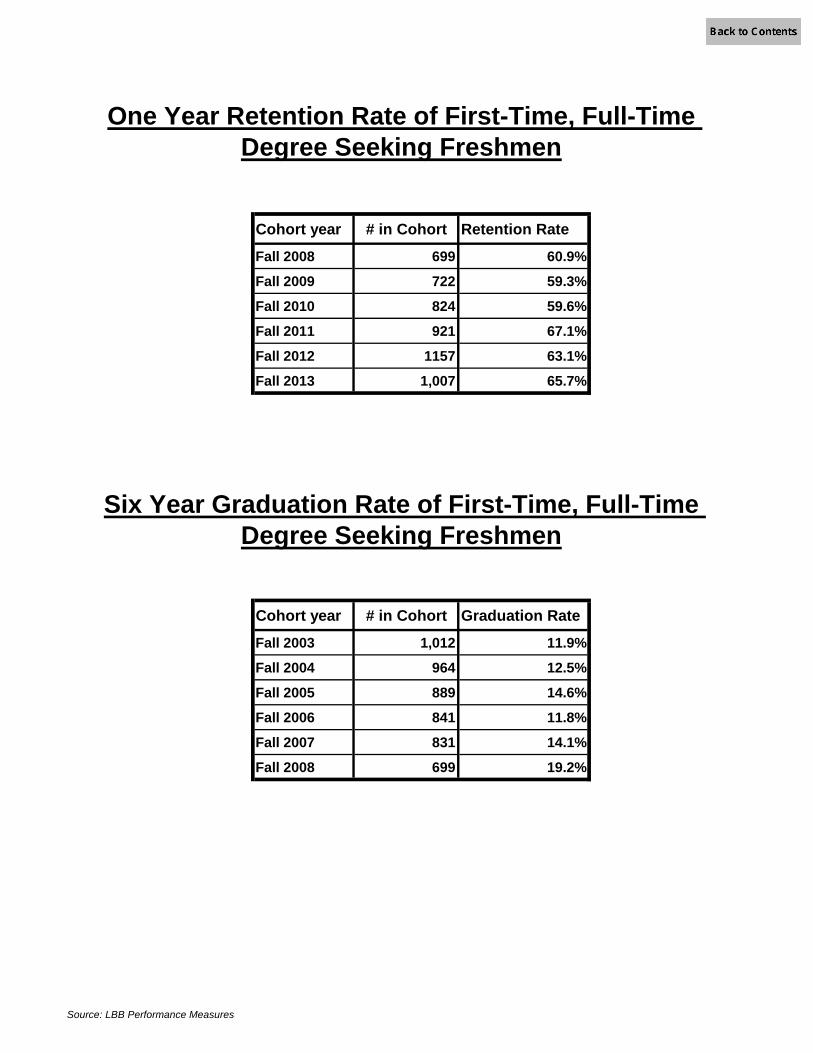
Source: LBB Performance Measures
Cohort year # in Cohort Retention Rate
Fall 2008 699 60.9%
Fall 2009 722 59.3%
Fall 2010 824 59.6%
Fall 2011 921 67.1%
Fall 2012 1157 63.1%
Fall 2013 1,007 65.7%
Cohort year # in Cohort Graduation Rate
Fall 2003 1,012 11.9%
Fall 2004 964 12.5%
Fall 2005 889 14.6%
Fall 2006 841 11.8%
Fall 2007 831 14.1%
Fall 2008 699 19.2%
One Year Retention Rate of First-Time, Full-Time Degree Seeking Freshmen
Six Year Graduation Rate of First-Time, Full-Time Degree Seeking Freshmen

Sources: CBM004, Common Data Set
Undergraduate All Classes
Fall 2010 26.3 26.1
Fall 2011 26.8 26.7
Fall 2012 27.5 27.3
Fall 2013 27.1 26.9
Fall 2014 27.3 27.1
Year RatioFall 2010 20 to 1
Fall 2011 20 to 1
Fall 2012 20 to 1
Fall 2013 21 to 1
Fall 2014 22 to 1
Average Class Size
Student to Faculty Ratio(based on FTE students and FTE faculty)
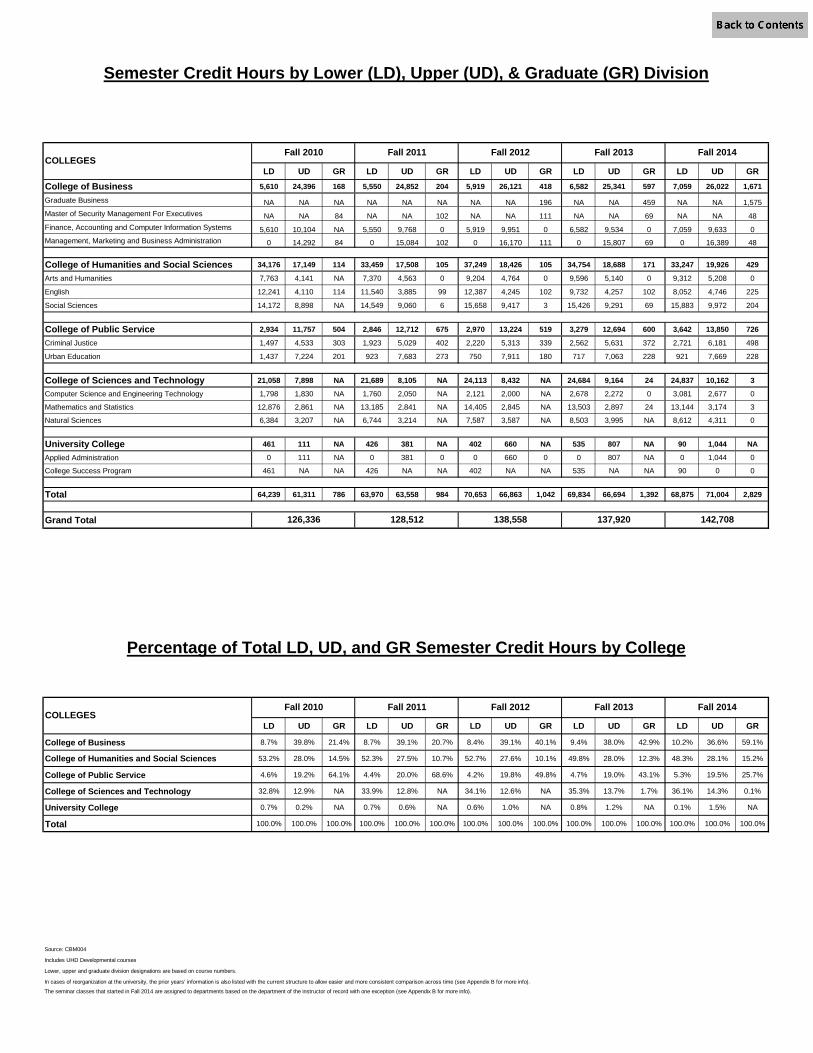
LD UD GR LD UD GR LD UD GR LD UD GR LD UD GR
College of Business 5,610 24,396 168 5,550 24,852 204 5,919 26,121 418 6,582 25,341 597 7,059 26,022 1,671
Graduate Business NA NA NA NA NA NA NA NA 196 NA NA 459 NA NA 1,575Master of Security Management For Executives NA NA 84 NA NA 102 NA NA 111 NA NA 69 NA NA 48Finance, Accounting and Computer Information Systems 5,610 10,104 NA 5,550 9,768 0 5,919 9,951 0 6,582 9,534 0 7,059 9,633 0Management, Marketing and Business Administration 0 14,292 84 0 15,084 102 0 16,170 111 0 15,807 69 0 16,389 48
College of Humanities and Social Sciences 34,176 17,149 114 33,459 17,508 105 37,249 18,426 105 34,754 18,688 171 33,247 19,926 429
Arts and Humanities 7,763 4,141 NA 7,370 4,563 0 9,204 4,764 0 9,596 5,140 0 9,312 5,208 0
English 12,241 4,110 114 11,540 3,885 99 12,387 4,245 102 9,732 4,257 102 8,052 4,746 225
Social Sciences 14,172 8,898 NA 14,549 9,060 6 15,658 9,417 3 15,426 9,291 69 15,883 9,972 204
College of Public Service 2,934 11,757 504 2,846 12,712 675 2,970 13,224 519 3,279 12,694 600 3,642 13,850 726
Criminal Justice 1,497 4,533 303 1,923 5,029 402 2,220 5,313 339 2,562 5,631 372 2,721 6,181 498
Urban Education 1,437 7,224 201 923 7,683 273 750 7,911 180 717 7,063 228 921 7,669 228
College of Sciences and Technology 21,058 7,898 NA 21,689 8,105 NA 24,113 8,432 NA 24,684 9,164 24 24,837 10,162 3
Computer Science and Engineering Technology 1,798 1,830 NA 1,760 2,050 NA 2,121 2,000 NA 2,678 2,272 0 3,081 2,677 0
Mathematics and Statistics 12,876 2,861 NA 13,185 2,841 NA 14,405 2,845 NA 13,503 2,897 24 13,144 3,174 3
Natural Sciences 6,384 3,207 NA 6,744 3,214 NA 7,587 3,587 NA 8,503 3,995 NA 8,612 4,311 0
University College 461 111 NA 426 381 NA 402 660 NA 535 807 NA 90 1,044 NA
Applied Administration 0 111 NA 0 381 0 0 660 0 0 807 NA 0 1,044 0
College Success Program 461 NA NA 426 NA NA 402 NA NA 535 NA NA 90 0 0
Total 64,239 61,311 786 63,970 63,558 984 70,653 66,863 1,042 69,834 66,694 1,392 68,875 71,004 2,829
Grand Total
LD UD GR LD UD GR LD UD GR LD UD GR LD UD GR
College of Business 8.7% 39.8% 21.4% 8.7% 39.1% 20.7% 8.4% 39.1% 40.1% 9.4% 38.0% 42.9% 10.2% 36.6% 59.1%
College of Humanities and Social Sciences 53.2% 28.0% 14.5% 52.3% 27.5% 10.7% 52.7% 27.6% 10.1% 49.8% 28.0% 12.3% 48.3% 28.1% 15.2%
College of Public Service 4.6% 19.2% 64.1% 4.4% 20.0% 68.6% 4.2% 19.8% 49.8% 4.7% 19.0% 43.1% 5.3% 19.5% 25.7%
College of Sciences and Technology 32.8% 12.9% NA 33.9% 12.8% NA 34.1% 12.6% NA 35.3% 13.7% 1.7% 36.1% 14.3% 0.1%
University College 0.7% 0.2% NA 0.7% 0.6% NA 0.6% 1.0% NA 0.8% 1.2% NA 0.1% 1.5% NA
Total 100.0% 100.0% 100.0% 100.0% 100.0% 100.0% 100.0% 100.0% 100.0% 100.0% 100.0% 100.0% 100.0% 100.0% 100.0%
Source: CBM004
Includes UHD Developmental courses
Lower, upper and graduate division designations are based on course numbers.
In cases of reorganization at the university, the prior years’ information is also listed with the current structure to allow easier and more consistent comparison across time (see Appendix B for more info).
The seminar classes that started in Fall 2014 are assigned to departments based on the department of the instructor of record with one exception (see Appendix B for more info).
Semester Credit Hours by Lower (LD), Upper (UD), & Graduate (GR) Division
Fall 2014
142,708
Fall 2014
126,336
COLLEGES
COLLEGES
Fall 2013
137,920
Fall 2013Fall 2012Fall 2011
Fall 2010
Fall 2010
Fall 2011
128,512
Fall 2012
138,558
Percentage of Total LD, UD, and GR Semester Credit Hours by College
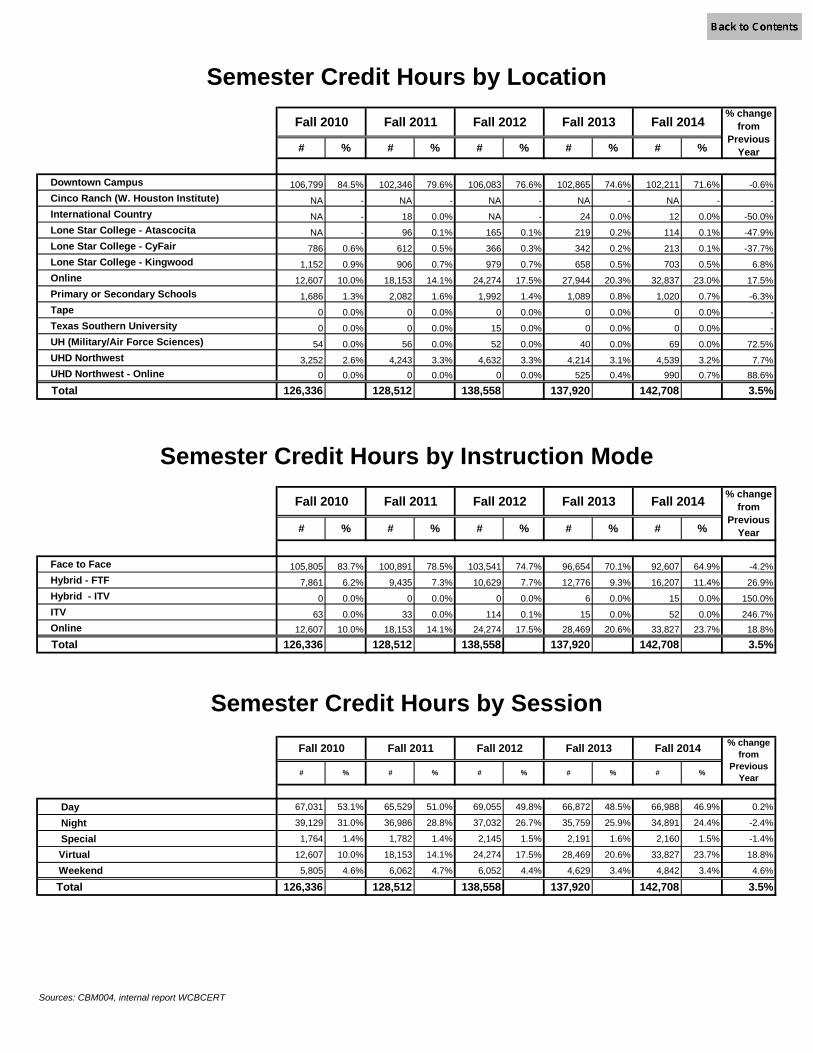
# % # % # % # % # %
Downtown Campus 106,799 84.5% 102,346 79.6% 106,083 76.6% 102,865 74.6% 102,211 71.6% -0.6% Cinco Ranch (W. Houston Institute) NA - NA - NA - NA - NA - - International Country NA - 18 0.0% NA - 24 0.0% 12 0.0% -50.0% Lone Star College - Atascocita NA - 96 0.1% 165 0.1% 219 0.2% 114 0.1% -47.9% Lone Star College - CyFair 786 0.6% 612 0.5% 366 0.3% 342 0.2% 213 0.1% -37.7% Lone Star College - Kingwood 1,152 0.9% 906 0.7% 979 0.7% 658 0.5% 703 0.5% 6.8% Online 12,607 10.0% 18,153 14.1% 24,274 17.5% 27,944 20.3% 32,837 23.0% 17.5% Primary or Secondary Schools 1,686 1.3% 2,082 1.6% 1,992 1.4% 1,089 0.8% 1,020 0.7% -6.3% Tape 0 0.0% 0 0.0% 0 0.0% 0 0.0% 0 0.0% - Texas Southern University 0 0.0% 0 0.0% 15 0.0% 0 0.0% 0 0.0% - UH (Military/Air Force Sciences) 54 0.0% 56 0.0% 52 0.0% 40 0.0% 69 0.0% 72.5% UHD Northwest 3,252 2.6% 4,243 3.3% 4,632 3.3% 4,214 3.1% 4,539 3.2% 7.7% UHD Northwest - Online 0 0.0% 0 0.0% 0 0.0% 525 0.4% 990 0.7% 88.6%
Total 126,336 128,512 138,558 137,920 142,708 3.5%
# % # % # % # % # %
Face to Face 105,805 83.7% 100,891 78.5% 103,541 74.7% 96,654 70.1% 92,607 64.9% -4.2% Hybrid - FTF 7,861 6.2% 9,435 7.3% 10,629 7.7% 12,776 9.3% 16,207 11.4% 26.9% Hybrid - ITV 0 0.0% 0 0.0% 0 0.0% 6 0.0% 15 0.0% 150.0% ITV 63 0.0% 33 0.0% 114 0.1% 15 0.0% 52 0.0% 246.7% Online 12,607 10.0% 18,153 14.1% 24,274 17.5% 28,469 20.6% 33,827 23.7% 18.8%
Total 126,336 128,512 138,558 137,920 142,708 3.5%
# % # % # % # % # %
Day 67,031 53.1% 65,529 51.0% 69,055 49.8% 66,872 48.5% 66,988 46.9% 0.2%
Night 39,129 31.0% 36,986 28.8% 37,032 26.7% 35,759 25.9% 34,891 24.4% -2.4%
Special 1,764 1.4% 1,782 1.4% 2,145 1.5% 2,191 1.6% 2,160 1.5% -1.4%
Virtual 12,607 10.0% 18,153 14.1% 24,274 17.5% 28,469 20.6% 33,827 23.7% 18.8%
Weekend 5,805 4.6% 6,062 4.7% 6,052 4.4% 4,629 3.4% 4,842 3.4% 4.6%
Total 126,336 128,512 138,558 137,920 142,708 3.5%
Sources: CBM004, internal report WCBCERT
Fall 2014
Fall 2014
Fall 2014
Fall 2013
Fall 2013
Fall 2010 Fall 2011 Fall 2012
Fall 2010 Fall 2011 Fall 2012
Semester Credit Hours by Location
Semester Credit Hours by Instruction Mode
Semester Credit Hours by SessionFall 2010 Fall 2011 Fall 2012 Fall 2013 % change
from Previous
Year
% change from
Previous Year
% change from
Previous Year
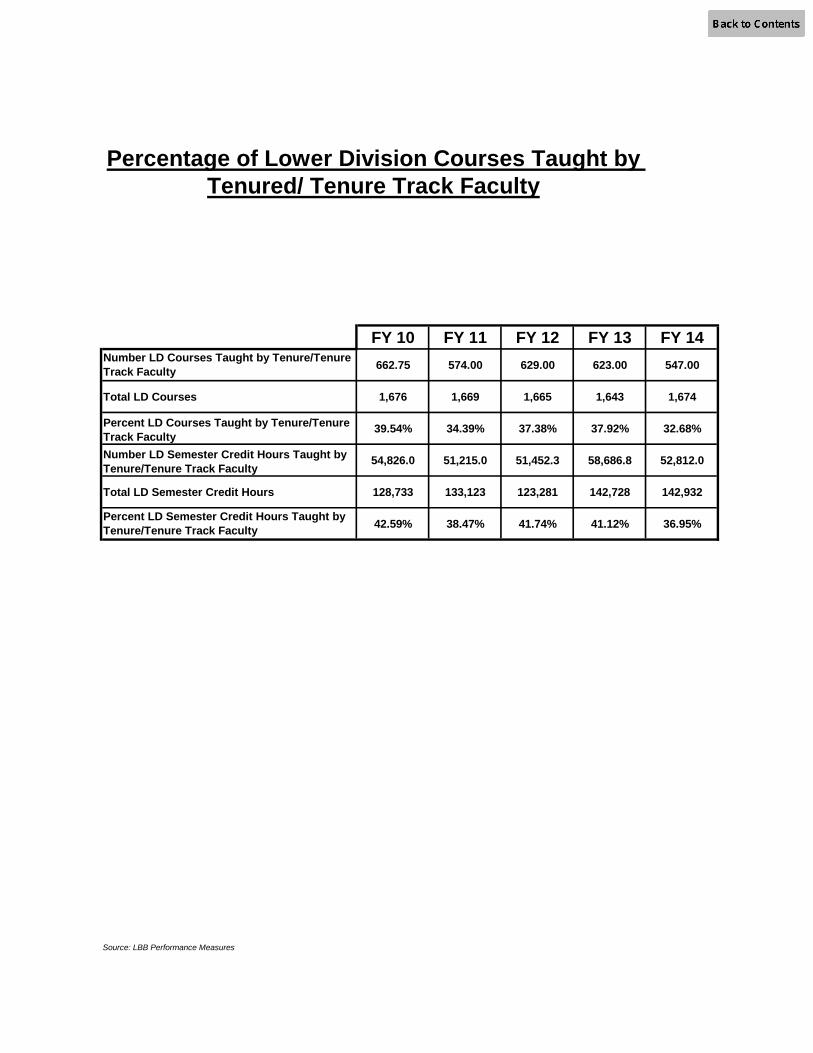
FY 10 FY 11 FY 12 FY 13 FY 14662.75 574.00 629.00 623.00 547.00
Total LD Courses 1,676 1,669 1,665 1,643 1,674
39.54% 34.39% 37.38% 37.92% 32.68%
54,826.0 51,215.0 51,452.3 58,686.8 52,812.0
Total LD Semester Credit Hours 128,733 133,123 123,281 142,728 142,932
42.59% 38.47% 41.74% 41.12% 36.95%
Source: LBB Performance Measures
Percentage of Lower Division Courses Taught by Tenured/ Tenure Track Faculty
Number LD Courses Taught by Tenure/Tenure Track Faculty
Percent LD Courses Taught by Tenure/Tenure Track FacultyNumber LD Semester Credit Hours Taught by Tenure/Tenure Track Faculty
Percent LD Semester Credit Hours Taught by Tenure/Tenure Track Faculty

Fall 2010 Fall 2011 Fall 2012 Fall 2013 Fall 2014
TENURE STATUS LD UD GR TOTAL LD UD GR TOTAL LD UD GR TOTAL LD UD GR TOTAL LD UD GR TOTAL
TENURED/TENURE-TRACK 23,096 36,868 681 60,645 25,969 36,325 831 63,125 27,422 37,255 898 65,575 25,620 36,300 1,185 63,105 21674 34453 2400 58527NON- T/TT: FULL-TIME 10,164 9,589 78 19,831 10,718 8,509 96 19,323 15,615 9,420 105 25,140 15,992 10,722 0 26,714 21463 14952 66 36481NON- T/TT: PART-TIME 30,979 14,854 27 45,860 27,283 18,724 57 46,064 27,616 20,188 39 47,843 28,222 19,672 207 48,101 25739 21599 363 47701
TOTAL SCH 64,239 61,311 786 126,336 63,970 63,558 984 128,512 70,653 66,863 1,042 138,558 69,834 66,694 1,392 137,920 68,875 71,004 2,829 142,708
% BY TENURED/TENURE-TRACK 36% 60% 87% 48% 41% 57% 84% 49% 39% 56% 86% 47% 37% 54% 85% 46% 31% 49% 85% 41%% BY N-T/TT: FULL-TIME 16% 16% 10% 16% 17% 13% 10% 15% 22% 14% 10% 18% 23% 16% 0% 19% 31% 21% 2% 26%% BY N-T/TT: PART-TIME 48% 24% 3% 36% 43% 29% 6% 36% 39% 30% 4% 35% 40% 29% 15% 35% 37% 30% 13% 33%
Fall 2010 Fall 2011 Fall 2012 Fall 2013 Fall 2014LD UD GR TOTAL LD UD GR TOTAL LD UD GR TOTAL LD UD GR TOTAL LD UD GR TOTAL
COLLEGE OF BUSINESS 5,610 24,396 168 30,174 5,550 24,852 204 30,606 5,919 26,121 418 32,458 6,582 25,341 597 32,520 7,059 26,022 1,671 34,752
TENURED/TENURE-TRACK 1,596 14,955 84 16,635 1,776 13,512 102 15,390 1,812 14,493 307 16,612 1,653 12,714 459 14,826 1,287 11,043 1,461 13,791NON- T/TT: FULL-TIME 2,790 5,157 57 8,004 1,320 4,146 45 5,511 1,839 3,732 78 5,649 2,496 4,299 0 6,795 2,694 6,684 48 9,426NON- T/TT: PART-TIME 1,224 4,284 27 5,535 2,454 7,194 57 9,705 2,268 7,896 33 10,197 2,433 8,328 138 10,899 3,078 8,295 162 11,535
% BY TENURED/TENURE-TRACK 28% 61% 50% 55% 32% 54% 50% 50% 31% 55% 73% 51% 25% 50% 77% 46% 18% 42% 87% 40%% BY N-T/TT: FULL-TIME 50% 21% 34% 27% 24% 17% 22% 18% 31% 14% 19% 17% 38% 17% 0% 21% 38% 26% 3% 27%% BY N-T/TT: PART-TIME 22% 18% 16% 18% 44% 29% 28% 32% 38% 30% 8% 31% 37% 33% 23% 34% 44% 32% 10% 33%
COLLEGE OF HUMANITIES & SOCIAL SCIENCES 34,176 17,149 114 51,439 33,459 17,508 105 51,072 37,249 18,426 105 55,780 34,754 18,688 171 53,613 33,247 19,926 429 53,602
TENURED/TENURE-TRACK 12,234 10,164 114 22,512 13,345 9,252 105 22,702 14,025 9,876 105 24,006 13,178 9,969 102 23,249 10,557 9,723 228 20,508NON- T/TT: FULL-TIME 2,655 888 0 3,543 2,937 1,146 0 4,083 7,836 2,241 0 10,077 5,997 2,769 0 8,766 9,411 4,437 0 13,848NON- T/TT: PART-TIME 19,287 6,097 0 25,384 17,177 7,110 0 24,287 15,388 6,309 0 21,697 15,579 5,950 69 21,598 13,279 5,766 201 19,246
% BY TENURED/TENURE-TRACK 36% 59% 100% 44% 40% 53% 100% 44% 38% 54% 100% 43% 38% 53% 60% 43% 32% 49% 53% 38%% BY N-T/TT: FULL-TIME 8% 5% 0% 7% 9% 7% 0% 8% 21% 12% 0% 18% 17% 15% 0% 16% 28% 22% 0% 26%% BY N-T/TT: PART-TIME 56% 36% 0% 49% 51% 41% 0% 48% 41% 34% 0% 39% 45% 32% 40% 40% 40% 29% 47% 36%
COLLEGE OF PUBLIC SERVICE 2,934 11,757 504 15,195 2,846 12,712 675 16,233 2,970 13,224 519 16,713 3,279 12,694 600 16,573 3,642 13,850 726 18,218
TENURED/TENURE-TRACK 1,572 6,117 483 8,172 1,647 7,597 624 9,868 2,112 6,774 486 9,372 1,710 7,366 600 9,676 1,371 7,219 708 9,298NON- T/TT: FULL-TIME 552 2,499 21 3,072 600 2,004 51 2,655 105 2,178 27 2,310 462 1,710 0 2,172 459 1,597 18 2,074NON- T/TT: PART-TIME 810 3,141 0 3,951 599 3,111 0 3,710 753 4,272 6 5,031 1,107 3,618 0 4,725 1,812 5,034 0 6,846
% BY TENURED/TENURE-TRACK 54% 52% 96% 54% 58% 60% 92% 61% 71% 51% 94% 56% 52% 58% 100% 58% 38% 52% 98% 51%% BY N-T/TT: FULL-TIME 19% 21% 4% 20% 21% 16% 8% 16% 4% 16% 5% 14% 14% 13% 0% 13% 13% 12% 2% 11%% BY N-T/TT: PART-TIME 28% 27% 0% 26% 21% 24% 0% 23% 25% 32% 1% 30% 34% 29% 0% 29% 50% 36% 0% 38%
COLLEGE OF SCIENCES AND TECHNOLOGY 21,058 7,898 N/A 28,956 21,689 8,105 N/A 29,794 24,113 8,432 N/A 32,545 24,684 9,164 24 33,872 24,837 10,162 3 35,002
TENURED/TENURE-TRACK 7,694 5,632 N/A 13,326 9,177 5,964 N/A 15,141 9,473 6,112 N/A 15,585 9,050 6,251 24 15,325 8,368.5 6,468 3 14,839.5NON- T/TT: FULL-TIME 4,096 955 N/A 5,051 5,742 1,042 N/A 6,784 5,744 1,041 N/A 6,785 6,862 1,551 0 8,413 8,899.0 1,355 0 10,254.0NON- T/TT: PART-TIME 9,268 1,311 N/A 10,579 6,770 1,099 N/A 7,869 8,896 1,279 N/A 10,175 8,772 1,362 0 10,134 7,569.5 2,339 0 9,908.5
% BY TENURED/TENURE-TRACK 37% 71% N/A 46% 42% 74% N/A 51% 39% 72% N/A 48% 37% 68% 100% 45% 34% 64% 100% 42%% BY N-T/TT: FULL-TIME 19% 12% N/A 17% 26% 13% N/A 23% 24% 12% N/A 21% 28% 17% 0% 25% 36% 13% 0% 29%% BY N-T/TT: PART-TIME 44% 17% N/A 37% 31% 14% N/A 26% 37% 15% N/A 31% 36% 15% 0% 30% 30% 23% 0% 28%
UNIVERSITY COLLEGE 461 111 N/A 572 426 381 N/A 807 402 660 N/A 1,062 535 807 N/A 1,342 90 1,044 N/A 1,134
TENURED/TENURE-TRACK 0 0 N/A 0 24 0 N/A 24 0 0 N/A 0 29 0 N/A 29 90 0 0 90NON- T/TT: FULL-TIME 71 90 N/A 161 119 171 N/A 290 91 228 N/A 319 175 393 N/A 568 0 879 0 879NON- T/TT: PART-TIME 390 21 N/A 411 283 210 N/A 493 311 432 N/A 743 331 414 N/A 745 0 165 0 165
% BY TENURED/TENURE-TRACK 0% 0% N/A 0% 6% 0% N/A 3% 0% 0% N/A 0% 5% 0% N/A 2% 100% 0% N/A 8%% BY N-T/TT: FULL-TIME 15% 81% N/A 28% 28% 45% N/A 36% 23% 35% N/A 30% 33% 49% N/A 42% 0% 84% N/A 78%% BY N-T/TT: PART-TIME 85% 19% N/A 72% 66% 55% N/A 61% 77% 65% N/A 70% 62% 51% N/A 56% 0% 16% N/A 15%
Sources: CBM004 & CBM008Includes UHD Developmental coursesLower, upper and graduate division designations are based on course numbers.In cases of reorganization at the university, the prior years’ information is also listed with the current structure to allow easier and more consistent comparison across time (see Appendix B for more info).The seminar classes that started in Fall 2014 are assigned to departments based on the department of the instructor of record with one exception (see Appendix B for more info).
SEMESTER CREDIT HOURS TAUGHT BY TENURE STATUS (UNIVERSITY-WIDE)
SEMESTER CREDIT HOURS TAUGHT BY TENURE STATUS BY COLLEGES
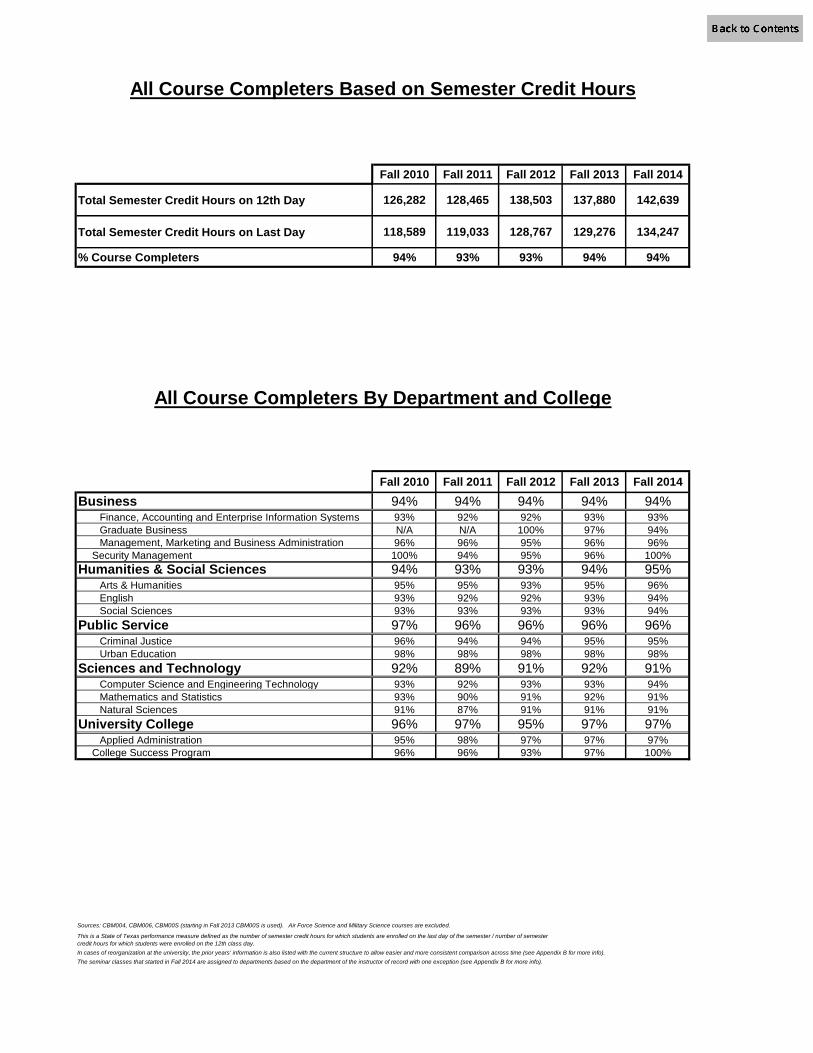
Fall 2010 Fall 2011 Fall 2012 Fall 2013 Fall 2014
Total Semester Credit Hours on 12th Day 126,282 128,465 138,503 137,880 142,639
Total Semester Credit Hours on Last Day 118,589 119,033 128,767 129,276 134,247
% Course Completers 94% 93% 93% 94% 94%
Fall 2010 Fall 2011 Fall 2012 Fall 2013 Fall 2014Business 94% 94% 94% 94% 94%
Finance, Accounting and Enterprise Information Systems 93% 92% 92% 93% 93%Graduate Business N/A N/A 100% 97% 94%Management, Marketing and Business Administration 96% 96% 95% 96% 96%
Security Management 100% 94% 95% 96% 100%Humanities & Social Sciences 94% 93% 93% 94% 95%
Arts & Humanities 95% 95% 93% 95% 96%English 93% 92% 92% 93% 94%Social Sciences 93% 93% 93% 93% 94%
Public Service 97% 96% 96% 96% 96%Criminal Justice 96% 94% 94% 95% 95%Urban Education 98% 98% 98% 98% 98%
Sciences and Technology 92% 89% 91% 92% 91%Computer Science and Engineering Technology 93% 92% 93% 93% 94%Mathematics and Statistics 93% 90% 91% 92% 91%Natural Sciences 91% 87% 91% 91% 91%
University College 96% 97% 95% 97% 97%Applied Administration 95% 98% 97% 97% 97%
College Success Program 96% 96% 93% 97% 100%
Sources: CBM004, CBM006, CBM00S (starting in Fall 2013 CBM00S is used). Air Force Science and Military Science courses are excluded.
In cases of reorganization at the university, the prior years’ information is also listed with the current structure to allow easier and more consistent comparison across time (see Appendix B for more info).The seminar classes that started in Fall 2014 are assigned to departments based on the department of the instructor of record with one exception (see Appendix B for more info).
This is a State of Texas performance measure defined as the number of semester credit hours for which students are enrolled on the last day of the semester / number of semester credit hours for which students were enrolled on the 12th class day.
All Course Completers Based on Semester Credit Hours
All Course Completers By Department and College
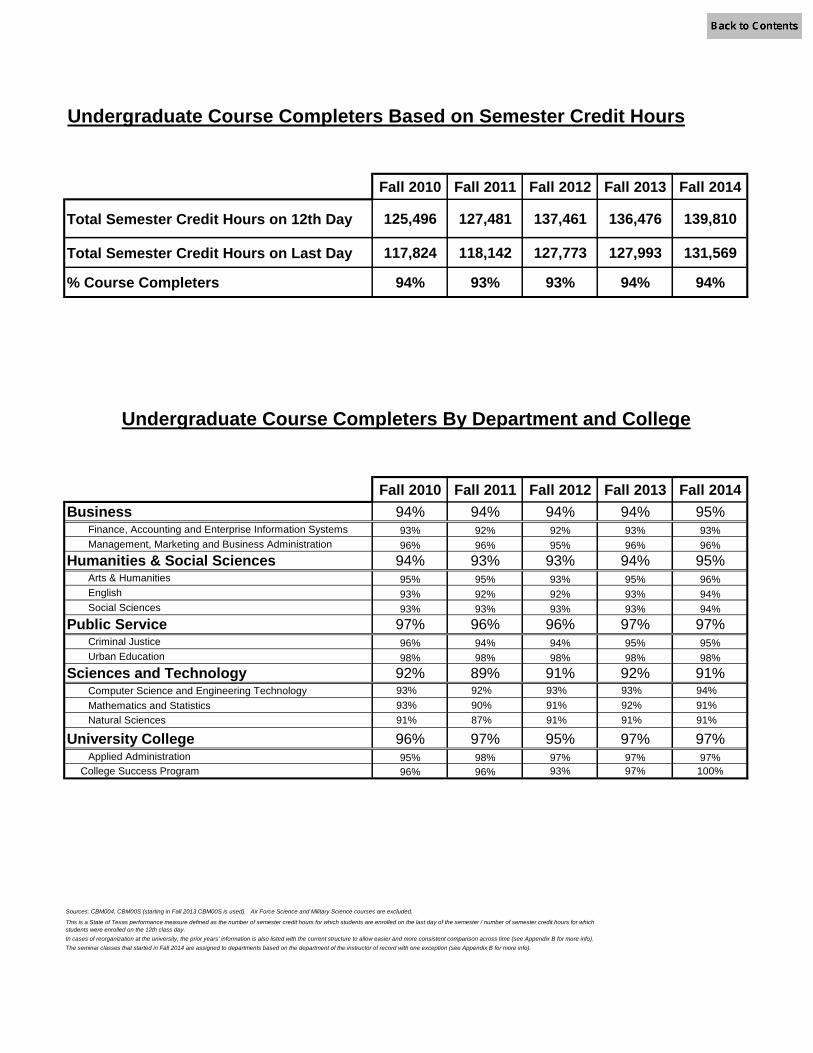
Undergraduate Course Completers Based on Semester Credit Hours
Fall 2010 Fall 2011 Fall 2012 Fall 2013 Fall 2014
Total Semester Credit Hours on 12th Day 125,496 127,481 137,461 136,476 139,810
Total Semester Credit Hours on Last Day 117,824 118,142 127,773 127,993 131,569
% Course Completers 94% 93% 93% 94% 94%
Fall 2010 Fall 2011 Fall 2012 Fall 2013 Fall 2014Business 94% 94% 94% 94% 95%
Finance, Accounting and Enterprise Information Systems 93% 92% 92% 93% 93%Management, Marketing and Business Administration 96% 96% 95% 96% 96%
Humanities & Social Sciences 94% 93% 93% 94% 95%Arts & Humanities 95% 95% 93% 95% 96%English 93% 92% 92% 93% 94%Social Sciences 93% 93% 93% 93% 94%
Public Service 97% 96% 96% 97% 97%Criminal Justice 96% 94% 94% 95% 95%Urban Education 98% 98% 98% 98% 98%
Sciences and Technology 92% 89% 91% 92% 91%Computer Science and Engineering Technology 93% 92% 93% 93% 94%Mathematics and Statistics 93% 90% 91% 92% 91%Natural Sciences 91% 87% 91% 91% 91%
University College 96% 97% 95% 97% 97%Applied Administration 95% 98% 97% 97% 97%
College Success Program 96% 96% 93% 97% 100%
Sources: CBM004, CBM00S (starting in Fall 2013 CBM00S is used). Air Force Science and Military Science courses are excluded.
In cases of reorganization at the university, the prior years’ information is also listed with the current structure to allow easier and more consistent comparison across time (see Appendix B for more info).The seminar classes that started in Fall 2014 are assigned to departments based on the department of the instructor of record with one exception (see Appendix B for more info).
This is a State of Texas performance measure defined as the number of semester credit hours for which students are enrolled on the last day of the semester / number of semester credit hours for which students were enrolled on the 12th class day.
Undergraduate Course Completers By Department and College

Fall 2010 Fall 2011 Fall 2012 Fall 2013 Fall 2014
Total Semester Credit Hours on 12th Day 786 984 1,042 1,392 2,829
Total Semester Credit Hours on Last Day 765 891 994 1,283 2,612
% Course Completers 97% 91% 95% 92% 92%
Fall 2010 Fall 2011 Fall 2012 Fall 2013 Fall 2014Business 100% 94% 97% 96% 94%
Finance, Accounting and Enterprise Information Systems NA NA NA NA NAGraduate Business NA NA 100% 97% 94%Management, Marketing and Business Administration 100% 94% 95% 96% 94%
Security Management 100% 94% 95% 96% 100%
Humanities & Social Sciences 95% 91% 97% 89% 83%Arts & Humanities NA NA NA NA NAEnglish 95% 91% 97% 91% 87%Social Sciences NA 100% 100% 87% 79%
Public Service 97% 89% 94% 91% 93%Criminal Justice 96% 89% 96% 95% 94%Urban Education 99% 90% 88% 83% 91%
Sciences and Technology NA NA NA 50% 100%Computer Science and Engineering Technology NA NA NA NA NAMathematics and Statistics NA NA NA 50% 100%Natural Sciences NA NA NA NA NA
University College NA NA NA NA NAApplied Administration NA NA NA NA NACollege Success Program NA NA NA NA NA
Sources: CBM004, CBM00S (starting in Fall 2013 CBM00S is used). Air Force Science and Military Science courses are excluded.
In cases of reorganization at the university, the prior years’ information is also listed with the current structure to allow easier and more consistent comparison across time (see Appendix B for more info).The seminar classes that started in Fall 2014 are assigned to departments based on the department of the instructor of record with one exception (see Appendix B for more info).
This is a State of Texas performance measure defined as the number of semester credit hours for which students are enrolled on the last day of the semester / number of semester credit hours for which students were enrolled on the 12th class day.
Graduate Course Completers Based on Semester Credit Hours
Graduate Course Completers By Department and College

# % # % # % # % # %
BACCALAUREATE DEGREES 2,359 100.0% 2,437 100.0% 2,351 100.0% 2,355 100.0% 2,339 100.0% -0.7%
COLLEGE OF BUSINESS 936 39.7% 984 40.4% 847 36.0% 874 37.1% 871 37.2% -0.3%
FINANCE, ACCOUNTING AND ENTERPRISE INFO. SYSTEMS 600 25.4% 636 26.1% 552 23.5% 545 23.1% 549 23.5% 0.7%BBA: ACCOUNTING 287 12.2% 297 12.2% 286 12.2% 267 11.3% 266 11.4% -0.4%BBA: COMPUTER INFORMATION SYSTEMS 1 63 2.7% 78 3.2% 62 2.6% 78 3.3% 37 1.6% -52.6%BBA: ENTERPRISE INFORMATION SYSTEMS 1 NA - NA - NA - 14 0.6% 50 2.1% 257.1%BBA: FINANCE 186 7.9% 194 8.0% 127 5.4% 126 5.4% 141 6.0% 11.9%BBA: INTERNATIONAL BUSINESS 64 2.7% 67 2.7% 77 3.3% 60 2.5% 55 2.4% -8.3%MANAGEMENT, MARKETING AND BUSINESS ADMINISTRATION 336 14.2% 348 14.3% 295 12.5% 329 14.0% 322 13.8% -2.1%BBA: ADMINISTRATIVE MANAGEMENT 2 1 0.0% 0 0.0% 0 0.0% 0 0.0% 0 0.0% -BBA: GENERAL BUSINESS 98 4.2% 97 4.0% 89 3.8% 82 3.5% 80 3.4% -2.4%BBA: INSURANCE & RISK MANAGEMENT NA - 3 0.1% 10 0.4% 9 0.4% 13 0.6% 44.4%BBA: MANAGEMENT 116 4.9% 143 5.9% 96 4.1% 111 4.7% 112 4.8% 0.9%BBA: MARKETING 74 3.1% 61 2.5% 60 2.6% 55 2.3% 40 1.7% -27.3%BBA: SUPPLY CHAIN MANAGEMENT 47 2.0% 44 1.8% 40 1.7% 72 3.1% 77 3.3% 6.9%
COLLEGE OF HUMANITIES AND SOCIAL SCIENCES 439 18.6% 455 18.7% 529 22.5% 468 19.9% 463 19.8% -1.1%
ARTS AND HUMANITIES 95 4.0% 100 4.1% 127 5.4% 121 5.1% 119 5.1% -1.7%BA: COMMUNICATION STUDIES 81 3.4% 74 3.0% 92 3.9% 91 3.9% 87 3.7% -4.4%BA: FINE ARTS 4 0.2% 7 0.3% 7 0.3% 15 0.6% 13 0.6% -13.3%BA: HUMANITIES 2 0.1% 7 0.3% 5 0.2% 2 0.1% 3 0.1% 50.0%BA: SPANISH 8 0.3% 12 0.5% 23 1.0% 13 0.6% 16 0.7% 23.1%ENGLISH 46 1.9% 43 1.8% 49 2.1% 39 1.7% 48 2.1% 23.1%BA: ENGLISH 33 1.4% 30 1.2% 36 1.5% 28 1.2% 31 1.3% 10.7%BS: PROFESSIONAL WRITING 13 0.6% 13 0.5% 13 0.6% 11 0.5% 17 0.7% 54.5%SOCIAL SCIENCES 298 12.6% 312 12.8% 353 15.0% 308 13.1% 296 12.7% -3.9%BA: HISTORY 27 1.1% 34 1.4% 20 0.9% 30 1.3% 33 1.4% 10.0%BA: PHILOSOPHY 7 0.3% 9 0.4% 11 0.5% 9 0.4% 5 0.2% -44.4%BS: POLITICAL SCIENCE 40 1.7% 39 1.6% 34 1.4% 39 1.7% 33 1.4% -15.4%BS: PSYCHOLOGY 156 6.6% 178 7.3% 231 9.8% 175 7.4% 180 7.7% 2.9%BA: SOCIAL SCIENCES 2 0.1% 3 0.1% 3 0.1% 1 0.0% 4 0.2% 300.0%BS: SOCIAL SCIENCES 29 1.2% 20 0.8% 19 0.8% 11 0.5% 16 0.7% 45.5%BS: SOCIOLOGY 37 1.6% 29 1.2% 35 1.5% 43 1.8% 25 1.1% -41.9%
COLLEGE OF PUBLIC SERVICE 415 17.6% 447 18.3% 486 20.7% 511 21.7% 456 19.5% -10.8%
CRIMINAL JUSTICE 183 7.8% 184 7.6% 242 10.3% 241 10.2% 252 10.8% 4.6%BAAS: CRIMINAL JUSTICE NA - NA - 3 0.1% 4 0.2% 11 0.5% 175.0%BS: CRIMINAL JUSTICE 183 7.8% 184 7.6% 223 9.5% 217 9.2% 210 9.0% -3.2%BSW: SOCIAL WORK NA - NA - 16 0.7% 20 0.8% 31 1.3% 55.0%URBAN EDUCATION 232 9.8% 263 10.8% 244 10.4% 270 11.5% 204 8.7% -24.4%BA: INTERDISCIPLINARY STUDIES (EDUCATION) 232 9.8% 263 10.8% 244 10.4% 270 11.5% 204 8.7% -24.4%
COLLEGE OF SCIENCES AND TECHNOLOGY 152 6.4% 195 8.0% 184 7.8% 175 7.4% 218 9.3% 24.6%
COMPUTER SCIENCE & ENGINEERING TECHNOLOGY 72 3.1% 83 3.4% 82 3.5% 69 2.9% 73 3.1% 5.8%BS: COMPUTER SCIENCE 26 1.1% 23 0.9% 21 0.9% 16 0.7% 18 0.8% 12.5%BSET: CONTROL & INSTRUMENTATION ENG. TECH. 11 0.5% 20 0.8% 9 0.4% 12 0.5% 18 0.8% 50.0%BSET: FIRE PROTECTION ENGINEERING TECHNOLOGY 2 8 0.3% 6 0.2% 6 0.3% 11 0.5% 3 0.1% -72.7%BSET: PROCESS & PIPING DESIGN 2 2 0.1% 0 0.0% 0 0.0% 0 0.0% 0 0.0% -BAAS: SAFETY MANAGEMENT 8 0.3% 8 0.3% 14 0.6% 11 0.5% 15 0.6% 36.4%BSET: STRUCTURAL ANALYSIS AND DESIGN 17 0.7% 26 1.1% 32 1.4% 19 0.8% 19 0.8% 0.0%MATHEMATICS & STATISTICS 17 0.7% 27 1.1% 24 1.0% 21 0.9% 32 1.4% 52.4%BS: APPLIED MATHEMATICS 8 0.3% 13 0.5% 12 0.5% 14 0.6% 15 0.6% 7.1%BS: APPLIED STATISTICS 3 0.1% 3 0.1% 5 0.2% 5 0.2% 9 0.4% 80.0%BA: MATHEMATICS 6 0.3% 11 0.5% 7 0.3% 2 0.1% 7 0.3% 250.0%BS: MATHEMATICS (added in 2014) NA - NA - NA - NA - 1 0.0% -NATURAL SCIENCES 63 2.7% 85 3.5% 78 3.3% 85 3.6% 113 4.8% 32.9%BS: BIOLOGICAL & PHYSICAL SCIENCES 15 0.6% 21 0.9% 16 0.7% 23 1.0% 23 1.0% 0.0%BS: BIOLOGY 36 1.5% 42 1.7% 28 1.2% 34 1.4% 45 1.9% 32.4%BS: BIOTECHNOLOGY 3 0.1% 3 0.1% 12 0.5% 3 0.1% 17 0.7% 466.7%BS: CHEMISTRY 2 0.1% 7 0.3% 9 0.4% 18 0.8% 20 0.9% 11.1%BS: GEOSCIENCES (added Fall 2013) NA - NA - NA - 0 0.0% 1 0.0% -BS: INDUSTRIAL CHEMISTRY 2 6 0.3% 5 0.2% 3 0.1% 3 0.1% 6 0.3% 100.0%BS: MICROBIOLOGY 2 1 0.0% 7 0.3% 10 0.4% 4 0.2% 1 0.0% -75.0%
UNIVERSITY COLLEGE 417 17.7% 356 14.6% 305 13.0% 327 13.9% 331 14.2% 1.2%
BAAS: APPLIED ADMINISTRATION (added Fall 2010) NA - NA - 8 0.3% 18 0.8% 31 1.3% 72.2%BS: INTERDISCIPLINARY STUDIES 417 17.7% 356 14.6% 297 12.6% 309 13.1% 300 12.8% -2.9%
Source: CBM0091 The Computer Information Systems major is being phased out, and students in this major can decide to finish it or change over to the new Enterprise Information Systems major, introduced Fall 2012.2 These programs have been discontinued.In cases of reorganization at the university, the prior years’ information is also listed with the current structure to allow easier and more consistent comparison across time (see Appendix B for more info).
Baccalaureate Degrees Awarded by College
% Change from Previous Year
2009 - 2010 2011 - 2012 2013 - 20142012 - 20132010 - 2011

# % # % # % # % # %
American Indian 8 0.5% 5 0.3% 10 0.6% 10 0.6% 8 0.5% -20.0%Asian or Pacific Islander 127 8.2% 142 9.0% 144 9.3% 103 6.7% 127 8.5% 23.3%Black 443 28.7% 445 28.2% 439 28.3% 431 28.0% 411 27.5% -4.6%Hispanic 537 34.8% 563 35.7% 566 36.4% 622 40.4% 553 37.0% -11.1%White 406 26.3% 392 24.9% 360 23.2% 339 22.0% 356 23.8% 5.0%International 22 1.4% 27 1.7% 28 1.8% 29 1.9% 34 2.3% 17.2%Unknown 2 0.1% 3 0.2% 6 0.4% 6 0.4% 6 0.4% 0.0%
Total Females 1,545 100.0% 1,577 100.0% 1,553 100.0% 1,540 100.0% 1,495 100.0% -2.9%
# % # % # % # % # %
American Indian 3 0.4% 3 0.4% 3 0.4% 2 0.2% 4 0.5% 100.0%Asian or Pacific Islander 117 14.4% 129 15.1% 142 17.9% 115 14.2% 129 15.5% 12.2%Black 153 18.8% 170 19.8% 144 18.2% 147 18.1% 160 19.2% 8.8%Hispanic 238 29.2% 269 31.4% 246 31.0% 263 32.4% 266 32.0% 1.1%White 268 32.9% 255 29.8% 221 27.9% 244 30.0% 228 27.4% -6.6%International 34 4.2% 30 3.5% 33 4.2% 32 3.9% 35 4.2% 9.4%Unknown 1 0.1% 1 0.1% 4 0.5% 9 1.1% 10 1.2% 11.1%
Total Males 814 100.0% 857 100.0% 793 100.0% 812 100.0% 832 100.0% 2.5%
# % # % # % # % # %
American Indian 11 0.5% 8 0.3% 13 0.6% 12 0.5% 12 0.5% 0.0%Asian or Pacific Islander 244 10.3% 271 11.1% 286 12.2% 218 9.3% 256 11.0% 17.4%Black 596 25.3% 615 25.3% 583 24.9% 578 24.6% 571 24.5% -1.2%Hispanic 775 32.9% 832 34.2% 812 34.6% 885 37.6% 819 35.2% -7.5%White 674 28.6% 647 26.6% 581 24.8% 583 24.8% 584 25.1% 0.2%International 56 2.4% 57 2.3% 61 2.6% 61 2.6% 69 3.0% 13.1%Unknown 3 0.1% 4 0.2% 10 0.4% 15 0.6% 16 0.7% 6.7%
Grand Total 1 2,359 100.0% 2,434 100.0% 2,346 100.0% 2,352 100.0% 2,327 100.0% -1.1%
Source: CBM0091 Total may differ from previous page because a student may have multiple majors but is counted only once by gender and ethnicity.
Baccalaureate Degrees Awarded by Gender & Ethnicity
2009 - 2010 % change from Previous Year
2012 - 20132010 - 2011 2011 - 2012 2013 - 2014
Female
2009 - 2010 % change from Previous Year
2012 - 2013
Overall
2013 - 2014
2013 - 2014
Male
2012 - 20132009 - 2010 % change from Previous Year
2010 - 2011 2011 - 2012
2010 - 2011 2011 - 2012
34.5%
65.5%
Bac. Degrees by Gender 2013 - 2014
Male
Female
0.5%
9.3%
24.6%
37.6%
24.8%
2.6% 0.6%
Baccalaureate Degrees by Ethnicity 2013 - 2014
American Indian
Asian or Pacific Islander
Black
Hispanic
White
International
Unknown
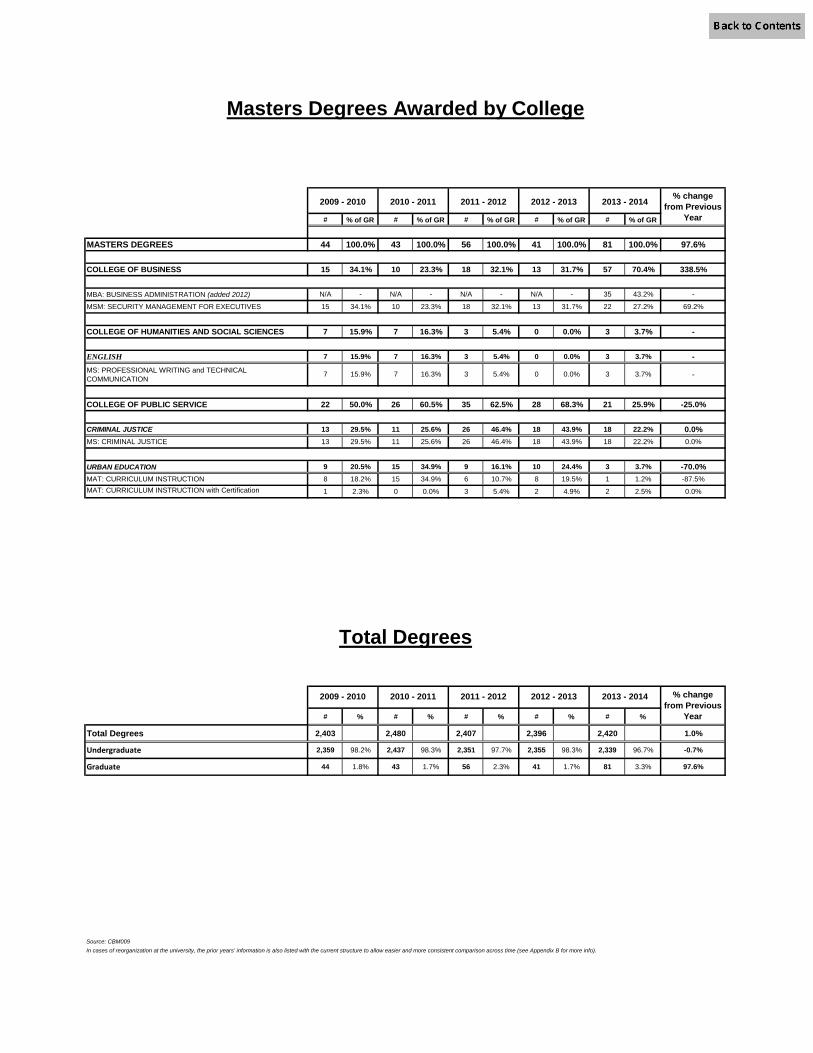
# % of GR # % of GR # % of GR # % of GR # % of GR
MASTERS DEGREES 44 100.0% 43 100.0% 56 100.0% 41 100.0% 81 100.0% 97.6%
COLLEGE OF BUSINESS 15 34.1% 10 23.3% 18 32.1% 13 31.7% 57 70.4% 338.5%
MBA: BUSINESS ADMINISTRATION (added 2012) N/A - N/A - N/A - N/A - 35 43.2% -
MSM: SECURITY MANAGEMENT FOR EXECUTIVES 15 34.1% 10 23.3% 18 32.1% 13 31.7% 22 27.2% 69.2%
COLLEGE OF HUMANITIES AND SOCIAL SCIENCES 7 15.9% 7 16.3% 3 5.4% 0 0.0% 3 3.7% -
ENGLISH 7 15.9% 7 16.3% 3 5.4% 0 0.0% 3 3.7% -MS: PROFESSIONAL WRITING and TECHNICAL COMMUNICATION
7 15.9% 7 16.3% 3 5.4% 0 0.0% 3 3.7% -
COLLEGE OF PUBLIC SERVICE 22 50.0% 26 60.5% 35 62.5% 28 68.3% 21 25.9% -25.0%
CRIMINAL JUSTICE 13 29.5% 11 25.6% 26 46.4% 18 43.9% 18 22.2% 0.0%MS: CRIMINAL JUSTICE 13 29.5% 11 25.6% 26 46.4% 18 43.9% 18 22.2% 0.0%
URBAN EDUCATION 9 20.5% 15 34.9% 9 16.1% 10 24.4% 3 3.7% -70.0%MAT: CURRICULUM INSTRUCTION 8 18.2% 15 34.9% 6 10.7% 8 19.5% 1 1.2% -87.5%MAT: CURRICULUM INSTRUCTION with Certification 1 2.3% 0 0.0% 3 5.4% 2 4.9% 2 2.5% 0.0%
# % # % # % # % # %
Total Degrees 2,403 2,480 2,407 2,396 2,420 1.0%
Undergraduate 2,359 98.2% 2,437 98.3% 2,351 97.7% 2,355 98.3% 2,339 96.7% -0.7%
Graduate 44 1.8% 43 1.7% 56 2.3% 41 1.7% 81 3.3% 97.6%
Source: CBM009In cases of reorganization at the university, the prior years’ information is also listed with the current structure to allow easier and more consistent comparison across time (see Appendix B for more info).
2013 - 2014 % change from Previous
Year
2013 - 2014
Total Degrees
2009 - 2010 2010 - 2011 2011 - 2012 2012 - 2013
Masters Degrees Awarded by College
2011 - 2012 % change from Previous
Year
2009 - 2010 2010 - 2011 2012 - 2013
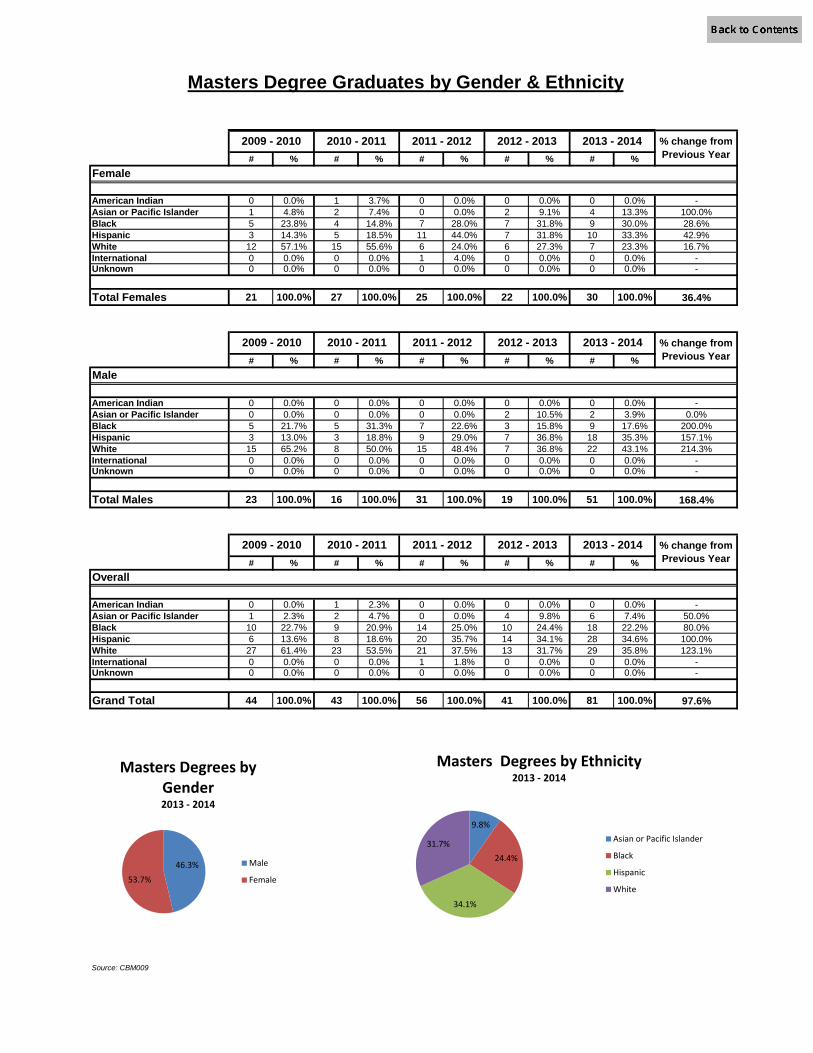
# % # % # % # % # %
American Indian 0 0.0% 1 3.7% 0 0.0% 0 0.0% 0 0.0% -Asian or Pacific Islander 1 4.8% 2 7.4% 0 0.0% 2 9.1% 4 13.3% 100.0%Black 5 23.8% 4 14.8% 7 28.0% 7 31.8% 9 30.0% 28.6%Hispanic 3 14.3% 5 18.5% 11 44.0% 7 31.8% 10 33.3% 42.9%White 12 57.1% 15 55.6% 6 24.0% 6 27.3% 7 23.3% 16.7%International 0 0.0% 0 0.0% 1 4.0% 0 0.0% 0 0.0% -Unknown 0 0.0% 0 0.0% 0 0.0% 0 0.0% 0 0.0% -
Total Females 21 100.0% 27 100.0% 25 100.0% 22 100.0% 30 100.0% 36.4%
# % # % # % # % # %
American Indian 0 0.0% 0 0.0% 0 0.0% 0 0.0% 0 0.0% -Asian or Pacific Islander 0 0.0% 0 0.0% 0 0.0% 2 10.5% 2 3.9% 0.0%Black 5 21.7% 5 31.3% 7 22.6% 3 15.8% 9 17.6% 200.0%Hispanic 3 13.0% 3 18.8% 9 29.0% 7 36.8% 18 35.3% 157.1%White 15 65.2% 8 50.0% 15 48.4% 7 36.8% 22 43.1% 214.3%International 0 0.0% 0 0.0% 0 0.0% 0 0.0% 0 0.0% -Unknown 0 0.0% 0 0.0% 0 0.0% 0 0.0% 0 0.0% -
Total Males 23 100.0% 16 100.0% 31 100.0% 19 100.0% 51 100.0% 168.4%
# % # % # % # % # %
American Indian 0 0.0% 1 2.3% 0 0.0% 0 0.0% 0 0.0% -Asian or Pacific Islander 1 2.3% 2 4.7% 0 0.0% 4 9.8% 6 7.4% 50.0%Black 10 22.7% 9 20.9% 14 25.0% 10 24.4% 18 22.2% 80.0%Hispanic 6 13.6% 8 18.6% 20 35.7% 14 34.1% 28 34.6% 100.0%White 27 61.4% 23 53.5% 21 37.5% 13 31.7% 29 35.8% 123.1%International 0 0.0% 0 0.0% 1 1.8% 0 0.0% 0 0.0% -Unknown 0 0.0% 0 0.0% 0 0.0% 0 0.0% 0 0.0% -
Grand Total 44 100.0% 43 100.0% 56 100.0% 41 100.0% 81 100.0% 97.6%
Source: CBM009
Masters Degree Graduates by Gender & Ethnicity
Overall
Male
2009 - 2010 % change from Previous Year
2012 - 2013
Female
2011 - 2012
2011 - 2012
2013 - 20142009 - 2010 % change from Previous Year
2012 - 20132010 - 2011
2011 - 2012
2009 - 2010 % change from Previous Year
2012 - 20132010 - 2011 2013 - 2014
2013 - 20142010 - 2011
46.3%
53.7%
Masters Degrees by Gender 2013 - 2014
Male
Female
9.8%
24.4%
34.1%
31.7%
Masters Degrees by Ethnicity 2013 - 2014
Asian or Pacific Islander
Black
Hispanic
White
# % # % # % # % # %
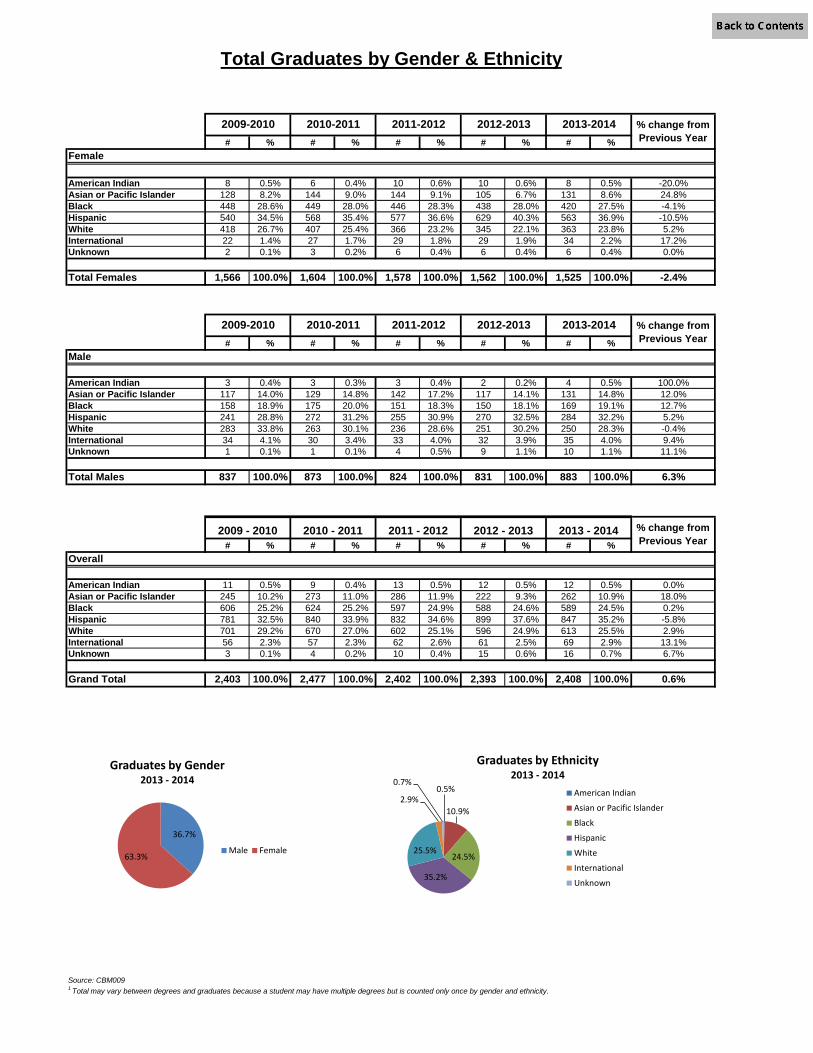
American Indian 8 0.5% 6 0.4% 10 0.6% 10 0.6% 8 0.5% -20.0%Asian or Pacific Islander 128 8.2% 144 9.0% 144 9.1% 105 6.7% 131 8.6% 24.8%Black 448 28.6% 449 28.0% 446 28.3% 438 28.0% 420 27.5% -4.1%Hispanic 540 34.5% 568 35.4% 577 36.6% 629 40.3% 563 36.9% -10.5%White 418 26.7% 407 25.4% 366 23.2% 345 22.1% 363 23.8% 5.2%International 22 1.4% 27 1.7% 29 1.8% 29 1.9% 34 2.2% 17.2%Unknown 2 0.1% 3 0.2% 6 0.4% 6 0.4% 6 0.4% 0.0%
Total Females 1,566 100.0% 1,604 100.0% 1,578 100.0% 1,562 100.0% 1,525 100.0% -2.4%
# % # % # % # % # %
American Indian 3 0.4% 3 0.3% 3 0.4% 2 0.2% 4 0.5% 100.0%Asian or Pacific Islander 117 14.0% 129 14.8% 142 17.2% 117 14.1% 131 14.8% 12.0%Black 158 18.9% 175 20.0% 151 18.3% 150 18.1% 169 19.1% 12.7%Hispanic 241 28.8% 272 31.2% 255 30.9% 270 32.5% 284 32.2% 5.2%White 283 33.8% 263 30.1% 236 28.6% 251 30.2% 250 28.3% -0.4%International 34 4.1% 30 3.4% 33 4.0% 32 3.9% 35 4.0% 9.4%Unknown 1 0.1% 1 0.1% 4 0.5% 9 1.1% 10 1.1% 11.1%
Total Males 837 100.0% 873 100.0% 824 100.0% 831 100.0% 883 100.0% 6.3%
# % # % # % # % # %Overall
American Indian 11 0.5% 9 0.4% 13 0.5% 12 0.5% 12 0.5% 0.0%Asian or Pacific Islander 245 10.2% 273 11.0% 286 11.9% 222 9.3% 262 10.9% 18.0%Black 606 25.2% 624 25.2% 597 24.9% 588 24.6% 589 24.5% 0.2%Hispanic 781 32.5% 840 33.9% 832 34.6% 899 37.6% 847 35.2% -5.8%White 701 29.2% 670 27.0% 602 25.1% 596 24.9% 613 25.5% 2.9%International 56 2.3% 57 2.3% 62 2.6% 61 2.5% 69 2.9% 13.1%Unknown 3 0.1% 4 0.2% 10 0.4% 15 0.6% 16 0.7% 6.7%
Grand Total 2,403 100.0% 2,477 100.0% 2,402 100.0% 2,393 100.0% 2,408 100.0% 0.6%
Source: CBM0091 Total may vary between degrees and graduates because a student may have multiple degrees but is counted only once by gender and ethnicity.
2013 - 2014 % change from Previous Year
2009 - 2010 2010 - 2011 2011 - 2012 2012 - 2013
2009-2010 2010-2011 2011-2012 2012-2013
% change from Previous Year
Male
Female
Total Graduates by Gender & Ethnicity
2013-2014 % change from Previous Year
2009-2010 2010-2011 2011-2012 2012-2013 2013-2014
36.7%
63.3%
Graduates by Gender 2013 - 2014
Male Female
0.5%
10.9%
24.5%
35.2%
25.5%
2.9%
0.7%
Graduates by Ethnicity 2013 - 2014
American Indian
Asian or Pacific Islander
Black
Hispanic
White
International
Unknown
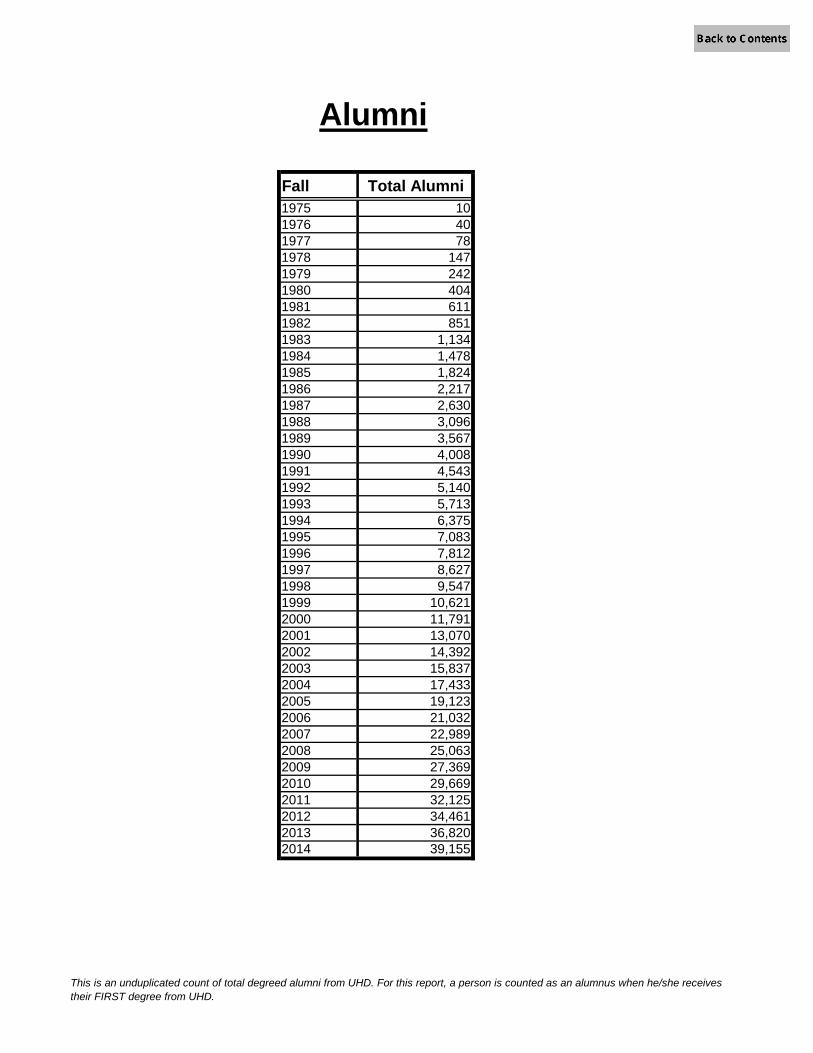
This is an unduplicated count of total degreed alumni from UHD. For this report, a person is counted as an alumnus when he/she receives their FIRST degree from UHD.
Fall Total Alumni1975 101976 401977 781978 1471979 2421980 4041981 6111982 8511983 1,1341984 1,4781985 1,8241986 2,2171987 2,6301988 3,0961989 3,5671990 4,0081991 4,5431992 5,1401993 5,7131994 6,3751995 7,0831996 7,8121997 8,6271998 9,5471999 10,6212000 11,7912001 13,0702002 14,3922003 15,8372004 17,4332005 19,1232006 21,0322007 22,9892008 25,0632009 27,3692010 29,6692011 32,1252012 34,4612013 36,8202014 39,155
Alumni
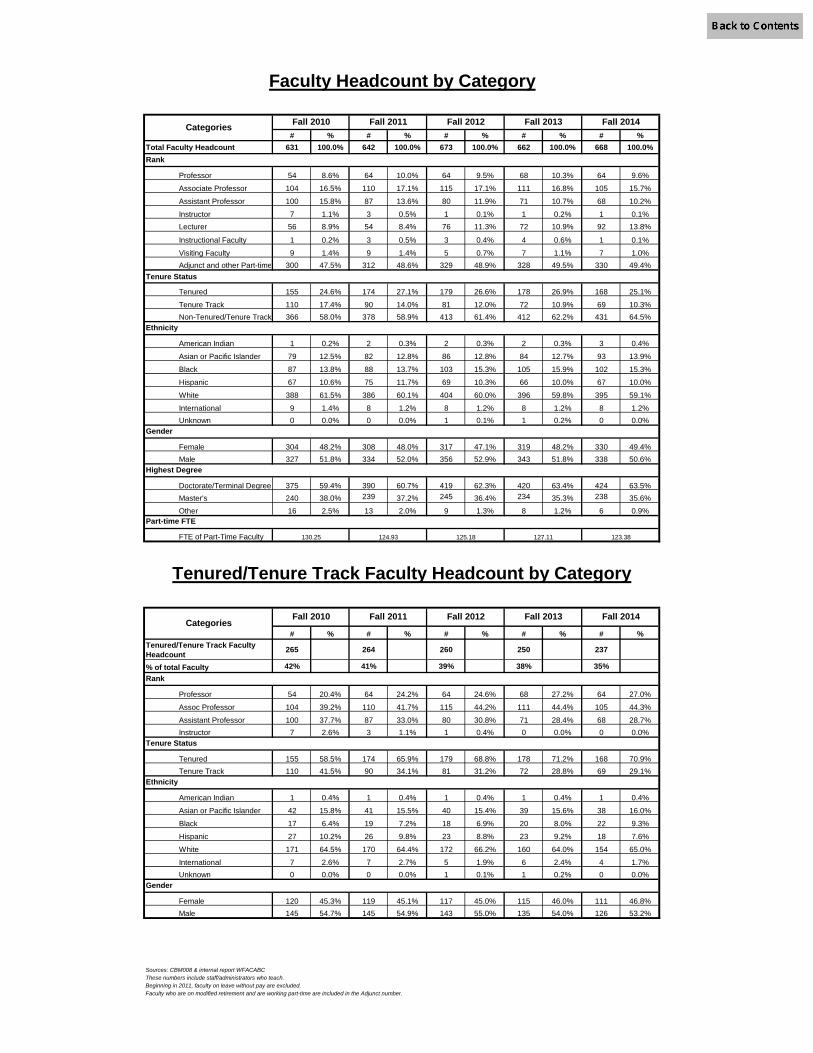
# % # % # % # % # %Total Faculty Headcount 631 100.0% 642 100.0% 673 100.0% 662 100.0% 668 100.0%
Professor 54 8.6% 64 10.0% 64 9.5% 68 10.3% 64 9.6%
Associate Professor 104 16.5% 110 17.1% 115 17.1% 111 16.8% 105 15.7%
Assistant Professor 100 15.8% 87 13.6% 80 11.9% 71 10.7% 68 10.2%
Instructor 7 1.1% 3 0.5% 1 0.1% 1 0.2% 1 0.1%Lecturer 56 8.9% 54 8.4% 76 11.3% 72 10.9% 92 13.8%
Instructional Faculty 1 0.2% 3 0.5% 3 0.4% 4 0.6% 1 0.1%
Visiting Faculty 9 1.4% 9 1.4% 5 0.7% 7 1.1% 7 1.0%Adjunct and other Part-time 300 47.5% 312 48.6% 329 48.9% 328 49.5% 330 49.4%
Tenure Status
Tenured 155 24.6% 174 27.1% 179 26.6% 178 26.9% 168 25.1%
Tenure Track 110 17.4% 90 14.0% 81 12.0% 72 10.9% 69 10.3%Non-Tenured/Tenure Track 366 58.0% 378 58.9% 413 61.4% 412 62.2% 431 64.5%
American Indian 1 0.2% 2 0.3% 2 0.3% 2 0.3% 3 0.4%
Asian or Pacific Islander 79 12.5% 82 12.8% 86 12.8% 84 12.7% 93 13.9%
Black 87 13.8% 88 13.7% 103 15.3% 105 15.9% 102 15.3%
Hispanic 67 10.6% 75 11.7% 69 10.3% 66 10.0% 67 10.0%
White 388 61.5% 386 60.1% 404 60.0% 396 59.8% 395 59.1%
International 9 1.4% 8 1.2% 8 1.2% 8 1.2% 8 1.2%Unknown 0 0.0% 0 0.0% 1 0.1% 1 0.2% 0 0.0%
Female 304 48.2% 308 48.0% 317 47.1% 319 48.2% 330 49.4%Male 327 51.8% 334 52.0% 356 52.9% 343 51.8% 338 50.6%
Doctorate/Terminal Degree 375 59.4% 390 60.7% 419 62.3% 420 63.4% 424 63.5%Master's 240 38.0% 239 37.2% 245 36.4% 234 35.3% 238 35.6%
Other 16 2.5% 13 2.0% 9 1.3% 8 1.2% 6 0.9%
FTE of Part-Time Faculty
# % # % # % # % # %Tenured/Tenure Track Faculty Headcount 265 264 260 250 237
% of total Faculty 42% 41% 39% 38% 35%
Professor 54 20.4% 64 24.2% 64 24.6% 68 27.2% 64 27.0%
Assoc Professor 104 39.2% 110 41.7% 115 44.2% 111 44.4% 105 44.3%
Assistant Professor 100 37.7% 87 33.0% 80 30.8% 71 28.4% 68 28.7%Instructor 7 2.6% 3 1.1% 1 0.4% 0 0.0% 0 0.0%
Tenured 155 58.5% 174 65.9% 179 68.8% 178 71.2% 168 70.9%Tenure Track 110 41.5% 90 34.1% 81 31.2% 72 28.8% 69 29.1%
American Indian 1 0.4% 1 0.4% 1 0.4% 1 0.4% 1 0.4%
Asian or Pacific Islander 42 15.8% 41 15.5% 40 15.4% 39 15.6% 38 16.0%
Black 17 6.4% 19 7.2% 18 6.9% 20 8.0% 22 9.3%
Hispanic 27 10.2% 26 9.8% 23 8.8% 23 9.2% 18 7.6%
White 171 64.5% 170 64.4% 172 66.2% 160 64.0% 154 65.0%
International 7 2.6% 7 2.7% 5 1.9% 6 2.4% 4 1.7%Unknown 0 0.0% 0 0.0% 1 0.1% 1 0.2% 0 0.0%
Female 120 45.3% 119 45.1% 117 45.0% 115 46.0% 111 46.8%Male 145 54.7% 145 54.9% 143 55.0% 135 54.0% 126 53.2%
Sources: CBM008 & internal report WFACABCThese numbers include staff/administrators who teach.Beginning in 2011, faculty on leave without pay are excluded.Faculty who are on modified retirement and are working part-time are included in the Adjunct number.
Fall 2014
Tenure Status
Ethnicity
130.25 124.93 125.18 127.11
Categories
Part-time FTE
Gender
Rank
Categories
Fall 2013
Fall 2013
Rank
Fall 2011
Fall 2012
Fall 2012Fall 2010
Faculty Headcount by Category
Highest Degree
Fall 2010
Tenured/Tenure Track Faculty Headcount by Category
Fall 2014Fall 2011
Ethnicity
Gender
123.38

College/Department Fall 2010
Change from Prev
Year
Fall 2011
Change from Prev
Year
Fall 2012
Change from Prev
Year
Fall 2013
Change from Prev
Year
Fall 2014
Change from Prev
Year
College of BusinessFTE Students 2014.40 -148.85 2045.80 31.40 2170.63 124.83 2177.95 7.32 2344.65 166.70FTE Faculty 84.80 4.41 87.39 2.59 89.16 1.77 91.29 2.13 94.34 3.05Student/Faculty Ratio 23.75 -3.15 23.41 -0.34 24.35 0.94 23.86 -0.49 24.85 1.00
Finance, Accounting and Enterprise Information SystemsFTE Students 1042.40 -22.40 1021.20 -21.20 1058.00 36.80 1074.40 16.40 1112.80 38.40FTE Faculty 39.36 0.31 41.44 2.08 39.27 -2.17 39.88 0.61 40.94 1.06Student/Faculty Ratio 26.48 -0.78 24.64 -1.84 26.94 2.30 26.94 0.00 27.18 0.24
Graduate BusinessFTE Students N/A - N/A - 16.33 - 38.25 21.92 131.25 93.00FTE Faculty N/A - N/A - 2.46 - 2.81 0.35 5.91 3.10Student/Faculty Ratio N/A - N/A - 6.64 - 13.61 6.97 22.21 8.60
Management, Marketing and Business AdministrationFTE Students 965.00 -125.45 1016.10 51.10 1087.05 70.95 1059.55 -27.50 1096.60 37.05FTE Faculty 44.14 3.40 44.65 0.51 46.13 1.48 48.30 2.17 46.49 -1.81Student/Faculty Ratio 21.86 -4.90 22.76 0.89 23.56 0.81 21.94 -1.63 23.59 1.65
Security ManagementFTE Students 7.00 -1.00 8.50 1.50 9.25 0.75 5.75 -3.50 4.00 -1.75FTE Faculty 1.30 0.70 1.30 0.00 1.30 0.00 0.30 -1.00 1.00 0.70Student/Faculty Ratio 5.38 -7.95 6.54 1.15 7.12 0.58 19.17 12.05 4.00 -15.17
College of Humanities and Social SciencesFTE Students 3427.57 -10.13 3402.81 -24.76 3716.95 314.14 3577.05 -139.90 3576.02 -1.03FTE Faculty 183.26 4.83 182.16 -1.10 179.61 -2.55 170.58 -9.03 168.38 -2.20Student/Faculty Ratio 18.70 -0.56 18.68 -0.02 20.69 2.01 20.97 0.28 21.24 0.27
Arts and HumanitiesFTE Students 793.60 74.07 795.53 1.93 931.20 135.67 982.40 51.20 968.00 -14.40FTE Faculty 49.59 4.98 51.71 2.12 52.26 0.55 52.81 0.55 49.17 -3.64Student/Faculty Ratio 16.00 -0.13 15.38 -0.62 17.82 2.43 18.60 0.78 19.69 1.08
EnglishFTE Students 1099.57 23.00 1036.58 -62.99 1117.30 80.72 941.10 -176.20 871.95 -69.15FTE Faculty 68.12 0.25 64.90 -3.22 62.75 -2.15 56.37 -6.38 48.78 -7.59Student/Faculty Ratio 16.14 0.28 15.97 -0.17 17.81 1.83 16.70 -1.11 17.88 1.18
Social SciencesFTE Students 1534.40 -107.20 1570.70 36.30 1668.45 97.75 1653.55 -14.90 1736.07 82.52FTE Faculty 65.55 -0.40 65.55 0.00 64.60 -0.95 61.40 -3.20 70.43 9.03Student/Faculty Ratio 23.41 -1.48 23.96 0.55 25.83 1.87 26.93 1.10 24.65 -2.28
College of Public ServiceFTE Students 1021.40 68.75 1091.45 70.05 1122.85 31.40 1114.87 -7.98 1226.64 111.77FTE Faculty 54.54 3.61 56.07 1.53 65.94 9.87 61.25 -4.69 59.94 -1.31Student/Faculty Ratio 18.73 0.02 19.47 0.74 17.03 -2.44 18.20 1.17 20.46 2.26
Criminal JusticeFTE Students 427.25 53.80 496.97 69.72 530.45 33.48 577.20 46.75 634.97 57.77FTE Faculty 18.65 1.17 20.00 1.35 26.44 6.44 26.00 -0.44 29.20 3.20Student/Faculty Ratio 22.91 1.54 24.85 1.94 20.06 -4.79 22.20 2.14 21.75 -0.45
Urban EducationFTE Students 594.15 14.95 594.48 0.33 592.40 -2.08 537.67 -54.73 591.67 54.00FTE Faculty 35.89 2.44 36.07 0.18 39.50 3.43 35.25 -4.25 30.74 -4.51Student/Faculty Ratio 16.55 -0.76 16.48 -0.07 15.00 -1.48 15.25 0.26 19.25 3.99
College of Sciences and TechnologyFTE Students 1930.40 98.47 1986.27 55.87 2169.66 183.39 2258.53 88.87 2333.52 74.99FTE Faculty 96.70 10.35 97.45 0.75 107.70 10.25 109.12 1.42 105.45 -3.67Student/Faculty Ratio 19.96 -1.25 20.38 0.42 20.15 -0.24 20.70 0.55 22.13 1.43
Computer Science and Engineering TechnologyFTE Students 241.87 10.47 254.00 12.13 274.73 20.73 330.00 55.27 383.87 53.87FTE Faculty 13.16 1.04 14.89 1.73 16.60 1.71 13.80 -2.80 13.01 -0.79
Student/Faculty Ratio 18.38 -0.71 17.06 -1.32 16.55 -0.51 23.91 7.36 29.51 5.59 Mathematics and Statistics
FTE Students 1049.13 11.13 1068.40 19.27 1150.00 81.60 1095.33 -54.67 1088.12 -7.21FTE Faculty 45.58 3.57 43.83 -1.75 44.52 0.69 45.54 1.02 43.00 -2.54
Student/Faculty Ratio 23.02 -1.69 24.38 1.36 25.83 1.46 24.05 -1.78 25.31 1.25 Natural Sciences
FTE Students 639.40 76.87 663.87 24.47 744.93 81.06 833.20 88.27 861.53 28.33FTE Faculty 37.96 5.74 38.73 0.77 46.58 7.85 49.78 3.20 49.44 -0.34
Student/Faculty Ratio 16.84 -0.61 17.14 0.30 15.99 -1.15 16.74 0.75 17.43 0.69University College
FTE Students 38.13 14.53 53.80 15.67 70.80 17.00 89.47 18.67 75.60 -13.87FTE Faculty 2.95 1.61 6.03 3.08 5.55 -0.48 6.55 1.00 6.35 -0.20Student/Faculty Ratio 12.93 -4.69 8.92 -4.00 12.76 3.83 13.66 0.90 11.91 -1.75
Applied AdministrationFTE Students 7.40 - 25.40 18.00 44.00 18.60 53.80 9.80 69.60 15.80FTE Faculty 2.00 - 3.15 1.15 2.15 -1.00 3.00 0.85 3.20 0.20
Student/Faculty Ratio 3.70 - 8.06 4.36 20.47 12.40 17.93 -2.53 21.75 3.82
FTE Students 30.73 7.13 28.40 -2.33 26.80 -1.60 35.67 8.87 6.00 -29.67FTE Faculty 0.95 -0.39 2.88 1.93 3.40 0.52 3.55 0.15 3.15 -0.40
Student/Faculty Ratio 32.35 14.74 9.86 -22.49 7.88 -1.98 10.05 2.17 1.90 -8.14Total UHD
FTE Students 8,431.90 22.77 8,580.13 148.23 9,250.89 818.99 9,217.87 -33.02 9,556.43 338.56FTE Faculty 422.25 24.81 429.10 6.85 447.96 25.71 438.79 -9.17 434.46 -4.33Student/Faculty Ratio 19.97 -1.19 20.00 0.03 20.65 0.68 21.01 0.36 22.00 0.99
FTE student calculations are based on 15 hours for undergraduate students and 12 hours for graduate students. The calculation includes all classes (lecture, lab, practicum, seminar, independent study etc. ) at all campuses except for the Air Force/Military Science classes taught at UH.In cases of reorganization at the university, the prior years’ information is also listed with the current structure to allow easier and more consistent comparison across time (see Appendix B for more info).Source: CBM004 & CBM008
College Success Program
FTE faculty calculations are based on the total instruction function (13A: instruction and 13B: administrative assignments which directly supplement the teaching function) divided by 100. Faculty teaching Air Force/Military Science classes are excluded.
Student / Faculty FTE & Ratio
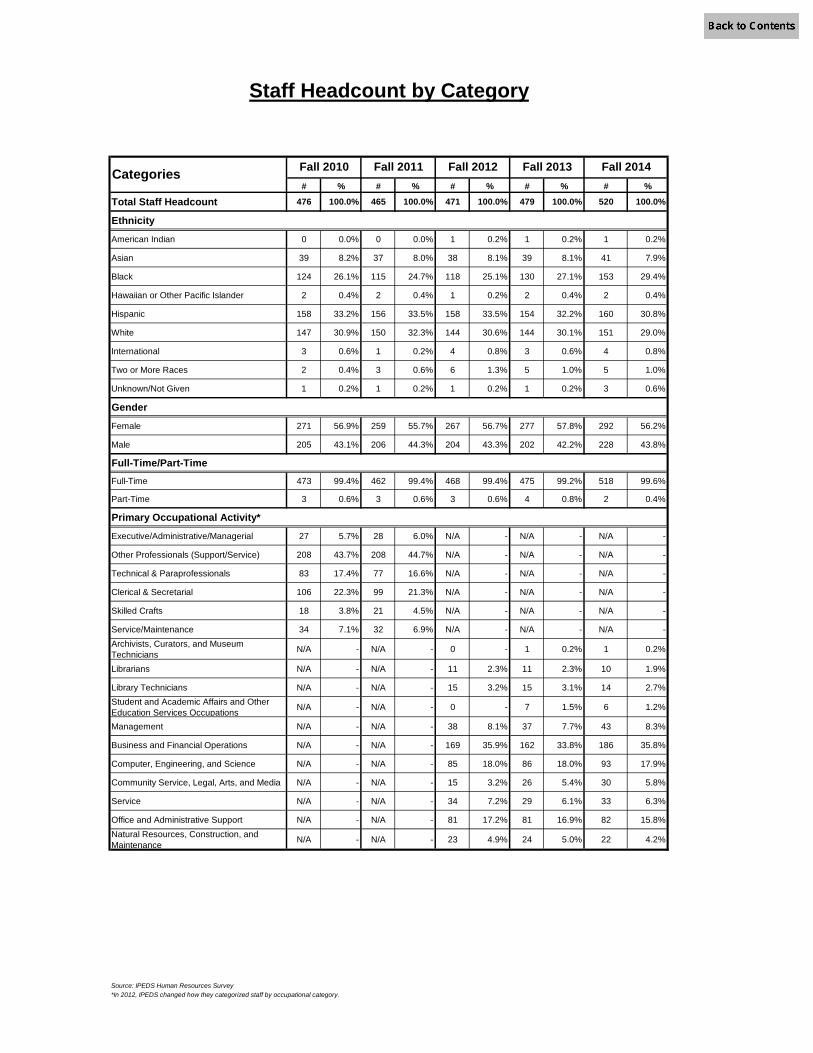
# % # % # % # % # %
Total Staff Headcount 476 100.0% 465 100.0% 471 100.0% 479 100.0% 520 100.0%
Ethnicity
American Indian 0 0.0% 0 0.0% 1 0.2% 1 0.2% 1 0.2%
Asian 39 8.2% 37 8.0% 38 8.1% 39 8.1% 41 7.9%
Black 124 26.1% 115 24.7% 118 25.1% 130 27.1% 153 29.4%
Hawaiian or Other Pacific Islander 2 0.4% 2 0.4% 1 0.2% 2 0.4% 2 0.4%
Hispanic 158 33.2% 156 33.5% 158 33.5% 154 32.2% 160 30.8%
White 147 30.9% 150 32.3% 144 30.6% 144 30.1% 151 29.0%
International 3 0.6% 1 0.2% 4 0.8% 3 0.6% 4 0.8%
Two or More Races 2 0.4% 3 0.6% 6 1.3% 5 1.0% 5 1.0%
Unknown/Not Given 1 0.2% 1 0.2% 1 0.2% 1 0.2% 3 0.6%
Gender
Female 271 56.9% 259 55.7% 267 56.7% 277 57.8% 292 56.2%
Male 205 43.1% 206 44.3% 204 43.3% 202 42.2% 228 43.8%
Full-Time/Part-TimeFull-Time 473 99.4% 462 99.4% 468 99.4% 475 99.2% 518 99.6%
Part-Time 3 0.6% 3 0.6% 3 0.6% 4 0.8% 2 0.4%
Primary Occupational Activity*
Executive/Administrative/Managerial 27 5.7% 28 6.0% N/A - N/A - N/A -
Other Professionals (Support/Service) 208 43.7% 208 44.7% N/A - N/A - N/A -
Technical & Paraprofessionals 83 17.4% 77 16.6% N/A - N/A - N/A -
Clerical & Secretarial 106 22.3% 99 21.3% N/A - N/A - N/A -
Skilled Crafts 18 3.8% 21 4.5% N/A - N/A - N/A -
Service/Maintenance 34 7.1% 32 6.9% N/A - N/A - N/A -Archivists, Curators, and Museum Technicians N/A - N/A - 0 - 1 0.2% 1 0.2%
Librarians N/A - N/A - 11 2.3% 11 2.3% 10 1.9%
Library Technicians N/A - N/A - 15 3.2% 15 3.1% 14 2.7%Student and Academic Affairs and Other Education Services Occupations N/A - N/A - 0 - 7 1.5% 6 1.2%
Management N/A - N/A - 38 8.1% 37 7.7% 43 8.3%
Business and Financial Operations N/A - N/A - 169 35.9% 162 33.8% 186 35.8%
Computer, Engineering, and Science N/A - N/A - 85 18.0% 86 18.0% 93 17.9%
Community Service, Legal, Arts, and Media N/A - N/A - 15 3.2% 26 5.4% 30 5.8%
Service N/A - N/A - 34 7.2% 29 6.1% 33 6.3%
Office and Administrative Support N/A - N/A - 81 17.2% 81 16.9% 82 15.8%Natural Resources, Construction, and Maintenance N/A - N/A - 23 4.9% 24 5.0% 22 4.2%
Source: IPEDS Human Resources Survey*In 2012, IPEDS changed how they categorized staff by occupational category.
Staff Headcount by Category
Fall 2014Fall 2013Fall 2010Categories Fall 2011 Fall 2012
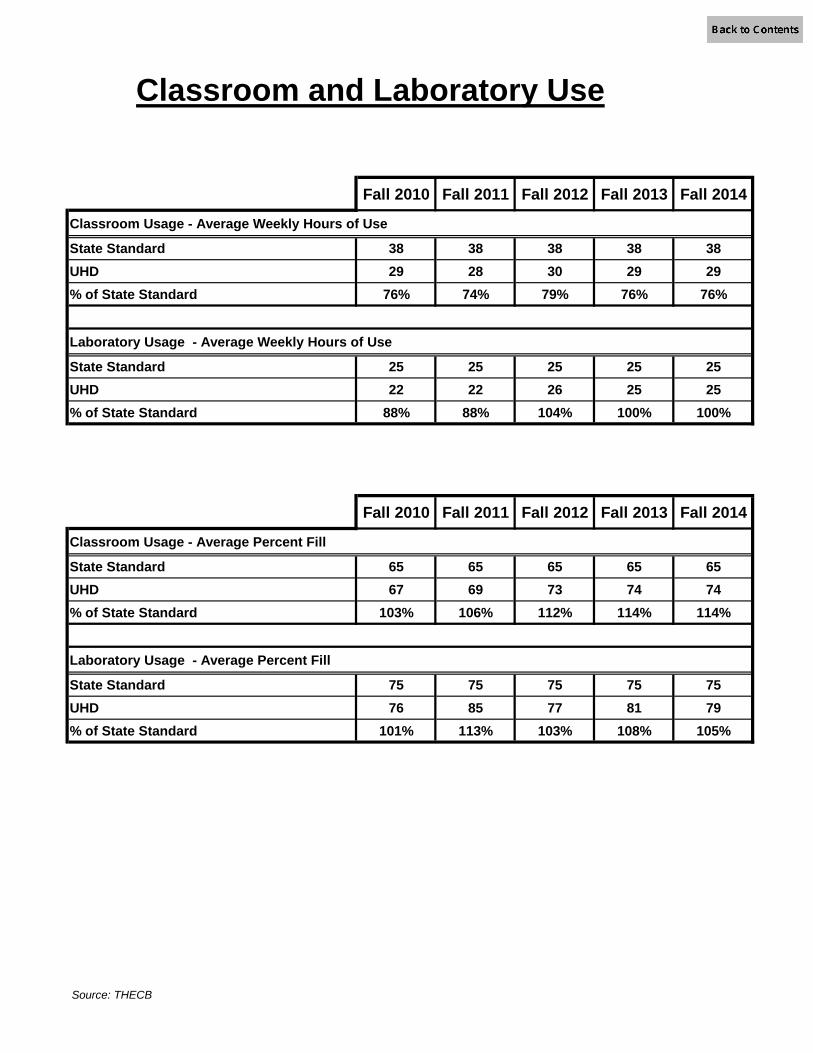
Source: THECB
Fall 2010 Fall 2011 Fall 2012 Fall 2013 Fall 2014
Classroom Usage - Average Weekly Hours of Use
State Standard 38 38 38 38 38UHD 29 28 30 29 29% of State Standard 76% 74% 79% 76% 76%
Laboratory Usage - Average Weekly Hours of Use
State Standard 25 25 25 25 25UHD 22 22 26 25 25% of State Standard 88% 88% 104% 100% 100%
Fall 2010 Fall 2011 Fall 2012 Fall 2013 Fall 2014
Classroom Usage - Average Percent Fill
State Standard 65 65 65 65 65UHD 67 69 73 74 74% of State Standard 103% 106% 112% 114% 114%
Laboratory Usage - Average Percent Fill
State Standard 75 75 75 75 75UHD 76 85 77 81 79% of State Standard 101% 113% 103% 108% 105%
Classroom and Laboratory Use

Sources: LBB Performance Measures, IPEDS Finance Survey, UHD Budget Office
Fiscal Year Dollar Value Percent of State Appropriations
Fiscal Year 2006 $350,000 1.4%Fiscal Year 2007 $140,000 0.6%Fiscal Year 2008 $230,000 0.8%Fiscal Year 2009 $460,000 1.6%Fiscal Year 2010 $987,058 3.5%Fiscal Year 2011 $1,280,274 4.5%Fiscal Year 2012 $2,414,213 2242.4%Fiscal Year 2013 $1,287,856 1936.5%Fiscal Year 2014 $1,882,001 1009.5%
Fiscal Year Dollar ValueFiscal Year 2006 $15,749,525Fiscal Year 2007 $17,554,110Fiscal Year 2008 $16,160,710Fiscal Year 2009 $13,675,601Fiscal Year 2010 $19,547,191Fiscal Year 2011 $34,673,285Fiscal Year 2012 $35,516,039Fiscal Year 2013 $37,339,078Fiscal Year 2014 $42,656,194
Fiscal Year Dollar ValueFiscal Year 2006 $79,637,279Fiscal Year 2007 $84,650,383Fiscal Year 2008 $94,437,936Fiscal Year 2009 $100,475,435Fiscal Year 2010 $106,868,693Fiscal Year 2011 $112,348,569Fiscal Year 2012 $104,440,871 Fiscal Year 2013 $108,638,069 Fiscal Year 2014 $115,287,953 Fiscal Year 2015 $118,820,485
External or Sponsored Research
Endowment
Operating Budget

Undergraduate1 Non-MBA Graduate2 MBA Graduate3
Texas Resident $5,516 $5,756 $7,572
$14,204 $11,372 $12,564
Undergraduate4 Non-MBA Graduate4 MBA Graduate5
Texas Resident $3,108 $4,032 $3,892
$7,452 $7,776 $6,388
Undergraduate Non-MBA Graduate MBA Graduate
Texas Resident $183.00 $260.00 $408.00
$545.00 $572.00 $720.00
1 Based on 24 semester credit hours per academic year (12 per semester).2 Based on 18 semester credit hours per academic year (9 per semester).3 Based on 16 semester credit hours per academic year (8 per semester).4 Based on 12 semester credit hours per academic year (6 per semester).5 Based on 8 semester credit hours per academic year (4 per semester).
Note: Graduate (MBA and non-MBA) rates are based on what incoming fall 2014 students pay.
Tuition and Mandatory Fees
Cost Per Credit hour (Tuition only)
Non-Resident
Non-Resident
Tuition is calculated according to residence status and total semester credit hours. Tuition and mandatory student fees quoted below are subject to change by university or legislative action. Fees listed below do not include parking fees, special lab and telecommunication fees, and other fees that may be applicable to a student.
Non-Resident
Full-time Annual Tuition & Mandatory Fees:
Part-time Annual Tuition & Mandatory Fees:
Tuition rates for College of Business courses are an additional $2 per Credit Hour ($185.00 per Hour for Resident and $547.00 per hour for Non-Resident). Tuition rates for College of Sciences & Technology courses are an additional $3 per Credit Hour ($186.00 per Hour for Resident and $548.00 per hour for Non-Resident).
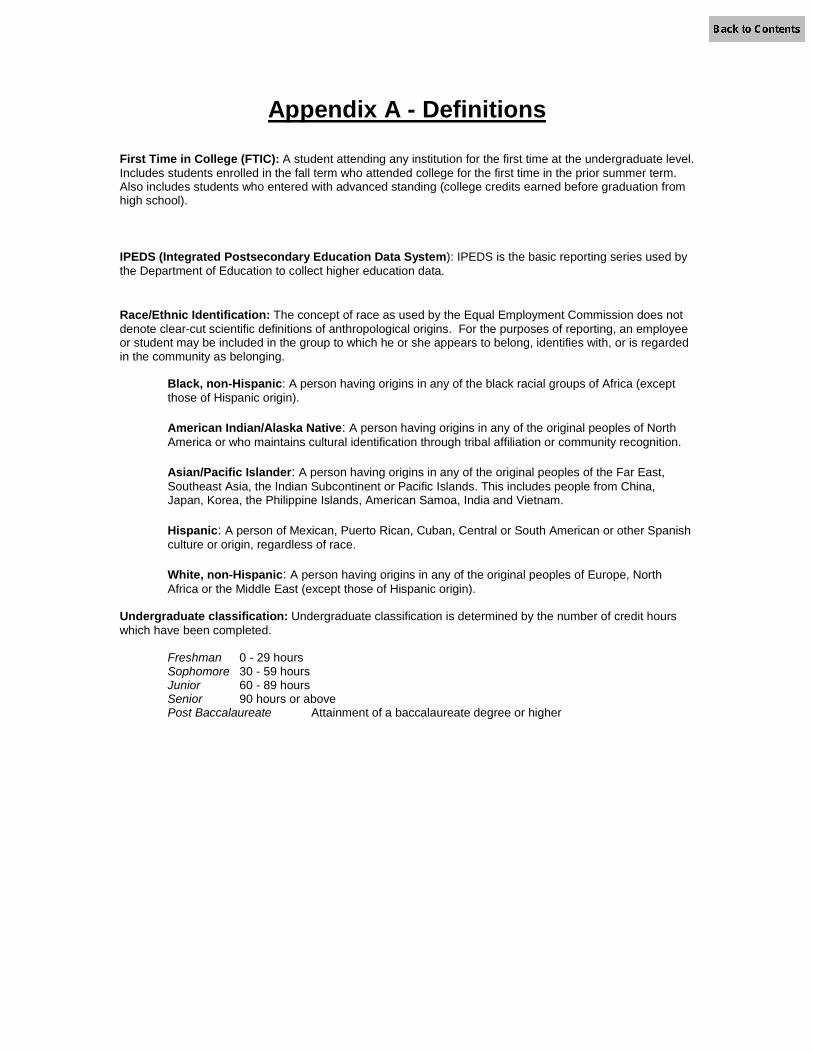
Appendix A - Definitions First Time in College (FTIC): A student attending any institution for the first time at the undergraduate level. Includes students enrolled in the fall term who attended college for the first time in the prior summer term. Also includes students who entered with advanced standing (college credits earned before graduation from high school). IPEDS (Integrated Postsecondary Education Data System): IPEDS is the basic reporting series used by the Department of Education to collect higher education data. Race/Ethnic Identification: The concept of race as used by the Equal Employment Commission does not denote clear-cut scientific definitions of anthropological origins. For the purposes of reporting, an employee or student may be included in the group to which he or she appears to belong, identifies with, or is regarded in the community as belonging.
Black, non-Hispanic: A person having origins in any of the black racial groups of Africa (except those of Hispanic origin). American Indian/Alaska Native: A person having origins in any of the original peoples of North America or who maintains cultural identification through tribal affiliation or community recognition. Asian/Pacific Islander: A person having origins in any of the original peoples of the Far East, Southeast Asia, the Indian Subcontinent or Pacific Islands. This includes people from China, Japan, Korea, the Philippine Islands, American Samoa, India and Vietnam. Hispanic: A person of Mexican, Puerto Rican, Cuban, Central or South American or other Spanish culture or origin, regardless of race. White, non-Hispanic: A person having origins in any of the original peoples of Europe, North Africa or the Middle East (except those of Hispanic origin).
Undergraduate classification: Undergraduate classification is determined by the number of credit hours which have been completed.
Freshman 0 - 29 hours Sophomore 30 - 59 hours Junior 60 - 89 hours Senior 90 hours or above Post Baccalaureate Attainment of a baccalaureate degree or higher
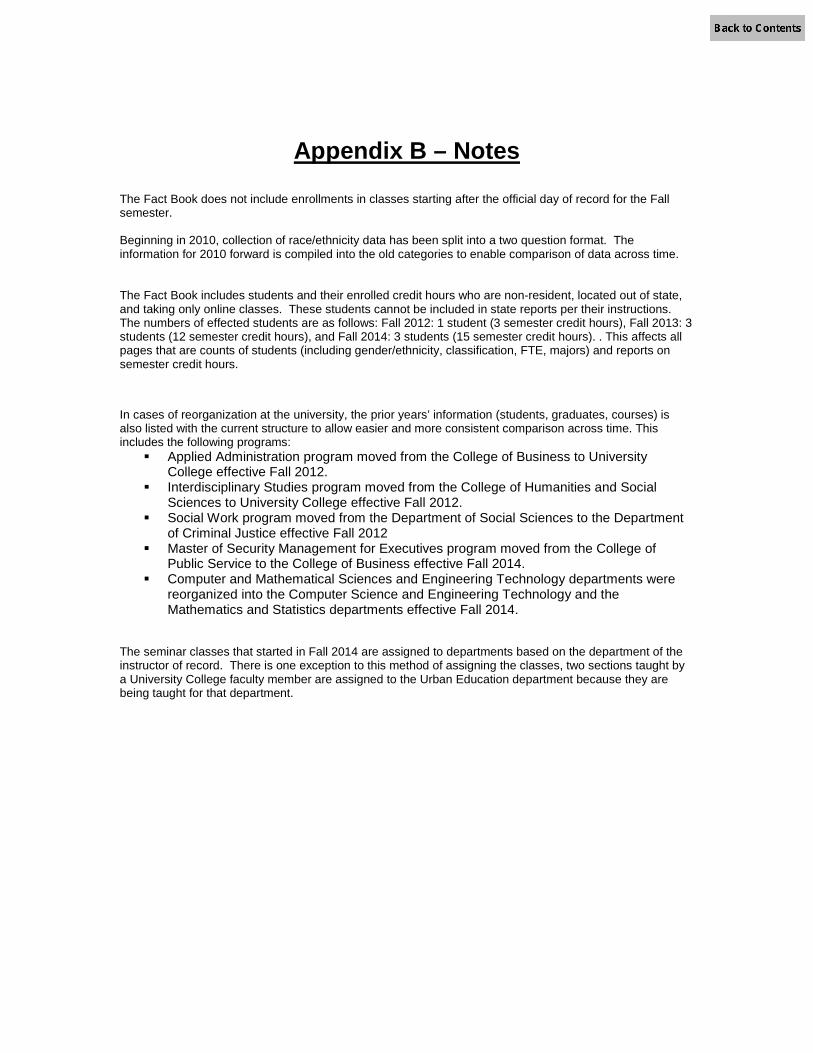
Appendix B – Notes
The Fact Book does not include enrollments in classes starting after the official day of record for the Fall semester. Beginning in 2010, collection of race/ethnicity data has been split into a two question format. The information for 2010 forward is compiled into the old categories to enable comparison of data across time. The Fact Book includes students and their enrolled credit hours who are non-resident, located out of state, and taking only online classes. These students cannot be included in state reports per their instructions. The numbers of effected students are as follows: Fall 2012: 1 student (3 semester credit hours), Fall 2013: 3 students (12 semester credit hours), and Fall 2014: 3 students (15 semester credit hours). . This affects all pages that are counts of students (including gender/ethnicity, classification, FTE, majors) and reports on semester credit hours. In cases of reorganization at the university, the prior years’ information (students, graduates, courses) is also listed with the current structure to allow easier and more consistent comparison across time. This includes the following programs:
Applied Administration program moved from the College of Business to University College effective Fall 2012.
Interdisciplinary Studies program moved from the College of Humanities and Social Sciences to University College effective Fall 2012.
Social Work program moved from the Department of Social Sciences to the Department of Criminal Justice effective Fall 2012
Master of Security Management for Executives program moved from the College of Public Service to the College of Business effective Fall 2014.
Computer and Mathematical Sciences and Engineering Technology departments were reorganized into the Computer Science and Engineering Technology and the Mathematics and Statistics departments effective Fall 2014.
The seminar classes that started in Fall 2014 are assigned to departments based on the department of the instructor of record. There is one exception to this method of assigning the classes, two sections taught by a University College faculty member are assigned to the Urban Education department because they are being taught for that department.