Embed Size (px)
Citation preview
Houston Downtown Retail Analysis Prepared for: Houston Downtown Management District Prepared by: Gibbs Planning Group, Inc.
January 10, 2010
TABLE OF CONTENTS 1.0 INTRODUCTION………………………………………………………………….. 11.1 Executive Summary………………………………………………………………. 11.2 Purpose of Study………………………………………………………………….. 4 2.0 TRADE AREAS AND DEMOGRAPHICS……………………………………… 52.1 Local Trade Area………………………………………………………………….. 52.2 Office Worker Demographics and Impact………………………………………. 62.3 Tourist and Convention Attendee Demographics and Impacts……………… 72.4 Primary Trade Area………………………………………………………………. 82.5 Tertiary Trade Area……………………………………………………………….. 92.6 Tapestry Lifestyles………………………………………………………………... 10 3.0 MARKET CONDITIONS…………………………………………………………. 143.1 Retail and Restaurant Demand………………………………………………….. 143.2 Tourism Expenditure…………………………………………………………….... 153.3 Workforce Expenditures………………………………………………………….. 173.4 Commercial Trade Areas………………………………………………………… 17
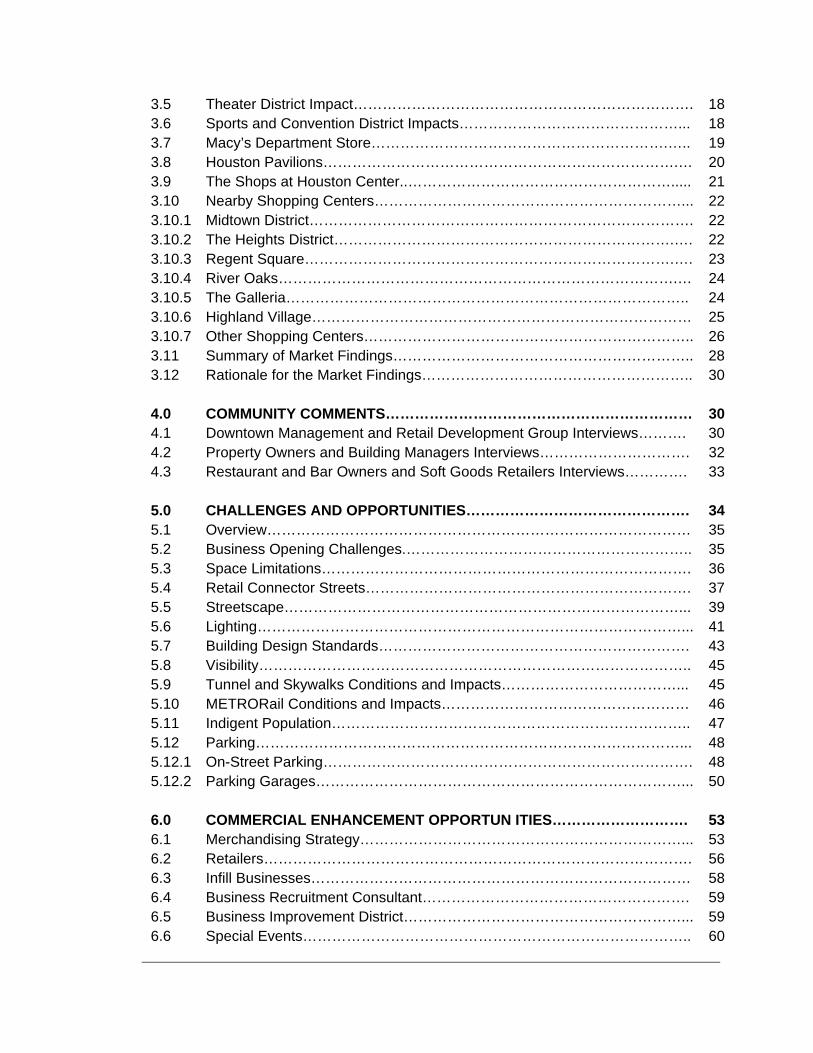
3.5 Theater District Impact……………………………………………………………. 183.6 Sports and Convention District Impacts………………………………………... 183.7 Macy’s Department Store…………………………………………………….….. 193.8 Houston Pavilions……………………………………………………………….… 203.9 The Shops at Houston Center..………………………………………………..... 213.10 Nearby Shopping Centers………………………………………………………... 223.10.1 Midtown District……………………………………………………………………. 223.10.2 The Heights District…………………………………………………………….…. 223.10.3 Regent Square………………………………………………………………….…. 233.10.4 River Oaks……………………………………………………………………….… 243.10.5 The Galleria……………………………………………………………………….. 243.10.6 Highland Village…………………………………………………………………… 253.10.7 Other Shopping Centers………………………………………………………….. 263.11 Summary of Market Findings…………………………………………………….. 283.12 Rationale for the Market Findings……………………………………………….. 30 4.0 COMMUNITY COMMENTS……………………………………………………… 304.1 Downtown Management and Retail Development Group Interviews………. 304.2 Property Owners and Building Managers Interviews…………………………. 324.3 Restaurant and Bar Owners and Soft Goods Retailers Interviews…………. 33 5.0 CHALLENGES AND OPPORTUNITIES………………………………………. 345.1 Overview…………………………………………………………………………… 355.2 Business Opening Challenges.………………………………………………….. 355.3 Space Limitations…………………………………………………………………. 365.4 Retail Connector Streets…………………………………………………………. 375.5 Streetscape………………………………………………………………………... 395.6 Lighting……………………………………………………………………………... 415.7 Building Design Standards………………………………………………………. 435.8 Visibility…………………………………………………………………………….. 455.9 Tunnel and Skywalks Conditions and Impacts………………………………... 455.10 METRORail Conditions and Impacts…………………………………………… 465.11 Indigent Population……………………………………………………………….. 475.12 Parking……………………………………………………………………………... 485.12.1 On-Street Parking…………………………………………………………………. 485.12.2 Parking Garages…………………………………………………………………... 50 6.0 COMMERCIAL ENHANCEMENT OPPORTUN ITIES………………………. 536.1 Merchandising Strategy…………………………………………………………... 536.2 Retailers……………………………………………………………………………. 566.3 Infill Businesses…………………………………………………………………… 586.4 Business Recruitment Consultant………………………………………………. 596.5 Business Improvement District…………………………………………………... 596.6 Special Events…………………………………………………………………….. 60
6.7 Marketing………………………………………………………………………….. 616.8 Wayfinding Signage……………………………………………………………... 61 7.0 SIMILAR HISTORIC DISTRICTS………………………………………………. 617.1 Charleston, South Carolina……………………………………………………… 627.2 Naples, Florida……………………………………………………………………. 63 8.0 CONDITIONS OF STUDY……………………………………………………….. 648.1 Methodology……………………………………………………………………….. 648.2 Limits of Study…………………………………………………………………….. 65
Downtown Houston Retail Analysis 1 Gibbs Planning Group, Inc. January 10, 2010
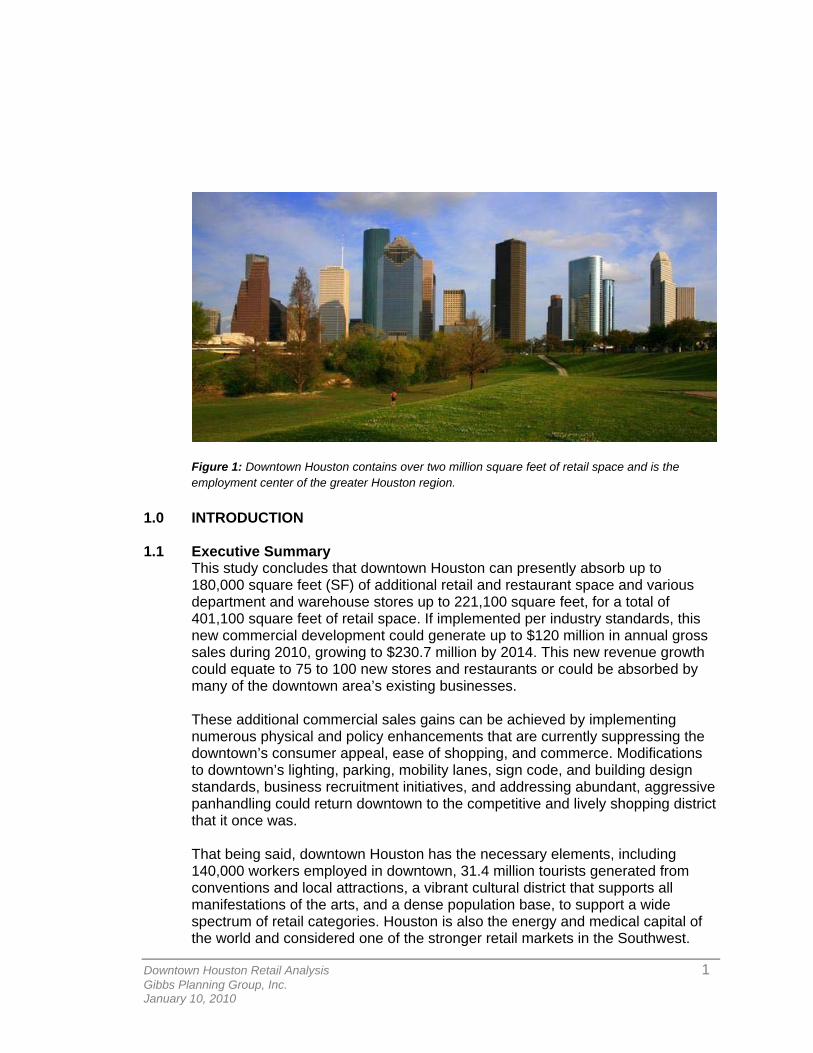
Figure 1: Downtown Houston contains over two million square feet of retail space and is the employment center of the greater Houston region.
1.0 INTRODUCTION
1.1 Executive Summary
This study concludes that downtown Houston can presently absorb up to 180,000 square feet (SF) of additional retail and restaurant space and various department and warehouse stores up to 221,100 square feet, for a total of 401,100 square feet of retail space. If implemented per industry standards, this new commercial development could generate up to $120 million in annual gross sales during 2010, growing to $230.7 million by 2014. This new revenue growth could equate to 75 to 100 new stores and restaurants or could be absorbed by many of the downtown area’s existing businesses. These additional commercial sales gains can be achieved by implementing numerous physical and policy enhancements that are currently suppressing the downtown’s consumer appeal, ease of shopping, and commerce. Modifications to downtown’s lighting, parking, mobility lanes, sign code, and building design standards, business recruitment initiatives, and addressing abundant, aggressive panhandling could return downtown to the competitive and lively shopping district that it once was. That being said, downtown Houston has the necessary elements, including 140,000 workers employed in downtown, 31.4 million tourists generated from conventions and local attractions, a vibrant cultural district that supports all manifestations of the arts, and a dense population base, to support a wide spectrum of retail categories. Houston is also the energy and medical capital of the world and considered one of the stronger retail markets in the Southwest.
Downtown Houston Retail Analysis 2 Gibbs Planning Group, Inc. January 10, 2010
010,00020,00030,00040,00050,00060,00070,00080,00090,000
100,000
Lugg
age
& Le
athe
r Sto
reU
sed
Mer
chan
dise
Sto
reB
eer,
Win
e &
Liq
uor S
tore
Jew
erly
Sto
reP
erso
nal S
ervi
ces
Toy
and
Hob
by S
tore
Art,
Cra
ft an
d Se
win
g …U
nise
x A
ppar
elLa
wn,
Gar
den
Equi
pmen
t …M
usic
al In
stru
men
t Sto
reC
ompu
ters
and
Sof
twar
eAp
plia
nces
Book
& M
usic
Sto
res
Hea
lth a
nd B
eaut
y St
ore
Car
d/G
ift S
hop
Chi
ldre
n's
App
arel
Dru
g St
ore/
Phar
mac
eutic
alG
roce
ry S
tore
Offi
ce S
uppl
ies,
Sta
tiona
ryG
ener
al E
lect
roni
csSh
oe S
tore
Lim
ited
Serv
ice
Res
taur
ant
Drin
king
Pla
ces
Spo
rting
Goo
d St
ore
Men
's A
ppar
elW
omen
's A
ppar
elW
areh
ouse
Clu
bD
isco
unt D
epar
tmen
t Sto
reD
epar
tmen
t Sto
reSupp
orta
ble
Squa
re F
oota
ge
Supportable Retail SF by Retail Category
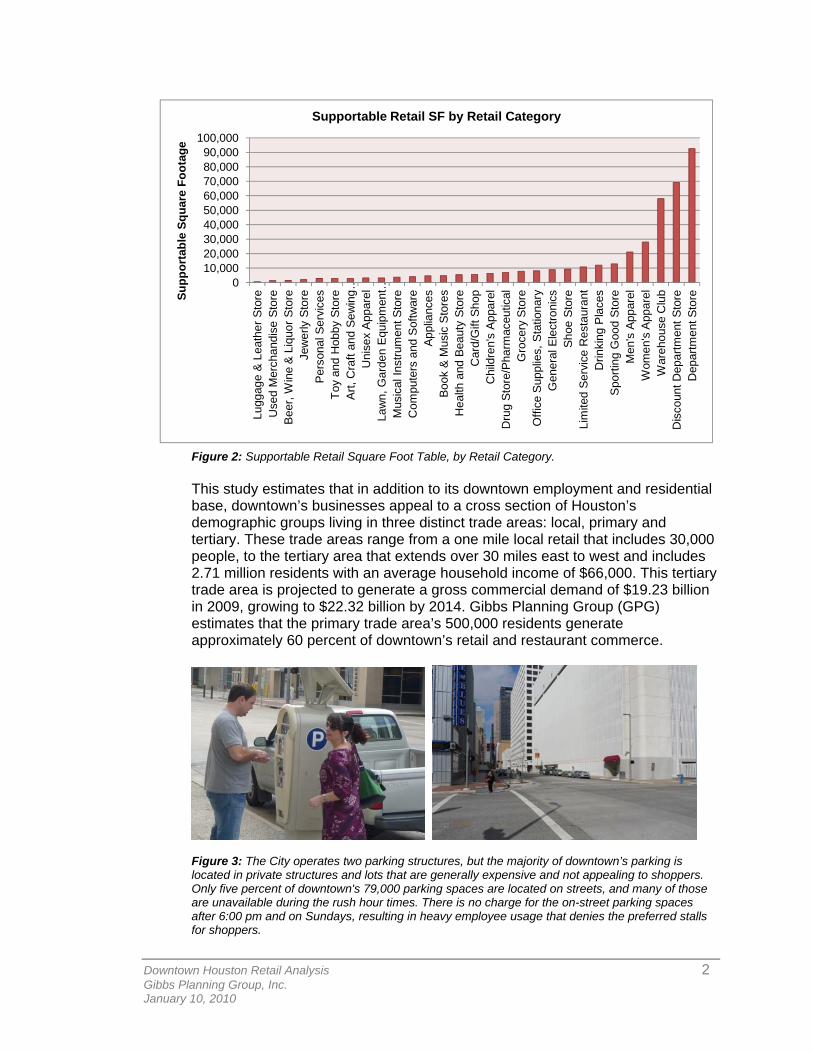
Figure 2: Supportable Retail Square Foot Table, by Retail Category. This study estimates that in addition to its downtown employment and residential base, downtown’s businesses appeal to a cross section of Houston’s demographic groups living in three distinct trade areas: local, primary and tertiary. These trade areas range from a one mile local retail that includes 30,000 people, to the tertiary area that extends over 30 miles east to west and includes 2.71 million residents with an average household income of $66,000. This tertiary trade area is projected to generate a gross commercial demand of $19.23 billion in 2009, growing to $22.32 billion by 2014. Gibbs Planning Group (GPG) estimates that the primary trade area’s 500,000 residents generate approximately 60 percent of downtown’s retail and restaurant commerce.
Figure 3: The City operates two parking structures, but the majority of downtown’s parking is located in private structures and lots that are generally expensive and not appealing to shoppers. Only five percent of downtown's 79,000 parking spaces are located on streets, and many of those are unavailable during the rush hour times. There is no charge for the on-street parking spaces after 6:00 pm and on Sundays, resulting in heavy employee usage that denies the preferred stalls for shoppers.
Downtown Houston Retail Analysis 3 Gibbs Planning Group, Inc. January 10, 2010
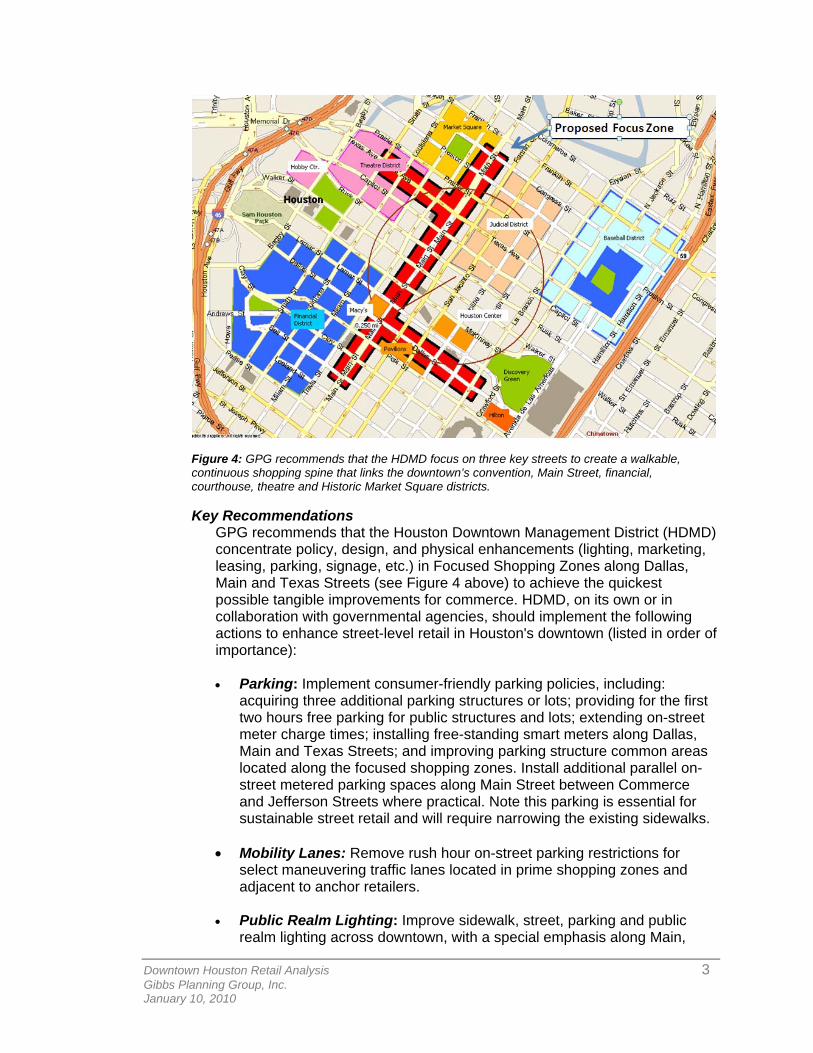
Figure 4: GPG recommends that the HDMD focus on three key streets to create a walkable, continuous shopping spine that links the downtown’s convention, Main Street, financial, courthouse, theatre and Historic Market Square districts. Key Recommendations
GPG recommends that the Houston Downtown Management District (HDMD) concentrate policy, design, and physical enhancements (lighting, marketing, leasing, parking, signage, etc.) in Focused Shopping Zones along Dallas, Main and Texas Streets (see Figure 4 above) to achieve the quickest possible tangible improvements for commerce. HDMD, on its own or in collaboration with governmental agencies, should implement the following actions to enhance street-level retail in Houston's downtown (listed in order of importance):
• Parking: Implement consumer-friendly parking policies, including:
acquiring three additional parking structures or lots; providing for the first two hours free parking for public structures and lots; extending on-street meter charge times; installing free-standing smart meters along Dallas, Main and Texas Streets; and improving parking structure common areas located along the focused shopping zones. Install additional parallel on-street metered parking spaces along Main Street between Commerce and Jefferson Streets where practical. Note this parking is essential for sustainable street retail and will require narrowing the existing sidewalks.
• Mobility Lanes: Remove rush hour on-street parking restrictions for select maneuvering traffic lanes located in prime shopping zones and adjacent to anchor retailers.
• Public Realm Lighting: Improve sidewalk, street, parking and public realm lighting across downtown, with a special emphasis along Main,
Downtown Houston Retail Analysis 4 Gibbs Planning Group, Inc. January 10, 2010
Dallas and Texas Streets and around the Historic Market Square (see Figure 4). Install tree lighting in key locations along Dallas and Main Streets.
• Private Realm Lighting: Along focused areas (see Figure 4), work with private property owners to repair non-working store window and exterior lighting. Install new fixtures where warranted.
• Panhandling: Implement more effective policies to reduce aggressive panhandling and loitering along primary commercial areas including: The Historic Market Square and Main, Dallas, and Texas Streets. Implement a team of trained street ambassadors to assist downtown visitors, report maintenance and safety issues and to manage homeless and panhandlers. This system has been proven successful in numerous large cities.
• Building Design Standards: Implement building design standards that
require street level commercial frontages and other urban design standards similar to those adopted by leading cities throughout the world.
• Signage: Modify commercial signage standards for street level and
anchor businesses to allow for more visibility and to match modern industry standards (as is common in the greater Houston region).
• Business Recruitment: Employ a qualified commercial broker team to
recruit tenants in accord with a tenant mix strategy. 1.2 Purpose of Study
GPG has been retained by the HDMD to conduct an independent third-party analysis of Houston’s urban characteristics and City policies as they relate to downtown Houston and with a focus on the following areas: the Historic District, Main Street Square, Houston Pavilions and the George R. Brown Convention Center (GRBCC), and the possible street-level retail connections between them. The broad purpose of this study is to identify the challenges and opportunities for increasing Houston’s commerce without compromising the quality of life for its surrounding neighborhoods or its historical heritage. Both issues are intertwined and dependent upon each other.
The following issues were addressed by GPG in this study:
• What are the strengths, opportunities and concerns of downtown Houston’s commerce from the point of view of community groups, residents, business owners, building owners, property managers, workers, and the HDMD staff?
• What are the general trends and opportunities for Houston business sales and growth?
• What do downtown Houston’s retailers and restaurants consider their major strengths and opportunities? What have been individual business sales trends during the past five years? Is downtown Houston a good location for their business model?
Downtown Houston Retail Analysis 5 Gibbs Planning Group, Inc. January 10, 2010
• How is downtown Houston’s built environment—including the streetscape and parking—impacting downtown commerce?
• What specific changes in HDMD operations and in City policies and
ordinances, including parking, security, signage, maintenance, and building approvals, would downtown Houston’s businesses, property owners, residents and stakeholders like to have modified? Will these modifications have the desired effect on downtown commerce?
• What is the potential growth for retail and restaurant expenditures for the next
five years?
• How is the new METRORail line on Main Street affecting downtown Houston businesses? Are there opportunities to improve METRORail operations to expand downtown commerce?
2.0 TRADE AREAS AND DEMOGRAPHICS Based on GPG’s field evaluation and interviews with local, regional, and national businesses, it was determined that the Houston downtown area currently has neighborhood, local, and regional draws that define three distinct trade areas: local, primary and tertiary.
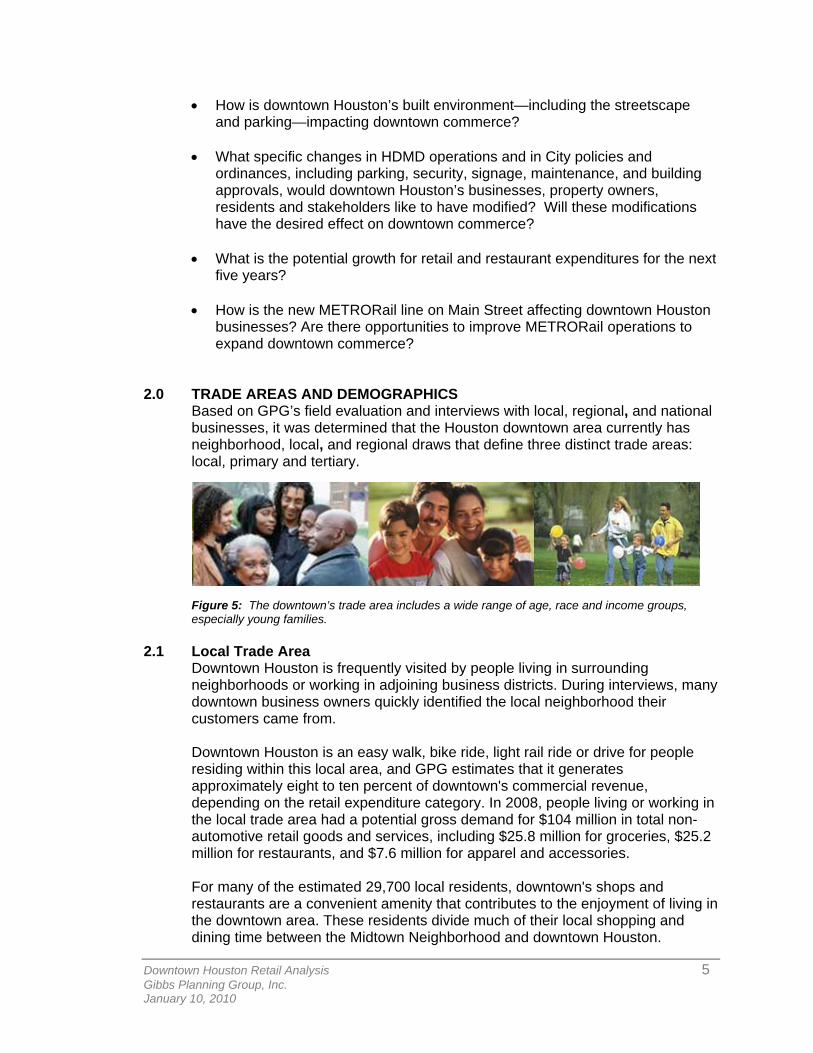
Figure 5: The downtown’s trade area includes a wide range of age, race and income groups, especially young families.
2.1 Local Trade Area Downtown Houston is frequently visited by people living in surrounding neighborhoods or working in adjoining business districts. During interviews, many downtown business owners quickly identified the local neighborhood their customers came from. Downtown Houston is an easy walk, bike ride, light rail ride or drive for people residing within this local area, and GPG estimates that it generates approximately eight to ten percent of downtown's commercial revenue, depending on the retail expenditure category. In 2008, people living or working in the local trade area had a potential gross demand for $104 million in total non-automotive retail goods and services, including $25.8 million for groceries, $25.2 million for restaurants, and $7.6 million for apparel and accessories. For many of the estimated 29,700 local residents, downtown's shops and restaurants are a convenient amenity that contributes to the enjoyment of living in the downtown area. These residents divide much of their local shopping and dining time between the Midtown Neighborhood and downtown Houston.
Downtown Houston Retail Analysis 6 Gibbs Planning Group, Inc. January 10, 2010
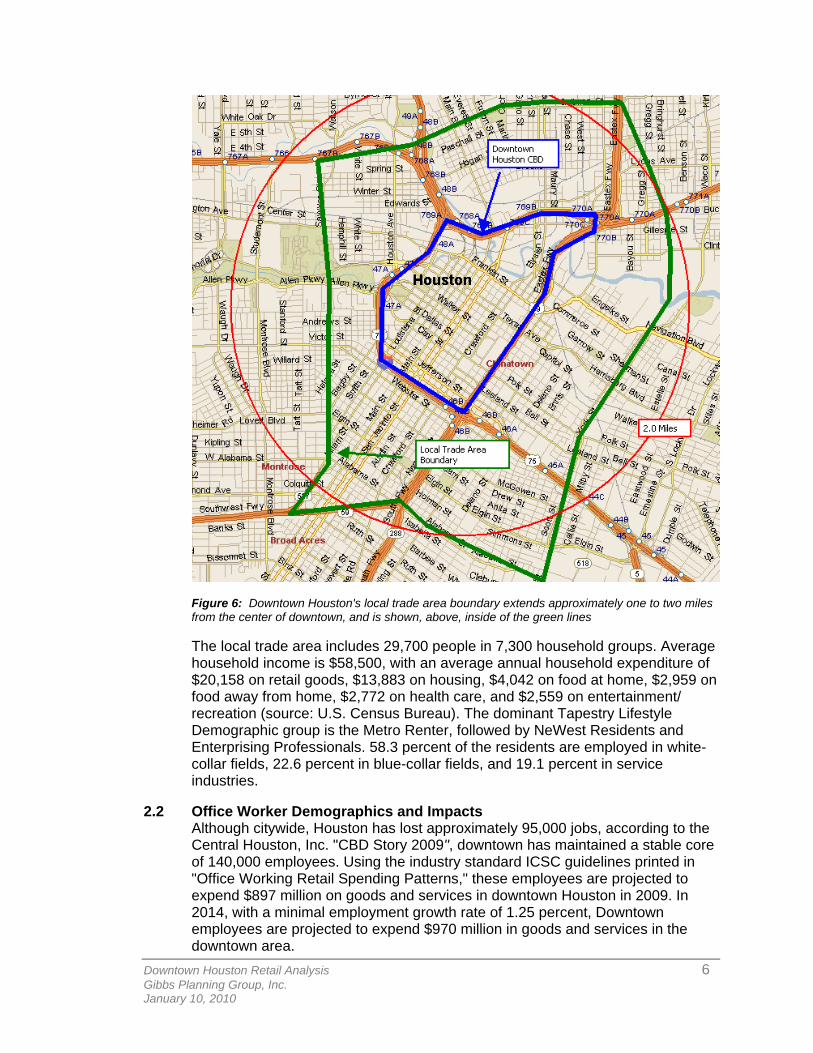
Figure 6: Downtown Houston's local trade area boundary extends approximately one to two miles from the center of downtown, and is shown, above, inside of the green lines The local trade area includes 29,700 people in 7,300 household groups. Average household income is $58,500, with an average annual household expenditure of $20,158 on retail goods, $13,883 on housing, $4,042 on food at home, $2,959 on food away from home, $2,772 on health care, and $2,559 on entertainment/ recreation (source: U.S. Census Bureau). The dominant Tapestry Lifestyle Demographic group is the Metro Renter, followed by NeWest Residents and Enterprising Professionals. 58.3 percent of the residents are employed in white-collar fields, 22.6 percent in blue-collar fields, and 19.1 percent in service industries.
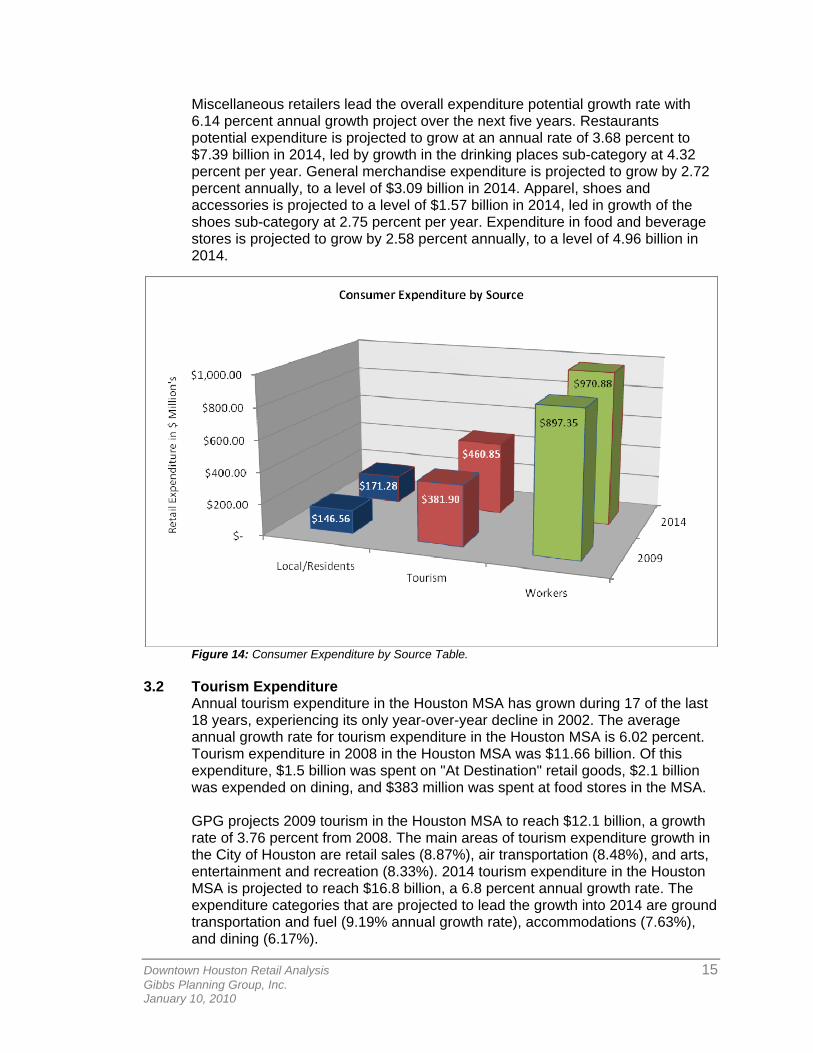
2.2 Office Worker Demographics and Impacts Although citywide, Houston has lost approximately 95,000 jobs, according to the Central Houston, Inc. "CBD Story 2009", downtown has maintained a stable core of 140,000 employees. Using the industry standard ICSC guidelines printed in "Office Working Retail Spending Patterns," these employees are projected to expend $897 million on goods and services in downtown Houston in 2009. In 2014, with a minimal employment growth rate of 1.25 percent, Downtown employees are projected to expend $970 million in goods and services in the downtown area.
Downtown Houston Retail Analysis 7 Gibbs Planning Group, Inc. January 10, 2010
On average, these employees are projected to have spent over $6,400 each in 2009 before, during, and after work. The major retail category for this expenditure is Dining, with an estimated $331 million spent on full-service dining, followed by General Merchandise in department and discount department store categories. The third major category for worker expenditure is the Grocery category at $123 million, followed by Apparel and Accessories at $91 million per year.
2.3 Tourist and Convention Attendee Demographics and Impacts
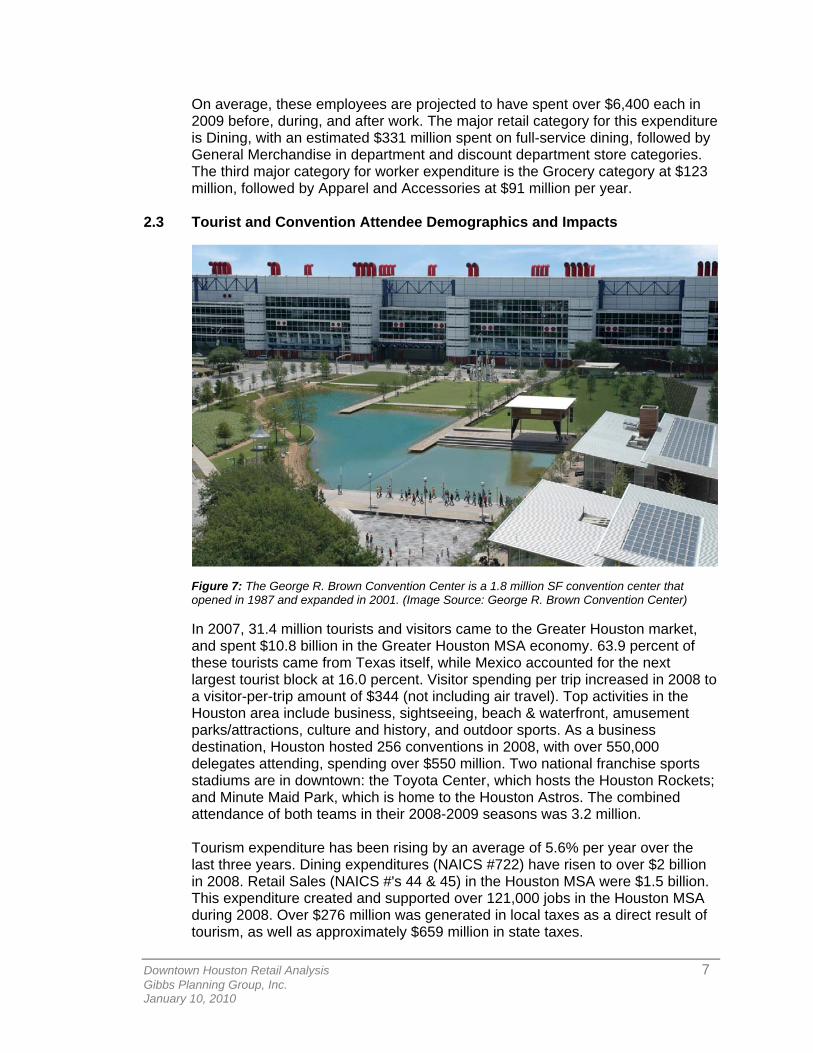
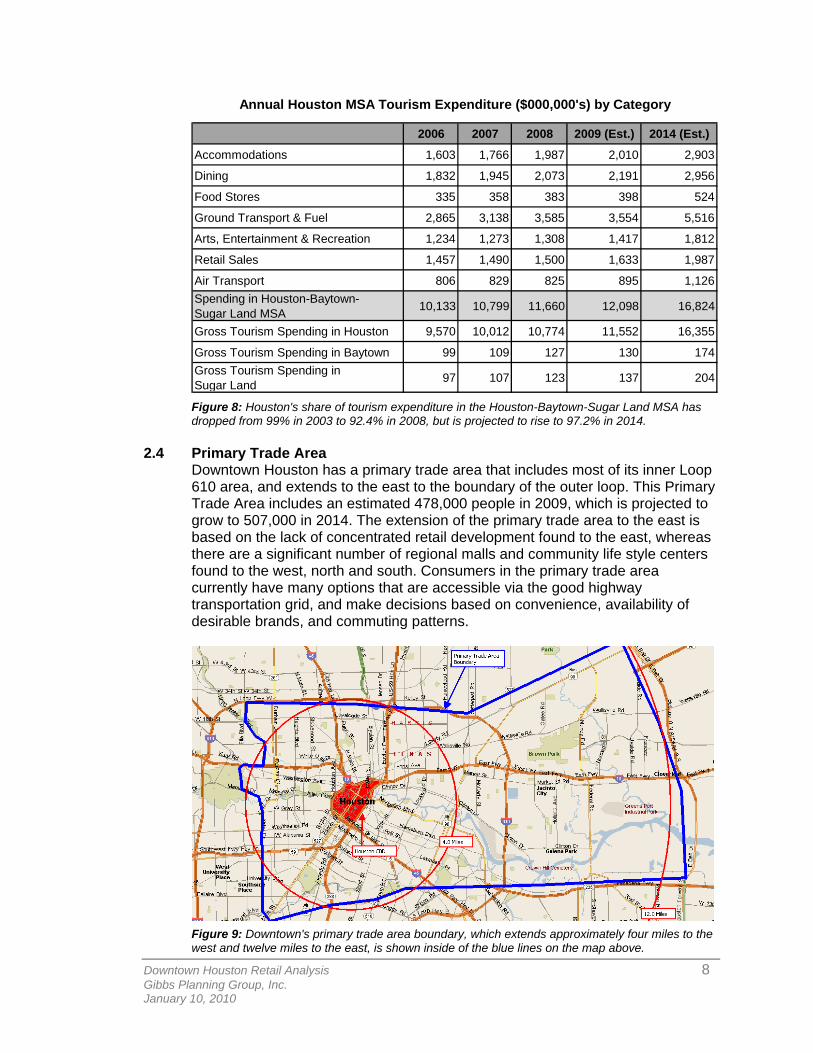
Figure 7: The George R. Brown Convention Center is a 1.8 million SF convention center that opened in 1987 and expanded in 2001. (Image Source: George R. Brown Convention Center) In 2007, 31.4 million tourists and visitors came to the Greater Houston market, and spent $10.8 billion in the Greater Houston MSA economy. 63.9 percent of these tourists came from Texas itself, while Mexico accounted for the next largest tourist block at 16.0 percent. Visitor spending per trip increased in 2008 to a visitor-per-trip amount of $344 (not including air travel). Top activities in the Houston area include business, sightseeing, beach & waterfront, amusement parks/attractions, culture and history, and outdoor sports. As a business destination, Houston hosted 256 conventions in 2008, with over 550,000 delegates attending, spending over $550 million. Two national franchise sports stadiums are in downtown: the Toyota Center, which hosts the Houston Rockets; and Minute Maid Park, which is home to the Houston Astros. The combined attendance of both teams in their 2008-2009 seasons was 3.2 million. Tourism expenditure has been rising by an average of 5.6% per year over the last three years. Dining expenditures (NAICS #722) have risen to over $2 billion in 2008. Retail Sales (NAICS #'s 44 & 45) in the Houston MSA were $1.5 billion. This expenditure created and supported over 121,000 jobs in the Houston MSA during 2008. Over $276 million was generated in local taxes as a direct result of tourism, as well as approximately $659 million in state taxes.
Downtown Houston Retail Analysis 8 Gibbs Planning Group, Inc. January 10, 2010
2006 2007 2008 2009 (Est.) 2014 (Est.)
Accommodations 1,603 1,766 1,987 2,010 2,903
Dining 1,832 1,945 2,073 2,191 2,956
Food Stores 335 358 383 398 524
Ground Transport & Fuel 2,865 3,138 3,585 3,554 5,516
Arts, Entertainment & Recreation 1,234 1,273 1,308 1,417 1,812
Retail Sales 1,457 1,490 1,500 1,633 1,987
Air Transport 806 829 825 895 1,126Spending in Houston-Baytown- Sugar Land MSA 10,133 10,799 11,660 12,098 16,824
Gross Tourism Spending in Houston 9,570 10,012 10,774 11,552 16,355
Gross Tourism Spending in Baytown 99 109 127 130 174Gross Tourism Spending in Sugar Land 97 107 123 137 204
Annual Houston MSA Tourism Expenditure ($000,000's) by Category
Figure 8: Houston's share of tourism expenditure in the Houston-Baytown-Sugar Land MSA has dropped from 99% in 2003 to 92.4% in 2008, but is projected to rise to 97.2% in 2014.
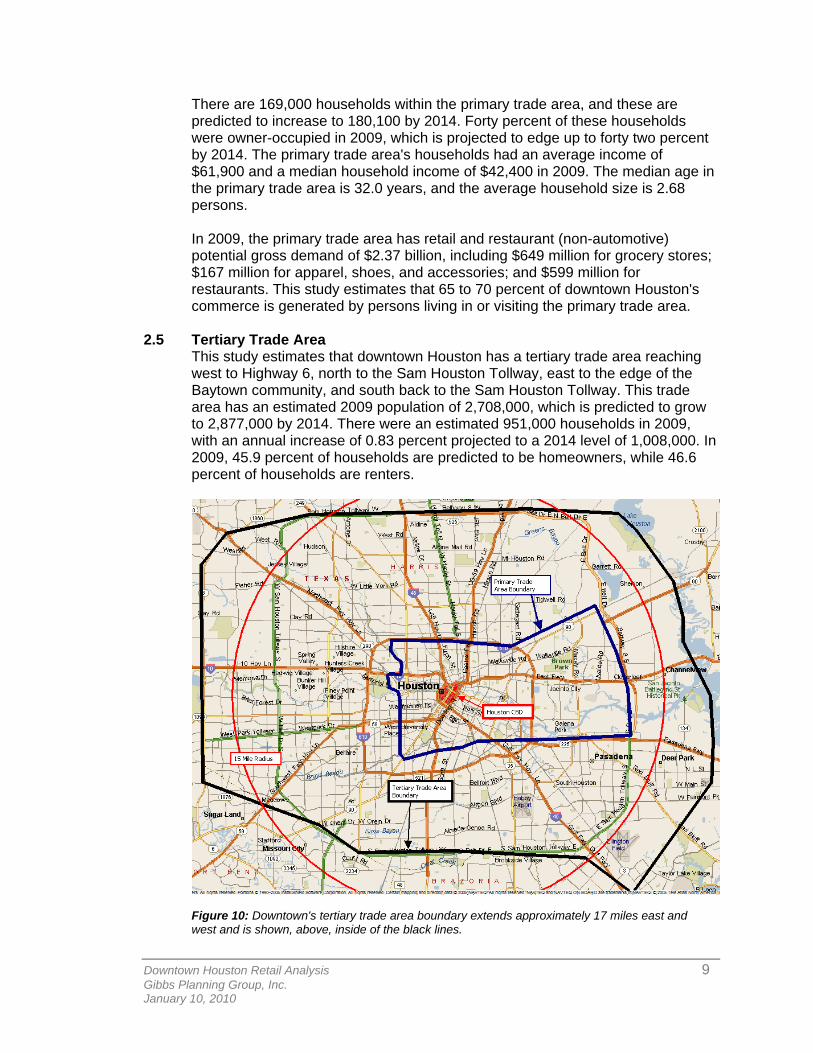
2.4 Primary Trade Area Downtown Houston has a primary trade area that includes most of its inner Loop 610 area, and extends to the east to the boundary of the outer loop. This Primary Trade Area includes an estimated 478,000 people in 2009, which is projected to grow to 507,000 in 2014. The extension of the primary trade area to the east is based on the lack of concentrated retail development found to the east, whereas there are a significant number of regional malls and community life style centers found to the west, north and south. Consumers in the primary trade area currently have many options that are accessible via the good highway transportation grid, and make decisions based on convenience, availability of desirable brands, and commuting patterns.
Figure 9: Downtown's primary trade area boundary, which extends approximately four miles to the west and twelve miles to the east, is shown inside of the blue lines on the map above.
Downtown Houston Retail Analysis 9 Gibbs Planning Group, Inc. January 10, 2010
There are 169,000 households within the primary trade area, and these are predicted to increase to 180,100 by 2014. Forty percent of these households were owner-occupied in 2009, which is projected to edge up to forty two percent by 2014. The primary trade area's households had an average income of $61,900 and a median household income of $42,400 in 2009. The median age in the primary trade area is 32.0 years, and the average household size is 2.68 persons. In 2009, the primary trade area has retail and restaurant (non-automotive) potential gross demand of $2.37 billion, including $649 million for grocery stores; $167 million for apparel, shoes, and accessories; and $599 million for restaurants. This study estimates that 65 to 70 percent of downtown Houston's commerce is generated by persons living in or visiting the primary trade area.
2.5 Tertiary Trade Area
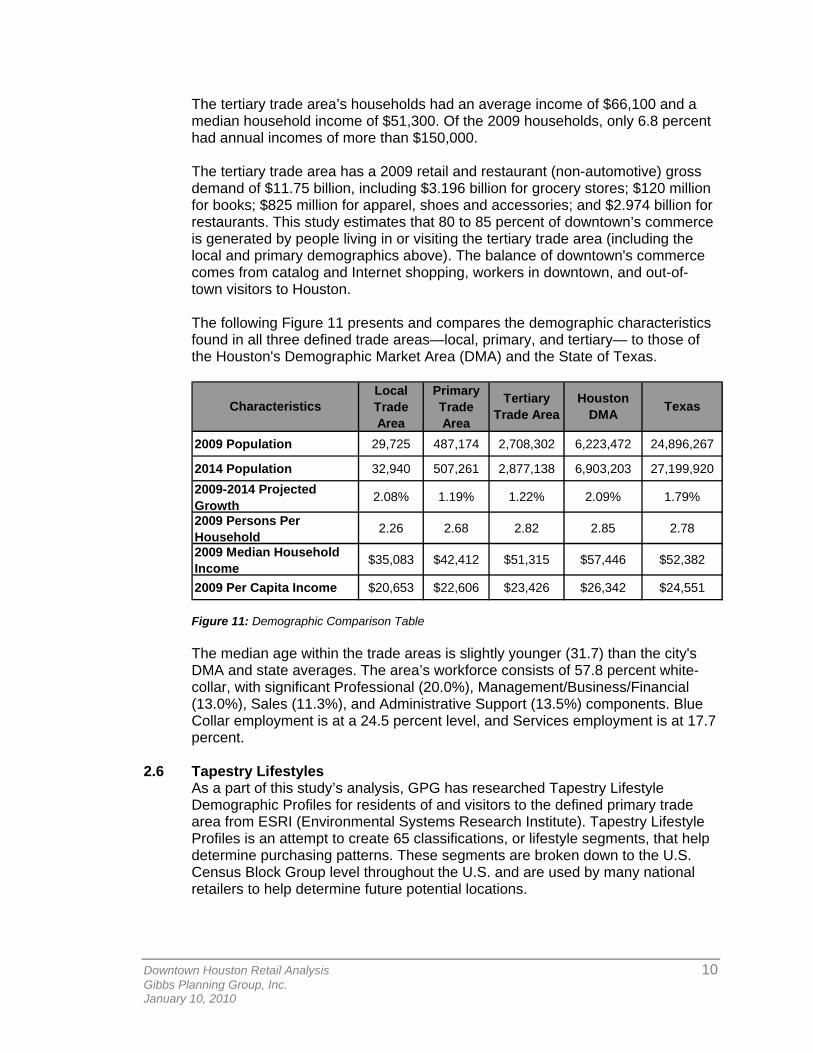
This study estimates that downtown Houston has a tertiary trade area reaching west to Highway 6, north to the Sam Houston Tollway, east to the edge of the Baytown community, and south back to the Sam Houston Tollway. This trade area has an estimated 2009 population of 2,708,000, which is predicted to grow to 2,877,000 by 2014. There were an estimated 951,000 households in 2009, with an annual increase of 0.83 percent projected to a 2014 level of 1,008,000. In 2009, 45.9 percent of households are predicted to be homeowners, while 46.6 percent of households are renters.
Figure 10: Downtown's tertiary trade area boundary extends approximately 17 miles east and west and is shown, above, inside of the black lines.
Downtown Houston Retail Analysis 10 Gibbs Planning Group, Inc. January 10, 2010
The tertiary trade area’s households had an average income of $66,100 and a median household income of $51,300. Of the 2009 households, only 6.8 percent had annual incomes of more than $150,000. The tertiary trade area has a 2009 retail and restaurant (non-automotive) gross demand of $11.75 billion, including $3.196 billion for grocery stores; $120 million for books; $825 million for apparel, shoes and accessories; and $2.974 billion for restaurants. This study estimates that 80 to 85 percent of downtown’s commerce is generated by people living in or visiting the tertiary trade area (including the local and primary demographics above). The balance of downtown's commerce comes from catalog and Internet shopping, workers in downtown, and out-of-town visitors to Houston. The following Figure 11 presents and compares the demographic characteristics found in all three defined trade areas—local, primary, and tertiary— to those of the Houston's Demographic Market Area (DMA) and the State of Texas.
2009 Population 29,725 487,174 2,708,302 6,223,472 24,896,267
2014 Population 32,940 507,261 2,877,138 6,903,203 27,199,9202009-2014 Projected Growth
2.08% 1.19% 1.22% 2.09% 1.79%
2009 Persons Per Household
2.26 2.68 2.82 2.85 2.78
2009 Median Household Income
$35,083 $42,412 $51,315 $57,446 $52,382
2009 Per Capita Income $20,653 $22,606 $23,426 $26,342 $24,551
Characteristics Houston DMA Texas
Local Trade Area
Primary Trade Area
Tertiary Trade Area
Figure 11: Demographic Comparison Table The median age within the trade areas is slightly younger (31.7) than the city's DMA and state averages. The area’s workforce consists of 57.8 percent white-collar, with significant Professional (20.0%), Management/Business/Financial (13.0%), Sales (11.3%), and Administrative Support (13.5%) components. Blue Collar employment is at a 24.5 percent level, and Services employment is at 17.7 percent.
2.6 Tapestry Lifestyles As a part of this study’s analysis, GPG has researched Tapestry Lifestyle Demographic Profiles for residents of and visitors to the defined primary trade area from ESRI (Environmental Systems Research Institute). Tapestry Lifestyle Profiles is an attempt to create 65 classifications, or lifestyle segments, that help determine purchasing patterns. These segments are broken down to the U.S. Census Block Group level throughout the U.S. and are used by many national retailers to help determine future potential locations.
Downtown Houston Retail Analysis 11 Gibbs Planning Group, Inc. January 10, 2010
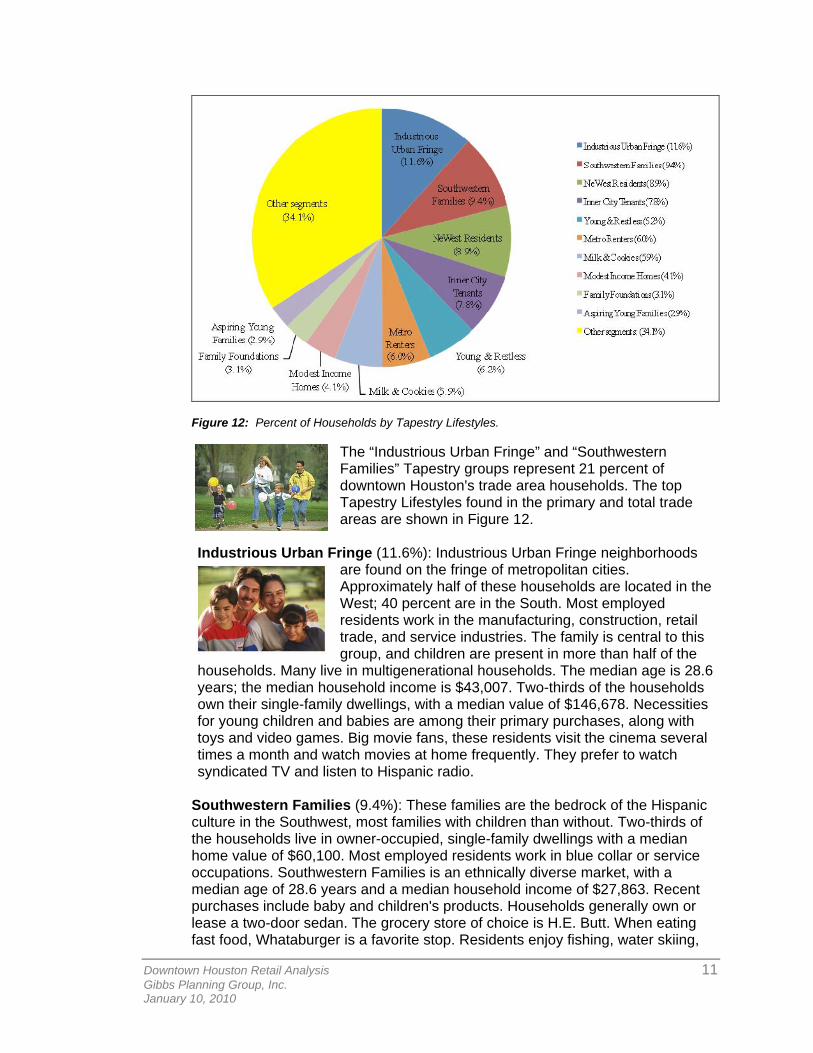
Figure 12: Percent of Households by Tapestry Lifestyles.
The “Industrious Urban Fringe” and “Southwestern Families” Tapestry groups represent 21 percent of downtown Houston's trade area households. The top Tapestry Lifestyles found in the primary and total trade areas are shown in Figure 12.
Industrious Urban Fringe (11.6%): Industrious Urban Fringe neighborhoods
are found on the fringe of metropolitan cities. Approximately half of these households are located in the West; 40 percent are in the South. Most employed residents work in the manufacturing, construction, retail trade, and service industries. The family is central to this group, and children are present in more than half of the
households. Many live in multigenerational households. The median age is 28.6 years; the median household income is $43,007. Two-thirds of the households own their single-family dwellings, with a median value of $146,678. Necessities for young children and babies are among their primary purchases, along with toys and video games. Big movie fans, these residents visit the cinema several times a month and watch movies at home frequently. They prefer to watch syndicated TV and listen to Hispanic radio.
Southwestern Families (9.4%): These families are the bedrock of the Hispanic culture in the Southwest, most families with children than without. Two-thirds of the households live in owner-occupied, single-family dwellings with a median home value of $60,100. Most employed residents work in blue collar or service occupations. Southwestern Families is an ethnically diverse market, with a median age of 28.6 years and a median household income of $27,863. Recent purchases include baby and children's products. Households generally own or lease a two-door sedan. The grocery store of choice is H.E. Butt. When eating fast food, Whataburger is a favorite stop. Residents enjoy fishing, water skiing,
Downtown Houston Retail Analysis 12 Gibbs Planning Group, Inc. January 10, 2010
playing soccer, and going to the movies. They read gardening and parenthood magazines and listen to Hispanic and urban radio formats. Typical TV viewing includes comedies as well as wrestling and boxing.
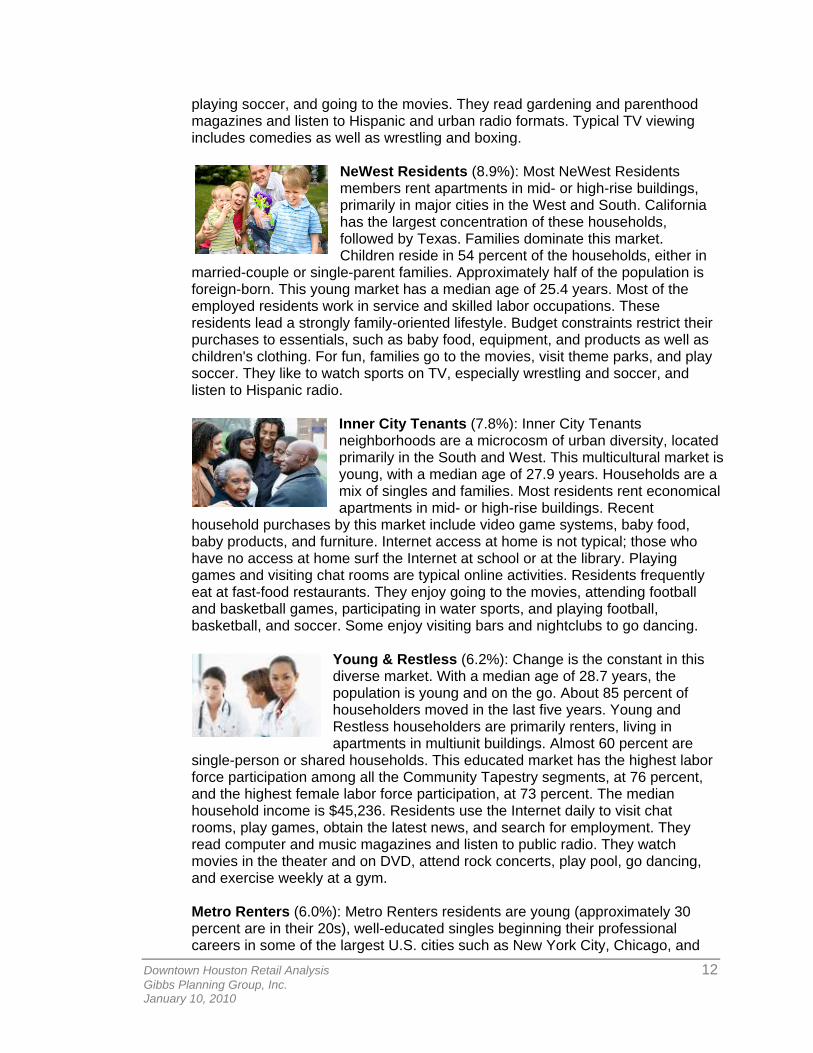
NeWest Residents (8.9%): Most NeWest Residents members rent apartments in mid- or high-rise buildings, primarily in major cities in the West and South. California has the largest concentration of these households, followed by Texas. Families dominate this market. Children reside in 54 percent of the households, either in
married-couple or single-parent families. Approximately half of the population is foreign-born. This young market has a median age of 25.4 years. Most of the employed residents work in service and skilled labor occupations. These residents lead a strongly family-oriented lifestyle. Budget constraints restrict their purchases to essentials, such as baby food, equipment, and products as well as children's clothing. For fun, families go to the movies, visit theme parks, and play soccer. They like to watch sports on TV, especially wrestling and soccer, and listen to Hispanic radio.
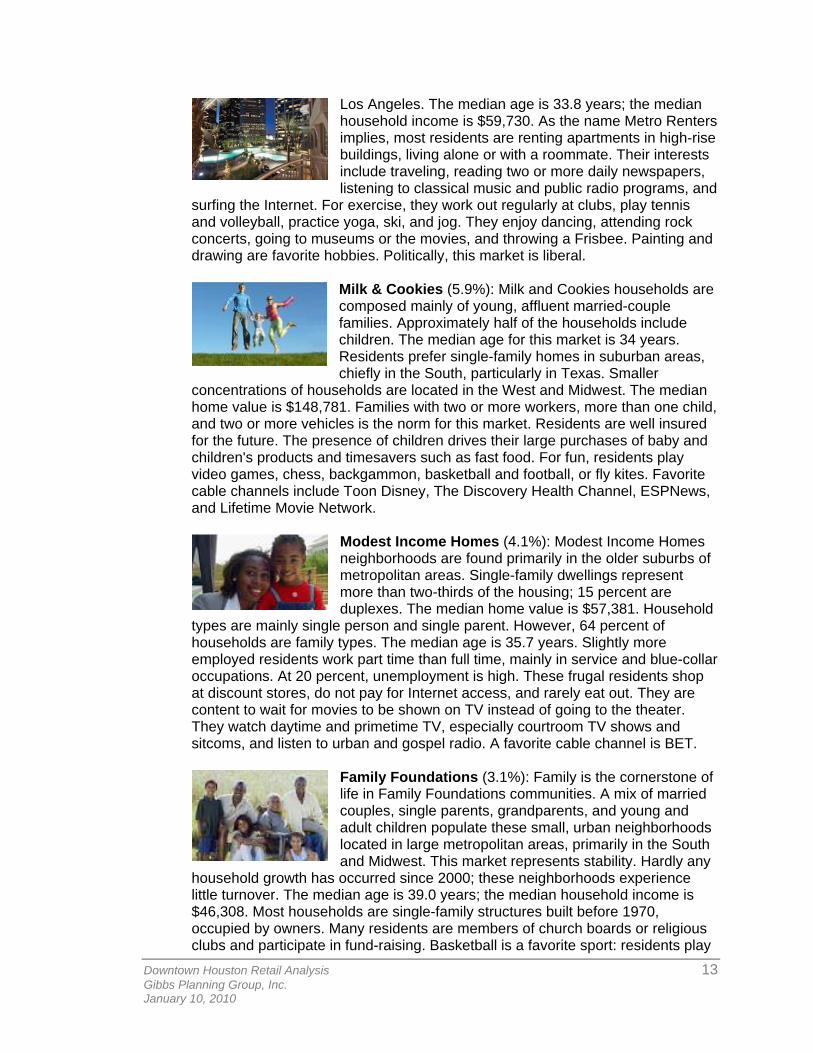
Inner City Tenants (7.8%): Inner City Tenants neighborhoods are a microcosm of urban diversity, located primarily in the South and West. This multicultural market is young, with a median age of 27.9 years. Households are a mix of singles and families. Most residents rent economical apartments in mid- or high-rise buildings. Recent
household purchases by this market include video game systems, baby food, baby products, and furniture. Internet access at home is not typical; those who have no access at home surf the Internet at school or at the library. Playing games and visiting chat rooms are typical online activities. Residents frequently eat at fast-food restaurants. They enjoy going to the movies, attending football and basketball games, participating in water sports, and playing football, basketball, and soccer. Some enjoy visiting bars and nightclubs to go dancing.
Young & Restless (6.2%): Change is the constant in this diverse market. With a median age of 28.7 years, the population is young and on the go. About 85 percent of householders moved in the last five years. Young and Restless householders are primarily renters, living in apartments in multiunit buildings. Almost 60 percent are
single-person or shared households. This educated market has the highest labor force participation among all the Community Tapestry segments, at 76 percent, and the highest female labor force participation, at 73 percent. The median household income is $45,236. Residents use the Internet daily to visit chat rooms, play games, obtain the latest news, and search for employment. They read computer and music magazines and listen to public radio. They watch movies in the theater and on DVD, attend rock concerts, play pool, go dancing, and exercise weekly at a gym. Metro Renters (6.0%): Metro Renters residents are young (approximately 30 percent are in their 20s), well-educated singles beginning their professional careers in some of the largest U.S. cities such as New York City, Chicago, and
Downtown Houston Retail Analysis 13 Gibbs Planning Group, Inc. January 10, 2010
Los Angeles. The median age is 33.8 years; the median household income is $59,730. As the name Metro Renters implies, most residents are renting apartments in high-rise buildings, living alone or with a roommate. Their interests include traveling, reading two or more daily newspapers, listening to classical music and public radio programs, and
surfing the Internet. For exercise, they work out regularly at clubs, play tennis and volleyball, practice yoga, ski, and jog. They enjoy dancing, attending rock concerts, going to museums or the movies, and throwing a Frisbee. Painting and drawing are favorite hobbies. Politically, this market is liberal.
Milk & Cookies (5.9%): Milk and Cookies households are composed mainly of young, affluent married-couple families. Approximately half of the households include children. The median age for this market is 34 years. Residents prefer single-family homes in suburban areas, chiefly in the South, particularly in Texas. Smaller
concentrations of households are located in the West and Midwest. The median home value is $148,781. Families with two or more workers, more than one child, and two or more vehicles is the norm for this market. Residents are well insured for the future. The presence of children drives their large purchases of baby and children's products and timesavers such as fast food. For fun, residents play video games, chess, backgammon, basketball and football, or fly kites. Favorite cable channels include Toon Disney, The Discovery Health Channel, ESPNews, and Lifetime Movie Network.
Modest Income Homes (4.1%): Modest Income Homes neighborhoods are found primarily in the older suburbs of metropolitan areas. Single-family dwellings represent more than two-thirds of the housing; 15 percent are duplexes. The median home value is $57,381. Household
types are mainly single person and single parent. However, 64 percent of households are family types. The median age is 35.7 years. Slightly more employed residents work part time than full time, mainly in service and blue-collar occupations. At 20 percent, unemployment is high. These frugal residents shop at discount stores, do not pay for Internet access, and rarely eat out. They are content to wait for movies to be shown on TV instead of going to the theater. They watch daytime and primetime TV, especially courtroom TV shows and sitcoms, and listen to urban and gospel radio. A favorite cable channel is BET.
Family Foundations (3.1%): Family is the cornerstone of life in Family Foundations communities. A mix of married couples, single parents, grandparents, and young and adult children populate these small, urban neighborhoods located in large metropolitan areas, primarily in the South and Midwest. This market represents stability. Hardly any
household growth has occurred since 2000; these neighborhoods experience little turnover. The median age is 39.0 years; the median household income is $46,308. Most households are single-family structures built before 1970, occupied by owners. Many residents are members of church boards or religious clubs and participate in fund-raising. Basketball is a favorite sport: residents play
Downtown Houston Retail Analysis 14 Gibbs Planning Group, Inc. January 10, 2010
it, attend professional games, watch games on TV and listen to games on the radio. They watch courtroom TV shows, sports, and news programs on TV and listen to gospel, urban, and jazz radio formats.
Aspiring Young Families (2.9%): Aspiring Young Families neighborhoods are located in large, growing metropolitan areas in the South and West, with the highest concentrations in California, Florida, and Texas. Mainly composed of young, married-couple families or single parents with children, the median age for this segment is 30.6 years. Nearly half of the households are
owner-occupied, single-family dwellings or townhomes, and over half are occupied by renters, many living in newer, multiunit buildings. Residents spend much of their discretionary income on baby and children's products and toys as well as home furnishings. Recent electronic purchases include cameras and video game systems. Leisure activities include dining out, dancing, going to the movies, attending professional football games, fishing, weight lifting, and playing basketball. Typically, vacations would include visits to theme parks. Internet usage mainly involves chat room visits.
3.0 MARKET CONDITIONS
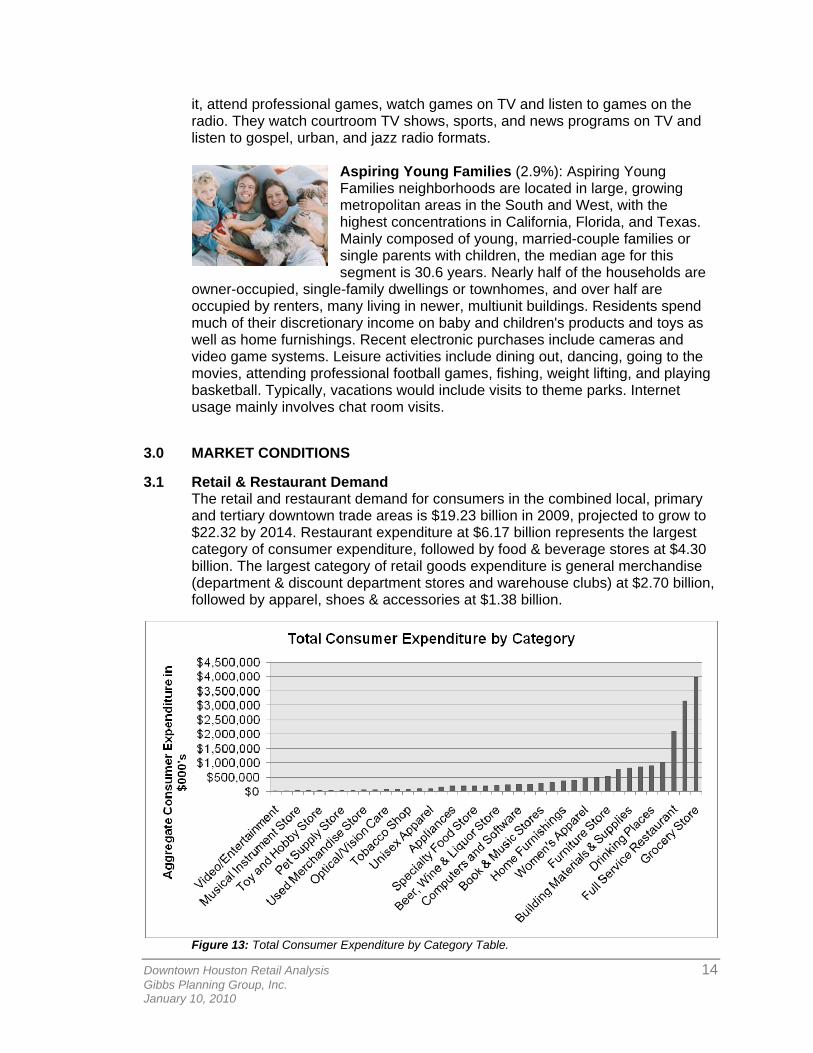
3.1 Retail & Restaurant Demand The retail and restaurant demand for consumers in the combined local, primary and tertiary downtown trade areas is $19.23 billion in 2009, projected to grow to $22.32 by 2014. Restaurant expenditure at $6.17 billion represents the largest category of consumer expenditure, followed by food & beverage stores at $4.30 billion. The largest category of retail goods expenditure is general merchandise (department & discount department stores and warehouse clubs) at $2.70 billion, followed by apparel, shoes & accessories at $1.38 billion.
Figure 13: Total Consumer Expenditure by Category Table.
Downtown Houston Retail Analysis 15 Gibbs Planning Group, Inc. January 10, 2010
Miscellaneous retailers lead the overall expenditure potential growth rate with 6.14 percent annual growth project over the next five years. Restaurants potential expenditure is projected to grow at an annual rate of 3.68 percent to $7.39 billion in 2014, led by growth in the drinking places sub-category at 4.32 percent per year. General merchandise expenditure is projected to grow by 2.72 percent annually, to a level of $3.09 billion in 2014. Apparel, shoes and accessories is projected to a level of $1.57 billion in 2014, led in growth of the shoes sub-category at 2.75 percent per year. Expenditure in food and beverage stores is projected to grow by 2.58 percent annually, to a level of 4.96 billion in 2014.
Figure 14: Consumer Expenditure by Source Table.
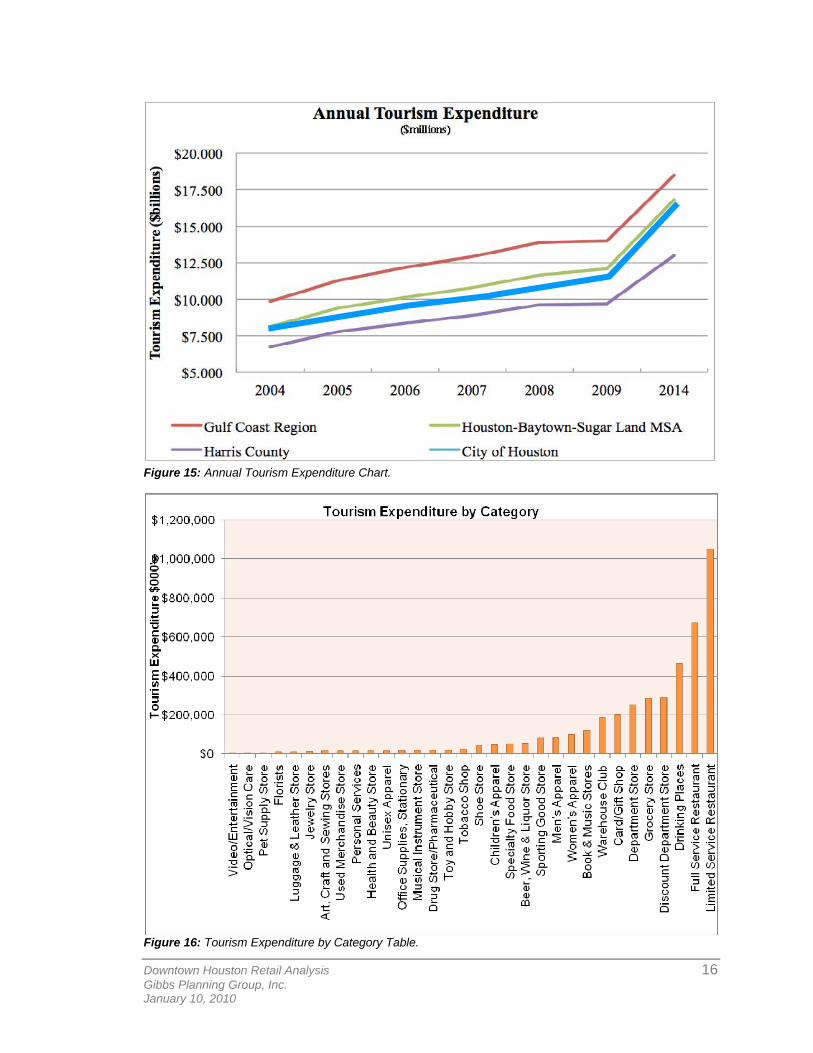
3.2 Tourism Expenditure Annual tourism expenditure in the Houston MSA has grown during 17 of the last 18 years, experiencing its only year-over-year decline in 2002. The average annual growth rate for tourism expenditure in the Houston MSA is 6.02 percent. Tourism expenditure in 2008 in the Houston MSA was $11.66 billion. Of this expenditure, $1.5 billion was spent on "At Destination" retail goods, $2.1 billion was expended on dining, and $383 million was spent at food stores in the MSA. GPG projects 2009 tourism in the Houston MSA to reach $12.1 billion, a growth rate of 3.76 percent from 2008. The main areas of tourism expenditure growth in the City of Houston are retail sales (8.87%), air transportation (8.48%), and arts, entertainment and recreation (8.33%). 2014 tourism expenditure in the Houston MSA is projected to reach $16.8 billion, a 6.8 percent annual growth rate. The expenditure categories that are projected to lead the growth into 2014 are ground transportation and fuel (9.19% annual growth rate), accommodations (7.63%), and dining (6.17%).
Downtown Houston Retail Analysis 16 Gibbs Planning Group, Inc. January 10, 2010
Figure 15: Annual Tourism Expenditure Chart.
Figure 16: Tourism Expenditure by Category Table.
Downtown Houston Retail Analysis 17 Gibbs Planning Group, Inc. January 10, 2010
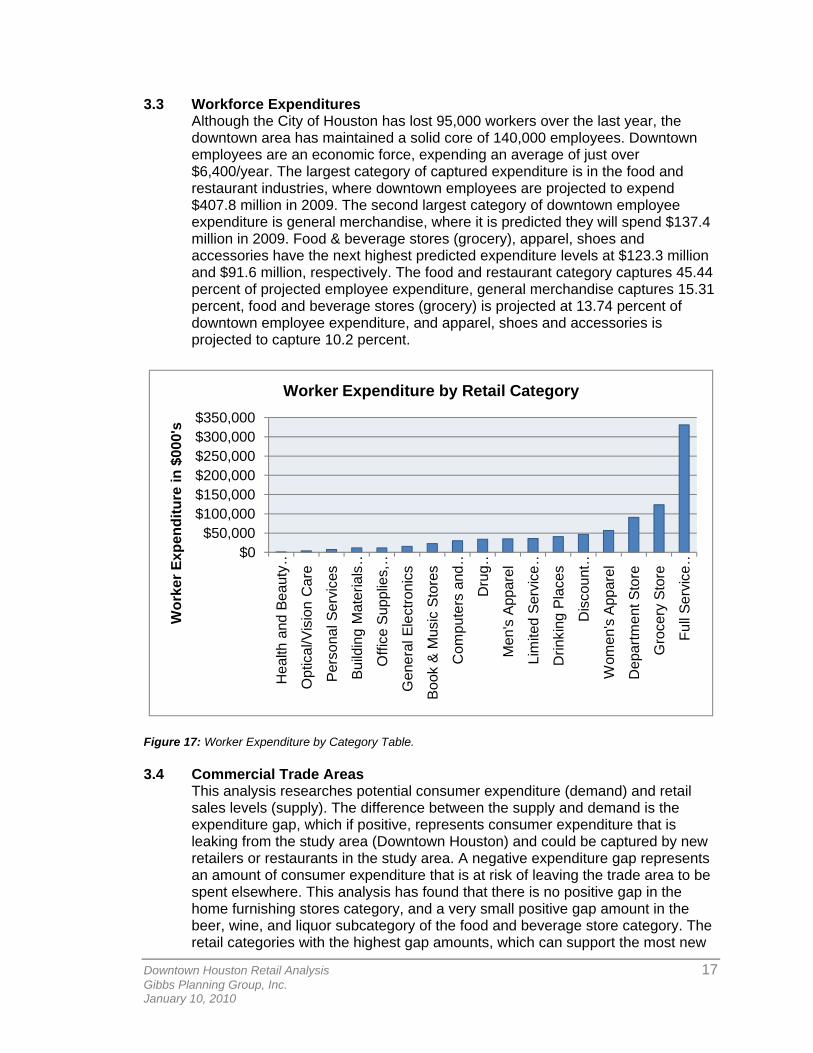
3.3 Workforce Expenditures Although the City of Houston has lost 95,000 workers over the last year, the downtown area has maintained a solid core of 140,000 employees. Downtown employees are an economic force, expending an average of just over $6,400/year. The largest category of captured expenditure is in the food and restaurant industries, where downtown employees are projected to expend $407.8 million in 2009. The second largest category of downtown employee expenditure is general merchandise, where it is predicted they will spend $137.4 million in 2009. Food & beverage stores (grocery), apparel, shoes and accessories have the next highest predicted expenditure levels at $123.3 million and $91.6 million, respectively. The food and restaurant category captures 45.44 percent of projected employee expenditure, general merchandise captures 15.31 percent, food and beverage stores (grocery) is projected at 13.74 percent of downtown employee expenditure, and apparel, shoes and accessories is projected to capture 10.2 percent.
$0$50,000
$100,000$150,000$200,000$250,000$300,000$350,000
Hea
lth a
nd B
eaut
y …
Opt
ical
/Vis
ion
Car
e
Pers
onal
Ser
vice
s
Build
ing
Mat
eria
ls …
Offi
ce S
uppl
ies,
…
Gen
eral
Ele
ctro
nics
Book
& M
usic
Sto
res
Com
pute
rs a
nd …
Dru
g …
Men
's A
ppar
el
Lim
ited
Serv
ice …
Drin
king
Pla
ces
Dis
coun
t …
Wom
en's
App
arel
Dep
artm
ent S
tore
Gro
cery
Sto
re
Full
Serv
ice …
Wor
ker E
xpen
ditu
re in
$00
0's
Worker Expenditure by Retail Category
Figure 17: Worker Expenditure by Category Table.
3.4 Commercial Trade Areas
This analysis researches potential consumer expenditure (demand) and retail sales levels (supply). The difference between the supply and demand is the expenditure gap, which if positive, represents consumer expenditure that is leaking from the study area (Downtown Houston) and could be captured by new retailers or restaurants in the study area. A negative expenditure gap represents an amount of consumer expenditure that is at risk of leaving the trade area to be spent elsewhere. This analysis has found that there is no positive gap in the home furnishing stores category, and a very small positive gap amount in the beer, wine, and liquor subcategory of the food and beverage store category. The retail categories with the highest gap amounts, which can support the most new
Downtown Houston Retail Analysis 18 Gibbs Planning Group, Inc. January 10, 2010
retail square footage, are (1) general merchandise department stores; (2) apparel, shoes and accessories; (3) electronics, appliances and computers; and (4) food and restaurants.
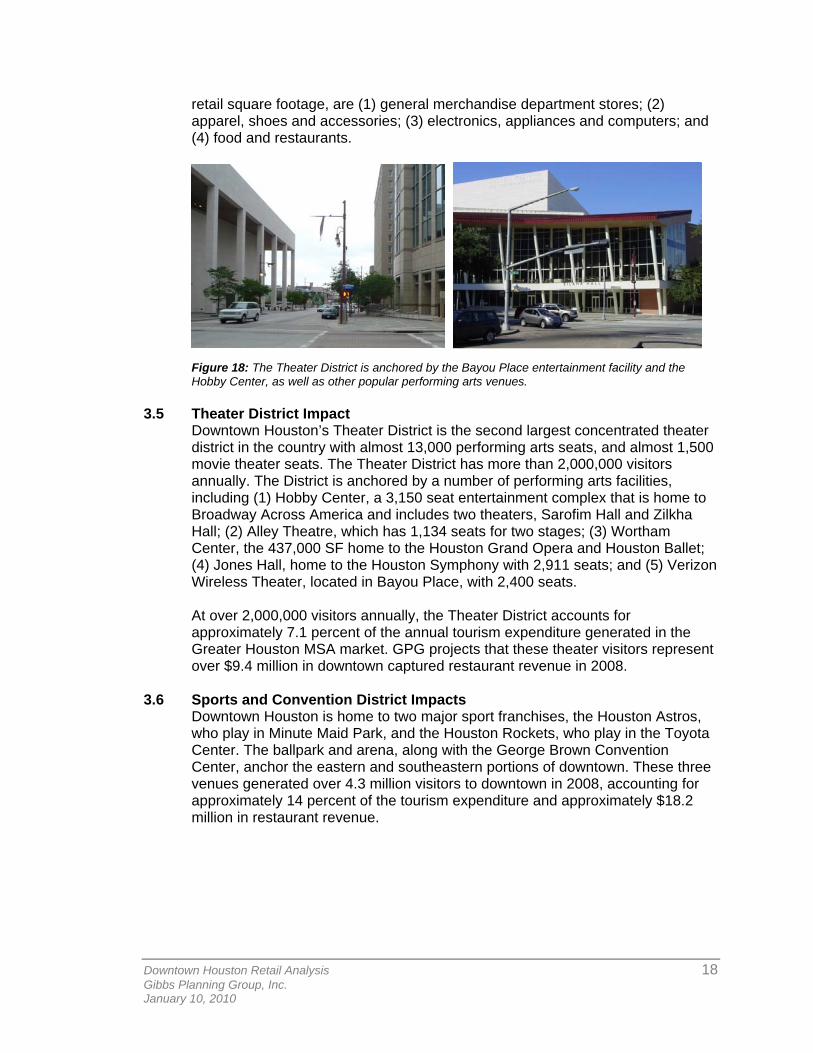
Figure 18: The Theater District is anchored by the Bayou Place entertainment facility and the Hobby Center, as well as other popular performing arts venues.
3.5 Theater District Impact Downtown Houston’s Theater District is the second largest concentrated theater district in the country with almost 13,000 performing arts seats, and almost 1,500 movie theater seats. The Theater District has more than 2,000,000 visitors annually. The District is anchored by a number of performing arts facilities, including (1) Hobby Center, a 3,150 seat entertainment complex that is home to Broadway Across America and includes two theaters, Sarofim Hall and Zilkha Hall; (2) Alley Theatre, which has 1,134 seats for two stages; (3) Wortham Center, the 437,000 SF home to the Houston Grand Opera and Houston Ballet; (4) Jones Hall, home to the Houston Symphony with 2,911 seats; and (5) Verizon Wireless Theater, located in Bayou Place, with 2,400 seats. At over 2,000,000 visitors annually, the Theater District accounts for approximately 7.1 percent of the annual tourism expenditure generated in the Greater Houston MSA market. GPG projects that these theater visitors represent over $9.4 million in downtown captured restaurant revenue in 2008.
3.6 Sports and Convention District Impacts Downtown Houston is home to two major sport franchises, the Houston Astros, who play in Minute Maid Park, and the Houston Rockets, who play in the Toyota Center. The ballpark and arena, along with the George Brown Convention Center, anchor the eastern and southeastern portions of downtown. These three venues generated over 4.3 million visitors to downtown in 2008, accounting for approximately 14 percent of the tourism expenditure and approximately $18.2 million in restaurant revenue.
Downtown Houston Retail Analysis 19 Gibbs Planning Group, Inc. January 10, 2010
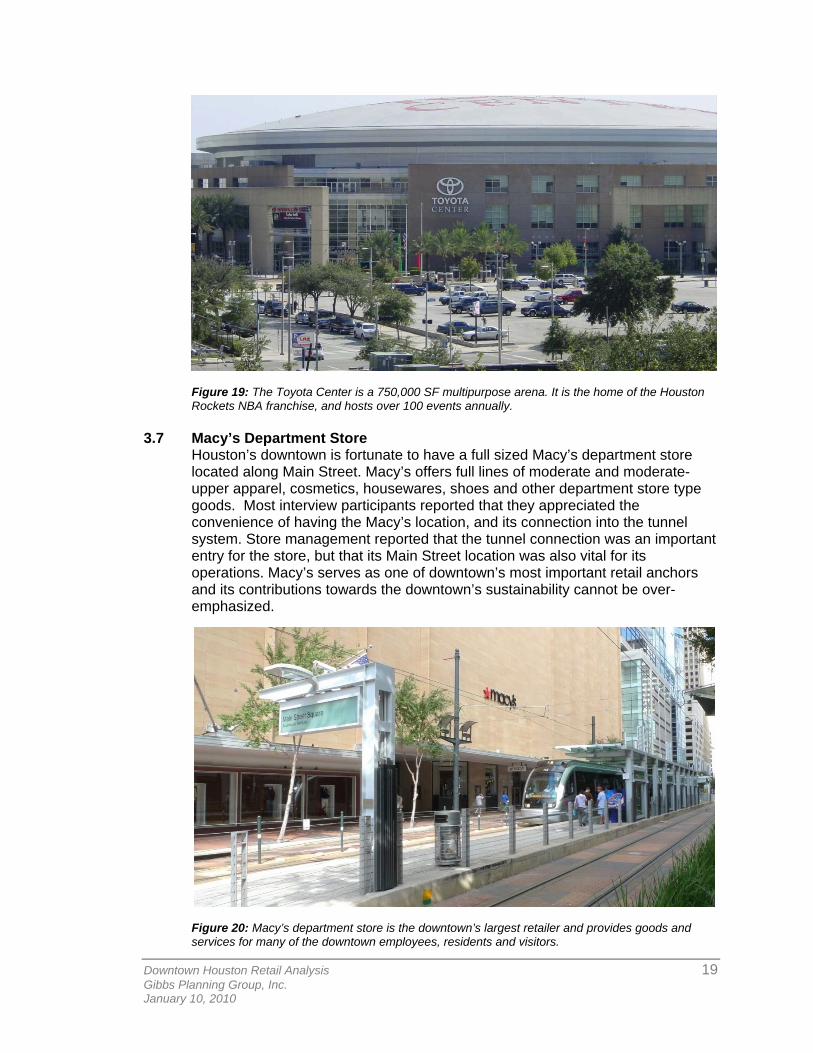
Figure 19: The Toyota Center is a 750,000 SF multipurpose arena. It is the home of the Houston Rockets NBA franchise, and hosts over 100 events annually.
3.7 Macy’s Department Store Houston’s downtown is fortunate to have a full sized Macy’s department store located along Main Street. Macy’s offers full lines of moderate and moderate-upper apparel, cosmetics, housewares, shoes and other department store type goods. Most interview participants reported that they appreciated the convenience of having the Macy’s location, and its connection into the tunnel system. Store management reported that the tunnel connection was an important entry for the store, but that its Main Street location was also vital for its operations. Macy’s serves as one of downtown’s most important retail anchors and its contributions towards the downtown’s sustainability cannot be over-emphasized.
Figure 20: Macy’s department store is the downtown’s largest retailer and provides goods and services for many of the downtown employees, residents and visitors.
Downtown Houston Retail Analysis 20 Gibbs Planning Group, Inc. January 10, 2010
GPG recommends that the HDMD continue to work closely with Macy’s management to ensure that the store continues to provide its important role in the downtown’s economy. Additional Main Street parking, larger signage, expanded street lighting and in-fill street level retailers are also recommended for the areas around Macy’s.
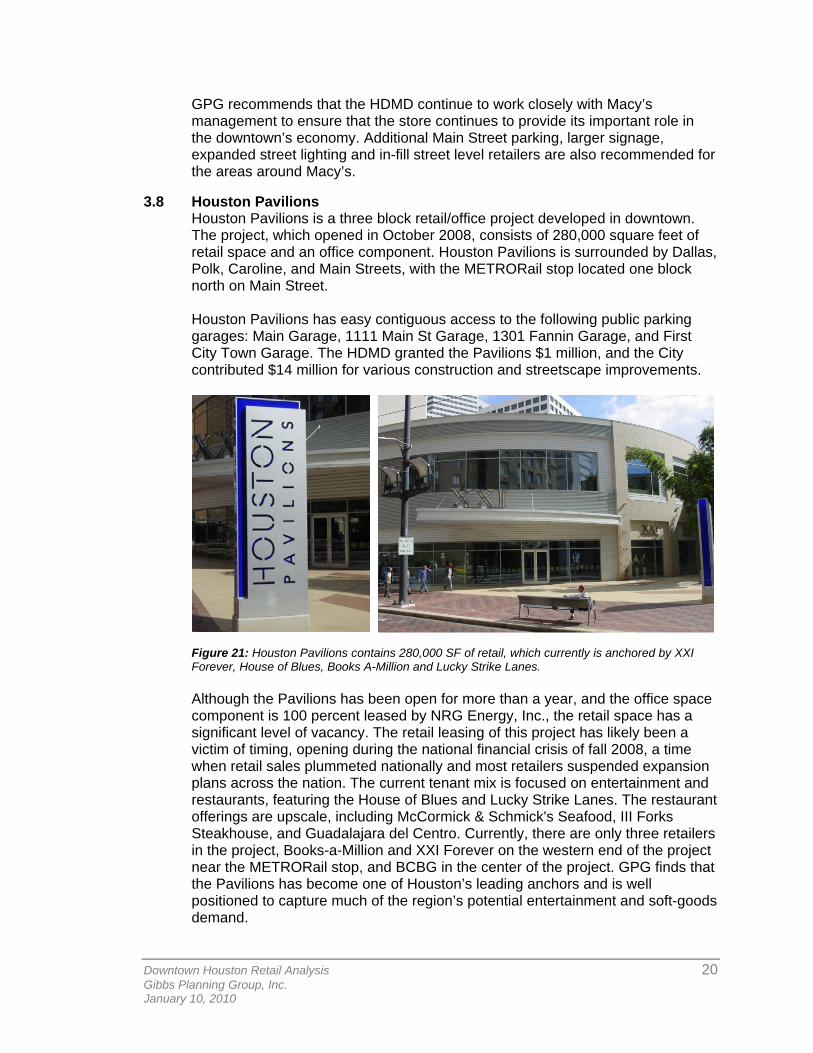
3.8 Houston Pavilions Houston Pavilions is a three block retail/office project developed in downtown. The project, which opened in October 2008, consists of 280,000 square feet of retail space and an office component. Houston Pavilions is surrounded by Dallas, Polk, Caroline, and Main Streets, with the METRORail stop located one block north on Main Street. Houston Pavilions has easy contiguous access to the following public parking garages: Main Garage, 1111 Main St Garage, 1301 Fannin Garage, and First City Town Garage. The HDMD granted the Pavilions $1 million, and the City contributed $14 million for various construction and streetscape improvements.
Figure 21: Houston Pavilions contains 280,000 SF of retail, which currently is anchored by XXI Forever, House of Blues, Books A-Million and Lucky Strike Lanes. Although the Pavilions has been open for more than a year, and the office space component is 100 percent leased by NRG Energy, Inc., the retail space has a significant level of vacancy. The retail leasing of this project has likely been a victim of timing, opening during the national financial crisis of fall 2008, a time when retail sales plummeted nationally and most retailers suspended expansion plans across the nation. The current tenant mix is focused on entertainment and restaurants, featuring the House of Blues and Lucky Strike Lanes. The restaurant offerings are upscale, including McCormick & Schmick's Seafood, III Forks Steakhouse, and Guadalajara del Centro. Currently, there are only three retailers in the project, Books-a-Million and XXI Forever on the western end of the project near the METRORail stop, and BCBG in the center of the project. GPG finds that the Pavilions has become one of Houston’s leading anchors and is well positioned to capture much of the region’s potential entertainment and soft-goods demand.
Downtown Houston Retail Analysis 21 Gibbs Planning Group, Inc. January 10, 2010
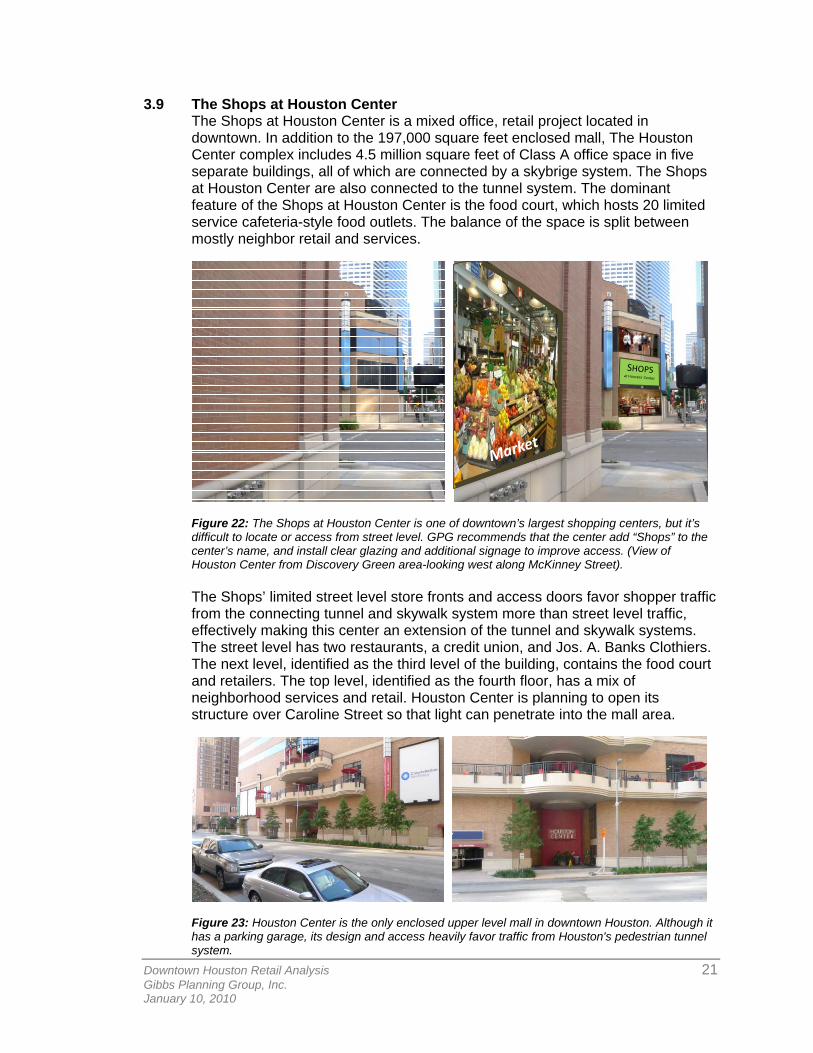
3.9 The Shops at Houston Center The Shops at Houston Center is a mixed office, retail project located in downtown. In addition to the 197,000 square feet enclosed mall, The Houston Center complex includes 4.5 million square feet of Class A office space in five separate buildings, all of which are connected by a skybrige system. The Shops at Houston Center are also connected to the tunnel system. The dominant feature of the Shops at Houston Center is the food court, which hosts 20 limited service cafeteria-style food outlets. The balance of the space is split between mostly neighbor retail and services.
Figure 22: The Shops at Houston Center is one of downtown’s largest shopping centers, but it’s difficult to locate or access from street level. GPG recommends that the center add “Shops” to the center’s name, and install clear glazing and additional signage to improve access. (View of Houston Center from Discovery Green area-looking west along McKinney Street). The Shops’ limited street level store fronts and access doors favor shopper traffic from the connecting tunnel and skywalk system more than street level traffic, effectively making this center an extension of the tunnel and skywalk systems. The street level has two restaurants, a credit union, and Jos. A. Banks Clothiers. The next level, identified as the third level of the building, contains the food court and retailers. The top level, identified as the fourth floor, has a mix of neighborhood services and retail. Houston Center is planning to open its structure over Caroline Street so that light can penetrate into the mall area.
Figure 23: Houston Center is the only enclosed upper level mall in downtown Houston. Although it has a parking garage, its design and access heavily favor traffic from Houston's pedestrian tunnel system.
Downtown Houston Retail Analysis 22 Gibbs Planning Group, Inc. January 10, 2010
3.10 Nearby Shopping Centers As part of this study, GPG visited most major shopping concentrations in and around the periphery of downtown Houston. There are six major shopping centers inside of the outer beltway that pose the most direct competition to downtown Houston's commerce. In addition, nine other major retail centers attract the tourists’ and residents’ shopping time and retail spending.
3.10.1 Midtown District The Midtown Neighborhood is located just south of downtown along Main Street. It is the neighborhood that links downtown to the Museum District, the Texas Medical Center and Rice University. The area flourished during World War II, but declined during the 1980s and 1990s. The community began to redevelop itself by creating the Midtown Management District and Redevelopment Authority. These entities, financed through tax increment financing that generates revenue from increased property values, have provided vision and management to help guide the pedestrian-orientated infill redevelopment. This strong community management entity provides services such as (1) streetscape infrastructure improvements; (2) access to professional consultants in the fields of finance, accounting, landscape architecture, law, and engineering; (3) cleanup and demolition of hazardous properties, and tenant recruitment.
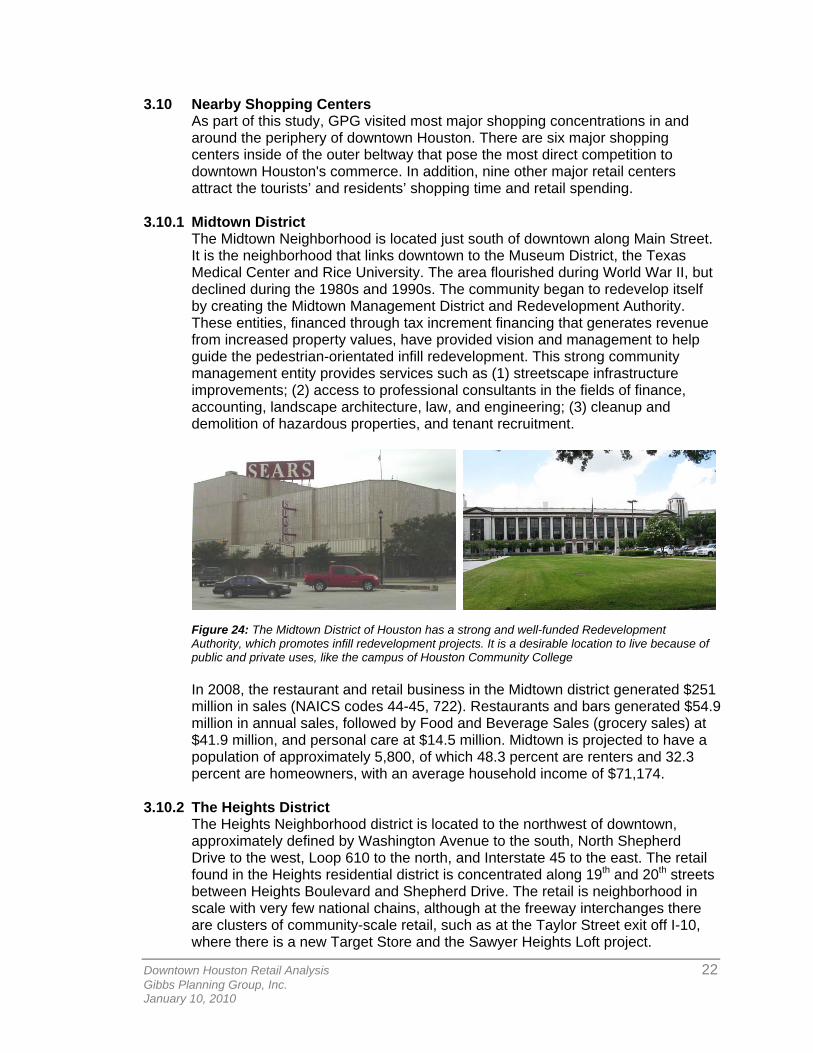
Figure 24: The Midtown District of Houston has a strong and well-funded Redevelopment Authority, which promotes infill redevelopment projects. It is a desirable location to live because of public and private uses, like the campus of Houston Community College In 2008, the restaurant and retail business in the Midtown district generated $251 million in sales (NAICS codes 44-45, 722). Restaurants and bars generated $54.9 million in annual sales, followed by Food and Beverage Sales (grocery sales) at $41.9 million, and personal care at $14.5 million. Midtown is projected to have a population of approximately 5,800, of which 48.3 percent are renters and 32.3 percent are homeowners, with an average household income of $71,174.
3.10.2 The Heights District The Heights Neighborhood district is located to the northwest of downtown, approximately defined by Washington Avenue to the south, North Shepherd Drive to the west, Loop 610 to the north, and Interstate 45 to the east. The retail found in the Heights residential district is concentrated along 19th and 20th streets between Heights Boulevard and Shepherd Drive. The retail is neighborhood in scale with very few national chains, although at the freeway interchanges there are clusters of community-scale retail, such as at the Taylor Street exit off I-10, where there is a new Target Store and the Sawyer Heights Loft project.
Downtown Houston Retail Analysis 23 Gibbs Planning Group, Inc. January 10, 2010
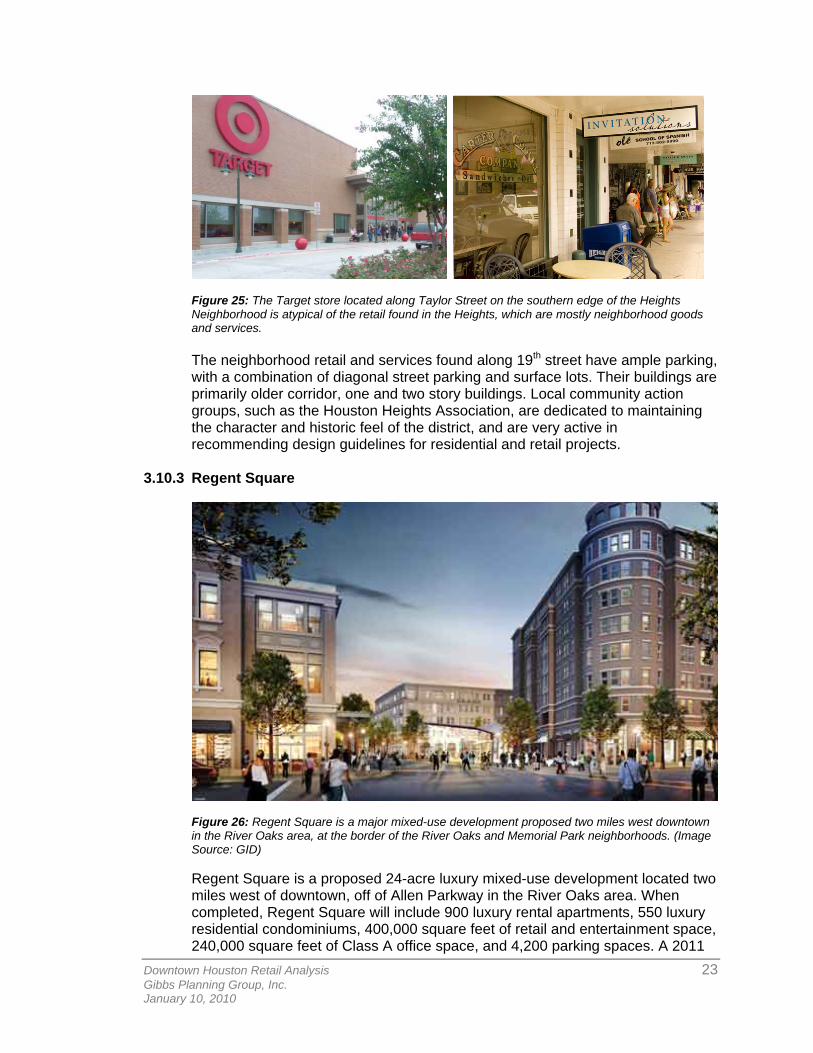
Figure 25: The Target store located along Taylor Street on the southern edge of the Heights Neighborhood is atypical of the retail found in the Heights, which are mostly neighborhood goods and services. The neighborhood retail and services found along 19th street have ample parking, with a combination of diagonal street parking and surface lots. Their buildings are primarily older corridor, one and two story buildings. Local community action groups, such as the Houston Heights Association, are dedicated to maintaining the character and historic feel of the district, and are very active in recommending design guidelines for residential and retail projects.
3.10.3 Regent Square
Figure 26: Regent Square is a major mixed-use development proposed two miles west downtown in the River Oaks area, at the border of the River Oaks and Memorial Park neighborhoods. (Image Source: GID) Regent Square is a proposed 24-acre luxury mixed-use development located two miles west of downtown, off of Allen Parkway in the River Oaks area. When completed, Regent Square will include 900 luxury rental apartments, 550 luxury residential condominiums, 400,000 square feet of retail and entertainment space, 240,000 square feet of Class A office space, and 4,200 parking spaces. A 2011
Downtown Houston Retail Analysis 24 Gibbs Planning Group, Inc. January 10, 2010
opening has been announced for the development by its developer GID, Urban Development Group; however, construction has not started at the time of this report.
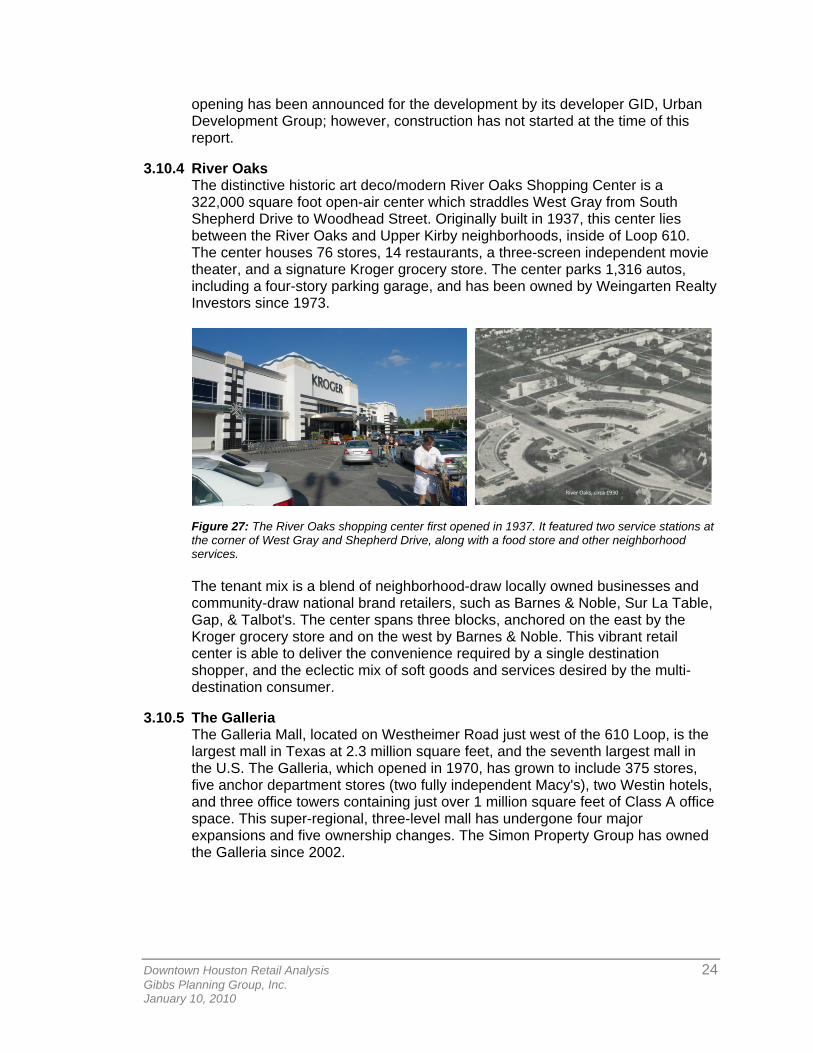
3.10.4 River Oaks The distinctive historic art deco/modern River Oaks Shopping Center is a 322,000 square foot open-air center which straddles West Gray from South Shepherd Drive to Woodhead Street. Originally built in 1937, this center lies between the River Oaks and Upper Kirby neighborhoods, inside of Loop 610. The center houses 76 stores, 14 restaurants, a three-screen independent movie theater, and a signature Kroger grocery store. The center parks 1,316 autos, including a four-story parking garage, and has been owned by Weingarten Realty Investors since 1973.
River Oaks, circa 1930
Figure 27: The River Oaks shopping center first opened in 1937. It featured two service stations at the corner of West Gray and Shepherd Drive, along with a food store and other neighborhood services.
The tenant mix is a blend of neighborhood-draw locally owned businesses and community-draw national brand retailers, such as Barnes & Noble, Sur La Table, Gap, & Talbot's. The center spans three blocks, anchored on the east by the Kroger grocery store and on the west by Barnes & Noble. This vibrant retail center is able to deliver the convenience required by a single destination shopper, and the eclectic mix of soft goods and services desired by the multi-destination consumer.
3.10.5 The Galleria
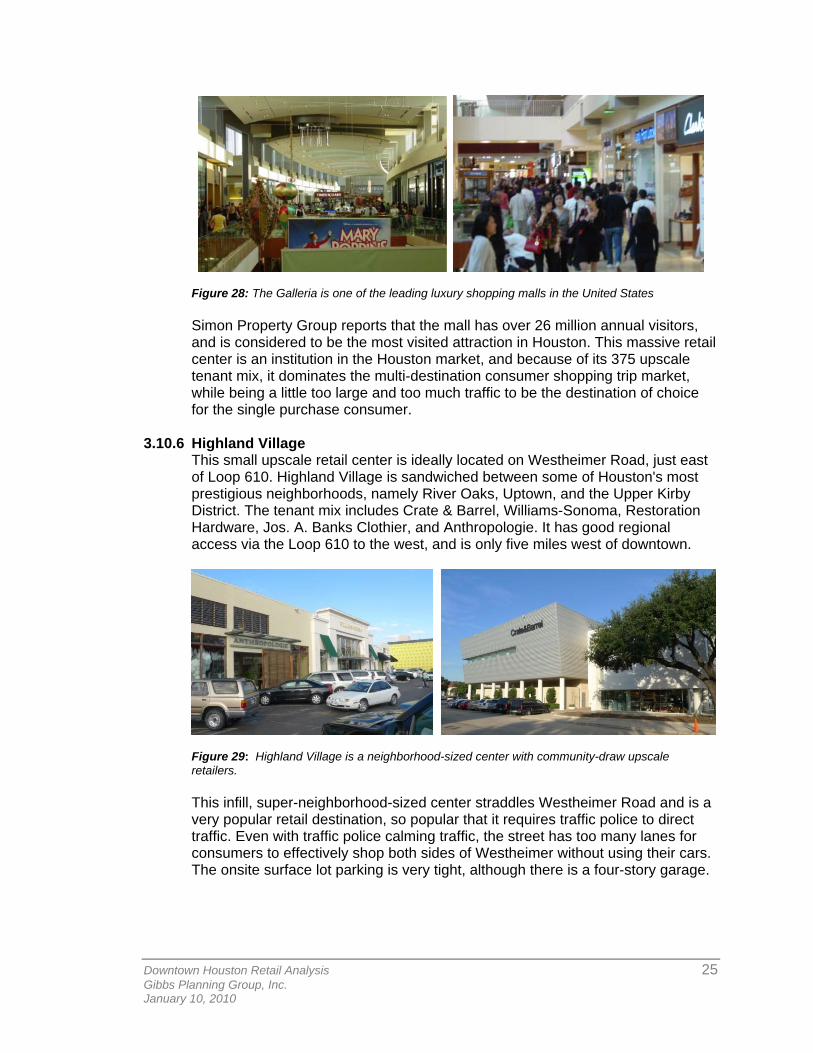
The Galleria Mall, located on Westheimer Road just west of the 610 Loop, is the largest mall in Texas at 2.3 million square feet, and the seventh largest mall in the U.S. The Galleria, which opened in 1970, has grown to include 375 stores, five anchor department stores (two fully independent Macy's), two Westin hotels, and three office towers containing just over 1 million square feet of Class A office space. This super-regional, three-level mall has undergone four major expansions and five ownership changes. The Simon Property Group has owned the Galleria since 2002.
Downtown Houston Retail Analysis 25 Gibbs Planning Group, Inc. January 10, 2010
Figure 28: The Galleria is one of the leading luxury shopping malls in the United States
Simon Property Group reports that the mall has over 26 million annual visitors, and is considered to be the most visited attraction in Houston. This massive retail center is an institution in the Houston market, and because of its 375 upscale tenant mix, it dominates the multi-destination consumer shopping trip market, while being a little too large and too much traffic to be the destination of choice for the single purchase consumer.
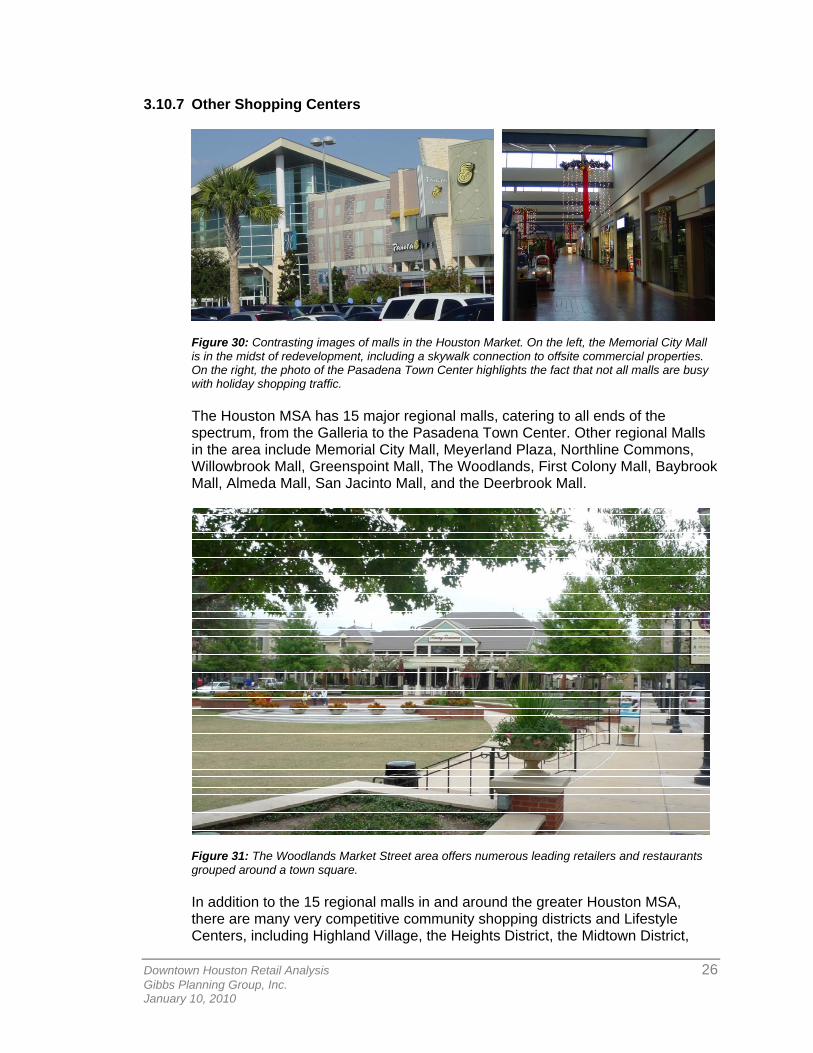
3.10.6 Highland Village This small upscale retail center is ideally located on Westheimer Road, just east of Loop 610. Highland Village is sandwiched between some of Houston's most prestigious neighborhoods, namely River Oaks, Uptown, and the Upper Kirby District. The tenant mix includes Crate & Barrel, Williams-Sonoma, Restoration Hardware, Jos. A. Banks Clothier, and Anthropologie. It has good regional access via the Loop 610 to the west, and is only five miles west of downtown.
Figure 29: Highland Village is a neighborhood-sized center with community-draw upscale retailers. This infill, super-neighborhood-sized center straddles Westheimer Road and is a very popular retail destination, so popular that it requires traffic police to direct traffic. Even with traffic police calming traffic, the street has too many lanes for consumers to effectively shop both sides of Westheimer without using their cars. The onsite surface lot parking is very tight, although there is a four-story garage.
Downtown Houston Retail Analysis 26 Gibbs Planning Group, Inc. January 10, 2010
3.10.7 Other Shopping Centers
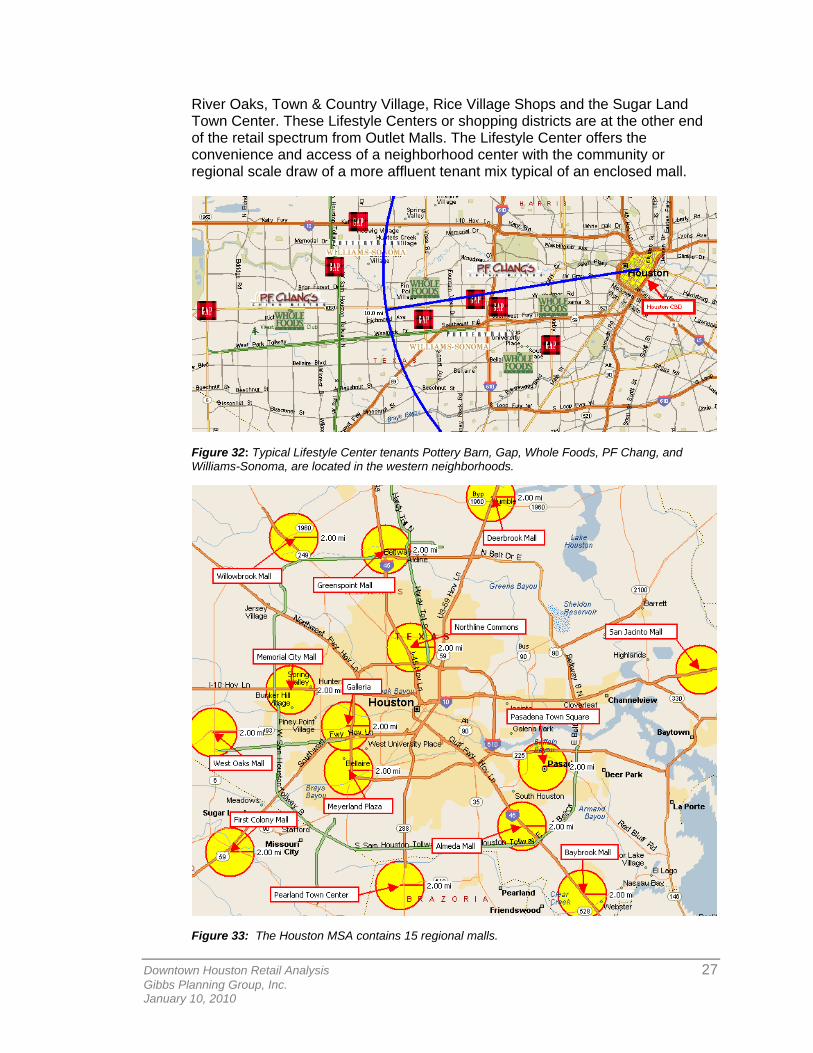
Figure 30: Contrasting images of malls in the Houston Market. On the left, the Memorial City Mall is in the midst of redevelopment, including a skywalk connection to offsite commercial properties. On the right, the photo of the Pasadena Town Center highlights the fact that not all malls are busy with holiday shopping traffic. The Houston MSA has 15 major regional malls, catering to all ends of the spectrum, from the Galleria to the Pasadena Town Center. Other regional Malls in the area include Memorial City Mall, Meyerland Plaza, Northline Commons, Willowbrook Mall, Greenspoint Mall, The Woodlands, First Colony Mall, Baybrook Mall, Almeda Mall, San Jacinto Mall, and the Deerbrook Mall.
Figure 31: The Woodlands Market Street area offers numerous leading retailers and restaurants grouped around a town square. In addition to the 15 regional malls in and around the greater Houston MSA, there are many very competitive community shopping districts and Lifestyle Centers, including Highland Village, the Heights District, the Midtown District,
Downtown Houston Retail Analysis 27 Gibbs Planning Group, Inc. January 10, 2010
River Oaks, Town & Country Village, Rice Village Shops and the Sugar Land Town Center. These Lifestyle Centers or shopping districts are at the other end of the retail spectrum from Outlet Malls. The Lifestyle Center offers the convenience and access of a neighborhood center with the community or regional scale draw of a more affluent tenant mix typical of an enclosed mall.
Figure 32: Typical Lifestyle Center tenants Pottery Barn, Gap, Whole Foods, PF Chang, and Williams-Sonoma, are located in the western neighborhoods.
Figure 33: The Houston MSA contains 15 regional malls.
Downtown Houston Retail Analysis 28 Gibbs Planning Group, Inc. January 10, 2010
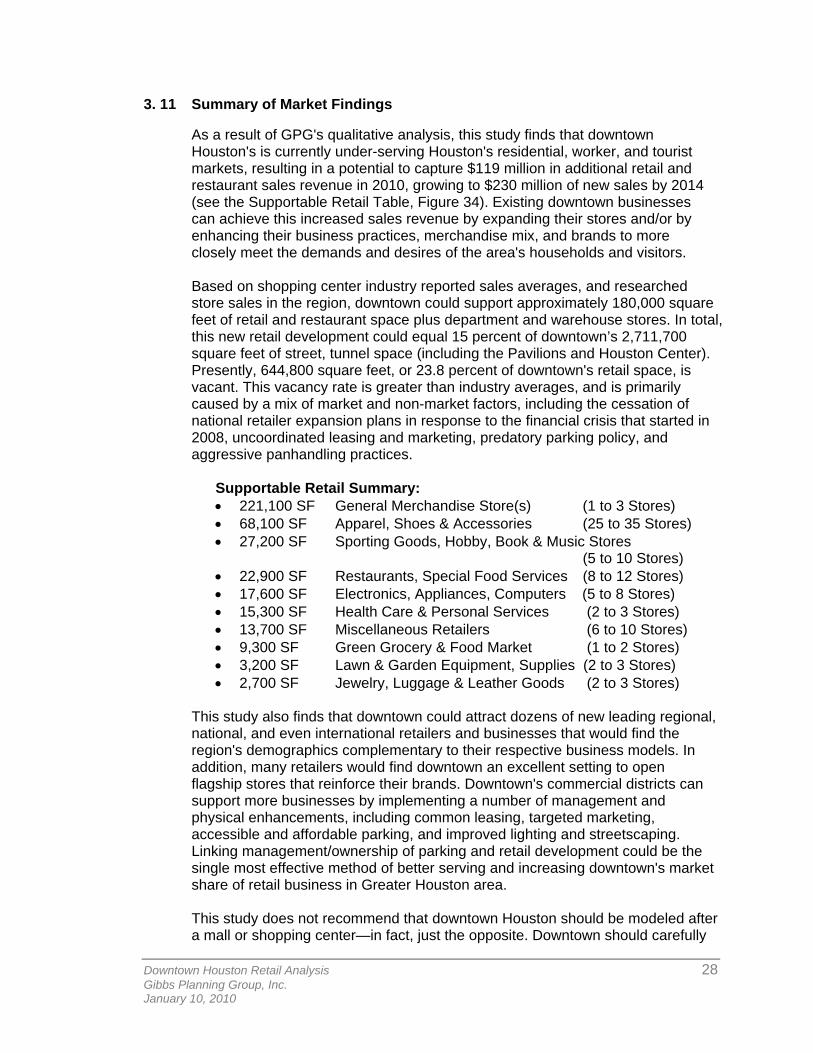
3. 11 Summary of Market Findings
As a result of GPG's qualitative analysis, this study finds that downtown Houston's is currently under-serving Houston's residential, worker, and tourist markets, resulting in a potential to capture $119 million in additional retail and restaurant sales revenue in 2010, growing to $230 million of new sales by 2014 (see the Supportable Retail Table, Figure 34). Existing downtown businesses can achieve this increased sales revenue by expanding their stores and/or by enhancing their business practices, merchandise mix, and brands to more closely meet the demands and desires of the area's households and visitors. Based on shopping center industry reported sales averages, and researched store sales in the region, downtown could support approximately 180,000 square feet of retail and restaurant space plus department and warehouse stores. In total, this new retail development could equal 15 percent of downtown’s 2,711,700 square feet of street, tunnel space (including the Pavilions and Houston Center). Presently, 644,800 square feet, or 23.8 percent of downtown's retail space, is vacant. This vacancy rate is greater than industry averages, and is primarily caused by a mix of market and non-market factors, including the cessation of national retailer expansion plans in response to the financial crisis that started in 2008, uncoordinated leasing and marketing, predatory parking policy, and aggressive panhandling practices.
Supportable Retail Summary: • 221,100 SF General Merchandise Store(s) (1 to 3 Stores) • 68,100 SF Apparel, Shoes & Accessories (25 to 35 Stores) • 27,200 SF Sporting Goods, Hobby, Book & Music Stores
(5 to 10 Stores) • 22,900 SF Restaurants, Special Food Services (8 to 12 Stores) • 17,600 SF Electronics, Appliances, Computers (5 to 8 Stores) • 15,300 SF Health Care & Personal Services (2 to 3 Stores) • 13,700 SF Miscellaneous Retailers (6 to 10 Stores) • 9,300 SF Green Grocery & Food Market (1 to 2 Stores) • 3,200 SF Lawn & Garden Equipment, Supplies (2 to 3 Stores) • 2,700 SF Jewelry, Luggage & Leather Goods (2 to 3 Stores)
This study also finds that downtown could attract dozens of new leading regional, national, and even international retailers and businesses that would find the region's demographics complementary to their respective business models. In addition, many retailers would find downtown an excellent setting to open flagship stores that reinforce their brands. Downtown's commercial districts can support more businesses by implementing a number of management and physical enhancements, including common leasing, targeted marketing, accessible and affordable parking, and improved lighting and streetscaping. Linking management/ownership of parking and retail development could be the single most effective method of better serving and increasing downtown's market share of retail business in Greater Houston area. This study does not recommend that downtown Houston should be modeled after a mall or shopping center—in fact, just the opposite. Downtown should carefully
Downtown Houston Retail Analysis 29 Gibbs Planning Group, Inc. January 10, 2010
target brands that are preferred by its demographic groups and visitors, and that reinforce each other as a whole. Local independent retailers and restaurants are an important component of downtown's character, and should be encouraged to remain and expand when possible. Overall, the tenant mix should not exceed 50 percent national brand names, unless market demographics shift in this direction.
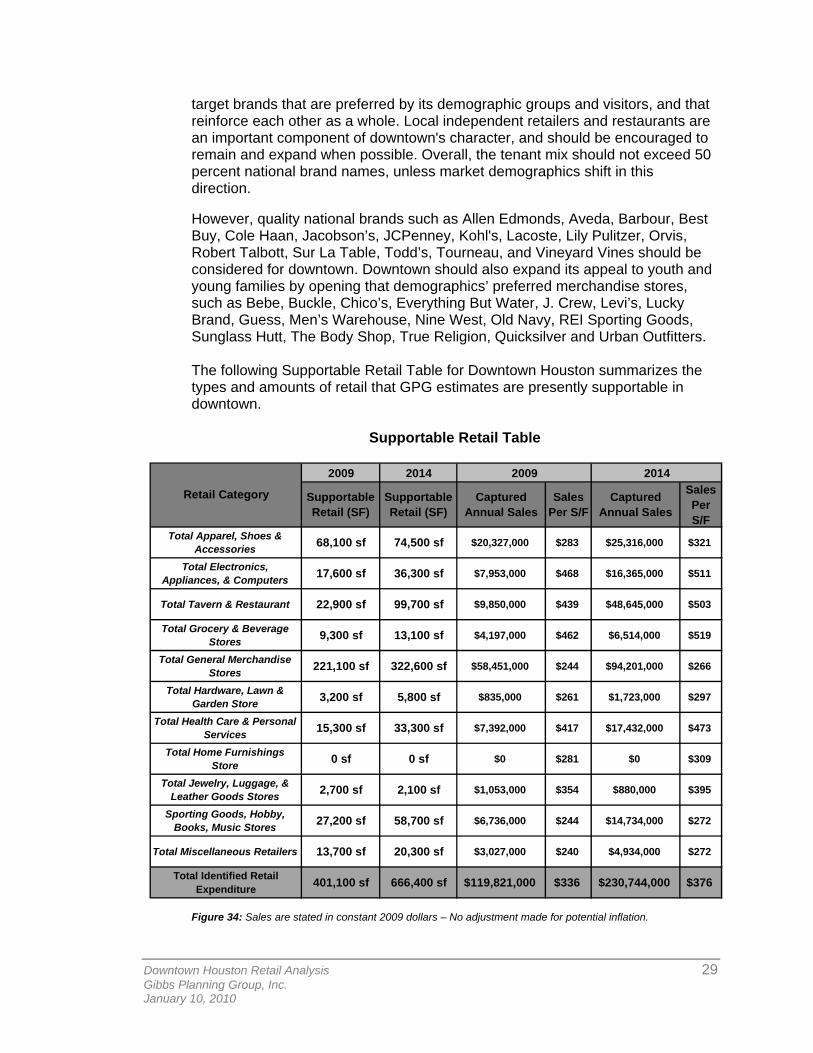
However, quality national brands such as Allen Edmonds, Aveda, Barbour, Best Buy, Cole Haan, Jacobson’s, JCPenney, Kohl's, Lacoste, Lily Pulitzer, Orvis, Robert Talbott, Sur La Table, Todd’s, Tourneau, and Vineyard Vines should be considered for downtown. Downtown should also expand its appeal to youth and young families by opening that demographics’ preferred merchandise stores, such as Bebe, Buckle, Chico’s, Everything But Water, J. Crew, Levi’s, Lucky Brand, Guess, Men’s Warehouse, Nine West, Old Navy, REI Sporting Goods, Sunglass Hutt, The Body Shop, True Religion, Quicksilver and Urban Outfitters. The following Supportable Retail Table for Downtown Houston summarizes the types and amounts of retail that GPG estimates are presently supportable in downtown.
Supportable Retail Table
2009 2014
Supportable Retail (SF)
Supportable Retail (SF)
Captured Annual Sales
Sales Per S/F
Captured Annual Sales
Sales Per S/F
Total Apparel, Shoes & Accessories 68,100 sf 74,500 sf $20,327,000 $283 $25,316,000 $321
Total Electronics, Appliances, & Computers 17,600 sf 36,300 sf $7,953,000 $468 $16,365,000 $511
Total Tavern & Restaurant 22,900 sf 99,700 sf $9,850,000 $439 $48,645,000 $503
Total Grocery & Beverage Stores 9,300 sf 13,100 sf $4,197,000 $462 $6,514,000 $519
Total General Merchandise Stores 221,100 sf 322,600 sf $58,451,000 $244 $94,201,000 $266
Total Hardware, Lawn & Garden Store 3,200 sf 5,800 sf $835,000 $261 $1,723,000 $297
Total Health Care & Personal Services 15,300 sf 33,300 sf $7,392,000 $417 $17,432,000 $473
Total Home Furnishings Store 0 sf 0 sf $0 $281 $0 $309
Total Jewelry, Luggage, & Leather Goods Stores 2,700 sf 2,100 sf $1,053,000 $354 $880,000 $395
Sporting Goods, Hobby, Books, Music Stores 27,200 sf 58,700 sf $6,736,000 $244 $14,734,000 $272
Total Miscellaneous Retailers 13,700 sf 20,300 sf $3,027,000 $240 $4,934,000 $272
Total Identified Retail Expenditure 401,100 sf 666,400 sf $119,821,000 $336 $230,744,000 $376
Retail Category
2009 2014
Figure 34: Sales are stated in constant 2009 dollars – No adjustment made for potential inflation.
Downtown Houston Retail Analysis 30 Gibbs Planning Group, Inc. January 10, 2010
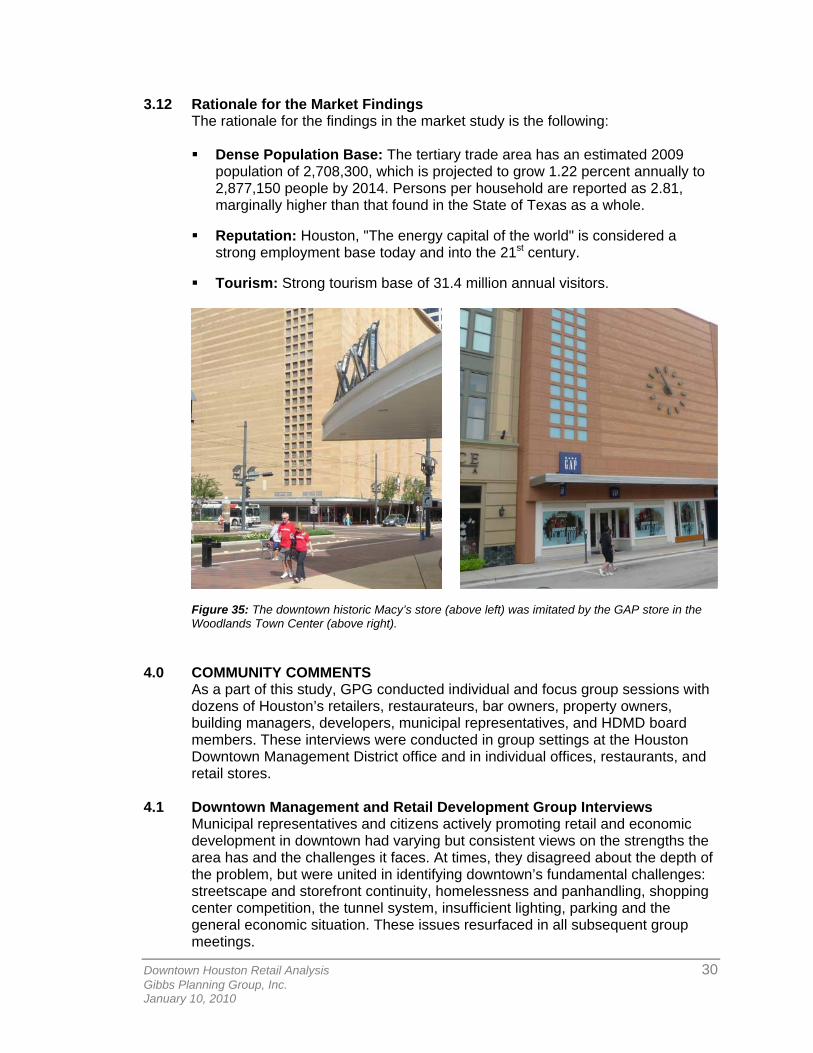
3.12 Rationale for the Market Findings The rationale for the findings in the market study is the following: Dense Population Base: The tertiary trade area has an estimated 2009
population of 2,708,300, which is projected to grow 1.22 percent annually to 2,877,150 people by 2014. Persons per household are reported as 2.81, marginally higher than that found in the State of Texas as a whole.
Reputation: Houston, "The energy capital of the world" is considered a
strong employment base today and into the 21st century.
Tourism: Strong tourism base of 31.4 million annual visitors.
Figure 35: The downtown historic Macy’s store (above left) was imitated by the GAP store in the Woodlands Town Center (above right).
4.0 COMMUNITY COMMENTS As a part of this study, GPG conducted individual and focus group sessions with dozens of Houston’s retailers, restaurateurs, bar owners, property owners, building managers, developers, municipal representatives, and HDMD board members. These interviews were conducted in group settings at the Houston Downtown Management District office and in individual offices, restaurants, and retail stores.
4.1 Downtown Management and Retail Development Group Interviews Municipal representatives and citizens actively promoting retail and economic development in downtown had varying but consistent views on the strengths the area has and the challenges it faces. At times, they disagreed about the depth of the problem, but were united in identifying downtown’s fundamental challenges: streetscape and storefront continuity, homelessness and panhandling, shopping center competition, the tunnel system, insufficient lighting, parking and the general economic situation. These issues resurfaced in all subsequent group meetings.
Downtown Houston Retail Analysis 31 Gibbs Planning Group, Inc. January 10, 2010
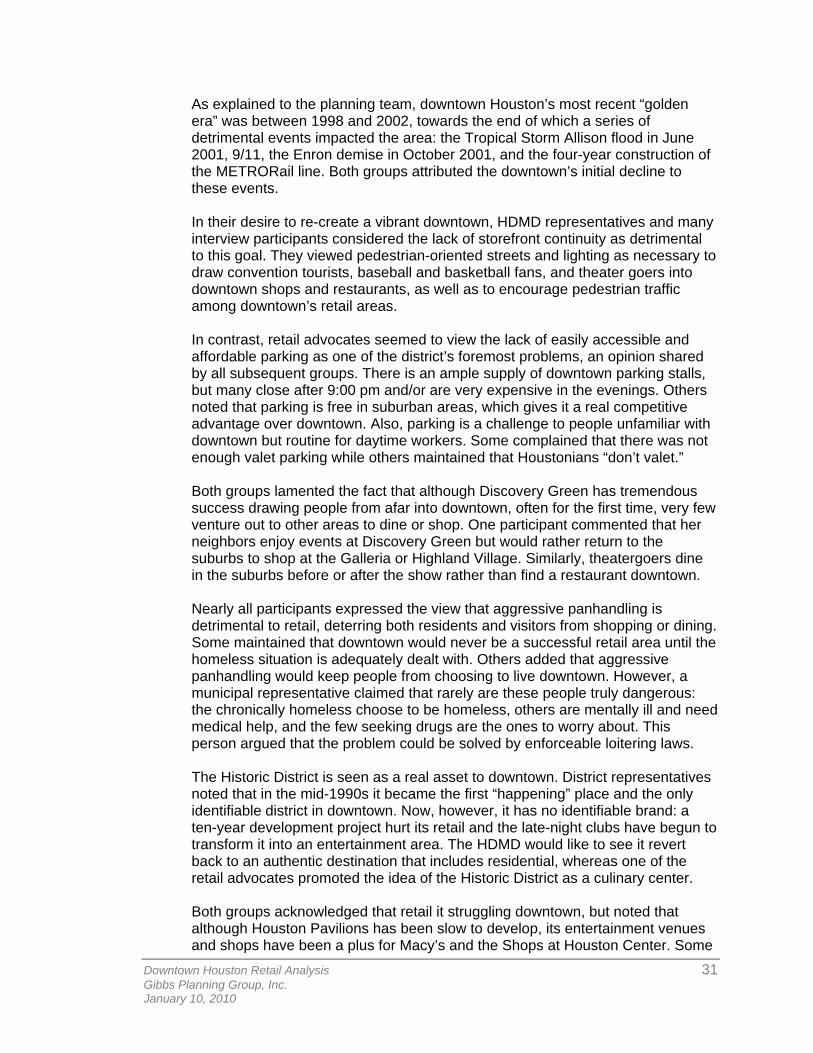
As explained to the planning team, downtown Houston’s most recent “golden era” was between 1998 and 2002, towards the end of which a series of detrimental events impacted the area: the Tropical Storm Allison flood in June 2001, 9/11, the Enron demise in October 2001, and the four-year construction of the METRORail line. Both groups attributed the downtown’s initial decline to these events. In their desire to re-create a vibrant downtown, HDMD representatives and many interview participants considered the lack of storefront continuity as detrimental to this goal. They viewed pedestrian-oriented streets and lighting as necessary to draw convention tourists, baseball and basketball fans, and theater goers into downtown shops and restaurants, as well as to encourage pedestrian traffic among downtown’s retail areas. In contrast, retail advocates seemed to view the lack of easily accessible and affordable parking as one of the district’s foremost problems, an opinion shared by all subsequent groups. There is an ample supply of downtown parking stalls, but many close after 9:00 pm and/or are very expensive in the evenings. Others noted that parking is free in suburban areas, which gives it a real competitive advantage over downtown. Also, parking is a challenge to people unfamiliar with downtown but routine for daytime workers. Some complained that there was not enough valet parking while others maintained that Houstonians “don’t valet.” Both groups lamented the fact that although Discovery Green has tremendous success drawing people from afar into downtown, often for the first time, very few venture out to other areas to dine or shop. One participant commented that her neighbors enjoy events at Discovery Green but would rather return to the suburbs to shop at the Galleria or Highland Village. Similarly, theatergoers dine in the suburbs before or after the show rather than find a restaurant downtown. Nearly all participants expressed the view that aggressive panhandling is detrimental to retail, deterring both residents and visitors from shopping or dining. Some maintained that downtown would never be a successful retail area until the homeless situation is adequately dealt with. Others added that aggressive panhandling would keep people from choosing to live downtown. However, a municipal representative claimed that rarely are these people truly dangerous: the chronically homeless choose to be homeless, others are mentally ill and need medical help, and the few seeking drugs are the ones to worry about. This person argued that the problem could be solved by enforceable loitering laws. The Historic District is seen as a real asset to downtown. District representatives noted that in the mid-1990s it became the first “happening” place and the only identifiable district in downtown. Now, however, it has no identifiable brand: a ten-year development project hurt its retail and the late-night clubs have begun to transform it into an entertainment area. The HDMD would like to see it revert back to an authentic destination that includes residential, whereas one of the retail advocates promoted the idea of the Historic District as a culinary center. Both groups acknowledged that retail it struggling downtown, but noted that although Houston Pavilions has been slow to develop, its entertainment venues and shops have been a plus for Macy’s and the Shops at Houston Center. Some
Downtown Houston Retail Analysis 32 Gibbs Planning Group, Inc. January 10, 2010
lamented that Macy’s no longer caters to higher income groups and seems to have settled on servicing lower incomes. Both groups acknowledge the need for more grocers to serve downtown residents.
4.2 Property Owners and Building Managers Interviews For the most part, property owners and building managers have assessments of Houston’s retail problems and future similar to their tenants. They noted that the major problem is the paucity of people spending money downtown, both as residents within downtown and as visitors from Houston’s suburbs and outlying communities. Most felt that the downtown could better capitalize on the nearly five million annual visitors to Houston’s sport venues, theater district, and recently opened Discovery Green Park. A minority view held that only a sizable downtown population—nearly 100,000—could truly support sustainable retail. Despite the current recession, property owners and building managers still believe in Houston’s economic future. In recognizing the need to preserve street-level retail, some owners have given new storefront tenants deeply discounted rents, in effect, subsidizing business incubators. Others noted that their retail tenants are adjusting to the new economic reality by offering less expensive goods and services.
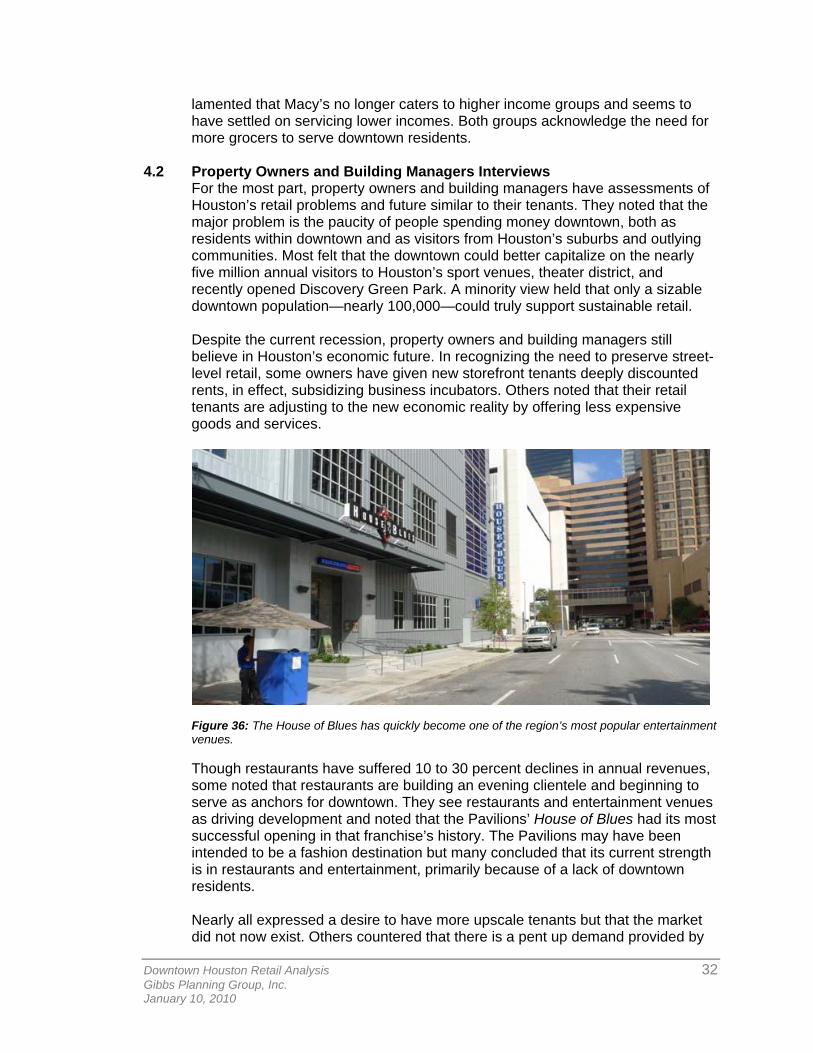
Figure 36: The House of Blues has quickly become one of the region’s most popular entertainment venues. Though restaurants have suffered 10 to 30 percent declines in annual revenues, some noted that restaurants are building an evening clientele and beginning to serve as anchors for downtown. They see restaurants and entertainment venues as driving development and noted that the Pavilions’ House of Blues had its most successful opening in that franchise’s history. The Pavilions may have been intended to be a fashion destination but many concluded that its current strength is in restaurants and entertainment, primarily because of a lack of downtown residents. Nearly all expressed a desire to have more upscale tenants but that the market did not now exist. Others countered that there is a pent up demand provided by
Downtown Houston Retail Analysis 33 Gibbs Planning Group, Inc. January 10, 2010
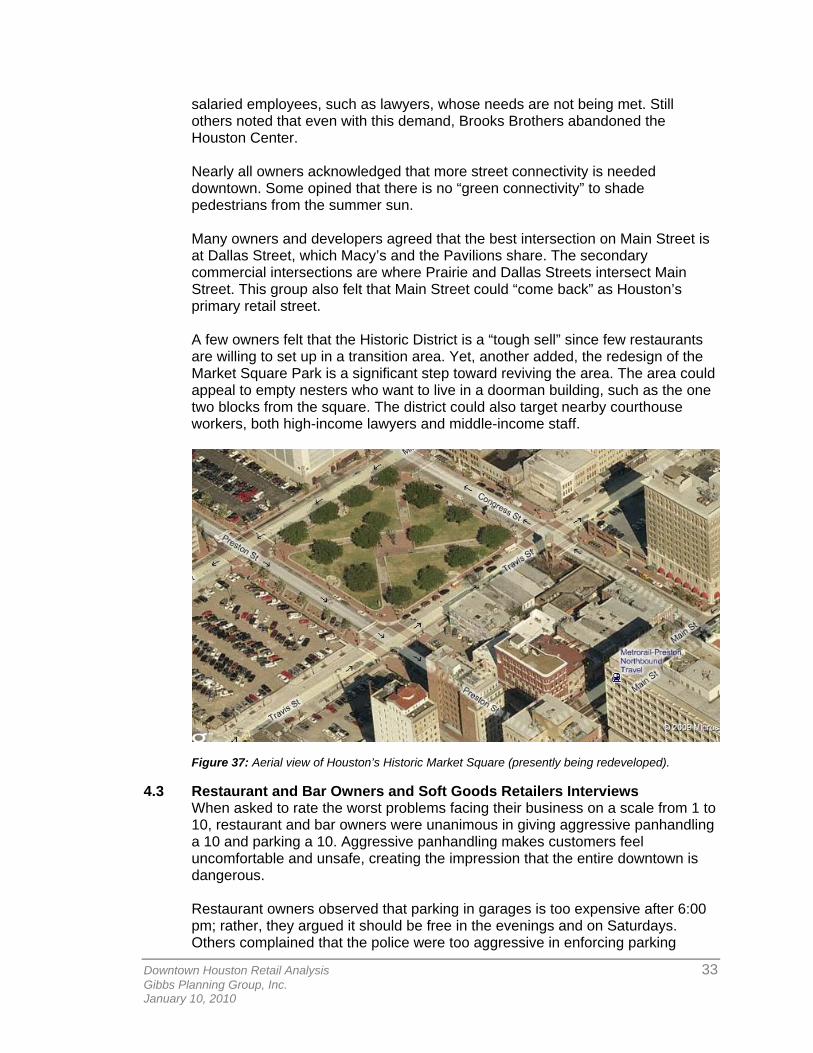
salaried employees, such as lawyers, whose needs are not being met. Still others noted that even with this demand, Brooks Brothers abandoned the Houston Center. Nearly all owners acknowledged that more street connectivity is needed downtown. Some opined that there is no “green connectivity” to shade pedestrians from the summer sun. Many owners and developers agreed that the best intersection on Main Street is at Dallas Street, which Macy’s and the Pavilions share. The secondary commercial intersections are where Prairie and Dallas Streets intersect Main Street. This group also felt that Main Street could “come back” as Houston’s primary retail street. A few owners felt that the Historic District is a “tough sell” since few restaurants are willing to set up in a transition area. Yet, another added, the redesign of the Market Square Park is a significant step toward reviving the area. The area could appeal to empty nesters who want to live in a doorman building, such as the one two blocks from the square. The district could also target nearby courthouse workers, both high-income lawyers and middle-income staff.
Figure 37: Aerial view of Houston’s Historic Market Square (presently being redeveloped).
4.3 Restaurant and Bar Owners and Soft Goods Retailers Interviews When asked to rate the worst problems facing their business on a scale from 1 to 10, restaurant and bar owners were unanimous in giving aggressive panhandling a 10 and parking a 10. Aggressive panhandling makes customers feel uncomfortable and unsafe, creating the impression that the entire downtown is dangerous. Restaurant owners observed that parking in garages is too expensive after 6:00 pm; rather, they argued it should be free in the evenings and on Saturdays. Others complained that the police were too aggressive in enforcing parking
Downtown Houston Retail Analysis 34 Gibbs Planning Group, Inc. January 10, 2010
infractions, resulting in a negative experience for suburban patrons who might, as a result, not wish to return. A few restaurant and bar owners proclaimed that convention tourists were “gold” to the city. Without them, their establishments might not be in business, whereas baseball and basketball fans quickly leave the city after games. When asked what improvements were needed in downtown, they responded that there should be a retail and restaurant corridor on Dallas Street from the Convention Center to Main Street. Restaurant owners want the HDMD to encourage less development in the tunnels and more on the street. For them, closing the tunnels might “double or triple” their sales. In contrast, larger retailers acknowledged that the “number one door” is the interior stairs from the tunnels. Retailers, especially those on or near Main Street, recognized that the METRORail helps their businesses. Loyal customers working in or residing near the Medical Center can readily take the METRORail to shop downtown. Some restaurant owners said that the District should not try to bring in more retailers, but should try to encourage more people to live downtown. Others countered that retail helps their businesses. Similarly, some of the retailers do not want to see more retail downtown, especially if it directly competes. But others acknowledged that cross-shopping could be mutually beneficial.
5.0 CHALLENGES & OPPORTUNITIES
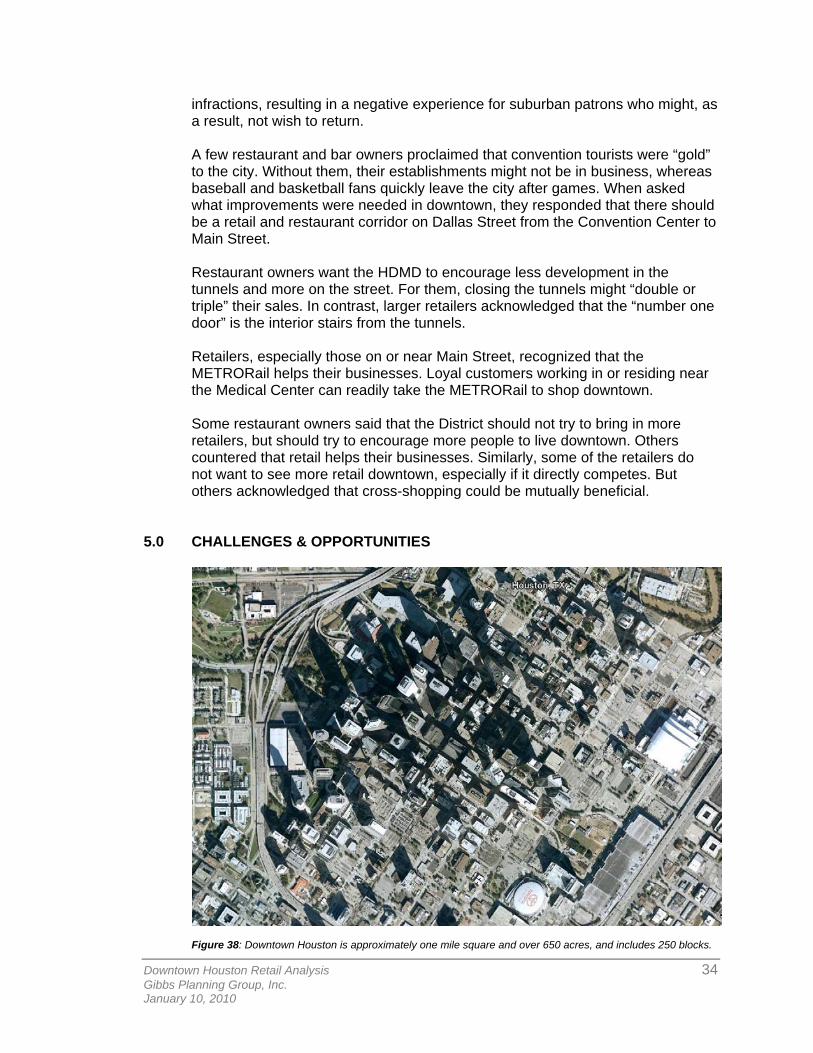
Figure 38: Downtown Houston is approximately one mile square and over 650 acres, and includes 250 blocks.
Downtown Houston Retail Analysis 35 Gibbs Planning Group, Inc. January 10, 2010
5.1 Overview Houston, the fourth largest city in the US, is located 45 miles from the Gulf of Mexico and approximately 225 miles southeast of Dallas. It was incorporated in 1837, and named after the President of the Republic of Texas, Sam Houston. Houston is the energy capital of the world, the U.S. headquarters for most major energy companies, including ConocoPhillips, Exxon-Mobile, Shell Oil, Marathon, BP, CITGO, and the command center for NASA. The Gross Area Product of Houston is greater than the Gross Domestic Product of all but 21 nations in the world.
5.2 Business Opening Challenges Today, downtown Houston’s retail market has a number of challenges: parking, lighting, signage, panhandling, and street-level building design. Nationwide, the retail industry has endured and continues to face weak sales, which has resulted in store closures and the suspension of new retail developments. Nonetheless, the consumer expenditure potential that downtown Houston could statistically capture could support an additional 401,100 square feet of retail space. The primary issues facing downtown Houston’s commerce are the following:
1. Parking is not conveniently located or reasonably priced to support substantial infill growth of retail space.
2. Panhandlers in downtown are aggressive and are perceived to be a security issue to consumers—both residents and tourists.
3. Limited business recruitment resources. 4. Poor street, sidewalk and building lighting. 5. Harsh street level building conditions: limited transparency (store
windows), pedestrian access and retail frontages. 6. Ineffective street level and anchor commercial signage. 7. Minimal coordinated marketing and advertizing campaign for downtown
retailers and the HDMD’s services. Unfocused downtown-wide retail leasing strategy.
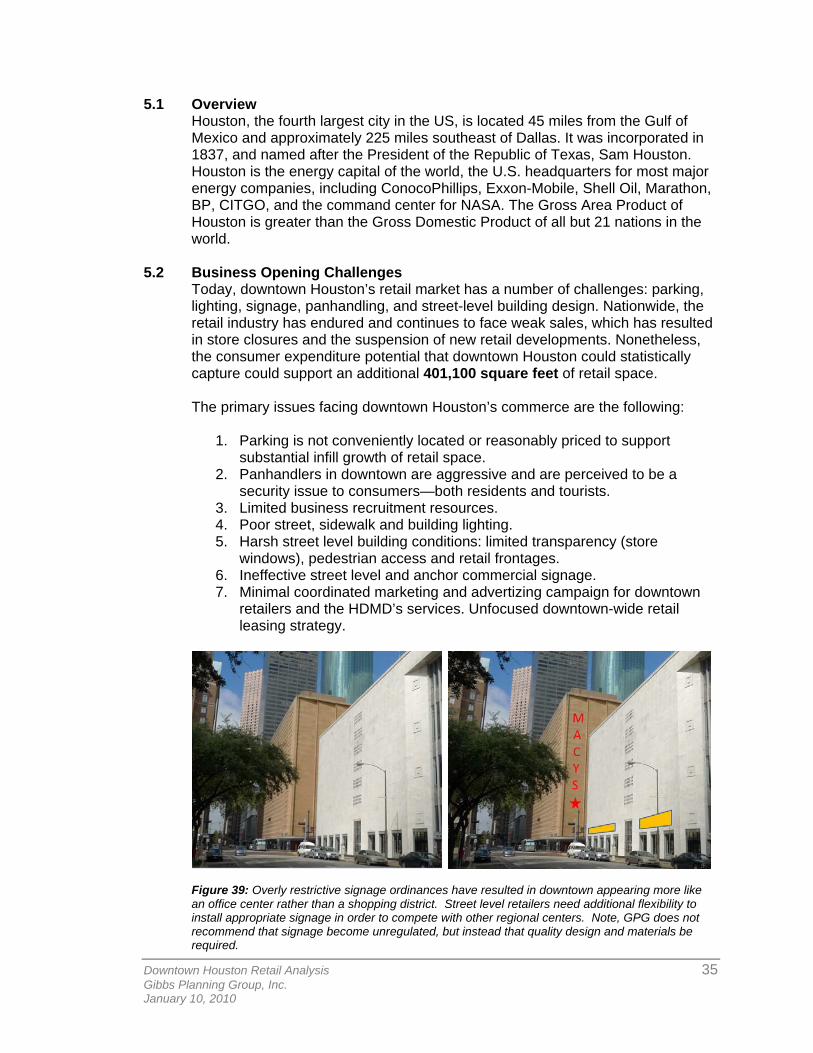
Figure 39: Overly restrictive signage ordinances have resulted in downtown appearing more like an office center rather than a shopping district. Street level retailers need additional flexibility to install appropriate signage in order to compete with other regional centers. Note, GPG does not recommend that signage become unregulated, but instead that quality design and materials be required.
Downtown Houston Retail Analysis 36 Gibbs Planning Group, Inc. January 10, 2010
Other local challenges to opening a business in downtown are the following:
1. The worker/consumer population quickly leaves the downtown area at the end of the business day and rarely takes the time for lengthy shopping trips after work.
2. The direct, local competition for daytime consumer business from the retailers in the tunnel system, who have many competitive advantages—lower operating costs by being open only during peak daytime business hours; a location in one of the many retail clusters within walking distance of major companies; and easy, direct access to the daytime employees in climate-controlled, pedestrian-orientated pathways.
3. Strongly established regional and community competition from
surrounding retail centers such as the Galleria, Highland Village, West University, River Oaks, Sugarland Town Center, and Woodlands’ retail components, which are all located closer to where the downtown employees reside and have a broader range of retail to meet their shopping needs.
5.3 Space Limitations
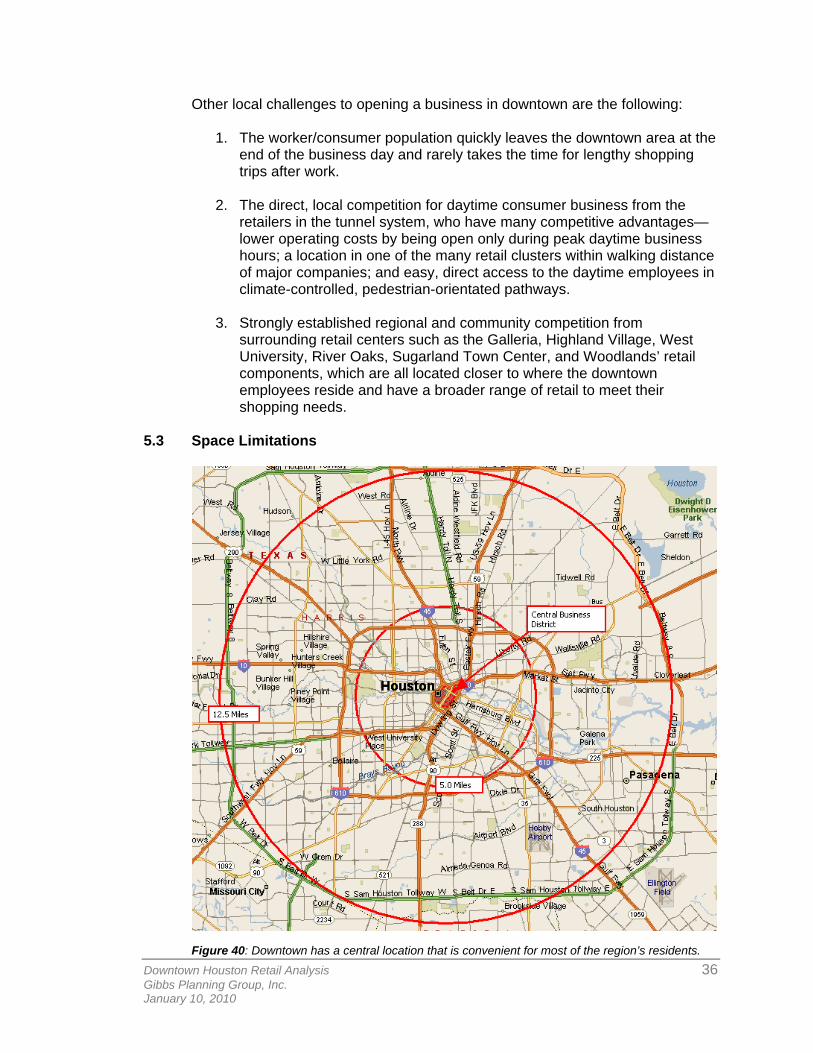
Figure 40: Downtown has a central location that is convenient for most of the region’s residents.
Downtown Houston Retail Analysis 37 Gibbs Planning Group, Inc. January 10, 2010
Geographically, downtown Houston is defined by the inner ring of highways I-10, I-45 and US 59. This ring of raised highways creates a definitive boundary in which downtown is confined. New development opportunities are found in the eastern and southern quadrants of downtown primarily southeast of Austin Street. This area has many surface parking lots or low-rise buildings which could be redeveloped. The deficiency of dense, stacked parking in these eastern and southern quadrants of downtown has both negative and positive aspects for new development. The negative is that any new development that eliminates surface parking, which is necessary for the two major sports venues—the Minute Maid Park and Toyota Center—and the George Brown Convention Center, would have to budget for replacement parking and parking for their own use, at great expense. The positive is that this new parking would be owned by the retail developer, or by the city, and could adopt retail-friendly best-management practices, such as two-hour free parking for shoppers with validation and convenient pedestrian links to the retail. Another limitation of space issue of a different nature found in downtown is the lack of homogenous and connected street-level retail. This issue is created by the design of many of the office building blocks, with the Discovery (Hess) Tower being the most recent example. Although Discovery Tower borders Discovery Park to create an urban link of potential consumer foot traffic between the George Brown Convention Center, the Shops at Houston Center, and Main Street Square District, it has no street-level retail. While the lack of street-level retail has limited impact on the consumer traveling to a predetermined destination, the lack of street-level retail does not induce consumers to travel one more block to see an interesting store front or recognizable retail brand name, which would lengthen their shopping trip and increase their potential expenditure on soft goods. This issue, which may in some parts of downtown be a direct result of the competition from the existing tunnel system, could be reversed through encouragement and incentives established by Houston's municipal government. These incentives could include: convenient free public parking, more flexible signage standards, strict panhandling enforcement, leasing assistance, district marketing and focused public realm enhancements.
5.4 Retail Connector Streets Given the lack of continuous street-level retail in downtown, the HDMD asked GPG to evaluate certain streets for their capacity to serve as pedestrian retail streets linking downtown Houston’s four primary areas: Historic Market Square, Theater District, Minute Maid Park, and George Brown Convention Center. At times referred to as a “yellow-brick road,” the envisioned connector streets would form a square linking the four areas. The two east – west streets would also connect to Main Street, which would serve as the concept’s spine. The four areas are a maximum of one-half mile from each other, which is a 10-15 minute walk. After walking and driving possible connectors, GPG determined that the abundance of blank, inactive walls (primarily the product of parking garages) and empty spatial gaps (surface parking lots), the scarcity of storefront buildings, and the difficult economic climate makes the concept of retail connector streets delineating a square too challenging at this time and likely for the next decade. Rather, GPG recommends that the HDMD focus its efforts on the two east – west streets connecting to Main Street. The proposed “Z”-shaped circulation plan
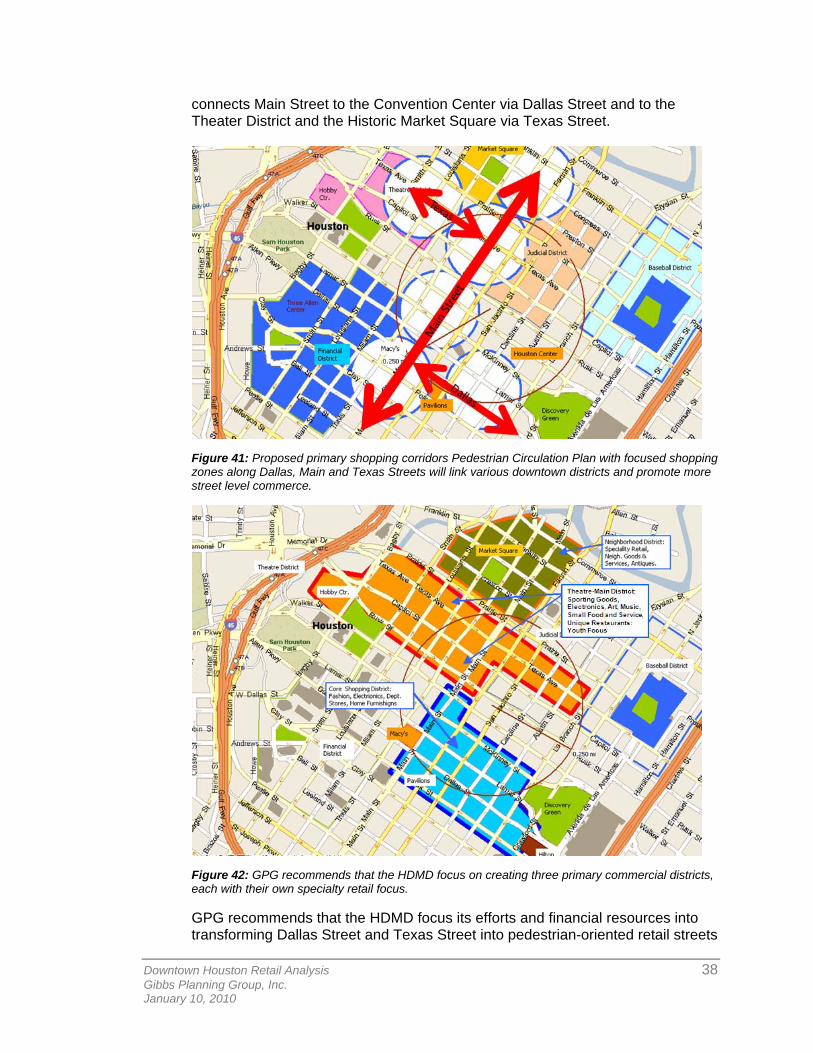
Downtown Houston Retail Analysis 38 Gibbs Planning Group, Inc. January 10, 2010
connects Main Street to the Convention Center via Dallas Street and to the Theater District and the Historic Market Square via Texas Street.
Figure 41: Proposed primary shopping corridors Pedestrian Circulation Plan with focused shopping zones along Dallas, Main and Texas Streets will link various downtown districts and promote more street level commerce.
Figure 42: GPG recommends that the HDMD focus on creating three primary commercial districts, each with their own specialty retail focus. GPG recommends that the HDMD focus its efforts and financial resources into transforming Dallas Street and Texas Street into pedestrian-oriented retail streets
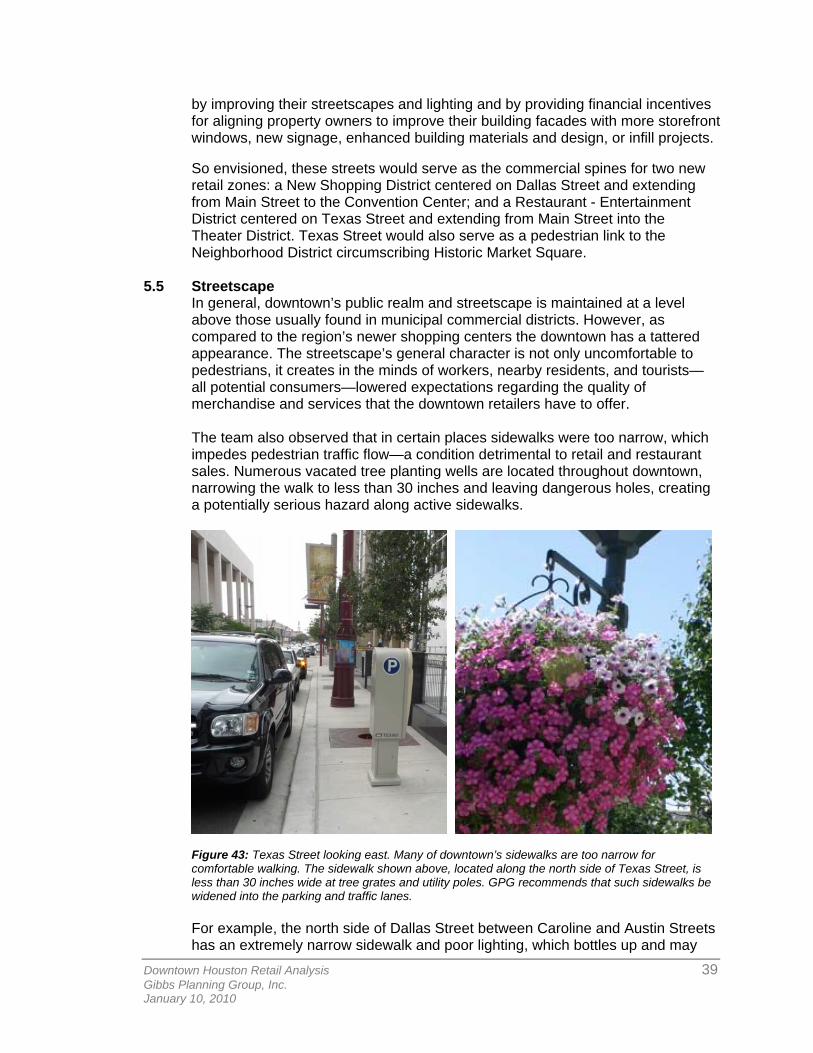
Downtown Houston Retail Analysis 39 Gibbs Planning Group, Inc. January 10, 2010
by improving their streetscapes and lighting and by providing financial incentives for aligning property owners to improve their building facades with more storefront windows, new signage, enhanced building materials and design, or infill projects. So envisioned, these streets would serve as the commercial spines for two new retail zones: a New Shopping District centered on Dallas Street and extending from Main Street to the Convention Center; and a Restaurant - Entertainment District centered on Texas Street and extending from Main Street into the Theater District. Texas Street would also serve as a pedestrian link to the Neighborhood District circumscribing Historic Market Square.
5.5 Streetscape
In general, downtown’s public realm and streetscape is maintained at a level above those usually found in municipal commercial districts. However, as compared to the region’s newer shopping centers the downtown has a tattered appearance. The streetscape’s general character is not only uncomfortable to pedestrians, it creates in the minds of workers, nearby residents, and tourists—all potential consumers—lowered expectations regarding the quality of merchandise and services that the downtown retailers have to offer.
The team also observed that in certain places sidewalks were too narrow, which impedes pedestrian traffic flow—a condition detrimental to retail and restaurant sales. Numerous vacated tree planting wells are located throughout downtown, narrowing the walk to less than 30 inches and leaving dangerous holes, creating a potentially serious hazard along active sidewalks.
Figure 43: Texas Street looking east. Many of downtown’s sidewalks are too narrow for comfortable walking. The sidewalk shown above, located along the north side of Texas Street, is less than 30 inches wide at tree grates and utility poles. GPG recommends that such sidewalks be widened into the parking and traffic lanes. For example, the north side of Dallas Street between Caroline and Austin Streets has an extremely narrow sidewalk and poor lighting, which bottles up and may
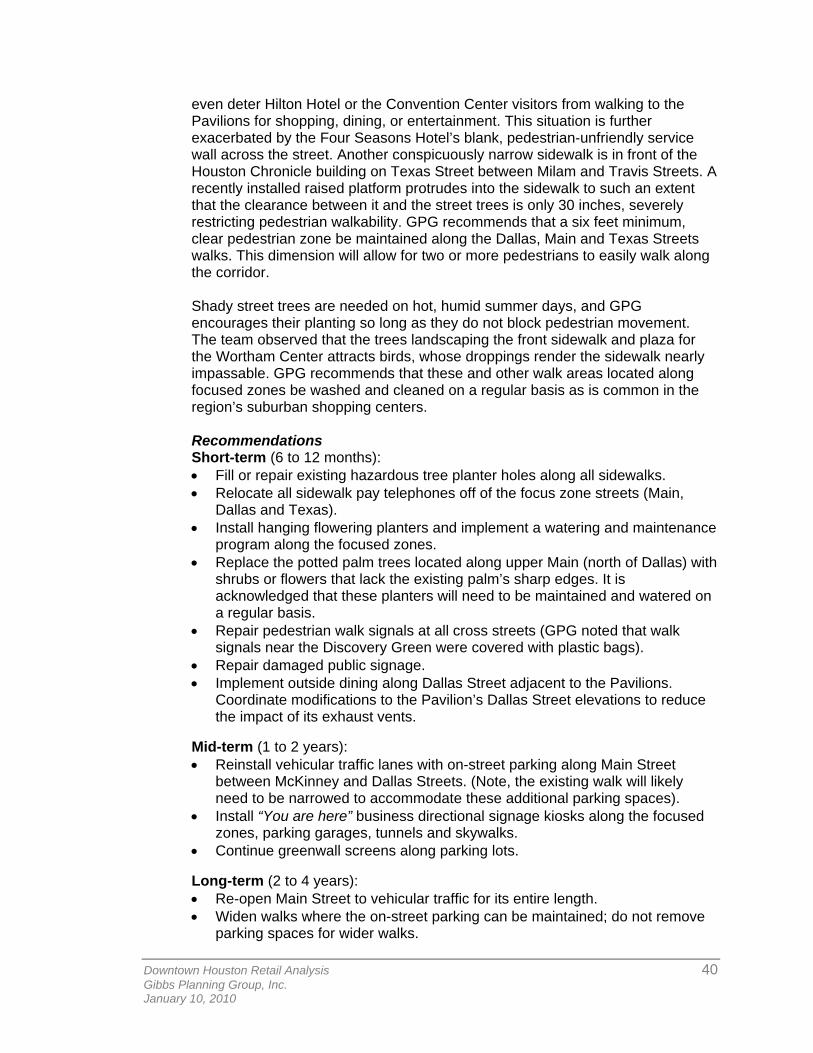
Downtown Houston Retail Analysis 40 Gibbs Planning Group, Inc. January 10, 2010
even deter Hilton Hotel or the Convention Center visitors from walking to the Pavilions for shopping, dining, or entertainment. This situation is further exacerbated by the Four Seasons Hotel’s blank, pedestrian-unfriendly service wall across the street. Another conspicuously narrow sidewalk is in front of the Houston Chronicle building on Texas Street between Milam and Travis Streets. A recently installed raised platform protrudes into the sidewalk to such an extent that the clearance between it and the street trees is only 30 inches, severely restricting pedestrian walkability. GPG recommends that a six feet minimum, clear pedestrian zone be maintained along the Dallas, Main and Texas Streets walks. This dimension will allow for two or more pedestrians to easily walk along the corridor.
Shady street trees are needed on hot, humid summer days, and GPG encourages their planting so long as they do not block pedestrian movement. The team observed that the trees landscaping the front sidewalk and plaza for the Wortham Center attracts birds, whose droppings render the sidewalk nearly impassable. GPG recommends that these and other walk areas located along focused zones be washed and cleaned on a regular basis as is common in the region’s suburban shopping centers. Recommendations Short-term (6 to 12 months): • Fill or repair existing hazardous tree planter holes along all sidewalks. • Relocate all sidewalk pay telephones off of the focus zone streets (Main,
Dallas and Texas). • Install hanging flowering planters and implement a watering and maintenance
program along the focused zones. • Replace the potted palm trees located along upper Main (north of Dallas) with
shrubs or flowers that lack the existing palm’s sharp edges. It is acknowledged that these planters will need to be maintained and watered on a regular basis.
• Repair pedestrian walk signals at all cross streets (GPG noted that walk signals near the Discovery Green were covered with plastic bags).
• Repair damaged public signage. • Implement outside dining along Dallas Street adjacent to the Pavilions.
Coordinate modifications to the Pavilion’s Dallas Street elevations to reduce the impact of its exhaust vents.
Mid-term (1 to 2 years): • Reinstall vehicular traffic lanes with on-street parking along Main Street
between McKinney and Dallas Streets. (Note, the existing walk will likely need to be narrowed to accommodate these additional parking spaces).
• Install “You are here” business directional signage kiosks along the focused zones, parking garages, tunnels and skywalks.
• Continue greenwall screens along parking lots.
Long-term (2 to 4 years): • Re-open Main Street to vehicular traffic for its entire length. • Widen walks where the on-street parking can be maintained; do not remove
parking spaces for wider walks.
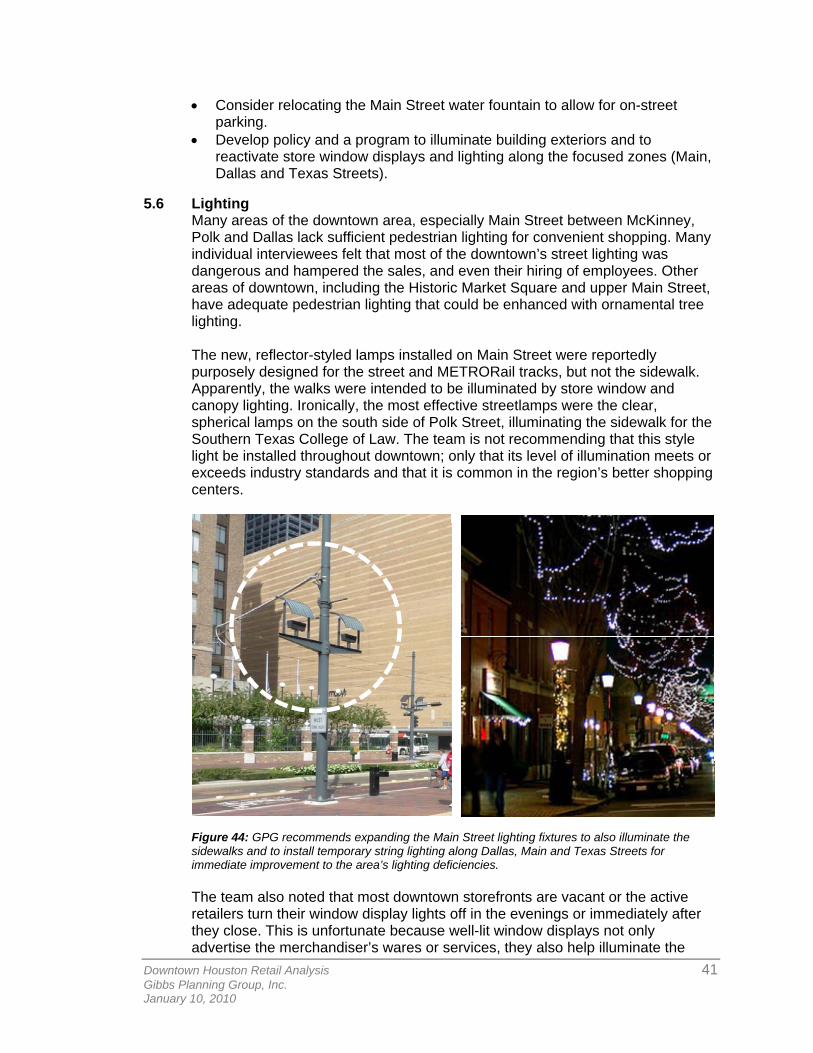
Downtown Houston Retail Analysis 41 Gibbs Planning Group, Inc. January 10, 2010
• Consider relocating the Main Street water fountain to allow for on-street parking.
• Develop policy and a program to illuminate building exteriors and to reactivate store window displays and lighting along the focused zones (Main, Dallas and Texas Streets).
5.6 Lighting Many areas of the downtown area, especially Main Street between McKinney, Polk and Dallas lack sufficient pedestrian lighting for convenient shopping. Many individual interviewees felt that most of the downtown’s street lighting was dangerous and hampered the sales, and even their hiring of employees. Other areas of downtown, including the Historic Market Square and upper Main Street, have adequate pedestrian lighting that could be enhanced with ornamental tree lighting. The new, reflector-styled lamps installed on Main Street were reportedly purposely designed for the street and METRORail tracks, but not the sidewalk. Apparently, the walks were intended to be illuminated by store window and canopy lighting. Ironically, the most effective streetlamps were the clear, spherical lamps on the south side of Polk Street, illuminating the sidewalk for the Southern Texas College of Law. The team is not recommending that this style light be installed throughout downtown; only that its level of illumination meets or exceeds industry standards and that it is common in the region’s better shopping centers.
Figure 44: GPG recommends expanding the Main Street lighting fixtures to also illuminate the sidewalks and to install temporary string lighting along Dallas, Main and Texas Streets for immediate improvement to the area’s lighting deficiencies. The team also noted that most downtown storefronts are vacant or the active retailers turn their window display lights off in the evenings or immediately after they close. This is unfortunate because well-lit window displays not only advertise the merchandiser’s wares or services, they also help illuminate the
Downtown Houston Retail Analysis 42 Gibbs Planning Group, Inc. January 10, 2010
sidewalk and make downtown a more interesting and safer place to walk at night. Facades of buildings should also be illuminated to provide visual interest and to highlight landmarks or key locations. Modern retailers and shopping centers carefully design lighting levels to create an exciting experience that enhances the pedestrian’s appearance. Studies indicate that improving light levels can increase sales by up to 15 percent. New combinations of halogen and low-energy light sources that are precisely designed can improve entire shopping areas without producing glare and light pollution. Light levels should be balanced between commercial and residential needs. Any additional lighting should be designed to have little or no negative impact on residential areas. The purpose of the lighting improvements is to promote more pedestrian movement throughout downtown, and specifically to highlight and ease the pedestrian link from the Convention Center, Theater District and Historic Market Square, to Main Street. The following lighting proposals are divided into short, medium and long-term implementation segments. Recommendations Short-term (60 to 120 days) • Repair all existing non-working or damaged street lighting fixtures throughout
downtown. • Install temporary exterior lighting at key challenging locations along:
o Main Street o Dallas Streets o Texas Streets o Other locations as warranted.
• Activate existing building exterior and store window lighting: o Dallas Street: Crawford to Travis Streets o Main Street: Polk to Preston Streets. o Texas Street: Main to Bagby.
• Install temporary string lighting in tree canopies along: o Dallas between Crawford to Main Streets to link Convention Center
area with Main Street & Pavilions areas. o Main Street between: Polk to McKinney Streets. o Texas Ave: Fannin to Bagby Streets Theatre District.
Mid-term (6 to 18 months): • Activate store window and building canopy lighting along the focus zones:
Main, Texas and Dallas Streets. • Extend existing Main Street light-fixture standards between McKinney and
Main Streets. • Install temporary string lighting in tree canopies along:
o Main Street: McKinney to Commerce Streets. o Around the Historic Market Square Park.
• Illuminate Landmark building exteriors such as: o City Hall o Macy’s o Historic corner buildings.
Downtown Houston Retail Analysis 43 Gibbs Planning Group, Inc. January 10, 2010
• Light civic art features including o Miro sculpture on Capitol Street o Key water features along Main Street.
Long-term (2 to 4 years) • Install new pedestrian and street lighting fixtures along Main Street:
McKinney to Clay Streets.
5.7 Building Design Standards During the group meetings, HDMD staff and board representatives, property holders, business owners and managers expressed pride in the character, diversity, and history of Houston’s architecture, whether gleaming new towers, mid-century modern storefronts, or authentic historic buildings. Many also expressed a desire to preserve the character of Houston’s traditional architecture, specifically in the Historic District. They also expressed concern that new construction was not always contributing to the public realm in terms of arresting storefront designs, shaded sidewalks, or sidewalk dining.
Figure 45: Houston has traditionally allowed numerous oversized building signs for anchor tenants. These signs are necessary for competitive commerce and GPG recommends larger signs for key retailers and merchants throughout downtown. Note, the House of Blues sign is too small and understated for the size of its building. GPG recognizes that in a city that eschews zoning, any recommendation of adopting building design standards is problematic. Nonetheless, the team believes that for retail to be sustainable, let alone thrive, economic rewards or incentives should be given to property and building owners who adopt proven standards for merchandising, storefront, signage, and urban design. This is especially true for streetfront properties within the proposed focus zone, the continuous pedestrian circulation along Dallas, Main, and Texas Streets.
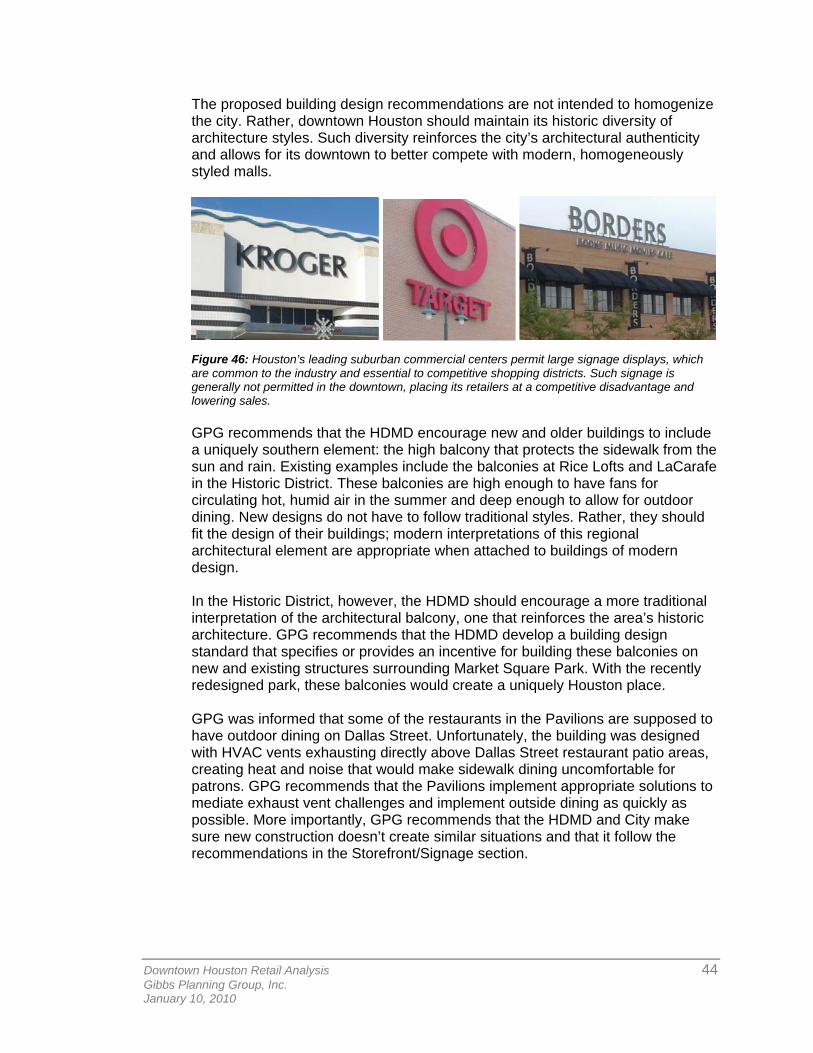
Downtown Houston Retail Analysis 44 Gibbs Planning Group, Inc. January 10, 2010
The proposed building design recommendations are not intended to homogenize the city. Rather, downtown Houston should maintain its historic diversity of architecture styles. Such diversity reinforces the city’s architectural authenticity and allows for its downtown to better compete with modern, homogeneously styled malls.
Figure 46: Houston’s leading suburban commercial centers permit large signage displays, which are common to the industry and essential to competitive shopping districts. Such signage is generally not permitted in the downtown, placing its retailers at a competitive disadvantage and lowering sales. GPG recommends that the HDMD encourage new and older buildings to include a uniquely southern element: the high balcony that protects the sidewalk from the sun and rain. Existing examples include the balconies at Rice Lofts and LaCarafe in the Historic District. These balconies are high enough to have fans for circulating hot, humid air in the summer and deep enough to allow for outdoor dining. New designs do not have to follow traditional styles. Rather, they should fit the design of their buildings; modern interpretations of this regional architectural element are appropriate when attached to buildings of modern design.
In the Historic District, however, the HDMD should encourage a more traditional interpretation of the architectural balcony, one that reinforces the area’s historic architecture. GPG recommends that the HDMD develop a building design standard that specifies or provides an incentive for building these balconies on new and existing structures surrounding Market Square Park. With the recently redesigned park, these balconies would create a uniquely Houston place. GPG was informed that some of the restaurants in the Pavilions are supposed to have outdoor dining on Dallas Street. Unfortunately, the building was designed with HVAC vents exhausting directly above Dallas Street restaurant patio areas, creating heat and noise that would make sidewalk dining uncomfortable for patrons. GPG recommends that the Pavilions implement appropriate solutions to mediate exhaust vent challenges and implement outside dining as quickly as possible. More importantly, GPG recommends that the HDMD and City make sure new construction doesn’t create similar situations and that it follow the recommendations in the Storefront/Signage section.
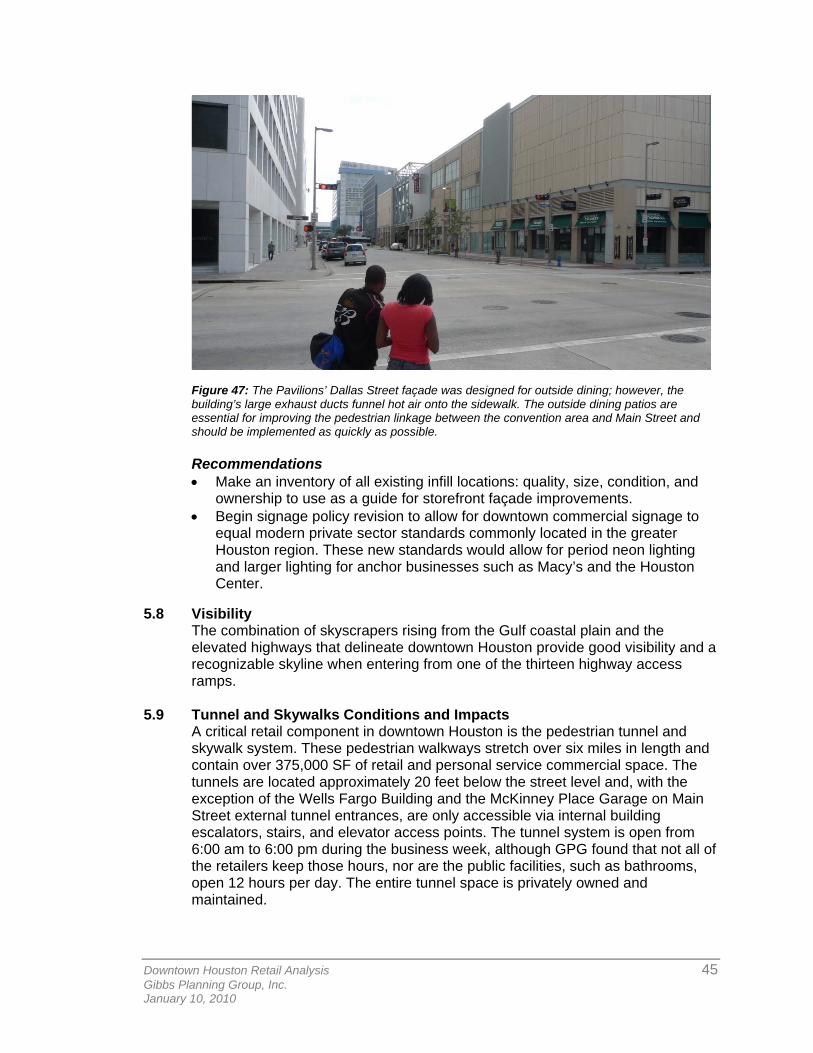
Downtown Houston Retail Analysis 45 Gibbs Planning Group, Inc. January 10, 2010
Figure 47: The Pavilions’ Dallas Street façade was designed for outside dining; however, the building’s large exhaust ducts funnel hot air onto the sidewalk. The outside dining patios are essential for improving the pedestrian linkage between the convention area and Main Street and should be implemented as quickly as possible. Recommendations • Make an inventory of all existing infill locations: quality, size, condition, and
ownership to use as a guide for storefront façade improvements. • Begin signage policy revision to allow for downtown commercial signage to
equal modern private sector standards commonly located in the greater Houston region. These new standards would allow for period neon lighting and larger lighting for anchor businesses such as Macy’s and the Houston Center.
5.8 Visibility The combination of skyscrapers rising from the Gulf coastal plain and the elevated highways that delineate downtown Houston provide good visibility and a recognizable skyline when entering from one of the thirteen highway access ramps.
5.9 Tunnel and Skywalks Conditions and Impacts A critical retail component in downtown Houston is the pedestrian tunnel and skywalk system. These pedestrian walkways stretch over six miles in length and contain over 375,000 SF of retail and personal service commercial space. The tunnels are located approximately 20 feet below the street level and, with the exception of the Wells Fargo Building and the McKinney Place Garage on Main Street external tunnel entrances, are only accessible via internal building escalators, stairs, and elevator access points. The tunnel system is open from 6:00 am to 6:00 pm during the business week, although GPG found that not all of the retailers keep those hours, nor are the public facilities, such as bathrooms, open 12 hours per day. The entire tunnel space is privately owned and maintained.
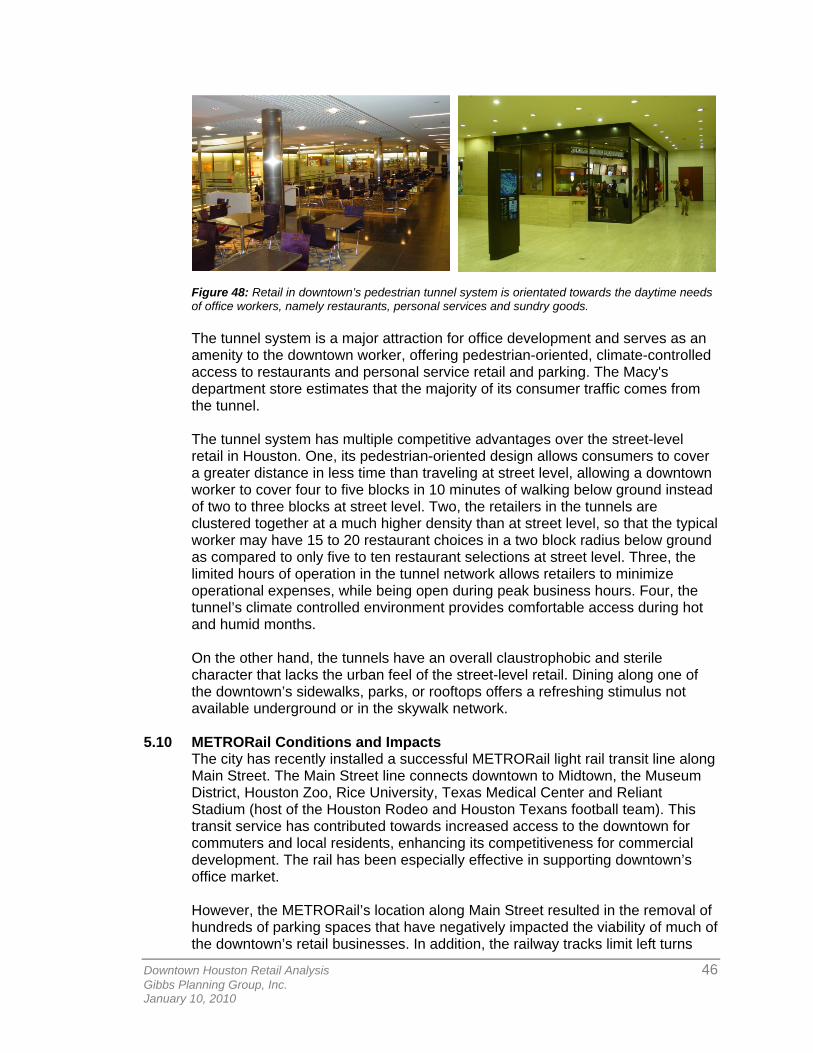
Downtown Houston Retail Analysis 46 Gibbs Planning Group, Inc. January 10, 2010
Figure 48: Retail in downtown’s pedestrian tunnel system is orientated towards the daytime needs of office workers, namely restaurants, personal services and sundry goods. The tunnel system is a major attraction for office development and serves as an amenity to the downtown worker, offering pedestrian-oriented, climate-controlled access to restaurants and personal service retail and parking. The Macy's department store estimates that the majority of its consumer traffic comes from the tunnel. The tunnel system has multiple competitive advantages over the street-level retail in Houston. One, its pedestrian-oriented design allows consumers to cover a greater distance in less time than traveling at street level, allowing a downtown worker to cover four to five blocks in 10 minutes of walking below ground instead of two to three blocks at street level. Two, the retailers in the tunnels are clustered together at a much higher density than at street level, so that the typical worker may have 15 to 20 restaurant choices in a two block radius below ground as compared to only five to ten restaurant selections at street level. Three, the limited hours of operation in the tunnel network allows retailers to minimize operational expenses, while being open during peak business hours. Four, the tunnel’s climate controlled environment provides comfortable access during hot and humid months. On the other hand, the tunnels have an overall claustrophobic and sterile character that lacks the urban feel of the street-level retail. Dining along one of the downtown’s sidewalks, parks, or rooftops offers a refreshing stimulus not available underground or in the skywalk network.
5.10 METRORail Conditions and Impacts The city has recently installed a successful METRORail light rail transit line along Main Street. The Main Street line connects downtown to Midtown, the Museum District, Houston Zoo, Rice University, Texas Medical Center and Reliant Stadium (host of the Houston Rodeo and Houston Texans football team). This transit service has contributed towards increased access to the downtown for commuters and local residents, enhancing its competitiveness for commercial development. The rail has been especially effective in supporting downtown’s office market. However, the METRORail’s location along Main Street resulted in the removal of hundreds of parking spaces that have negatively impacted the viability of much of the downtown’s retail businesses. In addition, the railway tracks limit left turns
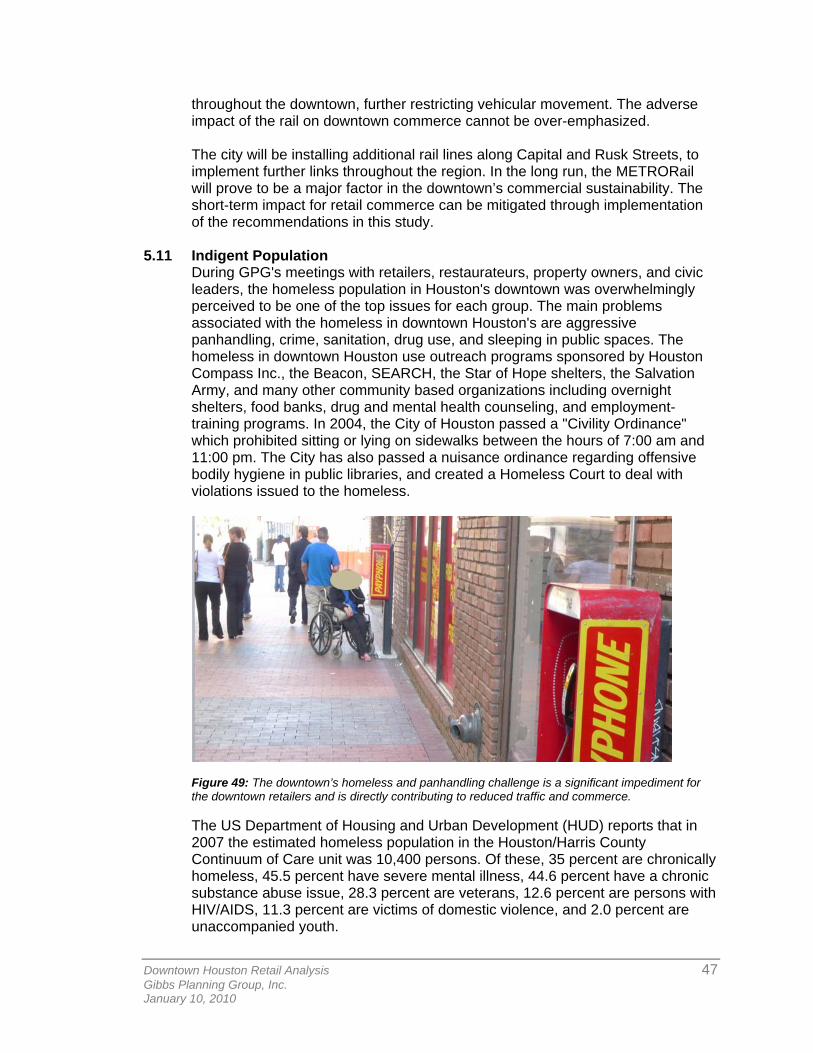
Downtown Houston Retail Analysis 47 Gibbs Planning Group, Inc. January 10, 2010
throughout the downtown, further restricting vehicular movement. The adverse impact of the rail on downtown commerce cannot be over-emphasized. The city will be installing additional rail lines along Capital and Rusk Streets, to implement further links throughout the region. In the long run, the METRORail will prove to be a major factor in the downtown’s commercial sustainability. The short-term impact for retail commerce can be mitigated through implementation of the recommendations in this study.
5.11 Indigent Population During GPG's meetings with retailers, restaurateurs, property owners, and civic leaders, the homeless population in Houston's downtown was overwhelmingly perceived to be one of the top issues for each group. The main problems associated with the homeless in downtown Houston's are aggressive panhandling, crime, sanitation, drug use, and sleeping in public spaces. The homeless in downtown Houston use outreach programs sponsored by Houston Compass Inc., the Beacon, SEARCH, the Star of Hope shelters, the Salvation Army, and many other community based organizations including overnight shelters, food banks, drug and mental health counseling, and employment-training programs. In 2004, the City of Houston passed a "Civility Ordinance" which prohibited sitting or lying on sidewalks between the hours of 7:00 am and 11:00 pm. The City has also passed a nuisance ordinance regarding offensive bodily hygiene in public libraries, and created a Homeless Court to deal with violations issued to the homeless.
Figure 49: The downtown’s homeless and panhandling challenge is a significant impediment for the downtown retailers and is directly contributing to reduced traffic and commerce. The US Department of Housing and Urban Development (HUD) reports that in 2007 the estimated homeless population in the Houston/Harris County Continuum of Care unit was 10,400 persons. Of these, 35 percent are chronically homeless, 45.5 percent have severe mental illness, 44.6 percent have a chronic substance abuse issue, 28.3 percent are veterans, 12.6 percent are persons with HIV/AIDS, 11.3 percent are victims of domestic violence, and 2.0 percent are unaccompanied youth.
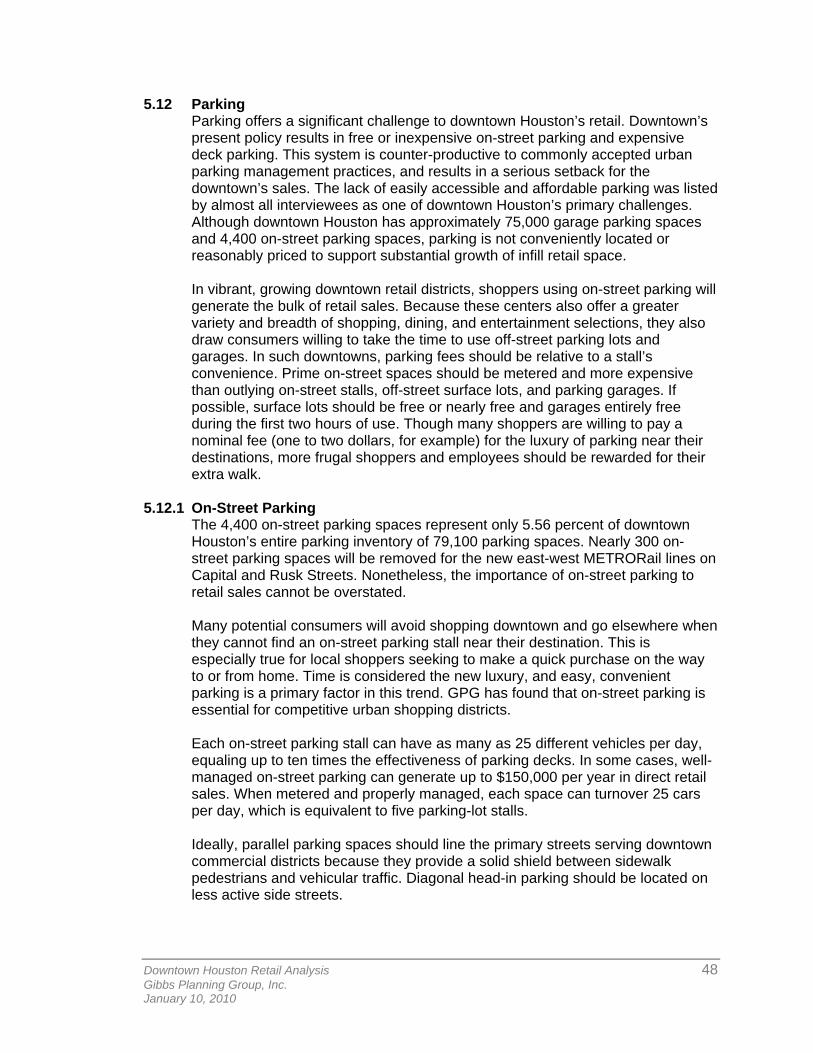
Downtown Houston Retail Analysis 48 Gibbs Planning Group, Inc. January 10, 2010
5.12 Parking Parking offers a significant challenge to downtown Houston’s retail. Downtown’s present policy results in free or inexpensive on-street parking and expensive deck parking. This system is counter-productive to commonly accepted urban parking management practices, and results in a serious setback for the downtown’s sales. The lack of easily accessible and affordable parking was listed by almost all interviewees as one of downtown Houston’s primary challenges. Although downtown Houston has approximately 75,000 garage parking spaces and 4,400 on-street parking spaces, parking is not conveniently located or reasonably priced to support substantial growth of infill retail space. In vibrant, growing downtown retail districts, shoppers using on-street parking will generate the bulk of retail sales. Because these centers also offer a greater variety and breadth of shopping, dining, and entertainment selections, they also draw consumers willing to take the time to use off-street parking lots and garages. In such downtowns, parking fees should be relative to a stall’s convenience. Prime on-street spaces should be metered and more expensive than outlying on-street stalls, off-street surface lots, and parking garages. If possible, surface lots should be free or nearly free and garages entirely free during the first two hours of use. Though many shoppers are willing to pay a nominal fee (one to two dollars, for example) for the luxury of parking near their destinations, more frugal shoppers and employees should be rewarded for their extra walk.
5.12.1 On-Street Parking The 4,400 on-street parking spaces represent only 5.56 percent of downtown Houston’s entire parking inventory of 79,100 parking spaces. Nearly 300 on-street parking spaces will be removed for the new east-west METRORail lines on Capital and Rusk Streets. Nonetheless, the importance of on-street parking to retail sales cannot be overstated. Many potential consumers will avoid shopping downtown and go elsewhere when they cannot find an on-street parking stall near their destination. This is especially true for local shoppers seeking to make a quick purchase on the way to or from home. Time is considered the new luxury, and easy, convenient parking is a primary factor in this trend. GPG has found that on-street parking is essential for competitive urban shopping districts. Each on-street parking stall can have as many as 25 different vehicles per day, equaling up to ten times the effectiveness of parking decks. In some cases, well-managed on-street parking can generate up to $150,000 per year in direct retail sales. When metered and properly managed, each space can turnover 25 cars per day, which is equivalent to five parking-lot stalls. Ideally, parallel parking spaces should line the primary streets serving downtown commercial districts because they provide a solid shield between sidewalk pedestrians and vehicular traffic. Diagonal head-in parking should be located on less active side streets.
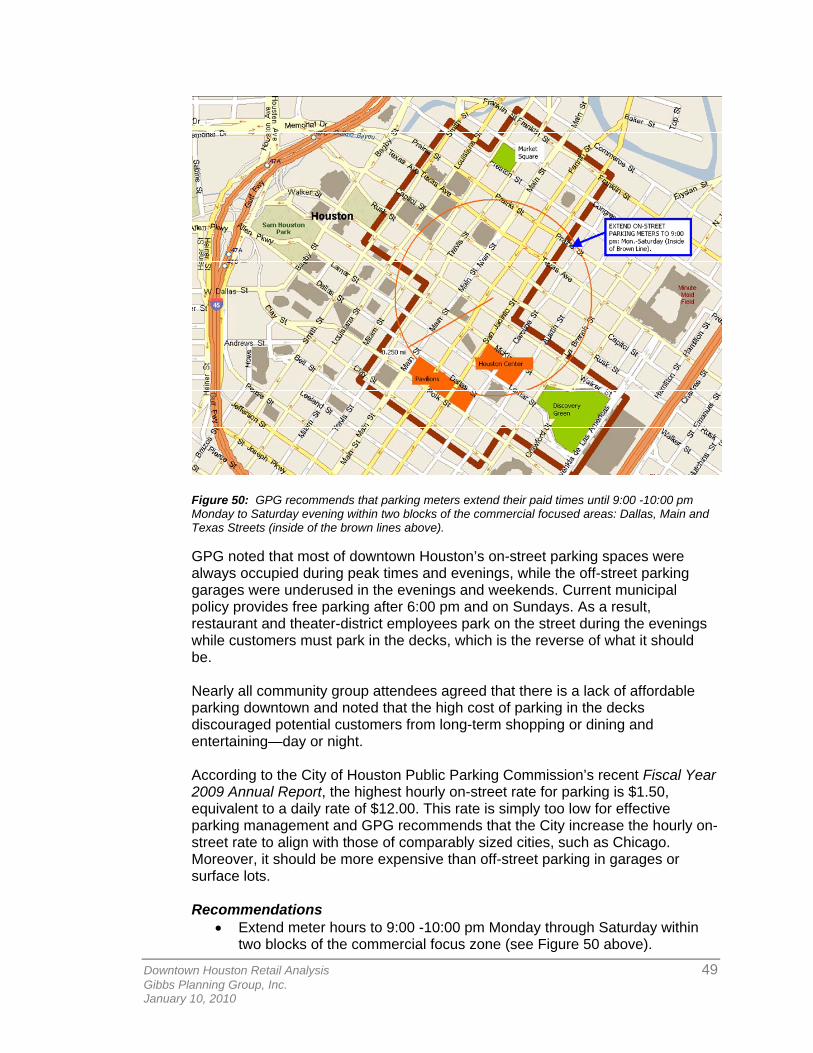
Downtown Houston Retail Analysis 49 Gibbs Planning Group, Inc. January 10, 2010
Figure 50: GPG recommends that parking meters extend their paid times until 9:00 -10:00 pm Monday to Saturday evening within two blocks of the commercial focused areas: Dallas, Main and Texas Streets (inside of the brown lines above).
GPG noted that most of downtown Houston’s on-street parking spaces were always occupied during peak times and evenings, while the off-street parking garages were underused in the evenings and weekends. Current municipal policy provides free parking after 6:00 pm and on Sundays. As a result, restaurant and theater-district employees park on the street during the evenings while customers must park in the decks, which is the reverse of what it should be. Nearly all community group attendees agreed that there is a lack of affordable parking downtown and noted that the high cost of parking in the decks discouraged potential customers from long-term shopping or dining and entertaining—day or night. According to the City of Houston Public Parking Commission’s recent Fiscal Year 2009 Annual Report, the highest hourly on-street rate for parking is $1.50, equivalent to a daily rate of $12.00. This rate is simply too low for effective parking management and GPG recommends that the City increase the hourly on-street rate to align with those of comparably sized cities, such as Chicago. Moreover, it should be more expensive than off-street parking in garages or surface lots. Recommendations
• Extend meter hours to 9:00 -10:00 pm Monday through Saturday within two blocks of the commercial focus zone (see Figure 50 above).
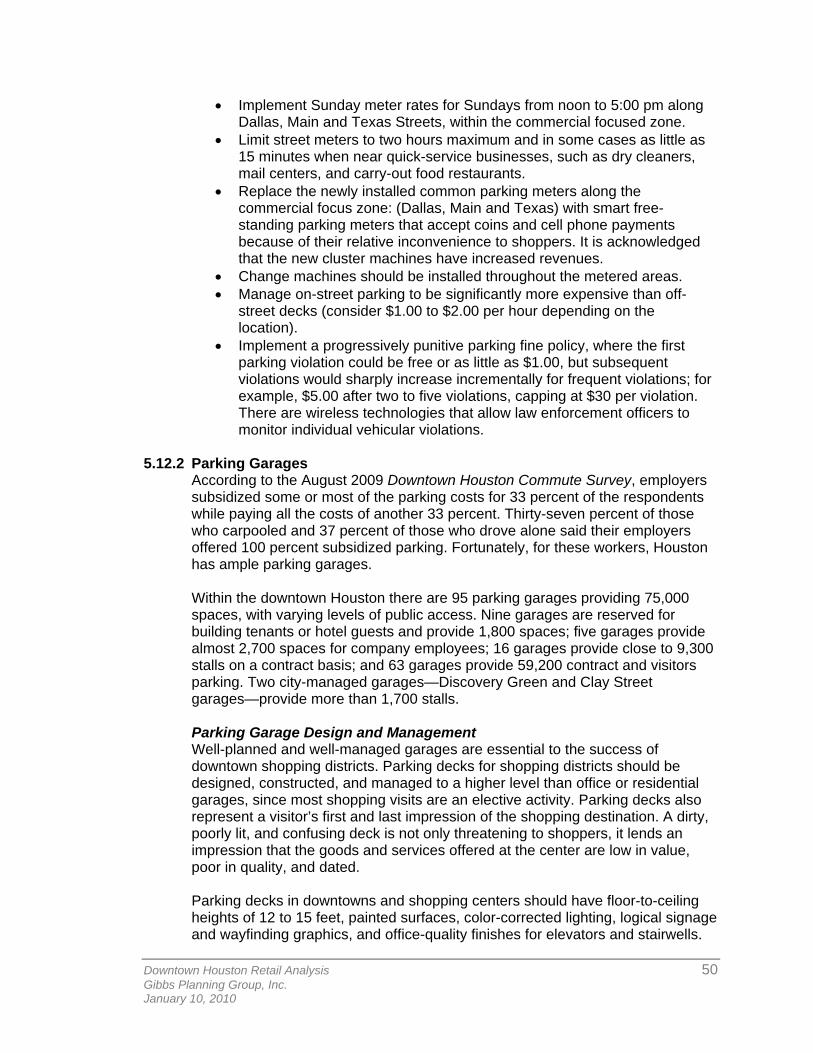
Downtown Houston Retail Analysis 50 Gibbs Planning Group, Inc. January 10, 2010
• Implement Sunday meter rates for Sundays from noon to 5:00 pm along Dallas, Main and Texas Streets, within the commercial focused zone.
• Limit street meters to two hours maximum and in some cases as little as 15 minutes when near quick-service businesses, such as dry cleaners, mail centers, and carry-out food restaurants.
• Replace the newly installed common parking meters along the commercial focus zone: (Dallas, Main and Texas) with smart free-standing parking meters that accept coins and cell phone payments because of their relative inconvenience to shoppers. It is acknowledged that the new cluster machines have increased revenues.
• Change machines should be installed throughout the metered areas. • Manage on-street parking to be significantly more expensive than off-
street decks (consider $1.00 to $2.00 per hour depending on the location).
• Implement a progressively punitive parking fine policy, where the first parking violation could be free or as little as $1.00, but subsequent violations would sharply increase incrementally for frequent violations; for example, $5.00 after two to five violations, capping at $30 per violation. There are wireless technologies that allow law enforcement officers to monitor individual vehicular violations.
5.12.2 Parking Garages
According to the August 2009 Downtown Houston Commute Survey, employers subsidized some or most of the parking costs for 33 percent of the respondents while paying all the costs of another 33 percent. Thirty-seven percent of those who carpooled and 37 percent of those who drove alone said their employers offered 100 percent subsidized parking. Fortunately, for these workers, Houston has ample parking garages. Within the downtown Houston there are 95 parking garages providing 75,000 spaces, with varying levels of public access. Nine garages are reserved for building tenants or hotel guests and provide 1,800 spaces; five garages provide almost 2,700 spaces for company employees; 16 garages provide close to 9,300 stalls on a contract basis; and 63 garages provide 59,200 contract and visitors parking. Two city-managed garages—Discovery Green and Clay Street garages—provide more than 1,700 stalls. Parking Garage Design and Management Well-planned and well-managed garages are essential to the success of downtown shopping districts. Parking decks for shopping districts should be designed, constructed, and managed to a higher level than office or residential garages, since most shopping visits are an elective activity. Parking decks also represent a visitor’s first and last impression of the shopping destination. A dirty, poorly lit, and confusing deck is not only threatening to shoppers, it lends an impression that the goods and services offered at the center are low in value, poor in quality, and dated. Parking decks in downtowns and shopping centers should have floor-to-ceiling heights of 12 to 15 feet, painted surfaces, color-corrected lighting, logical signage and wayfinding graphics, and office-quality finishes for elevators and stairwells.
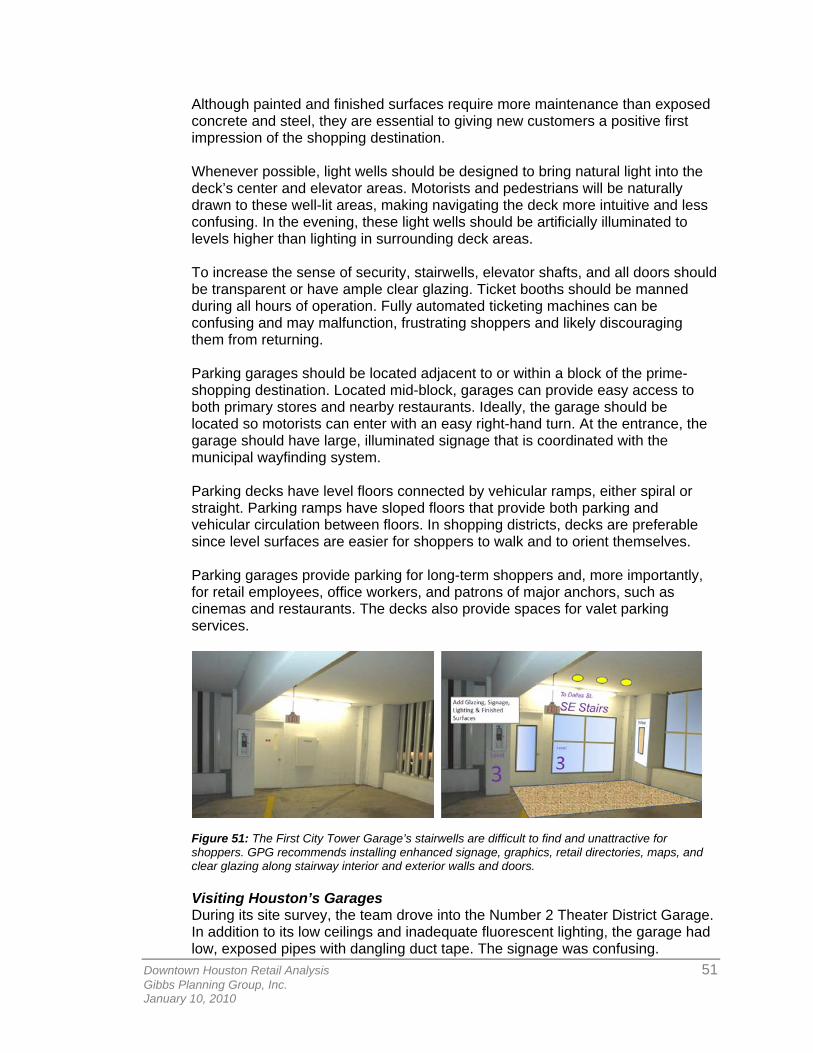
Downtown Houston Retail Analysis 51 Gibbs Planning Group, Inc. January 10, 2010
Although painted and finished surfaces require more maintenance than exposed concrete and steel, they are essential to giving new customers a positive first impression of the shopping destination. Whenever possible, light wells should be designed to bring natural light into the deck’s center and elevator areas. Motorists and pedestrians will be naturally drawn to these well-lit areas, making navigating the deck more intuitive and less confusing. In the evening, these light wells should be artificially illuminated to levels higher than lighting in surrounding deck areas. To increase the sense of security, stairwells, elevator shafts, and all doors should be transparent or have ample clear glazing. Ticket booths should be manned during all hours of operation. Fully automated ticketing machines can be confusing and may malfunction, frustrating shoppers and likely discouraging them from returning. Parking garages should be located adjacent to or within a block of the prime-shopping destination. Located mid-block, garages can provide easy access to both primary stores and nearby restaurants. Ideally, the garage should be located so motorists can enter with an easy right-hand turn. At the entrance, the garage should have large, illuminated signage that is coordinated with the municipal wayfinding system. Parking decks have level floors connected by vehicular ramps, either spiral or straight. Parking ramps have sloped floors that provide both parking and vehicular circulation between floors. In shopping districts, decks are preferable since level surfaces are easier for shoppers to walk and to orient themselves. Parking garages provide parking for long-term shoppers and, more importantly, for retail employees, office workers, and patrons of major anchors, such as cinemas and restaurants. The decks also provide spaces for valet parking services.
Figure 51: The First City Tower Garage’s stairwells are difficult to find and unattractive for shoppers. GPG recommends installing enhanced signage, graphics, retail directories, maps, and clear glazing along stairway interior and exterior walls and doors.
Visiting Houston’s Garages During its site survey, the team drove into the Number 2 Theater District Garage. In addition to its low ceilings and inadequate fluorescent lighting, the garage had low, exposed pipes with dangling duct tape. The signage was confusing.
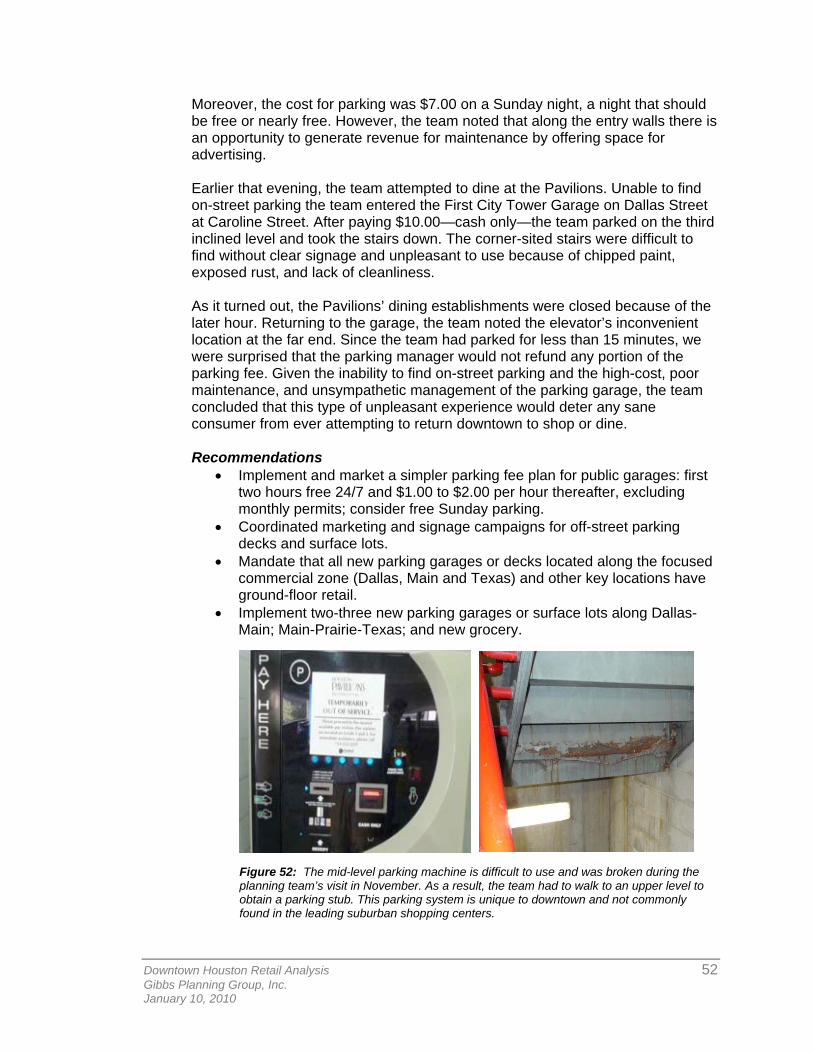
Downtown Houston Retail Analysis 52 Gibbs Planning Group, Inc. January 10, 2010
Moreover, the cost for parking was $7.00 on a Sunday night, a night that should be free or nearly free. However, the team noted that along the entry walls there is an opportunity to generate revenue for maintenance by offering space for advertising. Earlier that evening, the team attempted to dine at the Pavilions. Unable to find on-street parking the team entered the First City Tower Garage on Dallas Street at Caroline Street. After paying $10.00—cash only—the team parked on the third inclined level and took the stairs down. The corner-sited stairs were difficult to find without clear signage and unpleasant to use because of chipped paint, exposed rust, and lack of cleanliness. As it turned out, the Pavilions’ dining establishments were closed because of the later hour. Returning to the garage, the team noted the elevator’s inconvenient location at the far end. Since the team had parked for less than 15 minutes, we were surprised that the parking manager would not refund any portion of the parking fee. Given the inability to find on-street parking and the high-cost, poor maintenance, and unsympathetic management of the parking garage, the team concluded that this type of unpleasant experience would deter any sane consumer from ever attempting to return downtown to shop or dine.
Recommendations
• Implement and market a simpler parking fee plan for public garages: first two hours free 24/7 and $1.00 to $2.00 per hour thereafter, excluding monthly permits; consider free Sunday parking.
• Coordinated marketing and signage campaigns for off-street parking decks and surface lots.
• Mandate that all new parking garages or decks located along the focused commercial zone (Dallas, Main and Texas) and other key locations have ground-floor retail.
• Implement two-three new parking garages or surface lots along Dallas-Main; Main-Prairie-Texas; and new grocery.
Figure 52: The mid-level parking machine is difficult to use and was broken during the planning team’s visit in November. As a result, the team had to walk to an upper level to obtain a parking stub. This parking system is unique to downtown and not commonly found in the leading suburban shopping centers.
Downtown Houston Retail Analysis 53 Gibbs Planning Group, Inc. January 10, 2010
Overall Parking Recommendations Short-term (30-90 days): • Extend on-street parking meter hours to 9:00 pm Monday to Saturday, as
shown above (approximately bounded by Smith, Clay, San Jacinto and Franklin Streets and around the Discovery Green area.
• Extend 9:00 am-6:00 pm Sunday on-street parking meter hours along: Dallas: Main to La Branch Streets; Texas to Main to Smith Streets; Main Street: Congress to Bell Streets.
• Implement an annual progressive parking ticket fine system, ranging from a warning for over-parking in market spaces on the first offense, $20 for 2-5 violations; $30 for 6-10 violations; $40 for 11-15 violations; $50 for 10 or more violations.
• Implement a streamlined parking charge usage rate for all public garages that includes the first 1-2 hours free on a 24/7 basis. Increase longer time rates.
• Install a temporary (1-2 years) low-cost surface parking lot adjacent to the proposed new grocery store located at San Jacinto and McKinney Streets.
• Implement appropriate code building code enforcement of existing parking decks and lots:
o Stairwells o Lighting o Signage
Mid-term (3-12 months): • Replace existing clustered meters with free-standing two hour ($1.00-
$2.00/hr meters) free-standing mechanical meters (such as found in the Woodlands) along:
o Main Street: McKinney-Congress/Bell-Dallas o Dallas Street: Crawford and Travis Streets o Historic Market Square (all four sides) o Texas Street: Fannin and Bagby Streets
Long-term (1-2 years): • Purchase or obtain long-term leases to implement three public parking
surface lots or decks with first two hours free parking and streamlined usage rates at or near:
o Dallas/Fannin Streets • Improve existing public parking garages signage, lighting and general
maintenance to industry standards including: o Additional glazing in stairwell areas.
6.0 MERCHANDISING PLAN
6.1 Merchandising Strategy
Downtown Houston includes dozens of smaller sub-areas of business activities. Some retailers rely on purpose-driven visits from existing customers while other shops benefit from casual impulse purchases. In addition to Houston’s tunnel system of retail, downtown has three primary, overlapping commercial zones: the Historic District, and two districts GPG has identified as a New Shopping District
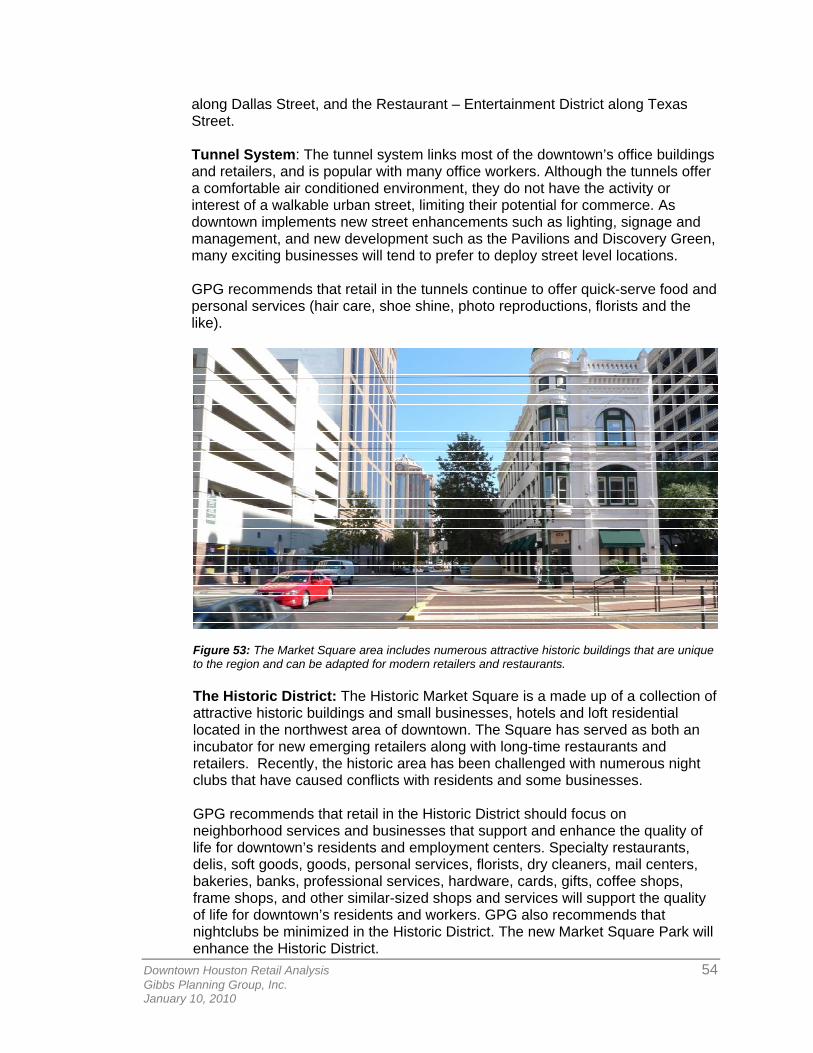
Downtown Houston Retail Analysis 54 Gibbs Planning Group, Inc. January 10, 2010
along Dallas Street, and the Restaurant – Entertainment District along Texas Street. Tunnel System: The tunnel system links most of the downtown’s office buildings and retailers, and is popular with many office workers. Although the tunnels offer a comfortable air conditioned environment, they do not have the activity or interest of a walkable urban street, limiting their potential for commerce. As downtown implements new street enhancements such as lighting, signage and management, and new development such as the Pavilions and Discovery Green, many exciting businesses will tend to prefer to deploy street level locations. GPG recommends that retail in the tunnels continue to offer quick-serve food and personal services (hair care, shoe shine, photo reproductions, florists and the like).
Figure 53: The Market Square area includes numerous attractive historic buildings that are unique to the region and can be adapted for modern retailers and restaurants. The Historic District: The Historic Market Square is a made up of a collection of attractive historic buildings and small businesses, hotels and loft residential located in the northwest area of downtown. The Square has served as both an incubator for new emerging retailers along with long-time restaurants and retailers. Recently, the historic area has been challenged with numerous night clubs that have caused conflicts with residents and some businesses. GPG recommends that retail in the Historic District should focus on neighborhood services and businesses that support and enhance the quality of life for downtown’s residents and employment centers. Specialty restaurants, delis, soft goods, goods, personal services, florists, dry cleaners, mail centers, bakeries, banks, professional services, hardware, cards, gifts, coffee shops, frame shops, and other similar-sized shops and services will support the quality of life for downtown’s residents and workers. GPG also recommends that nightclubs be minimized in the Historic District. The new Market Square Park will enhance the Historic District.
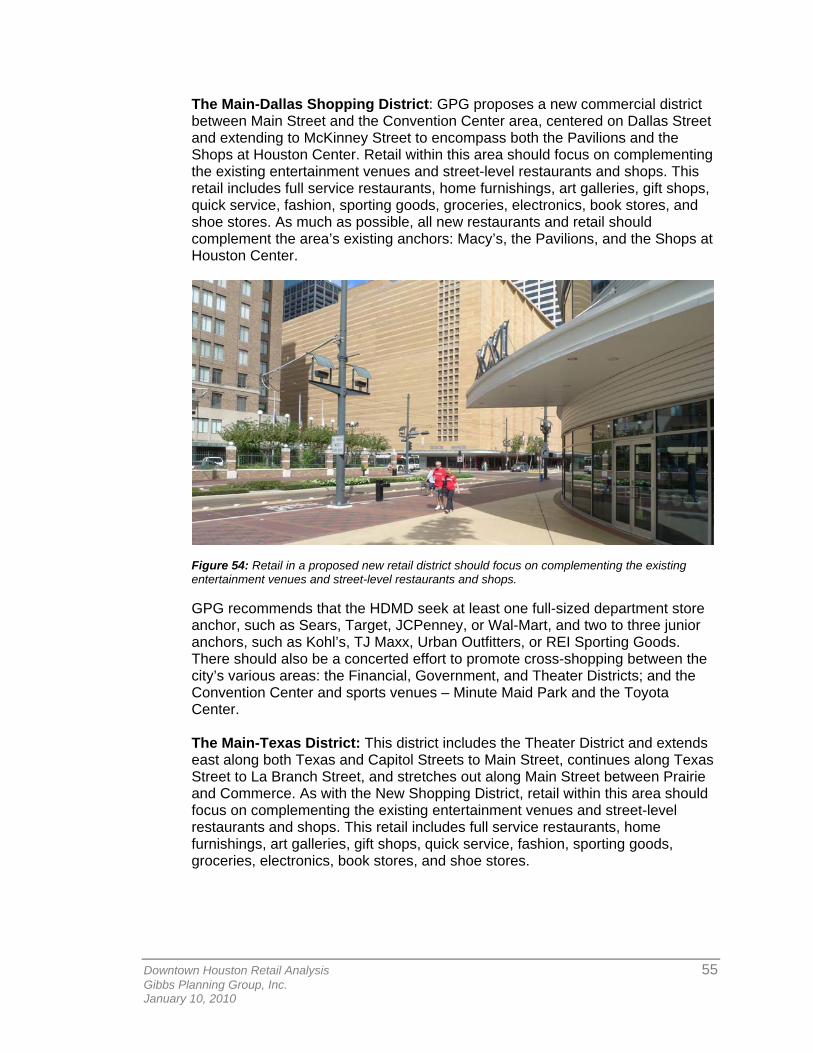
Downtown Houston Retail Analysis 55 Gibbs Planning Group, Inc. January 10, 2010
The Main-Dallas Shopping District: GPG proposes a new commercial district between Main Street and the Convention Center area, centered on Dallas Street and extending to McKinney Street to encompass both the Pavilions and the Shops at Houston Center. Retail within this area should focus on complementing the existing entertainment venues and street-level restaurants and shops. This retail includes full service restaurants, home furnishings, art galleries, gift shops, quick service, fashion, sporting goods, groceries, electronics, book stores, and shoe stores. As much as possible, all new restaurants and retail should complement the area’s existing anchors: Macy’s, the Pavilions, and the Shops at Houston Center.
Figure 54: Retail in a proposed new retail district should focus on complementing the existing entertainment venues and street-level restaurants and shops. GPG recommends that the HDMD seek at least one full-sized department store anchor, such as Sears, Target, JCPenney, or Wal-Mart, and two to three junior anchors, such as Kohl’s, TJ Maxx, Urban Outfitters, or REI Sporting Goods. There should also be a concerted effort to promote cross-shopping between the city’s various areas: the Financial, Government, and Theater Districts; and the Convention Center and sports venues – Minute Maid Park and the Toyota Center. The Main-Texas District: This district includes the Theater District and extends east along both Texas and Capitol Streets to Main Street, continues along Texas Street to La Branch Street, and stretches out along Main Street between Prairie and Commerce. As with the New Shopping District, retail within this area should focus on complementing the existing entertainment venues and street-level restaurants and shops. This retail includes full service restaurants, home furnishings, art galleries, gift shops, quick service, fashion, sporting goods, groceries, electronics, book stores, and shoe stores.
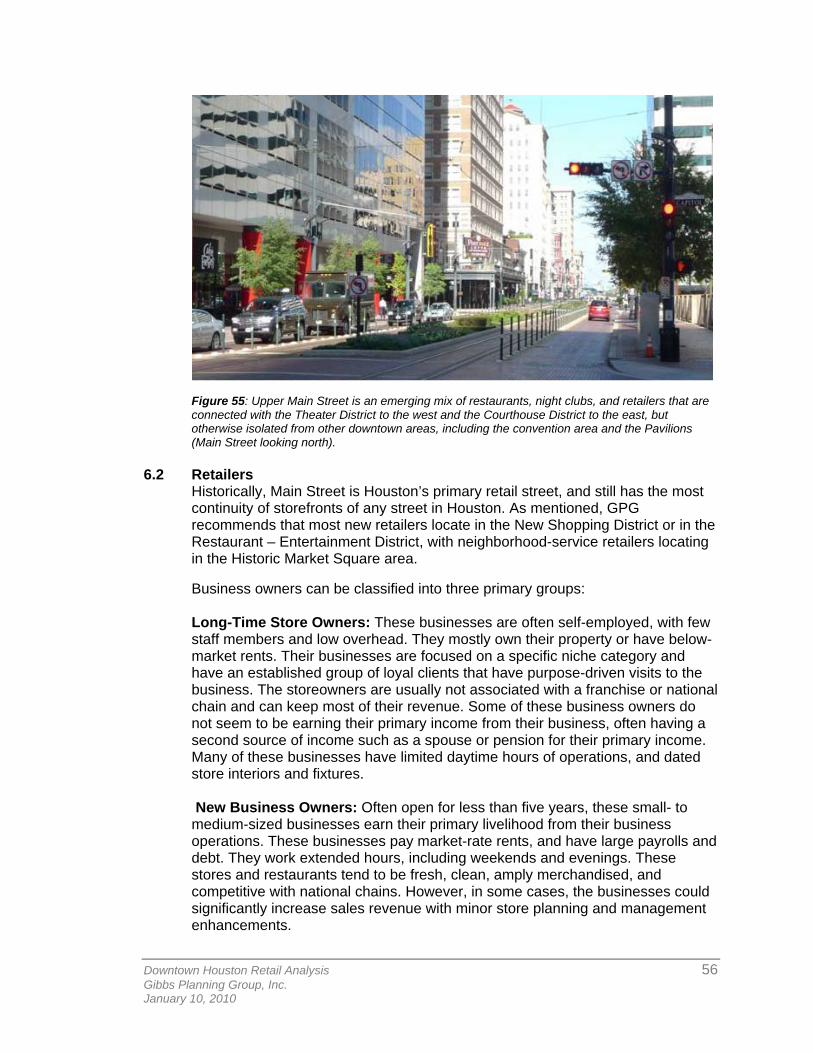
Downtown Houston Retail Analysis 56 Gibbs Planning Group, Inc. January 10, 2010
Figure 55: Upper Main Street is an emerging mix of restaurants, night clubs, and retailers that are connected with the Theater District to the west and the Courthouse District to the east, but otherwise isolated from other downtown areas, including the convention area and the Pavilions (Main Street looking north).
6.2 Retailers Historically, Main Street is Houston’s primary retail street, and still has the most continuity of storefronts of any street in Houston. As mentioned, GPG recommends that most new retailers locate in the New Shopping District or in the Restaurant – Entertainment District, with neighborhood-service retailers locating in the Historic Market Square area.
Business owners can be classified into three primary groups: Long-Time Store Owners: These businesses are often self-employed, with few staff members and low overhead. They mostly own their property or have below-market rents. Their businesses are focused on a specific niche category and have an established group of loyal clients that have purpose-driven visits to the business. The storeowners are usually not associated with a franchise or national chain and can keep most of their revenue. Some of these business owners do not seem to be earning their primary income from their business, often having a second source of income such as a spouse or pension for their primary income. Many of these businesses have limited daytime hours of operations, and dated store interiors and fixtures. New Business Owners: Often open for less than five years, these small- to medium-sized businesses earn their primary livelihood from their business operations. These businesses pay market-rate rents, and have large payrolls and debt. They work extended hours, including weekends and evenings. These stores and restaurants tend to be fresh, clean, amply merchandised, and competitive with national chains. However, in some cases, the businesses could significantly increase sales revenue with minor store planning and management enhancements.
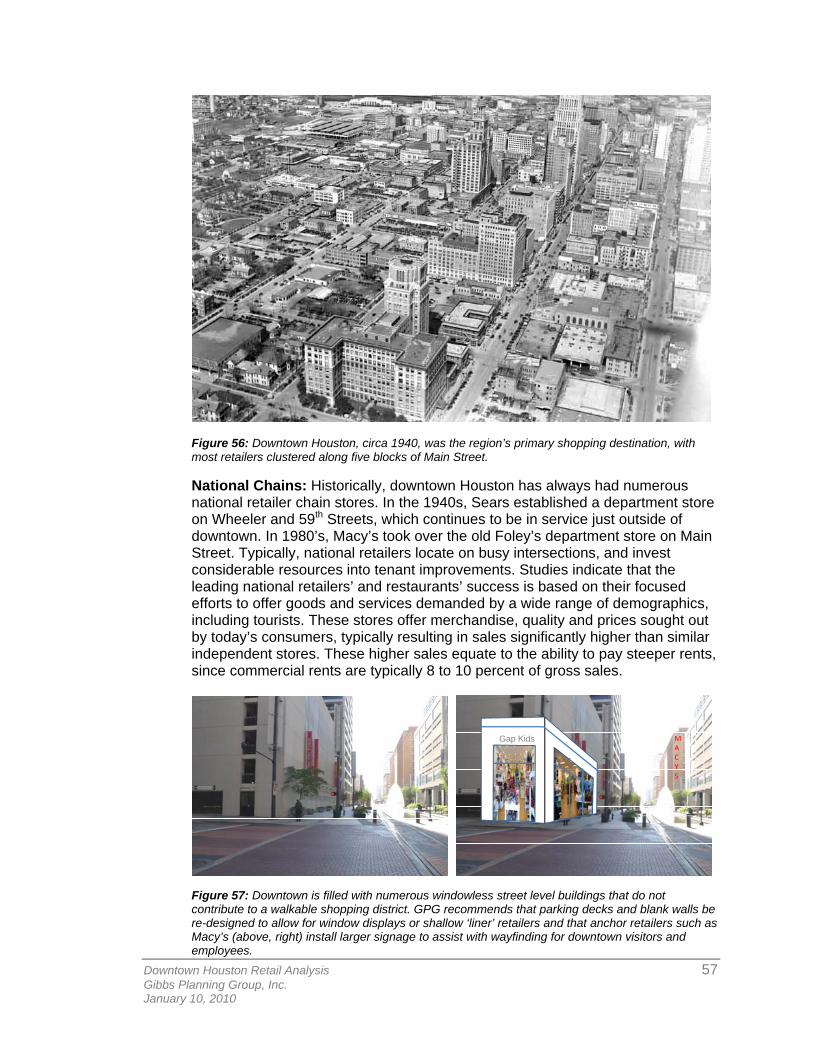
Downtown Houston Retail Analysis 57 Gibbs Planning Group, Inc. January 10, 2010
Figure 56: Downtown Houston, circa 1940, was the region’s primary shopping destination, with most retailers clustered along five blocks of Main Street.
National Chains: Historically, downtown Houston has always had numerous national retailer chain stores. In the 1940s, Sears established a department store on Wheeler and 59th Streets, which continues to be in service just outside of downtown. In 1980’s, Macy’s took over the old Foley’s department store on Main Street. Typically, national retailers locate on busy intersections, and invest considerable resources into tenant improvements. Studies indicate that the leading national retailers’ and restaurants’ success is based on their focused efforts to offer goods and services demanded by a wide range of demographics, including tourists. These stores offer merchandise, quality and prices sought out by today’s consumers, typically resulting in sales significantly higher than similar independent stores. These higher sales equate to the ability to pay steeper rents, since commercial rents are typically 8 to 10 percent of gross sales.
Gap Kids MACYS
Figure 57: Downtown is filled with numerous windowless street level buildings that do not contribute to a walkable shopping district. GPG recommends that parking decks and blank walls be re-designed to allow for window displays or shallow ‘liner’ retailers and that anchor retailers such as Macy’s (above, right) install larger signage to assist with wayfinding for downtown visitors and employees.
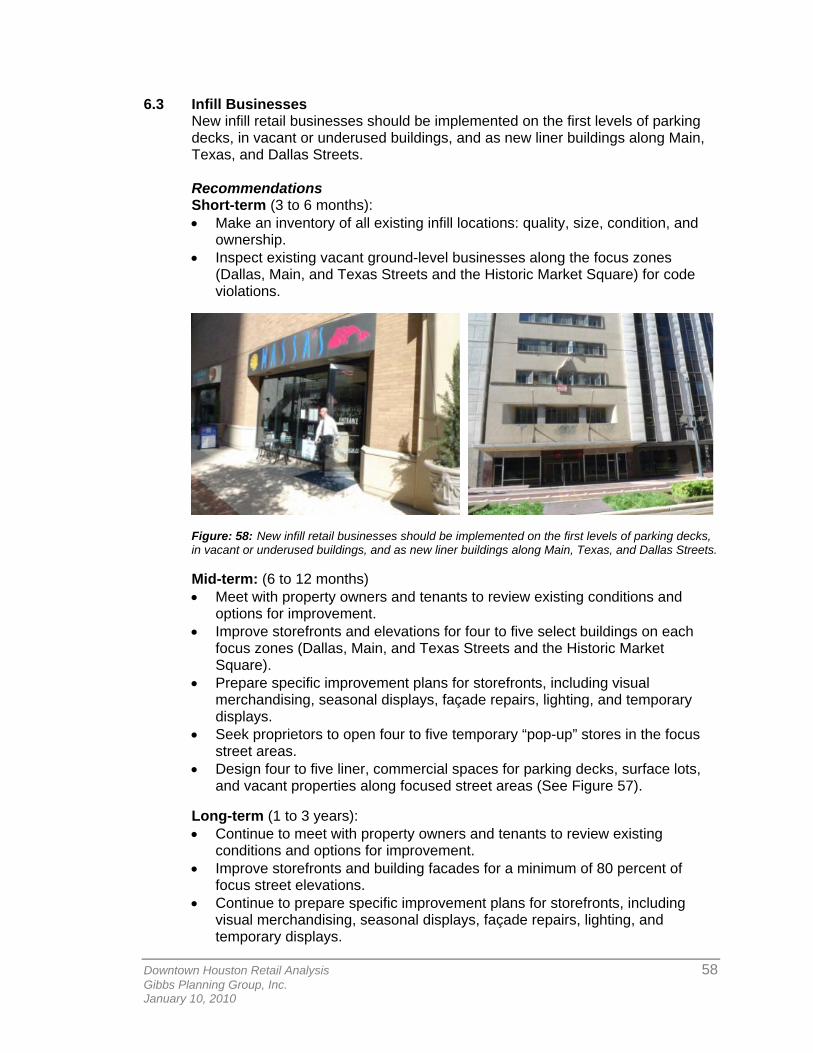
Downtown Houston Retail Analysis 58 Gibbs Planning Group, Inc. January 10, 2010
6.3 Infill Businesses New infill retail businesses should be implemented on the first levels of parking decks, in vacant or underused buildings, and as new liner buildings along Main, Texas, and Dallas Streets. Recommendations Short-term (3 to 6 months): • Make an inventory of all existing infill locations: quality, size, condition, and
ownership. • Inspect existing vacant ground-level businesses along the focus zones
(Dallas, Main, and Texas Streets and the Historic Market Square) for code violations.
Figure: 58: New infill retail businesses should be implemented on the first levels of parking decks, in vacant or underused buildings, and as new liner buildings along Main, Texas, and Dallas Streets. Mid-term: (6 to 12 months) • Meet with property owners and tenants to review existing conditions and
options for improvement. • Improve storefronts and elevations for four to five select buildings on each
focus zones (Dallas, Main, and Texas Streets and the Historic Market Square).
• Prepare specific improvement plans for storefronts, including visual merchandising, seasonal displays, façade repairs, lighting, and temporary displays.
• Seek proprietors to open four to five temporary “pop-up” stores in the focus street areas.
• Design four to five liner, commercial spaces for parking decks, surface lots, and vacant properties along focused street areas (See Figure 57).
Long-term (1 to 3 years): • Continue to meet with property owners and tenants to review existing
conditions and options for improvement. • Improve storefronts and building facades for a minimum of 80 percent of
focus street elevations. • Continue to prepare specific improvement plans for storefronts, including
visual merchandising, seasonal displays, façade repairs, lighting, and temporary displays.
Downtown Houston Retail Analysis 59 Gibbs Planning Group, Inc. January 10, 2010
• Implement façade improvements for 30 to 50 properties along the focus zones streets.
• Encourage restaurants and retailers to stay open during special events.
6.4 Business Recruitment Consultant Unlike a shopping center, the downtown does not have a coordinated sole-source retail broker. Instead, individual building owners are responsible for their own leasing, with various degrees of success. GPG recommends the HDMD retain a qualified commercial broker to recruit tenants that accord with the tenant mix strategy. This broker should have a proven regional and national record, be able to represent the City at national conventions, and be capable of gathering leads for downtown Houston property owners. This broker should be held on a monthly retainer and paid a commission when a lease or sale is closed by the benefiting property owner. As an alternative, the HDMD could expand its in-house recruitment resources and attend leasing conferences of the International Council of Shopping Centers and other shopping center conferences. Recommendations Short-term (3 to 6 months): • Prepare a list of potential local, regional, and national retailers and
restaurants that match downtown’s demographics and are suitable for downtown.
• Participate in local, regional, and national planning and retail industry conferences, including the Urban Land Institute (ULI) and International Council of Shopping Centers (ICSC).
• Prepare a basic leasing brochure for downtown highlighting the merchandising plan, proposed improvements, and other attributes.
• Lease a booth at ULI, ICSC, and other industry trade shows and conventions. • Establish communications with regional shopping centers’ management and
leasing teams to seek potential leads and advice for downtown.
Mid-term (6 to 12 months): • Prepare a data base of each first-level retail space in the downtown area,
including the owner contact, lease and sale rates, size, floor plans, existing physical condition, photographic inventory, and if necessary, an estimate of required improvements to bring up to municipal and state codes.
• Establish a public-private leasing-merchandising task force for downtown. • Retain a business recruitment consultant or full-time senior staff position to
implement the leasing plan.
6.5 Business Improvement District Downtown Houston’s small retailers and restaurants individually lack the resources to compete with major shopping centers and districts. Just having a unique store selling desired goods and services is not enough for the business owner to earn a reasonable living or ensure economic sustainability. As noted, downtown is not functioning as a cohesive shopping district. In spite of the METRORail and vehicular and pedestrian traffic, there is little cross- shopping or impulse buying occurring downtown. Many businesses depend on single-purpose visits, with the bulk of their customers coming to visit a specific store or restaurant.
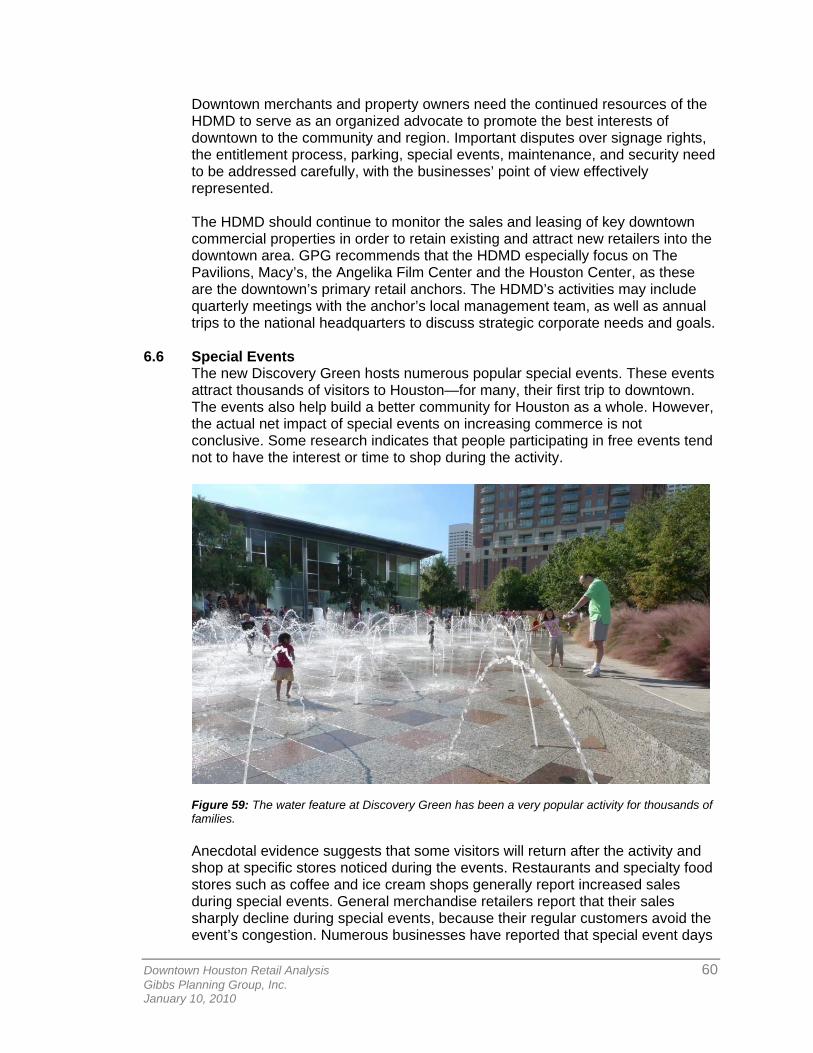
Downtown Houston Retail Analysis 60 Gibbs Planning Group, Inc. January 10, 2010
Downtown merchants and property owners need the continued resources of the HDMD to serve as an organized advocate to promote the best interests of downtown to the community and region. Important disputes over signage rights, the entitlement process, parking, special events, maintenance, and security need to be addressed carefully, with the businesses’ point of view effectively represented. The HDMD should continue to monitor the sales and leasing of key downtown commercial properties in order to retain existing and attract new retailers into the downtown area. GPG recommends that the HDMD especially focus on The Pavilions, Macy’s, the Angelika Film Center and the Houston Center, as these are the downtown’s primary retail anchors. The HDMD’s activities may include quarterly meetings with the anchor’s local management team, as well as annual trips to the national headquarters to discuss strategic corporate needs and goals.
6.6 Special Events The new Discovery Green hosts numerous popular special events. These events attract thousands of visitors to Houston—for many, their first trip to downtown. The events also help build a better community for Houston as a whole. However, the actual net impact of special events on increasing commerce is not conclusive. Some research indicates that people participating in free events tend not to have the interest or time to shop during the activity.
Figure 59: The water feature at Discovery Green has been a very popular activity for thousands of families. Anecdotal evidence suggests that some visitors will return after the activity and shop at specific stores noticed during the events. Restaurants and specialty food stores such as coffee and ice cream shops generally report increased sales during special events. General merchandise retailers report that their sales sharply decline during special events, because their regular customers avoid the event’s congestion. Numerous businesses have reported that special event days
Downtown Houston Retail Analysis 61 Gibbs Planning Group, Inc. January 10, 2010
are their worst sales days of the entire year. Many retailers actually close during special events because of reduced sales. Recommendations • Measure the impact of special events on business customer traffic and sales
during and after special events. • Plan parking, ticket sales, vendor booths and activities to contribute to
existing businesses. • Implement special events geared toward retailing, such as sidewalk sales
and special holiday promotional days. • Allow for existing businesses to participate in the festivals at special rates.
6.7 Marketing As commented in the group interviews, Houston employees most often immediately leave for home after work without spending any time shopping downtown. GPG recommends that the HDMD launch a marketing campaign to encourage employees to conduct more of their shopping in downtown. For example, lunchtime shopping could be encouraged by providing access to storage lockers in the tunnels or at employees’ places of work. Scheduling evening activities and events could induce office workers to stay in downtown after work. In addition, the HDMD should continue to promote its own services for downtown businesses and events with a campaign targeted at business retention and expansion.
6.8 Wayfinding Signage Houston’s traffic lights are often located next to street signs, making the latter difficult to read at night. Short of redesigning the city’s traffic lights into the more traditional lights centered above the roadway, GPG recommends that the HDMD install at least two sets of street signs for each intersection along the focus zones and also develop wayfinding signage that can be clearly read—day or night. The proposed graphics should coordinate the movement of pedestrians and vehicular traffic entering and traveling through downtown. The proposed graphics system should attract local, regional and out-of-town visitors to downtown Houston. Recommendations • Side-street businesses (both name and logo) should be illustrated on pole-
mounted signboards located in downtown. • Install pairs of street-name signs at each intersection; label the cross street
with at least two street-name signs to improve pedestrian and vehicular orientation.
7.0 SIMILAR HISTORIC DISTRICTS
Houston is a unique American city with no real equal. Cities with historic sections have their own set of challenges and opportunities. Nonetheless, King Street in Charleston, South Carolina, and the Fifth Avenue and Third Street area in Naples, Florida are downtowns with similar attributes as Houston’s Historic District and with whom the author has consulted.
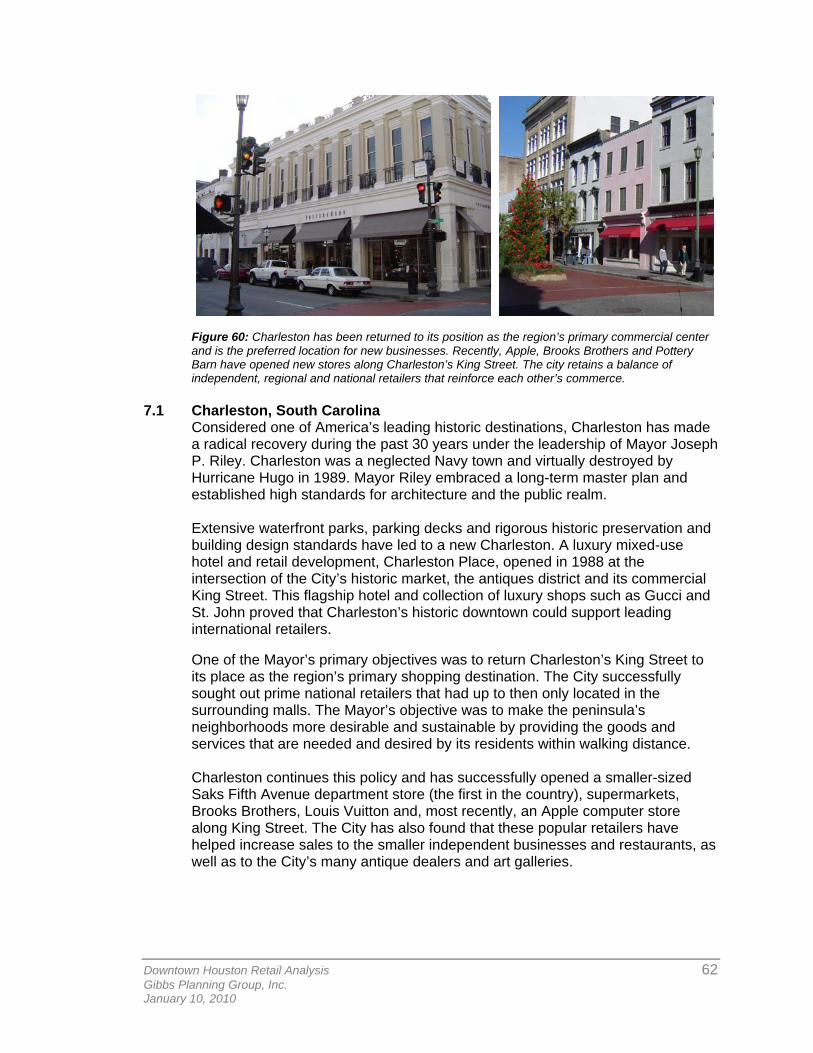
Downtown Houston Retail Analysis 62 Gibbs Planning Group, Inc. January 10, 2010
Figure 60: Charleston has been returned to its position as the region’s primary commercial center and is the preferred location for new businesses. Recently, Apple, Brooks Brothers and Pottery Barn have opened new stores along Charleston’s King Street. The city retains a balance of independent, regional and national retailers that reinforce each other’s commerce.
7.1 Charleston, South Carolina Considered one of America’s leading historic destinations, Charleston has made a radical recovery during the past 30 years under the leadership of Mayor Joseph P. Riley. Charleston was a neglected Navy town and virtually destroyed by Hurricane Hugo in 1989. Mayor Riley embraced a long-term master plan and established high standards for architecture and the public realm. Extensive waterfront parks, parking decks and rigorous historic preservation and building design standards have led to a new Charleston. A luxury mixed-use hotel and retail development, Charleston Place, opened in 1988 at the intersection of the City’s historic market, the antiques district and its commercial King Street. This flagship hotel and collection of luxury shops such as Gucci and St. John proved that Charleston’s historic downtown could support leading international retailers. One of the Mayor’s primary objectives was to return Charleston’s King Street to its place as the region’s primary shopping destination. The City successfully sought out prime national retailers that had up to then only located in the surrounding malls. The Mayor’s objective was to make the peninsula’s neighborhoods more desirable and sustainable by providing the goods and services that are needed and desired by its residents within walking distance. Charleston continues this policy and has successfully opened a smaller-sized Saks Fifth Avenue department store (the first in the country), supermarkets, Brooks Brothers, Louis Vuitton and, most recently, an Apple computer store along King Street. The City has also found that these popular retailers have helped increase sales to the smaller independent businesses and restaurants, as well as to the City’s many antique dealers and art galleries.
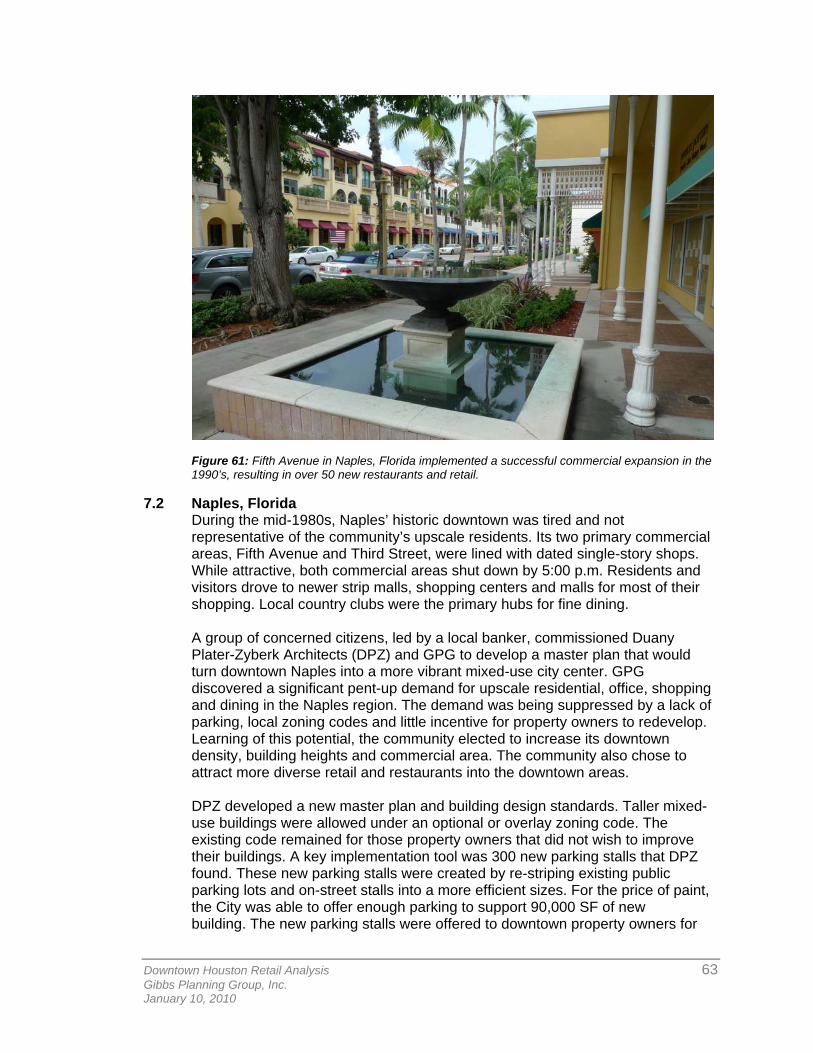
Downtown Houston Retail Analysis 63 Gibbs Planning Group, Inc. January 10, 2010
Figure 61: Fifth Avenue in Naples, Florida implemented a successful commercial expansion in the 1990’s, resulting in over 50 new restaurants and retail.
7.2 Naples, Florida During the mid-1980s, Naples’ historic downtown was tired and not representative of the community’s upscale residents. Its two primary commercial areas, Fifth Avenue and Third Street, were lined with dated single-story shops. While attractive, both commercial areas shut down by 5:00 p.m. Residents and visitors drove to newer strip malls, shopping centers and malls for most of their shopping. Local country clubs were the primary hubs for fine dining. A group of concerned citizens, led by a local banker, commissioned Duany Plater-Zyberk Architects (DPZ) and GPG to develop a master plan that would turn downtown Naples into a more vibrant mixed-use city center. GPG discovered a significant pent-up demand for upscale residential, office, shopping and dining in the Naples region. The demand was being suppressed by a lack of parking, local zoning codes and little incentive for property owners to redevelop. Learning of this potential, the community elected to increase its downtown density, building heights and commercial area. The community also chose to attract more diverse retail and restaurants into the downtown areas. DPZ developed a new master plan and building design standards. Taller mixed-use buildings were allowed under an optional or overlay zoning code. The existing code remained for those property owners that did not wish to improve their buildings. A key implementation tool was 300 new parking stalls that DPZ found. These new parking stalls were created by re-striping existing public parking lots and on-street stalls into a more efficient sizes. For the price of paint, the City was able to offer enough parking to support 90,000 SF of new building. The new parking stalls were offered to downtown property owners for
Downtown Houston Retail Analysis 64 Gibbs Planning Group, Inc. January 10, 2010
free, on a first-come, first-served basis. The City also streamlined the approval process for new buildings that closely adhered to DPZ’s codes. This incentive caused a rush for property owners to develop new mixed-use buildings along Fifth and Third. Some development plans were submitted within weeks of the planning effort. The successful new construction confirmed the demand for new urban residential and commercial properties in Naples. During later phases, the City also built two parking garages and a performing arts center. The Naples plan was almost completely implemented in two years. Unlike Charleston, Naples did not recruit leading national retailers and restaurants. These leading retailers have located in the region’s surrounding shopping centers. The downtown became so lively in such a short period of time that the DPZ team was retained by the City to see if its commerce could be dialed down a little. The City is now one of the most popular downtowns in Florida and has contributed to an improved quality of life for the community.
8.0 CONDITIONS OF STUDY 8.1 Methodology
This study was implemented by using a series of qualitative and quantitative research and interview processes as follows:
1. GPG conducted a series of informal interviews with local residents, retailers, restaurants, businesses, city staff, and officials, property owners, and real estate developers. GPG also completed an evaluation of most major existing shopping centers and retail concentrations in and around the defined trade areas. These interviews and field evaluations were conducted during the months of November and December 2009. During this evaluation, GPG thoroughly drove the Houston market, visiting and evaluating most major existing and planned retail concentrations in the region.
2. GPG visited the Houston area’s commercial centers during the day and in the evening to gain a qualitative understanding of the retail gravitational patterns and traffic patterns throughout the study area. GPG then defined a trade area that would serve retail in the proposed development based on the field evaluation and the retail gravitation in the market, as well as GPG’s experience defining trade areas for similar communities.
3. Population and demographic characteristics of trade area residents were
collected by U.S. census tracts from national sources and updated based on information gathered from local planning sources. GPG also used data provided by third party sources including CoStar; ESRI (Environmental Systems Research Institute); Research Data Services, Inc.; Houston Downtown Management District; and the Greater Houston Convention and Visitors Bureau.
4. Finally, based on the population and demographic characteristics of the
trade area, the existing and known planned retail competition, and traffic
Downtown Houston Retail Analysis 65 Gibbs Planning Group, Inc. January 10, 2010
and retail gravitational patterns, GPG developed a qualitative retail assessment for the downtown area.
The findings of this study do not take into account local, regional, or state governmental policy or zoning (where applicable) restrictions and is based on the following assumptions: • No other major retail will be developed within the downtown Houston trade
areas defined by this study through 2014.
• The Houston urban, Texas state, and U.S. national economies will return to normal or above normal rates of employment, inflation, growth, and retail demand. Also, commercial financing and lending will become available at terms and conditions similar to those obtainable in 2008.
• The downtown Houston area is managed pursuant to the best practices of
the American Planning Association, the Congress for the New Urbanism, the International Council of Shopping Centers, the National Main Street Program, and the Urban Land Institute. These include matters regarding building design, lighting, merchandising, marketing, operating hours, parking, promotions signage, streetscape, etc.
• The greater Houston region will continue to attract 31 million or more tourists annually, with similar demographics as during the past five years.
• Employment will stabilize at the current level of approximately 140,000 workers
in the downtown Houston area.
8.2 Limits of Study The findings of this study represent GPG’s best estimates for the amounts and types of retail tenants that should be supportable in downtown area by 2014. Every reasonable effort has been made to ensure that the data contained in this study reflect the most accurate and timely information possible and are believed to be reliable. It should be noted that the findings of this study are based upon generally accepted market research and business standards. It is possible that Houston's downtown area could support lower or higher quantities of retailers and restaurants yielding lower or higher sales revenues than indicated by this study, depending on numerous factors, including leasing, real estate pricing, respective business practices, and the management and design of the study subject site(s).
This study is based on estimates, assumptions, and other information developed by GPG as an independent third party research effort with general knowledge of the retail industry, and consultations with the client and its representatives. This report is current as of December 31st, 2009, and GPG has not undertaken any update of its research effort since such date.
This report may contain prospective financial information, estimates, or opinions that represent GPG’s view of reasonable expectations at a particular time. Such information, estimates, or opinions are not offered as predictions or assurances that a particular level of income or profit will be achieved, that particular events will occur, or that a particular price will be offered or accepted. Actual results

Downtown Houston Retail Analysis 66 Gibbs Planning Group, Inc. January 10, 2010
achieved during the period covered by our prospective financial analysis may vary from those described in our report, and the variations may be material. Therefore, no warranty or representation is made by GPG that any of the projected values or results contained in this study will be achieved.
This study should not be the sole basis for designing, financing, planning, and/or programming any business, real estate development, or public planning policy. This study is intended only for the use of the Houston Downtown Management District and is void for other municipalities or retail districts, developers, or organizations. This study is not intended for general public or media distribution and publication.
-- END OF MARKET STUDY –