Embed Size (px)
Citation preview

Facing the scientific challenges of the BIOMASS
mission Shaun Quegan
University of Sheffield & NCEO
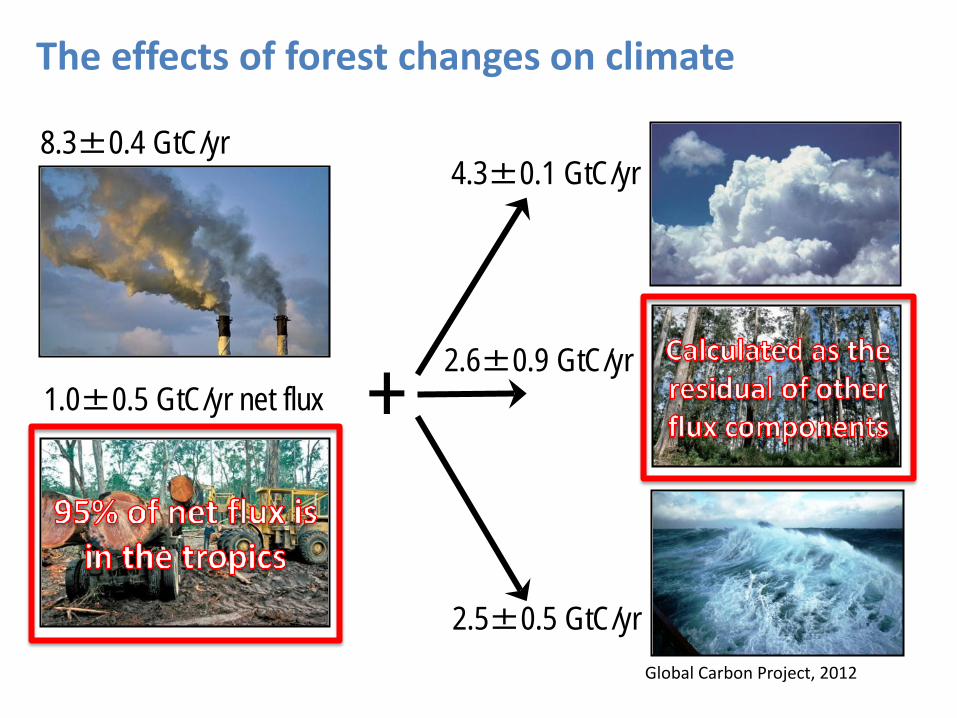
8.3±0.4 GtC/yr
+ 1.0±0.5 GtC/yr net flux 2.6±0.9 GtC/yr
4.3±0.1 GtC/yr
2.5±0.5 GtC/yr
The effects of forest changes on climate
Global Carbon Project, 2012

Forest biomass and forest height: global, 200 m scale, every 6 months for 4 years, 20% accuracy in biomass, 20-30% accuracy in height
Biomass will map forest biomass, height and change with unprecedented accuracy
Disturbances: global, at 50 m scale

La Selva, Costa Rica
Maine
Colombia
Landes Alaska
Scientific challenge 1: environmental changes
Paracou F.Guiana
Remningstorp Krycklan
Kalimantan
Major recent ESA campaigns: 1. Kalimantan 2004 (Indrex) 2. Remningstorp 2007 (BioSAR 1), 2010 (BioSAR 3) 3. Krycklan 2008 (BioSAR 2) 4. F. Guiana 2009 (TropiSAR), 2011-13 (TropiScat)
ESA campaigns non-ESA campaigns

Scientific challenge 1: environmental changes (2)
Inversion techniques must deal with data dispersion and differences between different types of forest.

Scientific challenge 1: environmental changes (3)
Blue - from airborne lidar map, std. error = 25 ton/ha Black - from 80 m x 80 m in situ plots, std. error = few % Training on stratified subset of Krycklan data. Performance assessed on data from Remningstorp.
Remningstorp 70 MHz data: varying environmental conditions over 3 months
Sweden
Finland
Norway
Denmark
Remningstorp
N
N
N
N
HV only HV, HH & VV HV, HH, VV & DEM
RMSE: 84% RMSE: 38% RMSE: 24%

Scientific challenge 2: combining measurement modes
PolSAR (SAR Polarimetry)
x
y
z
o
PolInSAR (Polarimetric SAR Interferometry)
x
y
z
o
TomoSAR (SAR Tomography)
x
y
z
o

Intensity retrieval
Intensity + height
Polarised intensities only
40
30
20
10
0m
Height (m)
Height retrieval
50
250
200
150
100
50
250
200
150
100
Biomass (t/ha)
RMSE= 16.3 t/ha
RMSE= 35.6 t/ha
Challenge 2: combining measurement modes

Challenge 2: combining measurement modes
Minimum Mean Square (MMSE)
Estimate
Biomass Estimation from
Intensity
PolSAR Covariance
Matrix
PolInSAR Covariance
Matrix
Biomass Map &
Error Map
TomoSAR results DEM
In situ data
Allometric Biomass
Estimation
Biomass Estimate 2
Biomass Estimate 1
Ion
osp
he
re C
orr
ec
tio
n
Forest Height Estimation

In situ network led by Smithsonian, including Centre for Tropical Forest Science
Afritron
Rainfor
Scientific challenge 3: training and validation

Scientific challenge 3: training and validation (2)
Rejou-Mechain et al.(2014)
Key message: Training inversion algorithms at 4 ha resolution (the Biomass estimation scale) with in situ data at smaller scales leads to an estimation bias.

Scientific challenge 4: the physics of P-band scattering
Inversion techniques need to deal with data dispersion and differences between different types of forest.

Scientific challenge 4 (2)
Power-law relationships between HV backscatter and biomass are found for all forests where we have data. What determines the exponent?
Site Intercept=a Slope=q R2 p-value
Paracou -3.3 ± 0.46 0.79 ± 0.17 0.46 < 0.001
La Selva -2.8 ± 0.07 0.60 ± 0.03 0.92 < 0.001
Remningstorp, March 9th -2.1 ± 0.08 0.47 ± 0.04 0.71 < 0.001
Remningstorp, April 2nd -2.1 ± 0.07 0.44 ± 0. 03 0.71 < 0.001
Remningstorp, May 2nd -2.1 ± 0.07 0.42 ± 0. 03 0.73 < 0.001
Landes -3.4 ± 0.16 1.01 ± 0. 03 0.88 < 0.001
Maine -2.2 ± 0.08 0.41 ± 0.04 0.75 < 0.001

Scientific challenge 5: getting BIOMASS data into carbon cycle estimates (& IPCC & REDD+)
AGU 2014: Informing carbon dynamics in the Community Land Model with observations from across timescales (Andy Fox [NEON] & Tim Hoar [NCAR]) Conclusions •Annual AGB biomass observations are a powerful constraint on many large C and N pools • Annual Net Primary Production estimates are less helpful than we expected

Carbon flux depends on the disturbance regime
M = mean loss of biomass F = severity of disturbance P = probability of disturbance

Summary 1. BIOMASS is the first P-band radar in space, the first space
mission exploiting Pol-InSAR for global forest height mapping, and the first space radar tomographic mission.
2. The experimental data supporting BIOMASS is heavily under-sampled in time and space.
3. 1 & 2 imply that 1. We have to make as much use as possible of physical, modelling and statistical
reasoning in preparing for BIOMASS 2. In practice many aspects of using the data will only become clear after launch
4. The BIOMASS mission already has significant buy-in from the ecological and carbon science communities.
5. More needs to be done to make sure that BIOMASS meets the needs of its non-science users