Embed Size (px)
Citation preview
A
Ra
b
c
a
ARA
KBBCIB
C
1d
Renewable and Sustainable Energy Reviews 15 (2011) 2262–2289
Contents lists available at ScienceDirect
Renewable and Sustainable Energy Reviews
journa l homepage: www.e lsev ier .com/ locate / rser
review on biomass as a fuel for boilers
. Saidura,∗, E.A. Abdelaziza, A. Demirbasb, M.S. Hossaina, S. Mekhilef c
Department of Mechanical Engineering, University of Malaya, 50603 Kuala Lumpur, MalaysiaSirnak University, Sirnak, TurkeyDepartment of Electrical Engineering, University of Malay, 50603 Kuala Lumpur, Malaysia
r t i c l e i n f o
rticle history:eceived 26 October 2010ccepted 31 January 2011
eywords:oilersiomassombustion
mpact of biomassiomass problems and solutions
a b s t r a c t
Currently, fossil fuels such as oil, coal and natural gas represent the prime energy sources in the world.However, it is anticipated that these sources of energy will deplete within the next 40–50 years. More-over, the expected environmental damages such as the global warming, acid rain and urban smog due tothe production of emissions from these sources have tempted the world to try to reduce carbon emissionsby 80% and shift towards utilizing a variety of renewable energy resources (RES) which are less environ-mentally harmful such as solar, wind, biomass etc. in a sustainable way. Biomass is one of the earliestsources of energy with very specific properties. In this review, several aspects which are associated withburning biomass in boilers have been investigated such as composition of biomass, estimating the higherheating value of biomass, comparison between biomass and other fuels, combustion of biomass, co-firing of biomass and coal, impacts of biomass, economic and social analysis of biomass, transportationof biomass, densification of biomass, problems of biomass and future of biomass. It has been found that
utilizing biomass in boilers offers many economical, social and environmental benefits such as financialnet saving, conservation of fossil fuel resources, job opportunities creation and CO2 and NOx emissionsreduction. However, care should be taken to other environmental impacts of biomass such as land andwater resources, soil erosion, loss of biodiversity and deforestation. Fouling, marketing, low heating value,storage and collections and handling are all associated problems when burning biomass in boilers. Thefuture of biomass in boilers depends upon the development of the markets for fossil fuels and on policy decisions regarding the biomass market.© 2011 Elsevier Ltd. All rights reserved.
ontents
1. Introduction . . . . . . . . . . . . . . . . . . . . . . . . . . . . . . . . . . . . . . . . . . . . . . . . . . . . . . . . . . . . . . . . . . . . . . . . . . . . . . . . . . . . . . . . . . . . . . . . . . . . . . . . . . . . . . . . . . . . . . . . . . . . . . . . . . . . . . . . . . 22631.1. Biomass as a boiler fuel . . . . . . . . . . . . . . . . . . . . . . . . . . . . . . . . . . . . . . . . . . . . . . . . . . . . . . . . . . . . . . . . . . . . . . . . . . . . . . . . . . . . . . . . . . . . . . . . . . . . . . . . . . . . . . . . . . . . . . . 2266
1.1.1. Characteristics of common industrial fuels . . . . . . . . . . . . . . . . . . . . . . . . . . . . . . . . . . . . . . . . . . . . . . . . . . . . . . . . . . . . . . . . . . . . . . . . . . . . . . . . . . . . . . . . 22661.1.2. Non-conventional fuels . . . . . . . . . . . . . . . . . . . . . . . . . . . . . . . . . . . . . . . . . . . . . . . . . . . . . . . . . . . . . . . . . . . . . . . . . . . . . . . . . . . . . . . . . . . . . . . . . . . . . . . . . . . . . 2266
2. Biomass as a carbon neutral source of energy . . . . . . . . . . . . . . . . . . . . . . . . . . . . . . . . . . . . . . . . . . . . . . . . . . . . . . . . . . . . . . . . . . . . . . . . . . . . . . . . . . . . . . . . . . . . . . . . . . . . . . . 22662.1. Conversion efficiencies of biomass . . . . . . . . . . . . . . . . . . . . . . . . . . . . . . . . . . . . . . . . . . . . . . . . . . . . . . . . . . . . . . . . . . . . . . . . . . . . . . . . . . . . . . . . . . . . . . . . . . . . . . . . . . . 22672.2. Major advantages and disadvantages of biomass fuels . . . . . . . . . . . . . . . . . . . . . . . . . . . . . . . . . . . . . . . . . . . . . . . . . . . . . . . . . . . . . . . . . . . . . . . . . . . . . . . . . . . . . . 22672.3. Sources of biomass . . . . . . . . . . . . . . . . . . . . . . . . . . . . . . . . . . . . . . . . . . . . . . . . . . . . . . . . . . . . . . . . . . . . . . . . . . . . . . . . . . . . . . . . . . . . . . . . . . . . . . . . . . . . . . . . . . . . . . . . . . . 22672.4. Composition of biomass . . . . . . . . . . . . . . . . . . . . . . . . . . . . . . . . . . . . . . . . . . . . . . . . . . . . . . . . . . . . . . . . . . . . . . . . . . . . . . . . . . . . . . . . . . . . . . . . . . . . . . . . . . . . . . . . . . . . . . 2267
2.4.1. Structural composition . . . . . . . . . . . . . . . . . . . . . . . . . . . . . . . . . . . . . . . . . . . . . . . . . . . . . . . . . . . . . . . . . . . . . . . . . . . . . . . . . . . . . . . . . . . . . . . . . . . . . . . . . . . . . 22672.4.2. Ultimate compositions . . . . . . . . . . . . . . . . . . . . . . . . . . . . . . . . . . . . . . . . . . . . . . . . . . . . . . . . . . . . . . . . . . . . . . . . . . . . . . . . . . . . . . . . . . . . . . . . . . . . . . . . . . . . . 22672.4.3. Proximate compositions . . . . . . . . . . . . . . . . . . . . . . . . . . . . . . . . . . . . . . . . . . . . . . . . . . . . . . . . . . . . . . . . . . . . . . . . . . . . . . . . . . . . . . . . . . . . . . . . . . . . . . . . . . . . 2267
2.5. Biomass conversion routes to energy . . . . . . . . . . . . . . . . . . . . . . . . . . . . . . . . . . . . . . . . . . . . . . . . . . . . . . . . . . . . . . . . . . . . . . . . . . . . . . . . . . . . . . . . . . . . . . . . . . . . . . . . 2269
2.5.1. Pyrolysis . . . . . . . . . . . . . . . . . . . . . . . . . . . . . . . . . . . . . . . . . . . . . . . . . .2.5.2. Gasification . . . . . . . . . . . . . . . . . . . . . . . . . . . . . . . . . . . . . . . . . . . . . . .2.5.3. Direct combustion . . . . . . . . . . . . . . . . . . . . . . . . . . . . . . . . . . . . . . . .2.5.4. Fermentation . . . . . . . . . . . . . . . . . . . . . . . . . . . . . . . . . . . . . . . . . . . . .∗ Corresponding author.E-mail address: [email protected] (R. Saidur).
364-0321/$ – see front matter © 2011 Elsevier Ltd. All rights reserved.oi:10.1016/j.rser.2011.02.015
. . . . . . . . . . . . . . . . . . . . . . . . . . . . . . . . . . . . . . . . . . . . . . . . . . . . . . . . . . . . . . . . . . . . . . . . . . 2271
. . . . . . . . . . . . . . . . . . . . . . . . . . . . . . . . . . . . . . . . . . . . . . . . . . . . . . . . . . . . . . . . . . . . . . . . . . 2271
. . . . . . . . . . . . . . . . . . . . . . . . . . . . . . . . . . . . . . . . . . . . . . . . . . . . . . . . . . . . . . . . . . . . . . . . . . 2273. . . . . . . . . . . . . . . . . . . . . . . . . . . . . . . . . . . . . . . . . . . . . . . . . . . . . . . . . . . . . . . . . . . . . . . . . . 2273
R. Saidur et al. / Renewable and Sustainable Energy Reviews 15 (2011) 2262–2289 2263
2.5.5. Anaerobic digestion . . . . . . . . . . . . . . . . . . . . . . . . . . . . . . . . . . . . . . . . . . . . . . . . . . . . . . . . . . . . . . . . . . . . . . . . . . . . . . . . . . . . . . . . . . . . . . . . . . . . . . . . . . . . . . . . 22732.5.6. Chemical conversion. . . . . . . . . . . . . . . . . . . . . . . . . . . . . . . . . . . . . . . . . . . . . . . . . . . . . . . . . . . . . . . . . . . . . . . . . . . . . . . . . . . . . . . . . . . . . . . . . . . . . . . . . . . . . . . . 2273
2.6. Estimating the higher heating value of biomass . . . . . . . . . . . . . . . . . . . . . . . . . . . . . . . . . . . . . . . . . . . . . . . . . . . . . . . . . . . . . . . . . . . . . . . . . . . . . . . . . . . . . . . . . . . . . 22732.7. Comparison between biomass and other fuels . . . . . . . . . . . . . . . . . . . . . . . . . . . . . . . . . . . . . . . . . . . . . . . . . . . . . . . . . . . . . . . . . . . . . . . . . . . . . . . . . . . . . . . . . . . . . . 2274
2.7.1. Summary comparison of coal and biomass combustion . . . . . . . . . . . . . . . . . . . . . . . . . . . . . . . . . . . . . . . . . . . . . . . . . . . . . . . . . . . . . . . . . . . . . . . . . . . 22742.8. Combustion of biomass. . . . . . . . . . . . . . . . . . . . . . . . . . . . . . . . . . . . . . . . . . . . . . . . . . . . . . . . . . . . . . . . . . . . . . . . . . . . . . . . . . . . . . . . . . . . . . . . . . . . . . . . . . . . . . . . . . . . . . . 2274
2.8.1. Combustion technology for boilers . . . . . . . . . . . . . . . . . . . . . . . . . . . . . . . . . . . . . . . . . . . . . . . . . . . . . . . . . . . . . . . . . . . . . . . . . . . . . . . . . . . . . . . . . . . . . . . . . 22772.9. Co-firing of biomass and coal . . . . . . . . . . . . . . . . . . . . . . . . . . . . . . . . . . . . . . . . . . . . . . . . . . . . . . . . . . . . . . . . . . . . . . . . . . . . . . . . . . . . . . . . . . . . . . . . . . . . . . . . . . . . . . . . 2278
2.9.1. Biomass co-firing technologies . . . . . . . . . . . . . . . . . . . . . . . . . . . . . . . . . . . . . . . . . . . . . . . . . . . . . . . . . . . . . . . . . . . . . . . . . . . . . . . . . . . . . . . . . . . . . . . . . . . . . 22782.9.2. Technical and economic barriers to co-firing . . . . . . . . . . . . . . . . . . . . . . . . . . . . . . . . . . . . . . . . . . . . . . . . . . . . . . . . . . . . . . . . . . . . . . . . . . . . . . . . . . . . . . 2278
2.10. The impacts of biomass . . . . . . . . . . . . . . . . . . . . . . . . . . . . . . . . . . . . . . . . . . . . . . . . . . . . . . . . . . . . . . . . . . . . . . . . . . . . . . . . . . . . . . . . . . . . . . . . . . . . . . . . . . . . . . . . . . . . . 22792.10.1. Emissions reduction of biomass . . . . . . . . . . . . . . . . . . . . . . . . . . . . . . . . . . . . . . . . . . . . . . . . . . . . . . . . . . . . . . . . . . . . . . . . . . . . . . . . . . . . . . . . . . . . . . . . . . 22792.10.2. Environmental effects of biomass: . . . . . . . . . . . . . . . . . . . . . . . . . . . . . . . . . . . . . . . . . . . . . . . . . . . . . . . . . . . . . . . . . . . . . . . . . . . . . . . . . . . . . . . . . . . . . . . . 2280
2.11. Economic and social impacts of biomass . . . . . . . . . . . . . . . . . . . . . . . . . . . . . . . . . . . . . . . . . . . . . . . . . . . . . . . . . . . . . . . . . . . . . . . . . . . . . . . . . . . . . . . . . . . . . . . . . . . 22802.12. Transportation of biomass . . . . . . . . . . . . . . . . . . . . . . . . . . . . . . . . . . . . . . . . . . . . . . . . . . . . . . . . . . . . . . . . . . . . . . . . . . . . . . . . . . . . . . . . . . . . . . . . . . . . . . . . . . . . . . . . . . 22822.13. Densification of biomass: . . . . . . . . . . . . . . . . . . . . . . . . . . . . . . . . . . . . . . . . . . . . . . . . . . . . . . . . . . . . . . . . . . . . . . . . . . . . . . . . . . . . . . . . . . . . . . . . . . . . . . . . . . . . . . . . . . . 2282
2.13.1. Balers . . . . . . . . . . . . . . . . . . . . . . . . . . . . . . . . . . . . . . . . . . . . . . . . . . . . . . . . . . . . . . . . . . . . . . . . . . . . . . . . . . . . . . . . . . . . . . . . . . . . . . . . . . . . . . . . . . . . . . . . . . . . . . 22822.13.2. Extrusion . . . . . . . . . . . . . . . . . . . . . . . . . . . . . . . . . . . . . . . . . . . . . . . . . . . . . . . . . . . . . . . . . . . . . . . . . . . . . . . . . . . . . . . . . . . . . . . . . . . . . . . . . . . . . . . . . . . . . . . . . . 22822.13.3. Briquetting roll press . . . . . . . . . . . . . . . . . . . . . . . . . . . . . . . . . . . . . . . . . . . . . . . . . . . . . . . . . . . . . . . . . . . . . . . . . . . . . . . . . . . . . . . . . . . . . . . . . . . . . . . . . . . . . . 22832.13.4. Punch and die . . . . . . . . . . . . . . . . . . . . . . . . . . . . . . . . . . . . . . . . . . . . . . . . . . . . . . . . . . . . . . . . . . . . . . . . . . . . . . . . . . . . . . . . . . . . . . . . . . . . . . . . . . . . . . . . . . . . . 22832.13.5. Variables influencing biomass densification . . . . . . . . . . . . . . . . . . . . . . . . . . . . . . . . . . . . . . . . . . . . . . . . . . . . . . . . . . . . . . . . . . . . . . . . . . . . . . . . . . . . . . 2283
2.14. Problems and remedies of biomass . . . . . . . . . . . . . . . . . . . . . . . . . . . . . . . . . . . . . . . . . . . . . . . . . . . . . . . . . . . . . . . . . . . . . . . . . . . . . . . . . . . . . . . . . . . . . . . . . . . . . . . . . 22832.14.1. Fouling, deposits, slagging and corrosion issues . . . . . . . . . . . . . . . . . . . . . . . . . . . . . . . . . . . . . . . . . . . . . . . . . . . . . . . . . . . . . . . . . . . . . . . . . . . . . . . . . . 22832.14.2. Agglomeration. . . . . . . . . . . . . . . . . . . . . . . . . . . . . . . . . . . . . . . . . . . . . . . . . . . . . . . . . . . . . . . . . . . . . . . . . . . . . . . . . . . . . . . . . . . . . . . . . . . . . . . . . . . . . . . . . . . . . 22832.14.3. Trace metal emissions . . . . . . . . . . . . . . . . . . . . . . . . . . . . . . . . . . . . . . . . . . . . . . . . . . . . . . . . . . . . . . . . . . . . . . . . . . . . . . . . . . . . . . . . . . . . . . . . . . . . . . . . . . . . . 22852.14.4. Low heating value . . . . . . . . . . . . . . . . . . . . . . . . . . . . . . . . . . . . . . . . . . . . . . . . . . . . . . . . . . . . . . . . . . . . . . . . . . . . . . . . . . . . . . . . . . . . . . . . . . . . . . . . . . . . . . . . . 22852.14.5. Marketing problems. . . . . . . . . . . . . . . . . . . . . . . . . . . . . . . . . . . . . . . . . . . . . . . . . . . . . . . . . . . . . . . . . . . . . . . . . . . . . . . . . . . . . . . . . . . . . . . . . . . . . . . . . . . . . . . 22852.14.6. Storage problem . . . . . . . . . . . . . . . . . . . . . . . . . . . . . . . . . . . . . . . . . . . . . . . . . . . . . . . . . . . . . . . . . . . . . . . . . . . . . . . . . . . . . . . . . . . . . . . . . . . . . . . . . . . . . . . . . . . 22852.14.7. Barriers for biomass production in South East Asia . . . . . . . . . . . . . . . . . . . . . . . . . . . . . . . . . . . . . . . . . . . . . . . . . . . . . . . . . . . . . . . . . . . . . . . . . . . . . . 22852.14.8. Biomass conversion challenges in USA . . . . . . . . . . . . . . . . . . . . . . . . . . . . . . . . . . . . . . . . . . . . . . . . . . . . . . . . . . . . . . . . . . . . . . . . . . . . . . . . . . . . . . . . . . . 2286
2.15. Policies of biomass . . . . . . . . . . . . . . . . . . . . . . . . . . . . . . . . . . . . . . . . . . . . . . . . . . . . . . . . . . . . . . . . . . . . . . . . . . . . . . . . . . . . . . . . . . . . . . . . . . . . . . . . . . . . . . . . . . . . . . . . . . 22862.15.1. Policies of biomass in Malaysia . . . . . . . . . . . . . . . . . . . . . . . . . . . . . . . . . . . . . . . . . . . . . . . . . . . . . . . . . . . . . . . . . . . . . . . . . . . . . . . . . . . . . . . . . . . . . . . . . . . 22862.15.2. Policies of biomass in India . . . . . . . . . . . . . . . . . . . . . . . . . . . . . . . . . . . . . . . . . . . . . . . . . . . . . . . . . . . . . . . . . . . . . . . . . . . . . . . . . . . . . . . . . . . . . . . . . . . . . . . 22862.15.3. Policies of biomass in USA . . . . . . . . . . . . . . . . . . . . . . . . . . . . . . . . . . . . . . . . . . . . . . . . . . . . . . . . . . . . . . . . . . . . . . . . . . . . . . . . . . . . . . . . . . . . . . . . . . . . . . . . 2286
2.16. Future of biomass . . . . . . . . . . . . . . . . . . . . . . . . . . . . . . . . . . . . . . . . . . . . . . . . . . . . . . . . . . . . . . . . . . . . . . . . . . . . . . . . . . . . . . . . . . . . . . . . . . . . . . . . . . . . . . . . . . . . . . . . . . . 22873. Conclusion. . . . . . . . . . . . . . . . . . . . . . . . . . . . . . . . . . . . . . . . . . . . . . . . . . . . . . . . . . . . . . . . . . . . . . . . . . . . . . . . . . . . . . . . . . . . . . . . . . . . . . . . . . . . . . . . . . . . . . . . . . . . . . . . . . . . . . . . . . . . 2287
. . . . .. . . . . .
1
ttHdeuha(bPf1sbOstwae
bOi(
Acknowledgement . . . . . . . . . . . . . . . . . . . . . . . . . . . . . . . . . . . . . . . . . . . . . . . . . . . .References . . . . . . . . . . . . . . . . . . . . . . . . . . . . . . . . . . . . . . . . . . . . . . . . . . . . . . . . . . . .
. Introduction
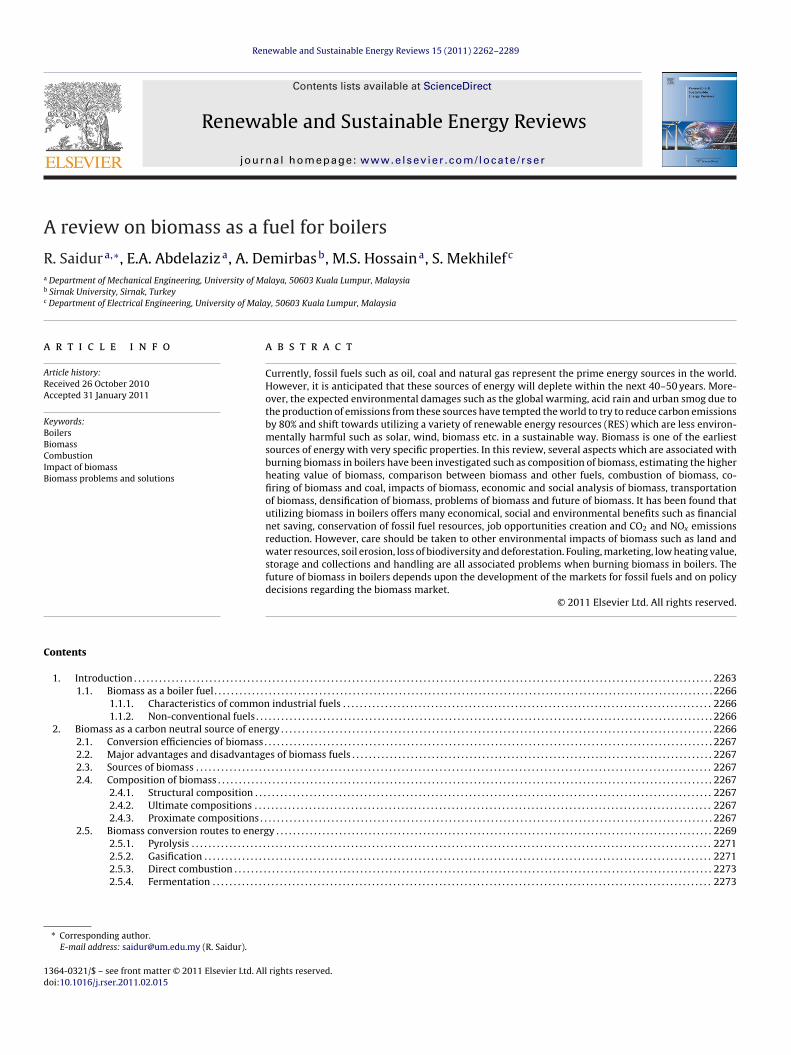
Currently, fossil fuels such as oil, coal and natural gas representhe prime energy sources in the world (approximately 80% ofhe total use of more than 400 EJ per year) as shown in Fig. 1.owever, it is anticipated that these sources of energy will beepleted within the next 40–50 years. Moreover, the expectednvironmental damages such as the global warming, acid rain andrban smog due to the production of emissions from these sourcesave tempted the world to try to reduce carbon emissions by 80%nd shift towards utilizing a variety of renewable energy resourcesRES) which are less environmentally harmful such as solar, wind,iomass. . .etc. in a sustainable way [1,2]. The Intergovernmentalanel on Climate Change (IPCC) reported that continued emissionsrom fossil fuels will lead to a temperature increase of between.4 and 5.8 ◦C over the period from 1990 to 2100 [3]. World energyupplies have been dominated by fossil fuels for decades. Todayiomass contributes about 10–15% (or 45 ± 10 EJ) of this demand.n average, in the industrialized countries biomass contributes
ome 9–14% to the total energy supplies, but in developing coun-ries this is as high as one-fifth to one-third [4]. According to theorld energy council projections, if the adequate policy initiatives
re provided in 2025, 30% of the direct fuel use and 60% of globallectricity supplies would be met by renewable energy sources [1].
The major source of GHG emissions from a boiler system is car-
on dioxide (CO2) from the combustion of fossil fuels in the boiler.ther minor sources of GHGs can include methane (CH4) from leaksn the natural gas distribution system and CH4 and nitrous oxideN2O) as byproducts of combustion processes [5].
. . . . . . . . . . . . . . . . . . . . . . . . . . . . . . . . . . . . . . . . . . . . . . . . . . . . . . . . . . . . . . . . . . . . . . . . . . 2288. . . . . . . . . . . . . . . . . . . . . . . . . . . . . . . . . . . . . . . . . . . . . . . . . . . . . . . . . . . . . . . . . . . . . . . . . 2288
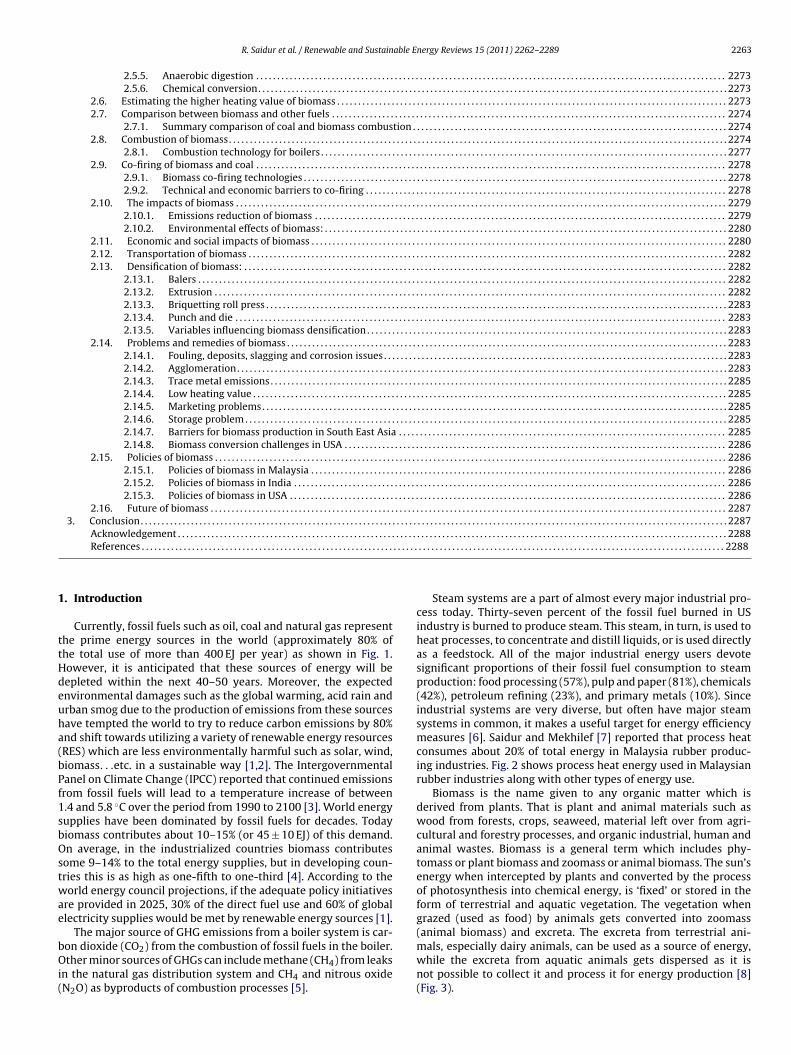
Steam systems are a part of almost every major industrial pro-cess today. Thirty-seven percent of the fossil fuel burned in USindustry is burned to produce steam. This steam, in turn, is used toheat processes, to concentrate and distill liquids, or is used directlyas a feedstock. All of the major industrial energy users devotesignificant proportions of their fossil fuel consumption to steamproduction: food processing (57%), pulp and paper (81%), chemicals(42%), petroleum refining (23%), and primary metals (10%). Sinceindustrial systems are very diverse, but often have major steamsystems in common, it makes a useful target for energy efficiencymeasures [6]. Saidur and Mekhilef [7] reported that process heatconsumes about 20% of total energy in Malaysia rubber produc-ing industries. Fig. 2 shows process heat energy used in Malaysianrubber industries along with other types of energy use.
Biomass is the name given to any organic matter which isderived from plants. That is plant and animal materials such aswood from forests, crops, seaweed, material left over from agri-cultural and forestry processes, and organic industrial, human andanimal wastes. Biomass is a general term which includes phy-tomass or plant biomass and zoomass or animal biomass. The sun’senergy when intercepted by plants and converted by the processof photosynthesis into chemical energy, is ‘fixed’ or stored in theform of terrestrial and aquatic vegetation. The vegetation whengrazed (used as food) by animals gets converted into zoomass(animal biomass) and excreta. The excreta from terrestrial ani-
mals, especially dairy animals, can be used as a source of energy,while the excreta from aquatic animals gets dispersed as it isnot possible to collect it and process it for energy production [8](Fig. 3).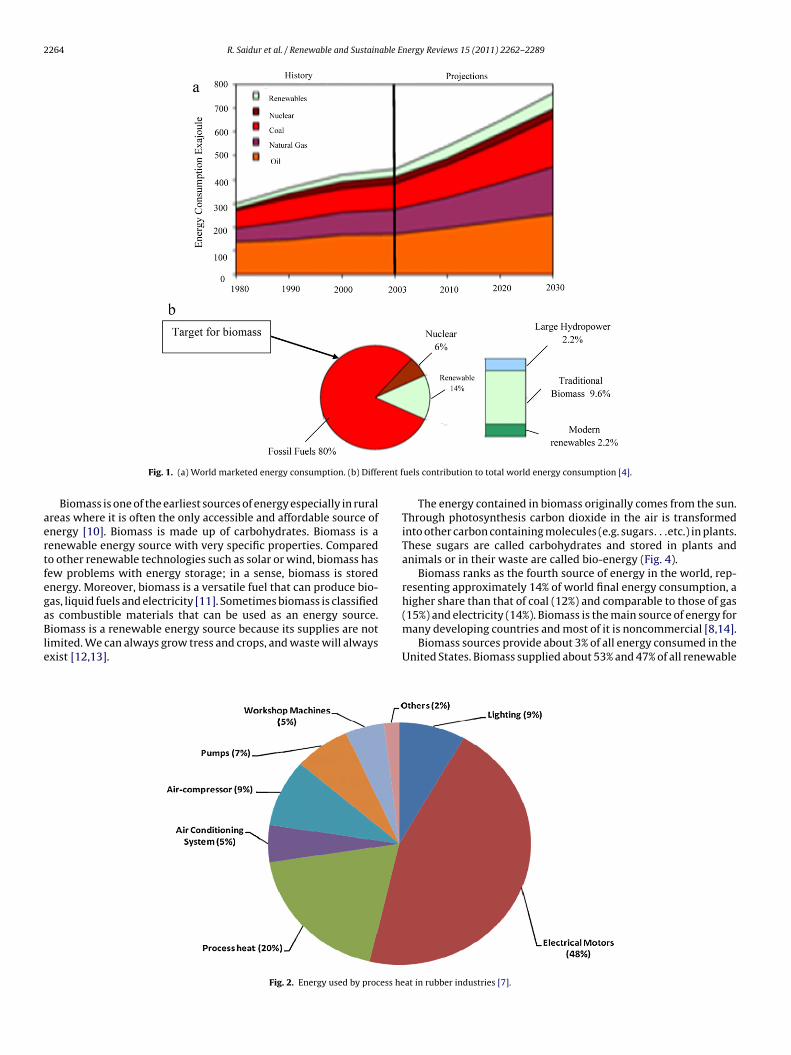
2264 R. Saidur et al. / Renewable and Sustainable Energy Reviews 15 (2011) 2262–2289
rent f
aertfegaBle
Fig. 1. (a) World marketed energy consumption. (b) Diffe
Biomass is one of the earliest sources of energy especially in ruralreas where it is often the only accessible and affordable source ofnergy [10]. Biomass is made up of carbohydrates. Biomass is aenewable energy source with very specific properties. Comparedo other renewable technologies such as solar or wind, biomass hasew problems with energy storage; in a sense, biomass is storednergy. Moreover, biomass is a versatile fuel that can produce bio-as, liquid fuels and electricity [11]. Sometimes biomass is classified
s combustible materials that can be used as an energy source.iomass is a renewable energy source because its supplies are notimited. We can always grow tress and crops, and waste will alwaysxist [12,13].
Fig. 2. Energy used by process he
uels contribution to total world energy consumption [4].
The energy contained in biomass originally comes from the sun.Through photosynthesis carbon dioxide in the air is transformedinto other carbon containing molecules (e.g. sugars. . .etc.) in plants.These sugars are called carbohydrates and stored in plants andanimals or in their waste are called bio-energy (Fig. 4).
Biomass ranks as the fourth source of energy in the world, rep-resenting approximately 14% of world final energy consumption, ahigher share than that of coal (12%) and comparable to those of gas
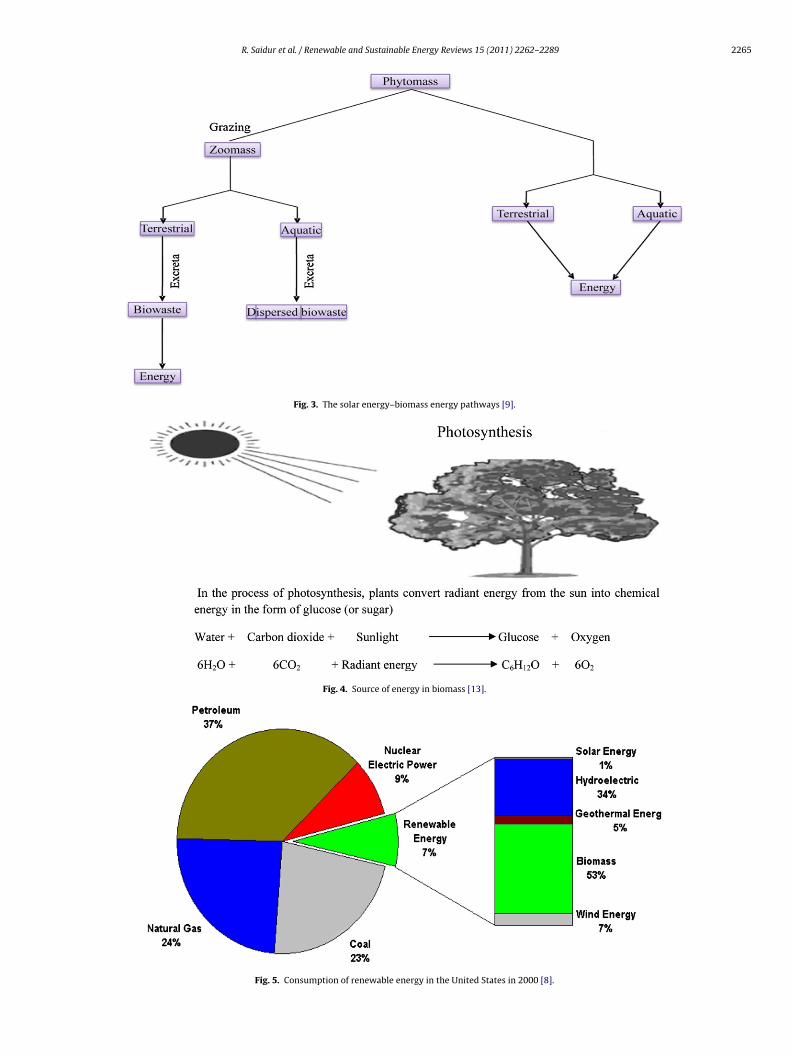
(15%) and electricity (14%). Biomass is the main source of energy formany developing countries and most of it is noncommercial [8,14].Biomass sources provide about 3% of all energy consumed in theUnited States. Biomass supplied about 53% and 47% of all renewable
at in rubber industries [7].
R. Saidur et al. / Renewable and Sustainable Energy Reviews 15 (2011) 2262–2289 2265
Fig. 3. The solar energy–biomass energy pathways [9].
Fig. 4. Source of energy in biomass [13].
Fig. 5. Consumption of renewable energy in the United States in 2000 [8].
2266 R. Saidur et al. / Renewable and Sustainable Energy Reviews 15 (2011) 2262–2289
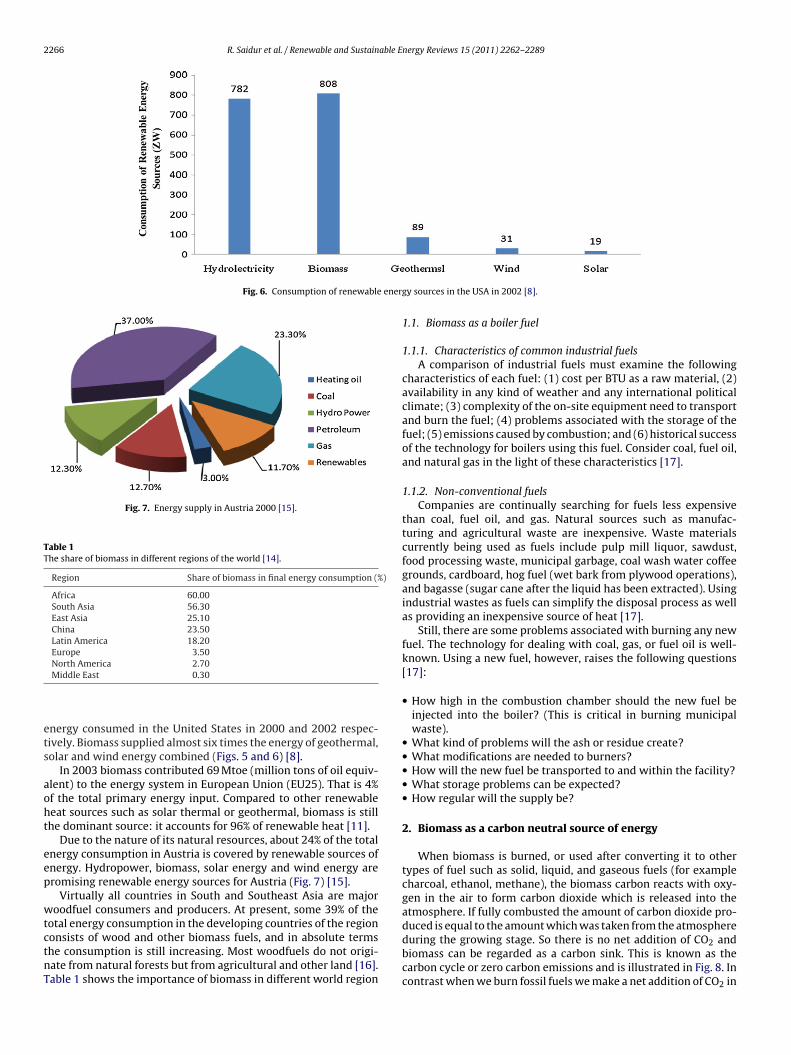
Fig. 6. Consumption of renewable ener
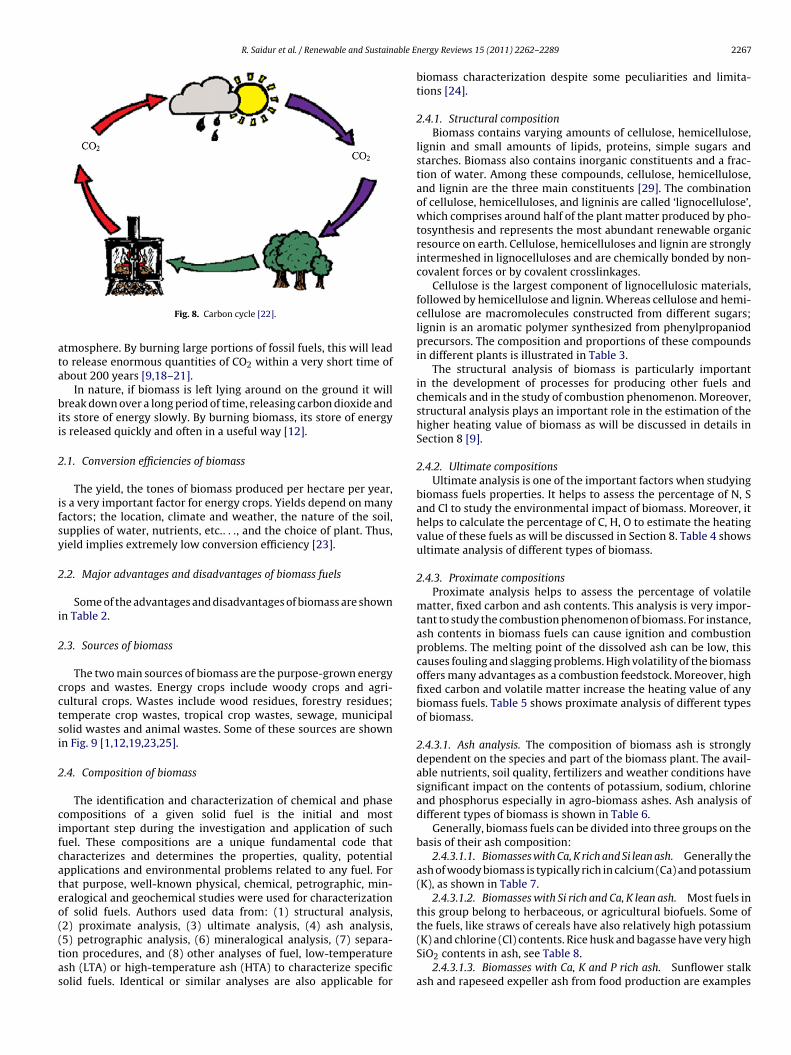
Fig. 7. Energy supply in Austria 2000 [15].
Table 1The share of biomass in different regions of the world [14].
Region Share of biomass in final energy consumption (%)
Africa 60.00South Asia 56.30East Asia 25.10China 23.50Latin America 18.20Europe 3.50
ets
aoht
eep
wtctnT
duced is equal to the amount which was taken from the atmosphereduring the growing stage. So there is no net addition of CO2 and
North America 2.70Middle East 0.30
nergy consumed in the United States in 2000 and 2002 respec-ively. Biomass supplied almost six times the energy of geothermal,olar and wind energy combined (Figs. 5 and 6) [8].
In 2003 biomass contributed 69 Mtoe (million tons of oil equiv-lent) to the energy system in European Union (EU25). That is 4%f the total primary energy input. Compared to other renewableeat sources such as solar thermal or geothermal, biomass is stillhe dominant source: it accounts for 96% of renewable heat [11].
Due to the nature of its natural resources, about 24% of the totalnergy consumption in Austria is covered by renewable sources ofnergy. Hydropower, biomass, solar energy and wind energy areromising renewable energy sources for Austria (Fig. 7) [15].
Virtually all countries in South and Southeast Asia are majoroodfuel consumers and producers. At present, some 39% of the
otal energy consumption in the developing countries of the regiononsists of wood and other biomass fuels, and in absolute terms
he consumption is still increasing. Most woodfuels do not origi-ate from natural forests but from agricultural and other land [16].able 1 shows the importance of biomass in different world regiongy sources in the USA in 2002 [8].
1.1. Biomass as a boiler fuel
1.1.1. Characteristics of common industrial fuelsA comparison of industrial fuels must examine the following
characteristics of each fuel: (1) cost per BTU as a raw material, (2)availability in any kind of weather and any international politicalclimate; (3) complexity of the on-site equipment need to transportand burn the fuel; (4) problems associated with the storage of thefuel; (5) emissions caused by combustion; and (6) historical successof the technology for boilers using this fuel. Consider coal, fuel oil,and natural gas in the light of these characteristics [17].
1.1.2. Non-conventional fuelsCompanies are continually searching for fuels less expensive
than coal, fuel oil, and gas. Natural sources such as manufac-turing and agricultural waste are inexpensive. Waste materialscurrently being used as fuels include pulp mill liquor, sawdust,food processing waste, municipal garbage, coal wash water coffeegrounds, cardboard, hog fuel (wet bark from plywood operations),and bagasse (sugar cane after the liquid has been extracted). Usingindustrial wastes as fuels can simplify the disposal process as wellas providing an inexpensive source of heat [17].
Still, there are some problems associated with burning any newfuel. The technology for dealing with coal, gas, or fuel oil is well-known. Using a new fuel, however, raises the following questions[17]:
• How high in the combustion chamber should the new fuel beinjected into the boiler? (This is critical in burning municipalwaste).
• What kind of problems will the ash or residue create?• What modifications are needed to burners?• How will the new fuel be transported to and within the facility?• What storage problems can be expected?• How regular will the supply be?
2. Biomass as a carbon neutral source of energy
When biomass is burned, or used after converting it to othertypes of fuel such as solid, liquid, and gaseous fuels (for examplecharcoal, ethanol, methane), the biomass carbon reacts with oxy-gen in the air to form carbon dioxide which is released into theatmosphere. If fully combusted the amount of carbon dioxide pro-
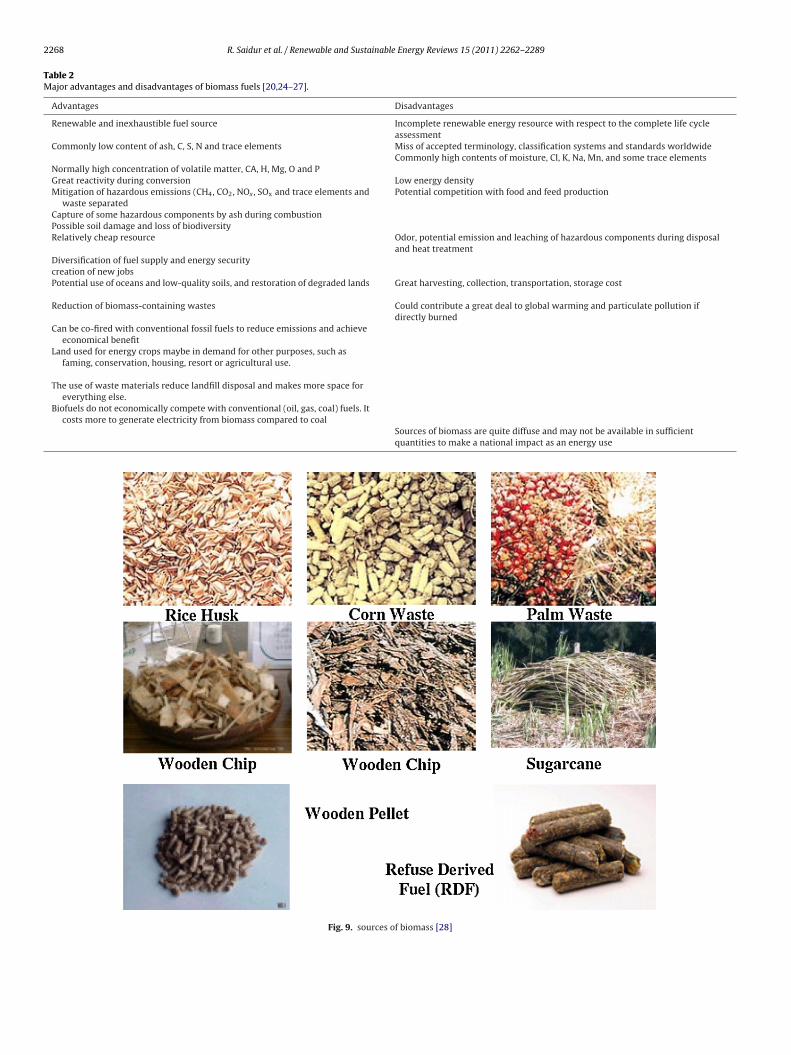
biomass can be regarded as a carbon sink. This is known as thecarbon cycle or zero carbon emissions and is illustrated in Fig. 8. Incontrast when we burn fossil fuels we make a net addition of CO2 in
R. Saidur et al. / Renewable and Sustainable E
ata
bii
2
ifsy
2
i
2
cctsi
2
cifcateo((tas
Fig. 8. Carbon cycle [22].
tmosphere. By burning large portions of fossil fuels, this will leado release enormous quantities of CO2 within a very short time ofbout 200 years [9,18–21].
In nature, if biomass is left lying around on the ground it willreak down over a long period of time, releasing carbon dioxide and
ts store of energy slowly. By burning biomass, its store of energys released quickly and often in a useful way [12].
.1. Conversion efficiencies of biomass
The yield, the tones of biomass produced per hectare per year,s a very important factor for energy crops. Yields depend on manyactors; the location, climate and weather, the nature of the soil,upplies of water, nutrients, etc.. . ., and the choice of plant. Thus,ield implies extremely low conversion efficiency [23].
.2. Major advantages and disadvantages of biomass fuels
Some of the advantages and disadvantages of biomass are shownn Table 2.
.3. Sources of biomass
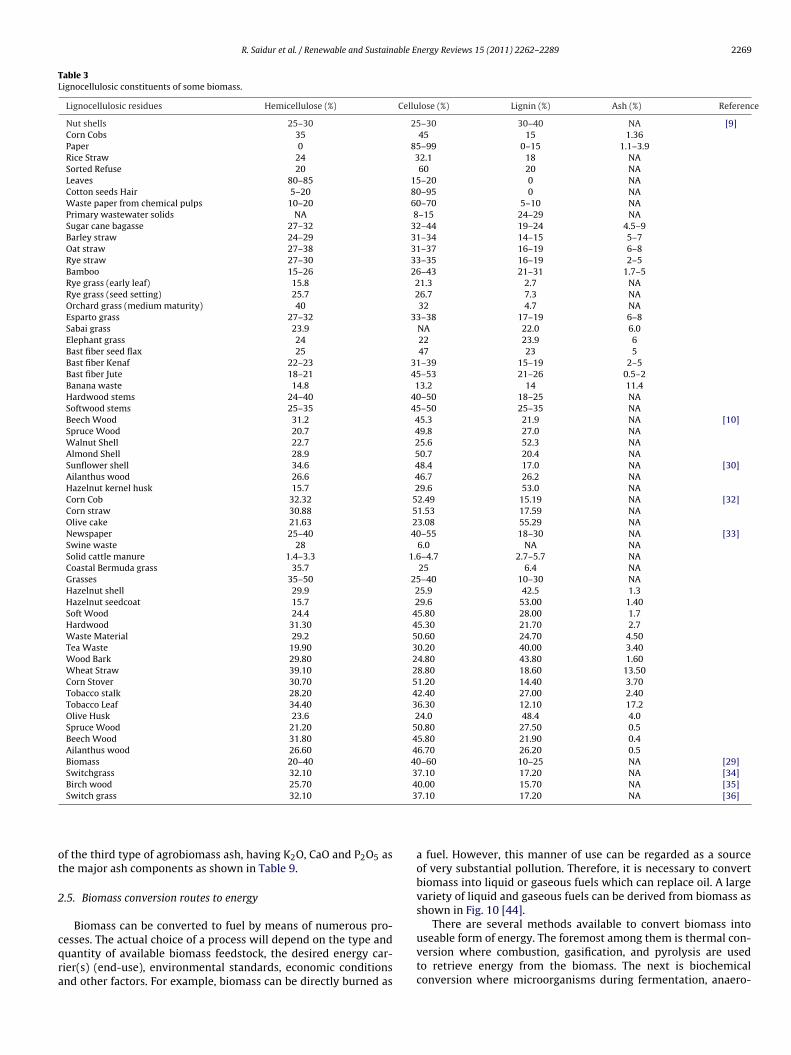
The two main sources of biomass are the purpose-grown energyrops and wastes. Energy crops include woody crops and agri-ultural crops. Wastes include wood residues, forestry residues;emperate crop wastes, tropical crop wastes, sewage, municipalolid wastes and animal wastes. Some of these sources are shownn Fig. 9 [1,12,19,23,25].
.4. Composition of biomass
The identification and characterization of chemical and phaseompositions of a given solid fuel is the initial and mostmportant step during the investigation and application of suchuel. These compositions are a unique fundamental code thatharacterizes and determines the properties, quality, potentialpplications and environmental problems related to any fuel. Forhat purpose, well-known physical, chemical, petrographic, min-ralogical and geochemical studies were used for characterizationf solid fuels. Authors used data from: (1) structural analysis,
2) proximate analysis, (3) ultimate analysis, (4) ash analysis,5) petrographic analysis, (6) mineralogical analysis, (7) separa-ion procedures, and (8) other analyses of fuel, low-temperaturesh (LTA) or high-temperature ash (HTA) to characterize specificolid fuels. Identical or similar analyses are also applicable fornergy Reviews 15 (2011) 2262–2289 2267
biomass characterization despite some peculiarities and limita-tions [24].
2.4.1. Structural compositionBiomass contains varying amounts of cellulose, hemicellulose,
lignin and small amounts of lipids, proteins, simple sugars andstarches. Biomass also contains inorganic constituents and a frac-tion of water. Among these compounds, cellulose, hemicellulose,and lignin are the three main constituents [29]. The combinationof cellulose, hemicelluloses, and ligninis are called ‘lignocellulose’,which comprises around half of the plant matter produced by pho-tosynthesis and represents the most abundant renewable organicresource on earth. Cellulose, hemicelluloses and lignin are stronglyintermeshed in lignocelluloses and are chemically bonded by non-covalent forces or by covalent crosslinkages.
Cellulose is the largest component of lignocellulosic materials,followed by hemicellulose and lignin. Whereas cellulose and hemi-cellulose are macromolecules constructed from different sugars;lignin is an aromatic polymer synthesized from phenylpropaniodprecursors. The composition and proportions of these compoundsin different plants is illustrated in Table 3.
The structural analysis of biomass is particularly importantin the development of processes for producing other fuels andchemicals and in the study of combustion phenomenon. Moreover,structural analysis plays an important role in the estimation of thehigher heating value of biomass as will be discussed in details inSection 8 [9].
2.4.2. Ultimate compositionsUltimate analysis is one of the important factors when studying
biomass fuels properties. It helps to assess the percentage of N, Sand Cl to study the environmental impact of biomass. Moreover, ithelps to calculate the percentage of C, H, O to estimate the heatingvalue of these fuels as will be discussed in Section 8. Table 4 showsultimate analysis of different types of biomass.
2.4.3. Proximate compositionsProximate analysis helps to assess the percentage of volatile
matter, fixed carbon and ash contents. This analysis is very impor-tant to study the combustion phenomenon of biomass. For instance,ash contents in biomass fuels can cause ignition and combustionproblems. The melting point of the dissolved ash can be low, thiscauses fouling and slagging problems. High volatility of the biomassoffers many advantages as a combustion feedstock. Moreover, highfixed carbon and volatile matter increase the heating value of anybiomass fuels. Table 5 shows proximate analysis of different typesof biomass.
2.4.3.1. Ash analysis. The composition of biomass ash is stronglydependent on the species and part of the biomass plant. The avail-able nutrients, soil quality, fertilizers and weather conditions havesignificant impact on the contents of potassium, sodium, chlorineand phosphorus especially in agro-biomass ashes. Ash analysis ofdifferent types of biomass is shown in Table 6.
Generally, biomass fuels can be divided into three groups on thebasis of their ash composition:
2.4.3.1.1. Biomasses with Ca, K rich and Si lean ash. Generally theash of woody biomass is typically rich in calcium (Ca) and potassium(K), as shown in Table 7.
2.4.3.1.2. Biomasses with Si rich and Ca, K lean ash. Most fuels inthis group belong to herbaceous, or agricultural biofuels. Some of
the fuels, like straws of cereals have also relatively high potassium(K) and chlorine (Cl) contents. Rice husk and bagasse have very highSiO2 contents in ash, see Table 8.2.4.3.1.3. Biomasses with Ca, K and P rich ash. Sunflower stalkash and rapeseed expeller ash from food production are examples
2268 R. Saidur et al. / Renewable and Sustainable Energy Reviews 15 (2011) 2262–2289
Table 2Major advantages and disadvantages of biomass fuels [20,24–27].
Advantages Disadvantages
Renewable and inexhaustible fuel source Incomplete renewable energy resource with respect to the complete life cycleassessment
Commonly low content of ash, C, S, N and trace elements Miss of accepted terminology, classification systems and standards worldwideCommonly high contents of moisture, Cl, K, Na, Mn, and some trace elements
Normally high concentration of volatile matter, CA, H, Mg, O and PGreat reactivity during conversion Low energy densityMitigation of hazardous emissions (CH4, CO2, NOx , SOx and trace elements and
waste separatedPotential competition with food and feed production
Capture of some hazardous components by ash during combustionPossible soil damage and loss of biodiversityRelatively cheap resource Odor, potential emission and leaching of hazardous components during disposal
and heat treatmentDiversification of fuel supply and energy securitycreation of new jobsPotential use of oceans and low-quality soils, and restoration of degraded lands Great harvesting, collection, transportation, storage cost
Reduction of biomass-containing wastes Could contribute a great deal to global warming and particulate pollution ifdirectly burned
Can be co-fired with conventional fossil fuels to reduce emissions and achieveeconomical benefit
Land used for energy crops maybe in demand for other purposes, such asfaming, conservation, housing, resort or agricultural use.
The use of waste materials reduce landfill disposal and makes more space foreverything else.
Biofuels do not economically compete with conventional (oil, gas, coal) fuels. Itcosts more to generate electricity from biomass compared to coal
Sources of biomass are quite diffuse and may not be available in sufficientquantities to make a national impact as an energy use
Fig. 9. sources of biomass [28]
R. Saidur et al. / Renewable and Sustainable Energy Reviews 15 (2011) 2262–2289 2269
Table 3Lignocellulosic constituents of some biomass.
Lignocellulosic residues Hemicellulose (%) Cellulose (%) Lignin (%) Ash (%) Reference
Nut shells 25–30 25–30 30–40 NA [9]Corn Cobs 35 45 15 1.36Paper 0 85–99 0–15 1.1–3.9Rice Straw 24 32.1 18 NASorted Refuse 20 60 20 NALeaves 80–85 15–20 0 NACotton seeds Hair 5–20 80–95 0 NAWaste paper from chemical pulps 10–20 60–70 5–10 NAPrimary wastewater solids NA 8–15 24–29 NASugar cane bagasse 27–32 32–44 19–24 4.5–9Barley straw 24–29 31–34 14–15 5–7Oat straw 27–38 31–37 16–19 6–8Rye straw 27–30 33–35 16–19 2–5Bamboo 15–26 26–43 21–31 1.7–5Rye grass (early leaf) 15.8 21.3 2.7 NARye grass (seed setting) 25.7 26.7 7.3 NAOrchard grass (medium maturity) 40 32 4.7 NAEsparto grass 27–32 33–38 17–19 6–8Sabai grass 23.9 NA 22.0 6.0Elephant grass 24 22 23.9 6Bast fiber seed flax 25 47 23 5Bast fiber Kenaf 22–23 31–39 15–19 2–5Bast fiber Jute 18–21 45–53 21–26 0.5–2Banana waste 14.8 13.2 14 11.4Hardwood stems 24–40 40–50 18–25 NASoftwood stems 25–35 45–50 25–35 NABeech Wood 31.2 45.3 21.9 NA [10]Spruce Wood 20.7 49.8 27.0 NAWalnut Shell 22.7 25.6 52.3 NAAlmond Shell 28.9 50.7 20.4 NASunflower shell 34.6 48.4 17.0 NA [30]Ailanthus wood 26.6 46.7 26.2 NAHazelnut kernel husk 15.7 29.6 53.0 NACorn Cob 32.32 52.49 15.19 NA [32]Corn straw 30.88 51.53 17.59 NAOlive cake 21.63 23.08 55.29 NANewspaper 25–40 40–55 18–30 NA [33]Swine waste 28 6.0 NA NASolid cattle manure 1.4–3.3 1.6–4.7 2.7–5.7 NACoastal Bermuda grass 35.7 25 6.4 NAGrasses 35–50 25–40 10–30 NAHazelnut shell 29.9 25.9 42.5 1.3Hazelnut seedcoat 15.7 29.6 53.00 1.40Soft Wood 24.4 45.80 28.00 1.7Hardwood 31.30 45.30 21.70 2.7Waste Material 29.2 50.60 24.70 4.50Tea Waste 19.90 30.20 40.00 3.40Wood Bark 29.80 24.80 43.80 1.60Wheat Straw 39.10 28.80 18.60 13.50Corn Stover 30.70 51.20 14.40 3.70Tobacco stalk 28.20 42.40 27.00 2.40Tobacco Leaf 34.40 36.30 12.10 17.2Olive Husk 23.6 24.0 48.4 4.0Spruce Wood 21.20 50.80 27.50 0.5Beech Wood 31.80 45.80 21.90 0.4Ailanthus wood 26.60 46.70 26.20 0.5Biomass 20–40 40–60 10–25 NA [29]Switchgrass 32.10 37.10 17.20 NA [34]
43
ot
2
cqra
Birch wood 25.70Switch grass 32.10
f the third type of agrobiomass ash, having K2O, CaO and P2O5 ashe major ash components as shown in Table 9.
.5. Biomass conversion routes to energy
Biomass can be converted to fuel by means of numerous pro-esses. The actual choice of a process will depend on the type anduantity of available biomass feedstock, the desired energy car-ier(s) (end-use), environmental standards, economic conditionsnd other factors. For example, biomass can be directly burned as
0.00 15.70 NA [35]7.10 17.20 NA [36]
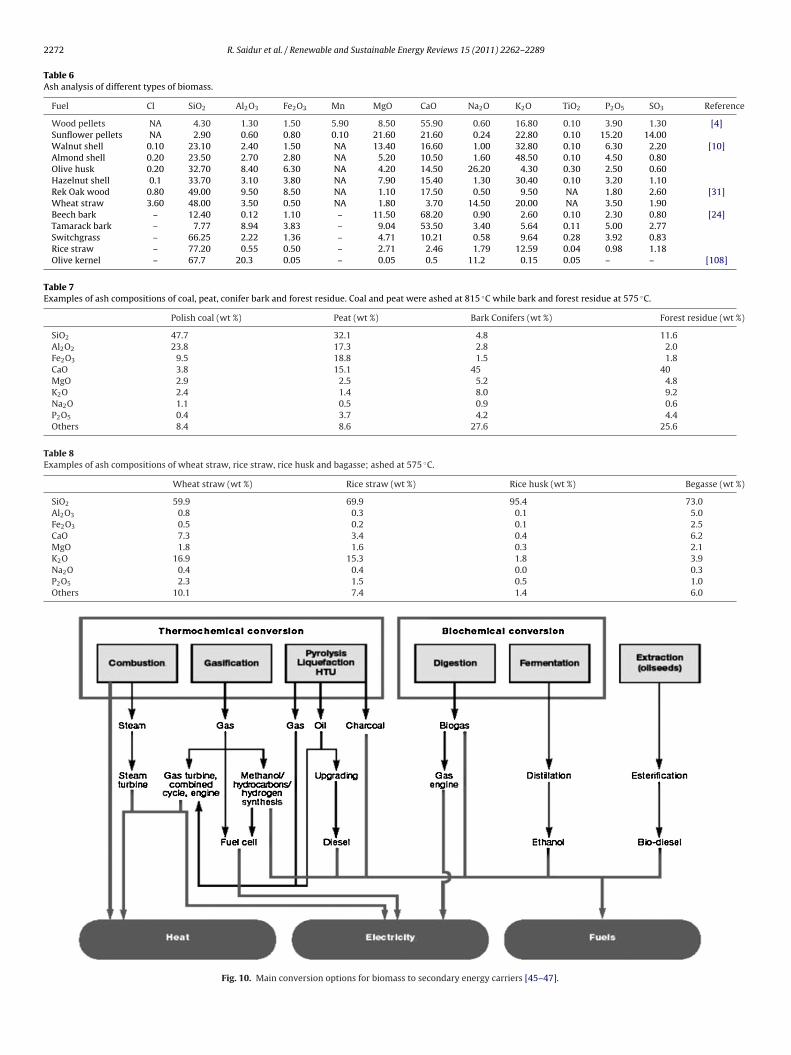
a fuel. However, this manner of use can be regarded as a sourceof very substantial pollution. Therefore, it is necessary to convertbiomass into liquid or gaseous fuels which can replace oil. A largevariety of liquid and gaseous fuels can be derived from biomass asshown in Fig. 10 [44].
There are several methods available to convert biomass intouseable form of energy. The foremost among them is thermal con-version where combustion, gasification, and pyrolysis are usedto retrieve energy from the biomass. The next is biochemicalconversion where microorganisms during fermentation, anaero-
2270 R. Saidur et al. / Renewable and Sustainable Energy Reviews 15 (2011) 2262–2289
Table 4Ultimate analysis of different types of biomass types (wt% dry basis).
Fuel C H O N S Cl Ref
Lignite 65.20 4.50 17.50 1.3 4.1 0.40 [37]Spruce wood 51.40 6.10 41.20 0.3 0.0 0.10Hazelnut Shell 50.80 5.60 41.10 1.0 0.0 0.20Corncob 49.00 5.40 44.20 0.4 0.0 0.20Corn Stover 49.40 5.60 42.50 0.6 0.1 0.30Tobacco stalk 49.30 5.60 42.80 0.7 0.0 0.20Tobacco leaf 41.20 4.90 33.90 0.9 0.0 0.30Almond shell 47.90 6.00 41.70 1.1 006 0.10Walnut shell 53.60 6.600 35.50 1.5 0.1 0.20Sawdust 46.90 5.20 37.80 0.1 0.04 – [10]Rice Husk 47.80 5.10 38.90 0.1 – –Cotton Gin 42.80 5.40 35.00 1.4 0.5 –Sugarcane Bagasse 44.80 5.40 39.60 0.4 0.01 –Peach Pit 53.00 5.90 39.10 0.3 0.05 –Alfafa Stalk 45.40 5.80 36.50 2.1 0.09 –Switchgrass 46.70 5.90 37.40 0.8 0.19 –Olive Husk 49.90 6.20 42.00 1.6 0.05 0.20Beech Wood 49.50 6.20 41.20 0.4 – –Tea Waste 48.00 5.5 44.00 0.5 0.06 0.1Sunflower Shell 47.40 5.80 41.3 1.4 0.05 0.1Tires 81.5 7.10 3.4 0.5 1.4 – [19]Poplar 48.45 5.85 43.69 0.47 0.01 –Eucalyptus 48.33 5.89 45.13 0.15 0.01 –Red oak wood 50.00 6.00 42.40 0.3 – – [31]Wheat straw 41.80 5.50 35.50 0.7 0.0 1.50Alder fill Sawdust 53.20 6.10 4.20 0.50 0.04 0.02 [24]Balsam bark 54.00 6.20 39.50 0.20 0.10 –Beech bark 51.40 6.00 41.80 0.70 0.11 –Birch bark 57.00 6.70 35.70 0.50 0.10 –Christmas tree 54.50 5.90 38.70 0.50 0.42 –Elm bark 50.9 5.80 42.50 0,70 0.11 –Olive wood 49.00 5.40 44.90 0.70 0.03Pine pruning 51.90 6.30 41.30 0.50 0.01 –Spruce bark 53.60 6.20 40.00 0.10 0.10 0.03Tamarack bark 57.00 10.20 32.00 0.70 0.11 –Willow 49.80 6.10 43.40 0.60 0.06 0.01Barley straw 49.40 6.20 43.60 0.70 0.13 0.27Sorghastrum grass 49.40 6.30 44.00 0.30 0.05 0.04Kenaf grass 48.40 6.00 44.50 1.00 0.15 0.17Bamboo whole 52.00 5.10 42.50 0.40 0.04 0.08Almond hulls 50.60 6.40 41.70 1.20 0.07 0.02Wheat straw 49.40 6.10 43.60 0.70 0.17 0.61Coffee husks 45.40 4.90 48.30 1.10 0.35 –Cotton husks 50.40 8.40 39.80 1.40 0.01 –Palm Kernels 51.00 6.50 39.50 2.70 0.27 0.21Pepper residue 45.70 3.20 47.10 3.40 0.60 –Plum pits 49.90 6.70 42.40 0.90 0.08 0.01Soya husks 45.40 6.70 46.90 0.90 0.10 –Chicken litter 60.50 6.80 25.30 6.20 1.20 0.50Meat-bone meal 57.30 8.00 20.80 12.20 1,69 0.87Mustard husks 45.80 9.20 44.40 0.40 0.20 –Sugar cane bagasse 49.80 6.00 43.90 0.20 0.06 0.03Walnut hulls and blows 55.10 6.70 36.50 1.60 0.12 0.02Coconut shells 51.10 5.60 43.10 0.10 0.10 –Sewage sludge 50.90 7.30 33.40 6.10 2.33 0.04Wood yard waste 52.20 6.0 40.40 1.1 0.30 0.30Pistachio shell 48.79 5.91 43.41 – – – [38]Wood chips 48.10 5.99 45.72 – – –Neem wood 48.26 6.27 43.46 – – –Cereals 46.50 06.10 42.00 01.20 0.10 0.20 [39]Millet 45.90 05.30 41.10 00.90 0.10 0.30Sunflower 50.50 05.90 34.90 01.30 0.10 0.40Apricot stones 52.38 06.57 38.78 01.07 0.15 – [40]Peach stones 51.35 06.01 40.32 00.58 0.14 –Olive cake 46.80 06.07 36.69 00.68 0.12 –
35–
bBwct
Switchgrass 42.04 04.97Rice Straw 38.45 5.28
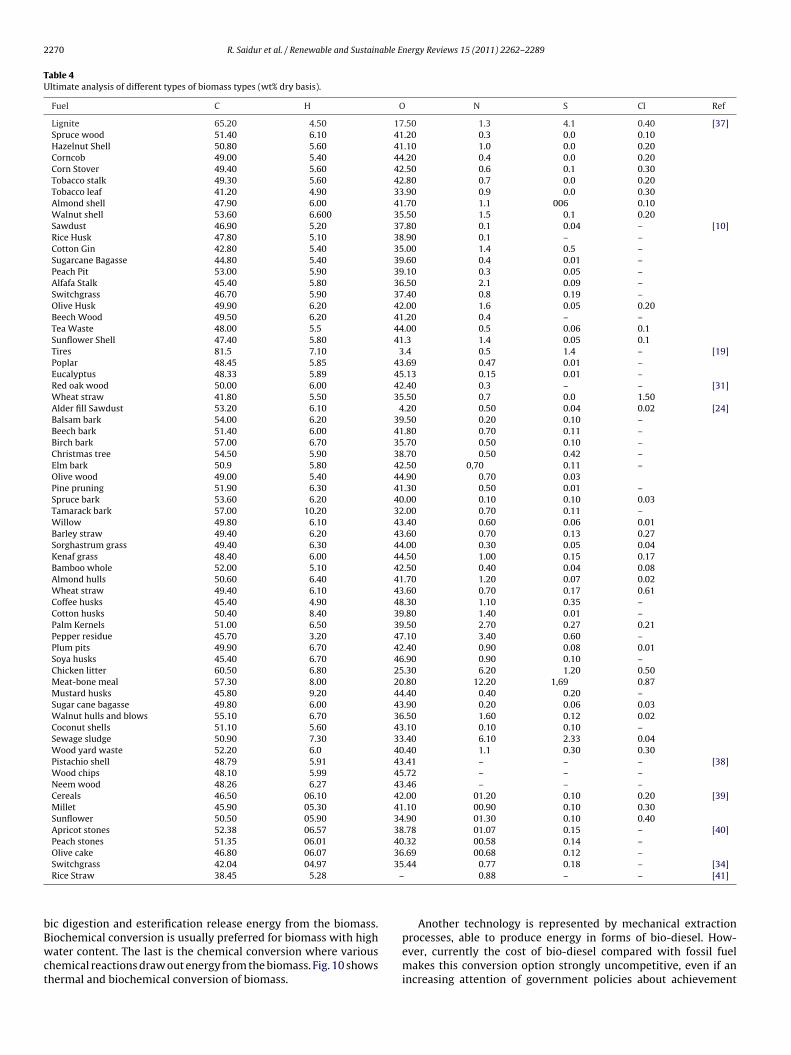
ic digestion and esterification release energy from the biomass.iochemical conversion is usually preferred for biomass with highater content. The last is the chemical conversion where various
hemical reactions draw out energy from the biomass. Fig. 10 showshermal and biochemical conversion of biomass.
.44 0.77 0.18 – [34]0.88 – – [41]
Another technology is represented by mechanical extractionprocesses, able to produce energy in forms of bio-diesel. How-ever, currently the cost of bio-diesel compared with fossil fuelmakes this conversion option strongly uncompetitive, even if anincreasing attention of government policies about achievement
R. Saidur et al. / Renewable and Sustainable Energy Reviews 15 (2011) 2262–2289 2271
Table 5Proximate analysis of different types of biomass types (wt% dry basis).
Fuel FC VM Ash Ref
Alfalfa stems 15.81 78.92 05.27 [42]Wheat straw 17.71 75.27 07.02Rice hulls 16.22 63.52 20,26Rice straw 15.86 65.47 18.67Switch grass 14.34 76.69 08.97Sugar cane bagasse 11.95 85.61 02.44Willow wood 16.07 82.22 01.71Hyprid poplar 12.49 84.81 02.70Almond shells 20.71 76.00 03.29Almond hulls 20.07 73.80 06.13Yard waste 13.59 66.04 20.37Fir mill 17.48 82.11 00.41Mixed paper 07.42 84.25 08.33Rice husk 16.95 61.81 21.24 [38]Olive husk 26.10 70.30 03.60Peanut hull 21.09 73.02 05.89Hazelnut shell 28.30 69.30 01.40Brazil nut shell 22.20 76.10 01.70Akhrot shell 18.78 79.98 01.20Coconut shell 22.10 77.19 00.71Spruce wood 29.30 70.20 01.50Ailanthus wood 24.80 73.50 01.70Neem wood 12.19 85.86 01.93Douglas fir wood 12.60 87.30 00.10Douglas fir bark 32.97 65.46 01.75Cotton stalk 19.90 62.90 17.30Jawar straw 15.15 75.97 08.88Barley straw 13.29 82.41 04.30Casurina wood 19.58 78.58 01.83Subabul wood 18.52 81.02 01.20Sena leaves 25.50 57.20 17.30Oak wood 21.90 77.60 00.50 [10]Beech wood 17.00 82.50 00.50Corncob 11.50 87.40 01.10Tea waste 13.00 85.50 01.50Walnut shell 37.90 59.30 02.80Sunflower shell 19.80 76.20 04.00Colza seed 15.40 78.10 06.50Pine one 21.70 07.30 01.00Cotton refuse 12.40 81.00 06.60Olive refuse 24.70 66.10 09.20Sawdust 15.00 82.20 02.80Corn stover 10.90 84.00 05.10Birch bark 19.40 78.50 2.10 [24]Elm bark 18.80 73.10 8.10Oak wood 21.40 78.10 0.50Willow 15.90 82.50 1.60Buffalo gourd grass 13.70 81.60 04.70Sorghastrum grass 14.20 81.60 04.20Olive pits 19.90 77.00 3.10Soya husks 20.30 74.30 5.40Coffee husks 20.70 76.50 2.80Pine pruning 15.10 82.20 2.70Maple bark 19.40 76.60 4.00Hemlock bark 25.50 72.00 2.50Buffalo gourd grass 13.70 81.6 4.70Kenaf grass 17.0 79.4 3.60Reed canary grass 17.70 73.4 8.90
47.885.6472.7583.30
o[
2
mcbmb
Chicken litter 14.40Mango wood 11.36Sudan grass 18.60Orchard 14.60
f better air-quality standards may rapidly change this situation45].
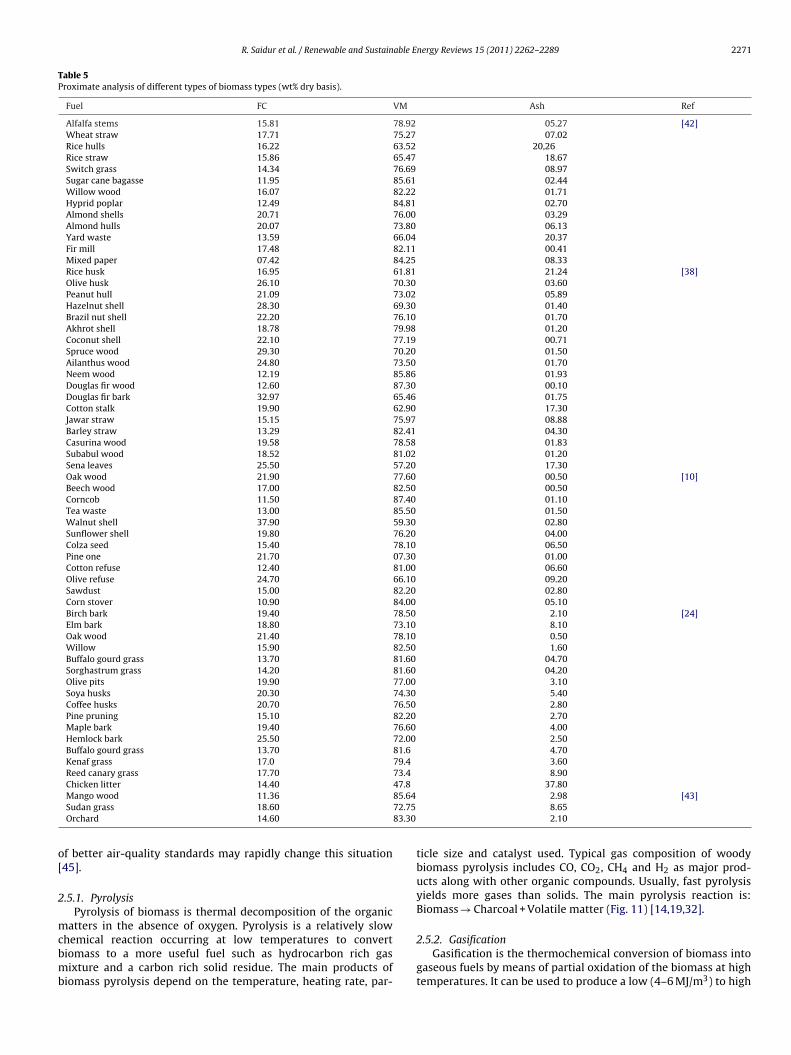
.5.1. PyrolysisPyrolysis of biomass is thermal decomposition of the organic
atters in the absence of oxygen. Pyrolysis is a relatively slowhemical reaction occurring at low temperatures to convertiomass to a more useful fuel such as hydrocarbon rich gasixture and a carbon rich solid residue. The main products of
iomass pyrolysis depend on the temperature, heating rate, par-
37.802.98 [43]8.652.10
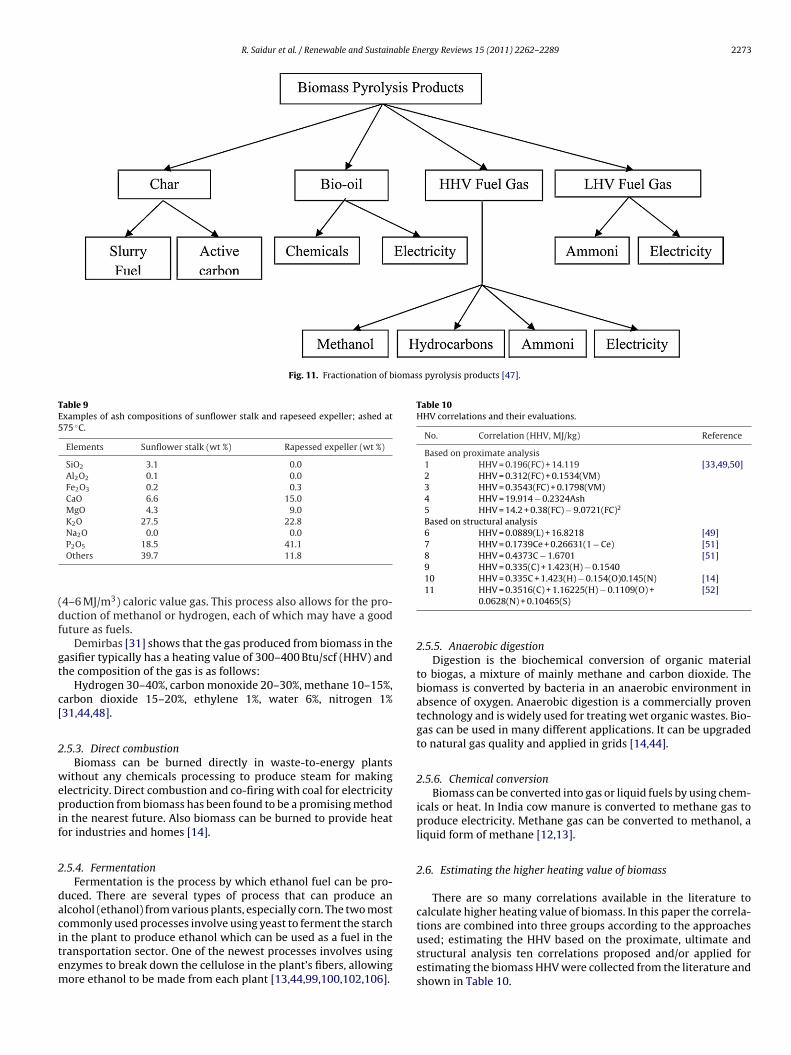
ticle size and catalyst used. Typical gas composition of woodybiomass pyrolysis includes CO, CO2, CH4 and H2 as major prod-ucts along with other organic compounds. Usually, fast pyrolysisyields more gases than solids. The main pyrolysis reaction is:Biomass → Charcoal + Volatile matter (Fig. 11) [14,19,32].
2.5.2. GasificationGasification is the thermochemical conversion of biomass into
gaseous fuels by means of partial oxidation of the biomass at hightemperatures. It can be used to produce a low (4–6 MJ/m3) to high
2272 R. Saidur et al. / Renewable and Sustainable Energy Reviews 15 (2011) 2262–2289
Table 6Ash analysis of different types of biomass.
Fuel Cl SiO2 Al2O3 Fe2O3 Mn MgO CaO Na2O K2O TiO2 P2O5 SO3 Reference
Wood pellets NA 4.30 1.30 1.50 5.90 8.50 55.90 0.60 16.80 0.10 3.90 1.30 [4]Sunflower pellets NA 2.90 0.60 0.80 0.10 21.60 21.60 0.24 22.80 0.10 15.20 14.00Walnut shell 0.10 23.10 2.40 1.50 NA 13.40 16.60 1.00 32.80 0.10 6.30 2.20 [10]Almond shell 0.20 23.50 2.70 2.80 NA 5.20 10.50 1.60 48.50 0.10 4.50 0.80Olive husk 0.20 32.70 8.40 6.30 NA 4.20 14.50 26.20 4.30 0.30 2.50 0.60Hazelnut shell 0.1 33.70 3.10 3.80 NA 7.90 15.40 1.30 30.40 0.10 3.20 1.10Rek Oak wood 0.80 49.00 9.50 8.50 NA 1.10 17.50 0.50 9.50 NA 1.80 2.60 [31]Wheat straw 3.60 48.00 3.50 0.50 NA 1.80 3.70 14.50 20.00 NA 3.50 1.90Beech bark – 12.40 0.12 1.10 – 11.50 68.20 0.90 2.60 0.10 2.30 0.80 [24]Tamarack bark – 7.77 8.94 3.83 – 9.04 53.50 3.40 5.64 0.11 5.00 2.77Switchgrass – 66.25 2.22 1.36 – 4.71 10.21 0.58 9.64 0.28 3.92 0.83Rice straw – 77.20 0.55 0.50 – 2.71 2.46 1.79 12.59 0.04 0.98 1.18Olive kernel – 67.7 20.3 0.05 – 0.05 0.5 11.2 0.15 0.05 – – [108]
Table 7Examples of ash compositions of coal, peat, conifer bark and forest residue. Coal and peat were ashed at 815 ◦C while bark and forest residue at 575 ◦C.
Polish coal (wt %) Peat (wt %) Bark Conifers (wt %) Forest residue (wt %)
SiO2 47.7 32.1 4.8 11.6Al2O2 23.8 17.3 2.8 2.0Fe2O3 9.5 18.8 1.5 1.8CaO 3.8 15.1 45 40MgO 2.9 2.5 5.2 4.8K2O 2.4 1.4 8.0 9.2Na2O 1.1 0.5 0.9 0.6P2O5 0.4 3.7 4.2 4.4Others 8.4 8.6 27.6 25.6
Table 8Examples of ash compositions of wheat straw, rice straw, rice husk and bagasse; ashed at 575 ◦C.
Wheat straw (wt %) Rice straw (wt %) Rice husk (wt %) Begasse (wt %)
SiO2 59.9 69.9 95.4 73.0Al2O3 0.8 0.3 0.1 5.0Fe2O3 0.5 0.2 0.1 2.5CaO 7.3 3.4 0.4 6.2MgO 1.8 1.6 0.3 2.1K2O 16.9 15.3 1.8 3.9Na2O 0.4 0.4 0.0 0.3P2O5 2.3 1.5 0.5 1.0Others 10.1 7.4 1.4 6.0
Fig. 10. Main conversion options for biomass to secondary energy carriers [45–47].
R. Saidur et al. / Renewable and Sustainable Energy Reviews 15 (2011) 2262–2289 2273
Fig. 11. Fractionation of biomass pyrolysis products [47].
Table 9Examples of ash compositions of sunflower stalk and rapeseed expeller; ashed at575 ◦C.
Elements Sunflower stalk (wt %) Rapessed expeller (wt %)
SiO2 3.1 0.0Al2O2 0.1 0.0Fe2O3 0.2 0.3CaO 6.6 15.0MgO 4.3 9.0K2O 27.5 22.8
(df
gt
c[
2
wepif
2
dacitem
Table 10HHV correlations and their evaluations.
No. Correlation (HHV, MJ/kg) Reference
Based on proximate analysis1 HHV = 0.196(FC) + 14.119 [33,49,50]2 HHV = 0.312(FC) + 0.1534(VM)3 HHV = 0.3543(FC) + 0.1798(VM)4 HHV = 19.914 − 0.2324Ash5 HHV = 14.2 + 0.38(FC) − 9.0721(FC)2
Based on structural analysis6 HHV = 0.0889(L) + 16.8218 [49]7 HHV = 0.1739Ce + 0.26631(1 − Ce) [51]8 HHV = 0.4373C − 1.6701 [51]9 HHV = 0.335(C) + 1.423(H) − 0.1540
Na2O 0.0 0.0P2O5 18.5 41.1Others 39.7 11.8
4–6 MJ/m3) caloric value gas. This process also allows for the pro-uction of methanol or hydrogen, each of which may have a gooduture as fuels.
Demirbas [31] shows that the gas produced from biomass in theasifier typically has a heating value of 300–400 Btu/scf (HHV) andhe composition of the gas is as follows:
Hydrogen 30–40%, carbon monoxide 20–30%, methane 10–15%,arbon dioxide 15–20%, ethylene 1%, water 6%, nitrogen 1%31,44,48].
.5.3. Direct combustionBiomass can be burned directly in waste-to-energy plants
ithout any chemicals processing to produce steam for makinglectricity. Direct combustion and co-firing with coal for electricityroduction from biomass has been found to be a promising method
n the nearest future. Also biomass can be burned to provide heator industries and homes [14].
.5.4. FermentationFermentation is the process by which ethanol fuel can be pro-
uced. There are several types of process that can produce anlcohol (ethanol) from various plants, especially corn. The two mostommonly used processes involve using yeast to ferment the starch
n the plant to produce ethanol which can be used as a fuel in theransportation sector. One of the newest processes involves usingnzymes to break down the cellulose in the plant’s fibers, allowingore ethanol to be made from each plant [13,44,99,100,102,106].10 HHV = 0.335C + 1.423(H) − 0.154(O)0.145(N) [14]11 HHV = 0.3516(C) + 1.16225(H) − 0.1109(O) +
0.0628(N) + 0.10465(S)[52]
2.5.5. Anaerobic digestionDigestion is the biochemical conversion of organic material
to biogas, a mixture of mainly methane and carbon dioxide. Thebiomass is converted by bacteria in an anaerobic environment inabsence of oxygen. Anaerobic digestion is a commercially proventechnology and is widely used for treating wet organic wastes. Bio-gas can be used in many different applications. It can be upgradedto natural gas quality and applied in grids [14,44].
2.5.6. Chemical conversionBiomass can be converted into gas or liquid fuels by using chem-
icals or heat. In India cow manure is converted to methane gas toproduce electricity. Methane gas can be converted to methanol, aliquid form of methane [12,13].
2.6. Estimating the higher heating value of biomass
There are so many correlations available in the literature tocalculate higher heating value of biomass. In this paper the correla-tions are combined into three groups according to the approaches
used; estimating the HHV based on the proximate, ultimate andstructural analysis ten correlations proposed and/or applied forestimating the biomass HHV were collected from the literature andshown in Table 10.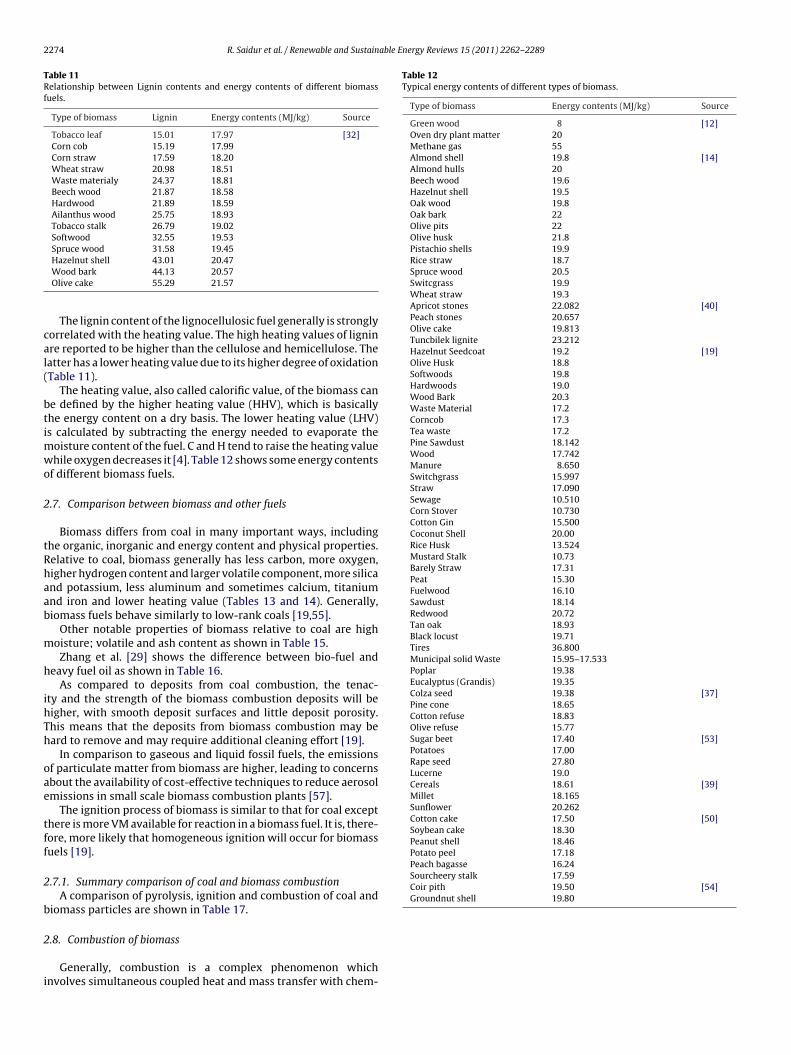
2274 R. Saidur et al. / Renewable and Sustainable Energy Reviews 15 (2011) 2262–2289
Table 11Relationship between Lignin contents and energy contents of different biomassfuels.
Type of biomass Lignin Energy contents (MJ/kg) Source
Tobacco leaf 15.01 17.97 [32]Corn cob 15.19 17.99Corn straw 17.59 18.20Wheat straw 20.98 18.51Waste materialy 24.37 18.81Beech wood 21.87 18.58Hardwood 21.89 18.59Ailanthus wood 25.75 18.93Tobacco stalk 26.79 19.02Softwood 32.55 19.53Spruce wood 31.58 19.45
cal(
btimwo
2
tRhaab
m
h
ihTh
oae
tff
2
b
2
i
Table 12Typical energy contents of different types of biomass.
Type of biomass Energy contents (MJ/kg) Source
Green wood 8 [12]Oven dry plant matter 20Methane gas 55Almond shell 19.8 [14]Almond hulls 20Beech wood 19.6Hazelnut shell 19.5Oak wood 19.8Oak bark 22Olive pits 22Olive husk 21.8Pistachio shells 19.9Rice straw 18.7Spruce wood 20.5Switcgrass 19.9Wheat straw 19.3Apricot stones 22.082 [40]Peach stones 20.657Olive cake 19.813Tuncbilek lignite 23.212Hazelnut Seedcoat 19.2 [19]Olive Husk 18.8Softwoods 19.8Hardwoods 19.0Wood Bark 20.3Waste Material 17.2Corncob 17.3Tea waste 17.2Pine Sawdust 18.142Wood 17.742Manure 8.650Switchgrass 15.997Straw 17.090Sewage 10.510Corn Stover 10.730Cotton Gin 15.500Coconut Shell 20.00Rice Husk 13.524Mustard Stalk 10.73Barely Straw 17.31Peat 15.30Fuelwood 16.10Sawdust 18.14Redwood 20.72Tan oak 18.93Black locust 19.71Tires 36.800Municipal solid Waste 15.95–17.533Poplar 19.38Eucalyptus (Grandis) 19.35Colza seed 19.38 [37]Pine cone 18.65Cotton refuse 18.83Olive refuse 15.77Sugar beet 17.40 [53]Potatoes 17.00Rape seed 27.80Lucerne 19.0Cereals 18.61 [39]Millet 18.165Sunflower 20.262Cotton cake 17.50 [50]Soybean cake 18.30Peanut shell 18.46Potato peel 17.18Peach bagasse 16.24Sourcheery stalk 17.59Coir pith 19.50 [54]Groundnut shell 19.80
Hazelnut shell 43.01 20.47Wood bark 44.13 20.57Olive cake 55.29 21.57
The lignin content of the lignocellulosic fuel generally is stronglyorrelated with the heating value. The high heating values of ligninre reported to be higher than the cellulose and hemicellulose. Theatter has a lower heating value due to its higher degree of oxidationTable 11).
The heating value, also called calorific value, of the biomass cane defined by the higher heating value (HHV), which is basicallyhe energy content on a dry basis. The lower heating value (LHV)s calculated by subtracting the energy needed to evaporate the
oisture content of the fuel. C and H tend to raise the heating valuehile oxygen decreases it [4]. Table 12 shows some energy contents
f different biomass fuels.
.7. Comparison between biomass and other fuels
Biomass differs from coal in many important ways, includinghe organic, inorganic and energy content and physical properties.elative to coal, biomass generally has less carbon, more oxygen,igher hydrogen content and larger volatile component, more silicand potassium, less aluminum and sometimes calcium, titaniumnd iron and lower heating value (Tables 13 and 14). Generally,iomass fuels behave similarly to low-rank coals [19,55].
Other notable properties of biomass relative to coal are highoisture; volatile and ash content as shown in Table 15.Zhang et al. [29] shows the difference between bio-fuel and
eavy fuel oil as shown in Table 16.As compared to deposits from coal combustion, the tenac-
ty and the strength of the biomass combustion deposits will beigher, with smooth deposit surfaces and little deposit porosity.his means that the deposits from biomass combustion may beard to remove and may require additional cleaning effort [19].
In comparison to gaseous and liquid fossil fuels, the emissionsf particulate matter from biomass are higher, leading to concernsbout the availability of cost-effective techniques to reduce aerosolmissions in small scale biomass combustion plants [57].
The ignition process of biomass is similar to that for coal excepthere is more VM available for reaction in a biomass fuel. It is, there-ore, more likely that homogeneous ignition will occur for biomassuels [19].
.7.1. Summary comparison of coal and biomass combustionA comparison of pyrolysis, ignition and combustion of coal and
iomass particles are shown in Table 17.
.8. Combustion of biomass
Generally, combustion is a complex phenomenon whichnvolves simultaneous coupled heat and mass transfer with chem-
R. Saidur et al. / Renewable and Sustainable Energy Reviews 15 (2011) 2262–2289 2275
Table 13Physical, chemical and fuel properties of biomass and coal fuels.
Property Biomass Coal Reference
Fuel density 500 1300 [10]Particle size (mm) 3 100C content (wet % of dry fuel) 43–54 65–85O content (wet % of dry fuel) 35–45 2–15S content (wet % of dry fuel) Max 0.5 0.5–7.5SiO2content (wet % of dry fuel) 23–49 40–60K2Ocontent (wet % of dry fuel) 4–48 2–6AL2O3 content (wet % of dry fuel) 2.4–9.5 15–25
ippomtcdmbt
igcTmtmpadgc
cm
Table 16Typical properties of wood pyrolysis bio-oil and of heavy fuel oil [29].
Physical property Bio-oil Heavy fuel oil
Moisture Content (wt %) 15–30 0.10pH 2.50 –Specific gravity 1.20 0.94Elemental compositionC 54–58 85H 5.5–7.0 11O 35–40 1.0N 0–0.2 0.30Ash 0–0.2 0.10HHV (MJ/kg) 16–19 40Viscosity (at 50 ◦C) 40–100 180Solids (wt%) 0.2–1 1Distillation residue (wt%) Up to 50 1
Table 17Comparative properties of biomass and coal [19].
Properties Comparison
Pyrolysis Starts earlier for biomass fuels comparedto coal fuels and releases CO, CO2 and H2O
Volatile matter Higher in biomass compared to that of coal.Heating value volatiles Specific heating value of volatiles in kJ per
kg is lower for biomass fuels compared tothose from coal fuel.
Heat contribution by volatiles The fractional heat contribution byvolatiles in biomass is of the order of, 70%compared to,36% for coal
Oxygen contents Biomass char has more oxygen comparedto coal.
have commonly been used to investigate the reactivities of car-
Tp
TM
Fe2O3content (wet % of dry fuel) 1.5–8.5 8–18Ignition temperature 418–426 490–595Heating value 14–21 23–28
cal reaction and fluid flow. The prediction of combustion for theurposes of design requires knowledge of fuel properties and com-ositions and the manner in which these factors might influence theutcome of the combustion process. It has been found that, biomassaterials show different combustion characteristics according to
heir elemental composition. Biomass combustion is a series ofhemical reactions by which mainly carbon is oxidized to carbonioxide, and hydrogen is oxidized to water. However, there areany elements that go into the combustion. Reaction for the com-
ustion of a biomass fuel in air might take the following form, wherehe first reactant compound is a biomass fuel.
Cx1Hx2Ox3Nx4Sx5Clx6Six7Kx8Cax9Mgx10Nax11Px12Fex13Alx14Tix15
+ nH2O + n2(1 + e)(O2 + 3.76N2) = n3CO2 + n4H2O
+ n5O2 + n6N2 + n7CO + n8CH4 + n9NO + n10NO2 + n11SO2
+ n12HCl + n13KCl + n14K2SO4 + n15C + · · · + Energy
The inclusion of 15 elements in the empirical formula for the fuels incomplete. There are many more, especially with respect to inor-anic constituents which are very important to the issue of biomassombustion and associated problems such as fouling and slagging.he second reactant term expresses the moisture in the fuel. If toouch moisture is present, the fuel will not spontaneously react. The
hird term represents air and is represented by the simple binaryixture of oxygen and nitrogen in the volume ratio of 21–79%. The
roduct side of the reaction is complex. The main products are thoseppearing first, but there are other products which are produceduring combustion such as CO, hydrocarbons HC, oxides of nitro-en and sulfur as well as the inorganic species such as the alkali
hlorides, sulfates, carbonates and silicates [14,42].Fuel properties for the combustion analysis of biomass fuelsan be conveniently grouped into physical, chemical, thermal, andineral properties.
able 14roperties of coal and different biomass fuels [56].
Fuel name Coal Swedish wood Straw
Inherent moisture (%) 4.38 9.53 8.3Ash content (%) 12.12 1.82 14.2Volatile content (%) 32.50 81.32 72.0Carbon content (%) 68.80 44.97 38.4Gross calorific value (kJ/kg) 27443.5 17210.5 15353.5Bulk density (kg/m3) 1300 500 500
able 15oisture, volatile and ash content of coal and biomass fuels.
Fuel Moisture (% of fuel) Ash (% of fuel)
Coal 4.8 ± 2.6 8.3 ± 1.5Oak wood 6.5 ± 0.8 0.5 ± 0.1Wheat straw 7.3 ± 1 12.7 ± 3.6
Ash contents Biomass fuels have ash that is morealkaline in nature, which may exaggeratethe fouling problems
Physical properties include density; porosity, particle size, andshape distribution are related to fuel preparation methods. Impor-tant chemical properties for combustion are the elemental analysis,proximate analysis, higher heating value. Thermal property valuessuch as specific heat, thermal conductivity, and emissivity vary withmoisture content, temperature, and degree of thermal degradationby one order of magnitude [14].
Biomass offers important advantages as a combustion feedstockbecause of the high volatility of the fuel and the high reactivity ofboth the fuel and the resulting char [14].
Isothermal and non-isothermal thermogravimetric techniques
bonaceous materials. A plot of the rate of weight loss againsttemperature while burning a sample under an oxidizing atmo-sphere is referred to as the “burning profile”. The burning profilesof the biomass samples are shown in Figs. 12–16. The first peak
Palm kernels Wood pellets High-protein biomass
1 9.3 5.43 1.954 4.24 2.55 27.880 71.63 79.16 79.126 44.20 47.91 40.73
18719.0 18710.5 17449.5500 500 NA
Volatile matter (% of fuel) Reference
2.4 ± 5.9 [31]78.6 ± 3.864.0 ± 5.1
2276 R. Saidur et al. / Renewable and Sustainable Energy Reviews 15 (2011) 2262–2289
Fig. 12. Burning profile of sunflower shell [10].
Fig. 13. Burning profile of colza seed [10].
osstao
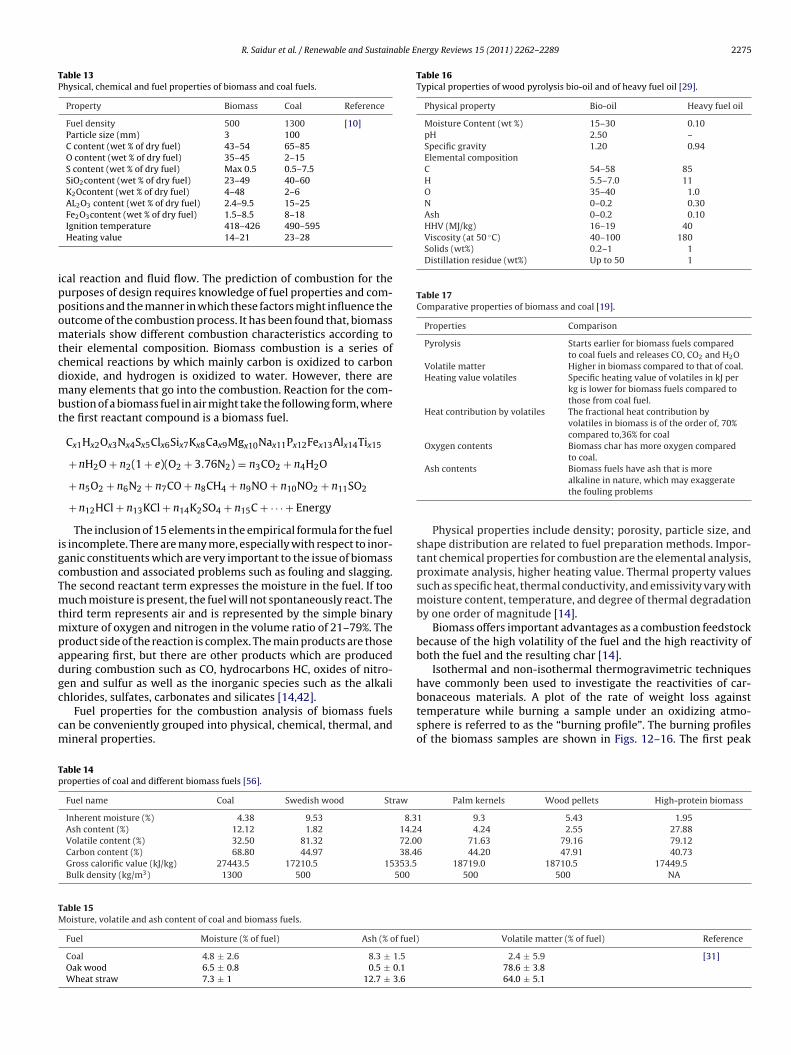
Fig. 15. Burning profile of cotton refuse [10].
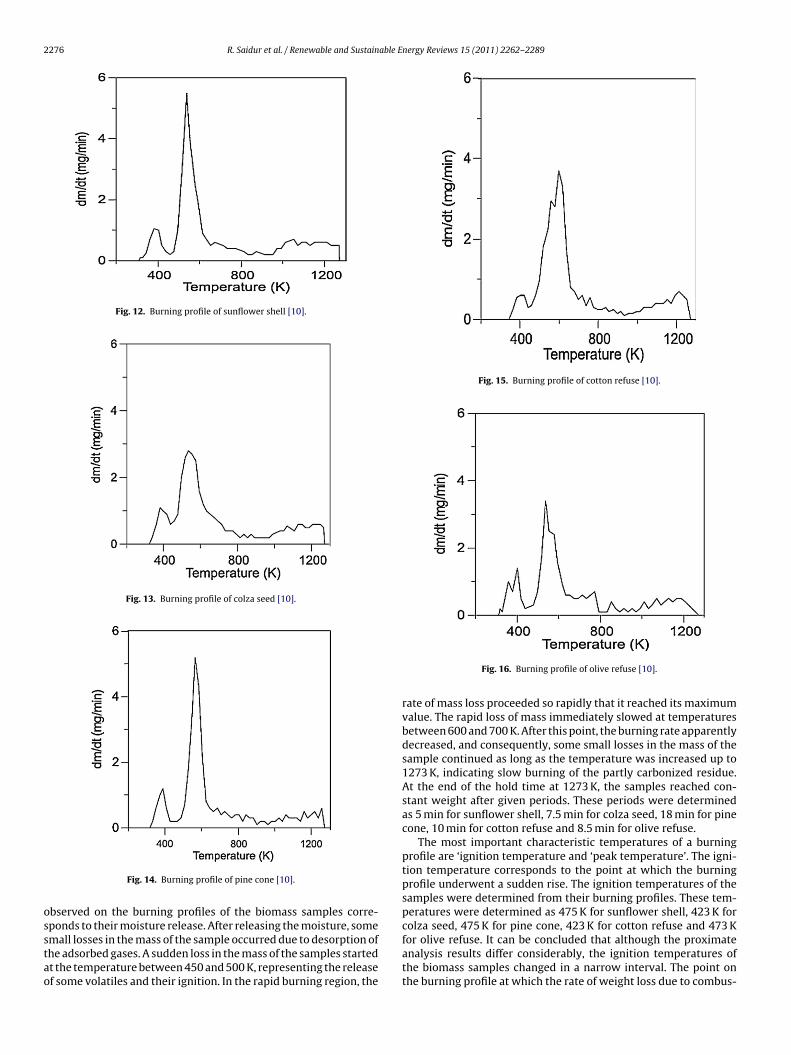
Fig. 14. Burning profile of pine cone [10].
bserved on the burning profiles of the biomass samples corre-
ponds to their moisture release. After releasing the moisture, somemall losses in the mass of the sample occurred due to desorption ofhe adsorbed gases. A sudden loss in the mass of the samples startedt the temperature between 450 and 500 K, representing the releasef some volatiles and their ignition. In the rapid burning region, theFig. 16. Burning profile of olive refuse [10].
rate of mass loss proceeded so rapidly that it reached its maximumvalue. The rapid loss of mass immediately slowed at temperaturesbetween 600 and 700 K. After this point, the burning rate apparentlydecreased, and consequently, some small losses in the mass of thesample continued as long as the temperature was increased up to1273 K, indicating slow burning of the partly carbonized residue.At the end of the hold time at 1273 K, the samples reached con-stant weight after given periods. These periods were determinedas 5 min for sunflower shell, 7.5 min for colza seed, 18 min for pinecone, 10 min for cotton refuse and 8.5 min for olive refuse.
The most important characteristic temperatures of a burningprofile are ‘ignition temperature and ‘peak temperature’. The igni-tion temperature corresponds to the point at which the burningprofile underwent a sudden rise. The ignition temperatures of thesamples were determined from their burning profiles. These tem-peratures were determined as 475 K for sunflower shell, 423 K for
colza seed, 475 K for pine cone, 423 K for cotton refuse and 473 Kfor olive refuse. It can be concluded that although the proximateanalysis results differ considerably, the ignition temperatures ofthe biomass samples changed in a narrow interval. The point onthe burning profile at which the rate of weight loss due to combus-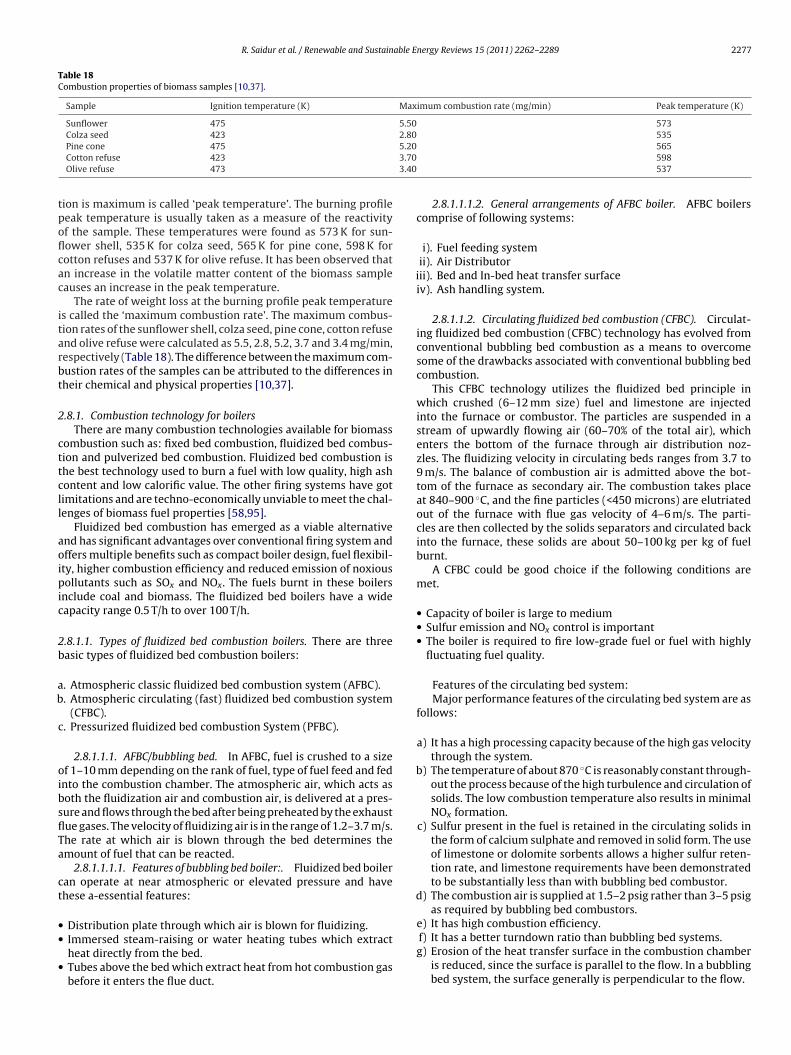
R. Saidur et al. / Renewable and Sustainable Energy Reviews 15 (2011) 2262–2289 2277
Table 18Combustion properties of biomass samples [10,37].
Sample Ignition temperature (K) Maximum combustion rate (mg/min) Peak temperature (K)
Sunflower 475 5.50 5732.805.203.703.40
tpoflcac
itarbt
2
cttcll
aoipic
2b
ab
c
oibsflTa
ct
••
•
i
b
d
Colza seed 423Pine cone 475Cotton refuse 423Olive refuse 473
ion is maximum is called ‘peak temperature’. The burning profileeak temperature is usually taken as a measure of the reactivityf the sample. These temperatures were found as 573 K for sun-ower shell, 535 K for colza seed, 565 K for pine cone, 598 K forotton refuses and 537 K for olive refuse. It has been observed thatn increase in the volatile matter content of the biomass sampleauses an increase in the peak temperature.
The rate of weight loss at the burning profile peak temperatures called the ‘maximum combustion rate’. The maximum combus-ion rates of the sunflower shell, colza seed, pine cone, cotton refusend olive refuse were calculated as 5.5, 2.8, 5.2, 3.7 and 3.4 mg/min,espectively (Table 18). The difference between the maximum com-ustion rates of the samples can be attributed to the differences inheir chemical and physical properties [10,37].
.8.1. Combustion technology for boilersThere are many combustion technologies available for biomass
ombustion such as: fixed bed combustion, fluidized bed combus-ion and pulverized bed combustion. Fluidized bed combustion ishe best technology used to burn a fuel with low quality, high ashontent and low calorific value. The other firing systems have gotimitations and are techno-economically unviable to meet the chal-enges of biomass fuel properties [58,95].
Fluidized bed combustion has emerged as a viable alternativend has significant advantages over conventional firing system andffers multiple benefits such as compact boiler design, fuel flexibil-ty, higher combustion efficiency and reduced emission of noxiousollutants such as SOx and NOx. The fuels burnt in these boilers
nclude coal and biomass. The fluidized bed boilers have a wideapacity range 0.5 T/h to over 100 T/h.
.8.1.1. Types of fluidized bed combustion boilers. There are threeasic types of fluidized bed combustion boilers:
. Atmospheric classic fluidized bed combustion system (AFBC).
. Atmospheric circulating (fast) fluidized bed combustion system(CFBC).
. Pressurized fluidized bed combustion System (PFBC).
2.8.1.1.1. AFBC/bubbling bed. In AFBC, fuel is crushed to a sizef 1–10 mm depending on the rank of fuel, type of fuel feed and fednto the combustion chamber. The atmospheric air, which acts asoth the fluidization air and combustion air, is delivered at a pres-ure and flows through the bed after being preheated by the exhaustue gases. The velocity of fluidizing air is in the range of 1.2–3.7 m/s.he rate at which air is blown through the bed determines themount of fuel that can be reacted.
2.8.1.1.1.1. Features of bubbling bed boiler:. Fluidized bed boileran operate at near atmospheric or elevated pressure and havehese a-essential features:
Distribution plate through which air is blown for fluidizing.Immersed steam-raising or water heating tubes which extractheat directly from the bed.Tubes above the bed which extract heat from hot combustion gasbefore it enters the flue duct.
535565598537
2.8.1.1.1.2. General arrangements of AFBC boiler. AFBC boilerscomprise of following systems:
i). Fuel feeding systemii). Air Distributorii). Bed and In-bed heat transfer surfaceiv). Ash handling system.
2.8.1.1.2. Circulating fluidized bed combustion (CFBC). Circulat-ing fluidized bed combustion (CFBC) technology has evolved fromconventional bubbling bed combustion as a means to overcomesome of the drawbacks associated with conventional bubbling bedcombustion.
This CFBC technology utilizes the fluidized bed principle inwhich crushed (6–12 mm size) fuel and limestone are injectedinto the furnace or combustor. The particles are suspended in astream of upwardly flowing air (60–70% of the total air), whichenters the bottom of the furnace through air distribution noz-zles. The fluidizing velocity in circulating beds ranges from 3.7 to9 m/s. The balance of combustion air is admitted above the bot-tom of the furnace as secondary air. The combustion takes placeat 840–900 ◦C, and the fine particles (<450 microns) are elutriatedout of the furnace with flue gas velocity of 4–6 m/s. The parti-cles are then collected by the solids separators and circulated backinto the furnace, these solids are about 50–100 kg per kg of fuelburnt.
A CFBC could be good choice if the following conditions aremet.
• Capacity of boiler is large to medium• Sulfur emission and NOx control is important• The boiler is required to fire low-grade fuel or fuel with highly
fluctuating fuel quality.
Features of the circulating bed system:Major performance features of the circulating bed system are as
follows:
a) It has a high processing capacity because of the high gas velocitythrough the system.
) The temperature of about 870 ◦C is reasonably constant through-out the process because of the high turbulence and circulation ofsolids. The low combustion temperature also results in minimalNOx formation.
c) Sulfur present in the fuel is retained in the circulating solids inthe form of calcium sulphate and removed in solid form. The useof limestone or dolomite sorbents allows a higher sulfur reten-tion rate, and limestone requirements have been demonstratedto be substantially less than with bubbling bed combustor.
) The combustion air is supplied at 1.5–2 psig rather than 3–5 psigas required by bubbling bed combustors.
e) It has high combustion efficiency.f) It has a better turndown ratio than bubbling bed systems.g) Erosion of the heat transfer surface in the combustion chamber
is reduced, since the surface is parallel to the flow. In a bubblingbed system, the surface generally is perpendicular to the flow.
2 able E
biv
2
278 R. Saidur et al. / Renewable and Sustain
2.8.1.1.3. Pressurized fluid bed combustion. Pressurized fluided combustion (PFBC) is a variation of fluid bed technology that
s meant for large-scale coal burning applications. In PFBC, the bedessel is operated at pressure up to 16 kg/cm2.
.8.1.2. Advantages of fluidized bed combustion boilers.
i). High EfficiencyFBC boilers can burn fuel with a combustion efficiency of
over 95% irrespective of ash content. FBC boilers can operatewith overall efficiency of 84% (±2%).
ii). Reduction in boiler size.High heat transfer rate over a small heat transfer area
immersed in the bed result in overall size reduction of theboiler.
iii). Fuel flexibilityFBC boilers can be operated efficiently with a variety of
fuels. Even fuels like flotation slimes, washer rejects, agrowaste can be burnt efficiently. These can be fed either inde-pendently or in combination with coal into the same furnace.
iv). Ability to burn low grade fuelFBC boilers would give the rated output even with inferior
quality fuel. The boilers can fire coals with ash content as highas 62% and having calorific value as low as 2500 kcal/kg. Evencarbon content of only 1% by weight can sustain the fluidizedbed combustion.
v). Ability to Burn FinesCoal containing fines below 6 mm can be burnt efficiently
in FBC boiler, which is very difficult to achieve in conven-tional firing system.
vi). Pollution ControlSO2 formation can be greatly minimized by addition of
limestone or dolomite for high sulfur coals. 3% limestone isrequired for every 1% sulfur in the coal feed. Low combustiontemperature eliminates NOx formation.
vii). Low Corrosion and ErosionThe corrosion and erosion effects are less due to lower
combustion temperature, softness of ash and low particlevelocity (of the order of 1 m/s).
viii). Easier ash removal – no clinker formationSince the temperature of the furnace is in the range
of 750–900 ◦C in FBC boilers, even coal of low ash fusiontemperature can be burnt without clinker formation. Ashremoval is easier as the ash flows like liquid from the com-bustion chamber. Hence less manpower is required for ashhandling.
ix). Less excess air–higher CO2 in flue gasThe CO2 in the flue gases will be of the order of 14–15% at
full load. Hence, the FBC boiler can operate at low excess air– only 20–25%.
x). Simple operation, quick start-upHigh turbulence of the bed facilitates quick start up and
shut down. Full automation of start up and operation usingreliable equipment is possible.
xi). Fast response to load fluctuations inherent high thermalstorage characteristics can easily absorb fluctuation in fuelfeed rates. Response to changing load is comparable to thatof oil fired boilers.
xii). No Slagging in the Furnace-No Soot Blowing
In FBC boilers, volatilization of alkali compo-nents in ash does not take place and the ash is nonsticky. This means that there is no slagging or sootblowing.
xiii). Provisions of automatic coal and ash handlingsystem
nergy Reviews 15 (2011) 2262–2289
Automatic systems for coal and ash handling can be incor-porated, making the plant easy to operate comparable to oilor gas fired installation.
xiv). Provision of automatic ignition systemControl systems using micro-processors and automatic
ignition equipment give excellent control with minimummanual supervision.
xv). High reliabilityThe absence of moving parts in the combustion zone
results in a high degree of reliability and low maintenancecosts.
xvi). Reduced MaintenanceRoutine overhauls are infrequent and high efficiency is
maintained for long periods.xvii). Quick responses to changing demand
A fluidized bed combustor can respond to changing heatdemands more easily than stoker fired systems. This makesit very suitable for applications such as thermal fluid heaters,which require rapid responses.
xviii). High efficiency of power generationBy operating the fluidized bed at elevated pressure, it can
be used to generate hot pressurized gases to power a gasturbine. This can be combined with a conventional steamturbine to improve the efficiency of electricity generationand give a potential fuel savings of at least 4% [58].
2.9. Co-firing of biomass and coal
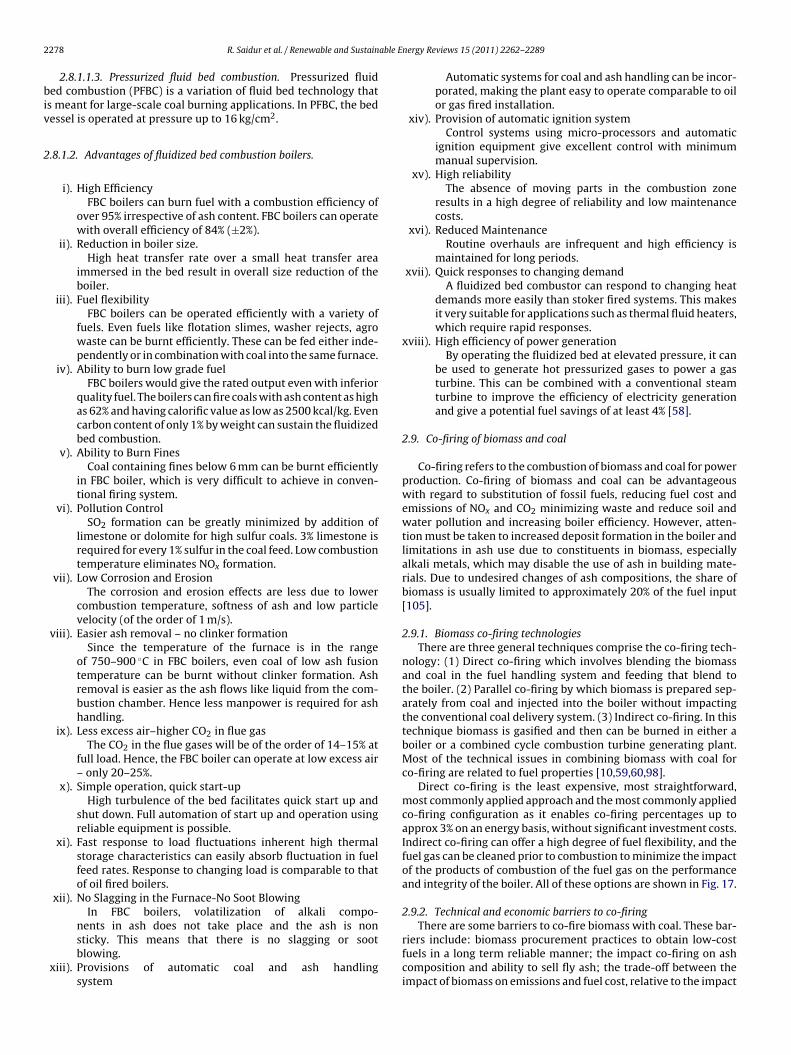
Co-firing refers to the combustion of biomass and coal for powerproduction. Co-firing of biomass and coal can be advantageouswith regard to substitution of fossil fuels, reducing fuel cost andemissions of NOx and CO2 minimizing waste and reduce soil andwater pollution and increasing boiler efficiency. However, atten-tion must be taken to increased deposit formation in the boiler andlimitations in ash use due to constituents in biomass, especiallyalkali metals, which may disable the use of ash in building mate-rials. Due to undesired changes of ash compositions, the share ofbiomass is usually limited to approximately 20% of the fuel input[105].
2.9.1. Biomass co-firing technologiesThere are three general techniques comprise the co-firing tech-
nology: (1) Direct co-firing which involves blending the biomassand coal in the fuel handling system and feeding that blend tothe boiler. (2) Parallel co-firing by which biomass is prepared sep-arately from coal and injected into the boiler without impactingthe conventional coal delivery system. (3) Indirect co-firing. In thistechnique biomass is gasified and then can be burned in either aboiler or a combined cycle combustion turbine generating plant.Most of the technical issues in combining biomass with coal forco-firing are related to fuel properties [10,59,60,98].
Direct co-firing is the least expensive, most straightforward,most commonly applied approach and the most commonly appliedco-firing configuration as it enables co-firing percentages up toapprox 3% on an energy basis, without significant investment costs.Indirect co-firing can offer a high degree of fuel flexibility, and thefuel gas can be cleaned prior to combustion to minimize the impactof the products of combustion of the fuel gas on the performanceand integrity of the boiler. All of these options are shown in Fig. 17.
2.9.2. Technical and economic barriers to co-firing
There are some barriers to co-fire biomass with coal. These bar-riers include: biomass procurement practices to obtain low-costfuels in a long term reliable manner; the impact co-firing on ashcomposition and ability to sell fly ash; the trade-off between theimpact of biomass on emissions and fuel cost, relative to the impact
R. Saidur et al. / Renewable and Sustainable Energy Reviews 15 (2011) 2262–2289 2279
Table 19Emissions factor from switch grass and coal [34].
Emission species CO2 N2O
Emission factor (g/kg Switch grass) 1525 0.09Emission factors (g/kg coal) 2085 0.03
Fig. 17. Biomass co-firing technologies. (a) Direct co-firing. (b) Indirect co-firing. (c)Parallel co-firing [60]. Technical and economic barriers to co-firing.
Table 20Emissions factor from electricity generation in the UK [23].
Fuel Emission factor (g/kWh)
CO2 SO2 NOx
Poultry litter 10 2.42 3.90Forestry residues 24 0.06 0.57
oB
2
2
fcBcMuuafts
since biomass are renewable. Recently some studies have shown
Animal slurry 31 1.12 2.38Natural gas 446 0.0 0.5Coal 955 11.80 4.3
f biomass on boiler efficiency and plant net station heat rate intu/kWh [107].
.10. The impacts of biomass
.10.1. Emissions reduction of biomassEnvironmentally, biomass is considered as an environmentally
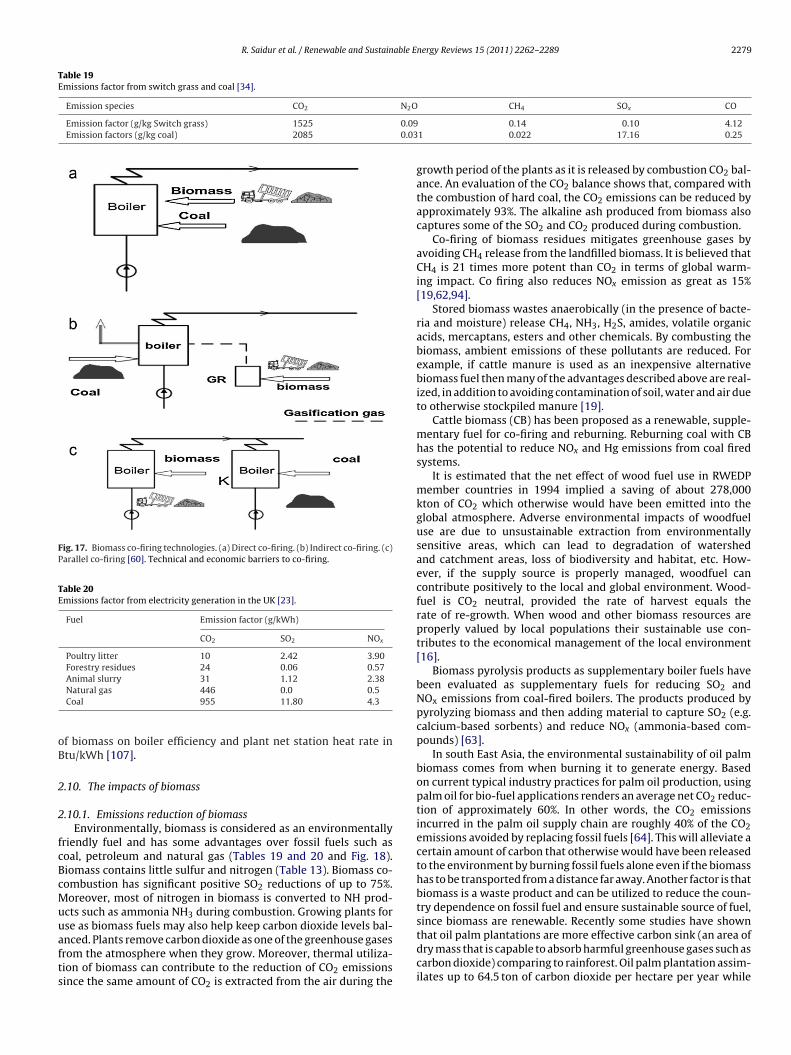
riendly fuel and has some advantages over fossil fuels such asoal, petroleum and natural gas (Tables 19 and 20 and Fig. 18).iomass contains little sulfur and nitrogen (Table 13). Biomass co-ombustion has significant positive SO2 reductions of up to 75%.oreover, most of nitrogen in biomass is converted to NH prod-
cts such as ammonia NH3 during combustion. Growing plants forse as biomass fuels may also help keep carbon dioxide levels bal-
nced. Plants remove carbon dioxide as one of the greenhouse gasesrom the atmosphere when they grow. Moreover, thermal utiliza-ion of biomass can contribute to the reduction of CO2 emissionsince the same amount of CO2 is extracted from the air during theCH4 SOx CO
0.14 0.10 4.121 0.022 17.16 0.25
growth period of the plants as it is released by combustion CO2 bal-ance. An evaluation of the CO2 balance shows that, compared withthe combustion of hard coal, the CO2 emissions can be reduced byapproximately 93%. The alkaline ash produced from biomass alsocaptures some of the SO2 and CO2 produced during combustion.
Co-firing of biomass residues mitigates greenhouse gases byavoiding CH4 release from the landfilled biomass. It is believed thatCH4 is 21 times more potent than CO2 in terms of global warm-ing impact. Co firing also reduces NOx emission as great as 15%[19,62,94].
Stored biomass wastes anaerobically (in the presence of bacte-ria and moisture) release CH4, NH3, H2S, amides, volatile organicacids, mercaptans, esters and other chemicals. By combusting thebiomass, ambient emissions of these pollutants are reduced. Forexample, if cattle manure is used as an inexpensive alternativebiomass fuel then many of the advantages described above are real-ized, in addition to avoiding contamination of soil, water and air dueto otherwise stockpiled manure [19].
Cattle biomass (CB) has been proposed as a renewable, supple-mentary fuel for co-firing and reburning. Reburning coal with CBhas the potential to reduce NOx and Hg emissions from coal firedsystems.
It is estimated that the net effect of wood fuel use in RWEDPmember countries in 1994 implied a saving of about 278,000kton of CO2 which otherwise would have been emitted into theglobal atmosphere. Adverse environmental impacts of woodfueluse are due to unsustainable extraction from environmentallysensitive areas, which can lead to degradation of watershedand catchment areas, loss of biodiversity and habitat, etc. How-ever, if the supply source is properly managed, woodfuel cancontribute positively to the local and global environment. Wood-fuel is CO2 neutral, provided the rate of harvest equals therate of re-growth. When wood and other biomass resources areproperly valued by local populations their sustainable use con-tributes to the economical management of the local environment[16].
Biomass pyrolysis products as supplementary boiler fuels havebeen evaluated as supplementary fuels for reducing SO2 andNOx emissions from coal-fired boilers. The products produced bypyrolyzing biomass and then adding material to capture SO2 (e.g.calcium-based sorbents) and reduce NOx (ammonia-based com-pounds) [63].
In south East Asia, the environmental sustainability of oil palmbiomass comes from when burning it to generate energy. Basedon current typical industry practices for palm oil production, usingpalm oil for bio-fuel applications renders an average net CO2 reduc-tion of approximately 60%. In other words, the CO2 emissionsincurred in the palm oil supply chain are roughly 40% of the CO2emissions avoided by replacing fossil fuels [64]. This will alleviate acertain amount of carbon that otherwise would have been releasedto the environment by burning fossil fuels alone even if the biomasshas to be transported from a distance far away. Another factor is thatbiomass is a waste product and can be utilized to reduce the coun-try dependence on fossil fuel and ensure sustainable source of fuel,
that oil palm plantations are more effective carbon sink (an area ofdry mass that is capable to absorb harmful greenhouse gases such ascarbon dioxide) comparing to rainforest. Oil palm plantation assim-ilates up to 64.5 ton of carbon dioxide per hectare per year while
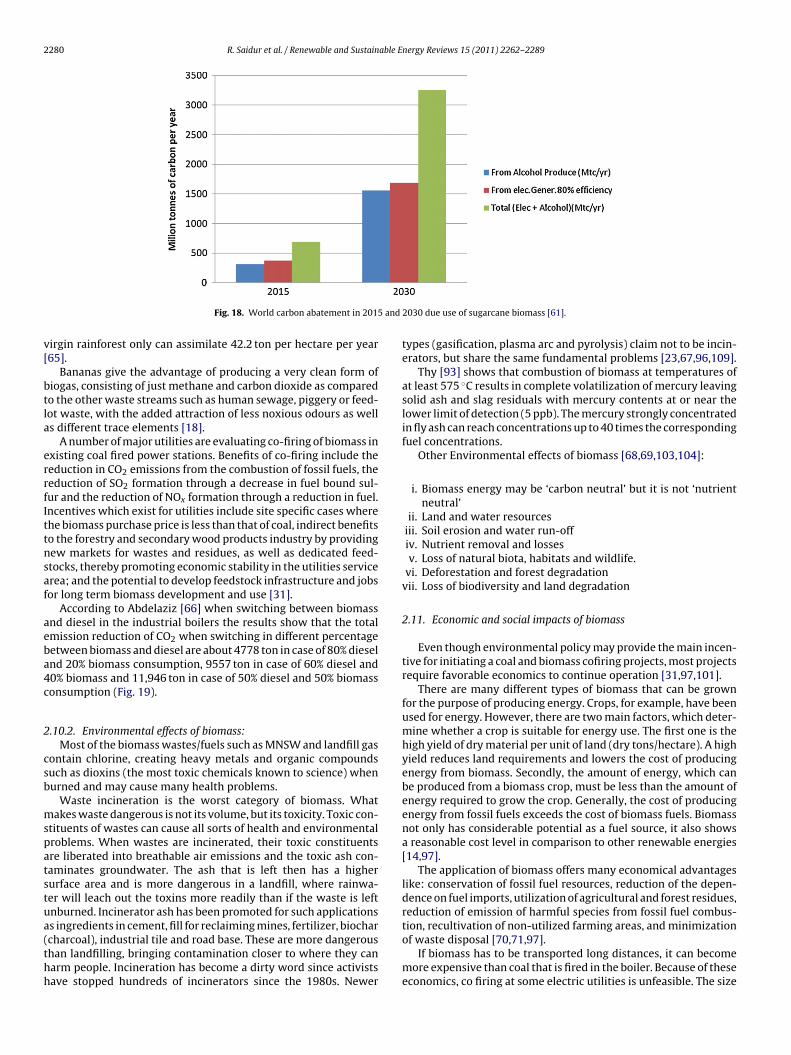
2280 R. Saidur et al. / Renewable and Sustainable Energy Reviews 15 (2011) 2262–2289
5 and
v[
btla
errfIttnsaf
aeba4c
2
csb
mspatstua(thh
Fig. 18. World carbon abatement in 201
irgin rainforest only can assimilate 42.2 ton per hectare per year65].
Bananas give the advantage of producing a very clean form ofiogas, consisting of just methane and carbon dioxide as comparedo the other waste streams such as human sewage, piggery or feed-ot waste, with the added attraction of less noxious odours as wells different trace elements [18].
A number of major utilities are evaluating co-firing of biomass inxisting coal fired power stations. Benefits of co-firing include theeduction in CO2 emissions from the combustion of fossil fuels, theeduction of SO2 formation through a decrease in fuel bound sul-ur and the reduction of NOx formation through a reduction in fuel.ncentives which exist for utilities include site specific cases wherehe biomass purchase price is less than that of coal, indirect benefitso the forestry and secondary wood products industry by providingew markets for wastes and residues, as well as dedicated feed-tocks, thereby promoting economic stability in the utilities servicerea; and the potential to develop feedstock infrastructure and jobsor long term biomass development and use [31].
According to Abdelaziz [66] when switching between biomassnd diesel in the industrial boilers the results show that the totalmission reduction of CO2 when switching in different percentageetween biomass and diesel are about 4778 ton in case of 80% dieselnd 20% biomass consumption, 9557 ton in case of 60% diesel and0% biomass and 11,946 ton in case of 50% diesel and 50% biomassonsumption (Fig. 19).
.10.2. Environmental effects of biomass:Most of the biomass wastes/fuels such as MNSW and landfill gas
ontain chlorine, creating heavy metals and organic compoundsuch as dioxins (the most toxic chemicals known to science) whenurned and may cause many health problems.
Waste incineration is the worst category of biomass. Whatakes waste dangerous is not its volume, but its toxicity. Toxic con-
tituents of wastes can cause all sorts of health and environmentalroblems. When wastes are incinerated, their toxic constituentsre liberated into breathable air emissions and the toxic ash con-aminates groundwater. The ash that is left then has a higherurface area and is more dangerous in a landfill, where rainwa-er will leach out the toxins more readily than if the waste is leftnburned. Incinerator ash has been promoted for such applications
s ingredients in cement, fill for reclaiming mines, fertilizer, biocharcharcoal), industrial tile and road base. These are more dangeroushan landfilling, bringing contamination closer to where they canarm people. Incineration has become a dirty word since activistsave stopped hundreds of incinerators since the 1980s. Newer2030 due use of sugarcane biomass [61].
types (gasification, plasma arc and pyrolysis) claim not to be incin-erators, but share the same fundamental problems [23,67,96,109].
Thy [93] shows that combustion of biomass at temperatures ofat least 575 ◦C results in complete volatilization of mercury leavingsolid ash and slag residuals with mercury contents at or near thelower limit of detection (5 ppb). The mercury strongly concentratedin fly ash can reach concentrations up to 40 times the correspondingfuel concentrations.
Other Environmental effects of biomass [68,69,103,104]:
i. Biomass energy may be ‘carbon neutral’ but it is not ‘nutrientneutral’
ii. Land and water resourcesiii. Soil erosion and water run-offiv. Nutrient removal and lossesv. Loss of natural biota, habitats and wildlife.
vi. Deforestation and forest degradationvii. Loss of biodiversity and land degradation
2.11. Economic and social impacts of biomass
Even though environmental policy may provide the main incen-tive for initiating a coal and biomass cofiring projects, most projectsrequire favorable economics to continue operation [31,97,101].
There are many different types of biomass that can be grownfor the purpose of producing energy. Crops, for example, have beenused for energy. However, there are two main factors, which deter-mine whether a crop is suitable for energy use. The first one is thehigh yield of dry material per unit of land (dry tons/hectare). A highyield reduces land requirements and lowers the cost of producingenergy from biomass. Secondly, the amount of energy, which canbe produced from a biomass crop, must be less than the amount ofenergy required to grow the crop. Generally, the cost of producingenergy from fossil fuels exceeds the cost of biomass fuels. Biomassnot only has considerable potential as a fuel source, it also showsa reasonable cost level in comparison to other renewable energies[14,97].
The application of biomass offers many economical advantageslike: conservation of fossil fuel resources, reduction of the depen-dence on fuel imports, utilization of agricultural and forest residues,reduction of emission of harmful species from fossil fuel combus-
tion, recultivation of non-utilized farming areas, and minimizationof waste disposal [70,71,97].If biomass has to be transported long distances, it can becomemore expensive than coal that is fired in the boiler. Because of theseeconomics, co firing at some electric utilities is unfeasible. The size
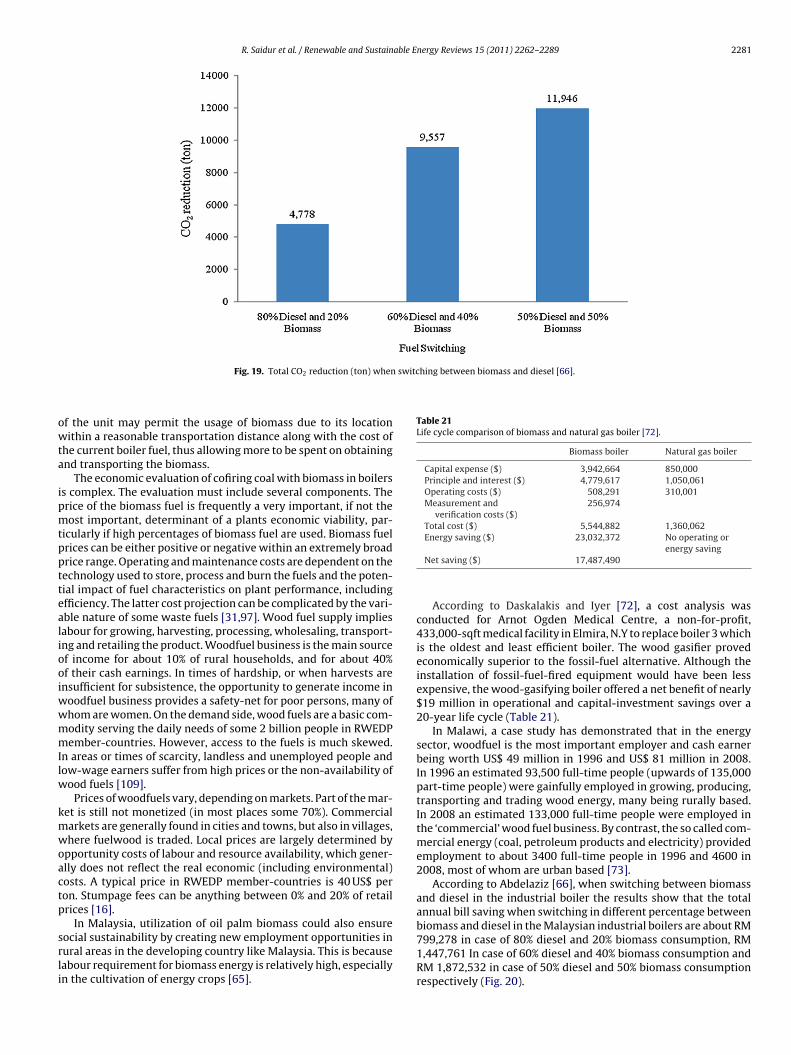
R. Saidur et al. / Renewable and Sustainable Energy Reviews 15 (2011) 2262–2289 2281
switching between biomass and diesel [66].
owta
ipmtppttealiooiwwmmIlw
kmwoactp
srli
Table 21Life cycle comparison of biomass and natural gas boiler [72].
Biomass boiler Natural gas boiler
Capital expense ($) 3,942,664 850,000Principle and interest ($) 4,779,617 1,050,061Operating costs ($) 508,291 310,001Measurement and
verification costs ($)256,974
Total cost ($) 5,544,882 1,360,062
Fig. 19. Total CO2 reduction (ton) when
f the unit may permit the usage of biomass due to its locationithin a reasonable transportation distance along with the cost of
he current boiler fuel, thus allowing more to be spent on obtainingnd transporting the biomass.
The economic evaluation of cofiring coal with biomass in boilerss complex. The evaluation must include several components. Therice of the biomass fuel is frequently a very important, if not theost important, determinant of a plants economic viability, par-
icularly if high percentages of biomass fuel are used. Biomass fuelrices can be either positive or negative within an extremely broadrice range. Operating and maintenance costs are dependent on theechnology used to store, process and burn the fuels and the poten-ial impact of fuel characteristics on plant performance, includingfficiency. The latter cost projection can be complicated by the vari-ble nature of some waste fuels [31,97]. Wood fuel supply impliesabour for growing, harvesting, processing, wholesaling, transport-ng and retailing the product. Woodfuel business is the main sourcef income for about 10% of rural households, and for about 40%f their cash earnings. In times of hardship, or when harvests arensufficient for subsistence, the opportunity to generate income in
oodfuel business provides a safety-net for poor persons, many ofhom are women. On the demand side, wood fuels are a basic com-odity serving the daily needs of some 2 billion people in RWEDPember-countries. However, access to the fuels is much skewed.
n areas or times of scarcity, landless and unemployed people andow-wage earners suffer from high prices or the non-availability of
ood fuels [109].Prices of woodfuels vary, depending on markets. Part of the mar-
et is still not monetized (in most places some 70%). Commercialarkets are generally found in cities and towns, but also in villages,here fuelwood is traded. Local prices are largely determined by
pportunity costs of labour and resource availability, which gener-lly does not reflect the real economic (including environmental)osts. A typical price in RWEDP member-countries is 40 US$ peron. Stumpage fees can be anything between 0% and 20% of retailrices [16].
In Malaysia, utilization of oil palm biomass could also ensureocial sustainability by creating new employment opportunities inural areas in the developing country like Malaysia. This is becauseabour requirement for biomass energy is relatively high, especiallyn the cultivation of energy crops [65].
Energy saving ($) 23,032,372 No operating orenergy saving
Net saving ($) 17,487,490
According to Daskalakis and Iyer [72], a cost analysis wasconducted for Arnot Ogden Medical Centre, a non-for-profit,433,000-sqft medical facility in Elmira, N.Y to replace boiler 3 whichis the oldest and least efficient boiler. The wood gasifier provedeconomically superior to the fossil-fuel alternative. Although theinstallation of fossil-fuel-fired equipment would have been lessexpensive, the wood-gasifying boiler offered a net benefit of nearly$19 million in operational and capital-investment savings over a20-year life cycle (Table 21).
In Malawi, a case study has demonstrated that in the energysector, woodfuel is the most important employer and cash earnerbeing worth US$ 49 million in 1996 and US$ 81 million in 2008.In 1996 an estimated 93,500 full-time people (upwards of 135,000part-time people) were gainfully employed in growing, producing,transporting and trading wood energy, many being rurally based.In 2008 an estimated 133,000 full-time people were employed inthe ‘commercial’ wood fuel business. By contrast, the so called com-mercial energy (coal, petroleum products and electricity) providedemployment to about 3400 full-time people in 1996 and 4600 in2008, most of whom are urban based [73].
According to Abdelaziz [66], when switching between biomassand diesel in the industrial boiler the results show that the totalannual bill saving when switching in different percentage betweenbiomass and diesel in the Malaysian industrial boilers are about RM
799,278 in case of 80% diesel and 20% biomass consumption, RM1,447,761 In case of 60% diesel and 40% biomass consumption andRM 1,872,532 in case of 50% diesel and 50% biomass consumptionrespectively (Fig. 20).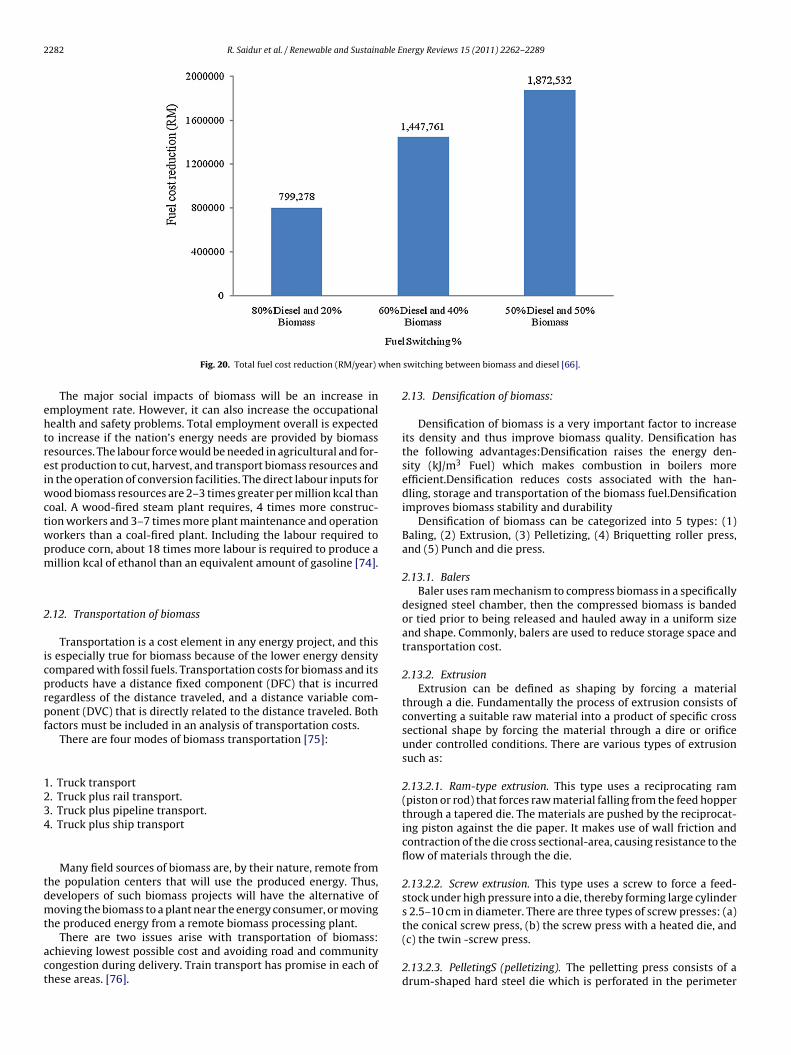
2282 R. Saidur et al. / Renewable and Sustainable Energy Reviews 15 (2011) 2262–2289
when
ehtreiwctwpm
2
icprpf
1234
tdmt
act
Fig. 20. Total fuel cost reduction (RM/year)
The major social impacts of biomass will be an increase inmployment rate. However, it can also increase the occupationalealth and safety problems. Total employment overall is expectedo increase if the nation’s energy needs are provided by biomassesources. The labour force would be needed in agricultural and for-st production to cut, harvest, and transport biomass resources andn the operation of conversion facilities. The direct labour inputs for
ood biomass resources are 2–3 times greater per million kcal thanoal. A wood-fired steam plant requires, 4 times more construc-ion workers and 3–7 times more plant maintenance and operationorkers than a coal-fired plant. Including the labour required toroduce corn, about 18 times more labour is required to produce aillion kcal of ethanol than an equivalent amount of gasoline [74].
.12. Transportation of biomass
Transportation is a cost element in any energy project, and thiss especially true for biomass because of the lower energy densityompared with fossil fuels. Transportation costs for biomass and itsroducts have a distance fixed component (DFC) that is incurredegardless of the distance traveled, and a distance variable com-onent (DVC) that is directly related to the distance traveled. Bothactors must be included in an analysis of transportation costs.
There are four modes of biomass transportation [75]:
. Truck transport
. Truck plus rail transport.
. Truck plus pipeline transport.
. Truck plus ship transport
Many field sources of biomass are, by their nature, remote fromhe population centers that will use the produced energy. Thus,evelopers of such biomass projects will have the alternative ofoving the biomass to a plant near the energy consumer, or moving
he produced energy from a remote biomass processing plant.There are two issues arise with transportation of biomass:
chieving lowest possible cost and avoiding road and communityongestion during delivery. Train transport has promise in each ofhese areas. [76].
switching between biomass and diesel [66].
2.13. Densification of biomass:
Densification of biomass is a very important factor to increaseits density and thus improve biomass quality. Densification hasthe following advantages:Densification raises the energy den-sity (kJ/m3 Fuel) which makes combustion in boilers moreefficient.Densification reduces costs associated with the han-dling, storage and transportation of the biomass fuel.Densificationimproves biomass stability and durability
Densification of biomass can be categorized into 5 types: (1)Baling, (2) Extrusion, (3) Pelletizing, (4) Briquetting roller press,and (5) Punch and die press.
2.13.1. BalersBaler uses ram mechanism to compress biomass in a specifically
designed steel chamber, then the compressed biomass is bandedor tied prior to being released and hauled away in a uniform sizeand shape. Commonly, balers are used to reduce storage space andtransportation cost.
2.13.2. ExtrusionExtrusion can be defined as shaping by forcing a material
through a die. Fundamentally the process of extrusion consists ofconverting a suitable raw material into a product of specific crosssectional shape by forcing the material through a dire or orificeunder controlled conditions. There are various types of extrusionsuch as:
2.13.2.1. Ram-type extrusion. This type uses a reciprocating ram(piston or rod) that forces raw material falling from the feed hopperthrough a tapered die. The materials are pushed by the reciprocat-ing piston against the die paper. It makes use of wall friction andcontraction of the die cross sectional-area, causing resistance to theflow of materials through the die.
2.13.2.2. Screw extrusion. This type uses a screw to force a feed-stock under high pressure into a die, thereby forming large cylinders 2.5–10 cm in diameter. There are three types of screw presses: (a)
the conical screw press, (b) the screw press with a heated die, and(c) the twin -screw press.2.13.2.3. PelletingS (pelletizing). The pelletting press consists of adrum-shaped hard steel die which is perforated in the perimeter
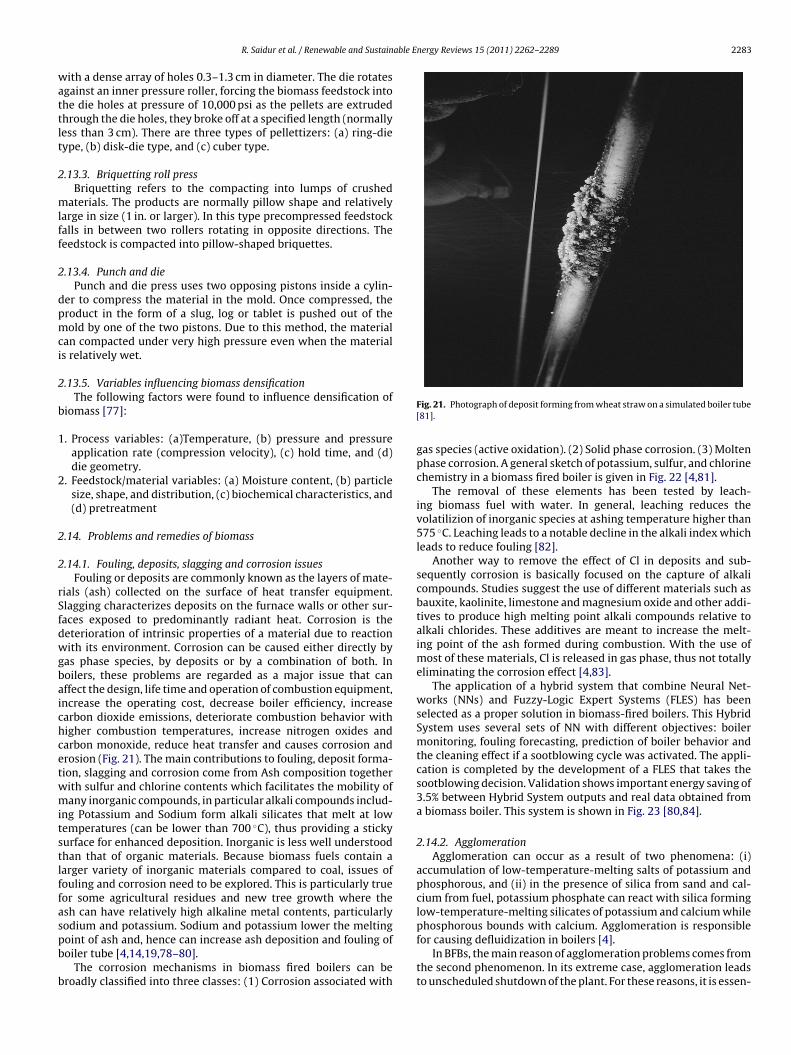
able Energy Reviews 15 (2011) 2262–2289 2283
wattlt
2
mlff
2
dpmci
2
b
1
2
2
2
rSfdwgbaichcetwmitstlffaspb
b
R. Saidur et al. / Renewable and Sustain
ith a dense array of holes 0.3–1.3 cm in diameter. The die rotatesgainst an inner pressure roller, forcing the biomass feedstock intohe die holes at pressure of 10,000 psi as the pellets are extrudedhrough the die holes, they broke off at a specified length (normallyess than 3 cm). There are three types of pellettizers: (a) ring-dieype, (b) disk-die type, and (c) cuber type.
.13.3. Briquetting roll pressBriquetting refers to the compacting into lumps of crushed
aterials. The products are normally pillow shape and relativelyarge in size (1 in. or larger). In this type precompressed feedstockalls in between two rollers rotating in opposite directions. Theeedstock is compacted into pillow-shaped briquettes.
.13.4. Punch and diePunch and die press uses two opposing pistons inside a cylin-
er to compress the material in the mold. Once compressed, theroduct in the form of a slug, log or tablet is pushed out of theold by one of the two pistons. Due to this method, the material
an compacted under very high pressure even when the materials relatively wet.
.13.5. Variables influencing biomass densificationThe following factors were found to influence densification of
iomass [77]:
. Process variables: (a)Temperature, (b) pressure and pressureapplication rate (compression velocity), (c) hold time, and (d)die geometry.
. Feedstock/material variables: (a) Moisture content, (b) particlesize, shape, and distribution, (c) biochemical characteristics, and(d) pretreatment
.14. Problems and remedies of biomass
.14.1. Fouling, deposits, slagging and corrosion issuesFouling or deposits are commonly known as the layers of mate-
ials (ash) collected on the surface of heat transfer equipment.lagging characterizes deposits on the furnace walls or other sur-aces exposed to predominantly radiant heat. Corrosion is theeterioration of intrinsic properties of a material due to reactionith its environment. Corrosion can be caused either directly by
as phase species, by deposits or by a combination of both. Inoilers, these problems are regarded as a major issue that canffect the design, life time and operation of combustion equipment,ncrease the operating cost, decrease boiler efficiency, increasearbon dioxide emissions, deteriorate combustion behavior withigher combustion temperatures, increase nitrogen oxides andarbon monoxide, reduce heat transfer and causes corrosion androsion (Fig. 21). The main contributions to fouling, deposit forma-ion, slagging and corrosion come from Ash composition togetherith sulfur and chlorine contents which facilitates the mobility ofany inorganic compounds, in particular alkali compounds includ-
ng Potassium and Sodium form alkali silicates that melt at lowemperatures (can be lower than 700 ◦C), thus providing a stickyurface for enhanced deposition. Inorganic is less well understoodhan that of organic materials. Because biomass fuels contain aarger variety of inorganic materials compared to coal, issues ofouling and corrosion need to be explored. This is particularly trueor some agricultural residues and new tree growth where thesh can have relatively high alkaline metal contents, particularly
odium and potassium. Sodium and potassium lower the meltingoint of ash and, hence can increase ash deposition and fouling ofoiler tube [4,14,19,78–80].The corrosion mechanisms in biomass fired boilers can beroadly classified into three classes: (1) Corrosion associated with
Fig. 21. Photograph of deposit forming from wheat straw on a simulated boiler tube[81].
gas species (active oxidation). (2) Solid phase corrosion. (3) Moltenphase corrosion. A general sketch of potassium, sulfur, and chlorinechemistry in a biomass fired boiler is given in Fig. 22 [4,81].
The removal of these elements has been tested by leach-ing biomass fuel with water. In general, leaching reduces thevolatilizion of inorganic species at ashing temperature higher than575 ◦C. Leaching leads to a notable decline in the alkali index whichleads to reduce fouling [82].
Another way to remove the effect of Cl in deposits and sub-sequently corrosion is basically focused on the capture of alkalicompounds. Studies suggest the use of different materials such asbauxite, kaolinite, limestone and magnesium oxide and other addi-tives to produce high melting point alkali compounds relative toalkali chlorides. These additives are meant to increase the melt-ing point of the ash formed during combustion. With the use ofmost of these materials, Cl is released in gas phase, thus not totallyeliminating the corrosion effect [4,83].
The application of a hybrid system that combine Neural Net-works (NNs) and Fuzzy-Logic Expert Systems (FLES) has beenselected as a proper solution in biomass-fired boilers. This HybridSystem uses several sets of NN with different objectives: boilermonitoring, fouling forecasting, prediction of boiler behavior andthe cleaning effect if a sootblowing cycle was activated. The appli-cation is completed by the development of a FLES that takes thesootblowing decision. Validation shows important energy saving of3.5% between Hybrid System outputs and real data obtained froma biomass boiler. This system is shown in Fig. 23 [80,84].
2.14.2. AgglomerationAgglomeration can occur as a result of two phenomena: (i)
accumulation of low-temperature-melting salts of potassium andphosphorous, and (ii) in the presence of silica from sand and cal-cium from fuel, potassium phosphate can react with silica forminglow-temperature-melting silicates of potassium and calcium while
phosphorous bounds with calcium. Agglomeration is responsiblefor causing defluidization in boilers [4].In BFBs, the main reason of agglomeration problems comes fromthe second phenomenon. In its extreme case, agglomeration leadsto unscheduled shutdown of the plant. For these reasons, it is essen-
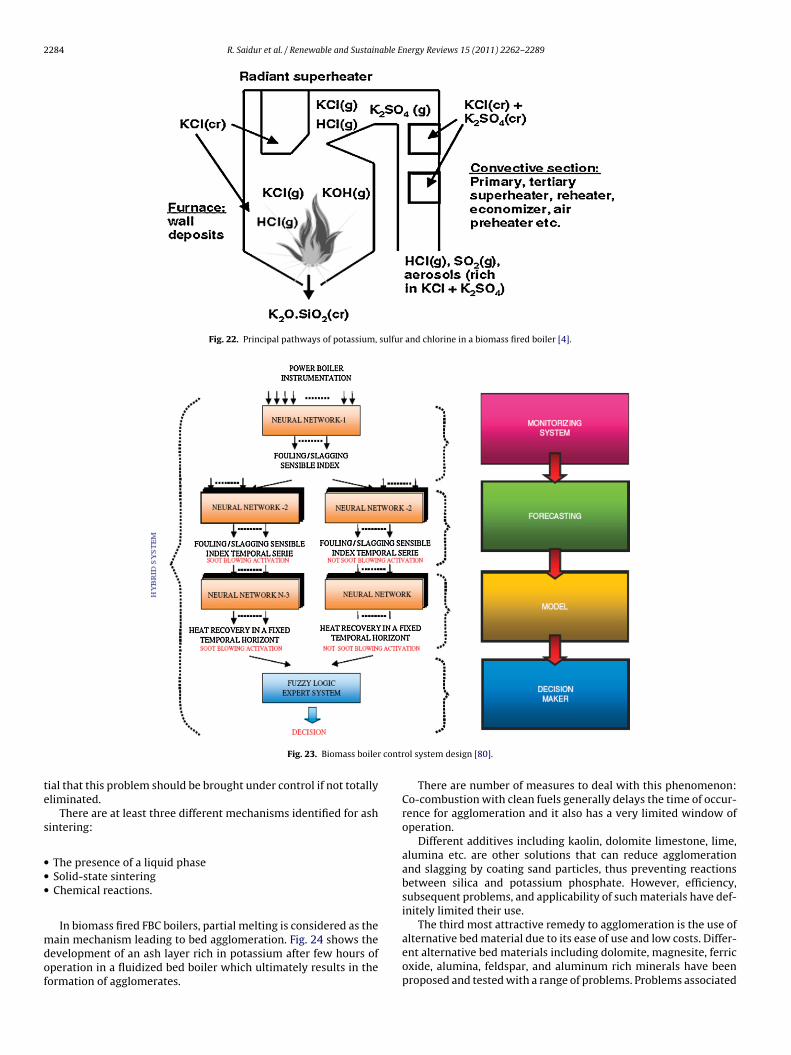
2284 R. Saidur et al. / Renewable and Sustainable Energy Reviews 15 (2011) 2262–2289
Fig. 22. Principal pathways of potassium, sulfur and chlorine in a biomass fired boiler [4].
contr
te
s
•••
mdof
Fig. 23. Biomass boiler
ial that this problem should be brought under control if not totallyliminated.
There are at least three different mechanisms identified for ashintering:
The presence of a liquid phaseSolid-state sinteringChemical reactions.
In biomass fired FBC boilers, partial melting is considered as theain mechanism leading to bed agglomeration. Fig. 24 shows the
evelopment of an ash layer rich in potassium after few hours ofperation in a fluidized bed boiler which ultimately results in theormation of agglomerates.
ol system design [80].
There are number of measures to deal with this phenomenon:Co-combustion with clean fuels generally delays the time of occur-rence for agglomeration and it also has a very limited window ofoperation.
Different additives including kaolin, dolomite limestone, lime,alumina etc. are other solutions that can reduce agglomerationand slagging by coating sand particles, thus preventing reactionsbetween silica and potassium phosphate. However, efficiency,subsequent problems, and applicability of such materials have def-initely limited their use.
The third most attractive remedy to agglomeration is the use ofalternative bed material due to its ease of use and low costs. Differ-ent alternative bed materials including dolomite, magnesite, ferricoxide, alumina, feldspar, and aluminum rich minerals have beenproposed and tested with a range of problems. Problems associated
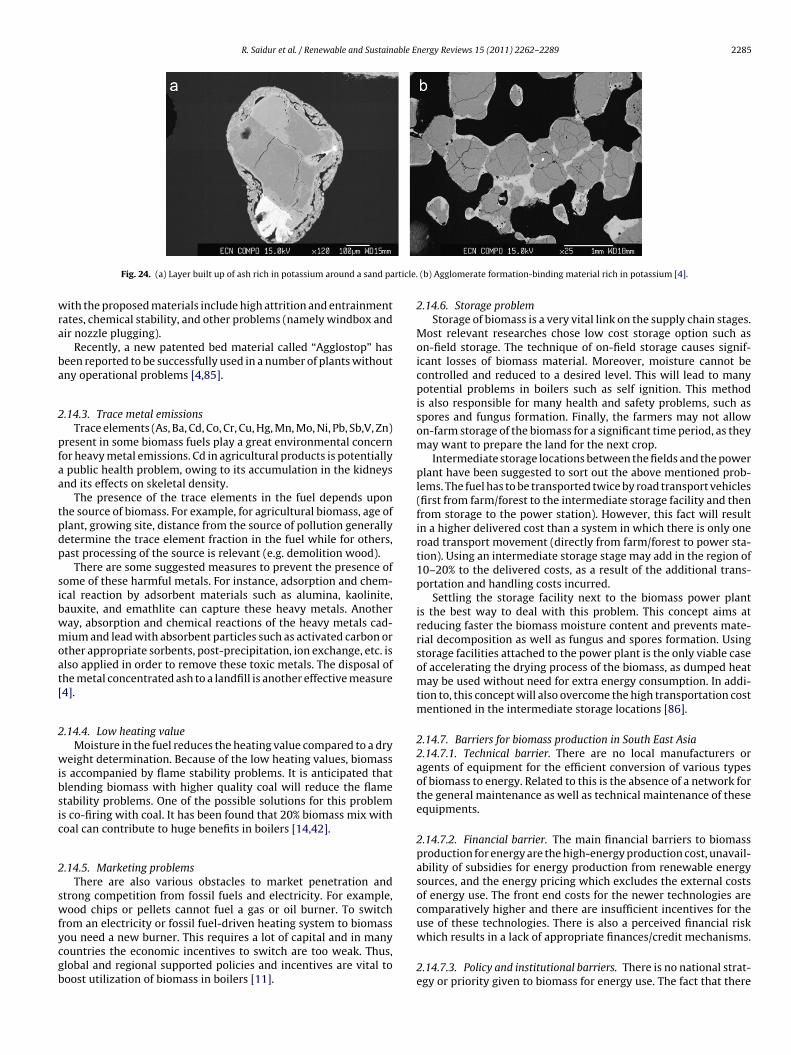
R. Saidur et al. / Renewable and Sustainable Energy Reviews 15 (2011) 2262–2289 2285
rticle.
wra
ba
2
pfaa
tpdp
sibwmoat[
2
wibsic
2
swfycgb
Fig. 24. (a) Layer built up of ash rich in potassium around a sand pa
ith the proposed materials include high attrition and entrainmentates, chemical stability, and other problems (namely windbox andir nozzle plugging).
Recently, a new patented bed material called “Agglostop” haseen reported to be successfully used in a number of plants withoutny operational problems [4,85].
.14.3. Trace metal emissionsTrace elements (As, Ba, Cd, Co, Cr, Cu, Hg, Mn, Mo, Ni, Pb, Sb,V, Zn)
resent in some biomass fuels play a great environmental concernor heavy metal emissions. Cd in agricultural products is potentiallypublic health problem, owing to its accumulation in the kidneys
nd its effects on skeletal density.The presence of the trace elements in the fuel depends upon
he source of biomass. For example, for agricultural biomass, age oflant, growing site, distance from the source of pollution generallyetermine the trace element fraction in the fuel while for others,ast processing of the source is relevant (e.g. demolition wood).
There are some suggested measures to prevent the presence ofome of these harmful metals. For instance, adsorption and chem-cal reaction by adsorbent materials such as alumina, kaolinite,auxite, and emathlite can capture these heavy metals. Anotheray, absorption and chemical reactions of the heavy metals cad-ium and lead with absorbent particles such as activated carbon or
ther appropriate sorbents, post-precipitation, ion exchange, etc. islso applied in order to remove these toxic metals. The disposal ofhe metal concentrated ash to a landfill is another effective measure4].
.14.4. Low heating valueMoisture in the fuel reduces the heating value compared to a dry
eight determination. Because of the low heating values, biomasss accompanied by flame stability problems. It is anticipated thatlending biomass with higher quality coal will reduce the flametability problems. One of the possible solutions for this problems co-firing with coal. It has been found that 20% biomass mix withoal can contribute to huge benefits in boilers [14,42].
.14.5. Marketing problemsThere are also various obstacles to market penetration and
trong competition from fossil fuels and electricity. For example,ood chips or pellets cannot fuel a gas or oil burner. To switch
rom an electricity or fossil fuel-driven heating system to biomassou need a new burner. This requires a lot of capital and in manyountries the economic incentives to switch are too weak. Thus,lobal and regional supported policies and incentives are vital tooost utilization of biomass in boilers [11].
(b) Agglomerate formation-binding material rich in potassium [4].
2.14.6. Storage problemStorage of biomass is a very vital link on the supply chain stages.
Most relevant researches chose low cost storage option such ason-field storage. The technique of on-field storage causes signif-icant losses of biomass material. Moreover, moisture cannot becontrolled and reduced to a desired level. This will lead to manypotential problems in boilers such as self ignition. This methodis also responsible for many health and safety problems, such asspores and fungus formation. Finally, the farmers may not allowon-farm storage of the biomass for a significant time period, as theymay want to prepare the land for the next crop.
Intermediate storage locations between the fields and the powerplant have been suggested to sort out the above mentioned prob-lems. The fuel has to be transported twice by road transport vehicles(first from farm/forest to the intermediate storage facility and thenfrom storage to the power station). However, this fact will resultin a higher delivered cost than a system in which there is only oneroad transport movement (directly from farm/forest to power sta-tion). Using an intermediate storage stage may add in the region of10–20% to the delivered costs, as a result of the additional trans-portation and handling costs incurred.
Settling the storage facility next to the biomass power plantis the best way to deal with this problem. This concept aims atreducing faster the biomass moisture content and prevents mate-rial decomposition as well as fungus and spores formation. Usingstorage facilities attached to the power plant is the only viable caseof accelerating the drying process of the biomass, as dumped heatmay be used without need for extra energy consumption. In addi-tion to, this concept will also overcome the high transportation costmentioned in the intermediate storage locations [86].
2.14.7. Barriers for biomass production in South East Asia2.14.7.1. Technical barrier. There are no local manufacturers oragents of equipment for the efficient conversion of various typesof biomass to energy. Related to this is the absence of a network forthe general maintenance as well as technical maintenance of theseequipments.
2.14.7.2. Financial barrier. The main financial barriers to biomassproduction for energy are the high-energy production cost, unavail-ability of subsidies for energy production from renewable energysources, and the energy pricing which excludes the external costsof energy use. The front end costs for the newer technologies arecomparatively higher and there are insufficient incentives for the
use of these technologies. There is also a perceived financial riskwhich results in a lack of appropriate finances/credit mechanisms.2.14.7.3. Policy and institutional barriers. There is no national strat-egy or priority given to biomass for energy use. The fact that there
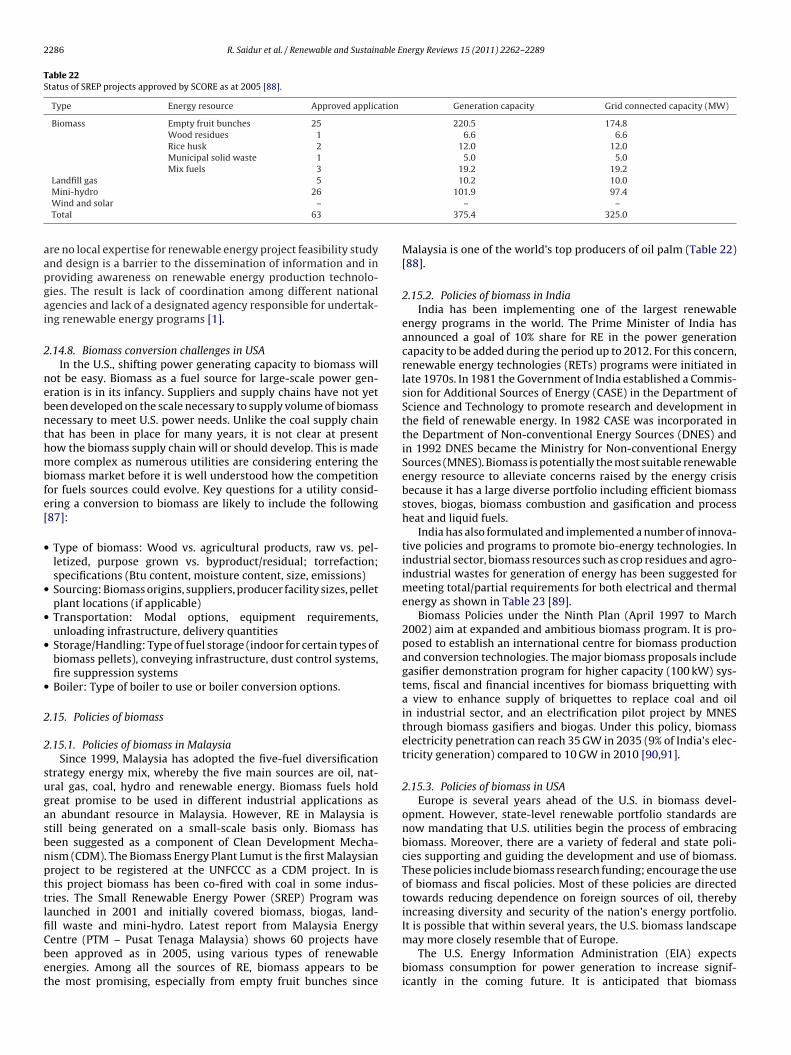
2286 R. Saidur et al. / Renewable and Sustainable Energy Reviews 15 (2011) 2262–2289
Table 22Status of SREP projects approved by SCORE as at 2005 [88].
Type Energy resource Approved application Generation capacity Grid connected capacity (MW)
Biomass Empty fruit bunches 25 220.5 174.8Wood residues 1 6.6 6.6Rice husk 2 12.0 12.0Municipal solid waste 1 5.0 5.0Mix fuels 3 19.2 19.2
aapgai
2
nebnthmbfe[
•
•
•
•
•
2
2
sugasbnpttlfiCbet
Landfill gas 5Mini-hydro 26Wind and solar –Total 63
re no local expertise for renewable energy project feasibility studynd design is a barrier to the dissemination of information and inroviding awareness on renewable energy production technolo-ies. The result is lack of coordination among different nationalgencies and lack of a designated agency responsible for undertak-ng renewable energy programs [1].
.14.8. Biomass conversion challenges in USAIn the U.S., shifting power generating capacity to biomass will
ot be easy. Biomass as a fuel source for large-scale power gen-ration is in its infancy. Suppliers and supply chains have not yeteen developed on the scale necessary to supply volume of biomassecessary to meet U.S. power needs. Unlike the coal supply chainhat has been in place for many years, it is not clear at presentow the biomass supply chain will or should develop. This is madeore complex as numerous utilities are considering entering the
iomass market before it is well understood how the competitionor fuels sources could evolve. Key questions for a utility consid-ring a conversion to biomass are likely to include the following87]:
Type of biomass: Wood vs. agricultural products, raw vs. pel-letized, purpose grown vs. byproduct/residual; torrefaction;specifications (Btu content, moisture content, size, emissions)Sourcing: Biomass origins, suppliers, producer facility sizes, pelletplant locations (if applicable)Transportation: Modal options, equipment requirements,unloading infrastructure, delivery quantitiesStorage/Handling: Type of fuel storage (indoor for certain types ofbiomass pellets), conveying infrastructure, dust control systems,fire suppression systemsBoiler: Type of boiler to use or boiler conversion options.
.15. Policies of biomass
.15.1. Policies of biomass in MalaysiaSince 1999, Malaysia has adopted the five-fuel diversification
trategy energy mix, whereby the five main sources are oil, nat-ral gas, coal, hydro and renewable energy. Biomass fuels holdreat promise to be used in different industrial applications asn abundant resource in Malaysia. However, RE in Malaysia istill being generated on a small-scale basis only. Biomass haseen suggested as a component of Clean Development Mecha-ism (CDM). The Biomass Energy Plant Lumut is the first Malaysianroject to be registered at the UNFCCC as a CDM project. In ishis project biomass has been co-fired with coal in some indus-ries. The Small Renewable Energy Power (SREP) Program wasaunched in 2001 and initially covered biomass, biogas, land-
ll waste and mini-hydro. Latest report from Malaysia Energyentre (PTM – Pusat Tenaga Malaysia) shows 60 projects haveeen approved as in 2005, using various types of renewablenergies. Among all the sources of RE, biomass appears to behe most promising, especially from empty fruit bunches since10.2 10.0101.9 97.4
– –375.4 325.0
Malaysia is one of the world’s top producers of oil palm (Table 22)[88].
2.15.2. Policies of biomass in IndiaIndia has been implementing one of the largest renewable
energy programs in the world. The Prime Minister of India hasannounced a goal of 10% share for RE in the power generationcapacity to be added during the period up to 2012. For this concern,renewable energy technologies (RETs) programs were initiated inlate 1970s. In 1981 the Government of India established a Commis-sion for Additional Sources of Energy (CASE) in the Department ofScience and Technology to promote research and development inthe field of renewable energy. In 1982 CASE was incorporated inthe Department of Non-conventional Energy Sources (DNES) andin 1992 DNES became the Ministry for Non-conventional EnergySources (MNES). Biomass is potentially the most suitable renewableenergy resource to alleviate concerns raised by the energy crisisbecause it has a large diverse portfolio including efficient biomassstoves, biogas, biomass combustion and gasification and processheat and liquid fuels.
India has also formulated and implemented a number of innova-tive policies and programs to promote bio-energy technologies. Inindustrial sector, biomass resources such as crop residues and agro-industrial wastes for generation of energy has been suggested formeeting total/partial requirements for both electrical and thermalenergy as shown in Table 23 [89].
Biomass Policies under the Ninth Plan (April 1997 to March2002) aim at expanded and ambitious biomass program. It is pro-posed to establish an international centre for biomass productionand conversion technologies. The major biomass proposals includegasifier demonstration program for higher capacity (100 kW) sys-tems, fiscal and financial incentives for biomass briquetting witha view to enhance supply of briquettes to replace coal and oilin industrial sector, and an electrification pilot project by MNESthrough biomass gasifiers and biogas. Under this policy, biomasselectricity penetration can reach 35 GW in 2035 (9% of India’s elec-tricity generation) compared to 10 GW in 2010 [90,91].
2.15.3. Policies of biomass in USAEurope is several years ahead of the U.S. in biomass devel-
opment. However, state-level renewable portfolio standards arenow mandating that U.S. utilities begin the process of embracingbiomass. Moreover, there are a variety of federal and state poli-cies supporting and guiding the development and use of biomass.These policies include biomass research funding; encourage the useof biomass and fiscal policies. Most of these policies are directedtowards reducing dependence on foreign sources of oil, therebyincreasing diversity and security of the nation’s energy portfolio.
It is possible that within several years, the U.S. biomass landscapemay more closely resemble that of Europe.The U.S. Energy Information Administration (EIA) expectsbiomass consumption for power generation to increase signif-icantly in the coming future. It is anticipated that biomass
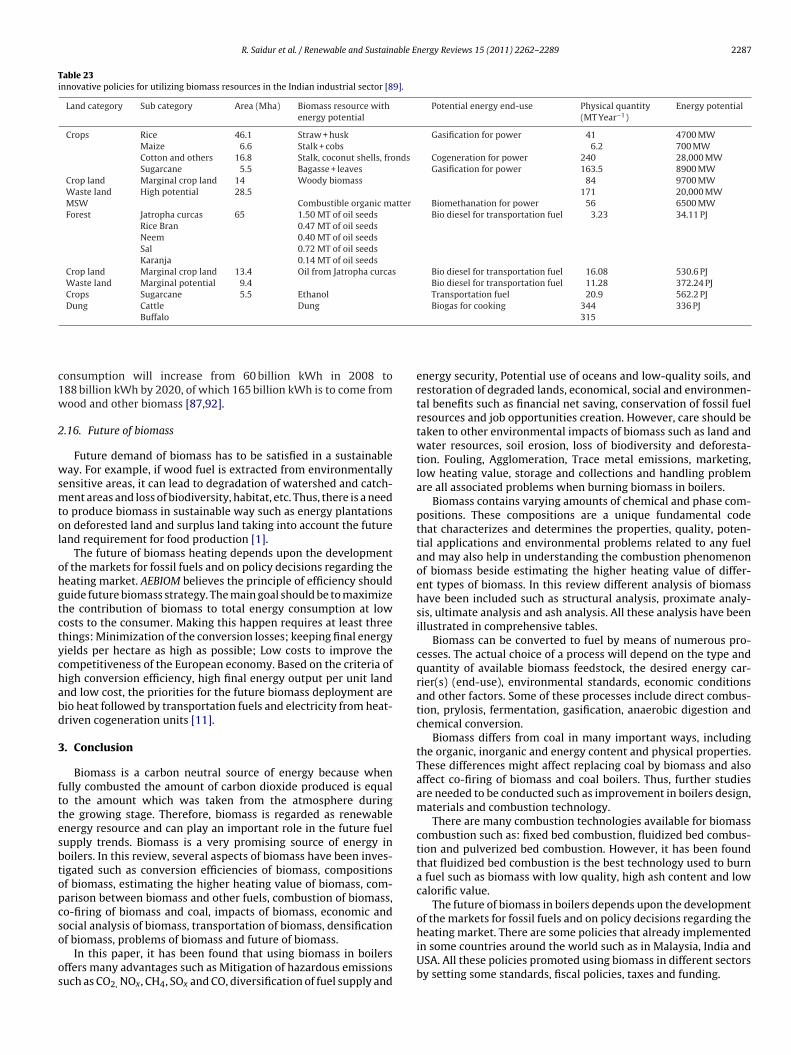
R. Saidur et al. / Renewable and Sustainable Energy Reviews 15 (2011) 2262–2289 2287
Table 23innovative policies for utilizing biomass resources in the Indian industrial sector [89].
Land category Sub category Area (Mha) Biomass resource withenergy potential
Potential energy end-use Physical quantity(MT Year−1)
Energy potential
Crops Rice 46.1 Straw + husk Gasification for power 41 4700 MWMaize 6.6 Stalk + cobs 6.2 700 MWCotton and others 16.8 Stalk, coconut shells, fronds Cogeneration for power 240 28,000 MWSugarcane 5.5 Bagasse + leaves Gasification for power 163.5 8900 MW
Crop land Marginal crop land 14 Woody biomass 84 9700 MWWaste land High potential 28.5 171 20,000 MWMSW Combustible organic matter Biomethanation for power 56 6500 MWForest Jatropha curcas 65 1.50 MT of oil seeds Bio diesel for transportation fuel 3.23 34.11 PJ
Rice Bran 0.47 MT of oil seedsNeem 0.40 MT of oil seedsSal 0.72 MT of oil seedsKaranja 0.14 MT of oil seeds
Crop land Marginal crop land 13.4 Oil from Jatropha curcas Bio diesel for transportation fuel 16.08 530.6 PJWaste land Marginal potential 9.4 Bio diesel for transportation fuel 11.28 372.24 PJCrops Sugarcane 5.5 Ethanol Transportation fuel 20.9 562.2 PJ
c1w
2
wsmtol
ohgtctychabd
3
fttesbtopcso
os
Dung Cattle DungBuffalo
onsumption will increase from 60 billion kWh in 2008 to88 billion kWh by 2020, of which 165 billion kWh is to come fromood and other biomass [87,92].
.16. Future of biomass
Future demand of biomass has to be satisfied in a sustainableay. For example, if wood fuel is extracted from environmentally
ensitive areas, it can lead to degradation of watershed and catch-ent areas and loss of biodiversity, habitat, etc. Thus, there is a need
o produce biomass in sustainable way such as energy plantationsn deforested land and surplus land taking into account the futureand requirement for food production [1].
The future of biomass heating depends upon the developmentf the markets for fossil fuels and on policy decisions regarding theeating market. AEBIOM believes the principle of efficiency shoulduide future biomass strategy. The main goal should be to maximizehe contribution of biomass to total energy consumption at lowosts to the consumer. Making this happen requires at least threehings: Minimization of the conversion losses; keeping final energyields per hectare as high as possible; Low costs to improve theompetitiveness of the European economy. Based on the criteria ofigh conversion efficiency, high final energy output per unit landnd low cost, the priorities for the future biomass deployment areio heat followed by transportation fuels and electricity from heat-riven cogeneration units [11].
. Conclusion
Biomass is a carbon neutral source of energy because whenully combusted the amount of carbon dioxide produced is equalo the amount which was taken from the atmosphere duringhe growing stage. Therefore, biomass is regarded as renewablenergy resource and can play an important role in the future fuelupply trends. Biomass is a very promising source of energy inoilers. In this review, several aspects of biomass have been inves-igated such as conversion efficiencies of biomass, compositionsf biomass, estimating the higher heating value of biomass, com-arison between biomass and other fuels, combustion of biomass,o-firing of biomass and coal, impacts of biomass, economic and
ocial analysis of biomass, transportation of biomass, densificationf biomass, problems of biomass and future of biomass.In this paper, it has been found that using biomass in boilersffers many advantages such as Mitigation of hazardous emissionsuch as CO2, NOx, CH4, SOx and CO, diversification of fuel supply and
Biogas for cooking 344 336 PJ315
energy security, Potential use of oceans and low-quality soils, andrestoration of degraded lands, economical, social and environmen-tal benefits such as financial net saving, conservation of fossil fuelresources and job opportunities creation. However, care should betaken to other environmental impacts of biomass such as land andwater resources, soil erosion, loss of biodiversity and deforesta-tion. Fouling, Agglomeration, Trace metal emissions, marketing,low heating value, storage and collections and handling problemare all associated problems when burning biomass in boilers.
Biomass contains varying amounts of chemical and phase com-positions. These compositions are a unique fundamental codethat characterizes and determines the properties, quality, poten-tial applications and environmental problems related to any fueland may also help in understanding the combustion phenomenonof biomass beside estimating the higher heating value of differ-ent types of biomass. In this review different analysis of biomasshave been included such as structural analysis, proximate analy-sis, ultimate analysis and ash analysis. All these analysis have beenillustrated in comprehensive tables.
Biomass can be converted to fuel by means of numerous pro-cesses. The actual choice of a process will depend on the type andquantity of available biomass feedstock, the desired energy car-rier(s) (end-use), environmental standards, economic conditionsand other factors. Some of these processes include direct combus-tion, prylosis, fermentation, gasification, anaerobic digestion andchemical conversion.
Biomass differs from coal in many important ways, includingthe organic, inorganic and energy content and physical properties.These differences might affect replacing coal by biomass and alsoaffect co-firing of biomass and coal boilers. Thus, further studiesare needed to be conducted such as improvement in boilers design,materials and combustion technology.
There are many combustion technologies available for biomasscombustion such as: fixed bed combustion, fluidized bed combus-tion and pulverized bed combustion. However, it has been foundthat fluidized bed combustion is the best technology used to burna fuel such as biomass with low quality, high ash content and lowcalorific value.
The future of biomass in boilers depends upon the developmentof the markets for fossil fuels and on policy decisions regarding the
heating market. There are some policies that already implementedin some countries around the world such as in Malaysia, India andUSA. All these policies promoted using biomass in different sectorsby setting some standards, fiscal policies, taxes and funding.
2 able E
A
fc
R
288 R. Saidur et al. / Renewable and Sustain
cknowledgement
The authors would like to acknowledge the financial supportrom the Vice Chancellor, University of Malaya. This research wasarried under the High Impact Research Grant (HIRG) scheme.
eferences
[1] Koh MP, Hoi WK. Sustainable biomass production for energy in Malaysia.Biomass Bioenergy 2003;25:517–29.
[2] Sasaki N, Knorr W, Foster DR, Etoh H, Ninomiya H, Chay S, et al. Woodybiomass and bioenergy potentials in Southeast Asia between 1990 and 2020.Appl Energy 2009;86:S140–50.
[3] Mahmoud A, Shuhaimi M, Abdel Samed M. A combined process integra-tion and fuel switching strategy for emissions reduction in chemical processplants. Energy 2009;34:190–5.
[4] Khan AA, Jonga WD, Jansens PJ, Spliethoff H. Biomass combustion in flu-idized bed boilers: potential problems and remedies. Fuel Process Technol2009;90:21–50.
[5] U.S. Environmental Protection Agency. Industrial boiler efficiency. http://www.epa.gov/climateleaders/documents/resources/industrial boilerprotocol.pdf; 2008 [accessed 01.03.10].
[6] Einstein D, Worrell E, Marta Khrushch. Steam systems in industry:energy use and energy efficiency improvement potentials, Lawrence Berke-ley National Laboratory. http://www.osti.gov/bridge/servlets/purl/789187-uTGqsP/native/; 2009 [accessed 17.05.10].
[7] Saidur R, Mekhilef S. Energy use, energy savings and emission analysis in theMalaysian rubber producing industries. Appl Energy 2010;87:2746–58.
[8] Oregon. Biomass energy. http://www.oregon.gov/ENERGY/RENEW/Biomass/BiomassHome.shtml; 2010 [accessed 05.01.10].
[9] Abbasi T, Abbasi SA. Biomass energy and the environmental impacts asso-ciated with its production and utilization. Renew Sustain Energy Rev2010;14:919–37.
[10] Demirbas A. Combustion characteristics of different biomass fuels. ProgEnergy Combust Sci 2004;30:219–30.
[11] Kopetz H. Biomass – a burning issue 2007:52–85. Available from: www.re-focus.net [accessed 22.02.10].
[12] AIE Australian institute of energy. Fact sheet 8: biomass. http://aie.org.au/Content/NavigationMenu/Resources/SchoolProjects/FS8 BIOMASS.pdf; 2010 [accessed 20.03.10].
[13] TNP. The need project: biomass. http://www.need.org/needpdf/infobookactivities/SecInfo/BiomassS.pdf; 2010 [accessed 25.12.09].
[14] Demirbas A. Potential applications of renewable energy sources, biomasscombustion problems in boiler power systems and combustion related envi-ronmental issues. Prog Energy Combust Sci 2005;31:171–92.
[15] Faninger G. Towards sustainability development in Austria: renewable energycontributions. Institute for Interdisciplinary Research and Continuing Educa-tion, University of Klagenfurt: Austria; 2003.
[16] ftp://ftp.fao.org/docrep/fao/W7744E/W7744E00.pdf [accessed 04.03.10].[17] Capehart BL, Turner WC, Kennedy WJ. Guide to energy management. 5th ed.
The Fairmont Press; 2005.[18] Tock JY, Lai CL, Lee KT, Tan KT, Bhatia S. Banana biomass as potential renew-
able energy resource: a Malaysian case study. Renew Sustain Energy Rev2010;14:798–805.
[19] Sami M, Annamalai K, Wooldridge M. Co-firing of coal and biomass fuelblends. Prog Energy Combust Sci 2001;27:171–214.
[20] Kamm T. A new class of plants for a biofuel feedstock energy crop. ApplBiochem Biotechnol 2004;113:55–70.
[21] Varela M, Lechon Y, Saez R. Environmental and socioeconomic aspects in thestrategic analysis of a biomass power plant integration. Biomass Bioenergy1999;17:405–13.
[22] NEF. Biomass. http://www.nef.org.uk/greenschool/documents/Biomass.pdf;2010 [accessed 25.03.10].
[23] Boyle G. Renewable energy Power for a sustainable future. Oxford UniversityPress: UK; 2004.
[24] Vassilev SV, Baxter D, Andersen LK, Vassileva CG. An overview of the chemicalcomposition of biomass. Fuel 2010;89:913–33.
[25] EM Energy Matters. Biomass: advantage and disadvantage. http://library.thinkquest.org/20331/types/biomass/advant.html; 2010 [accessed25.02.10].
[26] AES Alternative Energy Resources. Advantages of biomass. http://www.alternate-energy-sources.com/advantage-of-biomass-energy.html;2010 [accessed 12.02.10].
[27] BRP Biomass Research Project. Biomass (incineration): advantages and disad-vantages. http://science134.tripod.com/id9.html; 2010 [accessed 25.01.10].
[28] APO Asian Productivity Organization. Reusing biomass waste inindustrial boilers for energy recovery. http://www.apo-tokyo.org/biomassboiler/D0 online-resources.htm; 2010 [accessed 28.03.10].
[29] Zhang L, Xu C, Champagne P. Overview of recent advances in thermo-chemicalconversion of biomass. Energy Convers Manage 2010;51:969–82.
[30] Demirbas A. Relationships between lignin contents and fixed carbon contentsof biomass samples. Energy Convers Manage 2003;44:1481–6.
[31] Demirbas A. Sustainable cofiring of biomass with coal. Energy Convers Man-age 2003;44:1465–79.
nergy Reviews 15 (2011) 2262–2289
[32] Demirbas A. Yields of hydrogen-rich gaseous product via pyrolysis fromselected biomass samples. Fuel 2001;80:1885–91.
[33] Demirbas A. Calculation of higher heating values of biomass fuels. Fuel1996;76:431–4.
[34] Mohan T. An integrated approach for techno-economic and environmen-tal analysis of energy from biomass and fossil fuels. In: Thesis, Texas A&MUniversity. 2005.
[35] Mohan D, Pittman CU, Steele PH. Pyrolysis of wood/biomass for bio-oil: acritical review. Energy Fuels 2006;20:848–89.
[36] Lemus R, Brummer EC, Moore KJ, Molstad NE, Burras CL, Barker MF. Biomassyield and quality of 20 switchgrass populations in southern Iowa, USA.Biomass Bioenergy 2002;23:433–42.
[37] Acma HH. Combustion characteristics of different biomass materials. EnergyConvers Manage 2003;44:155–62.
[38] Shen J, Zhu S, Liu X, Zhang H, Tan J. The prediction of elemental com-position of biomass based on proximate analysis. Energy Convers Manage2010;51:983–7.
[39] Friedl A, Padouvas E, Rotter H, Varmuza K. Prediction of heating valuesof biomass fuel from elemental composition. Anal Chim Acta 2005;544:191–8.
[40] Atimtay AT. Combustion of agro-waste with coal in a fluidized bed. CleanTechnol Environ Policy 2010;12:43–52.
[41] Huang C, Han L, Yang Z, Liu X. Ultimate analysis and heating value predictionof straw by near infrared spectroscopy. Waste Manage 2009;29:1793–7.
[42] Jenkins BM, Baxter LL, Miles TR, Miles JRTR. Combustion properties of biomass.Fuel Process Technol 1998;54:17–46.
[43] Parikh J, Channiwala SA, Ghosal GK. A correlation for calculating ele-mental composition from proximate analysis of biomass materials. Fuel2007;86:1710–9.
[44] Faaij A. Energy from biomass and waste. Ph.D. thesis, Utrecht University.http://www.chem.uu.nl/nws/www/publica/Publicaties%201997/97046 a.htm; 1997 [accessed 21.01.10].
[45] Caputo AC, Palumbo M, Pelagagge PC, Scacchia F. Economics of biomassenergy utilization in combustion and gasification plants: effects of logisticvariables. Biomass Bioenergy 2005;28:35–51.
[46] Faaij A. Modern biomass conversion technology. Mitig Adapt Strat GlobalChange 2006;11:343–75.
[47] Balat M, Balat M, Kirtay E, Balat H. Main routes for the thermo-conversion ofbiomass into fuels and chemicals. Energy Convers Manage 2009;50:3147–57.
[48] McKendry P. Energy production from biomass (part 3): gasification technolo-gies. Bioresour Technol 2002;83:55–63.
[49] Demirbas A. Relationships between lignin contents and heating values ofbiomass. Energy Convers Manage 2001;42:183–8.
[50] Erol M, Haykiri-Acma H, kbayrak S. Calorific value estimation of biomass fromtheir proximate analyses data. Renew Energy 2010;35:170–3.
[51] Sheng c, Azevedo JLT. Estimating the higher heating value of biomass fuelsfrom basic analysis data. Biomass Bioenergy 2005;28:499–507.
[52] Wai KC. Effect of co-combustion of coal and biomass on combustion perfor-mance and pollutant emissions. Thesis, The Hong Kong University of Scienceand Technology; 2005.
[53] Borjesson PII. Energy analysis of biomass production and transportation.Biomass Bioenergy 1996;11:305–18.
[54] Raveendran K, Ganesh A. Heating value of biomass and biomass pyrolysisproducts. Fuel 1996;75:1715–20.
[55] (HNEI) Hawaii Natural Energy Institute. Thermochemical conversion ofbiomass. http://www.hnei.hawaii.edu/text/bio.thermal.asp; 2010 [accessed09.03.10].
[56] Lu G, Yan Y, Cornwell S, Whitehouse M, Riley G. Impact of co-firingcoal and biomass on flame characteristics and stability. Fuel 2008;87:1133–40.
[57] De Best CJJM, van Kemenade HP, Brunner T, Obernberger I. Particulate emis-sion reduction in small-scale biomass combustion plants by a condensingheat exchanger. Energy Fuel 2008;22:587–97.
[58] National Certification Examination for Energy Managers and Energy Auditors.FBC Boilers. http://www.em-ea.org/Guide%20Books/book-2/2.6%20FBC.pdf;2010 [accessed 24.03.10].
[59] Hughes EE. Biomass co-firing: economics, policy and opportunities. BiomassBioenergy 2000;19:457–65.
[60] Al-Mansour F, Zuwala J. An evaluation of biomass co-firing in Europe. BiomassBioenergy 2010;34:620–9.
[61] Moreira JR. Global biomass energy potential. Mitig Adapt Strat Global Change2006;11:313–42.
[62] Zhang O. Compacting biomass waste material for use as fuel. PHD Thesis,University of Missouri: Coloumbia; 2002.
[63] PSU The Pennsylvania State University, The energy Institute, Col-lege of earth and Mineral Sciences. Biomass/biofuels. http://www.energy.psu.edu/tes/biomass.html; 2010 [accessed 02.04.10].
[64] Zutphen HV, Wibrans R. The carbon balance: the new centre of atten-tion, Global Oils Fats Bus Mag 4(3). http://www.malaysiapalmoil.org/pdf/carboncapital%20solutions.pdf; 2007 [accessed 17.03.10].
[65] Shuit SH, Tan KT, Lee KT, Kamaruddin AH. Oil palm biomass as a sustainableenergy source: a Malaysian case study. Energy 2009;34:1225–35.
[66] Abdelaziz EA. Energy economical and environmental analysis of industrialboilers. Master thesis. University of Malaya: Malaysia, 2010.
[67] MAFOREST Massachusetts Forests Watch. Biomass incineration.http://www.maforests.org/Facts.pdf [accessed 21.01.10].
able E
Process Technol 1998;54:127–42.[108] Vamvuka D, Zografos D, Alevizos G. Control methods for mitigating biomass
ash-related problems in fluidized beds. Bioresour Technol 2008;99:3534–44.
R. Saidur et al. / Renewable and Sustain
[68] Ravindrana NH, Hall DO. Biomass, energy, and environment: a develop-ing country perspective from India. Earth scan, UK. http://books.google.com,2008 [accessed 07.04.10].
[69] Trimble JL, Van hook RI. Biomass for energy: the environmental issues.Biomass 1984;6:3–13.
[70] Spliethoff H, Hein KRG. Effect of co-combustion of biomass on emissions inpulverized fuel furnaces. Fuel Process Technol 1998;54:189–205.
[71] Hein KRG, Bemtgen JM. EU clean coal technology co-combustion of coal andbiomass. Fuel Process Technol 1998;54:159–69.
[72] Daskalakis M, Iyer V. Finding energy savings with a biomass boiler.http://hpac.com/bse/finding-energy-savings-0609/; 2009 [accessed25.01.10].
[73] Openshaw K. Biomass energy: employment generation and its contributionto poverty alleviation. Biomass Bioenergy 2010;34:365–78.
[74] Abbasi SA, Abbasi Naseema. The likely adverse environmental impacts ofrenewable energy sources. Appl Energy 2000;65:121–44.
[75] Searcy E, Flynn P, Ghafoori E, Kumar A. The relative cost of biomass energytransport. Appl Biochem Biotechnol 2007;137–140:639–52.
[76] Mahmudi H, Flynn PC. Rail transport of biomass in Canada.http://www.ncbi.nlm.nih.gov/pubmed/16915633; 2009 [accessed 05.03.10].
[77] Shaw M. Feedstock and process variables influencing biomass densification.Thesis, University of Saskatchewan; 2008.
[78] Hiltunen M, Barisic V, Zabetta EC. Combustion of different typesof biomass in CFB boilers. http://www.fwc.com/publications/tech papers/files/TP CFB 08 05.pdf; 2008 [accessed 05.03.10].
[79] Nielsen HP, Frandsen FJ, Dam-Johansen K, Baxter LL. The implications ofchlorine-associated corrosion on the operation of biomass-fired boilers. ProgEnergy Combust Sci 2000;26:283–98.
[80] Romeo LM, Gareta R. Hybrid System for fouling control in biomass boilers.Eng Appl Artif Intell 2006;19:915–25.
[81] Baxter LL, Miles TR, Jenkin BR, Milne T, Dayton D, Bryers RW, et al. The behaviorof inorganic material in biomass-fired power boilers: field and laboratoryexperiences. Fuel Process Technol 1998;54:47–78.
[82] Bakker RR. Biomass fuel leaching for the control of fouling, slaggging, andalggomeration in biomass power greneration. PHD Thesis, University of Cal-ifornia Davis; 2000.
[83] Miles TR, Baxter LL, Bryers RW. Boiler deposits from firing biomass fuels.Biomass Bioenergy 1995;10:125–38.
[84] Romeo LM, Gareta R. Fouling control in biomass boilers. Biomass bioenergy2009;33:854–61.
[85] Barisic V, Amand L, Zabetta CE. The role of limestone in preventingagglomeration and slagging during CFB combustion of high-phosphorousfuels. http://fwcparts.com/publications/tech papers/files/TP CFB 08 03.pdf;2008 [accessed 05.03.10].
[86] Rentizelas AA, Tolis AJ, Tatsiopoulos LP. Logistics issues of biomass: the stor-age problem and the multi-biomass supply chain. Renew Sustain Energy Rev
2009;13:887–94.[87] REW Renewable energy world. Biomass – an emerging fuel for power gener-ation. http://www.renewableenergyworld; 2010 [accessed 15.03.10].
[88] APO Asian Productivity Organization. Workshop on utilization ofbiomass for renewable energy, Katmandu, Nepal. http://webcache.googleusercontent.com; 2006 [accessed 25.04.10].
nergy Reviews 15 (2011) 2262–2289 2289
[89] NRI. Renewable energy policy – India. http://www.nri.org/projects/biomass/conference papers/policy material section 3.pdf; 2010[accessed 05.06.10].
[90] Shukla PR. Biomass energy in India: policies and prospects.http://www.decisioncraft.com/energy/papers/ecc/re/biomass/bpi.pdf;2010 [accessed 05.06.10].
[91] Shukla PR. Biomass energy in India: transition from traditional to modern.http://www.decisioncraft.com/energy/papers/ecc/re/biomass/bti.pdf; 2010[accessed 05.06.10].
[92] U.S. Department of Energy. Biomass policy. http://www1.eere.energy.gov/biomass/biomass policy.html; 2010 [accessed 17.06.10].
[93] Thy P, Jenkins BM. Mercury in biomass feedstock and combustion residuals.Water, Air Soil Pollut 2009;209:429–37.
[94] BEC Biomass Energy Crop & Biomass Power Working Group.A summary of NOx emissions reduction from biomass cofiring.www.treepower.org/cofiring/NOx-dayton.doc; 2010 [accessed 28.02.10].
[95] Van Loo S, Koppejan J. The handbook of biomass combustion and co-firing.Earth scan, UK; 2008.
[96] Sahin Y. Environmental impacts of biofuels. Energy Edu Sci Technol PART A –Energy Sci Res 2011;26(2):129–42.
[97] Demirbas A. Social, economic, environmental and policy aspects of biofuels.Energy Edu Sci Technol Part B – Energy Sci 2010;2(1–2):75–109.
[98] Belle-Oudry DA, Dayton DC. Analysis of combustion products from the cofir-ing of coal with biomass fuels. Natl Renew Energy Lab 2000:1096–100.
[99] Demirbas AH. Biofuels for future transportation necessity. Energy Edu SciTechnol Part A – Energy Sci Res 2010;26(1):13–23.
[100] Demirbas B. Biofuels for internal combustion engines. Energy Edu Sci TechnolPart A – Energy Sci Res 2009;22(2):117–32.
[101] Demirbas B. Biomass business and operating. Energy Edu Sci Technol Part A– Energy Sci Res 2010;26(1):37–47.
[102] Demirbas T. Overview of bioethanol from biorenewable feedstocks: technol-ogy, economics, policy, and impacts. Energy Edu Sci Technol Part A – EnergySci Res 2009;22(2):163–77.
[103] Duval Y. Environmental impact of modern biomass cogeneration in SoutheastAsia. Biomass Bioenergy 2001;20:287–95.
[104] http://publications.environment-agency.gov.uk/pdf/GEHO0305BIWI-E-E.pdf; 2010 [accessed 05.03.10].
[105] McIlveen-Wright DR, Huang Y, Rezvani S, Wang Y. A technical and envi-ronmental analysis of co-combustion of coal and biomass in fluidised bedtechnologies. Fuel 2007;86:2032–42.
[106] Balat H. Prospects of biofuels for a sustainable energy future: A critical assess-ment. Energy Edu Sci Technol Part A – Energy Sci Res 2010;24(2):85–111.
[107] Hughes EE, Tillman DA. Biomass cofiring: status and prospects 1996. Fuel
[109] NYSERD New York State Energy Research and Development Authority.Biomass combustion in europe overview on technologies and regulations.http://www.nyserda.org; 2008 [accessed 05.03.10].