Embed Size (px)
Citation preview
PV POWER PLANT TECHNOLOGY AND BUSINESSVolume 05 December 2015
Facing the elements
Market Watch The price-busting Dubai project leading the way for Middle East solar
FinanceGlobal opportunities for solar securitisation
System Integration How PV fi re safety is creating heat in the US solar industry
Storage & GridsThe vital role of Big Data in distributed energy management
PV hardware, construction and O&M in extreme environmentspages 21, 38, 51, 55, 61, 72
regulars
3 www.pv-tech.org | December 2015 |
Published bySolar Media Ltd.3rd Floor, America House, 2 America Square, London, EC3N 2LU, UKTel: +44 (0) 207 871 0122www.pv-tech.org
Publisher: Chris Riley
EditorialHead of content:Ben Willis
Deputy head of content: John Parnell
Senior news editor:Mark Osborne
Reporters:Andy Colthorpe, Tom Kenning, David Pratt, Liam Stoker
Design & productionDesign and production manager:Sarah-Jane Lee
Sub-editor:Stephen D. Brierley
Production:Daniel BrownTina Davidian
Infographics:Leonard Dickinson
AdvertisingSales director:David Evans
Account managers: Matthew Bosnjak, Graham Davie, Colin Michael, Lili Zhu
Printed by Buxton Press Ltd., Derbyshire
PV Tech Power Volume 05, 2015ISSN: 2057-438X
While every eff ort has been made to ensure the accuracy of the contents of this supple-ment, the publisher will accept no respon-sibility for any errors, or opinion expressed, or omissions, or for any loss or damage, consequential or otherwise, suff ered as a result of any material here published.
The entire contents of this publication are protected by copyright, full details of which are available from the publisher. All rights reserved. No part of this publication may be reproduced, stored in a retrieval system or transmitted in any form or by any means – electronic, mechanical, photocopying, re-cording or otherwise – without the prior per-mission of the copyright owner.
PV’s first big growth spurt was arguably in places where it made least sense – the northern hemisphere lands where the financial means to back a comparatively untried technology compensated for the sub-optimal conditions. Now the locus of attention is shifting to emerging economies where almost the inverse situation prevails, and great solar resources offset the general absence of subsidies.
This journey into new territories is inevitably exposing PV to a host of challenging conditions. In this issue of PV Tech Power we focus on some of the emerging technologies and logistical tightrope walking that together are helping solar move out of its comfort zone and into the wider world.
We kick off with an account of the new module technologies being specifically designed for the Atacama Desert (p.55), where the irradiance is among the best in the world but the conditions particularly harsh. The team of Chilean and German researchers working on the so-called AtaMo project give us an insight into the development of a panel that will stand up to these conditions but also help Chile make the most of its enviable resources. We ask whether tailoring cell and module technologies in this way to countries or regions displaying particular conditions will be a viable strategy for manufacturers seeking a competitive edge in emerging markets (p.51).
Building PV in desert conditions inevitably means dust and sand, and various cleaning regimes and technologies are being implemented to minimise performance losses from soiling. But as engineers from testing house PI Berlin discuss on p.72, there’s cleaning and there’s cleaning, and the wrong type
of cleaning on certain module surfaces can actually cause long-term damage.
We also look at mounting, one of the unsung heroes of a PV system (p.61). Although it’s the modules in a system that cost the most, it’s the mounting structure that has to bear the modules for 20, 25 or even 30 years. Add to the equation the prospect of high wind, snow, salt spray and even earthquakes, and it’s clear that there’s much the modern mounting system must be able to take.
Also in the spotlight in this issue is the Middle East (p.21), a part of the world that regularly comes top of the list of PV markets to watch. Years of talk about the potential for solar in the Middle East have in 2015 given way to some serious action. One notable project has been Dubai’s Sheikh Mohammed bin Rashid al Maktoum Solar Park, which caught attention earlier in the year when it attracted a record-low bid of under US$0.06/kWh.
Some doubters questioned whether such a low price represented the start of a race to the bottom that would result in a swathe of undeliverable or at best poor quality installations. But as we report, the consensus seems to be that the project is just what is needed to break the logjam in a region that stands to benefit hugely from PV.
With all this and much more, we hope you find this issue of PV Tech Power an indispensible source of information. Thanks for your support in 2015. We look forward to bringing you more in-depth reports from the world PV in 2016.
Ben WillisHead of content
Brands of Solar Media:
Introduction
Cover illustration by Leonard Dickinson
regulars
4 | December 2015 | www.pv-tech.org
Contents
08-13 NewsRound-up of the biggest stories in PV from around the world.
21-27 Market watch21-24 How Dubai will deliver sub-6¢ solar
The project causing a stir in the Middle East
25-27 Cracking the India solar nut Barriers to entry for foreign players
30-37 Financial, legal, professional30-32 Solar securitisation – growing global opportunities
Prospects for a promising new source of finance for solar
33-37 Technical Briefing Reducing risk in the secondary solar market By Emanuele Tacchino, Alectris
38-50 Design & build38-42 Just-in-time delivery of PV power plants
Logistics for successful project execution in challenging new markets
43-47 Technical Briefing Pyranometers versus reference cells for solar monitoring By Peter N. Johnson, AWS Truepower
48-50 Solving the soft-cost puzzle Slashing soft costs in US solar
26
21
30
38
51
68

regulars
6 | December 2015 | www.pv-tech.org
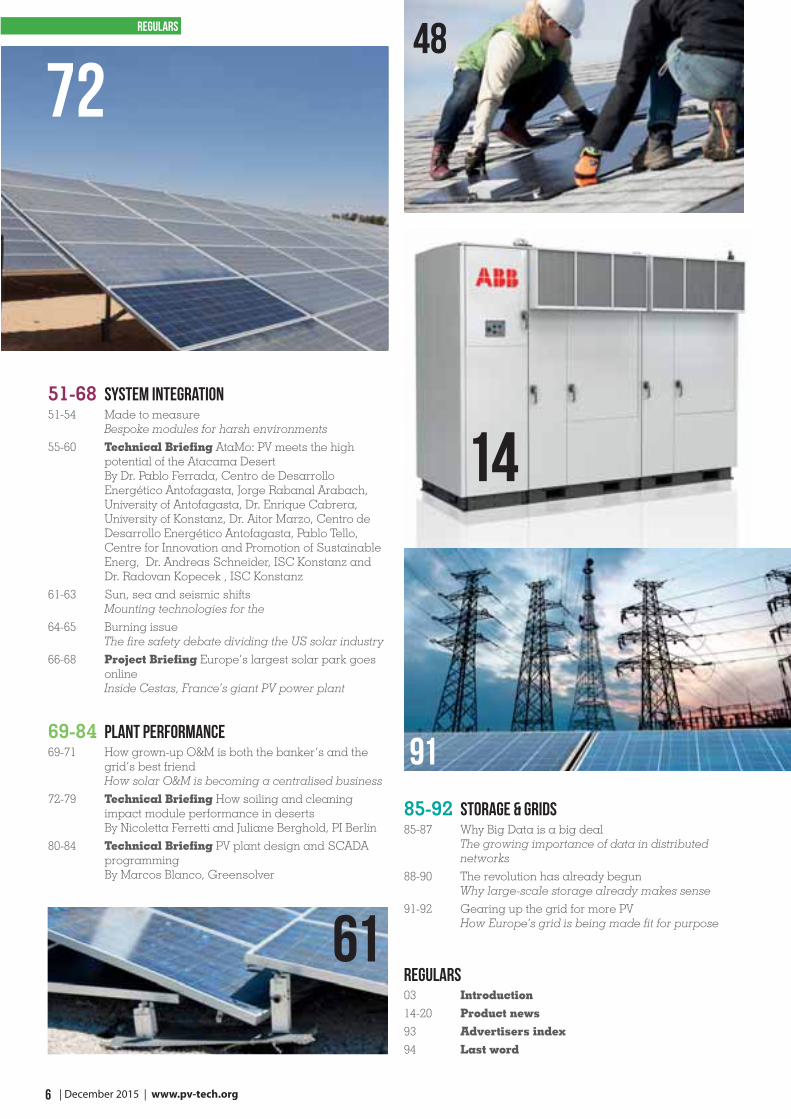
51-68 system integration51-54 Made to measure
Bespoke modules for harsh environments
55-60 Technical Briefing AtaMo: PV meets the high potential of the Atacama Desert By Dr. Pablo Ferrada, Centro de Desarrollo Energético Antofagasta, Jorge Rabanal Arabach, University of Antofagasta, Dr. Enrique Cabrera, University of Konstanz, Dr. Aitor Marzo, Centro de Desarrollo Energético Antofagasta, Pablo Tello, Centre for Innovation and Promotion of Sustainable Energ, Dr. Andreas Schneider, ISC Konstanz and Dr. Radovan Kopecek , ISC Konstanz
61-63 Sun, sea and seismic shifts Mounting technologies for the
64-65 Burning issue The fire safety debate dividing the US solar industry
66-68 Project Briefing Europe’s largest solar park goes online Inside Cestas, France’s giant PV power plant
69-84 Plant performance69-71 How grown-up O&M is both the banker’s and the
grid’s best friend How solar O&M is becoming a centralised business
72-79 Technical Briefing How soiling and cleaning impact module performance in deserts By Nicoletta Ferretti and Juliane Berghold, PI Berlin
80-84 Technical Briefing PV plant design and SCADA programming By Marcos Blanco, Greensolver
85-92 storage & grids85-87 Why Big Data is a big deal
The growing importance of data in distributed networks
88-90 The revolution has already begun Why large-scale storage already makes sense
91-92 Gearing up the grid for more PV How Europe’s grid is being made fit for purpose
Regulars03 Introduction
14-20 Product news
93 Advertisers index
94 Last word
82
886272
14
48
61
91
When a little pastemeans a lot of power.
DuPont™ Solamet®
photovoltaic metallizations
DuPont™ Solamet® photovoltaic metallizations have enabled manufacturers to decrease the amount of paste required to produce each solar cell by up to 50% in the last 3 to 4 years, resulting in substantial cost savings.
Reduced overall system costs benefit system owners by lowering levelized cost of electricity, on a cost per kilowatt-hour basis, over the lifetime of their system.
Materials Matter™ solamet.dupont.com
Copyright © 2015 DuPont. All rights reserved. The DuPont Oval Logo, DuPont™ and Solamet® are trademarks or registered trademarks of E.I. du Pont de Nemours and Company or its affiliates.
NEWS | from PV-Tech.org
8 | Decemeber 2015 | www.pv-tech.org
Europe
Jobs forecastAction urged to reverse decline in European solar jobsPolicymakers are facing calls to take action to boost Europe’s solar industry job numbers, which have been in decline since 2011. Research by consultancy EY for SolarPower Europe puts the number of solar jobs in Europe at 110,000, substantially down on the 2011 fi gure of 250,000. Despite the drop, the report reveals Europe’s solar sector could see employment rise to around 140,000 by 2020 if it is given the right help. “For Europe to reach the European Commis-sion’s ambition to be the number one in renewables we need to accelerate the deployment of solar considerably in the coming years,” said SolarPower Europe’s CEO James Watson. “This will boost employment and wealth generation far beyond the forecasts in this study.”
COP21France and India launch International Solar AllianceIndian prime minister Narendra Modi and French president Francois Hollande jointly launched the International Solar Alliance (ISA) at the COP21 climate conference in Paris. The proposed alliance, also named International Agency for Solar Technologies and Applica-tions (IASTA), is aiming to have over 100 countries join, including US, China and France as well as countries situated between the Tropics of Cancer and Capricorn. It will focus on giving momentum
to solar energy policies, increasing cooperation over best and new technologies and bringing faster cost reductions. It is also expected to support developing countries in adopting renewable energy through knowledge sharing and a reduction in costs.
P2P energy tradingRebranded Sonnenbatterie unveils new serviceSonnenbatterie has launched a new platform aimed at enabling trading of surplus power from solar PV coupled with its battery systems, rebranding as Sonnen in the process. SonnenCommunity combines distributed generation, battery technology and digital networking to create a new way of buying and selling electricity without the need for a traditional power company. Customers can make an additional profi t to their feed-in tariff (FiT) income and pay what Sonnen describes as “signifi cantly below the average of traditional suppliers” for electricity not generated by their own PV-plus-storage systems. The platform links together Sonnen custom-ers in Germany and can select trading opportunities in real-time. The process is automated by Sonnen’s software, meaning consumers will have visibility into the trading but will not be required to do anything besides sign up.
Import Tax‘Unpleasant surprise’ could have little impactTurkey recently approved an import tax on all solar modules coming into the country, based on weight criteria rather than Watt peak. The rules apply from 19 December, 2015. Solar association Solarbaba claimed the news came as an “unpleasant surprise” to many stake-holders, however Adiyaman said: “The new tax issue will not have too much impact on the Turkish market in regard to module imports, because if you have an investment certifi cate you do not pay any VAT at all.” He claimed it is very easy to obtain an investment certifi cate, but said rules could possibly change in a couple of months when the economics ministry sees that there has been no impact.
UKNet metering and private PPAs to be a ‘tipping point’The future of solar lies in a combination of private wire PPAs and a government-backed net metering scheme, according to former UK energy minister Lord Barker. Speaking at the UK Renewable Energy Association’s ‘Renewable Futures’ event alongside ex-energy secretary Ed Davey, Barker said large-scale solar developers would seek to build out solar parks on the back of signing direct wire power purchase agreements (PPAs) with utilities and other companies in the absence of subsidies. He also said he would urge current secretary of state Amber Rudd to look into establishing a net metering scheme “further down the line”, particularly when domestic storage technologies become more widespread. “There is a tipping point coming, and we need to realise it,” Barker said.
New foreign investmentCanadian Solar to develop seven UK solar farmsCanadian Solar has secured a US$28.9 million loan to develop seven ground-mount solar farms in the UK. The fi rm signed a fi nancing agreement with Royal Bank of Scotland that provided a term loan to construct the plants, which have a total installed capacity of 38MWp, taking Canadian Solar’s UK portfolio to 78MW. While Canadian Solar has not disclosed the names or locations of the assets in question, PV Tech Power’s sister publication Solar Power Portal revealed that the manufacturer had broken ground on a large solar farm in Scotland.
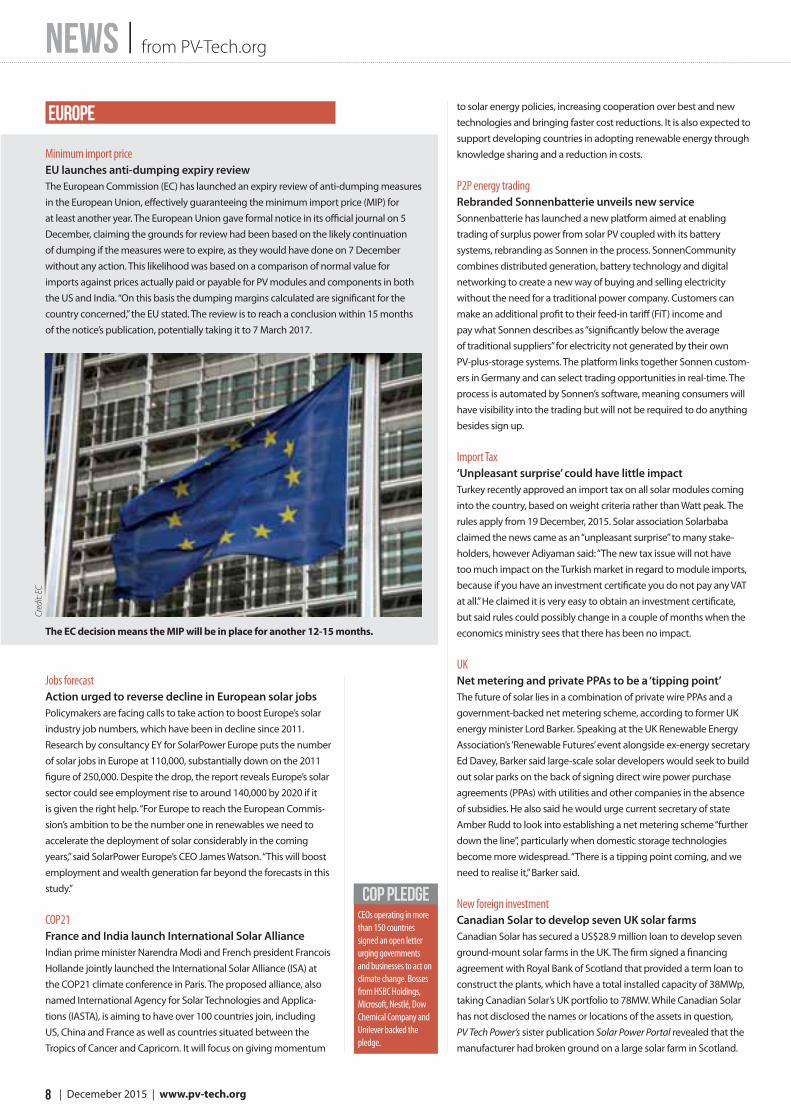
The EC decision means the MIP will be in place for another 12-15 months.
Minimum import priceEU launches anti-dumping expiry reviewThe European Commission (EC) has launched an expiry review of anti-dumping measures in the European Union, eff ectively guaranteeing the minimum import price (MIP) for at least another year. The European Union gave formal notice in its offi cial journal on 5 December, claiming the grounds for review had been based on the likely continuation of dumping if the measures were to expire, as they would have done on 7 December without any action. This likelihood was based on a comparison of normal value for imports against prices actually paid or payable for PV modules and components in both the US and India. “On this basis the dumping margins calculated are signifi cant for the country concerned,” the EU stated. The review is to reach a conclusion within 15 months of the notice’s publication, potentially taking it to 7 March 2017.
CEOs operating in more than 150 countries signed an open letter urging governments and businesses to act on climate change. Bosses from HSBC Holdings, Microsoft, Nestlé, Dow Chemical Company and Unilever backed the pledge.
Cred
it: E
C
COP PLEDGE
NEWS
9 www.pv-tech.org | Decemeber 2015 |
BrazilBrazil approves ‘historic’ net-metering schemeBrazil’s energy regulator National Electric Energy Agency (ANEEL) has approved an “historic” revision of the country’s net metering scheme for small-scale renewable energy systems, making it amongst the most forward-thinking countries in this sector, according to Rodrigo Sauaia, the director of Brazil’s solar industry association, Absolar. The revision, which has been scheduled since the net metering regula-tions were first implemented several years ago, came about after the realisation that the number of installed small-scale distributed generation energy systems is still relatively small compared to Brazil’s potential. There are currently 1,300 installed systems connected to the grid of which 96% is solar PV, said Sauaia. Under the revision, Brazil now has ‘virtual net metering’, which means any company or consumer can install an energy system at different points of electric-ity use and still get credits, which can be used to abate consumption costs on another unit.
StorageFirst utility sales of Tesla Powerwall include ‘zero up front’ optionThe first Tesla Powerwall home energy storage systems to go on sale in the US through a utility are being sold through Vermont’s Green Mountain Power, which is including a “no upfront cost” option for its customers. Green Mountain Power serves just over a quarter of a million customers and has ordered 500 Powerwall units from the Elon Musk-led manufacturer, which it expects to take delivery of in January. Tesla had original-ly launched Powerwall and its commer-cial/utility-scale counterpart Powerpack to great fanfare in April and touted its expected availability before the end of 2015, leading Green Mountain Power and others to widely advertise that Powerwall would be on shelves in that timeframe.
FranceMinistry names winning solar projectsOver 200 projects are set to benefit from the feed-in tariff programme run by the French Ministry of Ecology, Sustainable Development and Energy (MEDDE). The 212 winning projects from the 800MW solar energy auction range from 0.4MW to 12MW in capacity. The average tariff for large rooftop solar installations was €129/MWh (US$140), down 18% from €158/MWh in the previous auction held nearly two years ago. The average price for ground-mount facilities also fell, down 15% from €146 to €124. In addition, the ministry announced that nearly €1 billion will be invested in solar parks – expected to produce 1.1TWh of electricity annually – to give impetus to solar in the French industrial sector. New solar tenders will be launched in early 2016.
americas
MarketUS market enjoys record-breaking fourth quarterA report by GTM Research and the Solar Energy Industries Associa-tion (SEIA) forecasts 2015 as the biggest year ever for US solar with record-breaking estimates for the fourth quarter. According to the report, titled US Solar Market Insight Report, Q3 2015, the US installed 1361MW of PV capacity in the third quarter of 2015 – the eighth consecutive quarter in which the US has installed over 1GW of capacity. Cory Honeyman, GTM Research senior solar analyst, said: “This past quarter marked the calm before the storm. The one-gigawatt mark for quarterly capacity additions will serve as a distant floor as project developers ramp up installations in the next five quarters before the planned step down of the 30% federal Investment Tax Credit (ITC).”
DealGoogle claims ‘biggest ever non-utility power purchase’Search engine and information tech giant Google has purchased the output of renewable energy generation facilities totalling 841MW across several global territories. The latest purchases include the procurement of 61MW of solar from US utility Duke Energy, which is still under development, as well as a further 781MW. The purchase agreements have term lengths that vary from 10 to 20 years, and will be used to power Google’s own operations, including data centres. The company has to date invested in more than 2GW of renewable energy facilities and claimed that the 841MW of deals is the “biggest ever non-utility purchase” of renewable energy. Its most recently announced data centre, in Alabama, will be 100% renewable powered from its inauguration.
Pricing US utility-scale solar averages five cents per kWhFurther evidence has been delivered of the rapid fall in the cost of utility-scale solar in the US, which dropped to an average of US$0.05 per kilowatt hour, according to a report by Lawrence Berkeley National Laboratory. The price of power purchase agreements (PPAs), long-term contracts between project developers and utilities, has also declined 70% in the past six years since 2009, with installed project costs also falling by 50% since then. The report, ‘Utility-Scale Solar 2014’, looked at nearly 200 PV projects as well as a handful of CSP and CPV projects. The report’s authors, Mark Bolinger and Joachim Seel, defined utility-scale as any project over 5MW capacity.
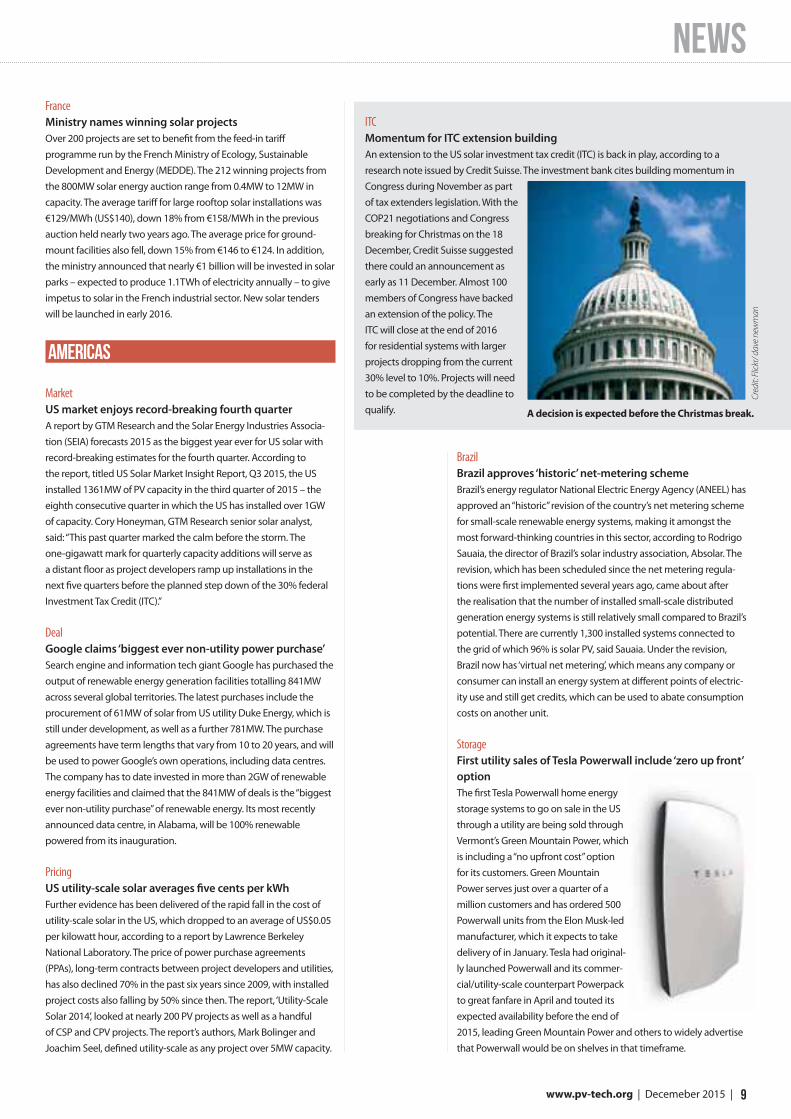
ITCMomentum for ITC extension building An extension to the US solar investment tax credit (ITC) is back in play, according to a research note issued by Credit Suisse. The investment bank cites building momentum in Congress during November as part of tax extenders legislation. With the COP21 negotiations and Congress breaking for Christmas on the 18 December, Credit Suisse suggested there could an announcement as early as 11 December. Almost 100 members of Congress have backed an extension of the policy. The ITC will close at the end of 2016 for residential systems with larger projects dropping from the current 30% level to 10%. Projects will need to be completed by the deadline to qualify.
Cred
it: F
lickr
/ dav
e ne
wm
an
A decision is expected before the Christmas break.
NEWS | from PV-Tech.org
10 | Decemeber 2015 | www.pv-tech.org
ChileDeutsche Bank praises Chilean solar potential but warns of grid risk Solar has become the cheapest source of energy in Chile, according to results from the country’s latest power tender in October, but issues remain with transmission lines, according to a Deutsche Bank report. While renewables came away with all of the 1,200GWh capac-ity available in the auction, there were bids between US$65-68/MWh for three solar parks, while two wind farms were bid for at US$79/MWh and coal power was bid for at a higher price of US$85/MWh. A market research report on ‘Chile Solar’ from Deutsche Bank research analyst Vishal Shah and research associate Jerimiah Booream-Phelps, said that solar is now at grid parity, adding: “Chile solar and wind are now cheaper sources of power generation in Chile than fossil fuels,” before warning that many of the country’s 2.1GW of approved projects “are unlikely to get built until the transmission lines get fixed”.
middle east & africa800MW tender latestJinko, REC and EDF throw hat in ring for Dubai’s 800MW solar tenderAround 20 bidders have entered the frame for the latest 800MW phase of Dubai’s flagship solar project, according to the Middle East Solar Industry Association. The third tender in the Mohammed bin Rashid Al Maktoum Solar Park drew attention from a wide range of players including Jinko Solar, SunEdison and REC Solar. A number of interesting partnerships have emerged. French utility Engie, which recently merged with SolaireDirect, has partnered with Japanese conglomerate Marubeni while Jinko Solar has partnered with German utility giant RWE. Regionally-owned developer Fotowatio Renewable Ventures is working with Abu Dhabi’s clean energy hub Masdar.
New playersGerman solar developer to sets up in EgyptKRAFTWERK Renewable Power Solutions will open an office in Egypt after securing the development contract for a 50MW plant in the country. The company had worked with Cairo Solar Farm, an SPV, to conduct the pre-feasibility study and guide it through Egypt’s competitive feed-in tariff (FiT) programme. “The available grid capac-ity is the most important factor and determines technical feasibility,” said Karsten Schulte, managing director, KRAFTWERK. “Because of the Egyptian grid infrastructure, which is determined by the transfer of significant capacities from the Assuan hydro power station, the transmission highway provides a good basis for integrating utility-scale PV power plant capacities.” The plant in Benban will be connected to a 220kV high-voltage line Schulte said, adding that it would generate sufficient electricity for 50,000 Egyptian families.
UK developer establishes base in DubaiUK solar developer Hive Energy is to make its first break into the international solar market by opening a new office in Dubai. Its Middle East regional headquarters will be led by the company’s Middle East, Africa and Indian Ocean Island director Colin Loubser and will target potentially lucrative solar opportunities throughout the region. “Solar power in the United Arab Emirates has the poten-tial to provide most of the country’s electricity demand. Although a major oil producing country, the UAE is taking significant steps
towards introducing solar power on a large scale,” said Giles Redpath, chief executive at Hive Energy.
Jordan procurementFotowatio signs PPA in Jordan for 50MWSaudi-owned Spanish firm Fotowatio Renewable Ventures has signed an agreement with Jordan’s utility company to build a 50MW PV power plant in the country. Under the 20-year power purchase (PPA) agreement with Jordan’s National Electric Power Company, electricity from the plant will be sold at 6.93 US cents per kilowatt hour. Fotowatio, owned by Jeddah-based Abdul Lateef Jameel Energy and Environmental Services, was selected as a preferred bidder under the 200MW second round of Jordan’s solar tender, held
SunEdison’s quarter to forgetSunEdison and its yieldco TerraForm Power endured a diffi-cult quarter with job losses, internal changes and financial reorganisation.
October 5SunEdison tells the stock exchange that it will have to cut 15% of its global workforce, or around 1000 people
October 7In its quarterly results conference call, SunEdison says it will “de-emphasise” certain markets, including the UK. It also confirmed it was reducing its 2016 project guidance by 20%
November 17The residential installer currently being acquired by SunEdison, Vivint Solar, announces that install figures and bookings had stalled
November 23TerraForm Power CEO Carlos Domenech leaves the company with immediate effect with SunEdison EVP Brian Wuebbels assuming the role
December 1Appaloosa Management takes a 9.25% stake in Terra-Form and publishes open letter questioning purchase of Vivint Solar and the relationship between the yield co and SunEdison
December 2SunEdison cancels its US$250 million acquisition of Brazil’s Renova Energia
timeline
Cred
it: S
unEd
ison

#SFIUK1-3 February 2016 London, UK
Solar Media’s Solar Finance & Investment Europe Forum returns to London on 1-3 February 2016
FEB 1: Asset Management dayFEB 2 - 3: European Secondary Markets & Making Solar Work Post-Subsidy
WE ARE BRINGING TOGETHER:
• Major European asset holders looking to enlarge their portfolios• Banks ready to refi nance projects• Developers with projects to sell• Institutional investors looking how to balance their liabilities and assets with long-term investments
TO HELP YOU NAVIGATE HOW TO TAKE ADVANTAGE OF THE OPPORTUNITIES WITHIN:
• European Secondary markets: YieldCos and listed funds, project supply, M&A• Refi nancing: how to do it best• Asset management and best practice O&M• Post-subsidy market• Tendering and development in Europe
Use Discount Code ‘PVTP15’ for a
15% discount*
fi nance.solarenergyevents.com
Nick BoyleCEO, Lightsource Renewable Energy
Sir David KingUK Foreign Secretary’s Special Representative for Climate Change
Armin SandhoevelCIO Infrastructure EquityAllianz Global Investors GmbH
Thierry LepercqPresidentSolairedirect
Michael Bonte- FriedheimCEONextEnergy Capital
Over 40 speakers confi rmed including:
Exclusive to PV Tech Power Readers. Offer ends 31/12/2015
NEWS | from PV-Tech.org
12 | Decemeber 2015 | www.pv-tech.org
earlier this year. It is the first bidder under this round to complete a PPA. The 50MW project will be built near Mafraq in northern Jordan. Completion is scheduled for 2017, after which the plant is expected to generate 155 million kWh of power, representing around 1% of Jordan’s generation capacity.
NigeriaUS$100 million deal signed for Nigeria’s first utility-scale projectDeveloper Access Infra Africa and asset management firm Quaint Global Energy Solutions are to co-invest in a 50MW PV project in Nigeria. The two companies will jointly invest US$100 million in the ABIBA solar project in Nigeria’s Kaduna state. The project would be the first significant solar array in Nigeria, where expectation over the country’s potential solar market has yet to translate into any meaningful installed capacity. Speaking at a signing ceremony in Nigeria’s Ministry of Power headquarters in Abuja, Reda El Chaar, executive chairman of Access, said: “We see this project as a gateway to the widespread adoption of renewable energy in Africa’s largest economy, whilst cementing the role of ACF as an innovative platform for turning good concepts into bankable projects.”
North AfricaAlgeria gets its first IPPSolar energy firm Condor Electronics Algeria is developing a 2MW
solar PV project in Algeria with UK-based solar developer Renewable Energy Partner. Toufik Benamara head of solar module manufactur-ing, Condor Electronics said: “We are excited to be working with Renewable Energy Partner, a leader in the country for solar photovol-taic project development. For us at Condor it is very strategic to work side-by-side with pioneering companies like Renewable Energy Partner. This cooperation will enable Condor to use its position as a manufacturer of solar panels in order to become a leading independent power producer in Algeria whose mission is to provide sustainable, clean and accessible energy to all. We see this project as the start of many more to come.”
KenyaEnel Green Power to partner for Kenyan mini-gridsEnel Green Power is partnering up with mini-grid technology solutions provider and developer Powerhive to construct and operate mini-grids in 100 villages located across Kenya. The grids will require an investment of around US$12 million over the span of 2016 – 93% provided by Enel Green Power and 7% from Powerhive. The project, which will be developed by Powerhive, will be comprised of solar mini-grids with a total installed capacity of 1MW and will be built in the Kenyan counties of Kisii and Nyamira. Once completed, the grids will provide clean energy to 20,000 homes, businesses, schools and health care centres, providing power for around 90,000 people in the process.
asia-pacificIndia’s energy mixKPMG predicts major disruption from solar in India over next decadeSolar prices in India could be substantially lower than coal by 2020, helping the technology become a major part of the country’s energy mix, said a KPMG report. Over the next decade solar will scale up significantly, reaching a 12.5% market penetration by 2025. A key factor in this scenario is the falling cost of solar, with predictions that by 2020, solar power will have reached INR4.20/kWh and INR3.59/kWh by 2025, up to 10% lower than coal. While rooftop PV is already competitive in India for many industrial, commercial and some residential customers, it is being held back by immature or non-existent net metering policies and the poor state of India’s grid. This could change with a significant evolution expected in storage technologies.
PolicyRevision to India’s RPO ready for approvalIndia’s Ministry of New and Renewable Energy (MNRE) is sending a revision of the Renewable Purchase Obligation (RPO) to the country’s Union Cabinet for approval. India’s distribution compa-nies are mandated to purchase a certain amount of their energy from renewable sources under the RPO. MNRE joint secretary Tarun Kapoor said the RPO is most important regulatory and policy mecha-nism to drive solar. Current national tariff policy discusses a 3% RPO in order to reach the original National Solar Mission targets, but now with 100GW by 2022 target confirmed, the separate RPO for solar will have to rise up to anything between 8-10% up until 2022. Some state regulators have not even fixed an RPO above 1% yet. Energy minister Piyush Goyal’s recently released UDAY package aiming to alleviate Distribution company debts should make it easier to enforce the RPOs.
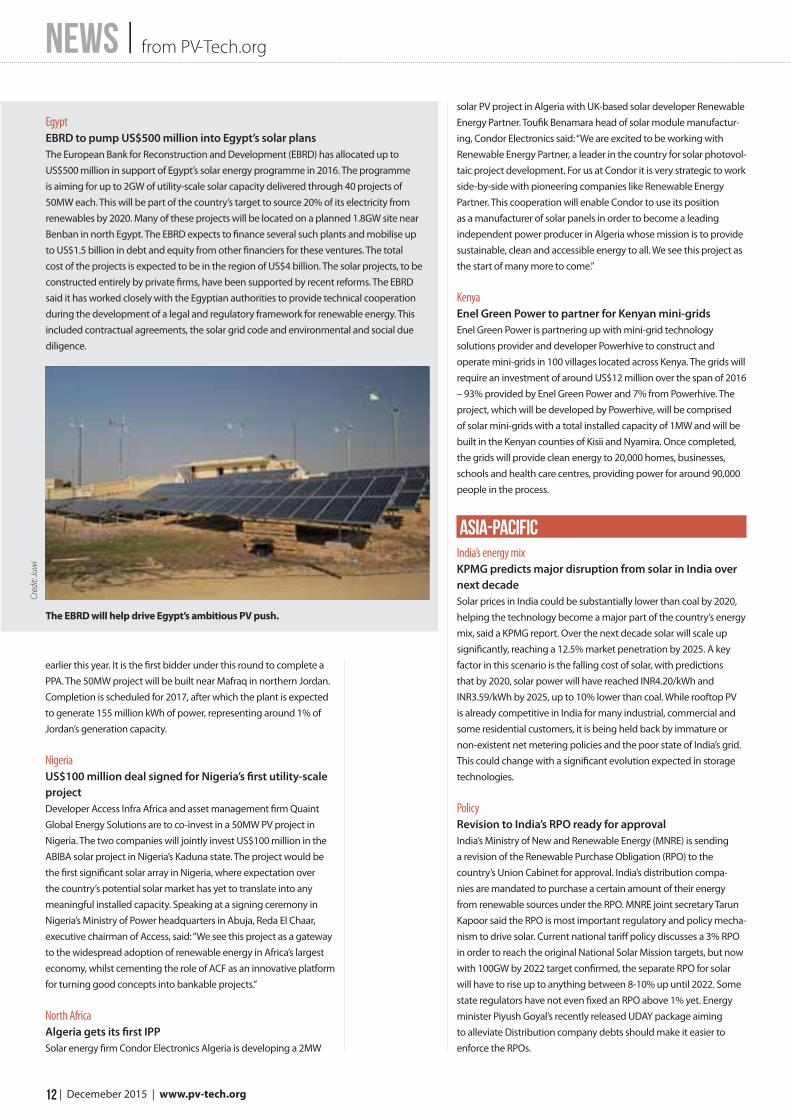
The EBRD will help drive Egypt’s ambitious PV push.
EgyptEBRD to pump US$500 million into Egypt’s solar plansThe European Bank for Reconstruction and Development (EBRD) has allocated up to US$500 million in support of Egypt’s solar energy programme in 2016. The programme is aiming for up to 2GW of utility-scale solar capacity delivered through 40 projects of 50MW each. This will be part of the country’s target to source 20% of its electricity from renewables by 2020. Many of these projects will be located on a planned 1.8GW site near Benban in north Egypt. The EBRD expects to finance several such plants and mobilise up to US$1.5 billion in debt and equity from other financiers for these ventures. The total cost of the projects is expected to be in the region of US$4 billion. The solar projects, to be constructed entirely by private firms, have been supported by recent reforms. The EBRD said it has worked closely with the Egyptian authorities to provide technical cooperation during the development of a legal and regulatory framework for renewable energy. This included contractual agreements, the solar grid code and environmental and social due diligence.
Cred
it: Ju
wi
NEWS
13 www.pv-tech.org | Decemeber 2015 |
AustraliaAustralia funding programme attracts 2GW of large-scale PV proposalsA recently launched lending programme for solar has attracted enough interest to boost Australia’s large-scale PV capacity 10-fold. The Clean Energy Finance Corporation (CEFC) received over 40 expressions of interest for loans under an AU$250 million (US$177.5 million) lending facility it launched earlier this year. The total capacity of the proposed projects is more than 2GW. The CEFC programme complements an AU$100 million funding programme launched at the same time by the Australian Renewable Energy Agency. Projects range in size from 15MW to 200MW, with Queensland attracting the largest number of projects bids, totalling 980MW, followed by New South Wales with 620MW. The CEFC programme will off er loans of AU$15 million and above, for projects over 10MW.
ProjectAustralia’s Queensland approves FRV’s 130MW solar farmThe government of Queensland gave planning approval for a 130MW solar farm to be developed by Spanish fi rm Fotowatio Renewable Ventures (FRV). Queensland deputy premier and minister for planning, Jackie Trad, used her call-in powers to approve the AU$400 million (US$284 million) project, which is located southwest of Ayr, Australia. This latest approval comes after a series of initiatives from the Queensland government to aid the progress of solar. The state has committed to 50% electricity generation from renewables by 2030. Meanwhile, under its Solar 60 initiative, it has committed to a 60MW auction for solar. It has also initiated an inquiry into fair pricing for solar.
Thailand tenderDevelopers and state agencies line up for bite at 600MW of Thai PV The Thai government opened its doors to prospective solar project developers, who have registered their interest in building the fi rst and largest portion of 800MW of PV projects in the country through an auction process. The initial winners of the tender process will deploy 600MW of PV in Thailand in the fi rst wave, with another 200MW expected to be awarded later. The government expects
around THB36 billion (US$1.01 billion) to be invested in the projects next year. Around 1,200 applicants are expected to apply for this fi rst tranche of projects. A mixture of private applicants and public agencies are likely to be involved.
SunPower in ChinaSunPower to build 170MW in China, Apple reported among investorsUS PV provider SunPower is to build 170MW of projects in China for two investors, one of which is rumoured to be tech giant Apple. It will build three projects in the Inner Mongolia region including a 100MW plant in Shangtuhai Village, Wuchuan County. All three projects are expected to be constructed by the end of 2016. They will be owned Tianjin Zhonghuan Semiconductor and an additional investor. SunPower has already teamed with Apple in China, announcing plans to build two 20MW projects for the company earlier this year. Separately, Apple will also build 200MW of solar in China and work with its supply chain partners in the country to develop a total of 2GW of clean energy capacity.
JapanSoftbank and Mitsui prepare to activate 111MW Japan PV arraySB Energy, the off shoot of telecoms group Softbank, and conglom-erate Mitsui have activated a 111MW PV array on Hokkaido island in northern Japan. The joint project was fi rst announced in March 2013 and had initially been scheduled for launch earlier this year. Built on 166 hectares of land near the town of Abira, the project is expected to provide power to around 30,000 households. Mitsui and SB Energy are collaborating on a number of other utility PV projects in Japan.
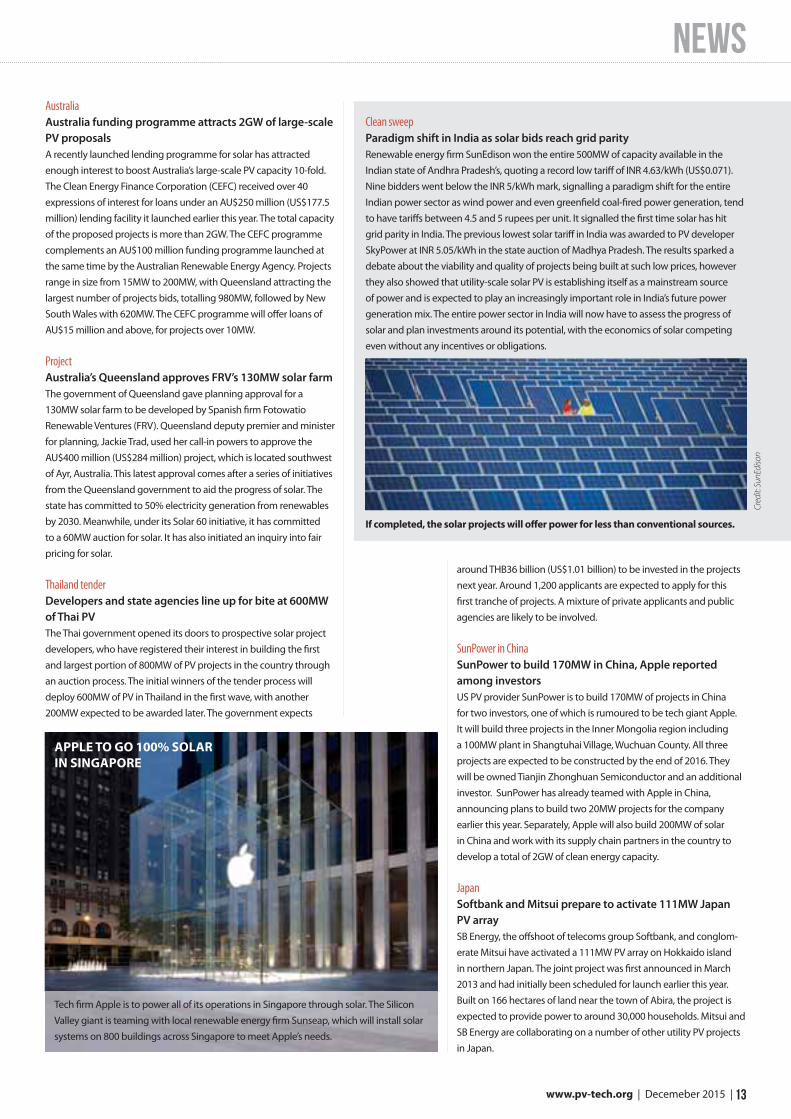
If completed, the solar projects will off er power for less than conventional sources.
Clean sweepParadigm shift in India as solar bids reach grid parityRenewable energy fi rm SunEdison won the entire 500MW of capacity available in the Indian state of Andhra Pradesh’s, quoting a record low tariff of INR 4.63/kWh (US$0.071). Nine bidders went below the INR 5/kWh mark, signalling a paradigm shift for the entire Indian power sector as wind power and even greenfi eld coal-fi red power generation, tend to have tariff s between 4.5 and 5 rupees per unit. It signalled the fi rst time solar has hit grid parity in India. The previous lowest solar tariff in India was awarded to PV developer SkyPower at INR 5.05/kWh in the state auction of Madhya Pradesh. The results sparked a debate about the viability and quality of projects being built at such low prices, however they also showed that utility-scale solar PV is establishing itself as a mainstream source of power and is expected to play an increasingly important role in India’s future power generation mix. The entire power sector in India will now have to assess the progress of solar and plan investments around its potential, with the economics of solar competing even without any incentives or obligations.
Cred
it: S
unEd
ison
Tech fi rm Apple is to power all of its operations in Singapore through solar. The Silicon Valley giant is teaming with local renewable energy fi rm Sunseap, which will install solar systems on 800 buildings across Singapore to meet Apple’s needs.
APPLE TO GO 100% SOLAR IN SINGAPORE
products
14 | December 2015 | www.pv-tech.org
Product Outline: ABB has released a low maintenance, high power outdoor central inverter, the ‘PVS980’. Overall system costs are driven down by the increased DC input voltage of up to 1,500V DC and a high power rating of up to 2,000kVA.
Problem: Large utility-scale PV power plants continue to be located in harsh environments that provide high irradiance levels and sufficient land. Central inverters have to be designed specifically to provide reliable low-cost maintenance capabilities in such extreme conditions.
Solution: One of the PVS980’s key features is its self-contained cooling system. Based on development from the ABB ACS800-38
Product Outline: AllEarth Renewables a US-based dual-axis solar tracker manufac-turer, has announced the introduction of its new L20 solar tracker designed for 72-cell PV modules with a landscape orientation option.
Problem: Dual-axis trackers can maximise a PV module’s electricity generation but have inherently carried higher BOS costs than single-axis trackers, increasing system LCOE. Having the capability to accommodate 72-cell PV modules could lower LCOE.
Solution: The L20 utilises the proven pole-mounted tracking system by AllEarth by enabling higher-power 72-cell modules, increasing the tracker advantage, while reducing material use and hardware costs. The new landscape orientation option
low-harmonic drive’s innovative cooling system, the PVS980 uses phase transition and thermosiphon technology to avoid external air entering the critical compartments of the inverter. The inverter can operate from below freezing to extreme heat in 100% humidity
without jeopardising functionality. With the simplicity of air cooling and with the power density of a liquid-cooled inverter, ABB is able to provide a low maintenance and
also improves wind loading, increases the height of the bottom row of panels from the ground, and is visually appealing in the landscape orientation, particularly for residential uses. The AllEarth Solar Tracker uses innovative GPS and wireless technol-ogy to follow the sun throughout the day,
easy-to-commission design as there are no fillable liquids, pumps, valves or inhibitors and, hence, no leaks. These low mainte-nance components are said to be capable of withstanding some of the harshest environ-ments throughout the world.
Applications: Utility-scale PV power plants for demanding applications and harsh environments.
Platform: PVS980 central inverters are available from 1,818kVA up to 2,000kVA, and are optimised for cost-effective, multi-megawatt power plants. They offer a numerous other services, including grid support features such as active and reactive power control.
Availability: Already available.
producing up to a claimed 45% more energy than a conventional fixed mounted solar array.
Applications: Ground-mounted commer-cial and utility-scale PV power plants.
Platform: The L20 is claimed to boost production by enabling higher power 72 cell modules, increasing the tracker advantage, while reducing material use and lowering hardware costs. The new product also improves wind loading and increases the height of the bottom row of panels from the ground. The complete system can be shipped on one large pallet.
Availability: The L20 will be available as a complete package to installers and develop-ers in January 2016.
Inverter ABB launches 1500V DC central inverter for harsh conditions
Tracker AllEarth Renewables dual-axis solar tracker designed for 72-cell PV modules
Product reviews
Canadian Solar offering 72-cell 320W ‘MaxPower’ series moduleCanadian Solar is offering its ‘MaxPower’ multicrystalline module in a new 320W power class. The MaxPower CS6X-320P is said to be a more robust module with higher power efficiency and comes with the brand’s 25-year linear power output warranty and a 10-year product warranty on materials and workmanship. This new power class is said to give solar installers and project developers the ability to reduce their overall balance-of-system costs for small commer-cial, large commercial, distributed generation and utility-scale projects.Pr
oduc
ts in
Brie
f
ET Solar offering optimised solar modules with integrated power regulatorET Solar has completed certification of its ET Cell Optimizer Module (COM). The ET COM modules incorporate next-generation power management integrated circuits developed by Maxim Integrated Products. The ET COM modules replace the diode function with active performance management, bringing optimisation to each cell string within the fabric of the module. By providing shade tolerance at the cell level, the ET COM modules will produce more energy. The ET COM modules are compatible with all leading inverters, monitoring equipment and mounting solutions, with an installation process identical to conventional PV modules.

DISCOVER THE WORLD OF INTERSOLAR
Intersolar Summit USA East | New York | March 24, 2016
Intersolar Summit Turkey | Istanbul | April 6, 2016
Intersolar Europe | Munich | June 22–24, 2016
Intersolar North America | San Francisco | July 12–14, 2016
Intersolar South America | São Paulo | August 23–25, 2016
Intersolar Middle East | Dubai | September 19–21, 2016
Intersolar India | Mumbai | October 19–21, 2016
Discover the World’s Leading Exhibition Series for the Solar Industrywww.intersolarglobal.com
products
16 | December 2015 | www.pv-tech.org
Prod
ucts
in B
rief
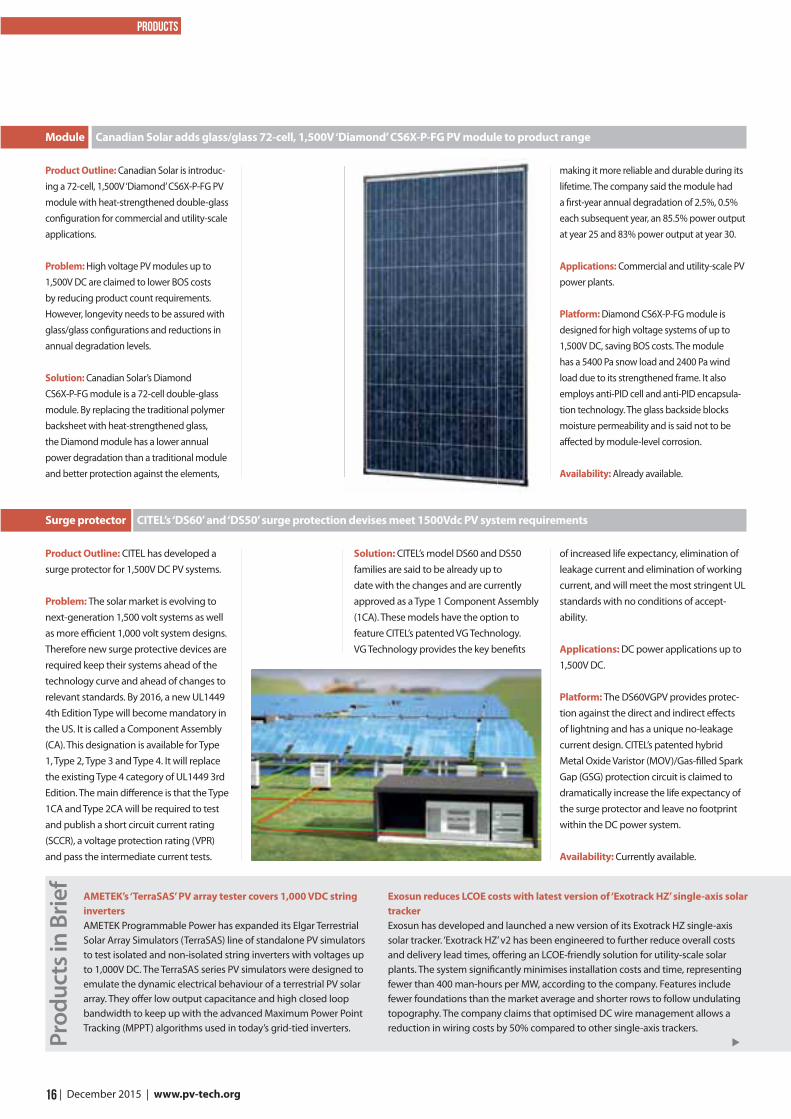
Product Outline: Canadian Solar is introduc-ing a 72-cell, 1,500V ‘Diamond’ CS6X-P-FG PV module with heat-strengthened double-glass confi guration for commercial and utility-scale applications.
Problem: High voltage PV modules up to 1,500V DC are claimed to lower BOS costs by reducing product count requirements. However, longevity needs to be assured with glass/glass confi gurations and reductions in annual degradation levels.
Solution: Canadian Solar’s Diamond CS6X-P-FG module is a 72-cell double-glass module. By replacing the traditional polymer backsheet with heat-strengthened glass, the Diamond module has a lower annual power degradation than a traditional module and better protection against the elements,
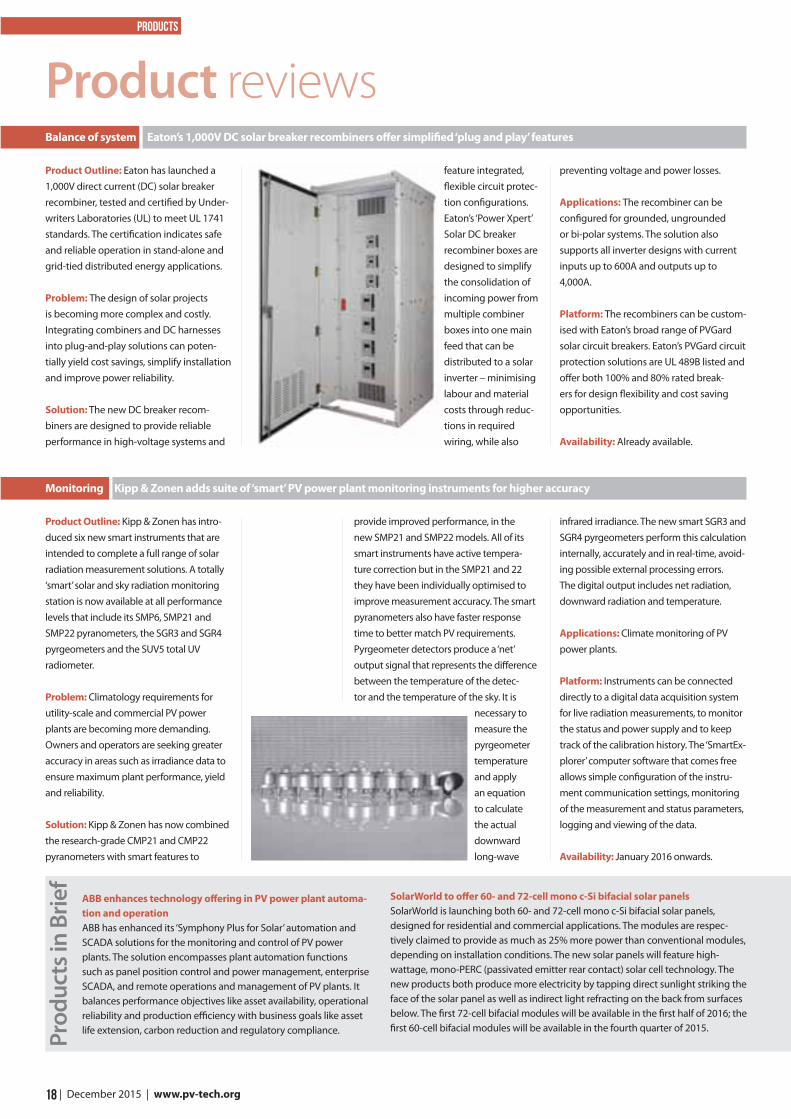
Product Outline: CITEL has developed a surge protector for 1,500V DC PV systems.
Problem: The solar market is evolving to next-generation 1,500 volt systems as well as more effi cient 1,000 volt system designs. Therefore new surge protective devices are required keep their systems ahead of the technology curve and ahead of changes to relevant standards. By 2016, a new UL1449 4th Edition Type will become mandatory in the US. It is called a Component Assembly (CA). This designation is available for Type 1, Type 2, Type 3 and Type 4. It will replace the existing Type 4 category of UL1449 3rd Edition. The main diff erence is that the Type 1CA and Type 2CA will be required to test and publish a short circuit current rating (SCCR), a voltage protection rating (VPR) and pass the intermediate current tests.
Solution: CITEL’s model DS60 and DS50 families are said to be already up to date with the changes and are currently approved as a Type 1 Component Assembly (1CA). These models have the option to feature CITEL’s patented VG Technology. VG Technology provides the key benefi ts
making it more reliable and durable during its lifetime. The company said the module had a fi rst-year annual degradation of 2.5%, 0.5% each subsequent year, an 85.5% power output at year 25 and 83% power output at year 30.
Applications: Commercial and utility-scale PV power plants.
Platform: Diamond CS6X-P-FG module is designed for high voltage systems of up to 1,500V DC, saving BOS costs. The module has a 5400 Pa snow load and 2400 Pa wind load due to its strengthened frame. It also employs anti-PID cell and anti-PID encapsula-tion technology. The glass backside blocks moisture permeability and is said not to be aff ected by module-level corrosion.
Availability: Already available.
of increased life expectancy, elimination of leakage current and elimination of working current, and will meet the most stringent UL standards with no conditions of accept-ability.
Applications: DC power applications up to 1,500V DC.
Platform: The DS60VGPV provides protec-tion against the direct and indirect eff ects of lightning and has a unique no-leakage current design. CITEL’s patented hybrid Metal Oxide Varistor (MOV)/Gas-fi lled Spark Gap (GSG) protection circuit is claimed to dramatically increase the life expectancy of the surge protector and leave no footprint within the DC power system.
Availability: Currently available.
Module Canadian Solar adds glass/glass 72-cell, 1,500V ‘Diamond’ CS6X-P-FG PV module to product range
Surge protector CITEL’s ‘DS60’ and ‘DS50’ surge protection devises meet 1500Vdc PV system requirements
AMETEK’s ‘TerraSAS’ PV array tester covers 1,000 VDC string invertersAMETEK Programmable Power has expanded its Elgar Terrestrial Solar Array Simulators (TerraSAS) line of standalone PV simulators to test isolated and non-isolated string inverters with voltages up to 1,000V DC. The TerraSAS series PV simulators were designed to emulate the dynamic electrical behaviour of a terrestrial PV solar array. They off er low output capacitance and high closed loop bandwidth to keep up with the advanced Maximum Power Point Tracking (MPPT) algorithms used in today’s grid-tied inverters.
Exosun reduces LCOE costs with latest version of ‘Exotrack HZ’ single-axis solar trackerExosun has developed and launched a new version of its Exotrack HZ single-axis solar tracker. ‘Exotrack HZ’ v2 has been engineered to further reduce overall costs and delivery lead times, off ering an LCOE-friendly solution for utility-scale solar plants. The system signifi cantly minimises installation costs and time, representing fewer than 400 man-hours per MW, according to the company. Features include fewer foundations than the market average and shorter rows to follow undulating topography. The company claims that optimised DC wire management allows a reduction in wiring costs by 50% compared to other single-axis trackers.

products
18 | December 2015 | www.pv-tech.org
Product Outline: Eaton has launched a 1,000V direct current (DC) solar breaker recombiner, tested and certified by Under-writers Laboratories (UL) to meet UL 1741 standards. The certification indicates safe and reliable operation in stand-alone and grid-tied distributed energy applications.
Problem: The design of solar projects is becoming more complex and costly. Integrating combiners and DC harnesses into plug-and-play solutions can poten-tially yield cost savings, simplify installation and improve power reliability.
Solution: The new DC breaker recom-biners are designed to provide reliable performance in high-voltage systems and
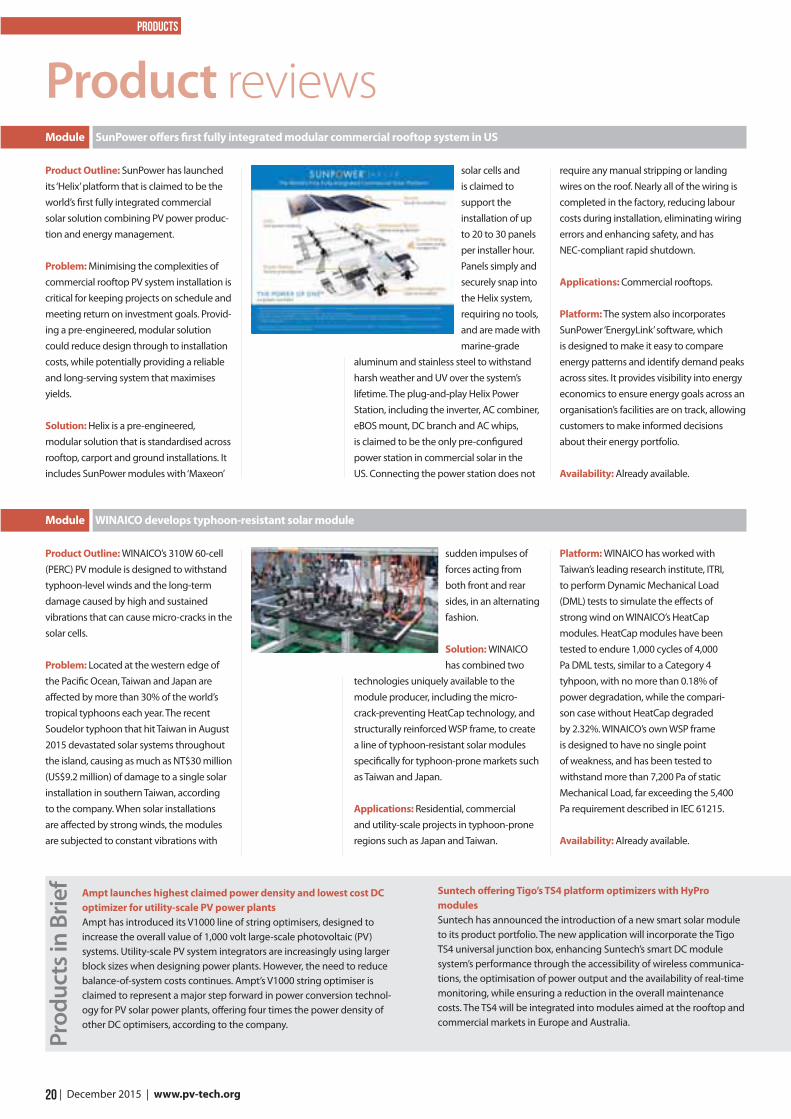
Product Outline: Kipp & Zonen has intro-duced six new smart instruments that are intended to complete a full range of solar radiation measurement solutions. A totally ‘smart’ solar and sky radiation monitoring station is now available at all performance levels that include its SMP6, SMP21 and SMP22 pyranometers, the SGR3 and SGR4 pyrgeometers and the SUV5 total UV radiometer.
Problem: Climatology requirements for utility-scale and commercial PV power plants are becoming more demanding. Owners and operators are seeking greater accuracy in areas such as irradiance data to ensure maximum plant performance, yield and reliability.
Solution: Kipp & Zonen has now combined the research-grade CMP21 and CMP22 pyranometers with smart features to
feature integrated, flexible circuit protec-tion configurations. Eaton’s ‘Power Xpert’ Solar DC breaker recombiner boxes are designed to simplify the consolidation of incoming power from multiple combiner boxes into one main feed that can be distributed to a solar inverter – minimising labour and material costs through reduc-tions in required wiring, while also
provide improved performance, in the new SMP21 and SMP22 models. All of its smart instruments have active tempera-ture correction but in the SMP21 and 22 they have been individually optimised to improve measurement accuracy. The smart pyranometers also have faster response time to better match PV requirements. Pyrgeometer detectors produce a ‘net’ output signal that represents the difference between the temperature of the detec-tor and the temperature of the sky. It is
necessary to measure the pyrgeometer temperature and apply an equation to calculate the actual downward long-wave
preventing voltage and power losses.
Applications: The recombiner can be configured for grounded, ungrounded or bi-polar systems. The solution also supports all inverter designs with current inputs up to 600A and outputs up to 4,000A.
Platform: The recombiners can be custom-ised with Eaton’s broad range of PVGard solar circuit breakers. Eaton’s PVGard circuit protection solutions are UL 489B listed and offer both 100% and 80% rated break-ers for design flexibility and cost saving opportunities.
Availability: Already available.
infrared irradiance. The new smart SGR3 and SGR4 pyrgeometers perform this calculation internally, accurately and in real-time, avoid-ing possible external processing errors. The digital output includes net radiation, downward radiation and temperature.
Applications: Climate monitoring of PV power plants.
Platform: Instruments can be connected directly to a digital data acquisition system for live radiation measurements, to monitor the status and power supply and to keep track of the calibration history. The ‘SmartEx-plorer’ computer software that comes free allows simple configuration of the instru-ment communication settings, monitoring of the measurement and status parameters, logging and viewing of the data.
Availability: January 2016 onwards.
Balance of system Eaton’s 1,000V DC solar breaker recombiners offer simplified ‘plug and play’ features
Monitoring Kipp & Zonen adds suite of ‘smart’ PV power plant monitoring instruments for higher accuracy
Product reviews
ABB enhances technology offering in PV power plant automa-tion and operationABB has enhanced its ‘Symphony Plus for Solar’ automation and SCADA solutions for the monitoring and control of PV power plants. The solution encompasses plant automation functions such as panel position control and power management, enterprise SCADA, and remote operations and management of PV plants. It balances performance objectives like asset availability, operational reliability and production efficiency with business goals like asset life extension, carbon reduction and regulatory compliance. Pr
oduc
ts in
Brie
f
SolarWorld to offer 60- and 72-cell mono c-Si bifacial solar panelsSolarWorld is launching both 60- and 72-cell mono c-Si bifacial solar panels, designed for residential and commercial applications. The modules are respec-tively claimed to provide as much as 25% more power than conventional modules, depending on installation conditions. The new solar panels will feature high-wattage, mono-PERC (passivated emitter rear contact) solar cell technology. The new products both produce more electricity by tapping direct sunlight striking the face of the solar panel as well as indirect light refracting on the back from surfaces below. The first 72-cell bifacial modules will be available in the first half of 2016; the first 60-cell bifacial modules will be available in the fourth quarter of 2015.
products
19 www.pv-tech.org | December 2015 |
Product Outline: LG Electronics has introduced a 72-cell solar panel designed for commercial installations. The all-new ‘Mono X NeON’ 72 uses LG’s n-type mono c-Si double-sided (bi-facial) cell structure for improved efficiency.
Problem: Increased solar panel conver-sion efficiencies and electricity generation output can reduce the required number of panels to meet PV system performance requirements, while lowering BOS costs.
Solution: Panel models LG360N2W-B3 and LG365N2W-B3 are designed to deliver high-efficiency output of up to 360 and 365 watts respectively, producing more power in less space (in a 1,960 x 1,000 x 46
Product Outline: SolarEdge Technologies has introduced its new HD-Wave inverter technology. Based on its track record of optimised PV solutions, SolarEdge has devel-oped a novel power conversion topology that represents one of the most significant leaps in solar technology in the past 20 years.
Problem: Inverters are the “brain” of the solar energy system, converting solar power into usable energy. While advances have been made in the solar inverter space throughout the years, the large size of magnetics and cooling components have significantly limited any leapfrogging in the inverter space.
Solution: SolarEdge’s new HD-Wave technology will dramatically reduce the size and weight of the inverter’s magnetics by means of advanced digital processing. At the same time, the new technology is
millimeter panel). Unlike conven-tional p-type
solar modules, the n-type cells used
in the Mono X NeON 72, NeON 2 and NeON
2 Black use phosphorous instead of boron in the
doping process. As a result, the LG cells do not suffer from light-
induced degradation (LID) caused by the simultaneous presence of boron and oxygen in the wafers. In contrast, the LID effect in standard poly and mono p-type cells leads to a reduction of the module power output by usually 2 to 3% within the first weeks of installation.
designed to increase reliability and optimise the performance of solar energy systems to 99% efficiency and beyond, an increase that will provide more solar power at lower cost, according to SolarEdge.
Applications: Residential and commercial PV systems.
Platform: HD-Wave technology uses advanced digital processing to create a high-definition wave that enables a novel power inversion topology. The result is a smaller size and weight of the expensive magnetic components typical in current PV inverters and is completely electrolyte capacitor free.
Availability: SolarEdge’s first single inverters powered by HD-Wave technology will be available starting December 2015. Large three-phase inverters using HD Wave technology are under development.
Applications: Residential and commercial/industrial rooftops and carports.
Platform: The Mono X NeON 72’s improved temperature coefficient means it can gener-ate more electricity on sunny days and even performs more efficiently on cloudy days. The Mono X NeON 72 offers the same increased frame firmness of the NeON 2 and NeON 2 Black – the direct result of a reinforced frame design. The 72-cell module comes with a product warranty of 12 years. The 25-year Linear Performance warranty has also been improved from -3% to -2 percent in the first year and from -0.7% to -0.6% per year from year two to Year 25.
Availability: Already available.
Module LG targets commercial markets with high-efficiency 72-cell ‘Mono X NeON’ panel
Inverter SolarEdge has developed ‘HD-Wave’ technology to reduce PV inverter magnetics
JA Solar’s modules compatible with Spice frames for faster installa-tionsJA Solar has made its PV modules compatible with Spice Solar Technology mounting frames, which are claimed to eliminate racking and therefore reduce installation time by up to 50%. The Spice version of JA Solar modules utilises 60-cell panels and a heavy-duty, extruded, aluminium frame. JA-Spice Solar modules snap together in rows and columns, can handle up to 72” attachment spans and need only one grounding point for each array. An ordinary rack-mounted system requires over 300 individual parts and fasteners – with a Spice system only 50 parts are required.
SMK Electronics ‘snap to lock’ PV module connectors offer quicker installsSMK Electronics has developed its PV-03 Photovoltaic Module Connectors that ‘snap to lock’, making solar power installation quicker, more reliable and less expensive, according to the company. PV system installation costs can be reduced by streamlining array connectivity issues and time consumption, while providing reliable and safe connections from panel strings to the PV inverter. The PV-03 Connectors’ ‘snap to lock’ mating system is said to enable quick, accurate field or factory installation of PV modules and systems. Supporting all popular cable diameters for both 600 and 1000 Volt DC systems, PV-03 Connec-tors meet the NEC2008 standard for safe installation of electrical wiring.
products
20 | December 2015 | www.pv-tech.org
Product Outline: SunPower has launched its ‘Helix’ platform that is claimed to be the world’s first fully integrated commercial solar solution combining PV power produc-tion and energy management.
Problem: Minimising the complexities of commercial rooftop PV system installation is critical for keeping projects on schedule and meeting return on investment goals. Provid-ing a pre-engineered, modular solution could reduce design through to installation costs, while potentially providing a reliable and long-serving system that maximises yields.
Solution: Helix is a pre-engineered, modular solution that is standardised across rooftop, carport and ground installations. It includes SunPower modules with ‘Maxeon’
Product Outline: WINAICO’s 310W 60-cell (PERC) PV module is designed to withstand typhoon-level winds and the long-term damage caused by high and sustained vibrations that can cause micro-cracks in the solar cells.
Problem: Located at the western edge of the Pacific Ocean, Taiwan and Japan are affected by more than 30% of the world’s tropical typhoons each year. The recent Soudelor typhoon that hit Taiwan in August 2015 devastated solar systems throughout the island, causing as much as NT$30 million (US$9.2 million) of damage to a single solar installation in southern Taiwan, according to the company. When solar installations are affected by strong winds, the modules are subjected to constant vibrations with
solar cells and is claimed to support the installation of up to 20 to 30 panels per installer hour. Panels simply and securely snap into the Helix system, requiring no tools, and are made with marine-grade
aluminum and stainless steel to withstand harsh weather and UV over the system’s lifetime. The plug-and-play Helix Power Station, including the inverter, AC combiner, eBOS mount, DC branch and AC whips, is claimed to be the only pre-configured power station in commercial solar in the US. Connecting the power station does not
sudden impulses of forces acting from both front and rear sides, in an alternating fashion.
Solution: WINAICO has combined two
technologies uniquely available to the module producer, including the micro-crack-preventing HeatCap technology, and structurally reinforced WSP frame, to create a line of typhoon-resistant solar modules specifically for typhoon-prone markets such as Taiwan and Japan.
Applications: Residential, commercial and utility-scale projects in typhoon-prone regions such as Japan and Taiwan.
require any manual stripping or landing wires on the roof. Nearly all of the wiring is completed in the factory, reducing labour costs during installation, eliminating wiring errors and enhancing safety, and has NEC-compliant rapid shutdown.
Applications: Commercial rooftops.
Platform: The system also incorporates SunPower ‘EnergyLink’ software, which is designed to make it easy to compare energy patterns and identify demand peaks across sites. It provides visibility into energy economics to ensure energy goals across an organisation’s facilities are on track, allowing customers to make informed decisions about their energy portfolio.
Availability: Already available.
Platform: WINAICO has worked with Taiwan’s leading research institute, ITRI, to perform Dynamic Mechanical Load (DML) tests to simulate the effects of strong wind on WINAICO’s HeatCap modules. HeatCap modules have been tested to endure 1,000 cycles of 4,000 Pa DML tests, similar to a Category 4 tyhpoon, with no more than 0.18% of power degradation, while the compari-son case without HeatCap degraded by 2.32%. WINAICO’s own WSP frame is designed to have no single point of weakness, and has been tested to withstand more than 7,200 Pa of static Mechanical Load, far exceeding the 5,400 Pa requirement described in IEC 61215.
Availability: Already available.
Module SunPower offers first fully integrated modular commercial rooftop system in US
Module WINAICO develops typhoon-resistant solar module
Product reviews
Ampt launches highest claimed power density and lowest cost DC optimizer for utility-scale PV power plantsAmpt has introduced its V1000 line of string optimisers, designed to increase the overall value of 1,000 volt large-scale photovoltaic (PV) systems. Utility-scale PV system integrators are increasingly using larger block sizes when designing power plants. However, the need to reduce balance-of-system costs continues. Ampt’s V1000 string optimiser is claimed to represent a major step forward in power conversion technol-ogy for PV solar power plants, offering four times the power density of other DC optimisers, according to the company.
Suntech offering Tigo’s TS4 platform optimizers with HyPro modules Suntech has announced the introduction of a new smart solar module to its product portfolio. The new application will incorporate the Tigo TS4 universal junction box, enhancing Suntech’s smart DC module system’s performance through the accessibility of wireless communica-tions, the optimisation of power output and the availability of real-time monitoring, while ensuring a reduction in the overall maintenance costs. The TS4 will be integrated into modules aimed at the rooftop and commercial markets in Europe and Australia.
Prod
ucts
in B
rief
Market watch
21 www.pv-tech.org | December 2015 |
Generally, when something is too good to be true, it isn’t. The solar industry has had its fair share
of false dawns. It could be technol-ogy breakthroughs that yield little but headlines, giant, un-fundable project pipelines or start-ups touting the next big idea that will ultimately make little impact. The industry is also not short of big announcements that carry varying degrees of weight. Memorandums of understanding generate a collec-tive groan in the PV Tech newsroom; there is no historical milestone, in the solar industry or outside it, linked to a memorandum of understanding.
Scepticism was perhaps an under-standable initial reaction to the news that ACWA Power, the successful bidder in the 100MW PV tender in Dubai in late 2014, had tendered at under six US cents
per kilowatt hour (5.84 cents/kWh). The project is the second phase in a series of solar tenders planned by the Dubai Electricity and Water Authority (DEWA). Since then, the project has been fully financed, the size doubled to 200MW and the price has been repeated (almost) in other markets, in the region and also in Texas.
So can the project deliver on that low, low bid? Vahid Fotuhi of Dubai-based consultancy Access Advisory and a former president of the Middle East Solar Industry Association (MESIA) points to the industry’s reaction when the third round of DEWA teders was released. In October, it was announced that 95 companies had expressed an interest in the tender.
“The fact that that the last project was around 5.5 cents has not dissuaded
project companies from stepping forward,” says Fotuhi. “They may think ACWA Power took on more than it can chew and perhaps won’t be as aggres-sive in this round, but regardless, [the next phase is] 800MW, it’s one of the largest tenders in the world and many companies are going to at least come to the negotiation table and see what they can put forward. It is a very, very large volume and it is certainly worth having a go. Those that came just short in the last tender will be keen to sharpen their pencils and make sure they are success-ful in this round.”
The 200MW second phase of the Sheikh Mohammed bin Rashid al Maktoum Solar Park, named after Dubai’s ruler, represents one of a number of shifts in the Middle East market that suggest it might finally be ready to emerge as a serious source of PV demand. The winning consortium of Saudi power engineering firm ACWA Power and engineering consultancy TSK Group, had bid on the basis of using First Solar modules, a procurement decision it set out from the outset of the bidding process.
“The DEWA phase 2 project is a landmark for the region and has ignited a whole lot of discussion and excitement around the cost competitiveness of utility-scale solar PV in the region,” says Matt Merfert, technical director at First Solar. He notes that the victorious price is even lower than conventional energy prices, quite a feat in a region with heavily subsidised fossil fuels.
“[That’s] an important milestone and demonstration of the validity and applicability of the technology for this region. There are a lot of factors in how that very low tariff was achieved,” adds Merfert.
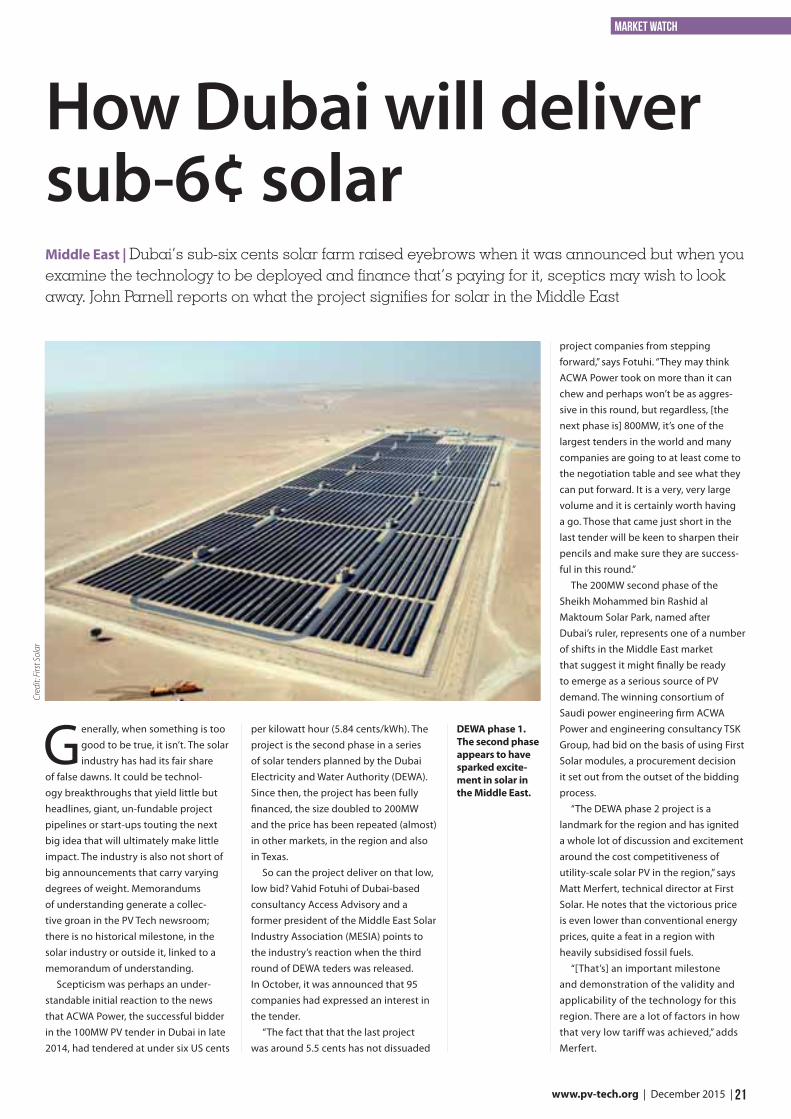
Middle East | Dubai’s sub-six cents solar farm raised eyebrows when it was announced but when you examine the technology to be deployed and finance that’s paying for it, sceptics may wish to look away. John Parnell reports on what the project signifies for solar in the Middle East
How Dubai will deliver sub-6¢ solar
DEWA phase 1. The second phase appears to have sparked excite-ment in solar in the Middle East.
Cred
it: F
irst S
olar
Market watch
22 | December 2015 | www.pv-tech.org
Money talksOne of the principal reasons is the financ-ing that has been put in place to pay for the project. ACWA Power’s CEO has said that the overall cost will be US$400 million. He revealed that the project has a 27-year, US$344 million loan from Abu Dhabi-based First Gulf Bank and Saudi Arabia’s National Commerce Bank and the Samba Financial Group. The inter-est rate is 4%. For comparison, India is purring over a rate of 9.75% for industrial rooftop projects and Brazil’s develop-ment bank offers solar developers discounted loans at around 7-10% with a lower rate only available if strict domestic content conditions are adhered to.
Fotuhi expects Dubai’s 800MW tender to continue attracting competitive financial interest. “When we look at the previous tender with 200MW it was financed by Saudi and UAE banks and I suspect that round three will have much of the same. It is a bigger ticket so there will be some sort of syndication involved and several banks will be playing ball, local and regional and large commercials such as Standard Chartered and HSBC will be actively looking at these projects,” he says.
The right technologySgurr Energy acted as technical advisor on the deal for the syndicate of banks funding DEWA 2 and is more than famil-iar with the hurdles any project has to pass, let alone one with such a competi-tive price to live up to.
“DEWA’s 200MW development is a landmark solar PV project for the Middle East and, as well as driving down costs, it has put the region’s PV market on the global stage,” says Kevin Wilkinson, solar team leader at Sgurr Energy.
“One benefit of solar PV develop-ment is that the technology travels very well. Whether building a 5MW PV plant in France or a 200MW plant in Dubai, the technology is often similar and in many cases identical PV modules, inverters, transformers and mounting structure technologies are being used. This highlights the universal nature of PV design and is one important reason why we have seen such swift cost reduc-tions for key PV components,” explains Wilkinson.
That’s not to say that the project devel-opment process as a whole is identical from one market to the next.
“The key challenge for technol-
ogy providers in the MENA region is in working with new electrical grid codes,” says Wilkinson. “Equipment may be well tried and tested for the grid networks in established solar markets, but integrating a solar plant requires careful design and planning. This type of plant behaves very differently from the traditional power plants the electrical network will be used to. In our experience so far, we have seen technology suppliers perform very well in this regard, working closely with local grid companies to ensure that generated power can be reliably exported for the benefit of the consumer.”
There are further regional considera-tions to consider during the operation of the plant.
“Hot desert conditions create several unique challenges for PV development and stress the importance of technol-ogy selection when developing in the MENA region. One example is PV module behaviour, which is extremely responsive to changes in ambient temperature and irradiance,” explains Wilkinson.
“The enhanced performance of thin-film technology in hotter temperatures, when compared to crystalline panels, has been a key driver in the increased uptake of thin-film in the region. Track-ing technologies have also come in to their own for deployment in climates of high irradiance. Sgurr Energy has calculated production increases of up to 16% for single-axis trackers compared to standard fixed-tilt systems, evidence which supports the move towards tracker technologies across the MENA region.”
First Solar was one of the first inter-national manufacturers to establish a base of operations in the region and that early mover advantage is starting to pay dividends.
Goodbye technology riskUnsurprisingly, First Solar’s Merfert backs Wilkinson’s assertions that thin-film modules are a smart choice in the region. The difference with his claim versus those that other vendors may make about their prospects in emerging Middle East
markets is that it can back them up with in-the-field data.
“In terms of technology risk, this is a unique situation. We were able to put a 13MW plant in for DEWA phase 1, we were the EPC and are continuing to do O&M, and that has been in operation for two years now at the same exact site [as the 200MW and 800MW phases], so we have extremely high confidence in the detailed weather data and the module performance in that specific location. That enables us to give high-confidence energy projections into the project,” Merfert explains. “Those results show that we are outperforming the original expectations, DEWA has confirmed that, we’re well above the guaranteed and expected values and there is no issue with reliability.
“If you go back in history, the original 1GW park plan included a mix of PV, CSP trough and CSP power towers, but as this concept has evolved we have seen it go 100% PV for the first gigawatt which is a win for PV,” adds Merfert. The project is now targeting 5GW as part of the emirate’s increased renewable energy targets.
From an independent perspective, Fotuhi believes the sector’s growing body of experience in the region has now removed technology as a barrier to investment.
“I think technology risk has been pretty much nullified. DEWA and the other utilities have seen that solar works and, based on the large-scale systems that have been installed already, that production is not inhibited by dust, or haze or humidity. That has spurred them on to be all the more aggressive in the third round [of the Dubai tender]. For example, the first round was 13MW the second was 200MW, that’s almost 20 times larger and now it has gone from 200MW to 800MW. That shows you the confidence level both here in Dubai and across the region in Jordan, Egypt and elsewhere.”
OperationFotuhi says that as much as technology risk has faded away, question marks surrounding the operation and mainte-nance of plants once they are complete have also “withered” meaning “develop-ers and off-takers are now more bullish about solar”.
“I’ve seen the O&M team at the 13MW facility and it is all very streamlined, they
“The project has ignited a whole lot of discussion and excitement around the cost competitiveness of utility-scale solar PV in the region”

Market watch
24 | December 2015 | www.pv-tech.org
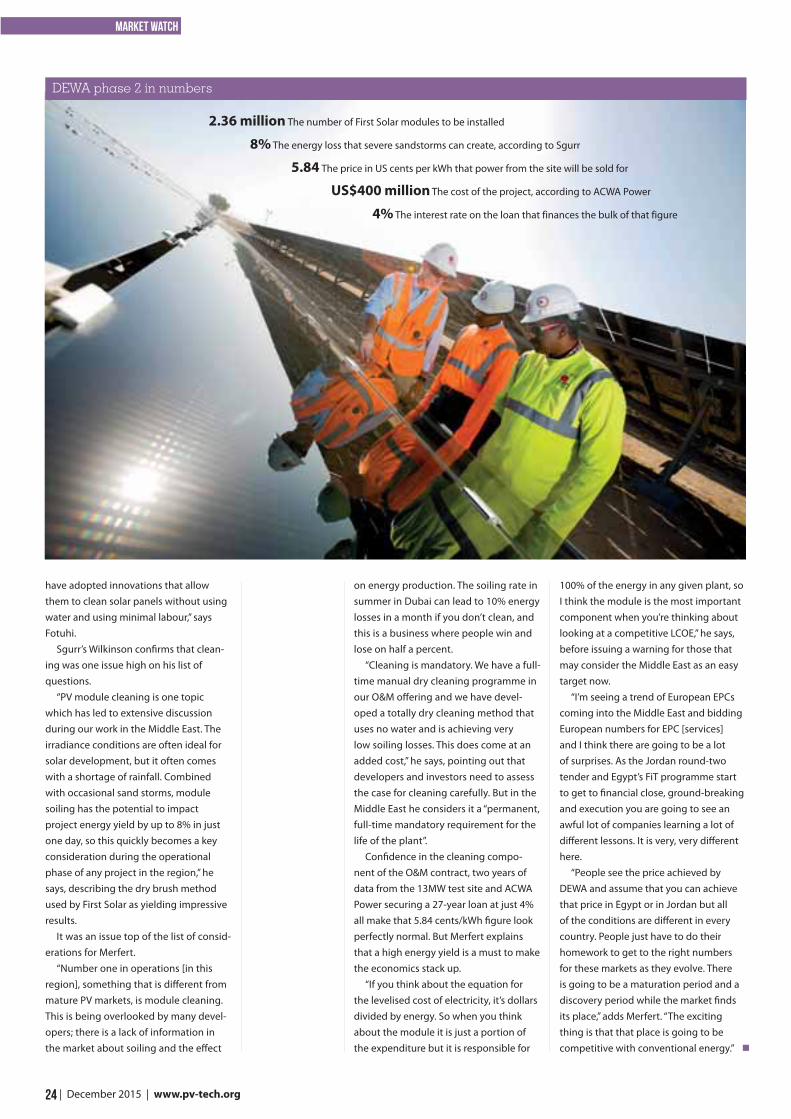
have adopted innovations that allow them to clean solar panels without using water and using minimal labour,” says Fotuhi.
Sgurr’s Wilkinson confirms that clean-ing was one issue high on his list of questions.
“PV module cleaning is one topic which has led to extensive discussion during our work in the Middle East. The irradiance conditions are often ideal for solar development, but it often comes with a shortage of rainfall. Combined with occasional sand storms, module soiling has the potential to impact project energy yield by up to 8% in just one day, so this quickly becomes a key consideration during the operational phase of any project in the region,” he says, describing the dry brush method used by First Solar as yielding impressive results.
It was an issue top of the list of consid-erations for Merfert.
“Number one in operations [in this region], something that is different from mature PV markets, is module cleaning. This is being overlooked by many devel-opers; there is a lack of information in the market about soiling and the effect
on energy production. The soiling rate in summer in Dubai can lead to 10% energy losses in a month if you don’t clean, and this is a business where people win and lose on half a percent.
“Cleaning is mandatory. We have a full-time manual dry cleaning programme in our O&M offering and we have devel-oped a totally dry cleaning method that uses no water and is achieving very low soiling losses. This does come at an added cost,” he says, pointing out that developers and investors need to assess the case for cleaning carefully. But in the Middle East he considers it a “permanent, full-time mandatory requirement for the life of the plant”.
Confidence in the cleaning compo-nent of the O&M contract, two years of data from the 13MW test site and ACWA Power securing a 27-year loan at just 4% all make that 5.84 cents/kWh figure look perfectly normal. But Merfert explains that a high energy yield is a must to make the economics stack up.
“If you think about the equation for the levelised cost of electricity, it’s dollars divided by energy. So when you think about the module it is just a portion of the expenditure but it is responsible for
100% of the energy in any given plant, so I think the module is the most important component when you’re thinking about looking at a competitive LCOE,” he says, before issuing a warning for those that may consider the Middle East as an easy target now.
“I’m seeing a trend of European EPCs coming into the Middle East and bidding European numbers for EPC [services] and I think there are going to be a lot of surprises. As the Jordan round-two tender and Egypt’s FiT programme start to get to financial close, ground-breaking and execution you are going to see an awful lot of companies learning a lot of different lessons. It is very, very different here.
“People see the price achieved by DEWA and assume that you can achieve that price in Egypt or in Jordan but all of the conditions are different in every country. People just have to do their homework to get to the right numbers for these markets as they evolve. There is going to be a maturation period and a discovery period while the market finds its place,” adds Merfert. “The exciting thing is that that place is going to be competitive with conventional energy.”
DEWA phase 2 in numbers
2.36 million The number of First Solar modules to be installed
8% The energy loss that severe sandstorms can create, according to Sgurr
5.84 The price in US cents per kWh that power from the site will be sold for
US$400 million The cost of the project, according to ACWA Power
4% The interest rate on the loan that finances the bulk of that figure
Market watch
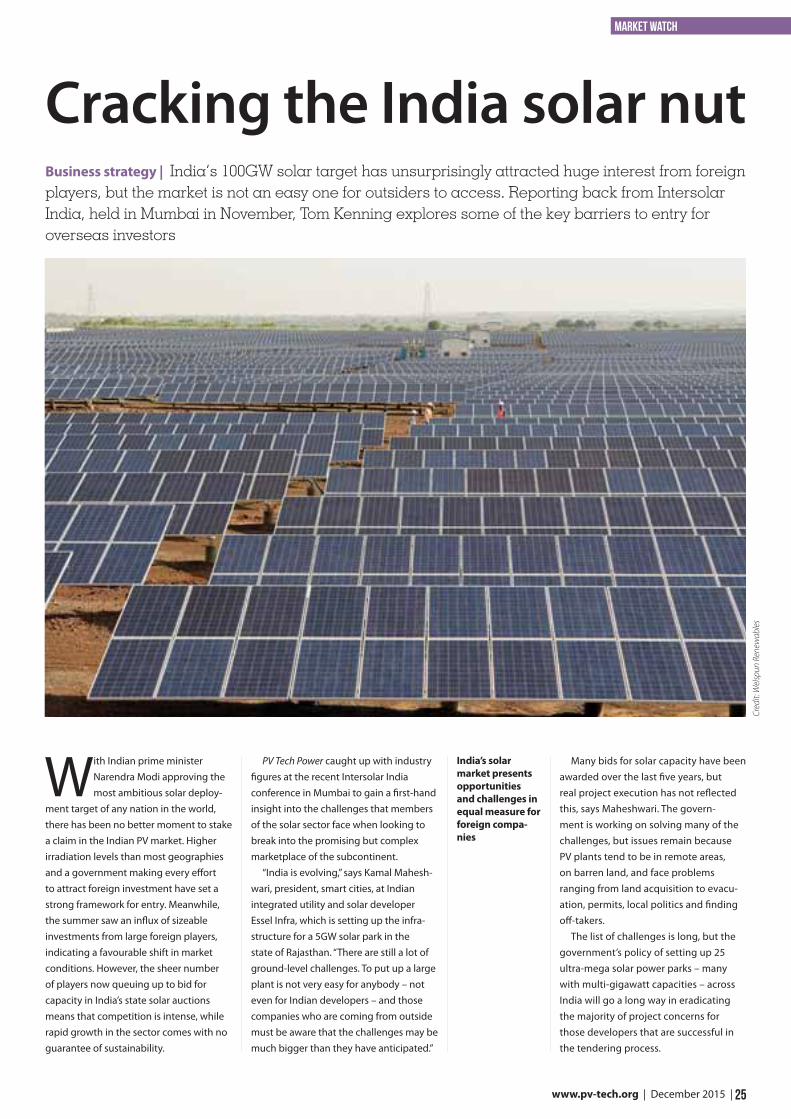
25 www.pv-tech.org | December 2015 |
With Indian prime minister Narendra Modi approving the most ambitious solar deploy-
ment target of any nation in the world, there has been no better moment to stake a claim in the Indian PV market. Higher irradiation levels than most geographies and a government making every effort to attract foreign investment have set a strong framework for entry. Meanwhile, the summer saw an influx of sizeable investments from large foreign players, indicating a favourable shift in market conditions. However, the sheer number of players now queuing up to bid for capacity in India’s state solar auctions means that competition is intense, while rapid growth in the sector comes with no guarantee of sustainability.
PV Tech Power caught up with industry figures at the recent Intersolar India conference in Mumbai to gain a first-hand insight into the challenges that members of the solar sector face when looking to break into the promising but complex marketplace of the subcontinent.
“India is evolving,” says Kamal Mahesh-wari, president, smart cities, at Indian integrated utility and solar developer Essel Infra, which is setting up the infra-structure for a 5GW solar park in the state of Rajasthan. “There are still a lot of ground-level challenges. To put up a large plant is not very easy for anybody – not even for Indian developers – and those companies who are coming from outside must be aware that the challenges may be much bigger than they have anticipated.”
Many bids for solar capacity have been awarded over the last five years, but real project execution has not reflected this, says Maheshwari. The govern-ment is working on solving many of the challenges, but issues remain because PV plants tend to be in remote areas, on barren land, and face problems ranging from land acquisition to evacu-ation, permits, local politics and finding off-takers.
The list of challenges is long, but the government’s policy of setting up 25 ultra-mega solar power parks – many with multi-gigawatt capacities – across India will go a long way in eradicating the majority of project concerns for those developers that are successful in the tendering process.
Business strategy | India’s 100GW solar target has unsurprisingly attracted huge interest from foreign players, but the market is not an easy one for outsiders to access. Reporting back from Intersolar India, held in Mumbai in November, Tom Kenning explores some of the key barriers to entry for overseas investors
Cracking the India solar nut
India’s solar market presents opportunities and challenges in equal measure for foreign compa-nies
Cred
it: W
elsp
un R
enew
able
s
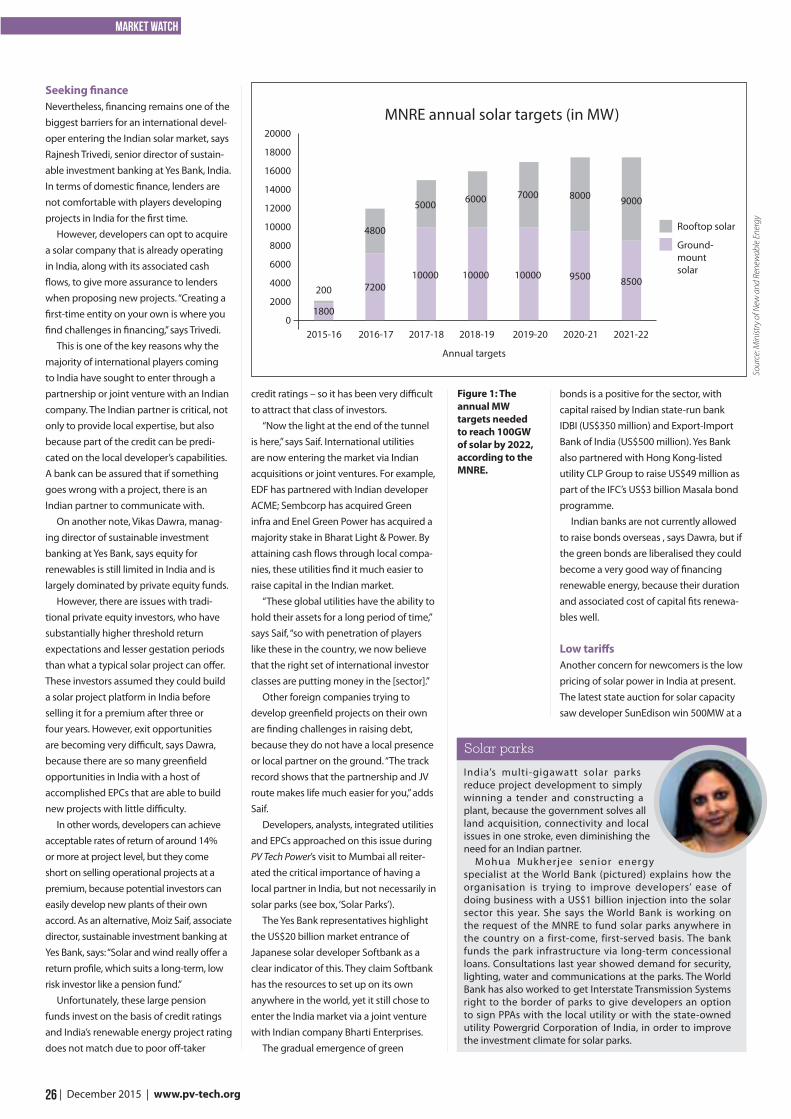
Market watch
26 | December 2015 | www.pv-tech.org
Seeking financeNevertheless, financing remains one of the biggest barriers for an international devel-oper entering the Indian solar market, says Rajnesh Trivedi, senior director of sustain-able investment banking at Yes Bank, India. In terms of domestic finance, lenders are not comfortable with players developing projects in India for the first time.
However, developers can opt to acquire a solar company that is already operating in India, along with its associated cash flows, to give more assurance to lenders when proposing new projects. “Creating a first-time entity on your own is where you find challenges in financing,” says Trivedi.
This is one of the key reasons why the majority of international players coming to India have sought to enter through a partnership or joint venture with an Indian company. The Indian partner is critical, not only to provide local expertise, but also because part of the credit can be predi-cated on the local developer’s capabilities. A bank can be assured that if something goes wrong with a project, there is an Indian partner to communicate with.
On another note, Vikas Dawra, manag-ing director of sustainable investment banking at Yes Bank, says equity for renewables is still limited in India and is largely dominated by private equity funds.
However, there are issues with tradi-tional private equity investors, who have substantially higher threshold return expectations and lesser gestation periods than what a typical solar project can offer. These investors assumed they could build a solar project platform in India before selling it for a premium after three or four years. However, exit opportunities are becoming very difficult, says Dawra, because there are so many greenfield opportunities in India with a host of accomplished EPCs that are able to build new projects with little difficulty.
In other words, developers can achieve acceptable rates of return of around 14% or more at project level, but they come short on selling operational projects at a premium, because potential investors can easily develop new plants of their own accord. As an alternative, Moiz Saif, associate director, sustainable investment banking at Yes Bank, says: “Solar and wind really offer a return profile, which suits a long-term, low risk investor like a pension fund.”
Unfortunately, these large pension funds invest on the basis of credit ratings and India’s renewable energy project rating does not match due to poor off-taker
credit ratings – so it has been very difficult to attract that class of investors.
“Now the light at the end of the tunnel is here,” says Saif. International utilities are now entering the market via Indian acquisitions or joint ventures. For example, EDF has partnered with Indian developer ACME; Sembcorp has acquired Green infra and Enel Green Power has acquired a majority stake in Bharat Light & Power. By attaining cash flows through local compa-nies, these utilities find it much easier to raise capital in the Indian market.
“These global utilities have the ability to hold their assets for a long period of time,” says Saif, “so with penetration of players like these in the country, we now believe that the right set of international investor classes are putting money in the [sector].”
Other foreign companies trying to develop greenfield projects on their own are finding challenges in raising debt, because they do not have a local presence or local partner on the ground. “The track record shows that the partnership and JV route makes life much easier for you,” adds Saif.
Developers, analysts, integrated utilities and EPCs approached on this issue during PV Tech Power’s visit to Mumbai all reiter-ated the critical importance of having a local partner in India, but not necessarily in solar parks (see box, ‘Solar Parks’).
The Yes Bank representatives highlight the US$20 billion market entrance of Japanese solar developer Softbank as a clear indicator of this. They claim Softbank has the resources to set up on its own anywhere in the world, yet it still chose to enter the India market via a joint venture with Indian company Bharti Enterprises.
The gradual emergence of green
bonds is a positive for the sector, with capital raised by Indian state-run bank IDBI (US$350 million) and Export-Import Bank of India (US$500 million). Yes Bank also partnered with Hong Kong-listed utility CLP Group to raise US$49 million as part of the IFC’s US$3 billion Masala bond programme.
Indian banks are not currently allowed to raise bonds overseas , says Dawra, but if the green bonds are liberalised they could become a very good way of financing renewable energy, because their duration and associated cost of capital fits renewa-bles well.
Low tariffsAnother concern for newcomers is the low pricing of solar power in India at present. The latest state auction for solar capacity saw developer SunEdison win 500MW at a
Figure 1: The annual MW targets needed to reach 100GW of solar by 2022, according to the MNRE.
India’s multi-gigawatt solar parks reduce project development to simply winning a tender and constructing a plant, because the government solves all land acquisition, connectivity and local issues in one stroke, even diminishing the need for an Indian partner.
Mohua Mukherjee senior energy specialist at the World Bank (pictured) explains how the organisation is trying to improve developers’ ease of doing business with a US$1 billion injection into the solar sector this year. She says the World Bank is working on the request of the MNRE to fund solar parks anywhere in the country on a first-come, first-served basis. The bank funds the park infrastructure via long-term concessional loans. Consultations last year showed demand for security, lighting, water and communications at the parks. The World Bank has also worked to get Interstate Transmission Systems right to the border of parks to give developers an option to sign PPAs with the local utility or with the state-owned utility Powergrid Corporation of India, in order to improve the investment climate for solar parks.
Solar parksSo
urce
: Min
istry
of N
ew a
nd R
enew
able
Ene
rgy
20000
18000
16000
14000
12000
10000
8000
6000
4000
2000
0
Rooftop solar
Ground- mount solar
2015-16 2016-17 2017-18 2018-19 2019-20 2020-21 2021-22
200
4800
5000 6000 7000 8000 9000
1800
720010000 10000 10000 9500 8500
Annual targets
MNRE annual solar targets (in MW)
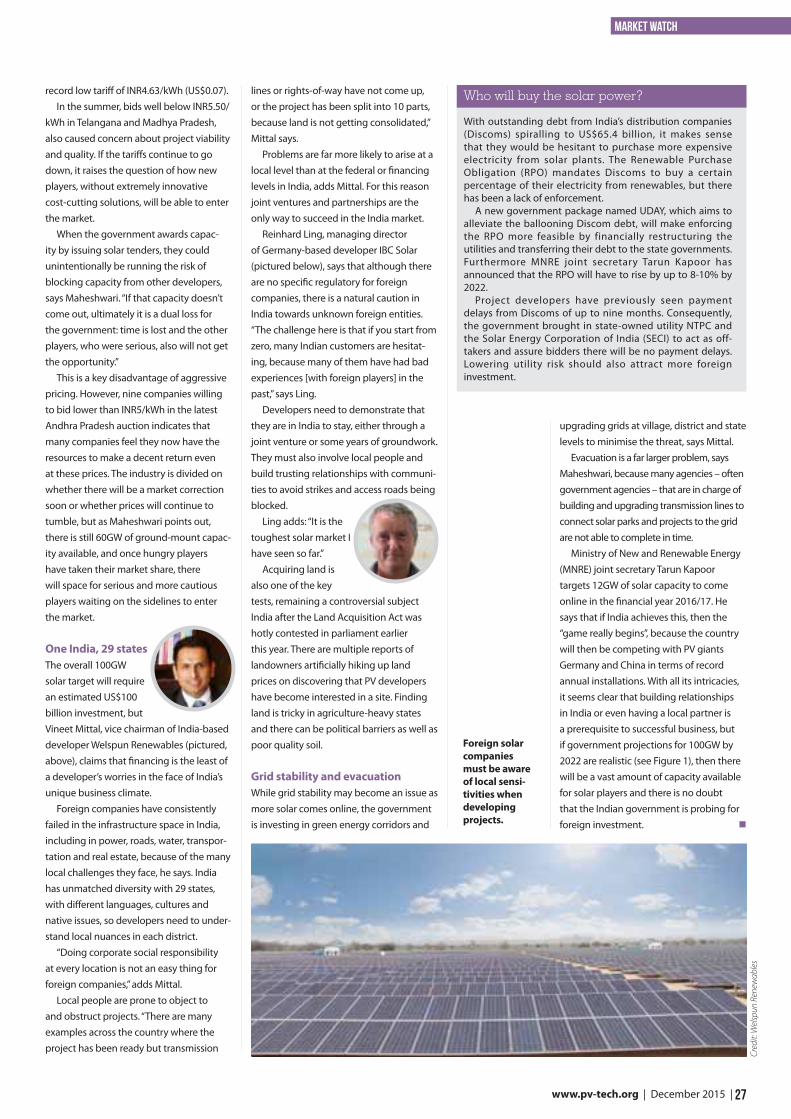
Market watch
27 www.pv-tech.org | December 2015 |
record low tariff of INR4.63/kWh (US$0.07).In the summer, bids well below INR5.50/
kWh in Telangana and Madhya Pradesh, also caused concern about project viability and quality. If the tariffs continue to go down, it raises the question of how new players, without extremely innovative cost-cutting solutions, will be able to enter the market.
When the government awards capac-ity by issuing solar tenders, they could unintentionally be running the risk of blocking capacity from other developers, says Maheshwari. “If that capacity doesn’t come out, ultimately it is a dual loss for the government: time is lost and the other players, who were serious, also will not get the opportunity.”
This is a key disadvantage of aggressive pricing. However, nine companies willing to bid lower than INR5/kWh in the latest Andhra Pradesh auction indicates that many companies feel they now have the resources to make a decent return even at these prices. The industry is divided on whether there will be a market correction soon or whether prices will continue to tumble, but as Maheshwari points out, there is still 60GW of ground-mount capac-ity available, and once hungry players have taken their market share, there will space for serious and more cautious players waiting on the sidelines to enter the market.
One India, 29 statesThe overall 100GW solar target will require an estimated US$100 billion investment, but Vineet Mittal, vice chairman of India-based developer Welspun Renewables (pictured, above), claims that financing is the least of a developer’s worries in the face of India’s unique business climate.
Foreign companies have consistently failed in the infrastructure space in India, including in power, roads, water, transpor-tation and real estate, because of the many local challenges they face, he says. India has unmatched diversity with 29 states, with different languages, cultures and native issues, so developers need to under-stand local nuances in each district.
“Doing corporate social responsibility at every location is not an easy thing for foreign companies,” adds Mittal.
Local people are prone to object to and obstruct projects. “There are many examples across the country where the project has been ready but transmission
lines or rights-of-way have not come up, or the project has been split into 10 parts, because land is not getting consolidated,” Mittal says.
Problems are far more likely to arise at a local level than at the federal or financing levels in India, adds Mittal. For this reason joint ventures and partnerships are the only way to succeed in the India market.
Reinhard Ling, managing director of Germany-based developer IBC Solar (pictured below), says that although there are no specific regulatory for foreign companies, there is a natural caution in India towards unknown foreign entities. “The challenge here is that if you start from zero, many Indian customers are hesitat-ing, because many of them have had bad experiences [with foreign players] in the past,” says Ling.
Developers need to demonstrate that they are in India to stay, either through a joint venture or some years of groundwork. They must also involve local people and build trusting relationships with communi-ties to avoid strikes and access roads being blocked.
Ling adds: “It is the toughest solar market I have seen so far.”
Acquiring land is also one of the key tests, remaining a controversial subject India after the Land Acquisition Act was hotly contested in parliament earlier this year. There are multiple reports of landowners artificially hiking up land prices on discovering that PV developers have become interested in a site. Finding land is tricky in agriculture-heavy states and there can be political barriers as well as poor quality soil.
Grid stability and evacuationWhile grid stability may become an issue as more solar comes online, the government is investing in green energy corridors and
upgrading grids at village, district and state levels to minimise the threat, says Mittal.
Evacuation is a far larger problem, says Maheshwari, because many agencies – often government agencies – that are in charge of building and upgrading transmission lines to connect solar parks and projects to the grid are not able to complete in time.
Ministry of New and Renewable Energy (MNRE) joint secretary Tarun Kapoor targets 12GW of solar capacity to come online in the financial year 2016/17. He says that if India achieves this, then the “game really begins”, because the country will then be competing with PV giants Germany and China in terms of record annual installations. With all its intricacies, it seems clear that building relationships in India or even having a local partner is a prerequisite to successful business, but if government projections for 100GW by 2022 are realistic (see Figure 1), then there will be a vast amount of capacity available for solar players and there is no doubt that the Indian government is probing for foreign investment.
With outstanding debt from India’s distribution companies (Discoms) spiralling to US$65.4 billion, it makes sense that they would be hesitant to purchase more expensive electricity from solar plants. The Renewable Purchase Obligation (RPO) mandates Discoms to buy a certain percentage of their electricity from renewables, but there has been a lack of enforcement.
A new government package named UDAY, which aims to alleviate the ballooning Discom debt, will make enforcing the RPO more feasible by financially restructuring the utilities and transferring their debt to the state governments. Furthermore MNRE joint secretary Tarun Kapoor has announced that the RPO will have to rise by up to 8-10% by 2022.
Project developers have previously seen payment delays from Discoms of up to nine months. Consequently, the government brought in state-owned utility NTPC and the Solar Energy Corporation of India (SECI) to act as off-takers and assure bidders there will be no payment delays. Lowering utility risk should also attract more foreign investment.
Who will buy the solar power?
Foreign solar companies must be aware of local sensi-tivities when developing projects.
Cred
it: W
elsp
un R
enew
able
s
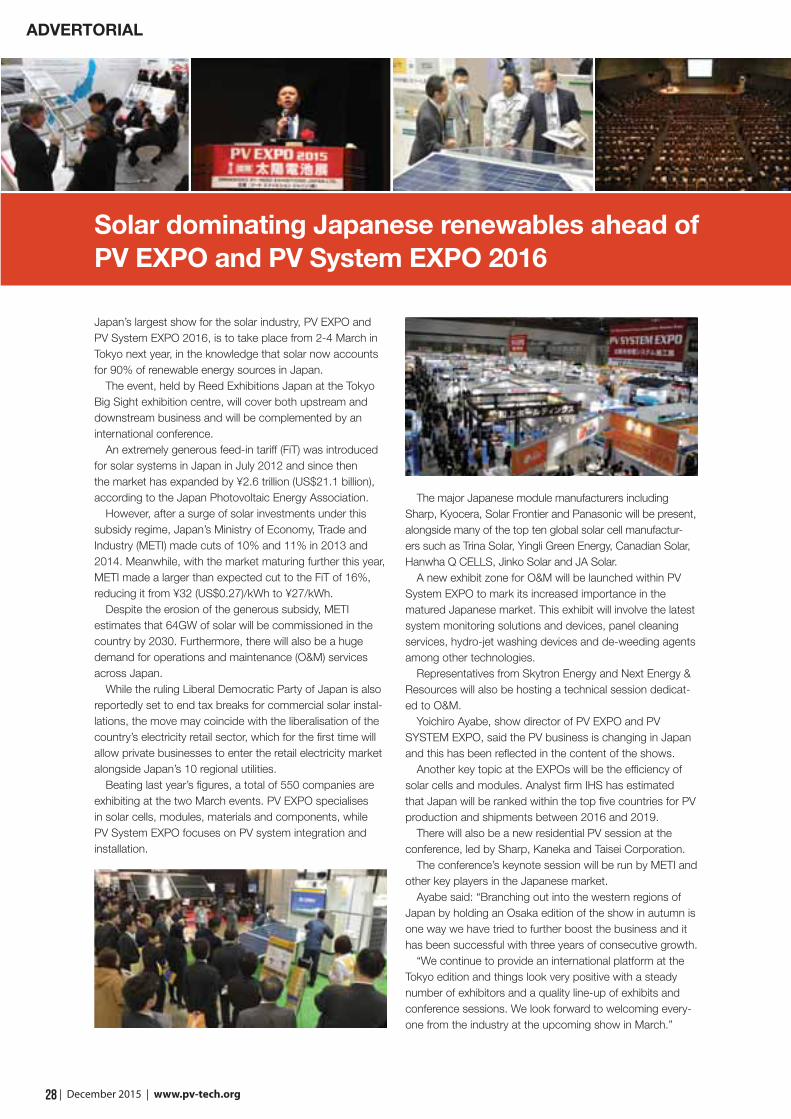
28 | December 2015 | www.pv-tech.org
ADVERTORIAL
Japan’s largest show for the solar industry, PV EXPO and PV System EXPO 2016, is to take place from 2-4 March in Tokyo next year, in the knowledge that solar now accounts for 90% of renewable energy sources in Japan.
The event, held by Reed Exhibitions Japan at the Tokyo Big Sight exhibition centre, will cover both upstream and downstream business and will be complemented by an international conference.
An extremely generous feed-in tariff (FiT) was introduced for solar systems in Japan in July 2012 and since then the market has expanded by ¥2.6 trillion (US$21.1 billion), according to the Japan Photovoltaic Energy Association.
However, after a surge of solar investments under this subsidy regime, Japan’s Ministry of Economy, Trade and Industry (METI) made cuts of 10% and 11% in 2013 and 2014. Meanwhile, with the market maturing further this year, METI made a larger than expected cut to the FiT of 16%, reducing it from ¥32 (US$0.27)/kWh to ¥27/kWh.
Despite the erosion of the generous subsidy, METI estimates that 64GW of solar will be commissioned in the country by 2030. Furthermore, there will also be a huge demand for operations and maintenance (O&M) services across Japan.
While the ruling Liberal Democratic Party of Japan is also reportedly set to end tax breaks for commercial solar instal-lations, the move may coincide with the liberalisation of the country’s electricity retail sector, which for the first time will allow private businesses to enter the retail electricity market alongside Japan’s 10 regional utilities.
Beating last year’s figures, a total of 550 companies are exhibiting at the two March events. PV EXPO specialises in solar cells, modules, materials and components, while PV System EXPO focuses on PV system integration and installation.
Solar dominating Japanese renewables ahead of PV EXPO and PV System EXPO 2016
The major Japanese module manufacturers including Sharp, Kyocera, Solar Frontier and Panasonic will be present, alongside many of the top ten global solar cell manufactur-ers such as Trina Solar, Yingli Green Energy, Canadian Solar, Hanwha Q CELLS, Jinko Solar and JA Solar.
A new exhibit zone for O&M will be launched within PV System EXPO to mark its increased importance in the matured Japanese market. This exhibit will involve the latest system monitoring solutions and devices, panel cleaning services, hydro-jet washing devices and de-weeding agents among other technologies.
Representatives from Skytron Energy and Next Energy & Resources will also be hosting a technical session dedicat-ed to O&M.
Yoichiro Ayabe, show director of PV EXPO and PV SYSTEM EXPO, said the PV business is changing in Japan and this has been reflected in the content of the shows.
Another key topic at the EXPOs will be the efficiency of solar cells and modules. Analyst firm IHS has estimated that Japan will be ranked within the top five countries for PV production and shipments between 2016 and 2019.
There will also be a new residential PV session at the conference, led by Sharp, Kaneka and Taisei Corporation.
The conference’s keynote session will be run by METI and other key players in the Japanese market.
Ayabe said: “Branching out into the western regions of Japan by holding an Osaka edition of the show in autumn is one way we have tried to further boost the business and it has been successful with three years of consecutive growth.
“We continue to provide an international platform at the Tokyo edition and things look very positive with a steady number of exhibitors and a quality line-up of exhibits and conference sessions. We look forward to welcoming every-one from the industry at the upcoming show in March.”
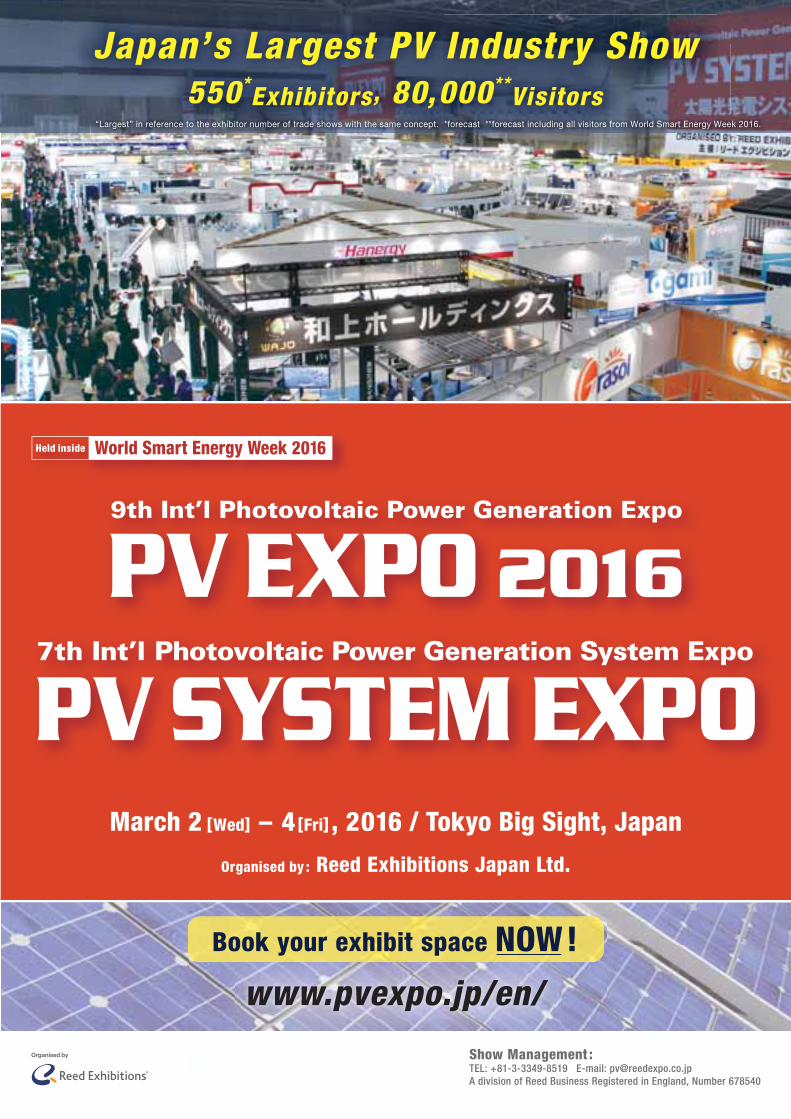
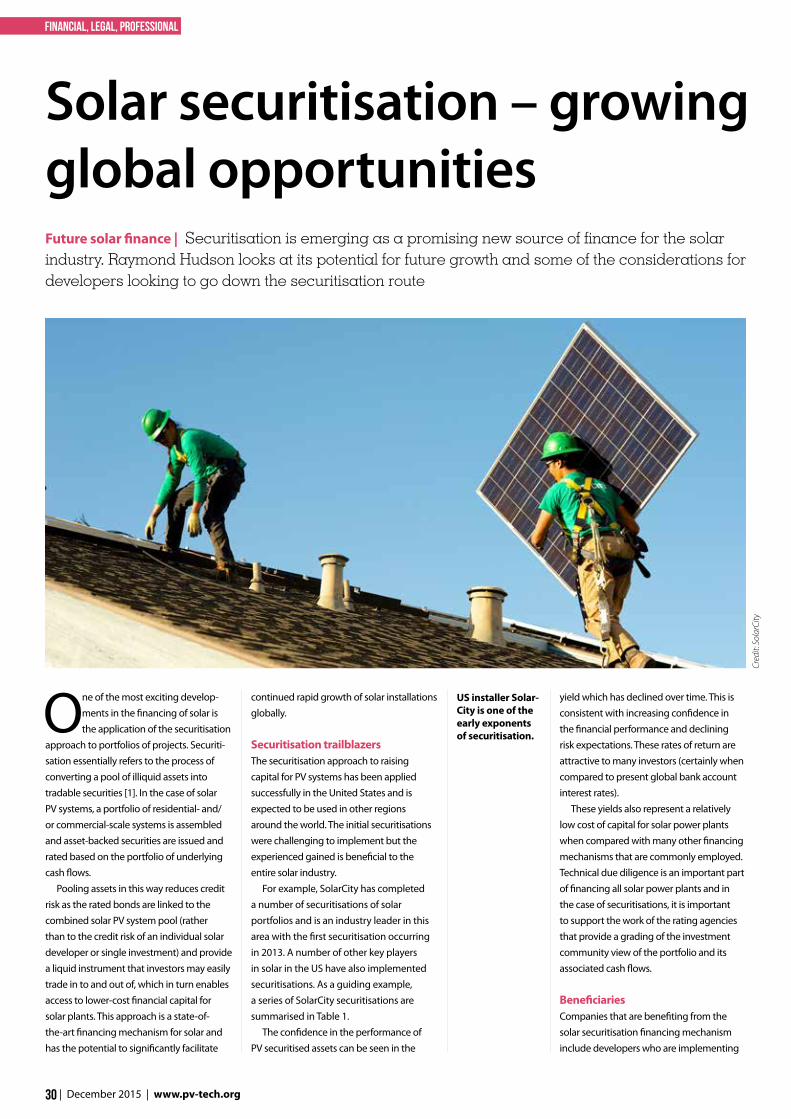
30 | December 2015 | www.pv-tech.org
financial, legal, professional
One of the most exciting develop-ments in the financing of solar is the application of the securitisation
approach to portfolios of projects. Securiti-sation essentially refers to the process of converting a pool of illiquid assets into tradable securities [1]. In the case of solar PV systems, a portfolio of residential- and/or commercial-scale systems is assembled and asset-backed securities are issued and rated based on the portfolio of underlying cash flows.
Pooling assets in this way reduces credit risk as the rated bonds are linked to the combined solar PV system pool (rather than to the credit risk of an individual solar developer or single investment) and provide a liquid instrument that investors may easily trade in to and out of, which in turn enables access to lower-cost financial capital for solar plants. This approach is a state-of-the-art financing mechanism for solar and has the potential to significantly facilitate
continued rapid growth of solar installations globally.
Securitisation trailblazersThe securitisation approach to raising capital for PV systems has been applied successfully in the United States and is expected to be used in other regions around the world. The initial securitisations were challenging to implement but the experienced gained is beneficial to the entire solar industry.
For example, SolarCity has completed a number of securitisations of solar portfolios and is an industry leader in this area with the first securitisation occurring in 2013. A number of other key players in solar in the US have also implemented securitisations. As a guiding example, a series of SolarCity securitisations are summarised in Table 1.
The confidence in the performance of PV securitised assets can be seen in the
yield which has declined over time. This is consistent with increasing confidence in the financial performance and declining risk expectations. These rates of return are attractive to many investors (certainly when compared to present global bank account interest rates).
These yields also represent a relatively low cost of capital for solar power plants when compared with many other financing mechanisms that are commonly employed. Technical due diligence is an important part of financing all solar power plants and in the case of securitisations, it is important to support the work of the rating agencies that provide a grading of the investment community view of the portfolio and its associated cash flows.
BeneficiariesCompanies that are benefiting from the solar securitisation financing mechanism include developers who are implementing
Future solar finance | Securitisation is emerging as a promising new source of finance for the solar industry. Raymond Hudson looks at its potential for future growth and some of the considerations for developers looking to go down the securitisation route
Solar securitisation – growing global opportunities
Cred
it: S
olar
City
US installer Solar-City is one of the early exponents of securitisation.
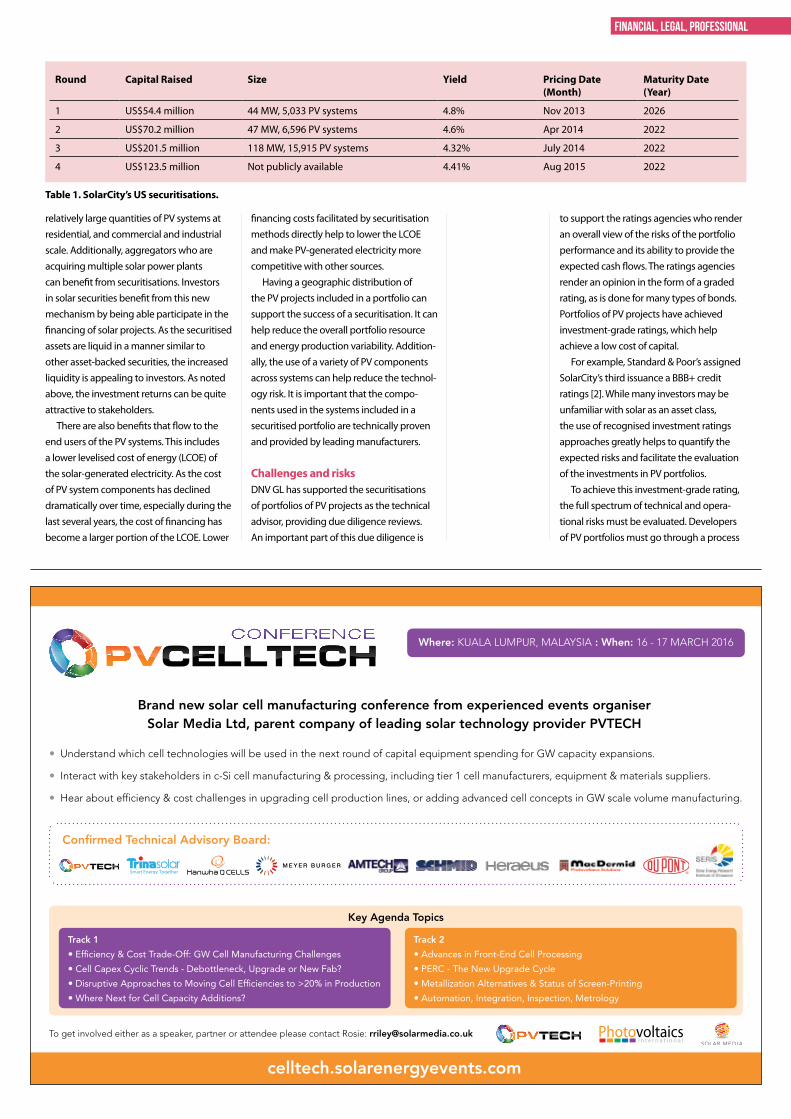
financial, legal, professional
relatively large quantities of PV systems at residential, and commercial and industrial scale. Additionally, aggregators who are acquiring multiple solar power plants can benefit from securitisations. Investors in solar securities benefit from this new mechanism by being able participate in the financing of solar projects. As the securitised assets are liquid in a manner similar to other asset-backed securities, the increased liquidity is appealing to investors. As noted above, the investment returns can be quite attractive to stakeholders.
There are also benefits that flow to the end users of the PV systems. This includes a lower levelised cost of energy (LCOE) of the solar-generated electricity. As the cost of PV system components has declined dramatically over time, especially during the last several years, the cost of financing has become a larger portion of the LCOE. Lower
financing costs facilitated by securitisation methods directly help to lower the LCOE and make PV-generated electricity more competitive with other sources.
Having a geographic distribution of the PV projects included in a portfolio can support the success of a securitisation. It can help reduce the overall portfolio resource and energy production variability. Addition-ally, the use of a variety of PV components across systems can help reduce the technol-ogy risk. It is important that the compo-nents used in the systems included in a securitised portfolio are technically proven and provided by leading manufacturers.
Challenges and risksDNV GL has supported the securitisations of portfolios of PV projects as the technical advisor, providing due diligence reviews. An important part of this due diligence is
to support the ratings agencies who render an overall view of the risks of the portfolio performance and its ability to provide the expected cash flows. The ratings agencies render an opinion in the form of a graded rating, as is done for many types of bonds. Portfolios of PV projects have achieved investment-grade ratings, which help achieve a low cost of capital.
For example, Standard & Poor’s assigned SolarCity’s third issuance a BBB+ credit ratings [2]. While many investors may be unfamiliar with solar as an asset class, the use of recognised investment ratings approaches greatly helps to quantify the expected risks and facilitate the evaluation of the investments in PV portfolios.
To achieve this investment-grade rating, the full spectrum of technical and opera-tional risks must be evaluated. Developers of PV portfolios must go through a process
Table 1. SolarCity’s US securitisations.
Brand new solar cell manufacturing conference from experienced events organiser Solar Media Ltd, parent company of leading solar technology provider PVTECH
celltech.solarenergyevents.com
Where: KUALA LUMPUR, MALAYSIA : When: 16 - 17 MARCH 2016
Understand which cell technologies will be used in the next round of capital equipment spending for GW capacity expansions.
Interact with key stakeholders in c-Si cell manufacturing & processing, including tier 1 cell manufacturers, equipment & materials suppliers.
Hear about effi ciency & cost challenges in upgrading cell production lines, or adding advanced cell concepts in GW scale volume manufacturing.
Confi rmed Technical Advisory Board:
Key Agenda Topics
Track 1
Effi ciency & Cost Trade-Off: GW Cell Manufacturing Challenges
Cell Capex Cyclic Trends - Debottleneck, Upgrade or New Fab?
Disruptive Approaches to Moving Cell Effi ciencies to >20% in Production
Where Next for Cell Capacity Additions?
Track 2
Advances in Front-End Cell Processing
PERC - The New Upgrade Cycle
Metallization Alternatives & Status of Screen-Printing
Automation, Integration, Inspection, Metrology
To get involved either as a speaker, partner or attendee please contact Rosie: [email protected] PhotovoltaicsI n t e r n a t i o n a l
Round Capital Raised Size Yield Pricing Date (Month)
Maturity Date (Year)
1 US$54.4 million 44 MW, 5,033 PV systems 4.8% Nov 2013 2026
2 US$70.2 million 47 MW, 6,596 PV systems 4.6% Apr 2014 2022
3 US$201.5 million 118 MW, 15,915 PV systems 4.32% July 2014 2022
4 US$123.5 million Not publicly available 4.41% Aug 2015 2022
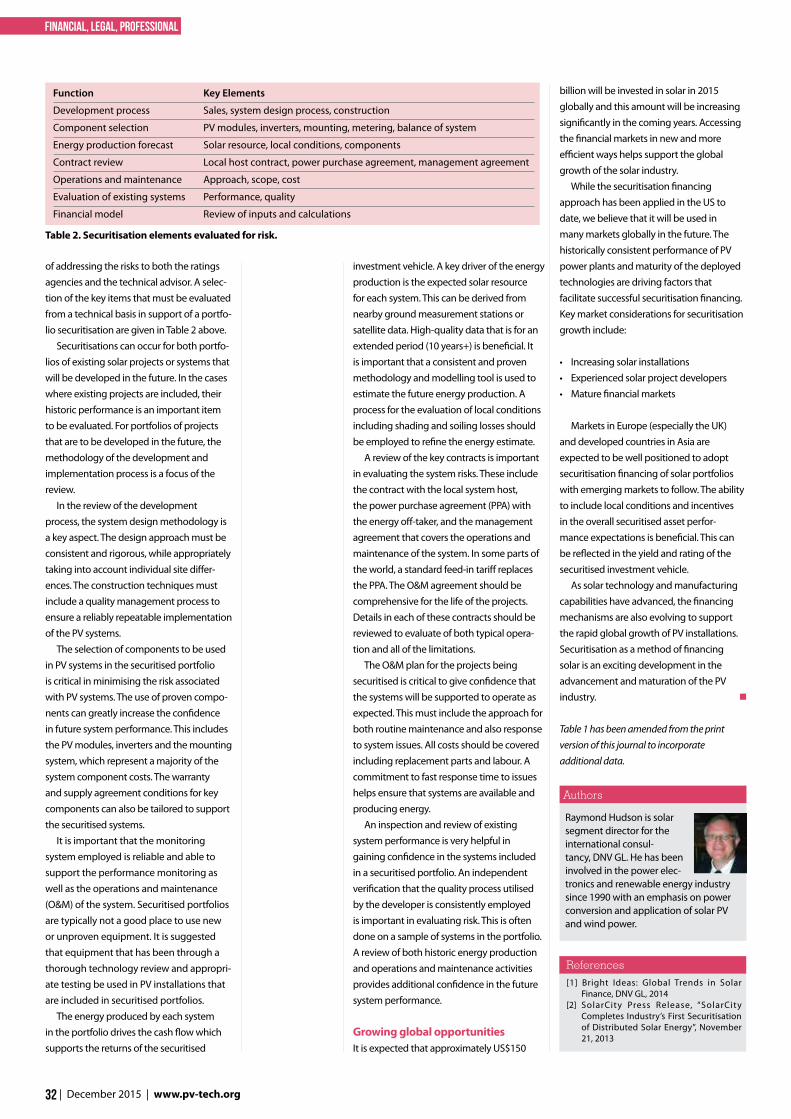
32 | December 2015 | www.pv-tech.org
financial, legal, professional
billion will be invested in solar in 2015 globally and this amount will be increasing significantly in the coming years. Accessing the financial markets in new and more efficient ways helps support the global growth of the solar industry.
While the securitisation financing approach has been applied in the US to date, we believe that it will be used in many markets globally in the future. The historically consistent performance of PV power plants and maturity of the deployed technologies are driving factors that facilitate successful securitisation financing. Key market considerations for securitisation growth include:
• Increasing solar installations• Experienced solar project developers• Mature financial markets
Markets in Europe (especially the UK) and developed countries in Asia are expected to be well positioned to adopt securitisation financing of solar portfolios with emerging markets to follow. The ability to include local conditions and incentives in the overall securitised asset perfor-mance expectations is beneficial. This can be reflected in the yield and rating of the securitised investment vehicle.
As solar technology and manufacturing capabilities have advanced, the financing mechanisms are also evolving to support the rapid global growth of PV installations. Securitisation as a method of financing solar is an exciting development in the advancement and maturation of the PV industry.
Table 1 has been amended from the print version of this journal to incorporate additional data.
investment vehicle. A key driver of the energy production is the expected solar resource for each system. This can be derived from nearby ground measurement stations or satellite data. High-quality data that is for an extended period (10 years+) is beneficial. It is important that a consistent and proven methodology and modelling tool is used to estimate the future energy production. A process for the evaluation of local conditions including shading and soiling losses should be employed to refine the energy estimate.
A review of the key contracts is important in evaluating the system risks. These include the contract with the local system host, the power purchase agreement (PPA) with the energy off-taker, and the management agreement that covers the operations and maintenance of the system. In some parts of the world, a standard feed-in tariff replaces the PPA. The O&M agreement should be comprehensive for the life of the projects. Details in each of these contracts should be reviewed to evaluate of both typical opera-tion and all of the limitations.
The O&M plan for the projects being securitised is critical to give confidence that the systems will be supported to operate as expected. This must include the approach for both routine maintenance and also response to system issues. All costs should be covered including replacement parts and labour. A commitment to fast response time to issues helps ensure that systems are available and producing energy.
An inspection and review of existing system performance is very helpful in gaining confidence in the systems included in a securitised portfolio. An independent verification that the quality process utilised by the developer is consistently employed is important in evaluating risk. This is often done on a sample of systems in the portfolio. A review of both historic energy production and operations and maintenance activities provides additional confidence in the future system performance.
Growing global opportunitiesIt is expected that approximately US$150
Raymond Hudson is solar segment director for the international consul-tancy, DNV GL. He has been involved in the power elec-tronics and renewable energy industry since 1990 with an emphasis on power conversion and application of solar PV and wind power.
Authors
[1] Bright Ideas: Global Trends in Solar Finance, DNV GL, 2014
[2] SolarCity Press Release, “SolarCity Completes Industry’s First Securitisation of Distributed Solar Energy”, November 21, 2013
References
of addressing the risks to both the ratings agencies and the technical advisor. A selec-tion of the key items that must be evaluated from a technical basis in support of a portfo-lio securitisation are given in Table 2 above.
Securitisations can occur for both portfo-lios of existing solar projects or systems that will be developed in the future. In the cases where existing projects are included, their historic performance is an important item to be evaluated. For portfolios of projects that are to be developed in the future, the methodology of the development and implementation process is a focus of the review.
In the review of the development process, the system design methodology is a key aspect. The design approach must be consistent and rigorous, while appropriately taking into account individual site differ-ences. The construction techniques must include a quality management process to ensure a reliably repeatable implementation of the PV systems.
The selection of components to be used in PV systems in the securitised portfolio is critical in minimising the risk associated with PV systems. The use of proven compo-nents can greatly increase the confidence in future system performance. This includes the PV modules, inverters and the mounting system, which represent a majority of the system component costs. The warranty and supply agreement conditions for key components can also be tailored to support the securitised systems.
It is important that the monitoring system employed is reliable and able to support the performance monitoring as well as the operations and maintenance (O&M) of the system. Securitised portfolios are typically not a good place to use new or unproven equipment. It is suggested that equipment that has been through a thorough technology review and appropri-ate testing be used in PV installations that are included in securitised portfolios.
The energy produced by each system in the portfolio drives the cash flow which supports the returns of the securitised
Table 2. Securitisation elements evaluated for risk.
Function Key Elements
Development process Sales, system design process, construction
Component selection PV modules, inverters, mounting, metering, balance of system
Energy production forecast Solar resource, local conditions, components
Contract review Local host contract, power purchase agreement, management agreement
Operations and maintenance Approach, scope, cost
Evaluation of existing systems Performance, quality
Financial model Review of inputs and calculations
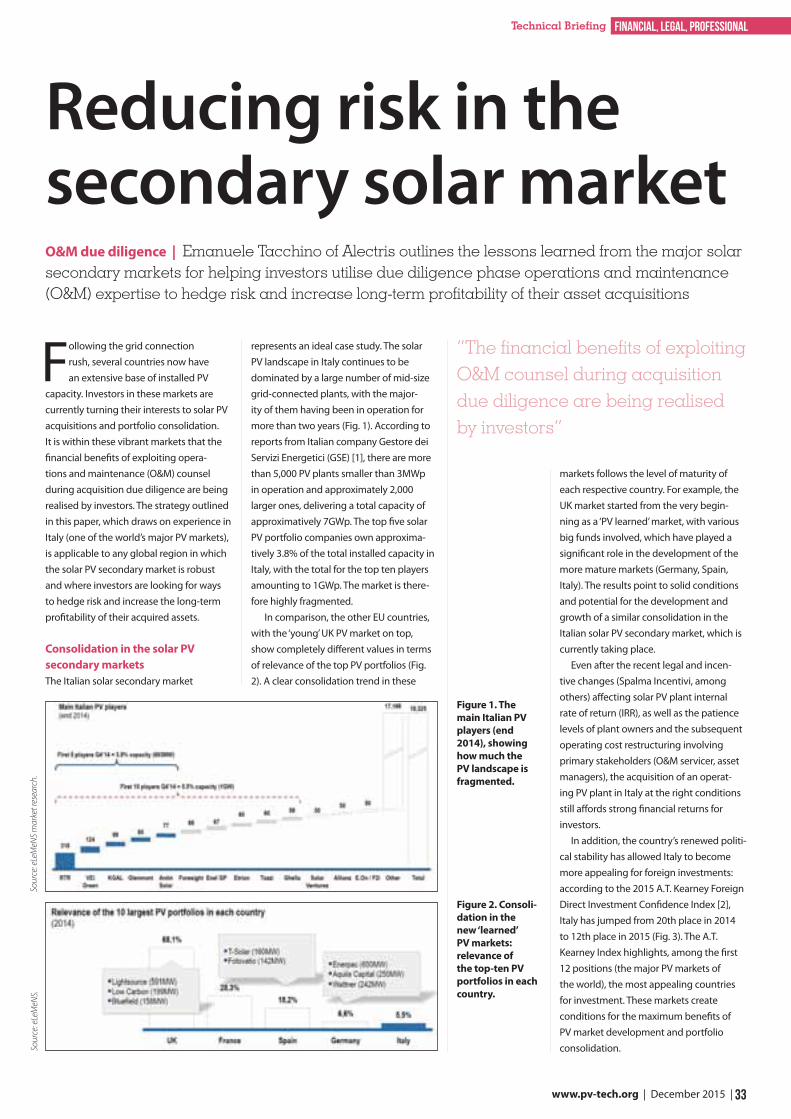
33 www.pv-tech.org | December 2015 |
financial, legal, professionalTechnical Briefing
Following the grid connection rush, several countries now have an extensive base of installed PV
capacity. Investors in these markets are currently turning their interests to solar PV acquisitions and portfolio consolidation. It is within these vibrant markets that the financial benefits of exploiting opera-tions and maintenance (O&M) counsel during acquisition due diligence are being realised by investors. The strategy outlined in this paper, which draws on experience in Italy (one of the world’s major PV markets), is applicable to any global region in which the solar PV secondary market is robust and where investors are looking for ways to hedge risk and increase the long-term profitability of their acquired assets.
Consolidation in the solar PV secondary markets The Italian solar secondary market
represents an ideal case study. The solar PV landscape in Italy continues to be dominated by a large number of mid-size grid-connected plants, with the major-ity of them having been in operation for more than two years (Fig. 1). According to reports from Italian company Gestore dei Servizi Energetici (GSE) [1], there are more than 5,000 PV plants smaller than 3MWp in operation and approximately 2,000 larger ones, delivering a total capacity of approximatively 7GWp. The top five solar PV portfolio companies own approxima-tively 3.8% of the total installed capacity in Italy, with the total for the top ten players amounting to 1GWp. The market is there-fore highly fragmented.
In comparison, the other EU countries, with the ‘young’ UK PV market on top, show completely different values in terms of relevance of the top PV portfolios (Fig. 2). A clear consolidation trend in these
markets follows the level of maturity of each respective country. For example, the UK market started from the very begin-ning as a ‘PV learned’ market, with various big funds involved, which have played a significant role in the development of the more mature markets (Germany, Spain, Italy). The results point to solid conditions and potential for the development and growth of a similar consolidation in the Italian solar PV secondary market, which is currently taking place.
Even after the recent legal and incen-tive changes (Spalma Incentivi, among others) affecting solar PV plant internal rate of return (IRR), as well as the patience levels of plant owners and the subsequent operating cost restructuring involving primary stakeholders (O&M servicer, asset managers), the acquisition of an operat-ing PV plant in Italy at the right conditions still affords strong financial returns for investors.
In addition, the country’s renewed politi-cal stability has allowed Italy to become more appealing for foreign investments: according to the 2015 A.T. Kearney Foreign Direct Investment Confidence Index [2], Italy has jumped from 20th place in 2014 to 12th place in 2015 (Fig. 3). The A.T. Kearney Index highlights, among the first 12 positions (the major PV markets of the world), the most appealing countries for investment. These markets create conditions for the maximum benefits of PV market development and portfolio consolidation.
Reducing risk in the secondary solar market O&M due diligence | Emanuele Tacchino of Alectris outlines the lessons learned from the major solar secondary markets for helping investors utilise due diligence phase operations and maintenance (O&M) expertise to hedge risk and increase long-term profitability of their asset acquisitions
“The financial benefits of exploiting O&M counsel during acquisition due diligence are being realised by investors”
Figure 1. The main Italian PV players (end 2014), showing how much the PV landscape is fragmented.
Figure 2. Consoli-dation in the new ‘learned’ PV markets: relevance of the top-ten PV portfolios in each country.
Sour
ce: e
LeM
eNS
mar
ket r
esea
rch.
Sour
ce: e
LeM
eNS.
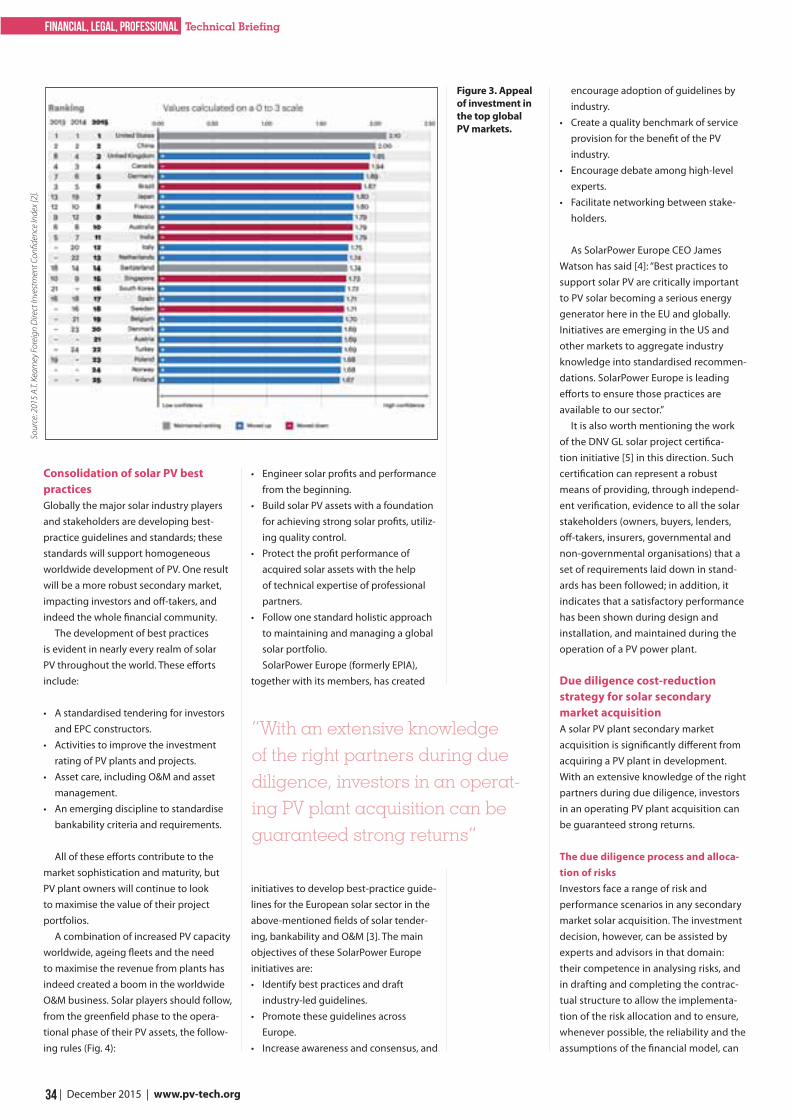
34 | December 2015 | www.pv-tech.org
financial, legal, professional Technical Briefing
Consolidation of solar PV best practices Globally the major solar industry players and stakeholders are developing best-practice guidelines and standards; these standards will support homogeneous worldwide development of PV. One result will be a more robust secondary market, impacting investors and off-takers, and indeed the whole financial community.
The development of best practices is evident in nearly every realm of solar PV throughout the world. These efforts include:
• A standardised tendering for investors and EPC constructors.
• Activities to improve the investment rating of PV plants and projects.
• Asset care, including O&M and asset management.
• An emerging discipline to standardise bankability criteria and requirements.
All of these efforts contribute to the market sophistication and maturity, but PV plant owners will continue to look to maximise the value of their project portfolios.
A combination of increased PV capacity worldwide, ageing fleets and the need to maximise the revenue from plants has indeed created a boom in the worldwide O&M business. Solar players should follow, from the greenfield phase to the opera-tional phase of their PV assets, the follow-ing rules (Fig. 4):
• Engineer solar profits and performance from the beginning.
• Build solar PV assets with a foundation for achieving strong solar profits, utiliz-ing quality control.
• Protect the profit performance of acquired solar assets with the help of technical expertise of professional partners.
• Follow one standard holistic approach to maintaining and managing a global solar portfolio.SolarPower Europe (formerly EPIA),
together with its members, has created
initiatives to develop best-practice guide-lines for the European solar sector in the above-mentioned fields of solar tender-ing, bankability and O&M [3]. The main objectives of these SolarPower Europe initiatives are:• Identify best practices and draft
industry-led guidelines. • Promote these guidelines across
Europe.• Increase awareness and consensus, and
encourage adoption of guidelines by industry.
• Create a quality benchmark of service provision for the benefit of the PV industry.
• Encourage debate among high-level experts.
• Facilitate networking between stake-holders.
As SolarPower Europe CEO James Watson has said [4]: “Best practices to support solar PV are critically important to PV solar becoming a serious energy generator here in the EU and globally. Initiatives are emerging in the US and other markets to aggregate industry knowledge into standardised recommen-dations. SolarPower Europe is leading efforts to ensure those practices are available to our sector.”
It is also worth mentioning the work of the DNV GL solar project certifica-tion initiative [5] in this direction. Such certification can represent a robust means of providing, through independ-ent verification, evidence to all the solar stakeholders (owners, buyers, lenders, off-takers, insurers, governmental and non-governmental organisations) that a set of requirements laid down in stand-ards has been followed; in addition, it indicates that a satisfactory performance has been shown during design and installation, and maintained during the operation of a PV power plant.
Due diligence cost-reduction strategy for solar secondary market acquisition A solar PV plant secondary market acquisition is significantly different from acquiring a PV plant in development. With an extensive knowledge of the right partners during due diligence, investors in an operating PV plant acquisition can be guaranteed strong returns.
The due diligence process and alloca-tion of risks Investors face a range of risk and performance scenarios in any secondary market solar acquisition. The investment decision, however, can be assisted by experts and advisors in that domain: their competence in analysing risks, and in drafting and completing the contrac-tual structure to allow the implementa-tion of the risk allocation and to ensure, whenever possible, the reliability and the assumptions of the financial model, can
“With an extensive knowledge of the right partners during due diligence, investors in an operat-ing PV plant acquisition can be guaranteed strong returns”
Figure 3. Appeal of investment in the top global PV markets.
Sour
ce: 2
015
A.T.
Kear
ney
Fore
ign
Dire
ct In
vest
men
t Con
fiden
ce In
dex
[2].
2016 INTERNATIONAL EVENTSBusiness critical events for solar and clean energy industry professionals
BOOK NOW AT www.solarenergyevents.com
@_SolarEnergy‘Solar Energy UK’
‘Solar Energy Events’
4 – 6 October 2016 | NEC, Birmingham, UKFREE to attend - uk.solarenergyevents.com
CO-LOCATED WITH:
INCORPORATING:
ENERGY BUYERS AND THE SOLAR INDUSTRY WILL MEET TO CLOSE THE POWER GAP
19 - 20 April 2016westafrica.solarenergyevents.com
June 2016solarenergyevents.com
DESIGNED TO CONNECT ENERGY USERS WITH INSTALLERS
March & April 2016 | Locations throughout the UKukroadshow.solarenergyevents.com
THE ONLY CTO SOLAR EVENT WHICH ADDRESSES THE BALANCE BETWEEN COST AND EFFICIENCY
16 - 17 March 2016 | Kuala Lumpur, Malaysia celltech.solarenergyevents.com
INCORPORATING: Solar O&M | Solar & Storage
26 - 28 April 2016 | Twickenham Stadium, UKsummit.solarenergyevents.com
MEET EUROPE’S BIGGEST ASSET OWNERS AND BUYERS
1-3 February 2016 | Grange City Hotel, London, UKfi nance.solarenergyevents.comFuture Events in: India - June/July 2016 New York - October
INCORPORATING: Solar Asset Management | 1 February 2016
SERIES
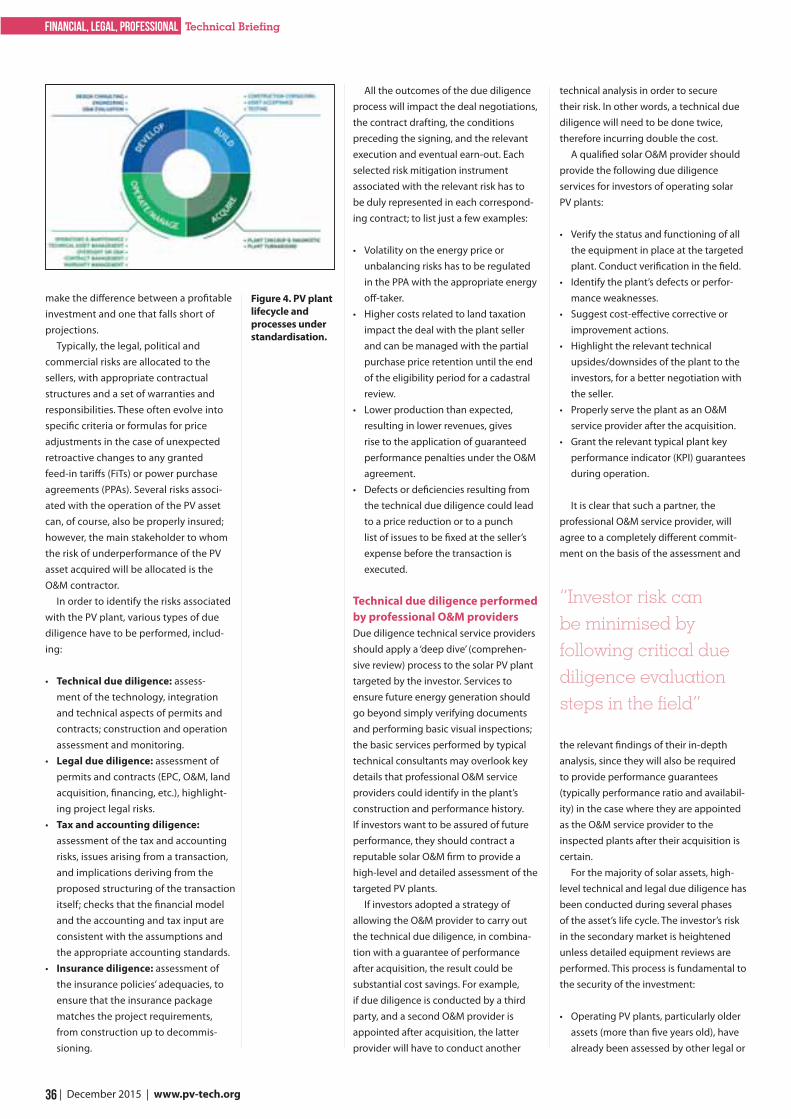
36 | December 2015 | www.pv-tech.org
financial, legal, professional Technical Briefing
All the outcomes of the due diligence process will impact the deal negotiations, the contract drafting, the conditions preceding the signing, and the relevant execution and eventual earn-out. Each selected risk mitigation instrument associated with the relevant risk has to be duly represented in each correspond-ing contract; to list just a few examples:
• Volatility on the energy price or unbalancing risks has to be regulated in the PPA with the appropriate energy off-taker.
• Higher costs related to land taxation impact the deal with the plant seller and can be managed with the partial purchase price retention until the end of the eligibility period for a cadastral review.
• Lower production than expected, resulting in lower revenues, gives rise to the application of guaranteed performance penalties under the O&M agreement.
• Defects or deficiencies resulting from the technical due diligence could lead to a price reduction or to a punch list of issues to be fixed at the seller’s expense before the transaction is executed.
Technical due diligence performed by professional O&M providersDue diligence technical service providers should apply a ‘deep dive’ (comprehen-sive review) process to the solar PV plant targeted by the investor. Services to ensure future energy generation should go beyond simply verifying documents and performing basic visual inspections; the basic services performed by typical technical consultants may overlook key details that professional O&M service providers could identify in the plant’s construction and performance history. If investors want to be assured of future performance, they should contract a reputable solar O&M firm to provide a high-level and detailed assessment of the targeted PV plants.
If investors adopted a strategy of allowing the O&M provider to carry out the technical due diligence, in combina-tion with a guarantee of performance after acquisition, the result could be substantial cost savings. For example, if due diligence is conducted by a third party, and a second O&M provider is appointed after acquisition, the latter provider will have to conduct another
make the difference between a profitable investment and one that falls short of projections.
Typically, the legal, political and commercial risks are allocated to the sellers, with appropriate contractual structures and a set of warranties and responsibilities. These often evolve into specific criteria or formulas for price adjustments in the case of unexpected retroactive changes to any granted feed-in tariffs (FiTs) or power purchase agreements (PPAs). Several risks associ-ated with the operation of the PV asset can, of course, also be properly insured; however, the main stakeholder to whom the risk of underperformance of the PV asset acquired will be allocated is the O&M contractor.
In order to identify the risks associated with the PV plant, various types of due diligence have to be performed, includ-ing:
• Technical due diligence: assess-ment of the technology, integration and technical aspects of permits and contracts; construction and operation assessment and monitoring.
• Legal due diligence: assessment of permits and contracts (EPC, O&M, land acquisition, financing, etc.), highlight-ing project legal risks.
• Tax and accounting diligence: assessment of the tax and accounting risks, issues arising from a transaction, and implications deriving from the proposed structuring of the transaction itself; checks that the financial model and the accounting and tax input are consistent with the assumptions and the appropriate accounting standards.
• Insurance diligence: assessment of the insurance policies’ adequacies, to ensure that the insurance package matches the project requirements, from construction up to decommis-sioning.
technical analysis in order to secure their risk. In other words, a technical due diligence will need to be done twice, therefore incurring double the cost.
A qualified solar O&M provider should provide the following due diligence services for investors of operating solar PV plants:
• Verify the status and functioning of all the equipment in place at the targeted plant. Conduct verification in the field.
• Identify the plant’s defects or perfor-mance weaknesses.
• Suggest cost-effective corrective or improvement actions.
• Highlight the relevant technical upsides/downsides of the plant to the investors, for a better negotiation with the seller.
• Properly serve the plant as an O&M service provider after the acquisition.
• Grant the relevant typical plant key performance indicator (KPI) guarantees during operation.
It is clear that such a partner, the professional O&M service provider, will agree to a completely different commit-ment on the basis of the assessment and
the relevant findings of their in-depth analysis, since they will also be required to provide performance guarantees (typically performance ratio and availabil-ity) in the case where they are appointed as the O&M service provider to the inspected plants after their acquisition is certain.
For the majority of solar assets, high-level technical and legal due diligence has been conducted during several phases of the asset’s life cycle. The investor’s risk in the secondary market is heightened unless detailed equipment reviews are performed. This process is fundamental to the security of the investment:
• Operating PV plants, particularly older assets (more than five years old), have already been assessed by other legal or
“Investor risk can be minimised by following critical due diligence evaluation steps in the field”
Figure 4. PV plant lifecycle and processes under standardisation.
37 www.pv-tech.org | December 2015 |
financial, legal, professionalTechnical Briefing
technical advisors during the financ-ing stage at the time of construction and/or during refinancing.
• To the investor, the risks related to legal due diligence (critical issues or red flags), to technical documenta-tion and the ‘as built’ of the existing plant, or to the compliance with applicable law and regulations, are quite limited (excluding full-equity plants, which have not yet been assessed by any technical consult-ants). The associated issues are typically remedied without incurring dramatic additional cost.
While the legal or high-level techni-cal risk is thus quite limited, or in some way ‘controlled’, the analysis of plant equipment is critical. Given the value of the investment, it becomes impera-tive to reduce any kind of operational surprise and future corrective costs after plant acquisition. Knowledge of the weaknesses of the targeted plants before acquisition will allow the inves-tor to save money on the acquisition itself. The value of this approach for an investor very much depends on the ability of a professional partner to:
• act in a speedy, accurate and complete manner in their assessment of a solar PV plant in the field;
• add fundamental understanding related to the real value of the plant that is being evaluated for acquisi-tion;
• provide quick and comprehensive answers to questions which are normally out of their scope.
Technical in-field due diligence detailsInvestor risk can be minimised by following critical due diligence evalu-ation steps in the field; this evaluative process provides a complete plant assessment, executed in phases of increasing accuracy. This approach also minimises investor expense. It is assumed that the O&M due diligence runs in parallel to the reviews of legal, tax and accounting aspects. The recom-mended solar PV O&M due diligence scope of work includes two phases.
Phase one• As-built vs. detailed engineering
and EPC contract analysiso PV plant layout, flash tests, wiring
plans, electrical drawings, design documentation
• Compliance of the plant with safety regulations and applicable norms
• Complete plant equipment checks on site o PV modules (string connections,
string boxes, broken/defective modules)
o Inverters (operation and state, existence/operation of DC/AC surge arresters)
o DC cables (state, sufficient currrent-carrying capacity)
o Mounting system (tilt position, state) o Transformers/MV part (MV UPS, LV
UPS, LV mainboard) o Trackers (position–orientation
and operation, stability and static efficiency)
o Security system (cameras, beams, magnetic contacts, DVR, motion detectors, optic fibre, etc.)
o Monitoring system (weather station, pyranometers, GSE meters)
o Communication (equipment, quality of internet connection)
• In-depth thermography
o Thermographic check of all modules, inverters and string boxes
Phase two This phase should be activated if and when the plant acquisition is probable, after it has achieved clean legal due diligence, with no major red flags:
• Additional in-depth measurements and checks o Junction boxes (string DC fuses,
measurements of Voc, Isc or Impp, I–V curves)
o Inverters (parameters/limits, AC/DC conversion)
o AC/DC cables (measurement of insulation level)
o Trackers (efficiency and state of motors, encoders)
o MV part (MV switch, MV UPS, trans-former)
o Pyranometers (verification of consist-ency of measured values)
o Communication (data transfer, connection stability)
Each phase’s investigative report should summarise the data and findings and provide a complete overview of the opera-
tional status of the installation. Specific qualitative and quantitative factors need to be analysed:
• Inverter dimensioning• Cabling dimensioning• Transformer dimensioning• Shadowing effect• Sorting of modules• Performance ratio (PR) of the plant (for
last year, as well as monthly values)• Availability of the plant and reliability
of the tracking system• Energy deviation between real values
and base case scenario• Irradiation deviation between real
values and base case scenario• Security system
Upon the completion of this range of work, the entire plant operation and performance will have been evaluated and will provide investor confidence to move forward with the plant acquisition. By tying the initial solar O&M provider services to the same firm as the one supplying the long-term care of the asset, the investor can gain additional value from this process in the form of securing long-term profitability.
Emanuele Tacchino is a business development manager in the Western Europe and Middle East division of Alectris. He has over a decade of experience in solar PV project management, dealing with PV projects or plant transactions and involving the development, construc-tion and operation of PV plants.
Author
[1] Gestore dei Servizi Energetici (GSE) [http://www.gse.it/en/Pages/default.aspx].
[2] A.T. Kearney 2015, “Connected risks: Investing in a divergent world”, 2015 A.T. Kearney Foreign Direct Investment Confidence Index [https:\www.atkearney.com\research-studies\foreign-direct-investment-confidence-index\2015\publication].
[3] SolarPower Europe, Operations and Maintenance Task Force [http://www.solarpowereurope.org/what-we-do/member-activities/operations-and-maintenance-task-force/].
[4] Willis, B. 2015, “EPIA forms task force to guide European solar O&M efforts”, News Report (May 12) [http://www.pv-tech.org/news/epia_forms_task_force_to_guide_european_solar_om_efforts].
[5] DNV GL 2015, “First photovoltaic power plants certification service specification” [https://www.dnvgl.com/news/first-photovoltaic-power-plants-certification-service-specification-28532].
References
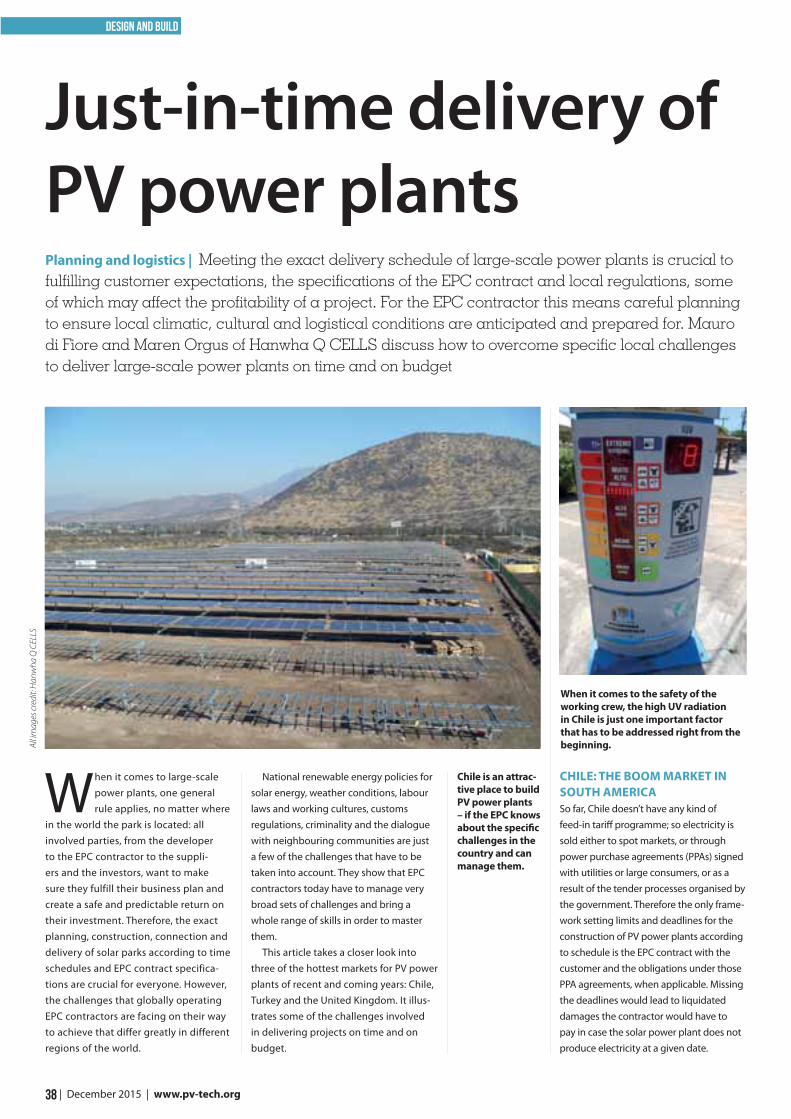
38 | December 2015 | www.pv-tech.org
Design and Build
When it comes to large-scale power plants, one general rule applies, no matter where
in the world the park is located: all involved parties, from the developer to the EPC contractor to the suppli-ers and the investors, want to make sure they fulfill their business plan and create a safe and predictable return on their investment. Therefore, the exact planning, construction, connection and delivery of solar parks according to time schedules and EPC contract specifica-tions are crucial for everyone. However, the challenges that globally operating EPC contractors are facing on their way to achieve that differ greatly in different regions of the world.
National renewable energy policies for solar energy, weather conditions, labour laws and working cultures, customs regulations, criminality and the dialogue with neighbouring communities are just a few of the challenges that have to be taken into account. They show that EPC contractors today have to manage very broad sets of challenges and bring a whole range of skills in order to master them.
This article takes a closer look into three of the hottest markets for PV power plants of recent and coming years: Chile, Turkey and the United Kingdom. It illus-trates some of the challenges involved in delivering projects on time and on budget.
CHILE: THE BOOM MARKET IN SOUTH AMERICASo far, Chile doesn’t have any kind of feed-in tariff programme; so electricity is sold either to spot markets, or through power purchase agreements (PPAs) signed with utilities or large consumers, or as a result of the tender processes organised by the government. Therefore the only frame-work setting limits and deadlines for the construction of PV power plants according to schedule is the EPC contract with the customer and the obligations under those PPA agreements, when applicable. Missing the deadlines would lead to liquidated damages the contractor would have to pay in case the solar power plant does not produce electricity at a given date.
Planning and logistics | Meeting the exact delivery schedule of large-scale power plants is crucial to fulfilling customer expectations, the specifications of the EPC contract and local regulations, some of which may affect the profitability of a project. For the EPC contractor this means careful planning to ensure local climatic, cultural and logistical conditions are anticipated and prepared for. Mauro di Fiore and Maren Orgus of Hanwha Q CELLS discuss how to overcome specific local challenges to deliver large-scale power plants on time and on budget
Just-in-time delivery of PV power plants
Chile is an attrac-tive place to build PV power plants – if the EPC knows about the specific challenges in the country and can manage them.
All i
mag
es c
redi
t: H
anw
ha Q
CEL
LS
When it comes to the safety of the working crew, the high UV radiation in Chile is just one important factor that has to be addressed right from the beginning.
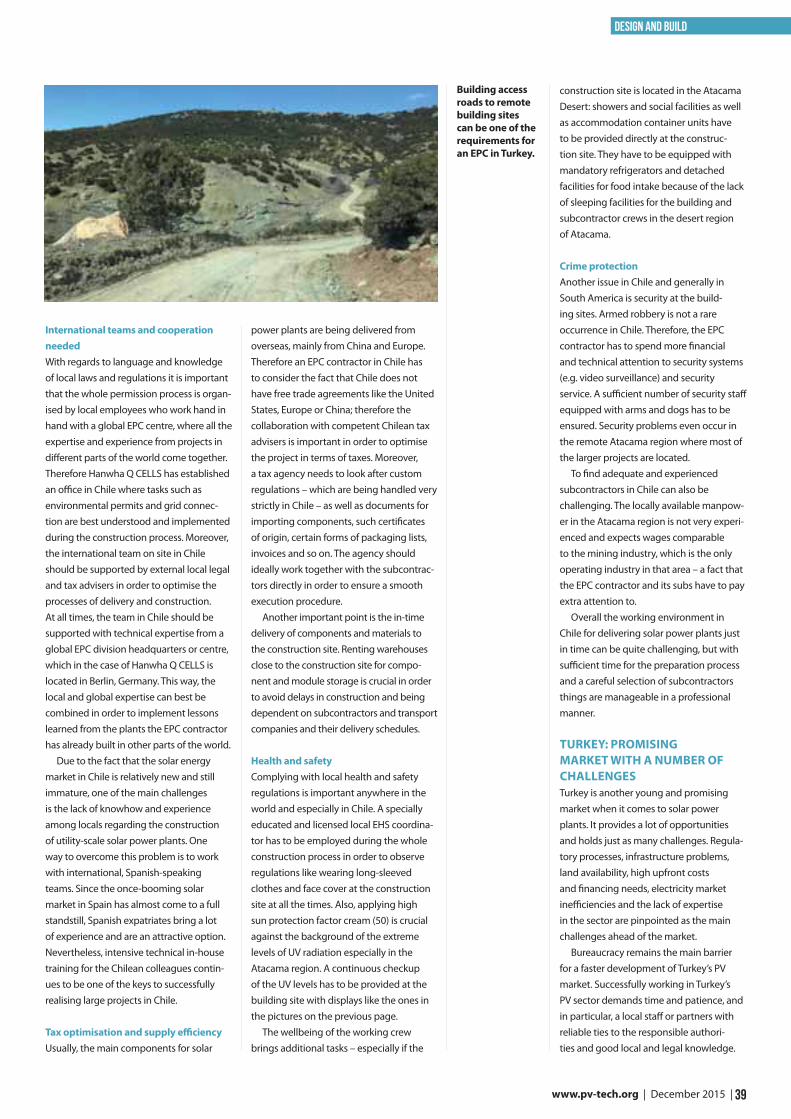
39 www.pv-tech.org | December 2015 |
Design and Build
International teams and cooperation needed With regards to language and knowledge of local laws and regulations it is important that the whole permission process is organ-ised by local employees who work hand in hand with a global EPC centre, where all the expertise and experience from projects in different parts of the world come together. Therefore Hanwha Q CELLS has established an office in Chile where tasks such as environmental permits and grid connec-tion are best understood and implemented during the construction process. Moreover, the international team on site in Chile should be supported by external local legal and tax advisers in order to optimise the processes of delivery and construction. At all times, the team in Chile should be supported with technical expertise from a global EPC division headquarters or centre, which in the case of Hanwha Q CELLS is located in Berlin, Germany. This way, the local and global expertise can best be combined in order to implement lessons learned from the plants the EPC contractor has already built in other parts of the world.
Due to the fact that the solar energy market in Chile is relatively new and still immature, one of the main challenges is the lack of knowhow and experience among locals regarding the construction of utility-scale solar power plants. One way to overcome this problem is to work with international, Spanish-speaking teams. Since the once-booming solar market in Spain has almost come to a full standstill, Spanish expatriates bring a lot of experience and are an attractive option. Nevertheless, intensive technical in-house training for the Chilean colleagues contin-ues to be one of the keys to successfully realising large projects in Chile.
Tax optimisation and supply efficiencyUsually, the main components for solar
construction site is located in the Atacama Desert: showers and social facilities as well as accommodation container units have to be provided directly at the construc-tion site. They have to be equipped with mandatory refrigerators and detached facilities for food intake because of the lack of sleeping facilities for the building and subcontractor crews in the desert region of Atacama.
Crime protectionAnother issue in Chile and generally in South America is security at the build-ing sites. Armed robbery is not a rare occurrence in Chile. Therefore, the EPC contractor has to spend more financial and technical attention to security systems (e.g. video surveillance) and security service. A sufficient number of security staff equipped with arms and dogs has to be ensured. Security problems even occur in the remote Atacama region where most of the larger projects are located.
To find adequate and experienced subcontractors in Chile can also be challenging. The locally available manpow-er in the Atacama region is not very experi-enced and expects wages comparable to the mining industry, which is the only operating industry in that area – a fact that the EPC contractor and its subs have to pay extra attention to.
Overall the working environment in Chile for delivering solar power plants just in time can be quite challenging, but with sufficient time for the preparation process and a careful selection of subcontractors things are manageable in a professional manner.
TURKEY: PROMISING MARKET WITH A NUMBER OF CHALLENGESTurkey is another young and promising market when it comes to solar power plants. It provides a lot of opportunities and holds just as many challenges. Regula-tory processes, infrastructure problems, land availability, high upfront costs and financing needs, electricity market inefficiencies and the lack of expertise in the sector are pinpointed as the main challenges ahead of the market.
Bureaucracy remains the main barrier for a faster development of Turkey’s PV market. Successfully working in Turkey’s PV sector demands time and patience, and in particular, a local staff or partners with reliable ties to the responsible authori-ties and good local and legal knowledge.
power plants are being delivered from overseas, mainly from China and Europe. Therefore an EPC contractor in Chile has to consider the fact that Chile does not have free trade agreements like the United States, Europe or China; therefore the collaboration with competent Chilean tax advisers is important in order to optimise the project in terms of taxes. Moreover, a tax agency needs to look after custom regulations – which are being handled very strictly in Chile – as well as documents for importing components, such certificates of origin, certain forms of packaging lists, invoices and so on. The agency should ideally work together with the subcontrac-tors directly in order to ensure a smooth execution procedure.
Another important point is the in-time delivery of components and materials to the construction site. Renting warehouses close to the construction site for compo-nent and module storage is crucial in order to avoid delays in construction and being dependent on subcontractors and transport companies and their delivery schedules.
Health and safetyComplying with local health and safety regulations is important anywhere in the world and especially in Chile. A specially educated and licensed local EHS coordina-tor has to be employed during the whole construction process in order to observe regulations like wearing long-sleeved clothes and face cover at the construction site at all the times. Also, applying high sun protection factor cream (50) is crucial against the background of the extreme levels of UV radiation especially in the Atacama region. A continuous checkup of the UV levels has to be provided at the building site with displays like the ones in the pictures on the previous page.
The wellbeing of the working crew brings additional tasks – especially if the
Building access roads to remote building sites can be one of the requirements for an EPC in Turkey.
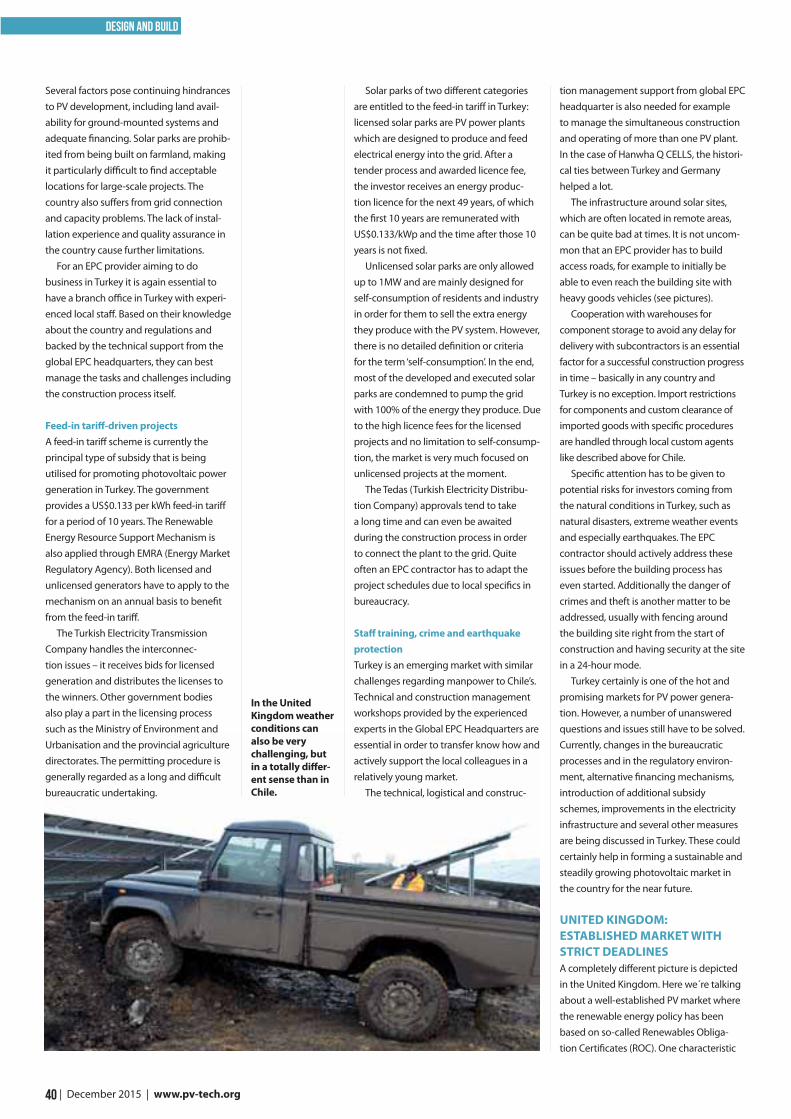
40 | December 2015 | www.pv-tech.org
Design and Build
In the United Kingdom weather conditions can also be very challenging, but in a totally differ-ent sense than in Chile.
Several factors pose continuing hindrances to PV development, including land avail-ability for ground-mounted systems and adequate financing. Solar parks are prohib-ited from being built on farmland, making it particularly difficult to find acceptable locations for large-scale projects. The country also suffers from grid connection and capacity problems. The lack of instal-lation experience and quality assurance in the country cause further limitations.
For an EPC provider aiming to do business in Turkey it is again essential to have a branch office in Turkey with experi-enced local staff. Based on their knowledge about the country and regulations and backed by the technical support from the global EPC headquarters, they can best manage the tasks and challenges including the construction process itself.
Feed-in tariff-driven projectsA feed-in tariff scheme is currently the principal type of subsidy that is being utilised for promoting photovoltaic power generation in Turkey. The government provides a US$0.133 per kWh feed-in tariff for a period of 10 years. The Renewable Energy Resource Support Mechanism is also applied through EMRA (Energy Market Regulatory Agency). Both licensed and unlicensed generators have to apply to the mechanism on an annual basis to benefit from the feed-in tariff.
The Turkish Electricity Transmission Company handles the interconnec-tion issues – it receives bids for licensed generation and distributes the licenses to the winners. Other government bodies also play a part in the licensing process such as the Ministry of Environment and Urbanisation and the provincial agriculture directorates. The permitting procedure is generally regarded as a long and difficult bureaucratic undertaking.
Solar parks of two different categories are entitled to the feed-in tariff in Turkey: licensed solar parks are PV power plants which are designed to produce and feed electrical energy into the grid. After a tender process and awarded licence fee, the investor receives an energy produc-tion licence for the next 49 years, of which the first 10 years are remunerated with US$0.133/kWp and the time after those 10 years is not fixed.
Unlicensed solar parks are only allowed up to 1MW and are mainly designed for self-consumption of residents and industry in order for them to sell the extra energy they produce with the PV system. However, there is no detailed definition or criteria for the term ‘self-consumption’. In the end, most of the developed and executed solar parks are condemned to pump the grid with 100% of the energy they produce. Due to the high licence fees for the licensed projects and no limitation to self-consump-tion, the market is very much focused on unlicensed projects at the moment.
The Tedas (Turkish Electricity Distribu-tion Company) approvals tend to take a long time and can even be awaited during the construction process in order to connect the plant to the grid. Quite often an EPC contractor has to adapt the project schedules due to local specifics in bureaucracy.
Staff training, crime and earthquake protectionTurkey is an emerging market with similar challenges regarding manpower to Chile’s. Technical and construction management workshops provided by the experienced experts in the Global EPC Headquarters are essential in order to transfer know how and actively support the local colleagues in a relatively young market.
The technical, logistical and construc-
tion management support from global EPC headquarter is also needed for example to manage the simultaneous construction and operating of more than one PV plant. In the case of Hanwha Q CELLS, the histori-cal ties between Turkey and Germany helped a lot.
The infrastructure around solar sites, which are often located in remote areas, can be quite bad at times. It is not uncom-mon that an EPC provider has to build access roads, for example to initially be able to even reach the building site with heavy goods vehicles (see pictures).
Cooperation with warehouses for component storage to avoid any delay for delivery with subcontractors is an essential factor for a successful construction progress in time – basically in any country and Turkey is no exception. Import restrictions for components and custom clearance of imported goods with specific procedures are handled through local custom agents like described above for Chile.
Specific attention has to be given to potential risks for investors coming from the natural conditions in Turkey, such as natural disasters, extreme weather events and especially earthquakes. The EPC contractor should actively address these issues before the building process has even started. Additionally the danger of crimes and theft is another matter to be addressed, usually with fencing around the building site right from the start of construction and having security at the site in a 24-hour mode.
Turkey certainly is one of the hot and promising markets for PV power genera-tion. However, a number of unanswered questions and issues still have to be solved. Currently, changes in the bureaucratic processes and in the regulatory environ-ment, alternative financing mechanisms, introduction of additional subsidy schemes, improvements in the electricity infrastructure and several other measures are being discussed in Turkey. These could certainly help in forming a sustainable and steadily growing photovoltaic market in the country for the near future.
UNITED KINGDOM: ESTABLISHED MARKET WITH STRICT DEADLINESA completely different picture is depicted in the United Kingdom. Here we´re talking about a well-established PV market where the renewable energy policy has been based on so-called Renewables Obliga-tion Certificates (ROC). One characteristic

summit.solarenergyevents.com
For more information contact Dominic Barklem | [email protected] | +44 (0) 207 871 0122
A NEW PLAYING FIELD
TWICKENHAM STADIUM | 26 - 28 April 2016
LEAD THE CONVERSATIONContact us today to drive the clean energy movement and demonstrate the vital role solar has to play.
Infl uence our programme and work with the team you can rely on for a good show at Twickenham!
Incorporating the industry’s leading spring event, Clean Energy Summit 2016 will bring together major stakeholders in the growing clean technology space. The event will allow the established UK solar industry to explore opportunities in a post-subsidy world, engaging with energy consumers and project developers to realise the vision for clean energy in the UK.
SUPER EARLYBIRD!
BOOK NOW for best
rates
Headline Sponsor
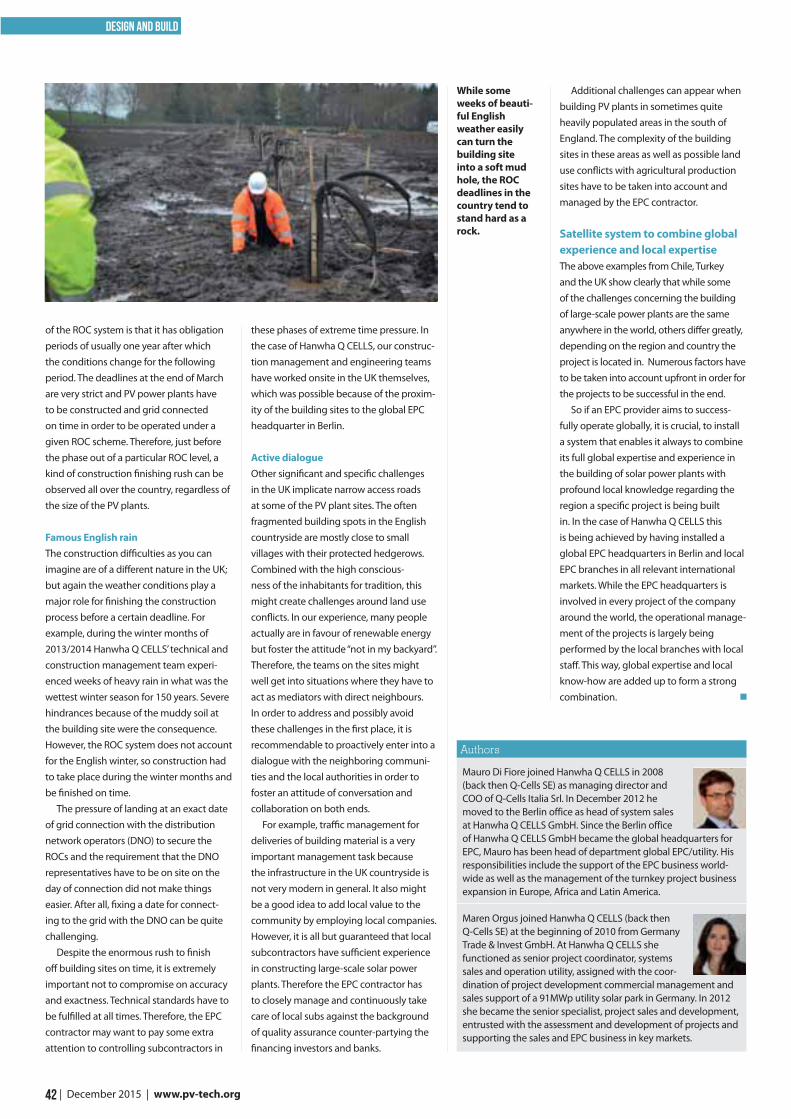
42 | December 2015 | www.pv-tech.org
Design and Build
of the ROC system is that it has obligation periods of usually one year after which the conditions change for the following period. The deadlines at the end of March are very strict and PV power plants have to be constructed and grid connected on time in order to be operated under a given ROC scheme. Therefore, just before the phase out of a particular ROC level, a kind of construction finishing rush can be observed all over the country, regardless of the size of the PV plants.
Famous English rainThe construction difficulties as you can imagine are of a different nature in the UK; but again the weather conditions play a major role for finishing the construction process before a certain deadline. For example, during the winter months of 2013/2014 Hanwha Q CELLS’ technical and construction management team experi-enced weeks of heavy rain in what was the wettest winter season for 150 years. Severe hindrances because of the muddy soil at the building site were the consequence. However, the ROC system does not account for the English winter, so construction had to take place during the winter months and be finished on time.
The pressure of landing at an exact date of grid connection with the distribution network operators (DNO) to secure the ROCs and the requirement that the DNO representatives have to be on site on the day of connection did not make things easier. After all, fixing a date for connect-ing to the grid with the DNO can be quite challenging.
Despite the enormous rush to finish off building sites on time, it is extremely important not to compromise on accuracy and exactness. Technical standards have to be fulfilled at all times. Therefore, the EPC contractor may want to pay some extra attention to controlling subcontractors in
these phases of extreme time pressure. In the case of Hanwha Q CELLS, our construc-tion management and engineering teams have worked onsite in the UK themselves, which was possible because of the proxim-ity of the building sites to the global EPC headquarter in Berlin.
Active dialogueOther significant and specific challenges in the UK implicate narrow access roads at some of the PV plant sites. The often fragmented building spots in the English countryside are mostly close to small villages with their protected hedgerows. Combined with the high conscious-ness of the inhabitants for tradition, this might create challenges around land use conflicts. In our experience, many people actually are in favour of renewable energy but foster the attitude “not in my backyard”. Therefore, the teams on the sites might well get into situations where they have to act as mediators with direct neighbours. In order to address and possibly avoid these challenges in the first place, it is recommendable to proactively enter into a dialogue with the neighboring communi-ties and the local authorities in order to foster an attitude of conversation and collaboration on both ends.
For example, traffic management for deliveries of building material is a very important management task because the infrastructure in the UK countryside is not very modern in general. It also might be a good idea to add local value to the community by employing local companies. However, it is all but guaranteed that local subcontractors have sufficient experience in constructing large-scale solar power plants. Therefore the EPC contractor has to closely manage and continuously take care of local subs against the background of quality assurance counter-partying the financing investors and banks.
Additional challenges can appear when building PV plants in sometimes quite heavily populated areas in the south of England. The complexity of the building sites in these areas as well as possible land use conflicts with agricultural production sites have to be taken into account and managed by the EPC contractor.
Satellite system to combine global experience and local expertiseThe above examples from Chile, Turkey and the UK show clearly that while some of the challenges concerning the building of large-scale power plants are the same anywhere in the world, others differ greatly, depending on the region and country the project is located in. Numerous factors have to be taken into account upfront in order for the projects to be successful in the end.
So if an EPC provider aims to success-fully operate globally, it is crucial, to install a system that enables it always to combine its full global expertise and experience in the building of solar power plants with profound local knowledge regarding the region a specific project is being built in. In the case of Hanwha Q CELLS this is being achieved by having installed a global EPC headquarters in Berlin and local EPC branches in all relevant international markets. While the EPC headquarters is involved in every project of the company around the world, the operational manage-ment of the projects is largely being performed by the local branches with local staff. This way, global expertise and local know-how are added up to form a strong combination.
While some weeks of beauti-ful English weather easily can turn the building site into a soft mud hole, the ROC deadlines in the country tend to stand hard as a rock.
Mauro Di Fiore joined Hanwha Q CELLS in 2008 (back then Q-Cells SE) as managing director and COO of Q-Cells Italia Srl. In December 2012 he moved to the Berlin office as head of system sales at Hanwha Q CELLS GmbH. Since the Berlin office of Hanwha Q CELLS GmbH became the global headquarters for EPC, Mauro has been head of department global EPC/utility. His responsibilities include the support of the EPC business world-wide as well as the management of the turnkey project business expansion in Europe, Africa and Latin America.
Maren Orgus joined Hanwha Q CELLS (back then Q-Cells SE) at the beginning of 2010 from Germany Trade & Invest GmbH. At Hanwha Q CELLS she functioned as senior project coordinator, systems sales and operation utility, assigned with the coor-dination of project development commercial management and sales support of a 91MWp utility solar park in Germany. In 2012 she became the senior specialist, project sales and development, entrusted with the assessment and development of projects and supporting the sales and EPC business in key markets.
Authors
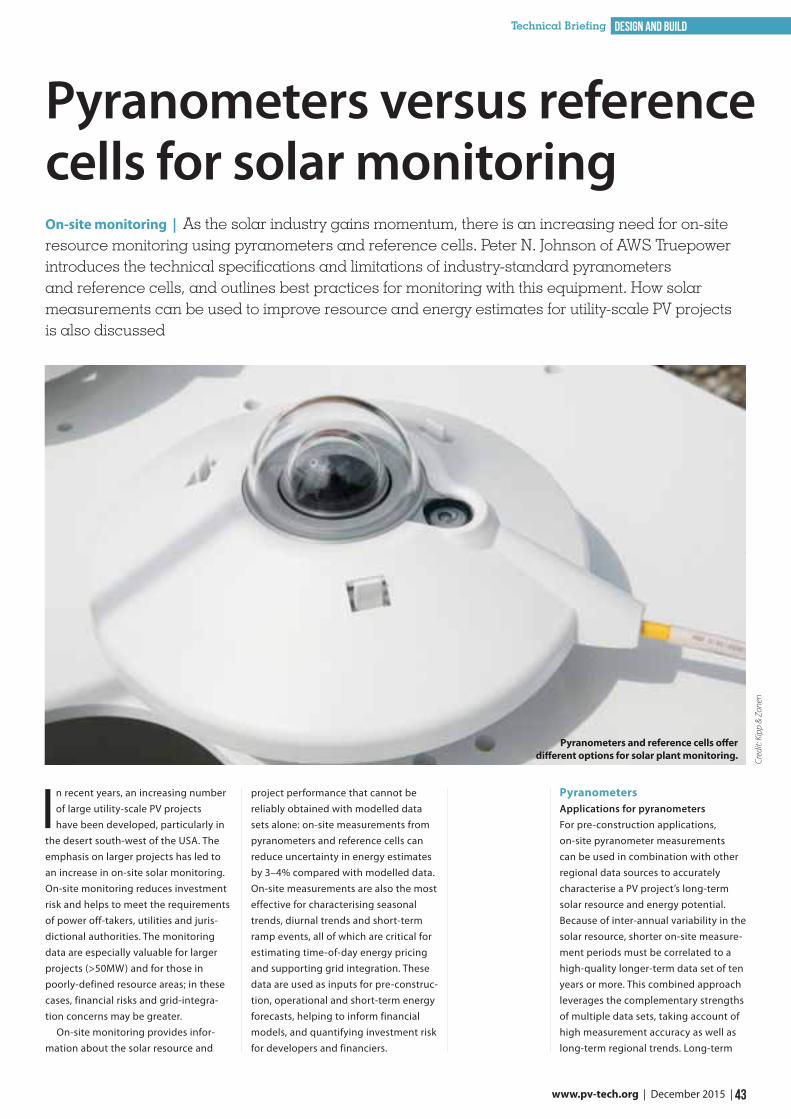
43 www.pv-tech.org | December 2015 |
Design and Build Technical Briefing
In recent years, an increasing number of large utility-scale PV projects have been developed, particularly in
the desert south-west of the USA. The emphasis on larger projects has led to an increase in on-site solar monitoring. On-site monitoring reduces investment risk and helps to meet the requirements of power off-takers, utilities and juris-dictional authorities. The monitoring data are especially valuable for larger projects (>50MW) and for those in poorly-defined resource areas; in these cases, financial risks and grid-integra-tion concerns may be greater.
On-site monitoring provides infor-mation about the solar resource and
project performance that cannot be reliably obtained with modelled data sets alone: on-site measurements from pyranometers and reference cells can reduce uncertainty in energy estimates by 3–4% compared with modelled data. On-site measurements are also the most effective for characterising seasonal trends, diurnal trends and short-term ramp events, all of which are critical for estimating time-of-day energy pricing and supporting grid integration. These data are used as inputs for pre-construc-tion, operational and short-term energy forecasts, helping to inform financial models, and quantifying investment risk for developers and financiers.
PyranometersApplications for pyranometersFor pre-construction applications, on-site pyranometer measurements can be used in combination with other regional data sources to accurately characterise a PV project’s long-term solar resource and energy potential. Because of inter-annual variability in the solar resource, shorter on-site measure-ment periods must be correlated to a high-quality longer-term data set of ten years or more. This combined approach leverages the complementary strengths of multiple data sets, taking account of high measurement accuracy as well as long-term regional trends. Long-term
On-site monitoring | As the solar industry gains momentum, there is an increasing need for on-site resource monitoring using pyranometers and reference cells. Peter N. Johnson of AWS Truepower introduces the technical specifications and limitations of industry-standard pyranometers and reference cells, and outlines best practices for monitoring with this equipment. How solar measurements can be used to improve resource and energy estimates for utility-scale PV projects is also discussed
Pyranometers versus reference cells for solar monitoring
Pyranometers and reference cells offer different options for solar plant monitoring. Cr
edit:
Kip
p &
Zone
n
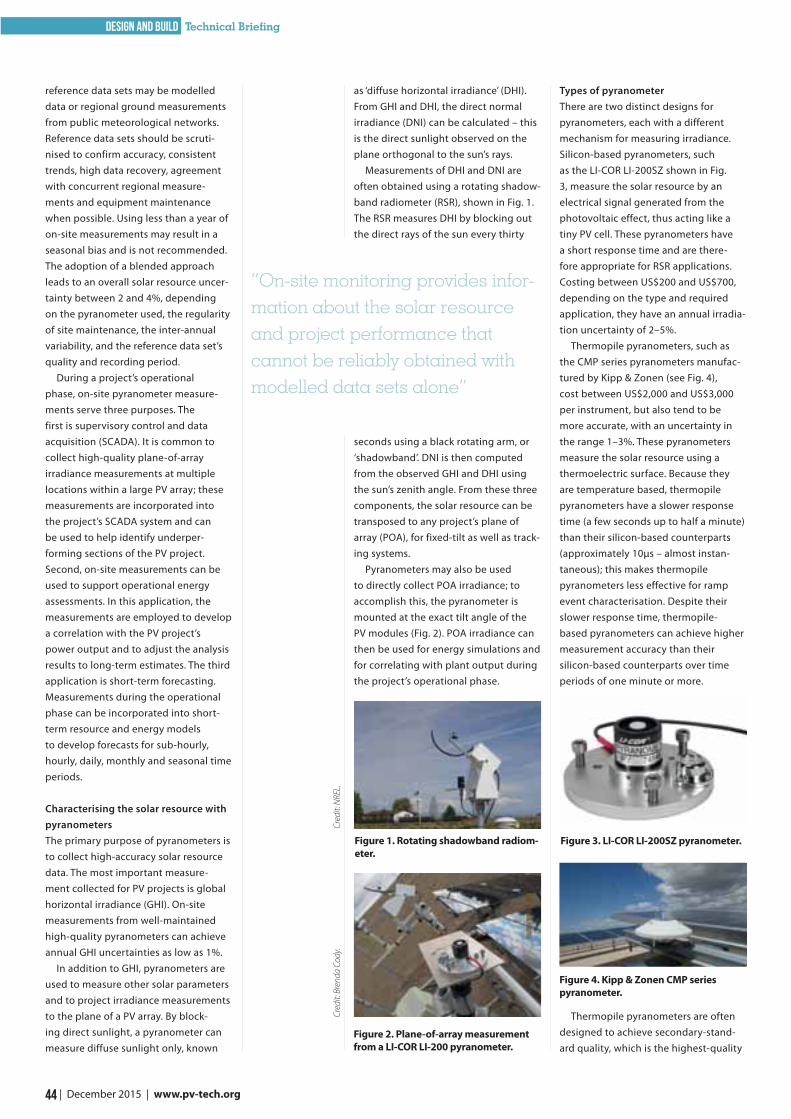
44 | December 2015 | www.pv-tech.org
Design and Build Technical Briefing
reference data sets may be modelled data or regional ground measurements from public meteorological networks. Reference data sets should be scruti-nised to confirm accuracy, consistent trends, high data recovery, agreement with concurrent regional measure-ments and equipment maintenance when possible. Using less than a year of on-site measurements may result in a seasonal bias and is not recommended. The adoption of a blended approach leads to an overall solar resource uncer-tainty between 2 and 4%, depending on the pyranometer used, the regularity of site maintenance, the inter-annual variability, and the reference data set’s quality and recording period.
During a project’s operational phase, on-site pyranometer measure-ments serve three purposes. The first is supervisory control and data acquisition (SCADA). It is common to collect high-quality plane-of-array irradiance measurements at multiple locations within a large PV array; these measurements are incorporated into the project’s SCADA system and can be used to help identify underper-forming sections of the PV project. Second, on-site measurements can be used to support operational energy assessments. In this application, the measurements are employed to develop a correlation with the PV project’s power output and to adjust the analysis results to long-term estimates. The third application is short-term forecasting. Measurements during the operational phase can be incorporated into short-term resource and energy models to develop forecasts for sub-hourly, hourly, daily, monthly and seasonal time periods.
Characterising the solar resource with pyranometersThe primary purpose of pyranometers is to collect high-accuracy solar resource data. The most important measure-ment collected for PV projects is global horizontal irradiance (GHI). On-site measurements from well-maintained high-quality pyranometers can achieve annual GHI uncertainties as low as 1%.
In addition to GHI, pyranometers are used to measure other solar parameters and to project irradiance measurements to the plane of a PV array. By block-ing direct sunlight, a pyranometer can measure diffuse sunlight only, known
as ‘diffuse horizontal irradiance’ (DHI). From GHI and DHI, the direct normal irradiance (DNI) can be calculated – this is the direct sunlight observed on the plane orthogonal to the sun’s rays.
Measurements of DHI and DNI are often obtained using a rotating shadow-band radiometer (RSR), shown in Fig. 1. The RSR measures DHI by blocking out the direct rays of the sun every thirty
seconds using a black rotating arm, or ‘shadowband’. DNI is then computed from the observed GHI and DHI using the sun’s zenith angle. From these three components, the solar resource can be transposed to any project’s plane of array (POA), for fixed-tilt as well as track-ing systems.
Pyranometers may also be used to directly collect POA irradiance; to accomplish this, the pyranometer is mounted at the exact tilt angle of the PV modules (Fig. 2). POA irradiance can then be used for energy simulations and for correlating with plant output during the project’s operational phase.
Types of pyranometerThere are two distinct designs for pyranometers, each with a different mechanism for measuring irradiance. Silicon-based pyranometers, such as the LI-COR LI-200SZ shown in Fig. 3, measure the solar resource by an electrical signal generated from the photovoltaic effect, thus acting like a tiny PV cell. These pyranometers have a short response time and are there-fore appropriate for RSR applications. Costing between US$200 and US$700, depending on the type and required application, they have an annual irradia-tion uncertainty of 2–5%.
Thermopile pyranometers, such as the CMP series pyranometers manufac-tured by Kipp & Zonen (see Fig. 4), cost between US$2,000 and US$3,000 per instrument, but also tend to be more accurate, with an uncertainty in the range 1–3%. These pyranometers measure the solar resource using a thermoelectric surface. Because they are temperature based, thermopile pyranometers have a slower response time (a few seconds up to half a minute) than their silicon-based counterparts (approximately 10μs – almost instan-taneous); this makes thermopile pyranometers less effective for ramp event characterisation. Despite their slower response time, thermopile-based pyranometers can achieve higher measurement accuracy than their silicon-based counterparts over time periods of one minute or more.
Thermopile pyranometers are often designed to achieve secondary-stand-ard quality, which is the highest-quality
Figure 1. Rotating shadowband radiom-eter.
Figure 2. Plane-of-array measurement from a LI-COR LI-200 pyranometer.
Cred
it: N
REL.
Cred
it: B
rend
a Co
dy.
Figure 3. LI-COR LI-200SZ pyranometer.
Figure 4. Kipp & Zonen CMP series pyranometer.
“On-site monitoring provides infor-mation about the solar resource and project performance that cannot be reliably obtained with modelled data sets alone”

Design and Build Technical Briefing
instrument available for field deploy-ment. The name ‘secondary standard’ refers to the sensor’s calibration using a lab-based primary standard pyranom-eter that is certified by the World Radiation Center. Pyranometers of this calibre must meet rigorous require-ments for response time, non-stability (drift), non-linearity, spectral selectiv-ity, temperature and tilt response, and achievable uncertainty. Silicon-based pyranometers, on the other hand, do not meet all the technical requirements of secondary-standard equipment, but are still useful for a variety of applica-tions, including long-term resource assessment, short-term forecasting, correlations with plant performance, and measurement networks.
Pyranometer best practices and maintenanceIn order to achieve the lowest solar resource uncertainty, pyranometers installed in the field must be properly configured and maintained. Pyranom-eters should be sited higher than surrounding instrumentation to avoid being shaded. They should also be
installed on steady but adjustable mounting arms to prevent non-level-ness, which would lead to poor measurement results: non-levelness to the east or the west leads to skewed diurnal patterns, while non-levelness to the north or south leads to measure-ments being lower or higher than actual. Redundant pyranometers are recommended as a quality-control measure, to achieve high data recover-ies in the event of equipment failure and to validate data using comparison techniques.
Daily, semi-weekly or weekly on-site maintenance of pyranometers is essen-tial to maximise measurement accuracy. When maintenance is neglected for long periods, measurement accuracy can degrade by as much as 5–10% because of a change in the orientation of the sensor or because of the accumu-lation of dust, snow or bird droppings.
The standard maintenance procedure includes re-levelling the pyranometer and carefully cleaning its surface with compressed air, distilled water and a streak-free, scratch-free cloth (Figs. 5 and 6).
Pyranometer data are commonly
“The primary purpose of pyranometers is to collect high-accuracy solar resource data”
Figure 5. Sensor levelling of the LI-200 pyranometer.
© F
rank
Car
roll.
Figure 6. Cleaning the CMP11 pyranom-eter.
© F
rank
Car
roll.
T h e N e t h e r l a n d s • U n i t e d S t a t e s o f A m e r i c a • F r a n c e • S i n g a p o r e • C h i n a
6 New Smart Instruments make our Smart Range complete
In 2012 Kipp & Zonen was the first to produce digital pyranometers and pyrheliometers to measure solar radiation.
So far, customers enjoyed our SMP3, SMP10 and SMP11 pyranometer and the SHP1 pyrheliometer.
Now, upon customer requests, we complete our range of Smart instruments with the new SMP6, SMP21 and SMP22 pyranometers,
the SGR3 and SGR4 pyrgeometers, and the SUV5 total UV radiometer.
Global, direct, diffuse, UV, long-wave and short-wave, all Smart!
Be Smart... go digital with Kipp & Zonen!
www.kippzonen.com
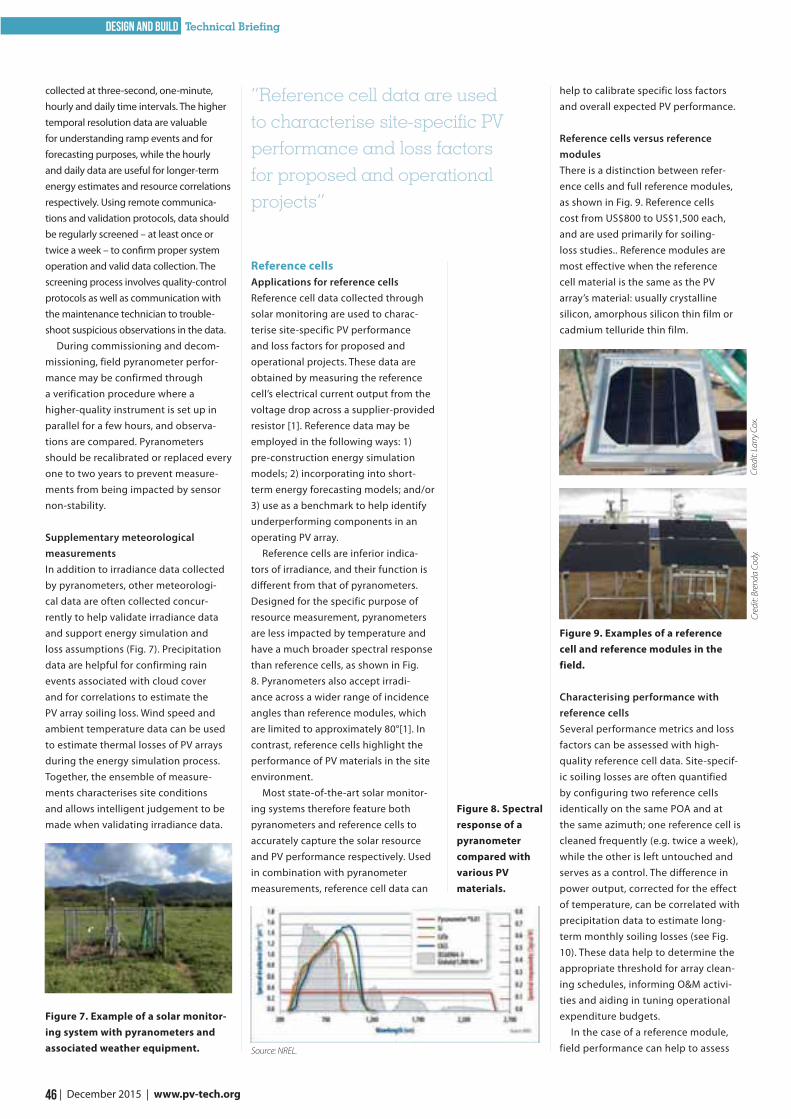
46 | December 2015 | www.pv-tech.org
Design and Build Technical Briefing
collected at three-second, one-minute, hourly and daily time intervals. The higher temporal resolution data are valuable for understanding ramp events and for forecasting purposes, while the hourly and daily data are useful for longer-term energy estimates and resource correlations respectively. Using remote communica-tions and validation protocols, data should be regularly screened – at least once or twice a week – to confirm proper system operation and valid data collection. The screening process involves quality-control protocols as well as communication with the maintenance technician to trouble-shoot suspicious observations in the data.
During commissioning and decom-missioning, field pyranometer perfor-mance may be confirmed through a verification procedure where a higher-quality instrument is set up in parallel for a few hours, and observa-tions are compared. Pyranometers should be recalibrated or replaced every one to two years to prevent measure-ments from being impacted by sensor non-stability.
Supplementary meteorological measurementsIn addition to irradiance data collected by pyranometers, other meteorologi-cal data are often collected concur-rently to help validate irradiance data and support energy simulation and loss assumptions (Fig. 7). Precipitation data are helpful for confirming rain events associated with cloud cover and for correlations to estimate the PV array soiling loss. Wind speed and ambient temperature data can be used to estimate thermal losses of PV arrays during the energy simulation process. Together, the ensemble of measure-ments characterises site conditions and allows intelligent judgement to be made when validating irradiance data.
Figure 7. Example of a solar monitor-ing system with pyranometers and associated weather equipment.
help to calibrate specific loss factors and overall expected PV performance.
Reference cells versus reference modulesThere is a distinction between refer-ence cells and full reference modules, as shown in Fig. 9. Reference cells cost from US$800 to US$1,500 each, and are used primarily for soiling-loss studies.. Reference modules are most effective when the reference cell material is the same as the PV array’s material: usually crystalline silicon, amorphous silicon thin film or cadmium telluride thin film.
Figure 9. Examples of a reference cell and reference modules in the field.
Characterising performance with reference cellsSeveral performance metrics and loss factors can be assessed with high-quality reference cell data. Site-specif-ic soiling losses are often quantified by configuring two reference cells identically on the same POA and at the same azimuth; one reference cell is cleaned frequently (e.g. twice a week), while the other is left untouched and serves as a control. The difference in power output, corrected for the effect of temperature, can be correlated with precipitation data to estimate long-term monthly soiling losses (see Fig. 10). These data help to determine the appropriate threshold for array clean-ing schedules, informing O&M activi-ties and aiding in tuning operational expenditure budgets.
In the case of a reference module, field performance can help to assess
Reference cellsApplications for reference cellsReference cell data collected through solar monitoring are used to charac-terise site-specific PV performance and loss factors for proposed and operational projects. These data are obtained by measuring the reference cell’s electrical current output from the voltage drop across a supplier-provided resistor [1]. Reference data may be employed in the following ways: 1) pre-construction energy simulation models; 2) incorporating into short-term energy forecasting models; and/or 3) use as a benchmark to help identify underperforming components in an operating PV array.
Reference cells are inferior indica-tors of irradiance, and their function is different from that of pyranometers. Designed for the specific purpose of resource measurement, pyranometers are less impacted by temperature and have a much broader spectral response than reference cells, as shown in Fig. 8. Pyranometers also accept irradi-ance across a wider range of incidence angles than reference modules, which are limited to approximately 80°[1]. In contrast, reference cells highlight the performance of PV materials in the site environment.
Most state-of-the-art solar monitor-ing systems therefore feature both pyranometers and reference cells to accurately capture the solar resource and PV performance respectively. Used in combination with pyranometer measurements, reference cell data can
“Reference cell data are used to characterise site-specific PV performance and loss factors for proposed and operational projects”
Cred
it: L
arry
Cox
. Cr
edit:
Bre
nda
Cody
.
Source: NREL.
Figure 8. Spectral response of a pyranometer compared with various PV materials.
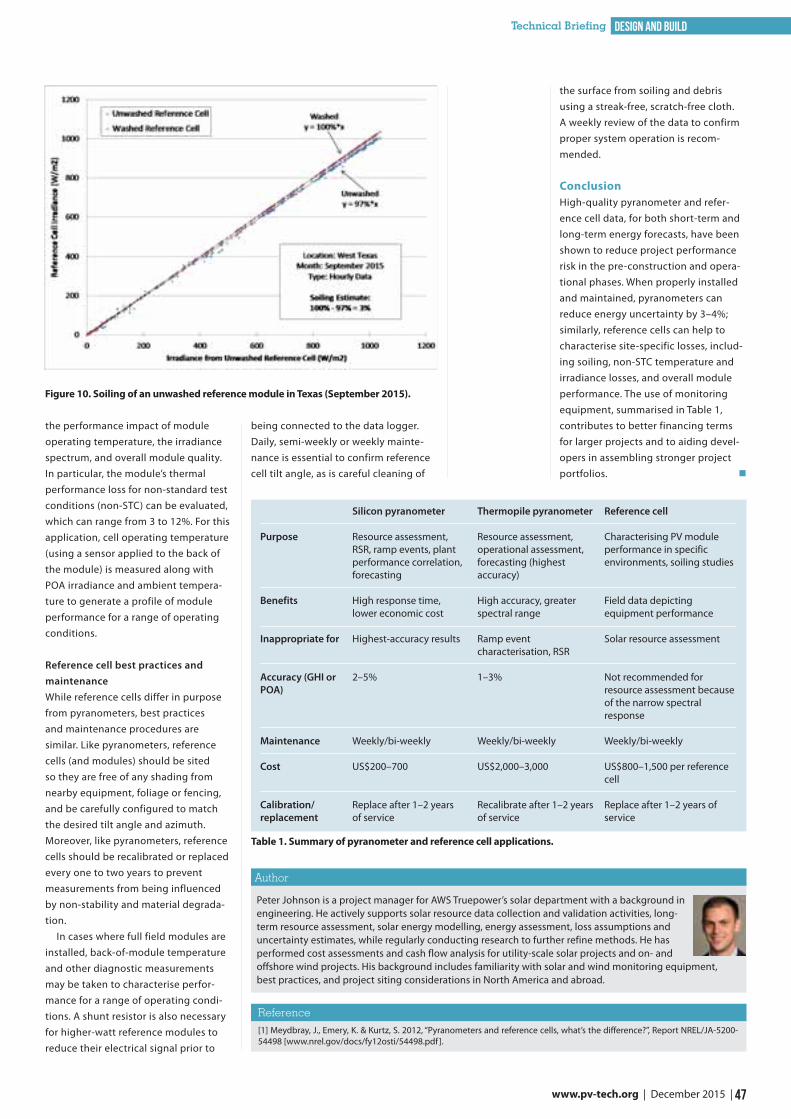
47 www.pv-tech.org | December 2015 |
Design and Build Technical Briefing
Peter Johnson is a project manager for AWS Truepower’s solar department with a background in engineering. He actively supports solar resource data collection and validation activities, long-term resource assessment, solar energy modelling, energy assessment, loss assumptions and uncertainty estimates, while regularly conducting research to further refine methods. He has performed cost assessments and cash flow analysis for utility-scale solar projects and on- and offshore wind projects. His background includes familiarity with solar and wind monitoring equipment, best practices, and project siting considerations in North America and abroad.
Author
[1] Meydbray, J., Emery, K. & Kurtz, S. 2012, “Pyranometers and reference cells, what’s the difference?”, Report NREL/JA-5200-54498 [www.nrel.gov/docs/fy12osti/54498.pdf].
Reference
Purpose
Benefits
Inappropriate for
Accuracy (GHI or POA)
Maintenance
Cost
Calibration/replacement
Silicon pyranometer
Resource assessment, RSR, ramp events, plant performance correlation, forecasting
High response time, lower economic cost
Highest-accuracy results
2–5%
Weekly/bi-weekly
US$200–700
Replace after 1–2 years of service
Thermopile pyranometer
Resource assessment, operational assessment, forecasting (highest accuracy)
High accuracy, greater spectral range
Ramp event characterisation, RSR
1–3%
Weekly/bi-weekly
US$2,000–3,000
Recalibrate after 1–2 years of service
Reference cell
Characterising PV module performance in specific environments, soiling studies
Field data depicting equipment performance
Solar resource assessment
Not recommended for resource assessment because of the narrow spectral response
Weekly/bi-weekly
US$800–1,500 per reference cell
Replace after 1–2 years of service
Table 1. Summary of pyranometer and reference cell applications.
Figure 10. Soiling of an unwashed reference module in Texas (September 2015).
the performance impact of module operating temperature, the irradiance spectrum, and overall module quality. In particular, the module’s thermal performance loss for non-standard test conditions (non-STC) can be evaluated, which can range from 3 to 12%. For this application, cell operating temperature (using a sensor applied to the back of the module) is measured along with POA irradiance and ambient tempera-ture to generate a profile of module performance for a range of operating conditions.
Reference cell best practices and maintenanceWhile reference cells differ in purpose from pyranometers, best practices and maintenance procedures are similar. Like pyranometers, reference cells (and modules) should be sited so they are free of any shading from nearby equipment, foliage or fencing, and be carefully configured to match the desired tilt angle and azimuth. Moreover, like pyranometers, reference cells should be recalibrated or replaced every one to two years to prevent measurements from being influenced by non-stability and material degrada-tion.
In cases where full field modules are installed, back-of-module temperature and other diagnostic measurements may be taken to characterise perfor-mance for a range of operating condi-tions. A shunt resistor is also necessary for higher-watt reference modules to reduce their electrical signal prior to
being connected to the data logger. Daily, semi-weekly or weekly mainte-nance is essential to confirm reference cell tilt angle, as is careful cleaning of
the surface from soiling and debris using a streak-free, scratch-free cloth. A weekly review of the data to confirm proper system operation is recom-mended.
ConclusionHigh-quality pyranometer and refer-ence cell data, for both short-term and long-term energy forecasts, have been shown to reduce project performance risk in the pre-construction and opera-tional phases. When properly installed and maintained, pyranometers can reduce energy uncertainty by 3–4%; similarly, reference cells can help to characterise site-specific losses, includ-ing soiling, non-STC temperature and irradiance losses, and overall module performance. The use of monitoring equipment, summarised in Table 1, contributes to better financing terms for larger projects and to aiding devel-opers in assembling stronger project portfolios.
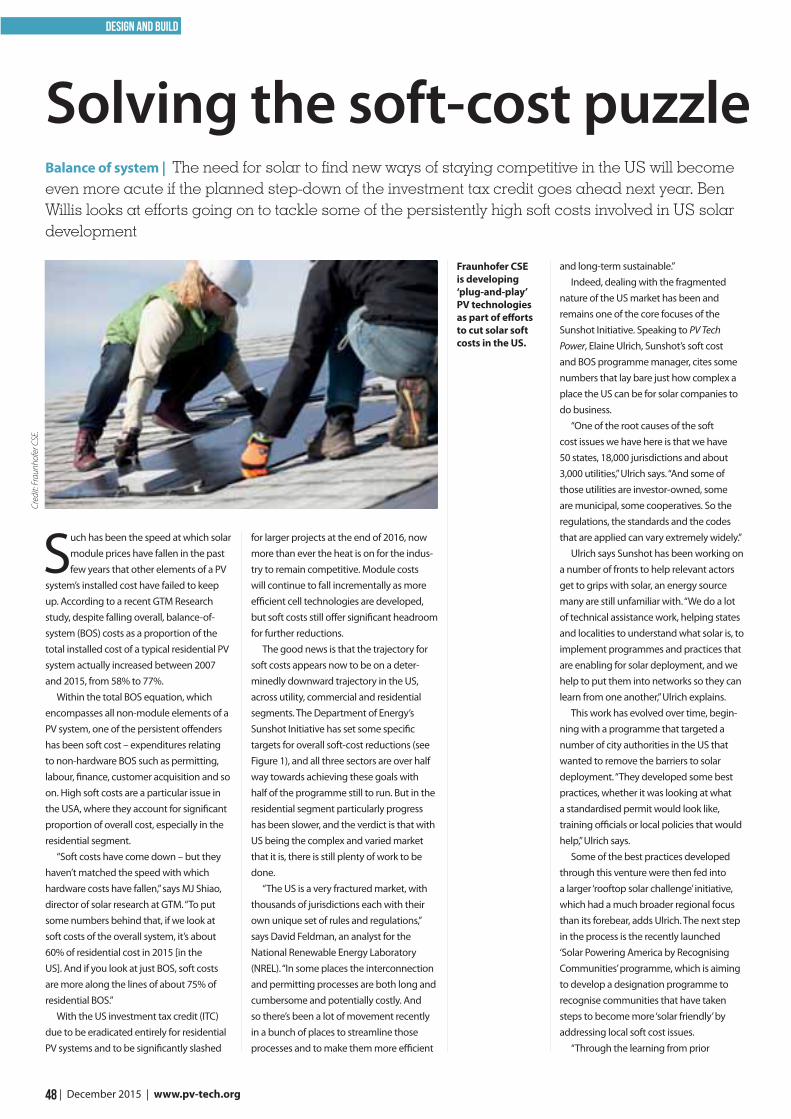
48 | December 2015 | www.pv-tech.org
Design and Build
Such has been the speed at which solar module prices have fallen in the past few years that other elements of a PV
system’s installed cost have failed to keep up. According to a recent GTM Research study, despite falling overall, balance-of-system (BOS) costs as a proportion of the total installed cost of a typical residential PV system actually increased between 2007 and 2015, from 58% to 77%.
Within the total BOS equation, which encompasses all non-module elements of a PV system, one of the persistent offenders has been soft cost – expenditures relating to non-hardware BOS such as permitting, labour, finance, customer acquisition and so on. High soft costs are a particular issue in the USA, where they account for significant proportion of overall cost, especially in the residential segment.
“Soft costs have come down – but they haven’t matched the speed with which hardware costs have fallen,” says MJ Shiao, director of solar research at GTM. “To put some numbers behind that, if we look at soft costs of the overall system, it’s about 60% of residential cost in 2015 [in the US]. And if you look at just BOS, soft costs are more along the lines of about 75% of residential BOS.”
With the US investment tax credit (ITC) due to be eradicated entirely for residential PV systems and to be significantly slashed
for larger projects at the end of 2016, now more than ever the heat is on for the indus-try to remain competitive. Module costs will continue to fall incrementally as more efficient cell technologies are developed, but soft costs still offer significant headroom for further reductions.
The good news is that the trajectory for soft costs appears now to be on a deter-minedly downward trajectory in the US, across utility, commercial and residential segments. The Department of Energy’s Sunshot Initiative has set some specific targets for overall soft-cost reductions (see Figure 1), and all three sectors are over half way towards achieving these goals with half of the programme still to run. But in the residential segment particularly progress has been slower, and the verdict is that with US being the complex and varied market that it is, there is still plenty of work to be done.
“The US is a very fractured market, with thousands of jurisdictions each with their own unique set of rules and regulations,” says David Feldman, an analyst for the National Renewable Energy Laboratory (NREL). “In some places the interconnection and permitting processes are both long and cumbersome and potentially costly. And so there’s been a lot of movement recently in a bunch of places to streamline those processes and to make them more efficient
and long-term sustainable.” Indeed, dealing with the fragmented
nature of the US market has been and remains one of the core focuses of the Sunshot Initiative. Speaking to PV Tech Power, Elaine Ulrich, Sunshot’s soft cost and BOS programme manager, cites some numbers that lay bare just how complex a place the US can be for solar companies to do business.
“One of the root causes of the soft cost issues we have here is that we have 50 states, 18,000 jurisdictions and about 3,000 utilities,” Ulrich says. “And some of those utilities are investor-owned, some are municipal, some cooperatives. So the regulations, the standards and the codes that are applied can vary extremely widely.”
Ulrich says Sunshot has been working on a number of fronts to help relevant actors get to grips with solar, an energy source many are still unfamiliar with. “We do a lot of technical assistance work, helping states and localities to understand what solar is, to implement programmes and practices that are enabling for solar deployment, and we help to put them into networks so they can learn from one another,” Ulrich explains.
This work has evolved over time, begin-ning with a programme that targeted a number of city authorities in the US that wanted to remove the barriers to solar deployment. “They developed some best practices, whether it was looking at what a standardised permit would look like, training officials or local policies that would help,” Ulrich says.
Some of the best practices developed through this venture were then fed into a larger ‘rooftop solar challenge’ initiative, which had a much broader regional focus than its forebear, adds Ulrich. The next step in the process is the recently launched ‘Solar Powering America by Recognising Communities’ programme, which is aiming to develop a designation programme to recognise communities that have taken steps to become more ‘solar friendly’ by addressing local soft cost issues.
“Through the learning from prior
Balance of system | The need for solar to find new ways of staying competitive in the US will become even more acute if the planned step-down of the investment tax credit goes ahead next year. Ben Willis looks at efforts going on to tackle some of the persistently high soft costs involved in US solar development
Solving the soft-cost puzzle
Fraunhofer CSE is developing ‘plug-and-play’ PV technologies as part of efforts to cut solar soft costs in the US.
Cred
it: F
raun
hofe
r CSE
.Design and Build
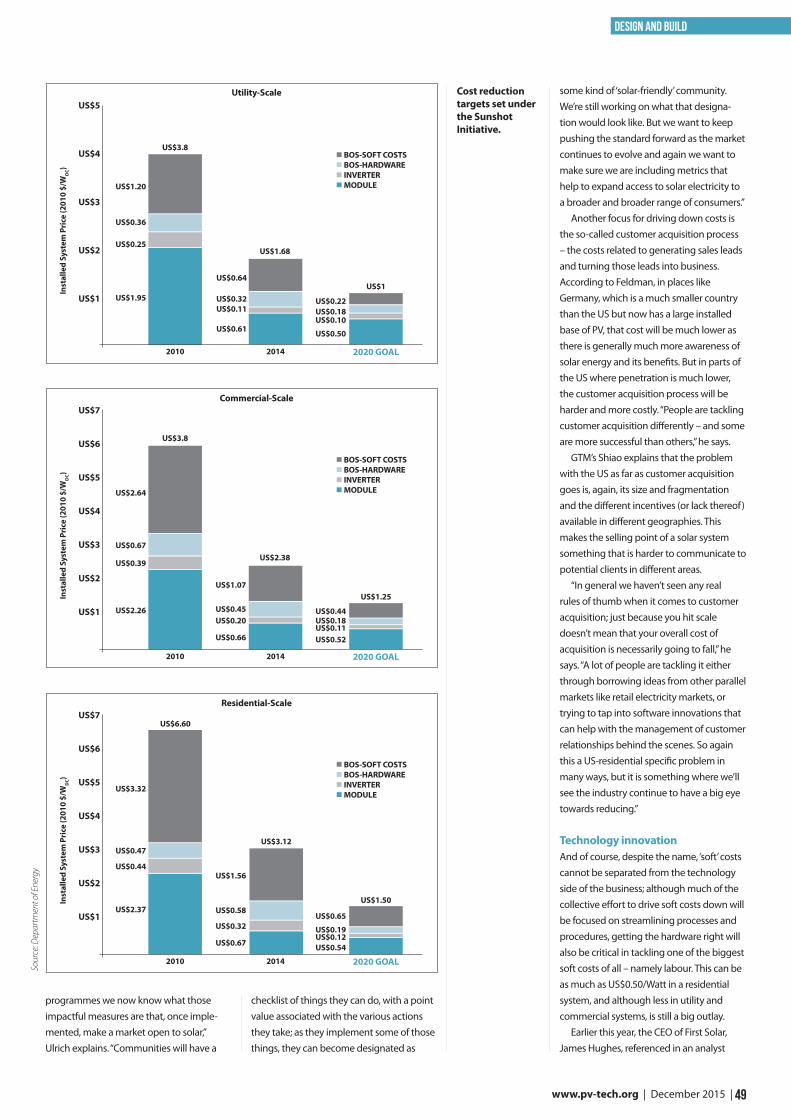
49 www.pv-tech.org | December 2015 |
Design and Build
programmes we now know what those impactful measures are that, once imple-mented, make a market open to solar,” Ulrich explains. “Communities will have a
checklist of things they can do, with a point value associated with the various actions they take; as they implement some of those things, they can become designated as
some kind of ‘solar-friendly’ community. We’re still working on what that designa-tion would look like. But we want to keep pushing the standard forward as the market continues to evolve and again we want to make sure we are including metrics that help to expand access to solar electricity to a broader and broader range of consumers.”
Another focus for driving down costs is the so-called customer acquisition process – the costs related to generating sales leads and turning those leads into business. According to Feldman, in places like Germany, which is a much smaller country than the US but now has a large installed base of PV, that cost will be much lower as there is generally much more awareness of solar energy and its benefits. But in parts of the US where penetration is much lower, the customer acquisition process will be harder and more costly. “People are tackling customer acquisition differently – and some are more successful than others,” he says.
GTM’s Shiao explains that the problem with the US as far as customer acquisition goes is, again, its size and fragmentation and the different incentives (or lack thereof) available in different geographies. This makes the selling point of a solar system something that is harder to communicate to potential clients in different areas.
“In general we haven’t seen any real rules of thumb when it comes to customer acquisition; just because you hit scale doesn’t mean that your overall cost of acquisition is necessarily going to fall,” he says. “A lot of people are tackling it either through borrowing ideas from other parallel markets like retail electricity markets, or trying to tap into software innovations that can help with the management of customer relationships behind the scenes. So again this a US-residential specific problem in many ways, but it is something where we’ll see the industry continue to have a big eye towards reducing.”
Technology innovationAnd of course, despite the name, ‘soft’ costs cannot be separated from the technology side of the business; although much of the collective effort to drive soft costs down will be focused on streamlining processes and procedures, getting the hardware right will also be critical in tackling one of the biggest soft costs of all – namely labour. This can be as much as US$0.50/Watt in a residential system, and although less in utility and commercial systems, is still a big outlay.
Earlier this year, the CEO of First Solar, James Hughes, referenced in an analyst
US$3.8
2010
Inst
alle
d Sy
stem
Pri
ce (2
010
$/W
DC)
Utility-Scale
BOS-SOFT COSTS BOS-HARDWARE INVERTER MODULE
2014 2020 GOAL
US$5
US$4
US$3
US$2
US$1
US$1.20
US$0.36
US$0.25
US$1.95
US$0.64
US$0.32US$0.11
US$0.61
US$0.22US$0.18US$0.10
US$0.50
US$1.68
US$1
US$6.60
2010
Inst
alle
d Sy
stem
Pri
ce (2
010
$/W
DC)
Residential-Scale
BOS-SOFT COSTS BOS-HARDWARE INVERTER MODULE
2014 2020 GOAL
US$7
US$6
US$5
US$4
US$3
US$2
US$1
US$3.32
US$0.47
US$0.44
US$2.37
US$1.56
US$0.58
US$0.32
US$0.67
US$0.65
US$0.19US$0.12US$0.54
US$3.12
US$1.50
US$3.8
2010
Inst
alle
d Sy
stem
Pri
ce (2
010
$/W
DC)
Commercial-Scale
BOS-SOFT COSTS BOS-HARDWARE INVERTER MODULE
2014 2020 GOAL
US$7
US$6
US$5
US$4
US$3
US$2
US$1
US$2.64
US$0.67
US$0.39
US$2.26
US$1.07
US$0.45US$0.20
US$0.66
US$0.44US$0.18US$0.11US$0.52
US$2.38
US$1.25
Cost reduction targets set under the Sunshot Initiative.
Sour
ce: D
epar
tmen
t of E
nerg
y
call how his company was changing the “means and methods” involved in constructing a PV power plant to reduce the number of actions and amount of time it takes to install. Clearly First Solar’s emphasis is on utility-scale projects, where arguably the most work has already been done to stream-line plant design and construction process, but the same point applies to commercial and residential installations.
Shiao says this principle explains the growing popularity of three-phase string inverters. “If you design a system for a rooftop, and then get to the roof and you look at it again and realise you have made a big mistake, you have to redesign the system. With a string inverter you can pull off 30kW or add 30kW, whatever the string inverter unit is, and you might be fine – versus a central inverter where you have to maybe completely redesign the system. So those little things just add up and are part of the soft-cost reduction package,” he says.
Looking ahead, Shiao identifies racking as one area where there is still an opportunity to reduce the amount of labour involved. “A lot of people don’t view racking as particularly sexy, but it is one of the most time-consuming activities – thinking about how to get racking to the roof, getting it in place and what sort of activity is needed to secure the module,” Shiao says.
“We’re seeing a lot of innovation. When we talk about rooftop systems we’re almost entirely talking about these modular systems now – where you’re not setting up these long rails or these long units on the roof because it’s faster. Then thinking about the attachment method of how you secure the panel to the racking system itself, folks have moved to a one-tool system or even a click-in system, where you don’t need a tool to put it together. Those are seemingly small things, but when you’re talking about a field of thousands of modules, that time really does add up.”
It will be through technical innovation such as this, and the ongoing efforts to educate and support the various actors who could be a help rather than hindrance to solar, that the objectives of the Sunshot programme will be achieved and soft costs driven down. Overall GTM in its recent BOS analysis predicted only a small fall in the overall proportion of system costs represent-ed by soft costs between now and 2020. But even that small percentage drop could represent a potentially significant contribution towards solar’s overall cost competitiveness and ability to keep on growing.
“In general as an overall proportion of system costs we don’t see [soft costs] changing all that much,” Shiao says. “Right now it’s about 60%, we think it will move to about 56-57% by 2020 for US residential. But those cost reductions are necessary – what it means is there are cost reductions across the board. We have to continue to reduce aggressively soft costs at least in line with hardware cost reductions in order to grow the industry.”
@solar_intel
www.facebook.com/solarintelligence
@SolarPowerPort
www.facebook.com/pages/Solar-Power-Portal-UK
Solar Power Portal
@_SolarEnergy
www.facebook.com/SolarEnergyUKEvents
Solar Energy UKSolar Energy Events
www.youtube.com/user/SolarEnergyEvents
@CleanEnergyLive
@NextEnergyNews
@pv_tech_storage
PV Tech Storage
Follow us across Social Media!
@pv_tech
www.facebook.com/pages/PV-Tech
www.youtube.com/user/photovoltaicsint
Photovoltaics International/PV-Tech.org
‘Plug-and-play’ technology Fraunhofer CSE, the US arm of the German research body, received a Sunshot grant to develop easy-to-install rooftop PV systems aimed at cutting labour time. CSE’s system incorporates new technologies such as lightweight modules and simplified mounting and wiring and measures to simplify the interconnection, permitting and inspection processes.
Automated permitting US installer Sunrun and Clean Power Research are trialling a new software platform that automates the solar permitting and interconnection process. The many thousands of separate jurisdictions handling this process across the US mean a patchwork of different rules and regulations, adding up to four weeks to average permitting times, according to Sunrun. The system is aiming to cut this time in half.
‘Race to 7-Day Solar’ This Sunshot programme is awarding up to US$10 million for the best new methods for bringing down the permit to plug-in time for solar systems to seven days for ≤100kW systems and seven weeks for ≤1MW systems. Twenty teams are involved in the programme, which kicked off in September 2015 and will run for 18 months.
Innovations driving down solar soft costs
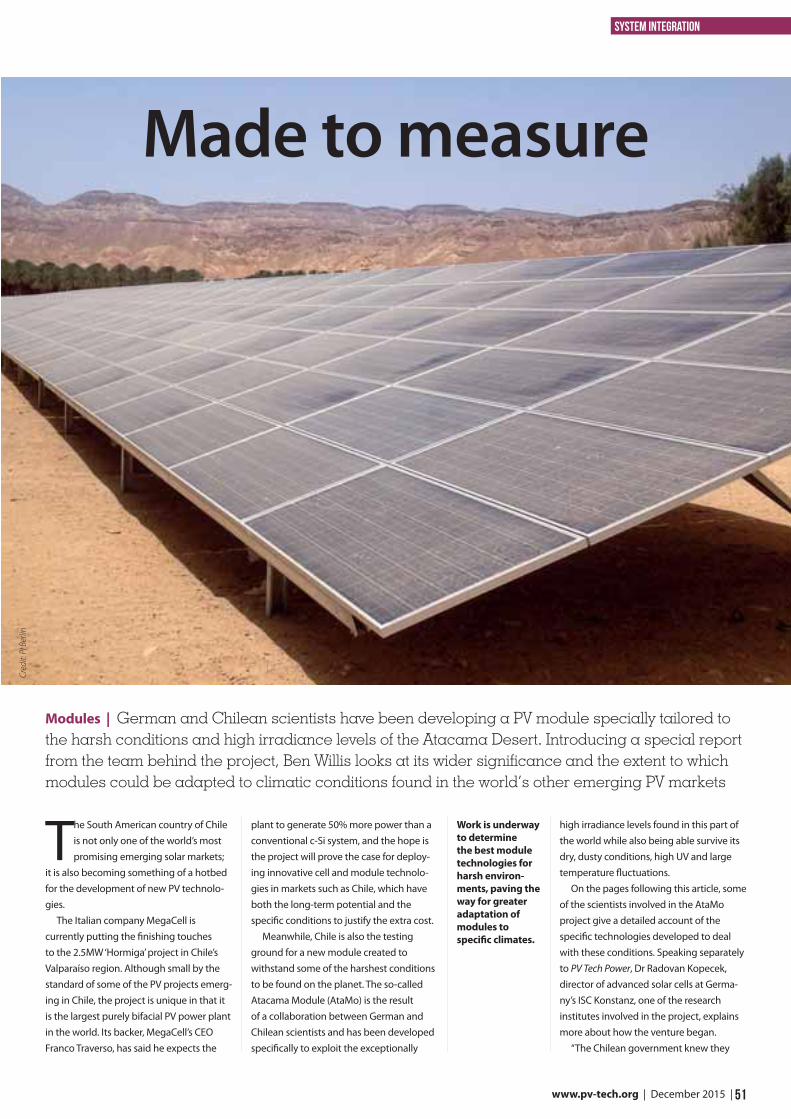
51 www.pv-tech.org | December 2015 |
system integration
The South American country of Chile is not only one of the world’s most promising emerging solar markets;
it is also becoming something of a hotbed for the development of new PV technolo-gies.
The Italian company MegaCell is currently putting the finishing touches to the 2.5MW ‘Hormiga’ project in Chile’s Valparaíso region. Although small by the standard of some of the PV projects emerg-ing in Chile, the project is unique in that it is the largest purely bifacial PV power plant in the world. Its backer, MegaCell’s CEO Franco Traverso, has said he expects the
plant to generate 50% more power than a conventional c-Si system, and the hope is the project will prove the case for deploy-ing innovative cell and module technolo-gies in markets such as Chile, which have both the long-term potential and the specific conditions to justify the extra cost.
Meanwhile, Chile is also the testing ground for a new module created to withstand some of the harshest conditions to be found on the planet. The so-called Atacama Module (AtaMo) is the result of a collaboration between German and Chilean scientists and has been developed specifically to exploit the exceptionally
high irradiance levels found in this part of the world while also being able survive its dry, dusty conditions, high UV and large temperature fluctuations.
On the pages following this article, some of the scientists involved in the AtaMo project give a detailed account of the specific technologies developed to deal with these conditions. Speaking separately to PV Tech Power, Dr Radovan Kopecek, director of advanced solar cells at Germa-ny’s ISC Konstanz, one of the research institutes involved in the project, explains more about how the venture began.
“The Chilean government knew they
Modules | German and Chilean scientists have been developing a PV module specially tailored to the harsh conditions and high irradiance levels of the Atacama Desert. Introducing a special report from the team behind the project, Ben Willis looks at its wider significance and the extent to which modules could be adapted to climatic conditions found in the world’s other emerging PV markets
Made to measure
Work is underway to determine the best module technologies for harsh environ-ments, paving the way for greater adaptation of modules to specific climates.
Cred
it: P
I Ber
lin
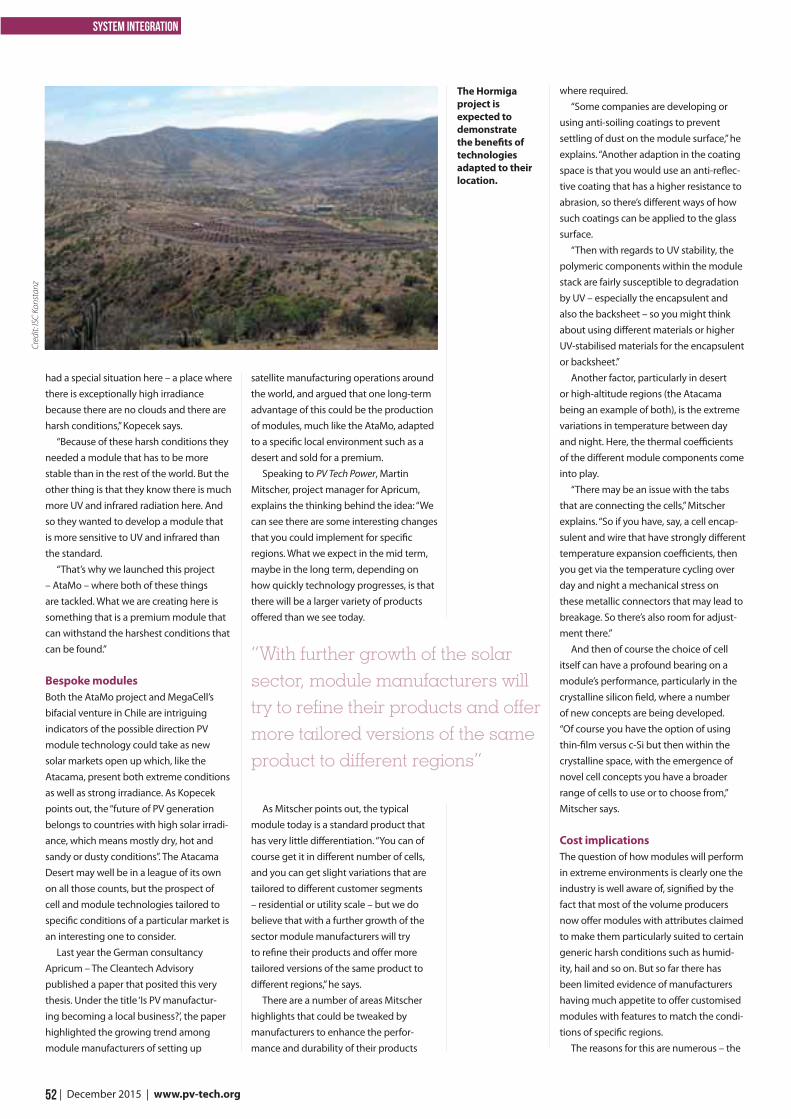
52 | December 2015 | www.pv-tech.org
system integration
had a special situation here – a place where there is exceptionally high irradiance because there are no clouds and there are harsh conditions,” Kopecek says.
“Because of these harsh conditions they needed a module that has to be more stable than in the rest of the world. But the other thing is that they know there is much more UV and infrared radiation here. And so they wanted to develop a module that is more sensitive to UV and infrared than the standard.
“That’s why we launched this project – AtaMo – where both of these things are tackled. What we are creating here is something that is a premium module that can withstand the harshest conditions that can be found.”
Bespoke modulesBoth the AtaMo project and MegaCell’s bifacial venture in Chile are intriguing indicators of the possible direction PV module technology could take as new solar markets open up which, like the Atacama, present both extreme conditions as well as strong irradiance. As Kopecek points out, the “future of PV generation belongs to countries with high solar irradi-ance, which means mostly dry, hot and sandy or dusty conditions”. The Atacama Desert may well be in a league of its own on all those counts, but the prospect of cell and module technologies tailored to specific conditions of a particular market is an interesting one to consider.
Last year the German consultancy Apricum – The Cleantech Advisory published a paper that posited this very thesis. Under the title ‘Is PV manufactur-ing becoming a local business?’, the paper highlighted the growing trend among module manufacturers of setting up
satellite manufacturing operations around the world, and argued that one long-term advantage of this could be the production of modules, much like the AtaMo, adapted to a specific local environment such as a desert and sold for a premium.
Speaking to PV Tech Power, Martin Mitscher, project manager for Apricum, explains the thinking behind the idea: “We can see there are some interesting changes that you could implement for specific regions. What we expect in the mid term, maybe in the long term, depending on how quickly technology progresses, is that there will be a larger variety of products offered than we see today.
As Mitscher points out, the typical module today is a standard product that has very little differentiation. “You can of course get it in different number of cells, and you can get slight variations that are tailored to different customer segments – residential or utility scale – but we do believe that with a further growth of the sector module manufacturers will try to refine their products and offer more tailored versions of the same product to different regions,” he says.
There are a number of areas Mitscher highlights that could be tweaked by manufacturers to enhance the perfor-mance and durability of their products
where required. “Some companies are developing or
using anti-soiling coatings to prevent settling of dust on the module surface,” he explains. “Another adaption in the coating space is that you would use an anti-reflec-tive coating that has a higher resistance to abrasion, so there’s different ways of how such coatings can be applied to the glass surface.
“Then with regards to UV stability, the polymeric components within the module stack are fairly susceptible to degradation by UV – especially the encapsulent and also the backsheet – so you might think about using different materials or higher UV-stabilised materials for the encapsulent or backsheet.”
Another factor, particularly in desert or high-altitude regions (the Atacama being an example of both), is the extreme variations in temperature between day and night. Here, the thermal coefficients of the different module components come into play.
“There may be an issue with the tabs that are connecting the cells,” Mitscher explains. “So if you have, say, a cell encap-sulent and wire that have strongly different temperature expansion coefficients, then you get via the temperature cycling over day and night a mechanical stress on these metallic connectors that may lead to breakage. So there’s also room for adjust-ment there.”
And then of course the choice of cell itself can have a profound bearing on a module’s performance, particularly in the crystalline silicon field, where a number of new concepts are being developed. “Of course you have the option of using thin-film versus c-Si but then within the crystalline space, with the emergence of novel cell concepts you have a broader range of cells to use or to choose from,” Mitscher says.
Cost implicationsThe question of how modules will perform in extreme environments is clearly one the industry is well aware of, signified by the fact that most of the volume producers now offer modules with attributes claimed to make them particularly suited to certain generic harsh conditions such as humid-ity, hail and so on. But so far there has been limited evidence of manufacturers having much appetite to offer customised modules with features to match the condi-tions of specific regions.
The reasons for this are numerous – the
“With further growth of the solar sector, module manufacturers will try to refine their products and offer more tailored versions of the same product to different regions”
The Hormiga project is expected to demonstrate the benefits of technologies adapted to their location.
Cred
it: IS
C Ko
nsta
nz

#sorwa16
19 - 20 April 2016Accra, Ghana
Benefi ts of attending:
• Discover strategic business opportunities in the region
• Network with international and local key industry players including fi nanciers, project developers, government, end users and manufacturers
• Hear policy and regulation updates from government offi cials
• Attend interactive sessions and learn from innovative case studies
• Learn about energy user’s concerns at our bespoke end users’ sessions
westafrica.solarenergyevents.com
Wisdom Ahiataku-Togobo, Director of Renewable EnergyMinistry of Energy Ghana
Dr. Ifeabunike Joseph Dioha Ag. Director, Renewable Energy, Nigerian Energy Commission
Joel Abrams, Managing Director, Nigeria Solar Capital Partners
Oliver AndrewsCIOAFC
Christopher J. Massaro, Senior Vice President, MAECI
Over 50 speakers confi rmed including:
Exclusive to PV Tech Power Readers. Offer ends 31/12/2015
SPONSORS Supporting sponsors:Silver sponsor:Gold sponsors:
For all enquiries contact [email protected]
Use Discount Code
‘PVTP15’ for a
15% discount *
Secure clean & reliable energy for West African consumers and businesses
Senegal: Tenergie and Greenwish Partners will present their 50MW and 20MW respective projects
Nigeria: Gigawatt Global and NSCP will elaborate on their 125MW project and the barriers to reaching fi nancial closure
Burkina Faso: Windiga will explain the realities of developing a 20MW project amidst political uncertainty
Ghana: First Solar and Windiga will talk us through their Ghana project and issues relating to grid connection and land acquisition
Equatorial Guinea: See Maeci talk about their development and construction of a 5MW island mini grid
Hear from projects in:
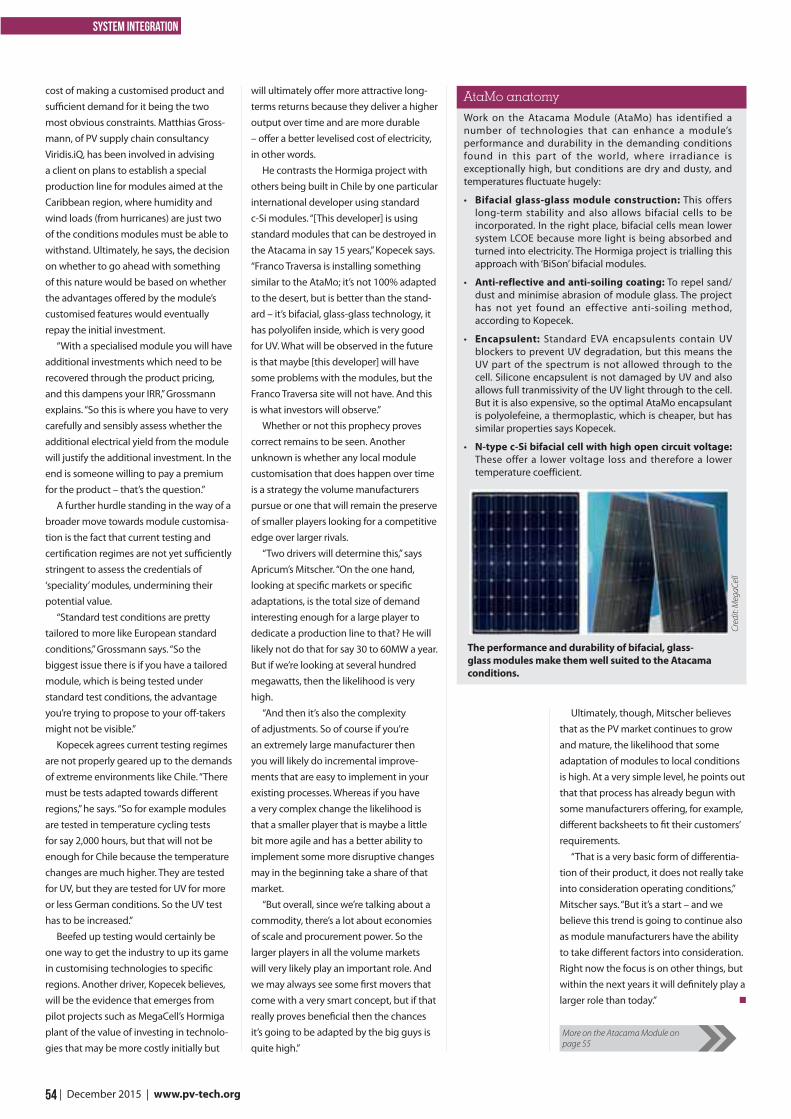
54 | December 2015 | www.pv-tech.org
system integration
cost of making a customised product and suffi cient demand for it being the two most obvious constraints. Matthias Gross-mann, of PV supply chain consultancy Viridis.iQ, has been involved in advising a client on plans to establish a special production line for modules aimed at the Caribbean region, where humidity and wind loads (from hurricanes) are just two of the conditions modules must be able to withstand. Ultimately, he says, the decision on whether to go ahead with something of this nature would be based on whether the advantages off ered by the module’s customised features would eventually repay the initial investment.
“With a specialised module you will have additional investments which need to be recovered through the product pricing, and this dampens your IRR,” Grossmann explains. “So this is where you have to very carefully and sensibly assess whether the additional electrical yield from the module will justify the additional investment. In the end is someone willing to pay a premium for the product – that’s the question.”
A further hurdle standing in the way of a broader move towards module customisa-tion is the fact that current testing and certifi cation regimes are not yet suffi ciently stringent to assess the credentials of ‘speciality’ modules, undermining their potential value.
“Standard test conditions are pretty tailored to more like European standard conditions,” Grossmann says. “So the biggest issue there is if you have a tailored module, which is being tested under standard test conditions, the advantage you’re trying to propose to your off -takers might not be visible.”
Kopecek agrees current testing regimes are not properly geared up to the demands of extreme environments like Chile. “There must be tests adapted towards diff erent regions,” he says. “So for example modules are tested in temperature cycling tests for say 2,000 hours, but that will not be enough for Chile because the temperature changes are much higher. They are tested for UV, but they are tested for UV for more or less German conditions. So the UV test has to be increased.”
Beefed up testing would certainly be one way to get the industry to up its game in customising technologies to specifi c regions. Another driver, Kopecek believes, will be the evidence that emerges from pilot projects such as MegaCell’s Hormiga plant of the value of investing in technolo-gies that may be more costly initially but
will ultimately off er more attractive long-terms returns because they deliver a higher output over time and are more durable – off er a better levelised cost of electricity, in other words.
He contrasts the Hormiga project with others being built in Chile by one particular international developer using standard c-Si modules. “[This developer] is using standard modules that can be destroyed in the Atacama in say 15 years,” Kopecek says. “Franco Traversa is installing something similar to the AtaMo; it’s not 100% adapted to the desert, but is better than the stand-ard – it’s bifacial, glass-glass technology, it has polyolifen inside, which is very good for UV. What will be observed in the future is that maybe [this developer] will have some problems with the modules, but the Franco Traversa site will not have. And this is what investors will observe.”
Whether or not this prophecy proves correct remains to be seen. Another unknown is whether any local module customisation that does happen over time is a strategy the volume manufacturers pursue or one that will remain the preserve of smaller players looking for a competitive edge over larger rivals.
“Two drivers will determine this,” says Apricum’s Mitscher. “On the one hand, looking at specifi c markets or specifi c adaptations, is the total size of demand interesting enough for a large player to dedicate a production line to that? He will likely not do that for say 30 to 60MW a year. But if we’re looking at several hundred megawatts, then the likelihood is very high.
“And then it’s also the complexity of adjustments. So of course if you’re an extremely large manufacturer then you will likely do incremental improve-ments that are easy to implement in your existing processes. Whereas if you have a very complex change the likelihood is that a smaller player that is maybe a little bit more agile and has a better ability to implement some more disruptive changes may in the beginning take a share of that market.
“But overall, since we’re talking about a commodity, there’s a lot about economies of scale and procurement power. So the larger players in all the volume markets will very likely play an important role. And we may always see some fi rst movers that come with a very smart concept, but if that really proves benefi cial then the chances it’s going to be adapted by the big guys is quite high.”
Ultimately, though, Mitscher believes that as the PV market continues to grow and mature, the likelihood that some adaptation of modules to local conditions is high. At a very simple level, he points out that that process has already begun with some manufacturers off ering, for example, diff erent backsheets to fi t their customers’ requirements.
“That is a very basic form of diff erentia-tion of their product, it does not really take into consideration operating conditions,” Mitscher says. “But it’s a start – and we believe this trend is going to continue also as module manufacturers have the ability to take diff erent factors into consideration. Right now the focus is on other things, but within the next years it will defi nitely play a larger role than today.”
Work on the Atacama Module (AtaMo) has identified a number of technologies that can enhance a module’s performance and durability in the demanding conditions found in this part of the world, where irradiance is exceptionally high, but conditions are dry and dusty, and temperatures fluctuate hugely:
• Bifacial glass-glass module construction: This offers long-term stability and also allows bifacial cells to be incorporated. In the right place, bifacial cells mean lower system LCOE because more light is being absorbed and turned into electricity. The Hormiga project is trialling this approach with ‘BiSon’ bifacial modules.
• Anti-reflective and anti-soiling coating: To repel sand/dust and minimise abrasion of module glass. The project has not yet found an effective anti-soiling method, according to Kopecek.
• Encapsulent: Standard EVA encapsulents contain UV blockers to prevent UV degradation, but this means the UV part of the spectrum is not allowed through to the cell. Silicone encapsulent is not damaged by UV and also allows full tranmissivity of the UV light through to the cell. But it is also expensive, so the optimal AtaMo encapsulant is polyolefeine, a thermoplastic, which is cheaper, but has similar properties says Kopecek.
• N-type c-Si bifacial cell with high open circuit voltage: These offer a lower voltage loss and therefore a lower temperature coefficient.
AtaMo anatomy
Cred
it: M
egaC
ell
The performance and durability of bifacial, glass-glass modules make them well suited to the Atacama conditions.
More on the Atacama Module on page 55
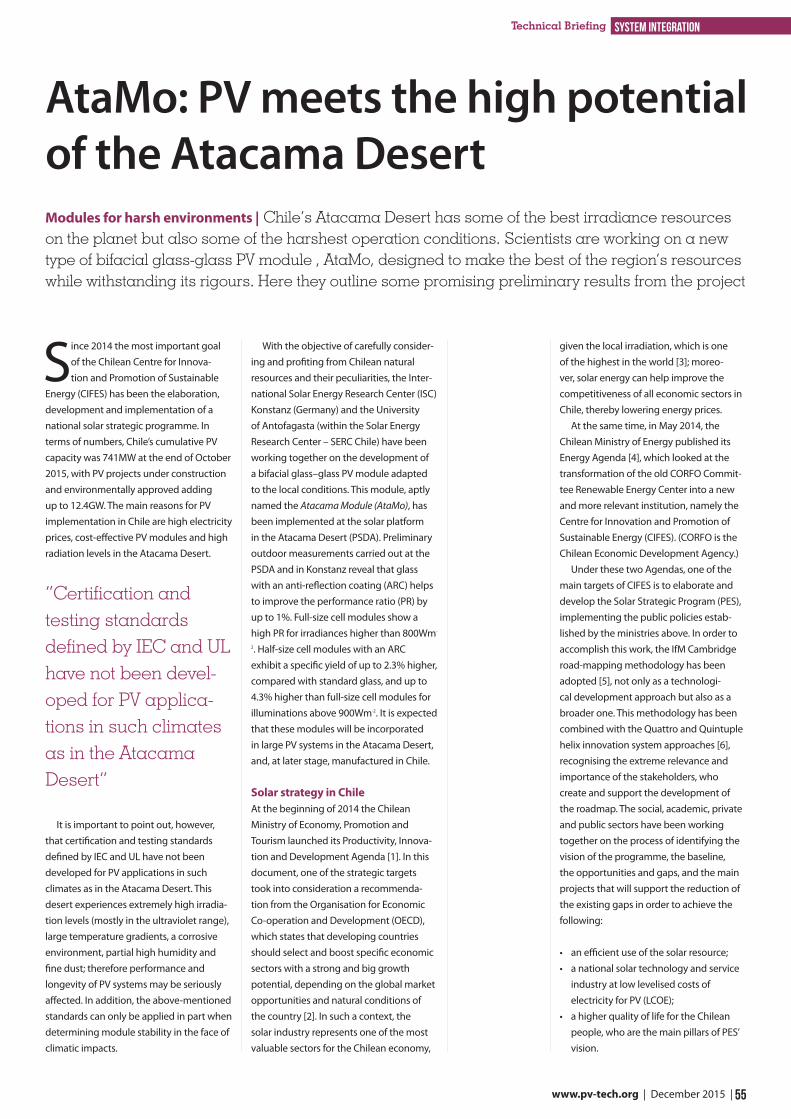
55 www.pv-tech.org | December 2015 |
system integrationTechnical Briefing
Since 2014 the most important goal of the Chilean Centre for Innova-tion and Promotion of Sustainable
Energy (CIFES) has been the elaboration, development and implementation of a national solar strategic programme. In terms of numbers, Chile’s cumulative PV capacity was 741MW at the end of October 2015, with PV projects under construction and environmentally approved adding up to 12.4GW. The main reasons for PV implementation in Chile are high electricity prices, cost-effective PV modules and high radiation levels in the Atacama Desert.
“Certification and testing standards defined by IEC and UL have not been devel-oped for PV applica-tions in such climates as in the Atacama Desert”
It is important to point out, however, that certification and testing standards defined by IEC and UL have not been developed for PV applications in such climates as in the Atacama Desert. This desert experiences extremely high irradia-tion levels (mostly in the ultraviolet range), large temperature gradients, a corrosive environment, partial high humidity and fine dust; therefore performance and longevity of PV systems may be seriously affected. In addition, the above-mentioned standards can only be applied in part when determining module stability in the face of climatic impacts.
With the objective of carefully consider-ing and profiting from Chilean natural resources and their peculiarities, the Inter-national Solar Energy Research Center (ISC) Konstanz (Germany) and the University of Antofagasta (within the Solar Energy Research Center – SERC Chile) have been working together on the development of a bifacial glass–glass PV module adapted to the local conditions. This module, aptly named the Atacama Module (AtaMo), has been implemented at the solar platform in the Atacama Desert (PSDA). Preliminary outdoor measurements carried out at the PSDA and in Konstanz reveal that glass with an anti-reflection coating (ARC) helps to improve the performance ratio (PR) by up to 1%. Full-size cell modules show a high PR for irradiances higher than 800Wm-
2. Half-size cell modules with an ARC exhibit a specific yield of up to 2.3% higher, compared with standard glass, and up to 4.3% higher than full-size cell modules for illuminations above 900Wm-2. It is expected that these modules will be incorporated in large PV systems in the Atacama Desert, and, at later stage, manufactured in Chile.
Solar strategy in ChileAt the beginning of 2014 the Chilean Ministry of Economy, Promotion and Tourism launched its Productivity, Innova-tion and Development Agenda [1]. In this document, one of the strategic targets took into consideration a recommenda-tion from the Organisation for Economic Co-operation and Development (OECD), which states that developing countries should select and boost specific economic sectors with a strong and big growth potential, depending on the global market opportunities and natural conditions of the country [2]. In such a context, the solar industry represents one of the most valuable sectors for the Chilean economy,
given the local irradiation, which is one of the highest in the world [3]; moreo-ver, solar energy can help improve the competitiveness of all economic sectors in Chile, thereby lowering energy prices.
At the same time, in May 2014, the Chilean Ministry of Energy published its Energy Agenda [4], which looked at the transformation of the old CORFO Commit-tee Renewable Energy Center into a new and more relevant institution, namely the Centre for Innovation and Promotion of Sustainable Energy (CIFES). (CORFO is the Chilean Economic Development Agency.)
Under these two Agendas, one of the main targets of CIFES is to elaborate and develop the Solar Strategic Program (PES), implementing the public policies estab-lished by the ministries above. In order to accomplish this work, the IfM Cambridge road-mapping methodology has been adopted [5], not only as a technologi-cal development approach but also as a broader one. This methodology has been combined with the Quattro and Quintuple helix innovation system approaches [6], recognising the extreme relevance and importance of the stakeholders, who create and support the development of the roadmap. The social, academic, private and public sectors have been working together on the process of identifying the vision of the programme, the baseline, the opportunities and gaps, and the main projects that will support the reduction of the existing gaps in order to achieve the following:
• an efficient use of the solar resource;• a national solar technology and service
industry at low levelised costs of electricity for PV (LCOE);
• a higher quality of life for the Chilean people, who are the main pillars of PES’ vision.
Modules for harsh environments | Chile’s Atacama Desert has some of the best irradiance resources on the planet but also some of the harshest operation conditions. Scientists are working on a new type of bifacial glass-glass PV module , AtaMo, designed to make the best of the region’s resources while withstanding its rigours. Here they outline some promising preliminary results from the project
AtaMo: PV meets the high potential of the Atacama Desert
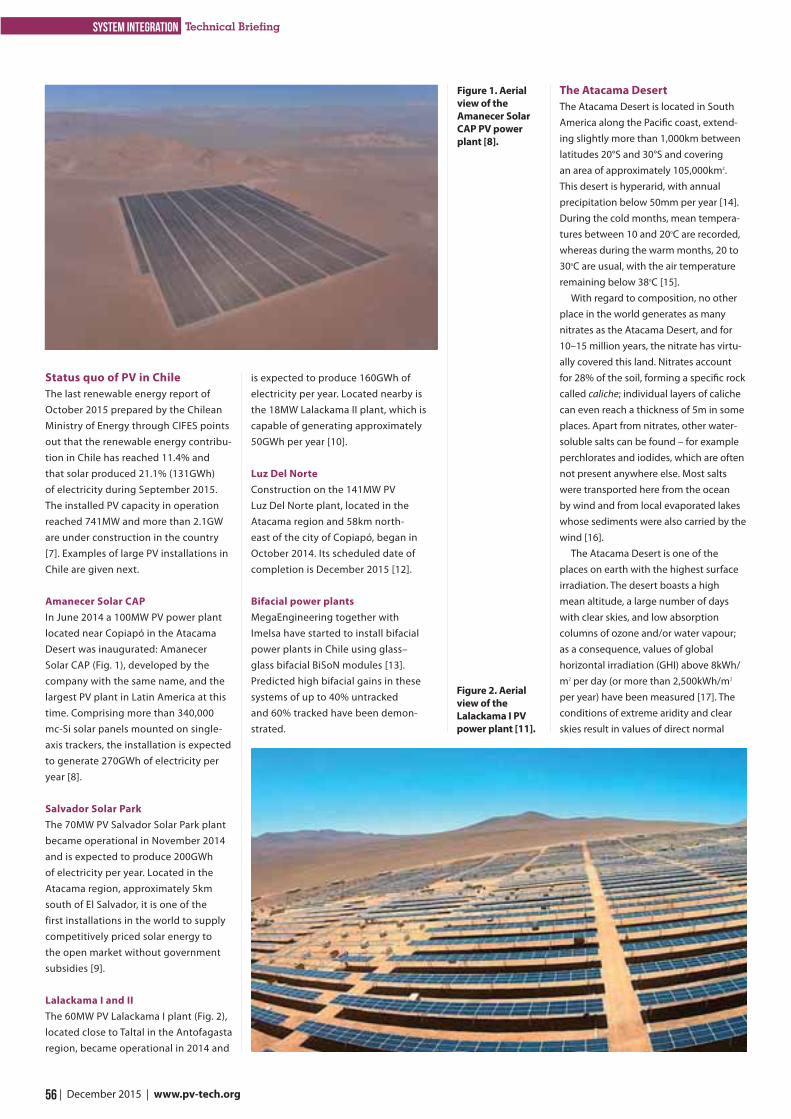
56 | December 2015 | www.pv-tech.org
system integration Technical Briefing
Status quo of PV in ChileThe last renewable energy report of October 2015 prepared by the Chilean Ministry of Energy through CIFES points out that the renewable energy contribu-tion in Chile has reached 11.4% and that solar produced 21.1% (131GWh) of electricity during September 2015. The installed PV capacity in operation reached 741MW and more than 2.1GW are under construction in the country [7]. Examples of large PV installations in Chile are given next.
Amanecer Solar CAPIn June 2014 a 100MW PV power plant located near Copiapó in the Atacama Desert was inaugurated: Amanecer Solar CAP (Fig. 1), developed by the company with the same name, and the largest PV plant in Latin America at this time. Comprising more than 340,000 mc-Si solar panels mounted on single-axis trackers, the installation is expected to generate 270GWh of electricity per year [8].
Salvador Solar ParkThe 70MW PV Salvador Solar Park plant became operational in November 2014 and is expected to produce 200GWh of electricity per year. Located in the Atacama region, approximately 5km south of El Salvador, it is one of the first installations in the world to supply competitively priced solar energy to the open market without government subsidies [9].
Lalackama I and IIThe 60MW PV Lalackama I plant (Fig. 2), located close to Taltal in the Antofagasta region, became operational in 2014 and
is expected to produce 160GWh of electricity per year. Located nearby is the 18MW Lalackama II plant, which is capable of generating approximately 50GWh per year [10].
Luz Del NorteConstruction on the 141MW PV Luz Del Norte plant, located in the Atacama region and 58km north-east of the city of Copiapó, began in October 2014. Its scheduled date of completion is December 2015 [12].
Bifacial power plantsMegaEngineering together with Imelsa have started to install bifacial power plants in Chile using glass–glass bifacial BiSoN modules [13]. Predicted high bifacial gains in these systems of up to 40% untracked and 60% tracked have been demon-strated.
The Atacama DesertThe Atacama Desert is located in South America along the Pacific coast, extend-ing slightly more than 1,000km between latitudes 20°S and 30°S and covering an area of approximately 105,000km2. This desert is hyperarid, with annual precipitation below 50mm per year [14]. During the cold months, mean tempera-tures between 10 and 20oC are recorded, whereas during the warm months, 20 to 30oC are usual, with the air temperature remaining below 38oC [15].
With regard to composition, no other place in the world generates as many nitrates as the Atacama Desert, and for 10–15 million years, the nitrate has virtu-ally covered this land. Nitrates account for 28% of the soil, forming a specific rock called caliche; individual layers of caliche can even reach a thickness of 5m in some places. Apart from nitrates, other water-soluble salts can be found – for example perchlorates and iodides, which are often not present anywhere else. Most salts were transported here from the ocean by wind and from local evaporated lakes whose sediments were also carried by the wind [16].
The Atacama Desert is one of the places on earth with the highest surface irradiation. The desert boasts a high mean altitude, a large number of days with clear skies, and low absorption columns of ozone and/or water vapour; as a consequence, values of global horizontal irradiation (GHI) above 8kWh/m2 per day (or more than 2,500kWh/m2 per year) have been measured [17]. The conditions of extreme aridity and clear skies result in values of direct normal
Figure 1. Aerial view of the Amanecer Solar CAP PV power plant [8].
Figure 2. Aerial view of the Lalackama I PV power plant [11].
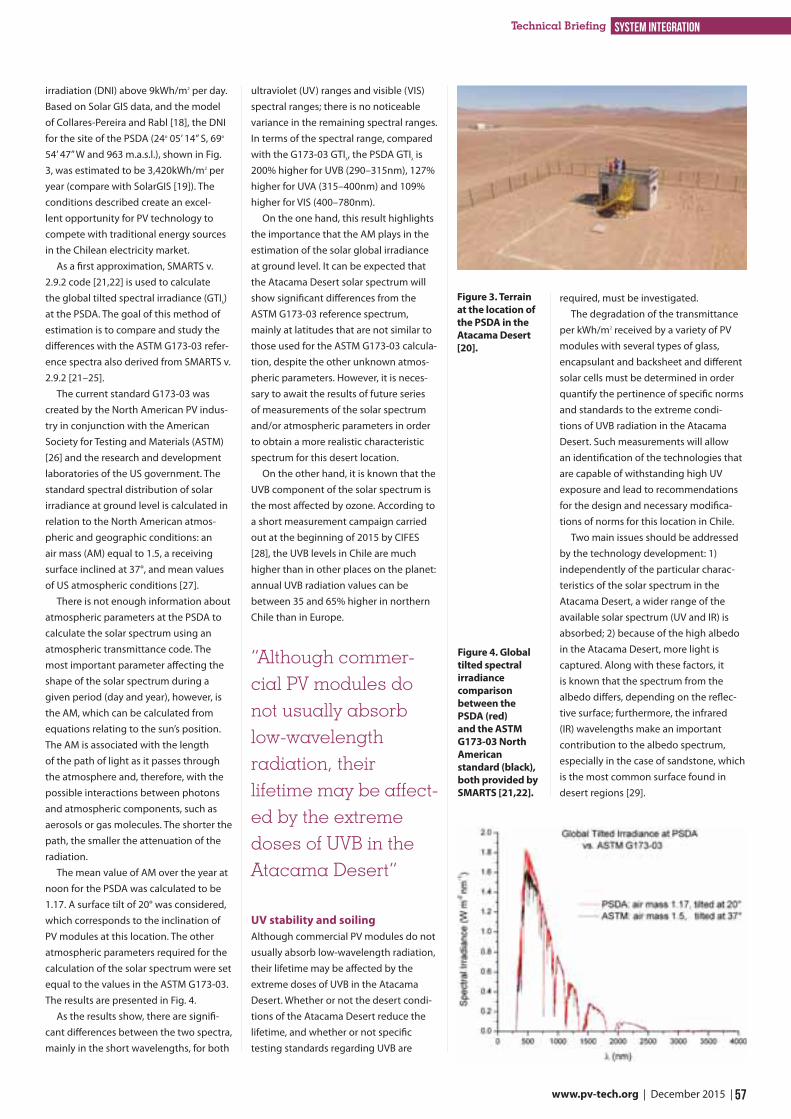
57 www.pv-tech.org | December 2015 |
system integrationTechnical Briefing
irradiation (DNI) above 9kWh/m2 per day. Based on Solar GIS data, and the model of Collares-Pereira and Rabl [18], the DNI for the site of the PSDA (24o 05’ 14” S, 69o 54’ 47” W and 963 m.a.s.l.), shown in Fig. 3, was estimated to be 3,420kWh/m2 per year (compare with SolarGIS [19]). The conditions described create an excel-lent opportunity for PV technology to compete with traditional energy sources in the Chilean electricity market.
As a first approximation, SMARTS v. 2.9.2 code [21,22] is used to calculate the global tilted spectral irradiance (GTIλ) at the PSDA. The goal of this method of estimation is to compare and study the differences with the ASTM G173-03 refer-ence spectra also derived from SMARTS v. 2.9.2 [21–25].
The current standard G173-03 was created by the North American PV indus-try in conjunction with the American Society for Testing and Materials (ASTM) [26] and the research and development laboratories of the US government. The standard spectral distribution of solar irradiance at ground level is calculated in relation to the North American atmos-pheric and geographic conditions: an air mass (AM) equal to 1.5, a receiving surface inclined at 37°, and mean values of US atmospheric conditions [27].
There is not enough information about atmospheric parameters at the PSDA to calculate the solar spectrum using an atmospheric transmittance code. The most important parameter affecting the shape of the solar spectrum during a given period (day and year), however, is the AM, which can be calculated from equations relating to the sun’s position. The AM is associated with the length of the path of light as it passes through the atmosphere and, therefore, with the possible interactions between photons and atmospheric components, such as aerosols or gas molecules. The shorter the path, the smaller the attenuation of the radiation.
The mean value of AM over the year at noon for the PSDA was calculated to be 1.17. A surface tilt of 20° was considered, which corresponds to the inclination of PV modules at this location. The other atmospheric parameters required for the calculation of the solar spectrum were set equal to the values in the ASTM G173-03. The results are presented in Fig. 4.
As the results show, there are signifi-cant differences between the two spectra, mainly in the short wavelengths, for both
ultraviolet (UV) ranges and visible (VIS) spectral ranges; there is no noticeable variance in the remaining spectral ranges. In terms of the spectral range, compared with the G173-03 GTIλ, the PSDA GTIλ is 200% higher for UVB (290–315nm), 127% higher for UVA (315–400nm) and 109% higher for VIS (400–780nm).
On the one hand, this result highlights the importance that the AM plays in the estimation of the solar global irradiance at ground level. It can be expected that the Atacama Desert solar spectrum will show significant differences from the ASTM G173-03 reference spectrum, mainly at latitudes that are not similar to those used for the ASTM G173-03 calcula-tion, despite the other unknown atmos-pheric parameters. However, it is neces-sary to await the results of future series of measurements of the solar spectrum and/or atmospheric parameters in order to obtain a more realistic characteristic spectrum for this desert location.
On the other hand, it is known that the UVB component of the solar spectrum is the most affected by ozone. According to a short measurement campaign carried out at the beginning of 2015 by CIFES [28], the UVB levels in Chile are much higher than in other places on the planet: annual UVB radiation values can be between 35 and 65% higher in northern Chile than in Europe.
“Although commer-cial PV modules do not usually absorb low-wavelength radiation, their lifetime may be affect-ed by the extreme doses of UVB in the Atacama Desert”
UV stability and soilingAlthough commercial PV modules do not usually absorb low-wavelength radiation, their lifetime may be affected by the extreme doses of UVB in the Atacama Desert. Whether or not the desert condi-tions of the Atacama Desert reduce the lifetime, and whether or not specific testing standards regarding UVB are
required, must be investigated.The degradation of the transmittance
per kWh/m2 received by a variety of PV modules with several types of glass, encapsulant and backsheet and different solar cells must be determined in order quantify the pertinence of specific norms and standards to the extreme condi-tions of UVB radiation in the Atacama Desert. Such measurements will allow an identification of the technologies that are capable of withstanding high UV exposure and lead to recommendations for the design and necessary modifica-tions of norms for this location in Chile.
Two main issues should be addressed by the technology development: 1) independently of the particular charac-teristics of the solar spectrum in the Atacama Desert, a wider range of the available solar spectrum (UV and IR) is absorbed; 2) because of the high albedo in the Atacama Desert, more light is captured. Along with these factors, it is known that the spectrum from the albedo differs, depending on the reflec-tive surface; furthermore, the infrared (IR) wavelengths make an important contribution to the albedo spectrum, especially in the case of sandstone, which is the most common surface found in desert regions [29].
Figure 3. Terrain at the location of the PSDA in the Atacama Desert [20].
Figure 4. Global tilted spectral irradiance comparison between the PSDA (red) and the ASTM G173-03 North American standard (black), both provided by SMARTS [21,22].
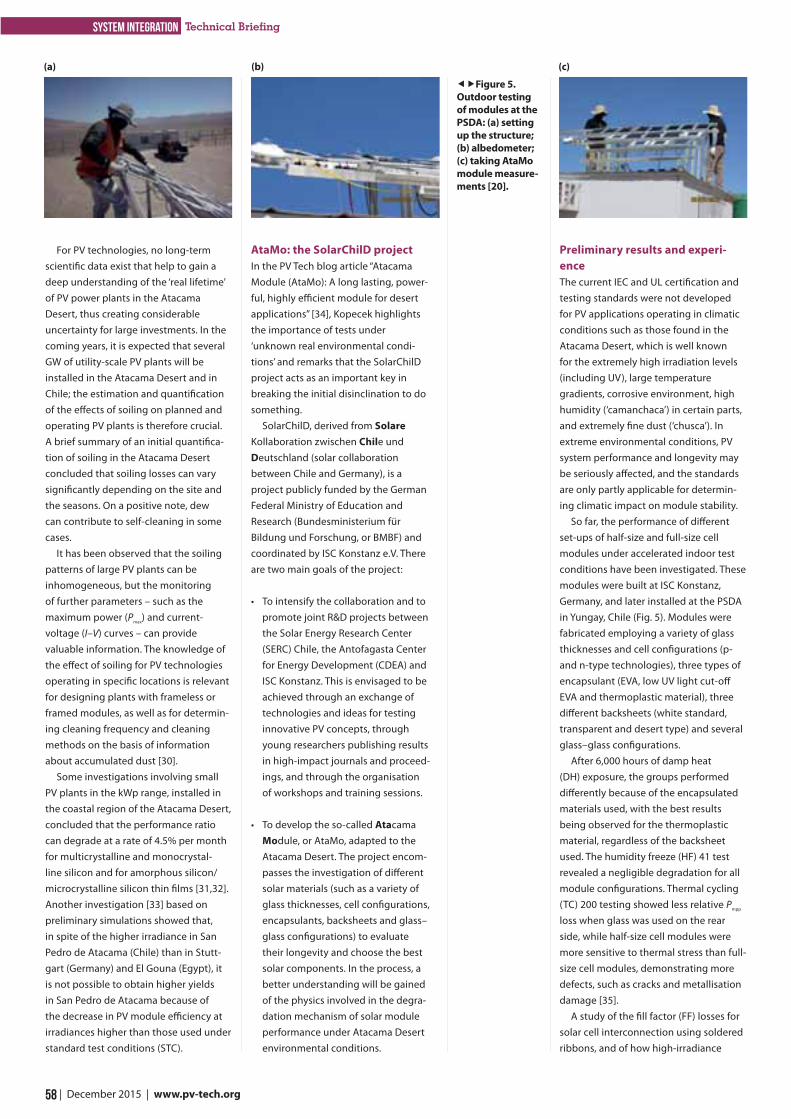
58 | December 2015 | www.pv-tech.org
system integration Technical Briefing
For PV technologies, no long-term scientific data exist that help to gain a deep understanding of the ‘real lifetime’ of PV power plants in the Atacama Desert, thus creating considerable uncertainty for large investments. In the coming years, it is expected that several GW of utility-scale PV plants will be installed in the Atacama Desert and in Chile; the estimation and quantification of the effects of soiling on planned and operating PV plants is therefore crucial. A brief summary of an initial quantifica-tion of soiling in the Atacama Desert concluded that soiling losses can vary significantly depending on the site and the seasons. On a positive note, dew can contribute to self-cleaning in some cases.
It has been observed that the soiling patterns of large PV plants can be inhomogeneous, but the monitoring of further parameters – such as the maximum power (Pmax) and current-voltage (I–V) curves – can provide valuable information. The knowledge of the effect of soiling for PV technologies operating in specific locations is relevant for designing plants with frameless or framed modules, as well as for determin-ing cleaning frequency and cleaning methods on the basis of information about accumulated dust [30].
Some investigations involving small PV plants in the kWp range, installed in the coastal region of the Atacama Desert, concluded that the performance ratio can degrade at a rate of 4.5% per month for multicrystalline and monocrystal-line silicon and for amorphous silicon/microcrystalline silicon thin films [31,32]. Another investigation [33] based on preliminary simulations showed that, in spite of the higher irradiance in San Pedro de Atacama (Chile) than in Stutt-gart (Germany) and El Gouna (Egypt), it is not possible to obtain higher yields in San Pedro de Atacama because of the decrease in PV module efficiency at irradiances higher than those used under standard test conditions (STC).
AtaMo: the SolarChilD projectIn the PV Tech blog article “Atacama Module (AtaMo): A long lasting, power-ful, highly efficient module for desert applications” [34], Kopecek highlights the importance of tests under ‘unknown real environmental condi-tions’ and remarks that the SolarChilD project acts as an important key in breaking the initial disinclination to do something.
SolarChilD, derived from Solare Kollaboration zwischen Chile und Deutschland (solar collaboration between Chile and Germany), is a project publicly funded by the German Federal Ministry of Education and Research (Bundesministerium für Bildung und Forschung, or BMBF) and coordinated by ISC Konstanz e.V. There are two main goals of the project:
• To intensify the collaboration and to promote joint R&D projects between the Solar Energy Research Center (SERC) Chile, the Antofagasta Center for Energy Development (CDEA) and ISC Konstanz. This is envisaged to be achieved through an exchange of technologies and ideas for testing innovative PV concepts, through young researchers publishing results in high-impact journals and proceed-ings, and through the organisation of workshops and training sessions.
• To develop the so-called Atacama Module, or AtaMo, adapted to the Atacama Desert. The project encom-passes the investigation of different solar materials (such as a variety of glass thicknesses, cell configurations, encapsulants, backsheets and glass–glass configurations) to evaluate their longevity and choose the best solar components. In the process, a better understanding will be gained of the physics involved in the degra-dation mechanism of solar module performance under Atacama Desert environmental conditions.
Preliminary results and experi-enceThe current IEC and UL certification and testing standards were not developed for PV applications operating in climatic conditions such as those found in the Atacama Desert, which is well known for the extremely high irradiation levels (including UV), large temperature gradients, corrosive environment, high humidity (‘camanchaca’) in certain parts, and extremely fine dust (‘chusca’). In extreme environmental conditions, PV system performance and longevity may be seriously affected, and the standards are only partly applicable for determin-ing climatic impact on module stability.
So far, the performance of different set-ups of half-size and full-size cell modules under accelerated indoor test conditions have been investigated. These modules were built at ISC Konstanz, Germany, and later installed at the PSDA in Yungay, Chile (Fig. 5). Modules were fabricated employing a variety of glass thicknesses and cell configurations (p- and n-type technologies), three types of encapsulant (EVA, low UV light cut-off EVA and thermoplastic material), three different backsheets (white standard, transparent and desert type) and several glass–glass configurations.
After 6,000 hours of damp heat (DH) exposure, the groups performed differently because of the encapsulated materials used, with the best results being observed for the thermoplastic material, regardless of the backsheet used. The humidity freeze (HF) 41 test revealed a negligible degradation for all module configurations. Thermal cycling (TC) 200 testing showed less relative Pmpp loss when glass was used on the rear side, while half-size cell modules were more sensitive to thermal stress than full-size cell modules, demonstrating more defects, such as cracks and metallisation damage [35].
A study of the fill factor (FF) losses for solar cell interconnection using soldered ribbons, and of how high-irradiance
Figure 5. Outdoor testing of modules at the PSDA: (a) setting up the structure; (b) albedometer; (c) taking AtaMo module measure-ments [20].
(a) (b) (c)
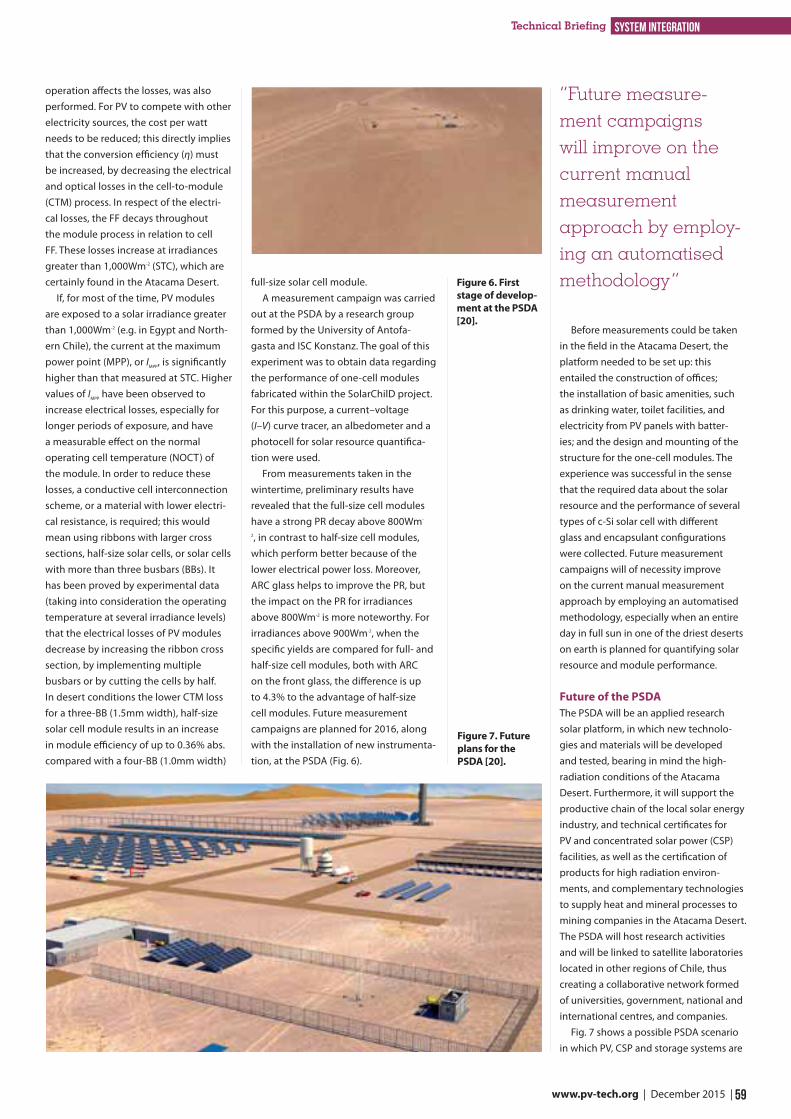
59 www.pv-tech.org | December 2015 |
system integrationTechnical Briefing
operation affects the losses, was also performed. For PV to compete with other electricity sources, the cost per watt needs to be reduced; this directly implies that the conversion efficiency (η) must be increased, by decreasing the electrical and optical losses in the cell-to-module (CTM) process. In respect of the electri-cal losses, the FF decays throughout the module process in relation to cell FF. These losses increase at irradiances greater than 1,000Wm-2 (STC), which are certainly found in the Atacama Desert.
If, for most of the time, PV modules are exposed to a solar irradiance greater than 1,000Wm-2 (e.g. in Egypt and North-ern Chile), the current at the maximum power point (MPP), or IMPP, is significantly higher than that measured at STC. Higher values of IMPP have been observed to increase electrical losses, especially for longer periods of exposure, and have a measurable effect on the normal operating cell temperature (NOCT) of the module. In order to reduce these losses, a conductive cell interconnection scheme, or a material with lower electri-cal resistance, is required; this would mean using ribbons with larger cross sections, half-size solar cells, or solar cells with more than three busbars (BBs). It has been proved by experimental data (taking into consideration the operating temperature at several irradiance levels) that the electrical losses of PV modules decrease by increasing the ribbon cross section, by implementing multiple busbars or by cutting the cells by half. In desert conditions the lower CTM loss for a three-BB (1.5mm width), half-size solar cell module results in an increase in module efficiency of up to 0.36% abs. compared with a four-BB (1.0mm width)
full-size solar cell module.A measurement campaign was carried
out at the PSDA by a research group formed by the University of Antofa-gasta and ISC Konstanz. The goal of this experiment was to obtain data regarding the performance of one-cell modules fabricated within the SolarChilD project. For this purpose, a current–voltage (I–V) curve tracer, an albedometer and a photocell for solar resource quantifica-tion were used.
From measurements taken in the wintertime, preliminary results have revealed that the full-size cell modules have a strong PR decay above 800Wm-
2, in contrast to half-size cell modules, which perform better because of the lower electrical power loss. Moreover, ARC glass helps to improve the PR, but the impact on the PR for irradiances above 800Wm-2 is more noteworthy. For irradiances above 900Wm-2, when the specific yields are compared for full- and half-size cell modules, both with ARC on the front glass, the difference is up to 4.3% to the advantage of half-size cell modules. Future measurement campaigns are planned for 2016, along with the installation of new instrumenta-tion, at the PSDA (Fig. 6).
“Future measure-ment campaigns will improve on the current manual measurement approach by employ-ing an automatised methodology”
Before measurements could be taken in the field in the Atacama Desert, the platform needed to be set up: this entailed the construction of offices; the installation of basic amenities, such as drinking water, toilet facilities, and electricity from PV panels with batter-ies; and the design and mounting of the structure for the one-cell modules. The experience was successful in the sense that the required data about the solar resource and the performance of several types of c-Si solar cell with different glass and encapsulant configurations were collected. Future measurement campaigns will of necessity improve on the current manual measurement approach by employing an automatised methodology, especially when an entire day in full sun in one of the driest deserts on earth is planned for quantifying solar resource and module performance.
Future of the PSDAThe PSDA will be an applied research solar platform, in which new technolo-gies and materials will be developed and tested, bearing in mind the high-radiation conditions of the Atacama Desert. Furthermore, it will support the productive chain of the local solar energy industry, and technical certificates for PV and concentrated solar power (CSP) facilities, as well as the certification of products for high radiation environ-ments, and complementary technologies to supply heat and mineral processes to mining companies in the Atacama Desert. The PSDA will host research activities and will be linked to satellite laboratories located in other regions of Chile, thus creating a collaborative network formed of universities, government, national and international centres, and companies.
Fig. 7 shows a possible PSDA scenario in which PV, CSP and storage systems are
Figure 6. First stage of develop-ment at the PSDA [20].
Figure 7. Future plans for the PSDA [20].
60 | December 2015 | www.pv-tech.org
system integration Technical Briefing
Dr. Pablo Ferrada works at the Centro de Desarrollo Energético Antofagasta (University of Antofagasta) and as a guest researcher at the Solar Energy Research Center, Chile. He focuses on PV module performance evalu-ation under the conditions of the Atacama Desert, material characterisation, and sup-porting development projects in collabora-tion with external centres.
Jorge Rabanal Arabach has a Dipl.-Ing. degree and is a researcher acad-emician at the University of Antofagasta. He is currently a Ph.D. student working on the SolarChilD project in the module develop-ment department at ISC Konstanz.
Dr. Enrique Cabrera received his Dipl.-Ing. degree (honours) in elec-trical engineering from the University of Santiago, Chile, and his Ph.D. in physics in the field of metallisation of silicon solar cells at ISC Konstanz in conjunction with the University of Konstanz. He leads the BMBF SolarChilD project and supports coopera-tive R&D projects in Chile.
Dr. Aitor Marzo works as researcher at the Centro de Desarrollo Energético Antofagasta (University of Antofagasta) and as a guest researcher at the Solar Energy Research Center (SERC) Chile. His research focuses on radiometry and providing sup-port to the different research areas in solar technologies, both for PV and for CSP.
Pablo Tello has a Dipl.-Ing. degree and has been working at the Centre for Innovation and Promotion of Sustainable Energy since 2010. He is now in charge of the stakeholders’ engagement process for the Chilean Strategic Solar Program and is part of the technical team responsible for the related roadmap elaboration.
Dr. Andreas Schneider has been with ISC Konstanz since 2011 and in charge of the module develop-ment department since 2013. He is mainly responsible for the scientific supervision of ISC’s module test laboratories and outdoor facilities.
Dr. Radovan Kopecek is one of the founders of ISC Konstanz. He has been working at the institute as a full-time manager and researcher since January 2007, and is cur-rently the head of the advanced solar cells department.
Authors
[1] Ministry of Economy, Promotion and Tourism of Chile [http://www.agendaproductividad.cl/wp-content/uploads/sites/22/2014/10/Agenda-de-Productividad-Innovacion-y-Crecimiento.pdf ].
[2] OECD/OCDE 2013, “Innovation-driven growth in regions: The role of smart specialisation”, Report [www.oecd.org/innovation/inno/smart-specialisation.pdf ].
[3] SolarGIS 2015, “Solar radiation maps: GHI” [http://solargis.info/doc/free-solar-radiation-maps-GHI].[4] Chilean Ministry of Energy 2014, “Energy agenda: A country challenge, progress for all” [http://www.minenergia.cl/
documentos/estudios/2014/agenda-de-energia-un-desafio-pais.html].[5] Phaal, R., Farrukh, C. & Probert, D. 2010, Roadmapping for Strategy and Innovation: Aligning Technology and Markets in a
Dynamic World. University of Cambridge, IfM.[6] Carayannis, E.G., Barth, T.D. & Campbell, D.F.J. 2012, “The Quintuple Helix innovation model: Global warming as a challenge
and driver for innovation”, J. Innov. Entrepren., Vol. 1, No. 2, pp. 1–12.[7] CIFES 2015, “Renewable energy in the Chilean electricity market”, Report (Oct.) [http://cifes.gob.cl/wp-content/
uploads/2014/06/Reporte_CIFES_Octubre_EN.pdf ].[8] CNW 2014, News Release (June) [http://www.pv-tech.org/news/sunedison_inaugurates_100mw_chile_solar_plant].[9] Etrion 2014, “Etrion announces completion of 70 MW solar park in Chile”, Press Release (4 Nov.) [https://www.etrion.com/
dm/Press/pr_chile_04-11-14.pdf ].[10] ENEL Green Power 2015, Press Release (5 May) [https://www.enelgreenpower.com/eWCM/salastampa/comunicati_
eng/1663736-1_PDF-1.pdf ].[11] Soltec 2015, “Projects: Our best reference” [http://www.soltec.com/proyectos/].[12] Evwind 2014, News Report (17 Oct.) [http://www.evwind.es/2014/10/17/first-solar-panel-for-the-141-megawatt-mwac-luz-
del-norte-solar-power-plant-in-chile].[13] Kenning, T. 2015, News Report (10 Jul.) [http://www.pv-tech.org/news/worlds_largest_bifacial_pv_plant_nears_
completion_in_chile].[14] Larraín, T. & Escobar, R. 2012, “Net energy analysis for concentrated solar power plants in northern Chile”, Renewable Energy, Vol. 41, 123–133.[15] McKay, C.P. et al. 2003, “Temperature and moisture conditions for life in the extreme arid region of the Atacama Desert: four
years of observations including the El Niño of 1997–1998”, Astrobiology, Vol. 3, pp. 393–406.[16] Navarro-González, R. et al. 2003, “Mars-like soils in the Atacama Desert, Chile, and the dry limit of microbial life”, Science, Vol.
302, No. 5647, pp. 1018–1021.[17] Escobar, R. et al. 2014, “Solar energy resource assessment in Chile: Satellite estimation and ground station measurements”,
Renewable Energy, Vol. 71, pp. 324–332.[18] Collares-Pereira, M. & Ralb, A. 1979, “The average distribution of solar radiation-correlations between diffuse and
hemispherical and between daily and hourly insolation values”, Solar Energy, Vol. 22, pp. 155–164.[19] SolarGIS 2015, “Solar radiation maps: DNI” [http://solargis.info/doc/free-solar-radiation-maps-DNI].[20] Antofagasta Center for Energy Development (CDEA) [http://www.uantof.cl/cdea].[21] Gueymard, C.A. 2001, “Parameterized transmittance model for direct beam and circumsolar spectral irradiance”, Sol. Energy,
Vol. 71, pp. 325–46.[22] Gueymard, C.A. 1995, “SMARTS2, A simple model of the atmospheric radiative transfer of sunshine: Algorithms and
performance assessment”, Technical Report FSEC-PF-270-95, Florida Solar Energy Center [http://rredc.nrel.gov/solar/models/smarts/relatedrefs/smarts2_report.pdf ].
[23] ASTM G173-03 (2012), “Standard tables for reference solar spectral irradiances: Direct normal and hemispherical”, ASTM International.
[24] Gueymard, C.A., Myers, D. & Emery, K. 2002, “Proposed reference irradiance spectra for solar energy systems testing”, Sol. Energy, Vol. 73, pp. 443–467.
[25] Gueymard, C.A. 2004, “The sun’s total and spectral irradiance for solar energy applications and solar radiation models”, Sol. Energy, Vol. 76, 423–453.
[26] ASTM [http://www.astm.org/].[27] National Renewable Energy Laboratory (NREL), “Reference solar spectral irradiance: Air mass 1.5” [http://rredc.nrel.gov/solar/
spectra/am1.5/].[28] CIFES 2015, Internal Report.[29] Brennan, M.P. et al. 2014, “Effects of spectral albedo on solar photovoltaic devices”, Sol. Energy Mater. Sol. Cells, Vol. 124, pp.
111–116.[30] Darez, P. & Darr, C. 2015, “Quantifying PV soiling losses in the Atacama Desert”, Proc. 31st EU PVSEC, Hamburg, Germany.[31] Ferrada, P. et al. 2015, “Performance analysis of photovoltaic systems of two different technologies in a coastal desert
climate zone of Chile”, Sol. Energy, Vol. 114, pp. 356–363.[32] Fuentealba, E. et al. 2015, Photovoltaic performance and LCoE comparison at the coastal zone of the Atacama Desert,
Chile”, Energy Conv. Man., Vol. 114, pp. 356–363.[33] Rabanal-Arabach, J., Schneider, A. & Cabrera, E. 2015, “Minimization of electrical losses of PV modules located in places with
high solar irradiance”, Energy Procedia, Vol. 77, pp. 402–406.[34] Kopecek, R. 2015, PV-Tech Guest Blog Article [http://www.pv-tech.org/guest_blog/atacama_module_atamo_a_long_
lasting_powerful_highly_efficient_module_for_de].[35] Cabrera, E. et al. 2015, “Advancements in the development of ‘AtaMo’: A solar module adapted for the climate conditions of
the Atacama Desert in Chile”, Proc. 31st EU PVSEC, Hamburg, Germany.
References
present. AtaMo and bifacial systems, as well as concentrated photovoltaics (CPV), will be a reality for PV in the coming years. A central receiver solar power plant, parabolic trough collectors and thermal flat collectors are also planned for CSP in the future. In addition, different configurations of thermal storage proto-types – such as sensible heat storage (using nitrate and carbonate molten salts), latent heat storage (using phase change materials produced in northern Chile) and thermochemical heat storage
(involving copper oxide as the storage material) – will be part of the PSDA.
AcknowledgementsThe authors acknowledge the generous financial support provided by:1. Education Ministry of Chile Grant PMI ANT 1201. 2. CONICYT/ FONDAP/15110019 Solar Energy Research Center (SERC) Chile.3. BMBF Solar Collaboration between Chile and Germany (Solar Child) project number 01DN14005.
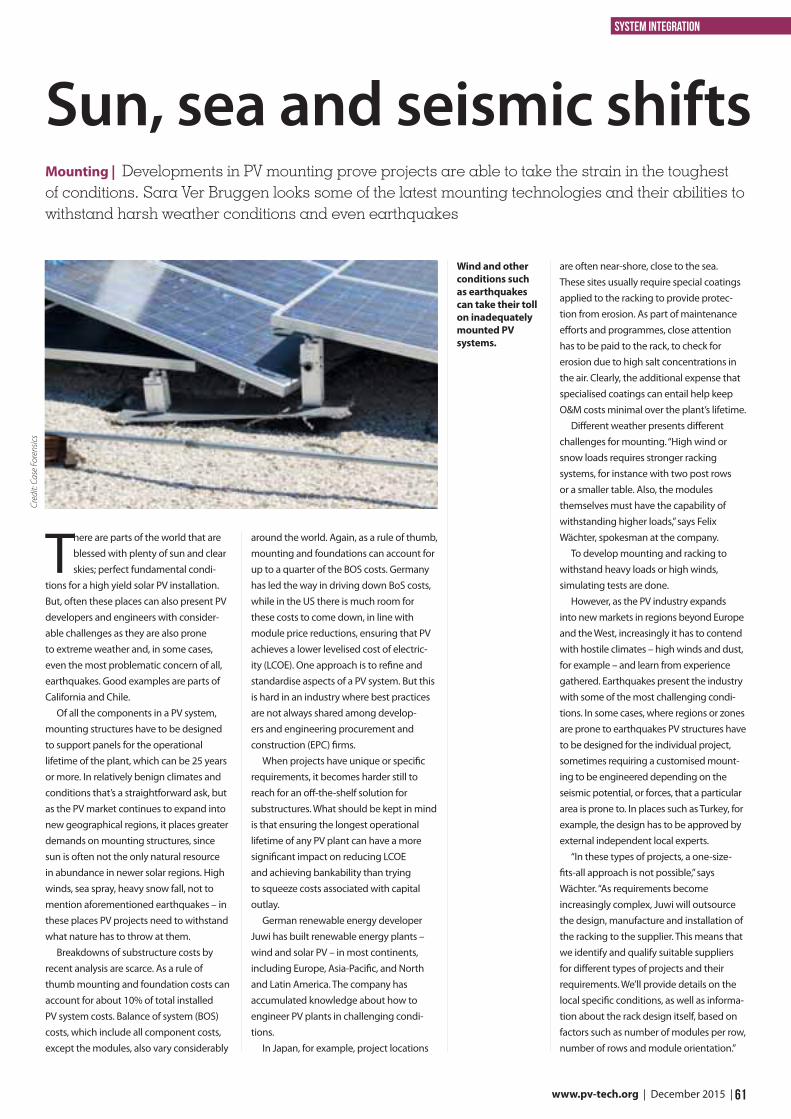
61 www.pv-tech.org | December 2015 |
system integration
There are parts of the world that are blessed with plenty of sun and clear skies; perfect fundamental condi-
tions for a high yield solar PV installation. But, often these places can also present PV developers and engineers with consider-able challenges as they are also prone to extreme weather and, in some cases, even the most problematic concern of all, earthquakes. Good examples are parts of California and Chile.
Of all the components in a PV system, mounting structures have to be designed to support panels for the operational lifetime of the plant, which can be 25 years or more. In relatively benign climates and conditions that’s a straightforward ask, but as the PV market continues to expand into new geographical regions, it places greater demands on mounting structures, since sun is often not the only natural resource in abundance in newer solar regions. High winds, sea spray, heavy snow fall, not to mention aforementioned earthquakes – in these places PV projects need to withstand what nature has to throw at them.
Breakdowns of substructure costs by recent analysis are scarce. As a rule of thumb mounting and foundation costs can account for about 10% of total installed PV system costs. Balance of system (BOS) costs, which include all component costs, except the modules, also vary considerably
around the world. Again, as a rule of thumb, mounting and foundations can account for up to a quarter of the BOS costs. Germany has led the way in driving down BoS costs, while in the US there is much room for these costs to come down, in line with module price reductions, ensuring that PV achieves a lower levelised cost of electric-ity (LCOE). One approach is to refine and standardise aspects of a PV system. But this is hard in an industry where best practices are not always shared among develop-ers and engineering procurement and construction (EPC) firms.
When projects have unique or specific requirements, it becomes harder still to reach for an off-the-shelf solution for substructures. What should be kept in mind is that ensuring the longest operational lifetime of any PV plant can have a more significant impact on reducing LCOE and achieving bankability than trying to squeeze costs associated with capital outlay.
German renewable energy developer Juwi has built renewable energy plants – wind and solar PV – in most continents, including Europe, Asia-Pacific, and North and Latin America. The company has accumulated knowledge about how to engineer PV plants in challenging condi-tions.
In Japan, for example, project locations
are often near-shore, close to the sea. These sites usually require special coatings applied to the racking to provide protec-tion from erosion. As part of maintenance efforts and programmes, close attention has to be paid to the rack, to check for erosion due to high salt concentrations in the air. Clearly, the additional expense that specialised coatings can entail help keep O&M costs minimal over the plant’s lifetime.
Different weather presents different challenges for mounting. “High wind or snow loads requires stronger racking systems, for instance with two post rows or a smaller table. Also, the modules themselves must have the capability of withstanding higher loads,” says Felix Wächter, spokesman at the company.
To develop mounting and racking to withstand heavy loads or high winds, simulating tests are done.
However, as the PV industry expands into new markets in regions beyond Europe and the West, increasingly it has to contend with hostile climates – high winds and dust, for example – and learn from experience gathered. Earthquakes present the industry with some of the most challenging condi-tions. In some cases, where regions or zones are prone to earthquakes PV structures have to be designed for the individual project, sometimes requiring a customised mount-ing to be engineered depending on the seismic potential, or forces, that a particular area is prone to. In places such as Turkey, for example, the design has to be approved by external independent local experts.
“In these types of projects, a one-size-fits-all approach is not possible,” says Wächter. “As requirements become increasingly complex, Juwi will outsource the design, manufacture and installation of the racking to the supplier. This means that we identify and qualify suitable suppliers for different types of projects and their requirements. We’ll provide details on the local specific conditions, as well as informa-tion about the rack design itself, based on factors such as number of modules per row, number of rows and module orientation.”
Mounting | Developments in PV mounting prove projects are able to take the strain in the toughest of conditions. Sara Ver Bruggen looks some of the latest mounting technologies and their abilities to withstand harsh weather conditions and even earthquakes
Sun, sea and seismic shifts
Wind and other conditions such as earthquakes can take their toll on inadequately mounted PV systems.
Cred
it: C
ase
Fore
nsic
s
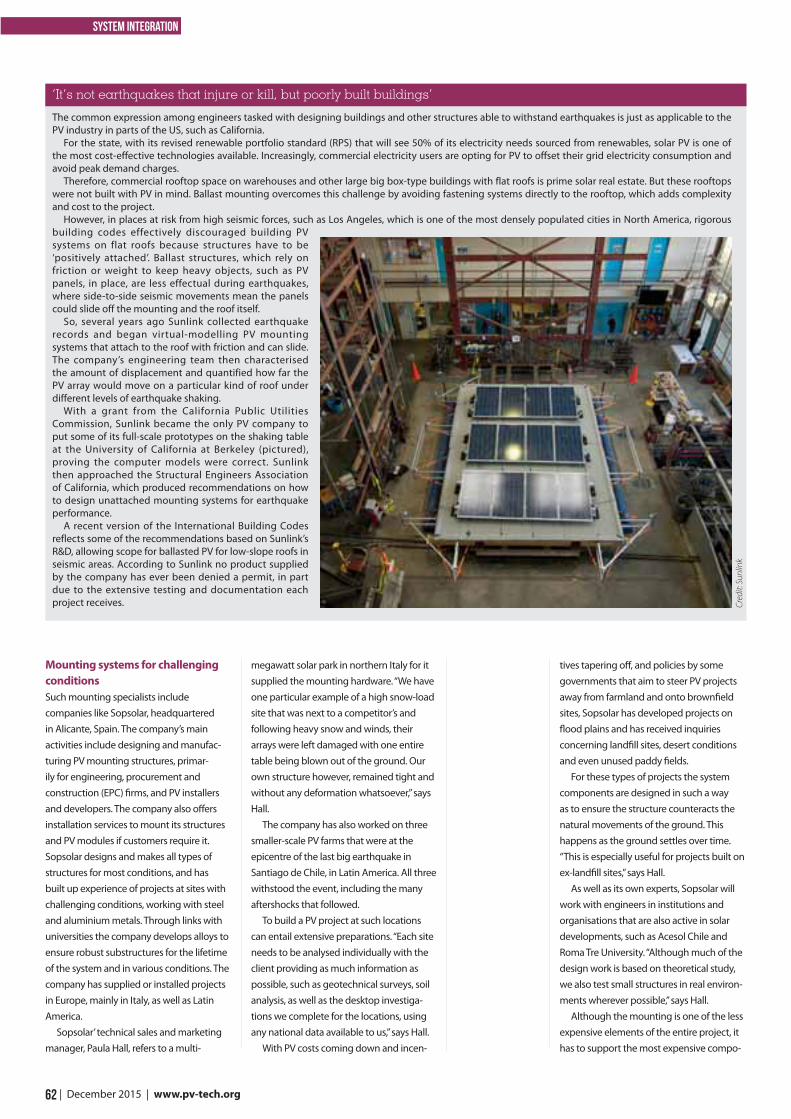
62 | December 2015 | www.pv-tech.org
system integration
Mounting systems for challenging conditionsSuch mounting specialists include companies like Sopsolar, headquartered in Alicante, Spain. The company’s main activities include designing and manufac-turing PV mounting structures, primar-ily for engineering, procurement and construction (EPC) firms, and PV installers and developers. The company also offers installation services to mount its structures and PV modules if customers require it. Sopsolar designs and makes all types of structures for most conditions, and has built up experience of projects at sites with challenging conditions, working with steel and aluminium metals. Through links with universities the company develops alloys to ensure robust substructures for the lifetime of the system and in various conditions. The company has supplied or installed projects in Europe, mainly in Italy, as well as Latin America.
Sopsolar’ technical sales and marketing manager, Paula Hall, refers to a multi-
megawatt solar park in northern Italy for it supplied the mounting hardware. “We have one particular example of a high snow-load site that was next to a competitor’s and following heavy snow and winds, their arrays were left damaged with one entire table being blown out of the ground. Our own structure however, remained tight and without any deformation whatsoever,” says Hall.
The company has also worked on three smaller-scale PV farms that were at the epicentre of the last big earthquake in Santiago de Chile, in Latin America. All three withstood the event, including the many aftershocks that followed.
To build a PV project at such locations can entail extensive preparations. “Each site needs to be analysed individually with the client providing as much information as possible, such as geotechnical surveys, soil analysis, as well as the desktop investiga-tions we complete for the locations, using any national data available to us,” says Hall.
With PV costs coming down and incen-
tives tapering off, and policies by some governments that aim to steer PV projects away from farmland and onto brownfield sites, Sopsolar has developed projects on flood plains and has received inquiries concerning landfill sites, desert conditions and even unused paddy fields.
For these types of projects the system components are designed in such a way as to ensure the structure counteracts the natural movements of the ground. This happens as the ground settles over time. “This is especially useful for projects built on ex-landfill sites,” says Hall.
As well as its own experts, Sopsolar will work with engineers in institutions and organisations that are also active in solar developments, such as Acesol Chile and Roma Tre University. “Although much of the design work is based on theoretical study, we also test small structures in real environ-ments wherever possible,” says Hall.
Although the mounting is one of the less expensive elements of the entire project, it has to support the most expensive compo-
The common expression among engineers tasked with designing buildings and other structures able to withstand earthquakes is just as applicable to the PV industry in parts of the US, such as California.
For the state, with its revised renewable portfolio standard (RPS) that will see 50% of its electricity needs sourced from renewables, solar PV is one of the most cost-effective technologies available. Increasingly, commercial electricity users are opting for PV to offset their grid electricity consumption and avoid peak demand charges.
Therefore, commercial rooftop space on warehouses and other large big box-type buildings with flat roofs is prime solar real estate. But these rooftops were not built with PV in mind. Ballast mounting overcomes this challenge by avoiding fastening systems directly to the rooftop, which adds complexity and cost to the project.
However, in places at risk from high seismic forces, such as Los Angeles, which is one of the most densely populated cities in North America, rigorous building codes effectively discouraged building PV systems on flat roofs because structures have to be ‘positively attached’. Ballast structures, which rely on friction or weight to keep heavy objects, such as PV panels, in place, are less effectual during earthquakes, where side-to-side seismic movements mean the panels could slide off the mounting and the roof itself.
So, several years ago Sunlink collected earthquake records and began virtual-modelling PV mounting systems that attach to the roof with friction and can slide. The company’s engineering team then characterised the amount of displacement and quantified how far the PV array would move on a particular kind of roof under different levels of earthquake shaking.
With a grant from the California Public Utilities Commission, Sunlink became the only PV company to put some of its full-scale prototypes on the shaking table at the University of California at Berkeley (pictured), proving the computer models were correct. Sunlink then approached the Structural Engineers Association of California, which produced recommendations on how to design unattached mounting systems for earthquake performance.
A recent version of the International Building Codes reflects some of the recommendations based on Sunlink’s R&D, allowing scope for ballasted PV for low-slope roofs in seismic areas. According to Sunlink no product supplied by the company has ever been denied a permit, in part due to the extensive testing and documentation each project receives.
‘It’s not earthquakes that injure or kill, but poorly built buildings’
Cred
it: S
unlin
k
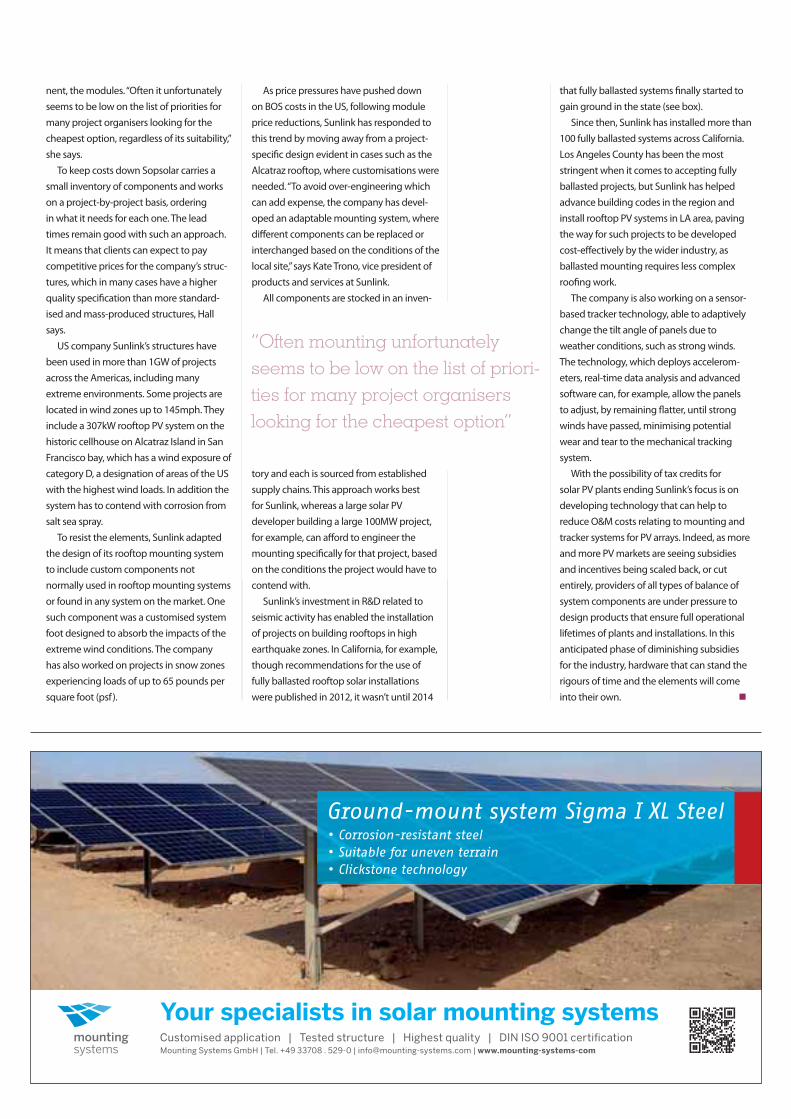
nent, the modules. “Often it unfortunately seems to be low on the list of priorities for many project organisers looking for the cheapest option, regardless of its suitability,” she says.
To keep costs down Sopsolar carries a small inventory of components and works on a project-by-project basis, ordering in what it needs for each one. The lead times remain good with such an approach. It means that clients can expect to pay competitive prices for the company’s struc-tures, which in many cases have a higher quality specifi cation than more standard-ised and mass-produced structures, Hall says.
US company Sunlink’s structures have been used in more than 1GW of projects across the Americas, including many extreme environments. Some projects are located in wind zones up to 145mph. They include a 307kW rooftop PV system on the historic cellhouse on Alcatraz Island in San Francisco bay, which has a wind exposure of category D, a designation of areas of the US with the highest wind loads. In addition the system has to contend with corrosion from salt sea spray.
To resist the elements, Sunlink adapted the design of its rooftop mounting system to include custom components not normally used in rooftop mounting systems or found in any system on the market. One such component was a customised system foot designed to absorb the impacts of the extreme wind conditions. The company has also worked on projects in snow zones experiencing loads of up to 65 pounds per square foot (psf).
As price pressures have pushed down on BOS costs in the US, following module price reductions, Sunlink has responded to this trend by moving away from a project-specifi c design evident in cases such as the Alcatraz rooftop, where customisations were needed. “To avoid over-engineering which can add expense, the company has devel-oped an adaptable mounting system, where diff erent components can be replaced or interchanged based on the conditions of the local site,” says Kate Trono, vice president of products and services at Sunlink.
All components are stocked in an inven-
tory and each is sourced from established supply chains. This approach works best for Sunlink, whereas a large solar PV developer building a large 100MW project, for example, can aff ord to engineer the mounting specifi cally for that project, based on the conditions the project would have to contend with.
Sunlink’s investment in R&D related to seismic activity has enabled the installation of projects on building rooftops in high earthquake zones. In California, for example, though recommendations for the use of fully ballasted rooftop solar installations were published in 2012, it wasn’t until 2014
that fully ballasted systems fi nally started to gain ground in the state (see box).
Since then, Sunlink has installed more than 100 fully ballasted systems across California. Los Angeles County has been the most stringent when it comes to accepting fully ballasted projects, but Sunlink has helped advance building codes in the region and install rooftop PV systems in LA area, paving the way for such projects to be developed cost-eff ectively by the wider industry, as ballasted mounting requires less complex roofi ng work.
The company is also working on a sensor-based tracker technology, able to adaptively change the tilt angle of panels due to weather conditions, such as strong winds. The technology, which deploys accelerom-eters, real-time data analysis and advanced software can, for example, allow the panels to adjust, by remaining fl atter, until strong winds have passed, minimising potential wear and tear to the mechanical tracking system.
With the possibility of tax credits for solar PV plants ending Sunlink’s focus is on developing technology that can help to reduce O&M costs relating to mounting and tracker systems for PV arrays. Indeed, as more and more PV markets are seeing subsidies and incentives being scaled back, or cut entirely, providers of all types of balance of system components are under pressure to design products that ensure full operational lifetimes of plants and installations. In this anticipated phase of diminishing subsidies for the industry, hardware that can stand the rigours of time and the elements will come into their own.
“Often mounting unfortunately seems to be low on the list of priori-ties for many project organisers looking for the cheapest option”
Your specialists in solar mounting systemsMounting Systems GmbH | Tel. +49 33708 . 529-0 | [email protected] | www.mounting-systems-com
Ground-mount system Sigma I XL Steel

64 | December 2015 | www.pv-tech.org
system integration
Fire safety with regards to rooftop PV has become a sore point in the US solar industry over the past
few years, with firefighters concerned about the potential hazards of coming into contact with an energised PV array. They have called for devices to be fitted to enable rapid shutdown of generators, bringing the voltage down to a ‘safe’ level within a specified response time.
This presents a problem for anyone using a central or string inverter. The rule won’t be enforced immediately or uniformly throughout the US, but rooftop solar installers that do not design systems with module-level power electronics will be technically precluded from those markets that do, should the rules be changed.
Faced with demands to drop voltages in a matter of seconds and for arrays to be safe to approach to within 1ft, solar industry representatives including the
Solar Energy Industries’ Association (SEIA) and central inverter maker SMA have proposed to meet the technological conundrum with what they considered to be compromises. Unfortunately, these proposals have not played well with the fire service. Meanwhile, a number of companies from the power electron-ics and smart module segment of the US market have interjected with pleas for the industry to just deal with the issue – while admitting this wouldn’t exactly harm their own regional sales. To massively oversimplify a protracted and sometimes ugly saga for the sake of both brevity and the dignity of all concerned, it hasn’t gone smoothly.
Code changesExisting legislation calls for PV conduits to de-energise from 240V to under 30V within 10 seconds, with a boundary of 10ft around an array considered ‘safe’.
Legislation pencilled in for 2017 will demand that all PV conductors outside the array can be shut down to 30V within 30 seconds of shutdown, but also that conductors within the array itself must be shut down to under 80V in less than 30 seconds. The boundary around the array is also reduced to 1ft in the later version.
Fire safety in the US is mainly dealt with in two tiers of regulation. The National Electric Code (NEC) deals with installation safety, produced by the privately-owned National Fire Protection Association (NFPA). A set of “maintenance codes”, the NEC is relatively flexible and not federally enforced, created in ongoing three-year cycles. The code currently in place is NEC 2014, although some states are still using the previous 2011 code.
There are also fire codes, adopted by fire services state by state. In a country where the lead firefighter on the scene at any given fire holds supreme authority over that fire, up to and including the president, fire codes are taken extremely seriously. They also have a direct impact on insurance and therefore bankability, with obvious ramifications for the third-party leasing model that dominates the US residential market and includes big players like SolarCity, Vivint and Sunrun.
Failure to come to an agreement with the fire service on the NEC, therefore, means the fire service could simply take the offending legislation into the fire code and – as an example of what they could do – refuse to deal with any fire involving PV whatsoever.
Firefighters’ concerns“Very simply, the fire service felt that there were inadequate codes for PV installations and some requirements were put in the fire codes,” says Matthew Paiss, a California firefighter who sat on the NFPA panel.
It clearly was not in the interest of anyone, not least the PV industry, for these concerns to be dealt with in the
Safety | Firefighters in the US are calling for rapid shutdown capabilities to be added to PV systems. But the issue has caused upset for string inverter suppliers because of the possible benefits such requirements would offer rivals that fit power electronics into their systems at module level. Andy Colthorpe reports on what is turning into increasingly contentious row
Burning issue
Proposed new rules aimed at providing firefighters with additional protection when tackling PV-related fires have become a source of conten-tion in the US.
Cred
it: C
omm
ons W
ikim
edia
, Bas
tique
65 www.pv-tech.org | December 2015 |
system integration
fire codes. Paiss says NFPA therefore worked closely with firefighters on the NEC instead.
Matthew Paiss worked in PV some three decades ago himself, building modules by hand. He certainly comes across as knowledgeable on PV technolo-gy and says he recognises the challenge, but to him getting “the voltage within the array to as low a level as possible” is essential, not just for the fire service but for others who might be up on the roof for any reason. He also says the fire service has been willing to compromise on numerous instances in this process, including putting the less strict rules into the 2014 code.
The fire service made this concession on the understanding that in the 2017 version, for which public comments closed in September, remaining concerns would be ironed out, giving the industry an incremental chance to catch up, Paiss says, including the 80/30V question.
What’s the impact?String inverter companies will undoubt-edly suffer a fall in demand as a result of NEC 2017, as Scott Moskowitz of GTM Research confirms, although it will be implemented on an “ongoing basis, in a particular number of states”, starting with Massachusetts and gradually rolling out over three or four years. Therefore, there remains a “ton of opportunity” for these companies, he believes, while the timeline gives them a chance to catch up.
Nonetheless, he says it is natural string inverter companies might feel hard done by. Those in the ‘against’ camp, collec-tively represented by SEIA, argue that there are no practical means to eliminate the risk of shock entirely from PV arrays and in particular take issue with what they feel is the “prescription of specific product solutions” i.e. module-level power electronics of the type currently only made by a handful of vendors. The association also claims there could be reliability issues with module level devices, creating a false sense of security around unsafe arrays.
SMA America’s head of strategic product management Hannes Knopf tells PV Tech Power that research conducted in Germany by TUV Rheinland and Fraun-hofer ISE found that fires near PV systems of 1,500V could be safely extinguished with sprayed water from a distance of 3ft to15ft away from the array. Knopf says SMA felt 80V was also an arbitrary
compromise with “no statistical or scientific justification whatsoever”, also pointing out that there have been no deaths or serious injuries recorded in the US from contact with rooftop PV arrays. “We absolutely do not oppose the creation of a safer working environment for first responders, merely the manner in which this specific language proposes to achieve safety,” Knopf says
SEIA has proposed an accreditation scheme for industry-listed PV instal-lations, which SMA backs, but the fire service rejects this out of hand. Matthew Paiss says systems on this proposed scheme would be listed with trading standards bodies and not enforceable. Paiss also says the ‘arbitrary’ 80V limit was set to appease the industry’s worries that 240V to 30V would be a difficult step to implement on a technical basis.
Scott Moskowitz of GTM also says in fact that the codes will not greatly impact overall demand for PV, not least when module-level power electronics already hold a 60% share of the total US residential market as it is. The analyst is also bullish on the potential of the value proposition module-level power electronics present, helping to lower overall cost, providing the ability to monitor and control PV systems down to the exact module despite requiring a higher outlay upfront. In a recent GTM report, Moskowitz predicted that the global market for AC and smart modules will be worth US$603 million by 2020.
From an industry point of view, he says, SolarEdge, which specialises in DC optimisers, has been so successful that other vendors are likely to be looking to follow that strategy anyway, either to “acquire or introduce some form of competing solution”.
Other major players in the module-level space more or less already able to compete in post-NEC 2017 states include microinverter specialist Enphase and smart module maker Tigo Energy. Zvi Alon, CEO of the latter, said his safety switch-integrated module cover could be licensed to a range of other providers.
Don’t just let it burnTigo’s CTO Sam Arditi, along with Enphase director of public policy, John Berdner, and SolarEdge VP of core technologies, Meir Adest, have all signed a statement supporting the firemen’s suggested code revisions.
Berdner and Zvi Alon of Tigo Energy
concede that while SMA and others in the ‘against’ group may have some valid points, both argue strongly that the alternative to agreeing with the fire service’s demands as they now stand could be devastating. The fire service could just wash its hands of the whole thing and in the instance of fire, just “let it burn”, Berdner says, while Alon questions the logic that no fatalities so far proves something is safe, particularly given the current rate of growth in the industry.
“Installations will keep multiplying at faster rates and now it’s becoming much more distributed because the residential market is the fastest growing market [segment], with 1,000V and 1,500V on the roof. I would say we [the PV industry] are not decreasing the risk by doing that!” Alon says. “The question is, can we come up with a compromise that is cost effective and move on with our lives and maybe in 15 years 95% of systems will have it and that will be the end of the story?”
‘Knuckle down’The fact remains that the hazard does appear reduced under the 2017 codes in the eyes of the fire service and on further investigation of this dispute, it seems to become more and more appar-ent that their view is ultimately the most important from a legal standpoint and will most likely prevail in a January NFPA ballot on the NEC changes.
There is also the very legitimate argument that they are – often voluntar-ily in the US – risking their lives to serve the public. Remaining concerns the PV industry has will be listened to more closely if it acknowledges that firefight-ers’ own concerns will simply take precedence. String level companies will either have to adapt somehow through innovation or acquisition of appropriate technologies in the years up to 2019.
Despite his obvious annoyance that some of the PV industry has fought him on this, Paiss says he is sympathetic to the fact that it is a sensitive subject to PV companies.
“I think it’s accentuated by the ITC (federal investment tax credit incentive) drop next year. I’m very sensitive to what this could mean to the industry, seeing a 20% cost increase. But our position is that if these systems fail, they need to fail in a safe mode, so that will be part of the standard.”
Ultimately, he says, the industry needs to “knuckle down and get on with this”.
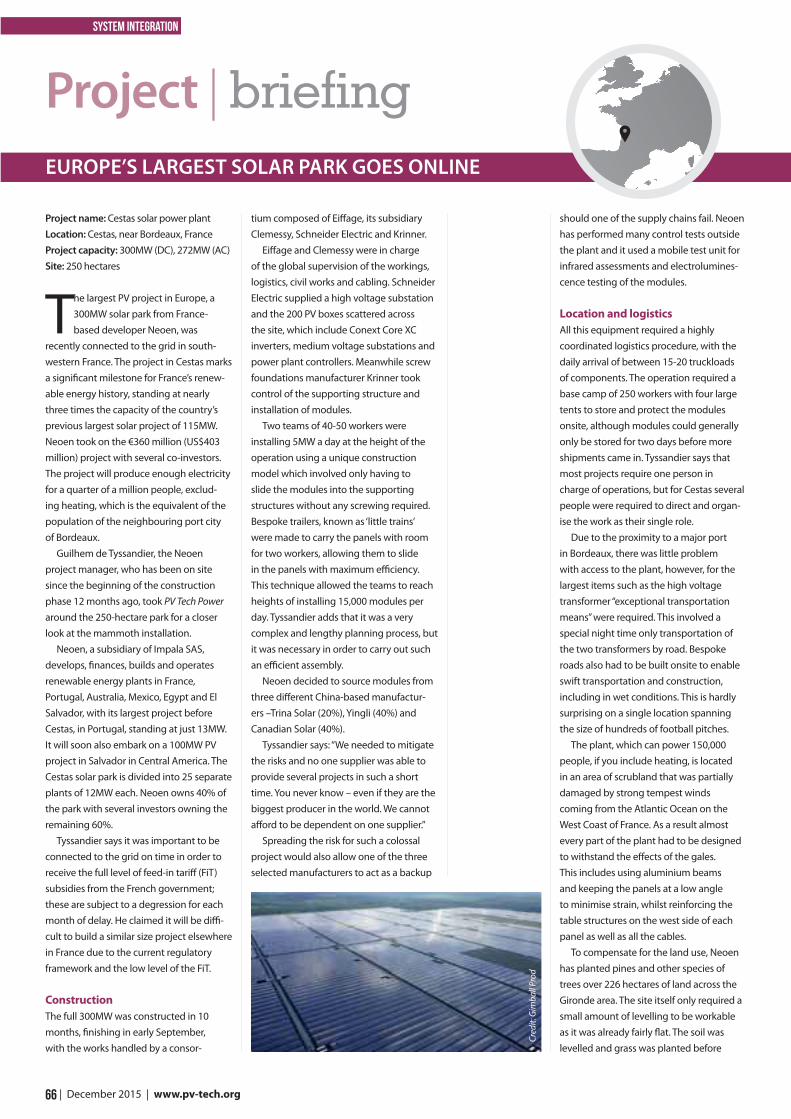
66 | December 2015 | www.pv-tech.org
system integration
Project name: Cestas solar power plantLocation: Cestas, near Bordeaux, FranceProject capacity: 300MW (DC), 272MW (AC)Site: 250 hectares
The largest PV project in Europe, a 300MW solar park from France-based developer Neoen, was
recently connected to the grid in south-western France. The project in Cestas marks a significant milestone for France’s renew-able energy history, standing at nearly three times the capacity of the country’s previous largest solar project of 115MW. Neoen took on the €360 million (US$403 million) project with several co-investors. The project will produce enough electricity for a quarter of a million people, exclud-ing heating, which is the equivalent of the population of the neighbouring port city of Bordeaux.
Guilhem de Tyssandier, the Neoen project manager, who has been on site since the beginning of the construction phase 12 months ago, took PV Tech Power around the 250-hectare park for a closer look at the mammoth installation.
Neoen, a subsidiary of Impala SAS, develops, finances, builds and operates renewable energy plants in France, Portugal, Australia, Mexico, Egypt and El Salvador, with its largest project before Cestas, in Portugal, standing at just 13MW. It will soon also embark on a 100MW PV project in Salvador in Central America. The Cestas solar park is divided into 25 separate plants of 12MW each. Neoen owns 40% of the park with several investors owning the remaining 60%.
Tyssandier says it was important to be connected to the grid on time in order to receive the full level of feed-in tariff (FiT) subsidies from the French government; these are subject to a degression for each month of delay. He claimed it will be diffi-cult to build a similar size project elsewhere in France due to the current regulatory framework and the low level of the FiT.
ConstructionThe full 300MW was constructed in 10 months, finishing in early September, with the works handled by a consor-
tium composed of Eiffage, its subsidiary Clemessy, Schneider Electric and Krinner.
Eiffage and Clemessy were in charge of the global supervision of the workings, logistics, civil works and cabling. Schneider Electric supplied a high voltage substation and the 200 PV boxes scattered across the site, which include Conext Core XC inverters, medium voltage substations and power plant controllers. Meanwhile screw foundations manufacturer Krinner took control of the supporting structure and installation of modules.
Two teams of 40-50 workers were installing 5MW a day at the height of the operation using a unique construction model which involved only having to slide the modules into the supporting structures without any screwing required. Bespoke trailers, known as ‘little trains’ were made to carry the panels with room for two workers, allowing them to slide in the panels with maximum efficiency. This technique allowed the teams to reach heights of installing 15,000 modules per day. Tyssandier adds that it was a very complex and lengthy planning process, but it was necessary in order to carry out such an efficient assembly.
Neoen decided to source modules from three different China-based manufactur-ers –Trina Solar (20%), Yingli (40%) and Canadian Solar (40%).
Tyssandier says: “We needed to mitigate the risks and no one supplier was able to provide several projects in such a short time. You never know – even if they are the biggest producer in the world. We cannot afford to be dependent on one supplier.”
Spreading the risk for such a colossal project would also allow one of the three selected manufacturers to act as a backup
should one of the supply chains fail. Neoen has performed many control tests outside the plant and it used a mobile test unit for infrared assessments and electrolumines-cence testing of the modules.
Location and logisticsAll this equipment required a highly coordinated logistics procedure, with the daily arrival of between 15-20 truckloads of components. The operation required a base camp of 250 workers with four large tents to store and protect the modules onsite, although modules could generally only be stored for two days before more shipments came in. Tyssandier says that most projects require one person in charge of operations, but for Cestas several people were required to direct and organ-ise the work as their single role.
Due to the proximity to a major port in Bordeaux, there was little problem with access to the plant, however, for the largest items such as the high voltage transformer “exceptional transportation means” were required. This involved a special night time only transportation of the two transformers by road. Bespoke roads also had to be built onsite to enable swift transportation and construction, including in wet conditions. This is hardly surprising on a single location spanning the size of hundreds of football pitches.
The plant, which can power 150,000 people, if you include heating, is located in an area of scrubland that was partially damaged by strong tempest winds coming from the Atlantic Ocean on the West Coast of France. As a result almost every part of the plant had to be designed to withstand the effects of the gales. This includes using aluminium beams and keeping the panels at a low angle to minimise strain, whilst reinforcing the table structures on the west side of each panel as well as all the cables.
To compensate for the land use, Neoen has planted pines and other species of trees over 226 hectares of land across the Gironde area. The site itself only required a small amount of levelling to be workable as it was already fairly flat. The soil was levelled and grass was planted before
Project | briefingEUROPE’S LARGEST SOLAR PARK GOES ONLINE
Cred
it: G
imba
ll Pr
od
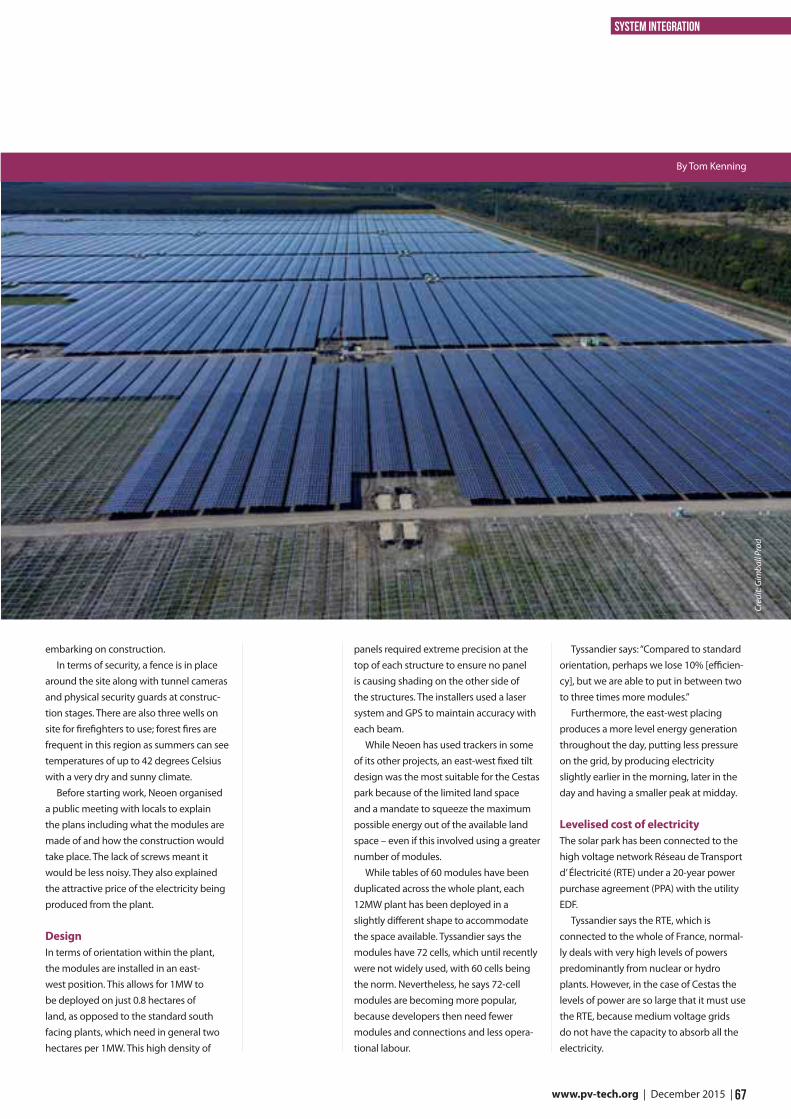
67 www.pv-tech.org | December 2015 |
system integration
embarking on construction.In terms of security, a fence is in place
around the site along with tunnel cameras and physical security guards at construc-tion stages. There are also three wells on site for firefighters to use; forest fires are frequent in this region as summers can see temperatures of up to 42 degrees Celsius with a very dry and sunny climate.
Before starting work, Neoen organised a public meeting with locals to explain the plans including what the modules are made of and how the construction would take place. The lack of screws meant it would be less noisy. They also explained the attractive price of the electricity being produced from the plant.
DesignIn terms of orientation within the plant, the modules are installed in an east-west position. This allows for 1MW to be deployed on just 0.8 hectares of land, as opposed to the standard south facing plants, which need in general two hectares per 1MW. This high density of
panels required extreme precision at the top of each structure to ensure no panel is causing shading on the other side of the structures. The installers used a laser system and GPS to maintain accuracy with each beam.
While Neoen has used trackers in some of its other projects, an east-west fixed tilt design was the most suitable for the Cestas park because of the limited land space and a mandate to squeeze the maximum possible energy out of the available land space – even if this involved using a greater number of modules.
While tables of 60 modules have been duplicated across the whole plant, each 12MW plant has been deployed in a slightly different shape to accommodate the space available. Tyssandier says the modules have 72 cells, which until recently were not widely used, with 60 cells being the norm. Nevertheless, he says 72-cell modules are becoming more popular, because developers then need fewer modules and connections and less opera-tional labour.
Tyssandier says: “Compared to standard orientation, perhaps we lose 10% [efficien-cy], but we are able to put in between two to three times more modules.”
Furthermore, the east-west placing produces a more level energy generation throughout the day, putting less pressure on the grid, by producing electricity slightly earlier in the morning, later in the day and having a smaller peak at midday.
Levelised cost of electricityThe solar park has been connected to the high voltage network Réseau de Transport d’ Électricité (RTE) under a 20-year power purchase agreement (PPA) with the utility EDF.
Tyssandier says the RTE, which is connected to the whole of France, normal-ly deals with very high levels of powers predominantly from nuclear or hydro plants. However, in the case of Cestas the levels of power are so large that it must use the RTE, because medium voltage grids do not have the capacity to absorb all the electricity.
By Tom Kenning
Cred
it: G
imba
ll Pr
od
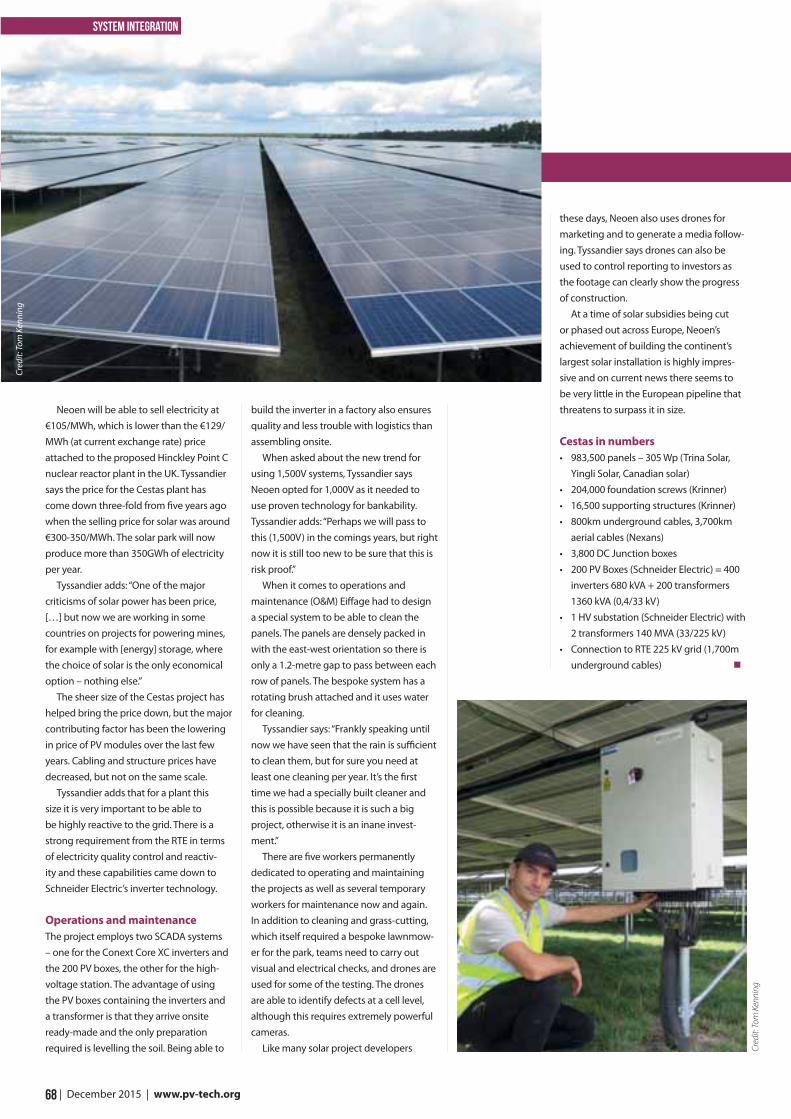
Neoen will be able to sell electricity at €105/MWh, which is lower than the €129/MWh (at current exchange rate) price attached to the proposed Hinckley Point C nuclear reactor plant in the UK. Tyssandier says the price for the Cestas plant has come down three-fold from five years ago when the selling price for solar was around €300-350/MWh. The solar park will now produce more than 350GWh of electricity per year.
Tyssandier adds: “One of the major criticisms of solar power has been price, […] but now we are working in some countries on projects for powering mines, for example with [energy] storage, where the choice of solar is the only economical option – nothing else.”
The sheer size of the Cestas project has helped bring the price down, but the major contributing factor has been the lowering in price of PV modules over the last few years. Cabling and structure prices have decreased, but not on the same scale.
Tyssandier adds that for a plant this size it is very important to be able to be highly reactive to the grid. There is a strong requirement from the RTE in terms of electricity quality control and reactiv-ity and these capabilities came down to Schneider Electric’s inverter technology.
Operations and maintenanceThe project employs two SCADA systems – one for the Conext Core XC inverters and the 200 PV boxes, the other for the high-voltage station. The advantage of using the PV boxes containing the inverters and a transformer is that they arrive onsite ready-made and the only preparation required is levelling the soil. Being able to
build the inverter in a factory also ensures quality and less trouble with logistics than assembling onsite.
When asked about the new trend for using 1,500V systems, Tyssandier says Neoen opted for 1,000V as it needed to use proven technology for bankability. Tyssandier adds: “Perhaps we will pass to this (1,500V) in the comings years, but right now it is still too new to be sure that this is risk proof.”
When it comes to operations and maintenance (O&M) Eiffage had to design a special system to be able to clean the panels. The panels are densely packed in with the east-west orientation so there is only a 1.2-metre gap to pass between each row of panels. The bespoke system has a rotating brush attached and it uses water for cleaning.
Tyssandier says: “Frankly speaking until now we have seen that the rain is sufficient to clean them, but for sure you need at least one cleaning per year. It’s the first time we had a specially built cleaner and this is possible because it is such a big project, otherwise it is an inane invest-ment.”
There are five workers permanently dedicated to operating and maintaining the projects as well as several temporary workers for maintenance now and again. In addition to cleaning and grass-cutting, which itself required a bespoke lawnmow-er for the park, teams need to carry out visual and electrical checks, and drones are used for some of the testing. The drones are able to identify defects at a cell level, although this requires extremely powerful cameras.
Like many solar project developers
68 | December 2015 | www.pv-tech.org
system integration
these days, Neoen also uses drones for marketing and to generate a media follow-ing. Tyssandier says drones can also be used to control reporting to investors as the footage can clearly show the progress of construction.
At a time of solar subsidies being cut or phased out across Europe, Neoen’s achievement of building the continent’s largest solar installation is highly impres-sive and on current news there seems to be very little in the European pipeline that threatens to surpass it in size.
Cestas in numbers• 983,500 panels – 305 Wp (Trina Solar,
Yingli Solar, Canadian solar)• 204,000 foundation screws (Krinner)• 16,500 supporting structures (Krinner)• 800km underground cables, 3,700km
aerial cables (Nexans)• 3,800 DC Junction boxes• 200 PV Boxes (Schneider Electric) = 400
inverters 680 kVA + 200 transformers 1360 kVA (0,4/33 kV)
• 1 HV substation (Schneider Electric) with 2 transformers 140 MVA (33/225 kV)
• Connection to RTE 225 kV grid (1,700m underground cables)
Cred
it: To
m K
enni
ng
Cred
it: To
m K
enni
ng
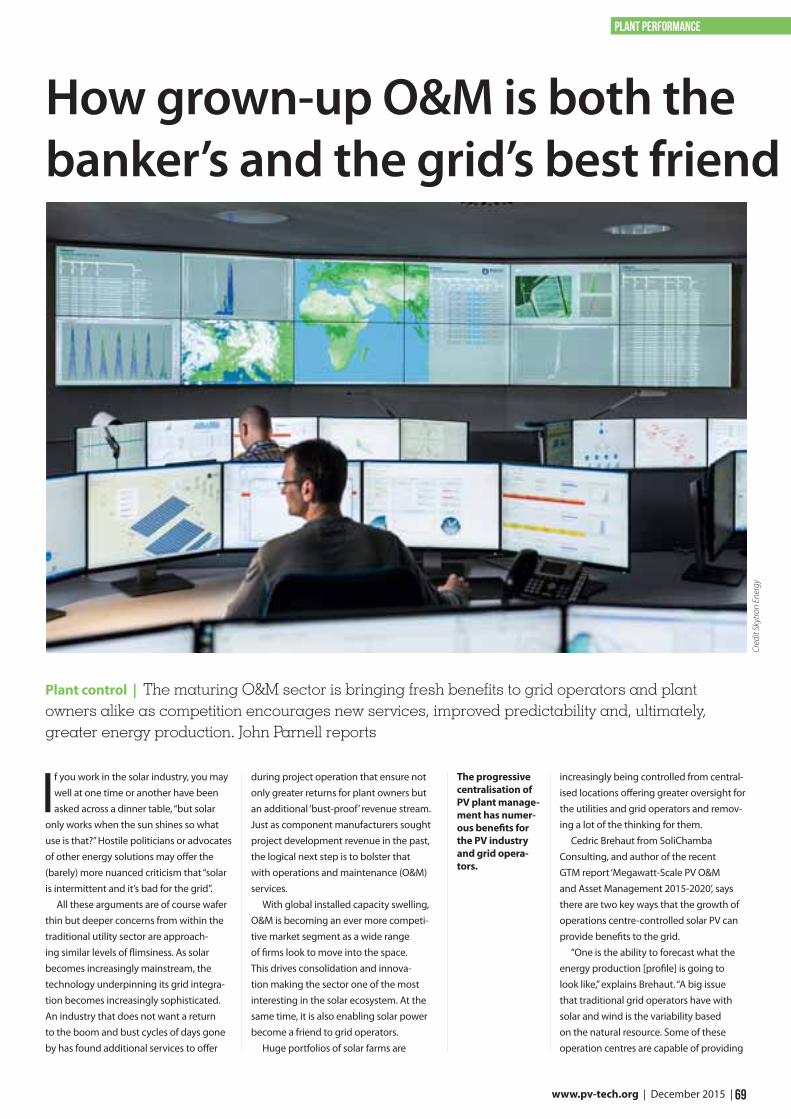
69 www.pv-tech.org | December 2015 |
plant performance
If you work in the solar industry, you may well at one time or another have been asked across a dinner table, “but solar
only works when the sun shines so what use is that?” Hostile politicians or advocates of other energy solutions may offer the (barely) more nuanced criticism that “solar is intermittent and it’s bad for the grid”.
All these arguments are of course wafer thin but deeper concerns from within the traditional utility sector are approach-ing similar levels of flimsiness. As solar becomes increasingly mainstream, the technology underpinning its grid integra-tion becomes increasingly sophisticated. An industry that does not want a return to the boom and bust cycles of days gone by has found additional services to offer
during project operation that ensure not only greater returns for plant owners but an additional ‘bust-proof’ revenue stream. Just as component manufacturers sought project development revenue in the past, the logical next step is to bolster that with operations and maintenance (O&M) services.
With global installed capacity swelling, O&M is becoming an ever more competi-tive market segment as a wide range of firms look to move into the space. This drives consolidation and innova-tion making the sector one of the most interesting in the solar ecosystem. At the same time, it is also enabling solar power become a friend to grid operators.
Huge portfolios of solar farms are
increasingly being controlled from central-ised locations offering greater oversight for the utilities and grid operators and remov-ing a lot of the thinking for them.
Cedric Brehaut from SoliChamba Consulting, and author of the recent GTM report ‘Megawatt-Scale PV O&M and Asset Management 2015-2020’, says there are two key ways that the growth of operations centre-controlled solar PV can provide benefits to the grid.
“One is the ability to forecast what the energy production [profile] is going to look like,” explains Brehaut. “A big issue that traditional grid operators have with solar and wind is the variability based on the natural resource. Some of these operation centres are capable of providing
Plant control | The maturing O&M sector is bringing fresh benefits to grid operators and plant owners alike as competition encourages new services, improved predictability and, ultimately, greater energy production. John Parnell reports
How grown-up O&M is both the banker’s and the grid’s best friend
The progressive centralisation of PV plant manage-ment has numer-ous benefits for the PV industry and grid opera-tors.
Cred
it Sk
ytro
n En
ergy
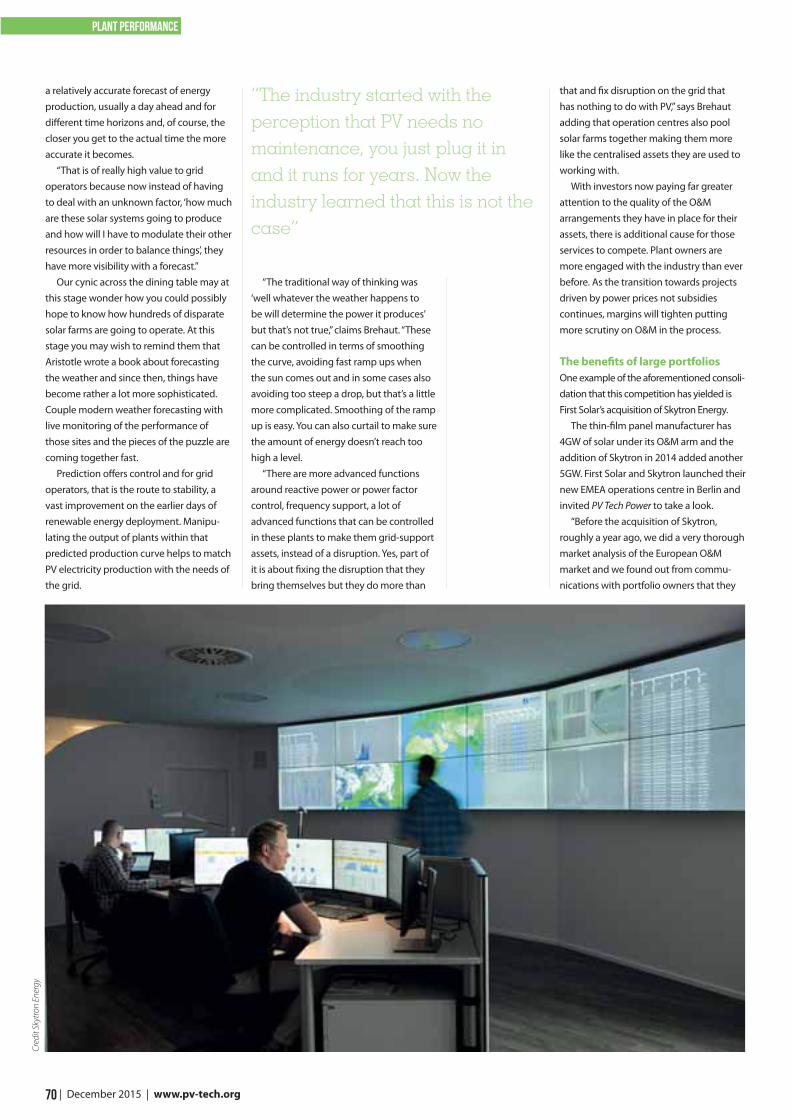
70 | December 2015 | www.pv-tech.org
plant performance
a relatively accurate forecast of energy production, usually a day ahead and for different time horizons and, of course, the closer you get to the actual time the more accurate it becomes.
“That is of really high value to grid operators because now instead of having to deal with an unknown factor, ‘how much are these solar systems going to produce and how will I have to modulate their other resources in order to balance things’, they have more visibility with a forecast.”
Our cynic across the dining table may at this stage wonder how you could possibly hope to know how hundreds of disparate solar farms are going to operate. At this stage you may wish to remind them that Aristotle wrote a book about forecasting the weather and since then, things have become rather a lot more sophisticated. Couple modern weather forecasting with live monitoring of the performance of those sites and the pieces of the puzzle are coming together fast.
Prediction offers control and for grid operators, that is the route to stability, a vast improvement on the earlier days of renewable energy deployment. Manipu-lating the output of plants within that predicted production curve helps to match PV electricity production with the needs of the grid.
“The traditional way of thinking was ‘well whatever the weather happens to be will determine the power it produces’ but that’s not true,” claims Brehaut. “These can be controlled in terms of smoothing the curve, avoiding fast ramp ups when the sun comes out and in some cases also avoiding too steep a drop, but that’s a little more complicated. Smoothing of the ramp up is easy. You can also curtail to make sure the amount of energy doesn’t reach too high a level.
“There are more advanced functions around reactive power or power factor control, frequency support, a lot of advanced functions that can be controlled in these plants to make them grid-support assets, instead of a disruption. Yes, part of it is about fixing the disruption that they bring themselves but they do more than
that and fix disruption on the grid that has nothing to do with PV,” says Brehaut adding that operation centres also pool solar farms together making them more like the centralised assets they are used to working with.
With investors now paying far greater attention to the quality of the O&M arrangements they have in place for their assets, there is additional cause for those services to compete. Plant owners are more engaged with the industry than ever before. As the transition towards projects driven by power prices not subsidies continues, margins will tighten putting more scrutiny on O&M in the process.
The benefits of large portfoliosOne example of the aforementioned consoli-dation that this competition has yielded is First Solar’s acquisition of Skytron Energy.
The thin-film panel manufacturer has 4GW of solar under its O&M arm and the addition of Skytron in 2014 added another 5GW. First Solar and Skytron launched their new EMEA operations centre in Berlin and invited PV Tech Power to take a look.
“Before the acquisition of Skytron, roughly a year ago, we did a very thorough market analysis of the European O&M market and we found out from commu-nications with portfolio owners that they
“The industry started with the perception that PV needs no maintenance, you just plug it in and it runs for years. Now the industry learned that this is not the case”
Cred
it Sk
ytro
n En
ergy
71 www.pv-tech.org | December 2015 |
plant performance
were not satisfied with the service they were getting,” explains Stefan Degener, First Solar’s senior director for O&M in the EMEA region.
“They just signed a piece of paper and the service provider either does not deliver against it or goes insolvent or doesn’t have the means to do it to keep their promises. This was the driver for us to enter the European market,” says Degener, adding that they take an approach of looking at a plant down to the component level in the search for optimisation.
The site covers a geographic spread from Portugal to Pakistan and together with First Solar operations centres in Tempe, Arizona, and Sydney, Australia, the company has global coverage. At the heart of the operation is a bombardment of data that is used to make the most of maintenance interventions and deliver the forecasting and control described by Brehaut.
“The data analysis helps you, giving the right information and direction to the plant managers on site, Degener adds. “They can go tweak the inverters, look at cables that
might be loose or whatever it is that needs to be done to help improve the availability of components and therefore the avail-ability of the entire plant and the energy production.”
Degener points out that there is a positive correlation between investment in O&M and the PPA price that your project can command. “O&M has gone from being a necessary add-on for the lenders to becoming one of the main points of interest for most owners of solar PV assets,” he says. He adds that with FiT payments previously in the order of €0.14 the O&M cost was around 8% of revenues but with PPA-based projects now operating at an increasingly lower levelised cost of energy (LCOE), they can now account for 15% of revenue.
Improving availability may keep investors sweet, but it also improves the predictability of solar as a whole, further enhancing its role within the wider energy system.
Skytron CEO Jörgen Klammer explains how the data archive built up by the company can be transformed into an additional service for the plant operator, bringing them more revenue and further smoothing the output of the plant.
“The entire industry started with the perception that PV in general needs no maintenance, no operation [work] neces-sary, you just plug it in and it runs for years. Now the entire industry learned that this is not the case. We have a tremendous amount of data and information and we’re pretty proud of the data quality we have,” says Klammer. “It’s a combination of our hardware and the software tools that we use. There is significant IP that can and is generated from that data. We can use that information to provide services to our customers.
“We submitted a patent for a soiling calculation algorithm that is based on our string monitoring capability. You need this accurate data and with the knowledge of the history on degradation, failures in the module, fuses blown, weather data, rainfall, there is a complex algorithm to predict the soiling of the module and this is very valuable information,” explains Klammer.
“Today cleaning procedures are scheduled at a certain point in time. We’re providing information that triggers clean-ing, so we can tell when the soiling has reached a level where it is economically feasible to do the cleaning. This is a prime example where we learn from the data we have in our database and we convert
it over to a product that we provide to our customers that is of significant economic value to them.”
New opportunities from storageThe advent of storage creates even more opportunity for operation centres to interact with the grid and deliver further benefits.
“It’s not a question of whether we could integrate storage, we are capable of integrating battery storage into the grid control and operation now,” says Klammer. “Here we need to separate between the control part that is necessary to maintain the health of the battery, that’s the expertise of the battery manufacturers. We look at a battery as a power plant and a consumer in one. A battery is a very, very flexible consumption and generation device.
“We already have a power plant where there is a wind power plant at a grid connection point and a PV plant, which installed battery storage, so we already control this mixture of energy sources. Depending on the signal from the grid operator and what kind of power is needed, reactive power control, we use the battery as a buffer and for grid stabilisa-tion.”
Klammer says there are companies well positioned to reduce the cost of batteries but until there is greater demand from the grid operators that cost reduction process will be slower than was seen with PV.
“What would change the picture is the removal of fossil fuel energy subsidies,” says Klammer. “Those are the sources where grid control and stability are sourced [at present]. Once those subsidies go away, the cost of conventional energy in the view of the grid operator will increase so they no longer get their control energy for the same price and then the demand for batteries is there.”
SoliChamba’s Brehaut says major innovation plays little part in the O&M market, with marginal gains and constantly improving efficiency the name of the game. And while the number of gigawatts under control swells and operations centres like Skytron’s in Berlin become more common, O&M firms will continue to quietly grow. Their impact on the bottom line of big solar players will doubtless increase too but it is their ability to mend bridges with grid operators and offer tangible benefits to utilities that could prove to be of greatest value to solar in the long run.
Cedric Brehaut of SoliChamba Consulting, and author of the GTM report ‘Megawatt-Scale PV O&M and Asset Management 2015-2020’, on the changing face of the O&M market.
“There two types of players today, the ones that have set themselves up to have that kind of infrastructure, only the largest ones, and then there is everyone else. The large ones will become even larger, if you already have 500MW or 1GW or in the case of First Solar and SunEdison you have two or three gigawatts, for them it is a matter of continuing to ramp up and perhaps open duplicate centres in various parts of the world. For them it is more incremental.
“But if you are a smaller firm with 50-100MW, it is going be a big change. It doesn’t scale linearly and as the scale of these plants gets bigger there are more challenges and a call to be more professional and more advanced. So the big players will get bigger, and a number of players who are not of that scale and who don’t have the infrastructure will have to choose whether they make a big investment and join the game, or they decide not to go alone and partner with others.
“In the US, power purchase agreements are at levels never seen before and so to make it work you need very low O&M costs. There will be price pressure in the O&M market from the economics of solar, but that is squeezing every part of the supply chain in the US. This is not the case somewhere like Italy where nobody is building anything anymore so everyone is competing for O&M – still pressure, but a different type of pressure. We may see more of this in the US in 2017 after the ITC closes with more players looking at O&M for existing plants.”
The O&M marketplace
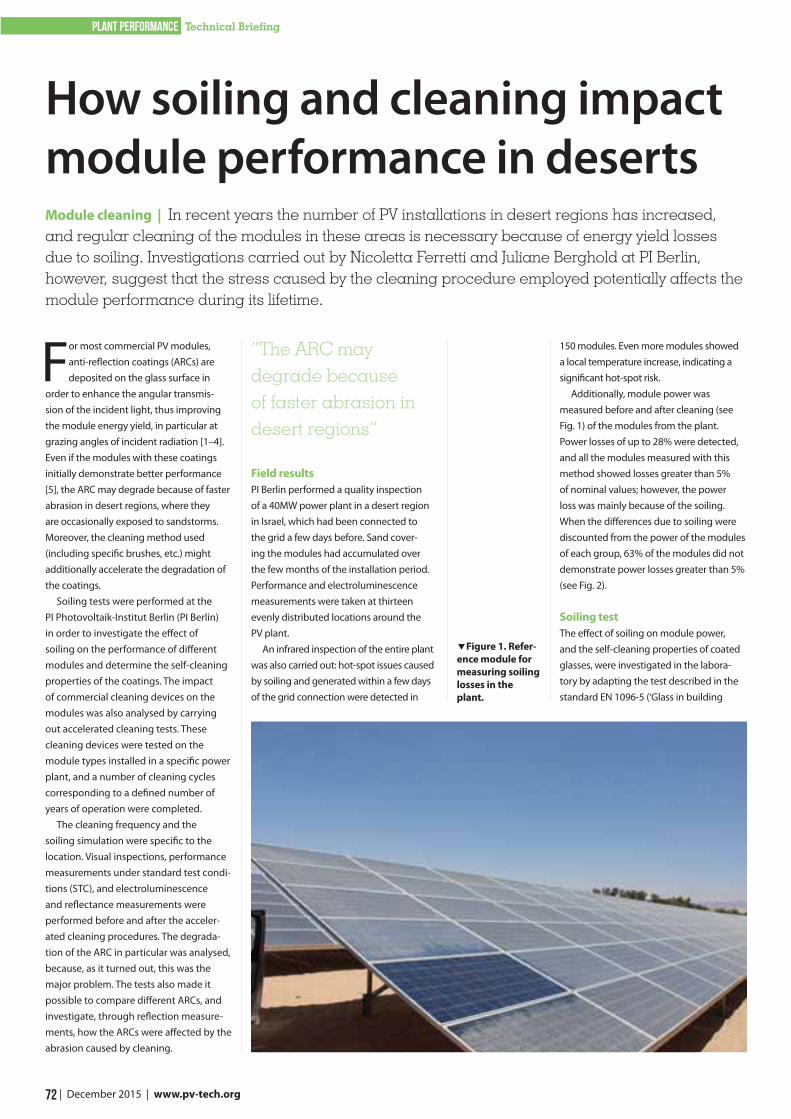
72 | December 2015 | www.pv-tech.org
plant performance Technical Briefing
For most commercial PV modules, anti-reflection coatings (ARCs) are deposited on the glass surface in
order to enhance the angular transmis-sion of the incident light, thus improving the module energy yield, in particular at grazing angles of incident radiation [1–4]. Even if the modules with these coatings initially demonstrate better performance [5], the ARC may degrade because of faster abrasion in desert regions, where they are occasionally exposed to sandstorms. Moreover, the cleaning method used (including specific brushes, etc.) might additionally accelerate the degradation of the coatings.
Soiling tests were performed at the PI Photovoltaik-Institut Berlin (PI Berlin) in order to investigate the effect of soiling on the performance of different modules and determine the self-cleaning properties of the coatings. The impact of commercial cleaning devices on the modules was also analysed by carrying out accelerated cleaning tests. These cleaning devices were tested on the module types installed in a specific power plant, and a number of cleaning cycles corresponding to a defined number of years of operation were completed.
The cleaning frequency and the soiling simulation were specific to the location. Visual inspections, performance measurements under standard test condi-tions (STC), and electroluminescence and reflectance measurements were performed before and after the acceler-ated cleaning procedures. The degrada-tion of the ARC in particular was analysed, because, as it turned out, this was the major problem. The tests also made it possible to compare different ARCs, and investigate, through reflection measure-ments, how the ARCs were affected by the abrasion caused by cleaning.
“The ARC may degrade because of faster abrasion in desert regions”
Field resultsPI Berlin performed a quality inspection of a 40MW power plant in a desert region in Israel, which had been connected to the grid a few days before. Sand cover-ing the modules had accumulated over the few months of the installation period. Performance and electroluminescence measurements were taken at thirteen evenly distributed locations around the PV plant.
An infrared inspection of the entire plant was also carried out: hot-spot issues caused by soiling and generated within a few days of the grid connection were detected in
150 modules. Even more modules showed a local temperature increase, indicating a significant hot-spot risk.
Additionally, module power was measured before and after cleaning (see Fig. 1) of the modules from the plant. Power losses of up to 28% were detected, and all the modules measured with this method showed losses greater than 5% of nominal values; however, the power loss was mainly because of the soiling. When the differences due to soiling were discounted from the power of the modules of each group, 63% of the modules did not demonstrate power losses greater than 5% (see Fig. 2).
Soiling testThe effect of soiling on module power, and the self-cleaning properties of coated glasses, were investigated in the labora-tory by adapting the test described in the standard EN 1096-5 (‘Glass in building
Module cleaning | In recent years the number of PV installations in desert regions has increased, and regular cleaning of the modules in these areas is necessary because of energy yield losses due to soiling. Investigations carried out by Nicoletta Ferretti and Juliane Berghold at PI Berlin, however, suggest that the stress caused by the cleaning procedure employed potentially affects the module performance during its lifetime.
How soiling and cleaning impact module performance in deserts
Figure 1. Refer-ence module for measuring soiling losses in the plant.

Under the patronage ofH. H. Sheikh Maktoum bin Mohammed bin Rashid Al Maktoum, Dubai Deputy Ruler
1 – 3 MARCH 2016DUBAI WORLD TRADE CENTRE, UAE
1-3 March 2016Dubai World Trade Centre, UAE
1,600 exhibiting companies25 international pavilions
40 technical seminars2 conferences
E: [email protected] T: +971 (0) 4 336 5161 W: www.solarmiddleeast.ae
REGISTER NOW FOR FREE FAST-TRACK ACCESS
Organised by Partner Events
Co-located with:
THE REGION’S LARGEST SOLAR TRADE EVENT
120+ 25 4,000 senior level decision makers4,500 sqm of the latest solar technologies
Find out more and register your attendance on www.middleeastelectricity.comEmail: info@middleeastelectricity , Phone: +971 4 336 5161
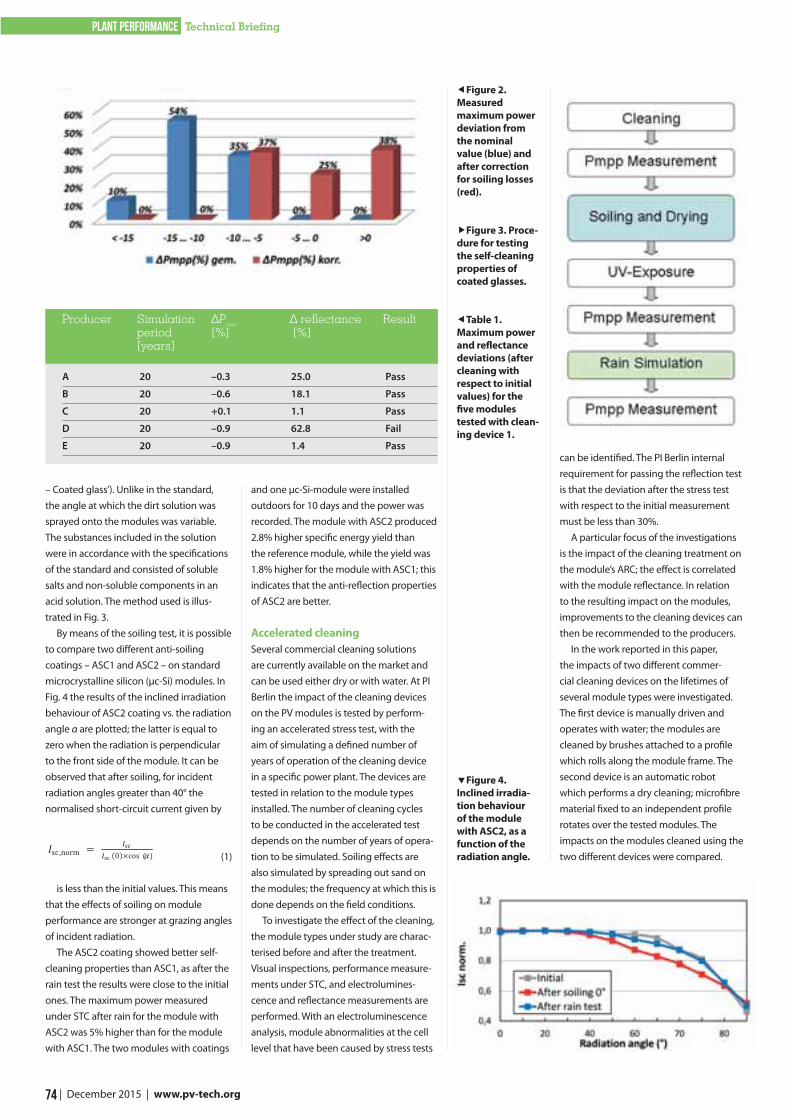
74 | December 2015 | www.pv-tech.org
plant performance Technical Briefing
– Coated glass’). Unlike in the standard, the angle at which the dirt solution was sprayed onto the modules was variable. The substances included in the solution were in accordance with the specifications of the standard and consisted of soluble salts and non-soluble components in an acid solution. The method used is illus-trated in Fig. 3.
By means of the soiling test, it is possible to compare two different anti-soiling coatings – ASC1 and ASC2 – on standard microcrystalline silicon (μc-Si) modules. In Fig. 4 the results of the inclined irradiation behaviour of ASC2 coating vs. the radiation angle α are plotted; the latter is equal to zero when the radiation is perpendicular to the front side of the module. It can be observed that after soiling, for incident radiation angles greater than 40° the normalised short-circuit current given by
sc ,norm = scsc (0)×cos ( ) (1)
is less than the initial values. This means that the effects of soiling on module performance are stronger at grazing angles of incident radiation.
The ASC2 coating showed better self-cleaning properties than ASC1, as after the rain test the results were close to the initial ones. The maximum power measured under STC after rain for the module with ASC2 was 5% higher than for the module with ASC1. The two modules with coatings
and one μc-Si-module were installed outdoors for 10 days and the power was recorded. The module with ASC2 produced 2.8% higher specific energy yield than the reference module, while the yield was 1.8% higher for the module with ASC1; this indicates that the anti-reflection properties of ASC2 are better.
Accelerated cleaningSeveral commercial cleaning solutions are currently available on the market and can be used either dry or with water. At PI Berlin the impact of the cleaning devices on the PV modules is tested by perform-ing an accelerated stress test, with the aim of simulating a defined number of years of operation of the cleaning device in a specific power plant. The devices are tested in relation to the module types installed. The number of cleaning cycles to be conducted in the accelerated test depends on the number of years of opera-tion to be simulated. Soiling effects are also simulated by spreading out sand on the modules; the frequency at which this is done depends on the field conditions.
To investigate the effect of the cleaning, the module types under study are charac-terised before and after the treatment. Visual inspections, performance measure-ments under STC, and electrolumines-cence and reflectance measurements are performed. With an electroluminescence analysis, module abnormalities at the cell level that have been caused by stress tests
can be identified. The PI Berlin internal requirement for passing the reflection test is that the deviation after the stress test with respect to the initial measurement must be less than 30%.
A particular focus of the investigations is the impact of the cleaning treatment on the module’s ARC; the effect is correlated with the module reflectance. In relation to the resulting impact on the modules, improvements to the cleaning devices can then be recommended to the producers.
In the work reported in this paper, the impacts of two different commer-cial cleaning devices on the lifetimes of several module types were investigated. The first device is manually driven and operates with water; the modules are cleaned by brushes attached to a profile which rolls along the module frame. The second device is an automatic robot which performs a dry cleaning; microfibre material fixed to an independent profile rotates over the tested modules. The impacts on the modules cleaned using the two different devices were compared.
Figure 2. Measured maximum power deviation from the nominal value (blue) and after correction for soiling losses (red).
Figure 3. Proce-dure for testing the self-cleaning properties of coated glasses.
Table 1. Maximum power and reflectance deviations (after cleaning with respect to initial values) for the five modules tested with clean-ing device 1.
Figure 4. Inclined irradia-tion behaviour of the module with ASC2, as a function of the radiation angle.
A 20 –0.3 25.0 Pass
B 20 –0.6 18.1 Pass
C 20 +0.1 1.1 Pass
D 20 –0.9 62.8 Fail
E 20 –0.9 1.4 Pass
Pmpp period [%] [%]
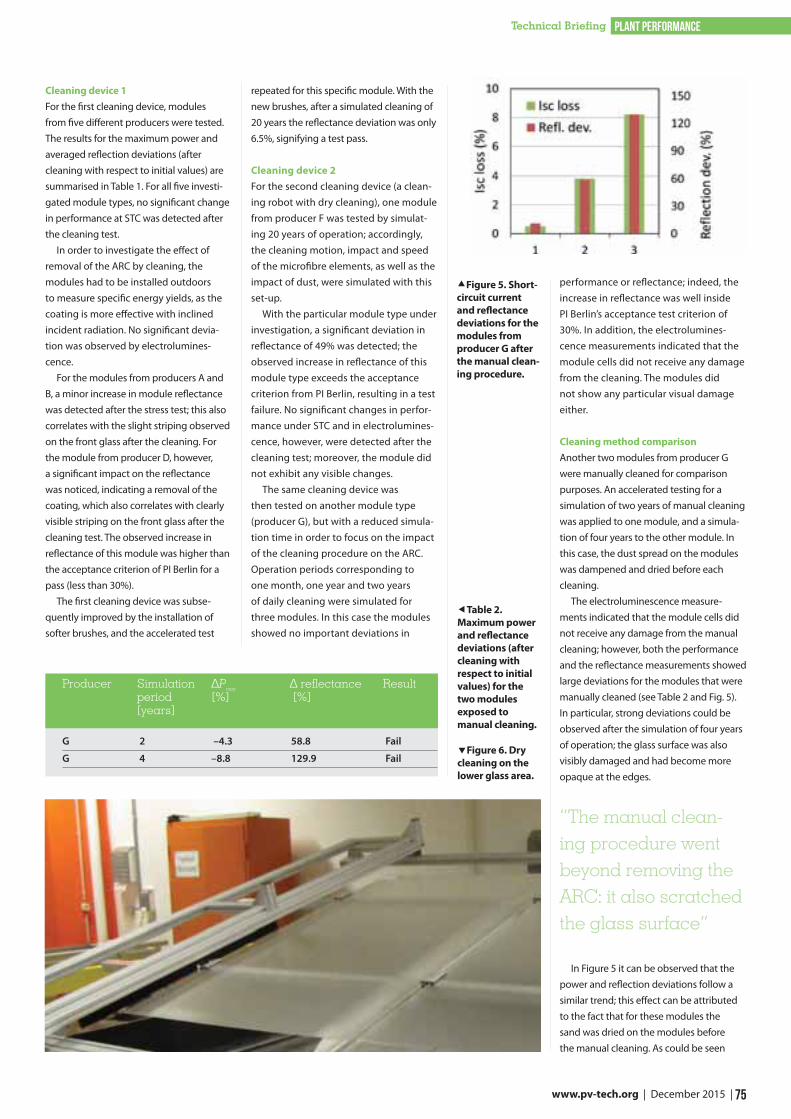
75 www.pv-tech.org | December 2015 |
plant performanceTechnical Briefing
Cleaning device 1For the first cleaning device, modules from five different producers were tested. The results for the maximum power and averaged reflection deviations (after cleaning with respect to initial values) are summarised in Table 1. For all five investi-gated module types, no significant change in performance at STC was detected after the cleaning test.
In order to investigate the effect of removal of the ARC by cleaning, the modules had to be installed outdoors to measure specific energy yields, as the coating is more effective with inclined incident radiation. No significant devia-tion was observed by electrolumines-cence.
For the modules from producers A and B, a minor increase in module reflectance was detected after the stress test; this also correlates with the slight striping observed on the front glass after the cleaning. For the module from producer D, however, a significant impact on the reflectance was noticed, indicating a removal of the coating, which also correlates with clearly visible striping on the front glass after the cleaning test. The observed increase in reflectance of this module was higher than the acceptance criterion of PI Berlin for a pass (less than 30%).
The first cleaning device was subse-quently improved by the installation of softer brushes, and the accelerated test
repeated for this specific module. With the new brushes, after a simulated cleaning of 20 years the reflectance deviation was only 6.5%, signifying a test pass.
Cleaning device 2For the second cleaning device (a clean-ing robot with dry cleaning), one module from producer F was tested by simulat-ing 20 years of operation; accordingly, the cleaning motion, impact and speed of the microfibre elements, as well as the impact of dust, were simulated with this set-up.
With the particular module type under investigation, a significant deviation in reflectance of 49% was detected; the observed increase in reflectance of this module type exceeds the acceptance criterion from PI Berlin, resulting in a test failure. No significant changes in perfor-mance under STC and in electrolumines-cence, however, were detected after the cleaning test; moreover, the module did not exhibit any visible changes.
The same cleaning device was then tested on another module type (producer G), but with a reduced simula-tion time in order to focus on the impact of the cleaning procedure on the ARC. Operation periods corresponding to one month, one year and two years of daily cleaning were simulated for three modules. In this case the modules showed no important deviations in
performance or reflectance; indeed, the increase in reflectance was well inside PI Berlin’s acceptance test criterion of 30%. In addition, the electrolumines-cence measurements indicated that the module cells did not receive any damage from the cleaning. The modules did not show any particular visual damage either.
Cleaning method comparisonAnother two modules from producer G were manually cleaned for comparison purposes. An accelerated testing for a simulation of two years of manual cleaning was applied to one module, and a simula-tion of four years to the other module. In this case, the dust spread on the modules was dampened and dried before each cleaning.
The electroluminescence measure-ments indicated that the module cells did not receive any damage from the manual cleaning; however, both the performance and the reflectance measurements showed large deviations for the modules that were manually cleaned (see Table 2 and Fig. 5). In particular, strong deviations could be observed after the simulation of four years of operation; the glass surface was also visibly damaged and had become more opaque at the edges.
“The manual clean-ing procedure went beyond removing the
In Figure 5 it can be observed that the power and reflection deviations follow a similar trend; this effect can be attributed to the fact that for these modules the sand was dried on the modules before the manual cleaning. As could be seen
Figure 5. Short-circuit current and reflectance deviations for the modules from producer G after the manual clean-ing procedure.
Table 2. Maximum power and reflectance deviations (after cleaning with respect to initial values) for the two modules exposed to manual cleaning.
Figure 6. Dry cleaning on the lower glass area.
G 2 –4.3 58.8 Fail
G 4 –8.8 129.9 Fail
Pmpp period [%] [%]
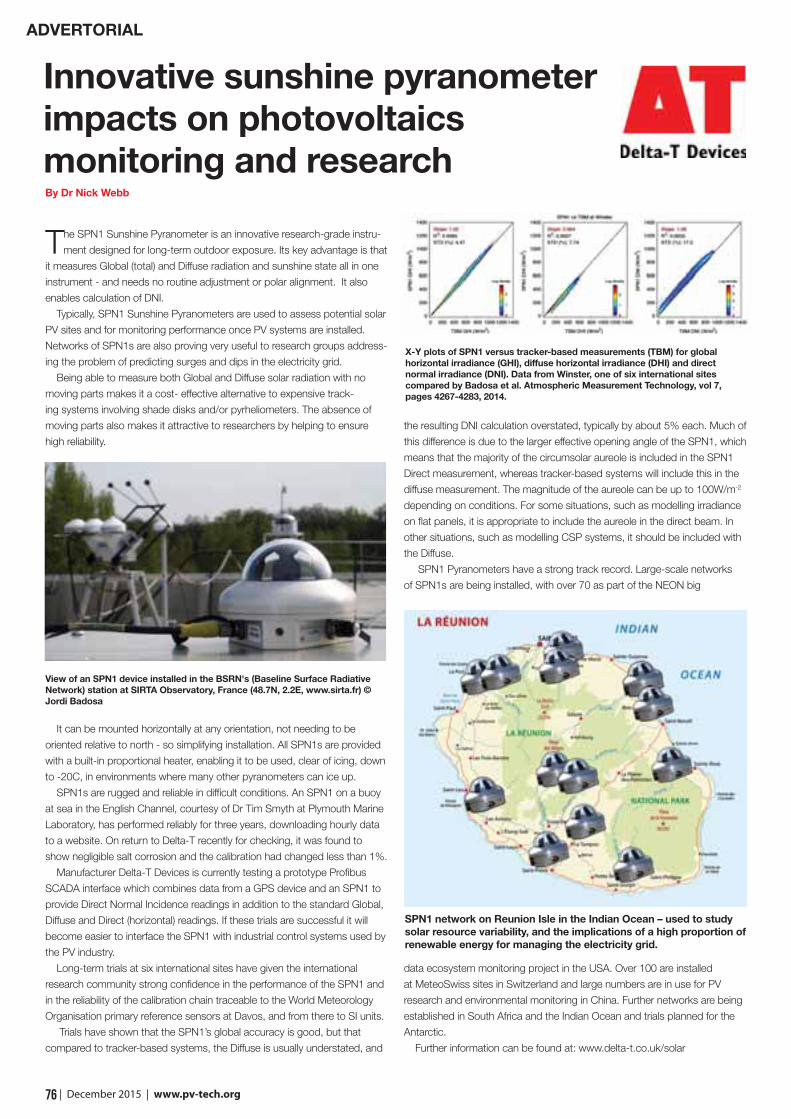
76 | December 2015 | www.pv-tech.org
The SPN1 Sunshine Pyranometer is an innovative research-grade instru-
ment designed for long-term outdoor exposure. Its key advantage is that
it measures Global (total) and Diffuse radiation and sunshine state all in one
instrument - and needs no routine adjustment or polar alignment. It also
enables calculation of DNI.
Typically, SPN1 Sunshine Pyranometers are used to assess potential solar
PV sites and for monitoring performance once PV systems are installed.
Networks of SPN1s are also proving very useful to research groups address-
ing the problem of predicting surges and dips in the electricity grid.
Being able to measure both Global and Diffuse solar radiation with no
moving parts makes it a cost- effective alternative to expensive track-
ing systems involving shade disks and/or pyrheliometers. The absence of
moving parts also makes it attractive to researchers by helping to ensure
high reliability.
It can be mounted horizontally at any orientation, not needing to be
oriented relative to north - so simplifying installation. All SPN1s are provided
with a built-in proportional heater, enabling it to be used, clear of icing, down
to -20C, in environments where many other pyranometers can ice up.
SPN1s are rugged and reliable in difficult conditions. An SPN1 on a buoy
at sea in the English Channel, courtesy of Dr Tim Smyth at Plymouth Marine
Laboratory, has performed reliably for three years, downloading hourly data
to a website. On return to Delta-T recently for checking, it was found to
show negligible salt corrosion and the calibration had changed less than 1%.
Manufacturer Delta-T Devices is currently testing a prototype Profibus
SCADA interface which combines data from a GPS device and an SPN1 to
provide Direct Normal Incidence readings in addition to the standard Global,
Diffuse and Direct (horizontal) readings. If these trials are successful it will
become easier to interface the SPN1 with industrial control systems used by
the PV industry.
Long-term trials at six international sites have given the international
research community strong confidence in the performance of the SPN1 and
in the reliability of the calibration chain traceable to the World Meteorology
Organisation primary reference sensors at Davos, and from there to SI units.
Trials have shown that the SPN1’s global accuracy is good, but that
compared to tracker-based systems, the Diffuse is usually understated, and
the resulting DNI calculation overstated, typically by about 5% each. Much of
this difference is due to the larger effective opening angle of the SPN1, which
means that the majority of the circumsolar aureole is included in the SPN1
Direct measurement, whereas tracker-based systems will include this in the
diffuse measurement. The magnitude of the aureole can be up to 100W/m-2
depending on conditions. For some situations, such as modelling irradiance
on flat panels, it is appropriate to include the aureole in the direct beam. In
other situations, such as modelling CSP systems, it should be included with
the Diffuse.
SPN1 Pyranometers have a strong track record. Large-scale networks
of SPN1s are being installed, with over 70 as part of the NEON big
data ecosystem monitoring project in the USA. Over 100 are installed
at MeteoSwiss sites in Switzerland and large numbers are in use for PV
research and environmental monitoring in China. Further networks are being
established in South Africa and the Indian Ocean and trials planned for the
Antarctic.
Further information can be found at: www.delta-t.co.uk/solar
Innovative sunshine pyranometer impacts on photovoltaics monitoring and researchBy Dr Nick Webb
View of an SPN1 device installed in the BSRN's (Baseline Surface Radiative Network) station at SIRTA Observatory, France (48.7N, 2.2E, www.sirta.fr) © Jordi Badosa
X-Y plots of SPN1 versus tracker-based measurements (TBM) for global horizontal irradiance (GHI), diffuse horizontal irradiance (DHI) and direct normal irradiance (DNI). Data from Winster, one of six international sites compared by Badosa et al. Atmospheric Measurement Technology, vol 7, pages 4267-4283, 2014.
SPN1 network on Reunion Isle in the Indian Ocean – used to study solar resource variability, and the implications of a high proportion of renewable energy for managing the electricity grid.
ADVERTORIAL

SPN1Sunshine Pyranometer
The SPN1 is a cost-effective validation tool for photovoltaic developers and trialists
• Direct and Diffuse solar radiation• No moving parts or adjustments• DNI Calculations• Sunshine Status
www.delta-t.co.uk/solar
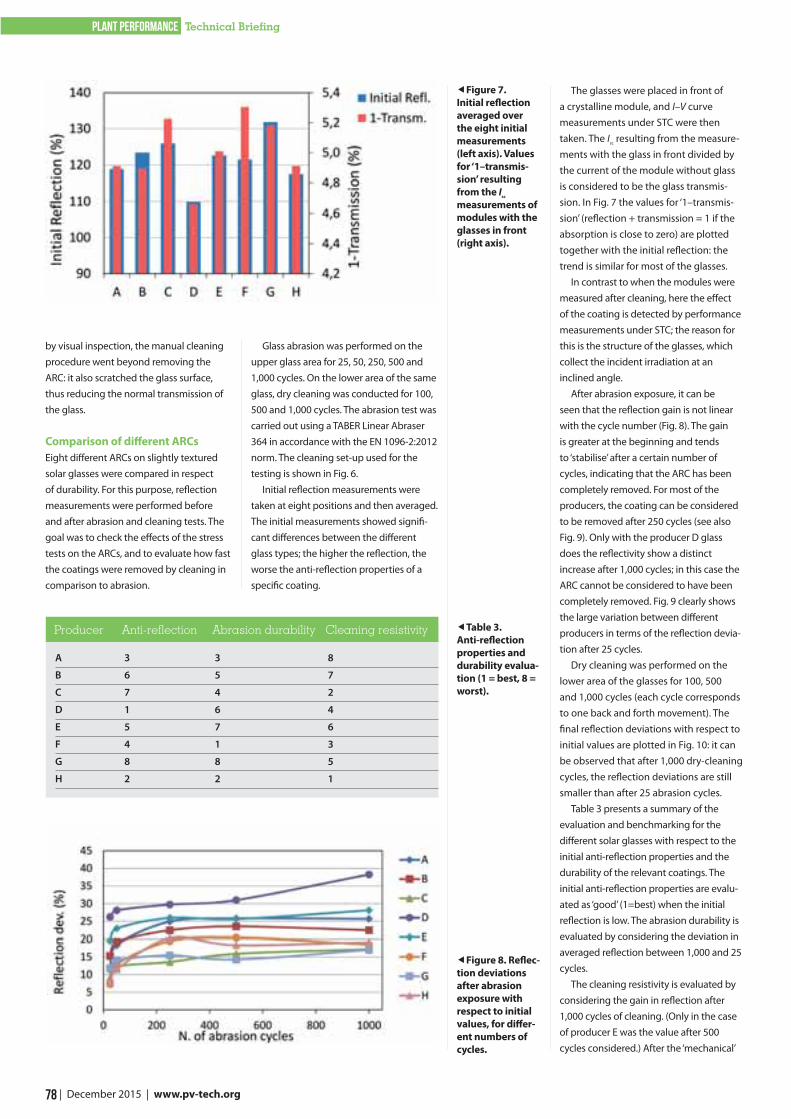
78 | December 2015 | www.pv-tech.org
plant performance Technical Briefing
by visual inspection, the manual cleaning procedure went beyond removing the ARC: it also scratched the glass surface, thus reducing the normal transmission of the glass.
Comparison of different ARCsEight different ARCs on slightly textured solar glasses were compared in respect of durability. For this purpose, reflection measurements were performed before and after abrasion and cleaning tests. The goal was to check the effects of the stress tests on the ARCs, and to evaluate how fast the coatings were removed by cleaning in comparison to abrasion.
Glass abrasion was performed on the upper glass area for 25, 50, 250, 500 and 1,000 cycles. On the lower area of the same glass, dry cleaning was conducted for 100, 500 and 1,000 cycles. The abrasion test was carried out using a TABER Linear Abraser 364 in accordance with the EN 1096-2:2012 norm. The cleaning set-up used for the testing is shown in Fig. 6.
Initial reflection measurements were taken at eight positions and then averaged. The initial measurements showed signifi-cant differences between the different glass types; the higher the reflection, the worse the anti-reflection properties of a specific coating.
The glasses were placed in front of a crystalline module, and I–V curve measurements under STC were then taken. The Isc resulting from the measure-ments with the glass in front divided by the current of the module without glass is considered to be the glass transmis-sion. In Fig. 7 the values for ‘1–transmis-sion’ (reflection + transmission = 1 if the absorption is close to zero) are plotted together with the initial reflection: the trend is similar for most of the glasses.
In contrast to when the modules were measured after cleaning, here the effect of the coating is detected by performance measurements under STC; the reason for this is the structure of the glasses, which collect the incident irradiation at an inclined angle.
After abrasion exposure, it can be seen that the reflection gain is not linear with the cycle number (Fig. 8). The gain is greater at the beginning and tends to ‘stabilise’ after a certain number of cycles, indicating that the ARC has been completely removed. For most of the producers, the coating can be considered to be removed after 250 cycles (see also Fig. 9). Only with the producer D glass does the reflectivity show a distinct increase after 1,000 cycles; in this case the ARC cannot be considered to have been completely removed. Fig. 9 clearly shows the large variation between different producers in terms of the reflection devia-tion after 25 cycles.
Dry cleaning was performed on the lower area of the glasses for 100, 500 and 1,000 cycles (each cycle corresponds to one back and forth movement). The final reflection deviations with respect to initial values are plotted in Fig. 10: it can be observed that after 1,000 dry-cleaning cycles, the reflection deviations are still smaller than after 25 abrasion cycles.
Table 3 presents a summary of the evaluation and benchmarking for the different solar glasses with respect to the initial anti-reflection properties and the durability of the relevant coatings. The initial anti-reflection properties are evalu-ated as ‘good’ (1=best) when the initial reflection is low. The abrasion durability is evaluated by considering the deviation in averaged reflection between 1,000 and 25 cycles.
The cleaning resistivity is evaluated by considering the gain in reflection after 1,000 cycles of cleaning. (Only in the case of producer E was the value after 500 cycles considered.) After the ‘mechanical’
Figure 7. Initial reflection averaged over the eight initial measurements (left axis). Values for ‘1–transmis-sion’ resulting from the Isc measurements of modules with the glasses in front (right axis).
Figure 8. Reflec-tion deviations after abrasion exposure with respect to initial values, for differ-ent numbers of cycles.
A 3 3 8
B 6 5 7
C 7 4 2
D 1 6 4
E 5 7 6
F 4 1 3
G 8 8 5
H 2 2 1
Producer Anti-reflection Abrasion durability Cleaning resistivity Table 3. Anti-reflection properties and durability evalua-tion (1 = best, 8 = worst).
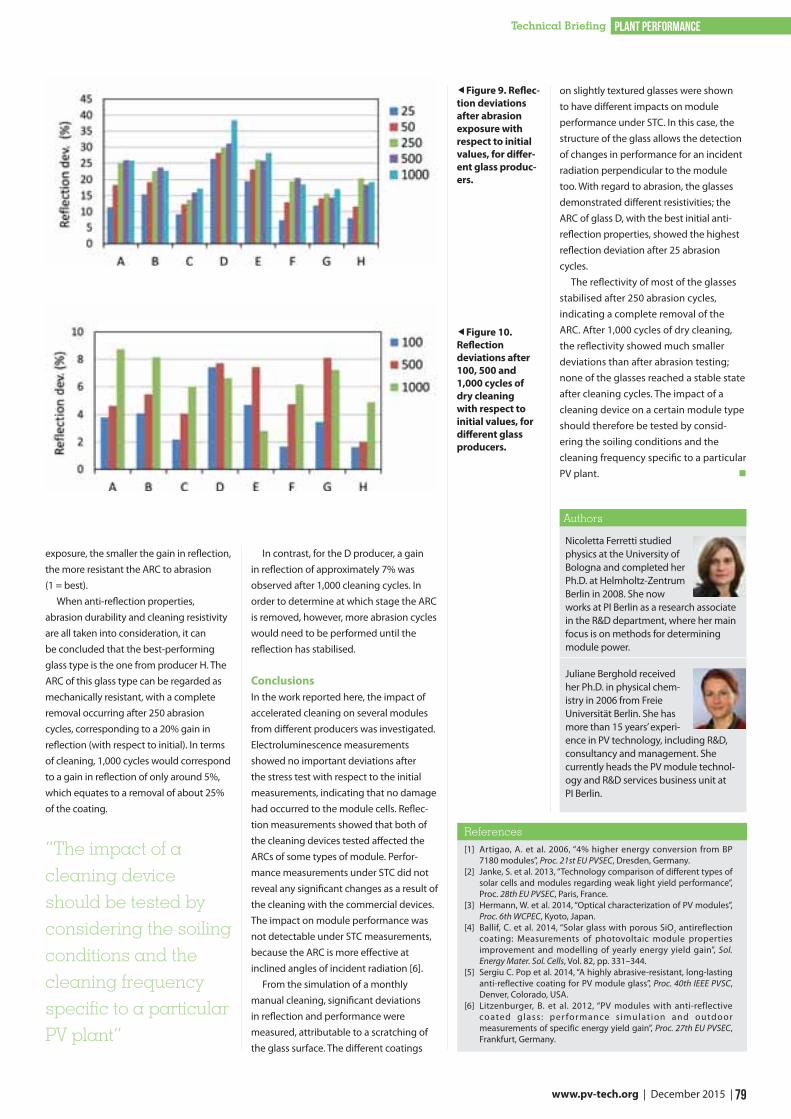
79 www.pv-tech.org | December 2015 |
plant performanceTechnical Briefing
Nicoletta Ferretti studied physics at the University of Bologna and completed her Ph.D. at Helmholtz-Zentrum Berlin in 2008. She now works at PI Berlin as a research associate in the R&D department, where her main focus is on methods for determining module power.
Juliane Berghold received her Ph.D. in physical chem-istry in 2006 from Freie Universität Berlin. She has more than 15 years’ experi-ence in PV technology, including R&D, consultancy and management. She currently heads the PV module technol-ogy and R&D services business unit at PI Berlin.
Authors
[1] Artigao, A. et al. 2006, “4% higher energy conversion from BP 7180 modules”, Proc. 21st EU PVSEC, Dresden, Germany.
[2] Janke, S. et al. 2013, “Technology comparison of different types of solar cells and modules regarding weak light yield performance”, Proc. 28th EU PVSEC, Paris, France.
[3] Hermann, W. et al. 2014, “Optical characterization of PV modules”, Proc. 6th WCPEC, Kyoto, Japan.
[4] Ballif, C. et al. 2014, “Solar glass with porous SiO2 antireflection coating: Measurements of photovoltaic module properties improvement and modelling of yearly energy yield gain”, Sol. Energy Mater. Sol. Cells, Vol. 82, pp. 331–344.
[5] Sergiu C. Pop et al. 2014, “A highly abrasive-resistant, long-lasting anti-reflective coating for PV module glass”, Proc. 40th IEEE PVSC, Denver, Colorado, USA.
[6] Litzenburger, B. et al. 2012, “PV modules with anti-reflective coated glass : per formance s imulat ion and outdoor measurements of specific energy yield gain”, Proc. 27th EU PVSEC, Frankfurt, Germany.
References
exposure, the smaller the gain in reflection, the more resistant the ARC to abrasion (1 = best).
When anti-reflection properties, abrasion durability and cleaning resistivity are all taken into consideration, it can be concluded that the best-performing glass type is the one from producer H. The ARC of this glass type can be regarded as mechanically resistant, with a complete removal occurring after 250 abrasion cycles, corresponding to a 20% gain in reflection (with respect to initial). In terms of cleaning, 1,000 cycles would correspond to a gain in reflection of only around 5%, which equates to a removal of about 25% of the coating.
“The impact of a cleaning device should be tested by considering the soiling conditions and the cleaning frequency specific to a particular PV plant”
In contrast, for the D producer, a gain in reflection of approximately 7% was observed after 1,000 cleaning cycles. In order to determine at which stage the ARC is removed, however, more abrasion cycles would need to be performed until the reflection has stabilised.
ConclusionsIn the work reported here, the impact of accelerated cleaning on several modules from different producers was investigated. Electroluminescence measurements showed no important deviations after the stress test with respect to the initial measurements, indicating that no damage had occurred to the module cells. Reflec-tion measurements showed that both of the cleaning devices tested affected the ARCs of some types of module. Perfor-mance measurements under STC did not reveal any significant changes as a result of the cleaning with the commercial devices. The impact on module performance was not detectable under STC measurements, because the ARC is more effective at inclined angles of incident radiation [6].
From the simulation of a monthly manual cleaning, significant deviations in reflection and performance were measured, attributable to a scratching of the glass surface. The different coatings
on slightly textured glasses were shown to have different impacts on module performance under STC. In this case, the structure of the glass allows the detection of changes in performance for an incident radiation perpendicular to the module too. With regard to abrasion, the glasses demonstrated different resistivities; the ARC of glass D, with the best initial anti-reflection properties, showed the highest reflection deviation after 25 abrasion cycles.
The reflectivity of most of the glasses stabilised after 250 abrasion cycles, indicating a complete removal of the ARC. After 1,000 cycles of dry cleaning, the reflectivity showed much smaller deviations than after abrasion testing; none of the glasses reached a stable state after cleaning cycles. The impact of a cleaning device on a certain module type should therefore be tested by consid-ering the soiling conditions and the cleaning frequency specific to a particular PV plant.
Figure 9. Reflec-tion deviations after abrasion exposure with respect to initial values, for differ-ent glass produc-ers.
Figure 10. Reflection deviations after 100, 500 and 1,000 cycles of dry cleaning with respect to initial values, for different glass producers.
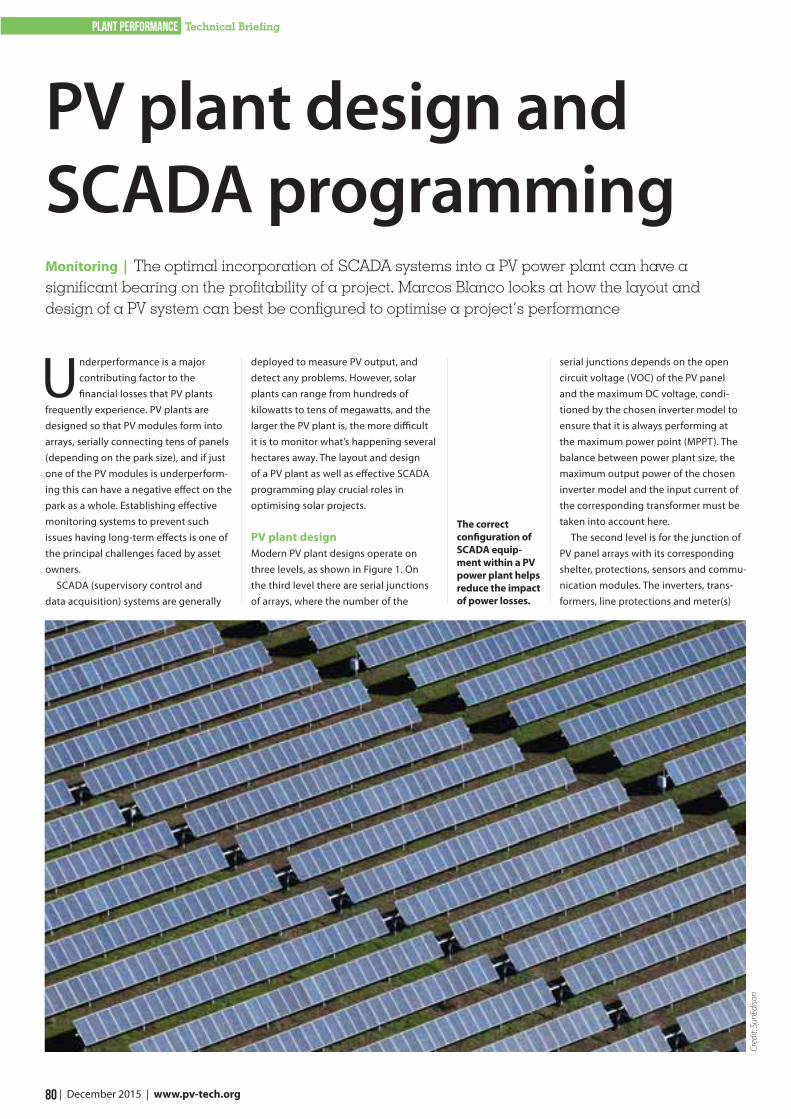
80 | December 2015 | www.pv-tech.org
plant performance Technical Briefing
Underperformance is a major contributing factor to the financial losses that PV plants
frequently experience. PV plants are designed so that PV modules form into arrays, serially connecting tens of panels (depending on the park size), and if just one of the PV modules is underperform-ing this can have a negative effect on the park as a whole. Establishing effective monitoring systems to prevent such issues having long-term effects is one of the principal challenges faced by asset owners.
SCADA (supervisory control and data acquisition) systems are generally
deployed to measure PV output, and detect any problems. However, solar plants can range from hundreds of kilowatts to tens of megawatts, and the larger the PV plant is, the more difficult it is to monitor what’s happening several hectares away. The layout and design of a PV plant as well as effective SCADA programming play crucial roles in optimising solar projects.
PV plant design Modern PV plant designs operate on three levels, as shown in Figure 1. On the third level there are serial junctions of arrays, where the number of the
serial junctions depends on the open circuit voltage (VOC) of the PV panel and the maximum DC voltage, condi-tioned by the chosen inverter model to ensure that it is always performing at the maximum power point (MPPT). The balance between power plant size, the maximum output power of the chosen inverter model and the input current of the corresponding transformer must be taken into account here.
The second level is for the junction of PV panel arrays with its corresponding shelter, protections, sensors and commu-nication modules. The inverters, trans-formers, line protections and meter(s)
PV plant design and SCADA programming
The correct configuration of SCADA equip-ment within a PV power plant helps reduce the impact of power losses.
Monitoring | The optimal incorporation of SCADA systems into a PV power plant can have a significant bearing on the profitability of a project. Marcos Blanco looks at how the layout and design of a PV system can best be configured to optimise a project’s performance
Cred
it: S
unEd
ison
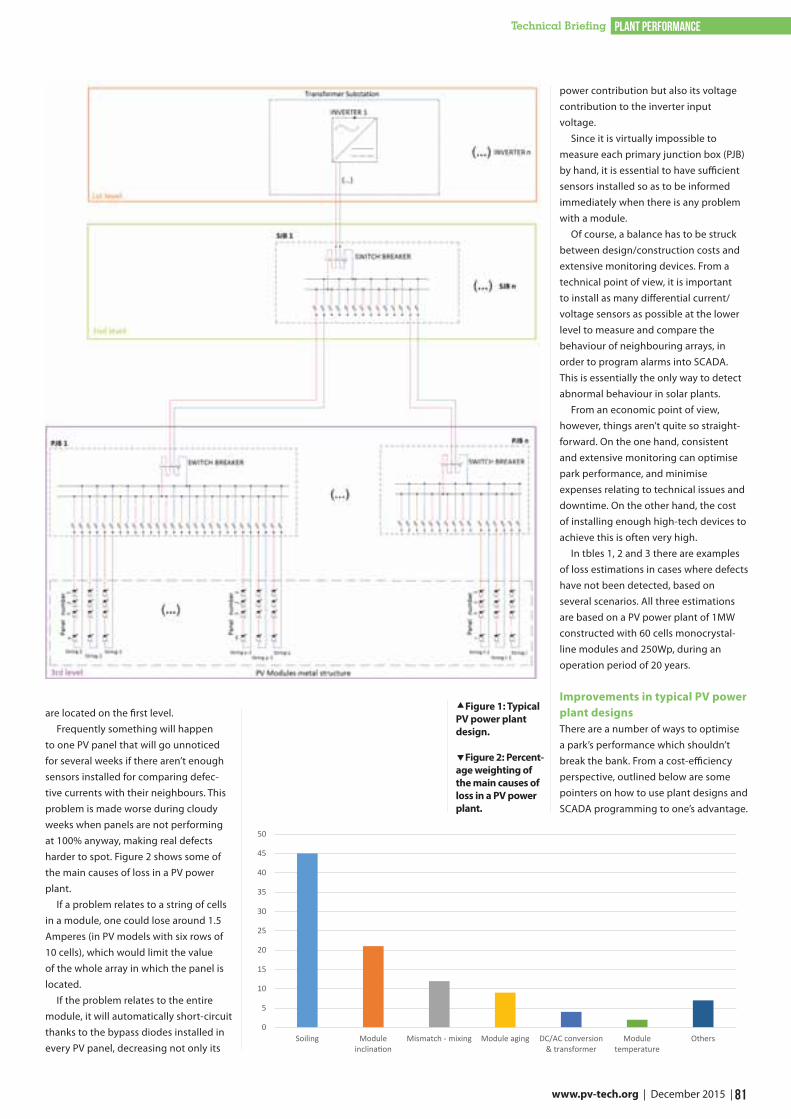
81 www.pv-tech.org | December 2015 |
plant performanceTechnical Briefing
are located on the first level. Frequently something will happen
to one PV panel that will go unnoticed for several weeks if there aren’t enough sensors installed for comparing defec-tive currents with their neighbours. This problem is made worse during cloudy weeks when panels are not performing at 100% anyway, making real defects harder to spot. Figure 2 shows some of the main causes of loss in a PV power plant.
If a problem relates to a string of cells in a module, one could lose around 1.5 Amperes (in PV models with six rows of 10 cells), which would limit the value of the whole array in which the panel is located.
If the problem relates to the entire module, it will automatically short-circuit thanks to the bypass diodes installed in every PV panel, decreasing not only its
power contribution but also its voltage contribution to the inverter input voltage.
Since it is virtually impossible to measure each primary junction box (PJB) by hand, it is essential to have sufficient sensors installed so as to be informed immediately when there is any problem with a module.
Of course, a balance has to be struck between design/construction costs and extensive monitoring devices. From a technical point of view, it is important to install as many differential current/voltage sensors as possible at the lower level to measure and compare the behaviour of neighbouring arrays, in order to program alarms into SCADA. This is essentially the only way to detect abnormal behaviour in solar plants.
From an economic point of view, however, things aren’t quite so straight-forward. On the one hand, consistent and extensive monitoring can optimise park performance, and minimise expenses relating to technical issues and downtime. On the other hand, the cost of installing enough high-tech devices to achieve this is often very high.
In tbles 1, 2 and 3 there are examples of loss estimations in cases where defects have not been detected, based on several scenarios. All three estimations are based on a PV power plant of 1MW constructed with 60 cells monocrystal-line modules and 250Wp, during an operation period of 20 years.
Improvements in typical PV power plant designs There are a number of ways to optimise a park’s performance which shouldn’t break the bank. From a cost-efficiency perspective, outlined below are some pointers on how to use plant designs and SCADA programming to one’s advantage.
Figure 1: Typical PV power plant design.
Figure 2: Percent-age weighting of the main causes of loss in a PV power plant.
0
5
10
15
20
25
30
35
40
45
50
Soiling Moduleinclina on
Mismatch - mixing Module aging DC/AC conversion& transformer
Moduletemperature
Others
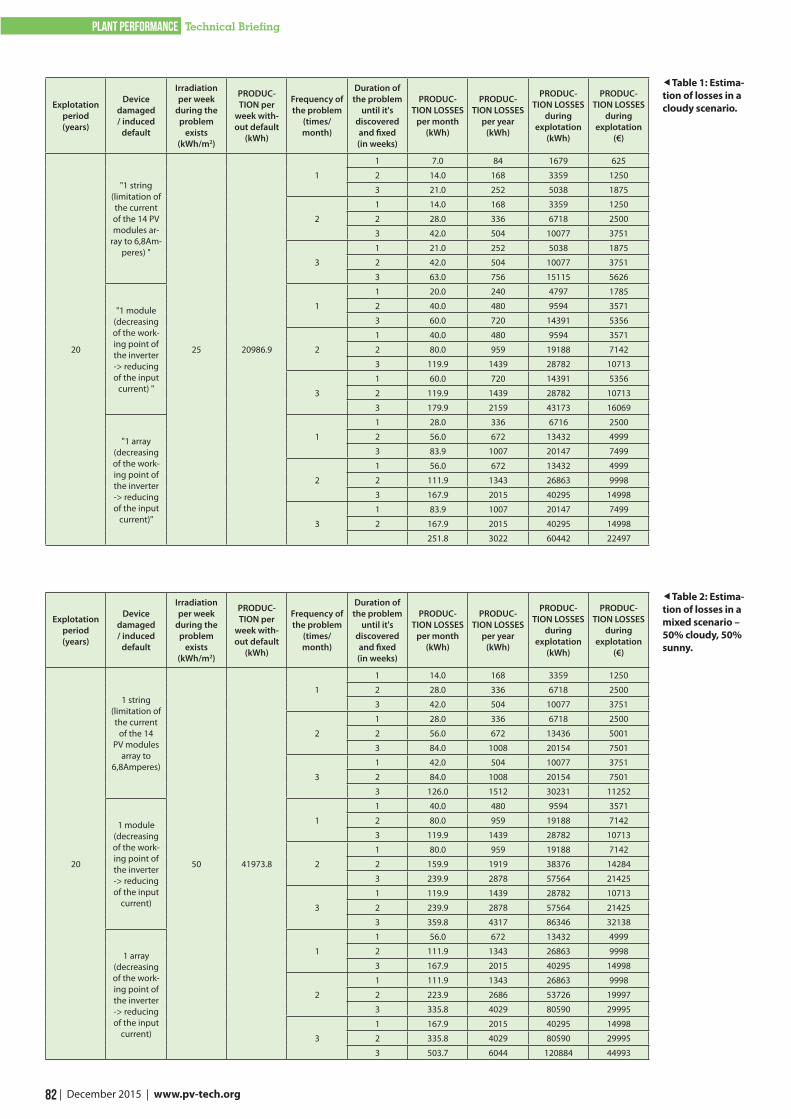
82 | December 2015 | www.pv-tech.org
plant performance Technical Briefing
Table 1: Estima-tion of losses in a cloudy scenario.
Table 2: Estima-tion of losses in a mixed scenario – 50% cloudy, 50% sunny.
Explotation period (years)
Device damaged / induced
default
Irradiation per week
during the problem
exists (kWh/m2)
PRODUC-TION per
week with-out default
(kWh)
Frequency of the problem
(times/month)
Duration of the problem
until it's discovered and fixed (in weeks)
PRODUC-TION LOSSES
per month (kWh)
PRODUC-TION LOSSES
per year (kWh)
PRODUC-TION LOSSES
during explotation
(kWh)
PRODUC-TION LOSSES
during explotation
(€)
20
"1 string (limitation of the current of the 14 PV modules ar-
ray to 6,8Am-peres) "
25 20986.9
1
1 7.0 84 1679 625
2 14.0 168 3359 1250
3 21.0 252 5038 1875
2
1 14.0 168 3359 1250
2 28.0 336 6718 2500
3 42.0 504 10077 3751
3
1 21.0 252 5038 1875
2 42.0 504 10077 3751
3 63.0 756 15115 5626
"1 module (decreasing of the work-ing point of the inverter -> reducing of the input
current) "
1
1 20.0 240 4797 1785
2 40.0 480 9594 3571
3 60.0 720 14391 5356
2
1 40.0 480 9594 3571
2 80.0 959 19188 7142
3 119.9 1439 28782 10713
3
1 60.0 720 14391 5356
2 119.9 1439 28782 10713
3 179.9 2159 43173 16069
"1 array (decreasing of the work-ing point of the inverter -> reducing of the input
current)"
1
1 28.0 336 6716 2500
2 56.0 672 13432 4999
3 83.9 1007 20147 7499
2
1 56.0 672 13432 4999
2 111.9 1343 26863 9998
3 167.9 2015 40295 14998
3
1 83.9 1007 20147 7499
2 167.9 2015 40295 14998
251.8 3022 60442 22497
Explotation period (years)
Device damaged / induced
default
Irradiation per week
during the problem
exists (kWh/m2)
PRODUC-TION per
week with-out default
(kWh)
Frequency of the problem
(times/month)
Duration of the problem
until it's discovered and fixed (in weeks)
PRODUC-TION LOSSES
per month (kWh)
PRODUC-TION LOSSES
per year (kWh)
PRODUC-TION LOSSES
during explotation
(kWh)
PRODUC-TION LOSSES
during explotation
(€)
20
1 string (limitation of the current
of the 14 PV modules
array to 6,8Amperes)
50 41973.8
1
1 14.0 168 3359 1250
2 28.0 336 6718 2500
3 42.0 504 10077 3751
2
1 28.0 336 6718 2500
2 56.0 672 13436 5001
3 84.0 1008 20154 7501
3
1 42.0 504 10077 3751
2 84.0 1008 20154 7501
3 126.0 1512 30231 11252
1 module (decreasing of the work-ing point of the inverter -> reducing of the input
current)
1
1 40.0 480 9594 3571
2 80.0 959 19188 7142
3 119.9 1439 28782 10713
2
1 80.0 959 19188 7142
2 159.9 1919 38376 14284
3 239.9 2878 57564 21425
3
1 119.9 1439 28782 10713
2 239.9 2878 57564 21425
3 359.8 4317 86346 32138
1 array (decreasing of the work-ing point of the inverter -> reducing of the input
current)
1
1 56.0 672 13432 4999
2 111.9 1343 26863 9998
3 167.9 2015 40295 14998
2
1 111.9 1343 26863 9998
2 223.9 2686 53726 19997
3 335.8 4029 80590 29995
3
1 167.9 2015 40295 14998
2 335.8 4029 80590 29995
3 503.7 6044 120884 44993
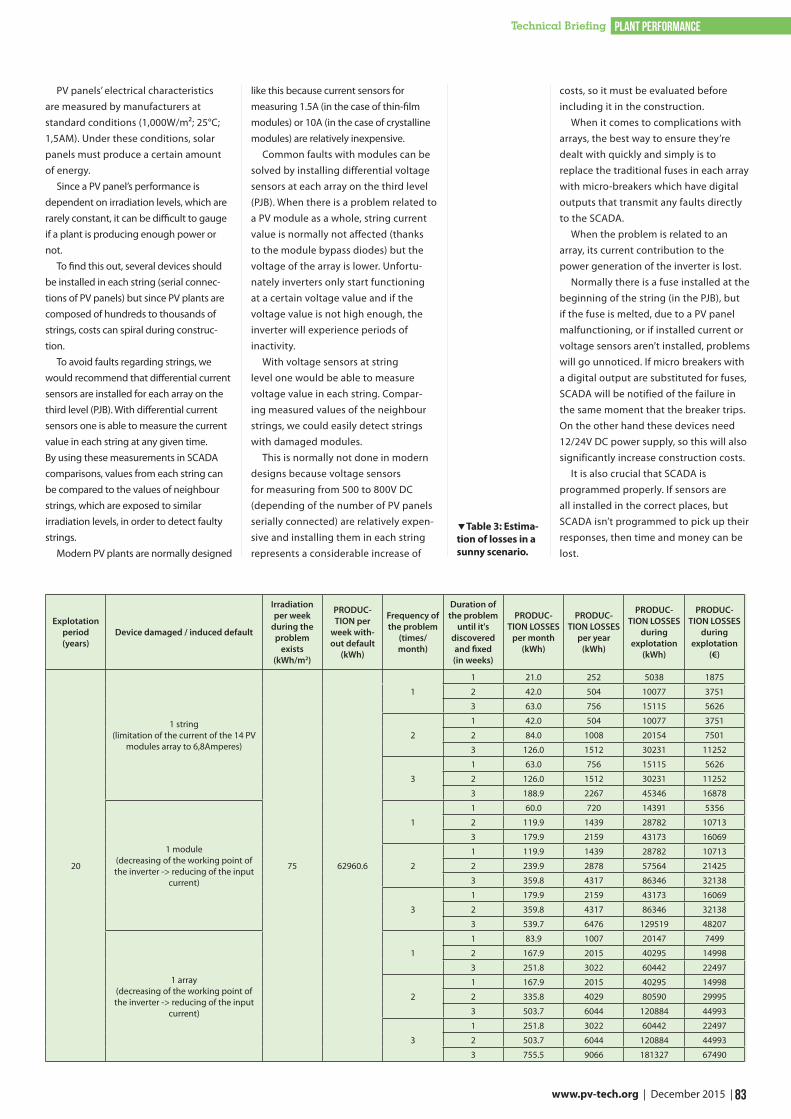
83 www.pv-tech.org | December 2015 |
plant performanceTechnical Briefing
PV panels’ electrical characteristics are measured by manufacturers at standard conditions (1,000W/m²; 25°C; 1,5AM). Under these conditions, solar panels must produce a certain amount of energy.
Since a PV panel’s performance is dependent on irradiation levels, which are rarely constant, it can be difficult to gauge if a plant is producing enough power or not.
To find this out, several devices should be installed in each string (serial connec-tions of PV panels) but since PV plants are composed of hundreds to thousands of strings, costs can spiral during construc-tion.
To avoid faults regarding strings, we would recommend that differential current sensors are installed for each array on the third level (PJB). With differential current sensors one is able to measure the current value in each string at any given time. By using these measurements in SCADA comparisons, values from each string can be compared to the values of neighbour strings, which are exposed to similar irradiation levels, in order to detect faulty strings.
Modern PV plants are normally designed
like this because current sensors for measuring 1.5A (in the case of thin-film modules) or 10A (in the case of crystalline modules) are relatively inexpensive.
Common faults with modules can be solved by installing differential voltage sensors at each array on the third level (PJB). When there is a problem related to a PV module as a whole, string current value is normally not affected (thanks to the module bypass diodes) but the voltage of the array is lower. Unfortu-nately inverters only start functioning at a certain voltage value and if the voltage value is not high enough, the inverter will experience periods of inactivity.
With voltage sensors at string level one would be able to measure voltage value in each string. Compar-ing measured values of the neighbour strings, we could easily detect strings with damaged modules.
This is normally not done in modern designs because voltage sensors for measuring from 500 to 800V DC (depending of the number of PV panels serially connected) are relatively expen-sive and installing them in each string represents a considerable increase of
costs, so it must be evaluated before including it in the construction.
When it comes to complications with arrays, the best way to ensure they’re dealt with quickly and simply is to replace the traditional fuses in each array with micro-breakers which have digital outputs that transmit any faults directly to the SCADA.
When the problem is related to an array, its current contribution to the power generation of the inverter is lost.
Normally there is a fuse installed at the beginning of the string (in the PJB), but if the fuse is melted, due to a PV panel malfunctioning, or if installed current or voltage sensors aren’t installed, problems will go unnoticed. If micro breakers with a digital output are substituted for fuses, SCADA will be notified of the failure in the same moment that the breaker trips. On the other hand these devices need 12/24V DC power supply, so this will also significantly increase construction costs.
It is also crucial that SCADA is programmed properly. If sensors are all installed in the correct places, but SCADA isn’t programmed to pick up their responses, then time and money can be lost.
Explotation period (years)
Device damaged / induced default
Irradiation per week
during the problem
exists (kWh/m2)
PRODUC-TION per
week with-out default
(kWh)
Frequency of the problem
(times/month)
Duration of the problem
until it's discovered and fixed (in weeks)
PRODUC-TION LOSSES
per month (kWh)
PRODUC-TION LOSSES
per year (kWh)
PRODUC-TION LOSSES
during explotation
(kWh)
PRODUC-TION LOSSES
during explotation
(€)
20
1 string (limitation of the current of the 14 PV
modules array to 6,8Amperes)
75 62960.6
1
1 21.0 252 5038 1875
2 42.0 504 10077 3751
3 63.0 756 15115 5626
2
1 42.0 504 10077 3751
2 84.0 1008 20154 7501
3 126.0 1512 30231 11252
3
1 63.0 756 15115 5626
2 126.0 1512 30231 11252
3 188.9 2267 45346 16878
1 module (decreasing of the working point of the inverter -> reducing of the input
current)
1
1 60.0 720 14391 5356
2 119.9 1439 28782 10713
3 179.9 2159 43173 16069
2
1 119.9 1439 28782 10713
2 239.9 2878 57564 21425
3 359.8 4317 86346 32138
3
1 179.9 2159 43173 16069
2 359.8 4317 86346 32138
3 539.7 6476 129519 48207
1 array (decreasing of the working point of the inverter -> reducing of the input
current)
1
1 83.9 1007 20147 7499
2 167.9 2015 40295 14998
3 251.8 3022 60442 22497
2
1 167.9 2015 40295 14998
2 335.8 4029 80590 29995
3 503.7 6044 120884 44993
3
1 251.8 3022 60442 22497
2 503.7 6044 120884 44993
3 755.5 9066 181327 67490
Table 3: Estima-tion of losses in a sunny scenario.
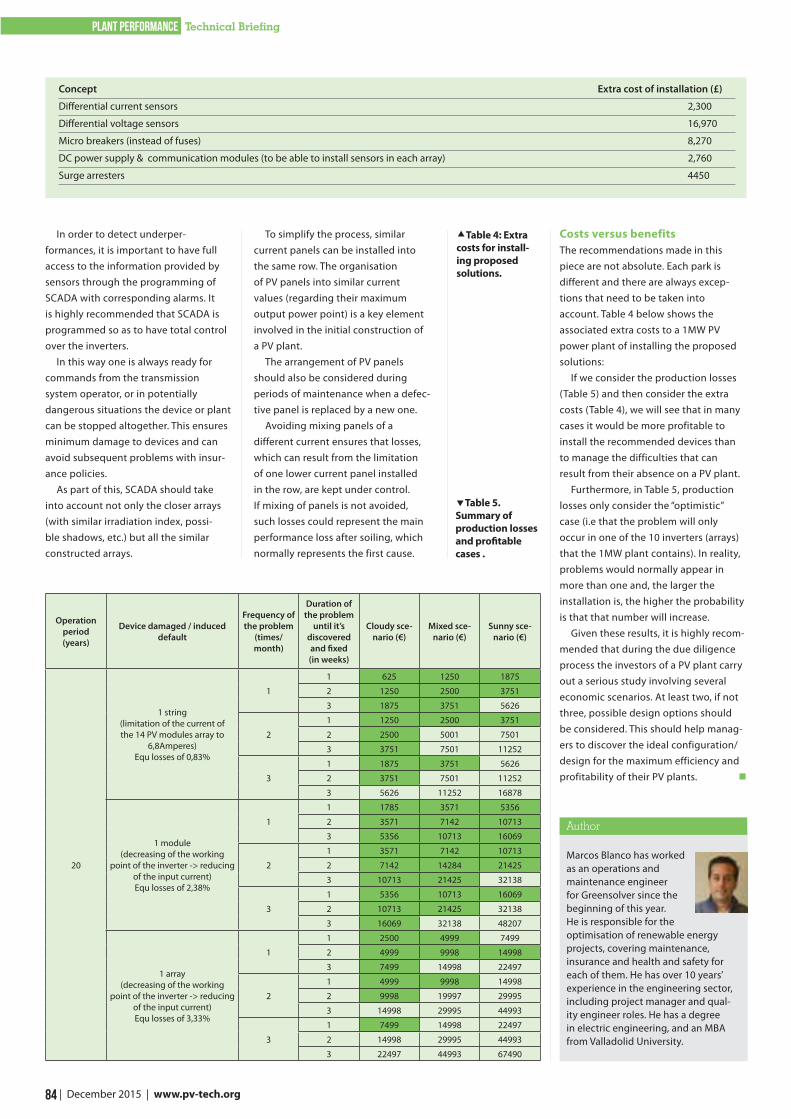
84 | December 2015 | www.pv-tech.org
plant performance Technical Briefing
Table 5. Summary of production losses and profitable cases .
Concept Extra cost of installation (£)
Differential current sensors 2,300
Differential voltage sensors 16,970
Micro breakers (instead of fuses) 8,270
DC power supply & communication modules (to be able to install sensors in each array) 2,760
Surge arresters 4450
Table 4: Extra costs for install-ing proposed solutions.
Marcos Blanco has worked as an operations and maintenance engineer for Greensolver since the beginning of this year. He is responsible for the optimisation of renewable energy projects, covering maintenance, insurance and health and safety for each of them. He has over 10 years’ experience in the engineering sector, including project manager and qual-ity engineer roles. He has a degree in electric engineering, and an MBA from Valladolid University.
Author
To simplify the process, similar current panels can be installed into the same row. The organisation of PV panels into similar current values (regarding their maximum output power point) is a key element involved in the initial construction of a PV plant.
The arrangement of PV panels should also be considered during periods of maintenance when a defec-tive panel is replaced by a new one.
Avoiding mixing panels of a different current ensures that losses, which can result from the limitation of one lower current panel installed in the row, are kept under control. If mixing of panels is not avoided, such losses could represent the main performance loss after soiling, which normally represents the first cause.
In order to detect underper-formances, it is important to have full access to the information provided by sensors through the programming of SCADA with corresponding alarms. It is highly recommended that SCADA is programmed so as to have total control over the inverters.
In this way one is always ready for commands from the transmission system operator, or in potentially dangerous situations the device or plant can be stopped altogether. This ensures minimum damage to devices and can avoid subsequent problems with insur-ance policies.
As part of this, SCADA should take into account not only the closer arrays (with similar irradiation index, possi-ble shadows, etc.) but all the similar constructed arrays.
Costs versus benefitsThe recommendations made in this piece are not absolute. Each park is different and there are always excep-tions that need to be taken into account. Table 4 below shows the associated extra costs to a 1MW PV power plant of installing the proposed solutions:
If we consider the production losses (Table 5) and then consider the extra costs (Table 4), we will see that in many cases it would be more profitable to install the recommended devices than to manage the difficulties that can result from their absence on a PV plant.
Furthermore, in Table 5, production losses only consider the “optimistic” case (i.e that the problem will only occur in one of the 10 inverters (arrays) that the 1MW plant contains). In reality, problems would normally appear in more than one and, the larger the installation is, the higher the probability is that that number will increase.
Given these results, it is highly recom-mended that during the due diligence process the investors of a PV plant carry out a serious study involving several economic scenarios. At least two, if not three, possible design options should be considered. This should help manag-ers to discover the ideal configuration/design for the maximum efficiency and profitability of their PV plants.
Operation period (years)
Device damaged / induced default
Frequency of the problem
(times/month)
Duration of the problem
until it’s discovered and fixed (in weeks)
Cloudy sce-nario (€)
Mixed sce-nario (€)
Sunny sce-nario (€)
20
1 string (limitation of the current of the 14 PV modules array to
6,8Amperes) Equ losses of 0,83%
1
1 625 1250 1875
2 1250 2500 3751
3 1875 3751 5626
2
1 1250 2500 3751
2 2500 5001 7501
3 3751 7501 11252
3
1 1875 3751 5626
2 3751 7501 11252
3 5626 11252 16878
1 module (decreasing of the working
point of the inverter -> reducing of the input current)Equ losses of 2,38%
1
1 1785 3571 5356
2 3571 7142 10713
3 5356 10713 16069
2
1 3571 7142 10713
2 7142 14284 21425
3 10713 21425 32138
3
1 5356 10713 16069
2 10713 21425 32138
3 16069 32138 48207
1 array (decreasing of the working
point of the inverter -> reducing of the input current)Equ losses of 3,33%
1
1 2500 4999 7499
2 4999 9998 14998
3 7499 14998 22497
2
1 4999 9998 14998
2 9998 19997 29995
3 14998 29995 44993
3
1 7499 14998 22497
2 14998 29995 44993
3 22497 44993 67490
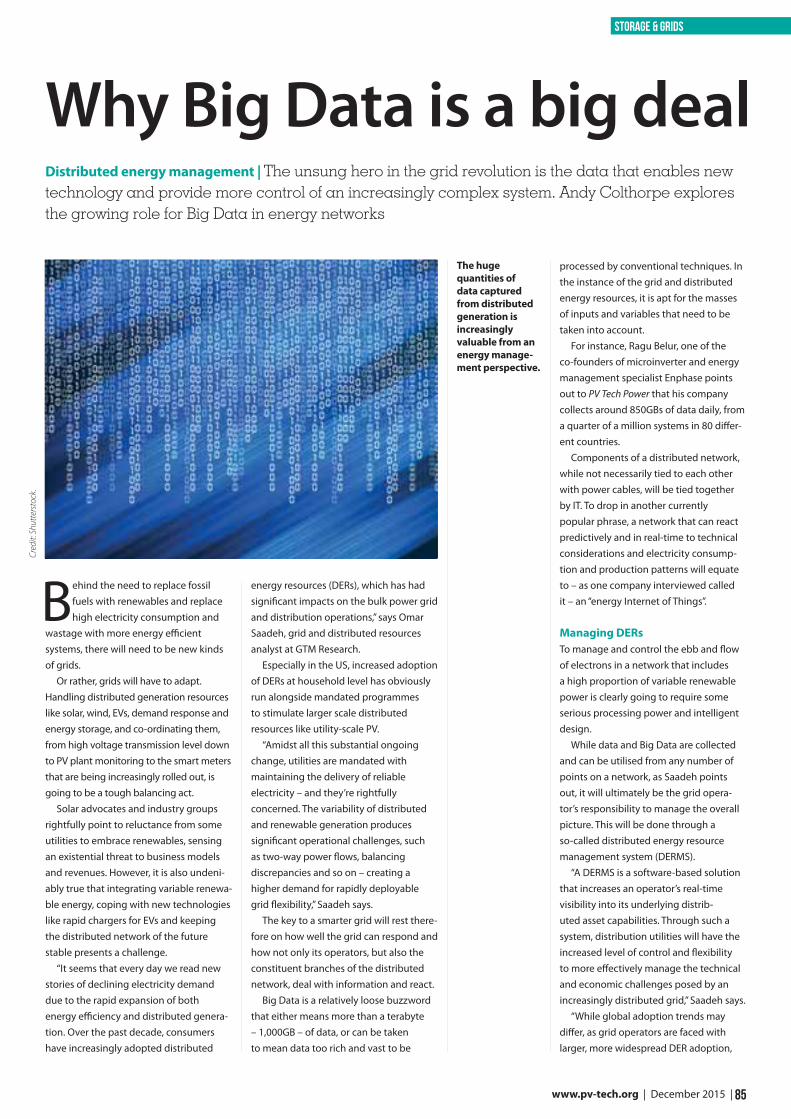
85 www.pv-tech.org | December 2015 |
storage & grids
Behind the need to replace fossil fuels with renewables and replace high electricity consumption and
wastage with more energy efficient systems, there will need to be new kinds of grids.
Or rather, grids will have to adapt. Handling distributed generation resources like solar, wind, EVs, demand response and energy storage, and co-ordinating them, from high voltage transmission level down to PV plant monitoring to the smart meters that are being increasingly rolled out, is going to be a tough balancing act.
Solar advocates and industry groups rightfully point to reluctance from some utilities to embrace renewables, sensing an existential threat to business models and revenues. However, it is also undeni-ably true that integrating variable renewa-ble energy, coping with new technologies like rapid chargers for EVs and keeping the distributed network of the future stable presents a challenge.
“It seems that every day we read new stories of declining electricity demand due to the rapid expansion of both energy efficiency and distributed genera-tion. Over the past decade, consumers have increasingly adopted distributed
energy resources (DERs), which has had significant impacts on the bulk power grid and distribution operations,” says Omar Saadeh, grid and distributed resources analyst at GTM Research.
Especially in the US, increased adoption of DERs at household level has obviously run alongside mandated programmes to stimulate larger scale distributed resources like utility-scale PV.
“Amidst all this substantial ongoing change, utilities are mandated with maintaining the delivery of reliable electricity – and they’re rightfully concerned. The variability of distributed and renewable generation produces significant operational challenges, such as two-way power flows, balancing discrepancies and so on – creating a higher demand for rapidly deployable grid flexibility,” Saadeh says.
The key to a smarter grid will rest there-fore on how well the grid can respond and how not only its operators, but also the constituent branches of the distributed network, deal with information and react.
Big Data is a relatively loose buzzword that either means more than a terabyte – 1,000GB – of data, or can be taken to mean data too rich and vast to be
processed by conventional techniques. In the instance of the grid and distributed energy resources, it is apt for the masses of inputs and variables that need to be taken into account.
For instance, Ragu Belur, one of the co-founders of microinverter and energy management specialist Enphase points out to PV Tech Power that his company collects around 850GBs of data daily, from a quarter of a million systems in 80 differ-ent countries.
Components of a distributed network, while not necessarily tied to each other with power cables, will be tied together by IT. To drop in another currently popular phrase, a network that can react predictively and in real-time to technical considerations and electricity consump-tion and production patterns will equate to – as one company interviewed called it – an “energy Internet of Things”.
Managing DERsTo manage and control the ebb and flow of electrons in a network that includes a high proportion of variable renewable power is clearly going to require some serious processing power and intelligent design.
While data and Big Data are collected and can be utilised from any number of points on a network, as Saadeh points out, it will ultimately be the grid opera-tor’s responsibility to manage the overall picture. This will be done through a so-called distributed energy resource management system (DERMS).
“A DERMS is a software-based solution that increases an operator’s real-time visibility into its underlying distrib-uted asset capabilities. Through such a system, distribution utilities will have the increased level of control and flexibility to more effectively manage the technical and economic challenges posed by an increasingly distributed grid,” Saadeh says.
“While global adoption trends may differ, as grid operators are faced with larger, more widespread DER adoption,
Distributed energy management | The unsung hero in the grid revolution is the data that enables new technology and provide more control of an increasingly complex system. Andy Colthorpe explores the growing role for Big Data in energy networks
Why Big Data is a big dealCr
edit:
Shu
tter
stoc
k.
The huge quantities of data captured from distributed generation is increasingly valuable from an energy manage-ment perspective.
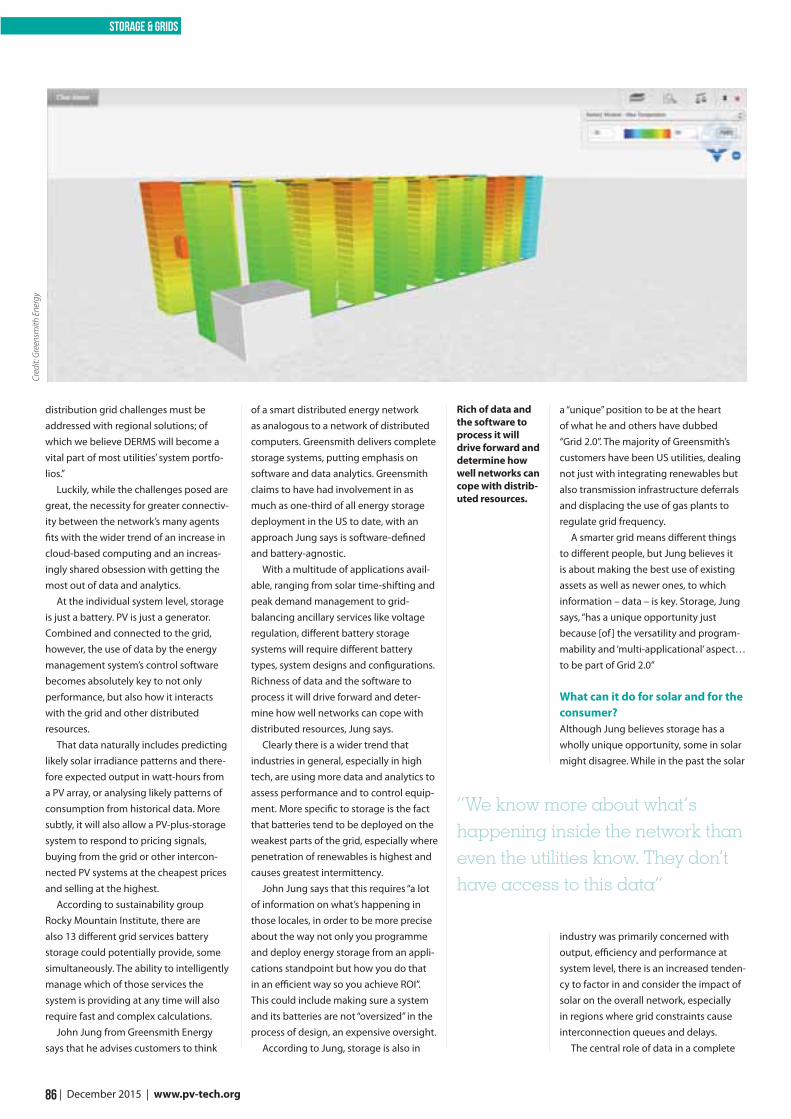
86 | December 2015 | www.pv-tech.org
storage & grids
distribution grid challenges must be addressed with regional solutions; of which we believe DERMS will become a vital part of most utilities’ system portfo-lios.”
Luckily, while the challenges posed are great, the necessity for greater connectiv-ity between the network’s many agents fits with the wider trend of an increase in cloud-based computing and an increas-ingly shared obsession with getting the most out of data and analytics.
At the individual system level, storage is just a battery. PV is just a generator. Combined and connected to the grid, however, the use of data by the energy management system’s control software becomes absolutely key to not only performance, but also how it interacts with the grid and other distributed resources.
That data naturally includes predicting likely solar irradiance patterns and there-fore expected output in watt-hours from a PV array, or analysing likely patterns of consumption from historical data. More subtly, it will also allow a PV-plus-storage system to respond to pricing signals, buying from the grid or other intercon-nected PV systems at the cheapest prices and selling at the highest.
According to sustainability group Rocky Mountain Institute, there are also 13 different grid services battery storage could potentially provide, some simultaneously. The ability to intelligently manage which of those services the system is providing at any time will also require fast and complex calculations.
John Jung from Greensmith Energy says that he advises customers to think
of a smart distributed energy network as analogous to a network of distributed computers. Greensmith delivers complete storage systems, putting emphasis on software and data analytics. Greensmith claims to have had involvement in as much as one-third of all energy storage deployment in the US to date, with an approach Jung says is software-defined and battery-agnostic.
With a multitude of applications avail-able, ranging from solar time-shifting and peak demand management to grid-balancing ancillary services like voltage regulation, different battery storage systems will require different battery types, system designs and configurations. Richness of data and the software to process it will drive forward and deter-mine how well networks can cope with distributed resources, Jung says.
Clearly there is a wider trend that industries in general, especially in high tech, are using more data and analytics to assess performance and to control equip-ment. More specific to storage is the fact that batteries tend to be deployed on the weakest parts of the grid, especially where penetration of renewables is highest and causes greatest intermittency.
John Jung says that this requires “a lot of information on what’s happening in those locales, in order to be more precise about the way not only you programme and deploy energy storage from an appli-cations standpoint but how you do that in an efficient way so you achieve ROI”. This could include making sure a system and its batteries are not “oversized” in the process of design, an expensive oversight.
According to Jung, storage is also in
a “unique” position to be at the heart of what he and others have dubbed “Grid 2.0”. The majority of Greensmith’s customers have been US utilities, dealing not just with integrating renewables but also transmission infrastructure deferrals and displacing the use of gas plants to regulate grid frequency.
A smarter grid means different things to different people, but Jung believes it is about making the best use of existing assets as well as newer ones, to which information – data – is key. Storage, Jung says, “has a unique opportunity just because [of ] the versatility and program-mability and ‘multi-applicational’ aspect…to be part of Grid 2.0”
What can it do for solar and for the consumer?Although Jung believes storage has a wholly unique opportunity, some in solar might disagree. While in the past the solar
industry was primarily concerned with output, efficiency and performance at system level, there is an increased tenden-cy to factor in and consider the impact of solar on the overall network, especially in regions where grid constraints cause interconnection queues and delays.
The central role of data in a complete
Cred
it: G
reen
smith
Ene
rgy
Rich of data and the software to process it will drive forward and determine how well networks can cope with distrib-uted resources.
“We know more about what’s happening inside the network than even the utilities know. They don’t have access to this data”
87 www.pv-tech.org | December 2015 |
storage & grids
stage industry such as storage, where designing and building a new system from scratch could be prohibitively expensive. Using software to customise projects by feeding in different variables and metrics from a vast range available to a scalable platform could save projects money, Jung claims.
The scaling effect works both ways too. Mark Chew, who specialises in analyt-ics for the Internet of Things at Big Data analysis and response company Autogrid, tells PV Tech Power that the recent success of large-scale solar has driven down the cost and grown the feasibility of distrib-uted generation as a whole.
Autogrid, headquartered in the US but also active in Asia and Europe, analyses big data in energy networks and provides tailored solutions for customers that include big utilities, recently worked on what it and its partner, the energy producer and supplier Eneco in Holland, described as “the world’s first software-defined power plant”.
This new type of “virtual power plant” (VPP) integrates multiple distrib-uted resources, adding up to 100MW of dispatchable resources including CHP and industrial demand response to Eneco’s
energy system of the type offered by Enphase and others – solar, storage, inverter (or micro-inverters) and a software-defined control and manage-ment system – means the solar industry could be well-positioned too.
“Data as it relates to renewables – it is one tool to help in the integration of DG with the grid itself. The grid was not designed for this. Now for the first time, not only do we have generation occurring at the end nodes, in the distribution and transmission lines, but generation is now heading back into the grid,” Paul Nahi, Enphase’s CEO, says.
“The ability for renewables to actually add to grid stability is what I think is being missed by most individuals.”
Nahi says the usefulness of data collected by micro-inverters and other parts of a solar energy system at all scales could help smash a common perception that adding diverse distributed genera-tion resources means losing visibility of what is going on in the network, versus a few centrally located, centrally dispatched assets like coal and nuclear.
“The reality is that now, with those solar assets out there, we can leverage those assets to monitor the grid. Remember, in most cases we know more about what’s happening inside the network, in the distribution and transmission lines than even the utilities know. They don’t have access to this data.”
An example Nahi cited was Enphase’s remote upgrading of some 800,000 micro-inverters on Hawaiian PV systems at the beginning of this year. To make the systems comply with new grid protocols and therefore clear an interconnection backlog for thousands of new custom-ers, Enphase was changing settings on devices in the field from its offices, Nahi says, “almost literally at the push of a button”.
Software and scalabilityNahi of Enphase and Jung of Greensmith would likely agree that the scalability of software-based solutions to network problems is one of its strongest suits. Jung claims Greensmith’s software teams “pump out new algorithms” every month. Around half of the company’s engineers come from industries such as telecoms and cloud computing, versed in dealing with the increased importance of issues like cyber-security that are more commonly associated with IT than energy.
Ability to scale is critical in an early-
portfolio. It has been built on Autogrid’s Predictive Controls platform, and will help integrate renewables, partly because its capability to respond to pricing signals from the Dutch transmission system operator’s wholesale markets will help pay balancing costs.
“For years utilities have done forecast-ing, optimisation to different degrees and different types of control,” Chew says.
“What’s changed about what they need is that where they used to be dispatching a relatively small number of resources to a large load, now utilities need to do all of that forecasting, optimi-sation and control, in real-time and at scale, so the number of calculations has increased by orders of magnitude.”
Aggregating and managing DG from control centres works out very economi-cally, according to Chew.
“The cost to put in a VPP, software that can dispatch and control distributed resources as if they were conventional generation, is a fraction of the cost of building a new power plant, or putting in peaker plants. Plus the utility doesn’t have to buy new hardware, they can use scalable cloud-based solutions, there are no emissions [and] they have it distrib-uted across their grid so it’s not limited to one place.”
Grid 2.0 and the new value chainThe role of data in the creation of tomor-row’s energy networks will be a central one. One project started up in June in Cologne, Germany, will use Internet of Things analytics to support what AGT, an IoT specialist and one of the five-year project’s participants, called “the building and running of low energy neighbour-hoods”. Using IoT data and analytics to inform civic planners as well as grid and energy asset operators about their networks could lead to a reduction in primary energy consumption of as much as 60%, reduce emissions by a similar amount and get the city’s proportion of energy sourced from renewables also up to 60% by 2020. Two other European cities, Barcelona and Stockholm, have also been chosen for the EU project.
Solar, storage, smart meters, thermo-stats, demand response and your car, anything you can think of behind and in front of the meter will be defined not just on how well it performs, but also how well it informs and interacts with the rest of the network. Big Data is going to be huge.
Greater visibility into networks is likely to enable better understanding of consumer behaviour, as well as technical aspects of the grid and distributed energy resources. For instance, vice president of engineering for smart meter and analytics software company Tendril, Jake Meier, told PV Tech Power that richer insights based on Big Data could be used for marketing, adding extra levels of customer engagement.
However, one obvious danger is privacy and security. The laws regulating both vary hugely from region to region but in general, Meier says, companies that deal with Big Data and analytics have to take security “ridiculously seriously”.
Meier says Tendril, and its competitors, “follow industry best practises at securing people’s information. Things like encrypting data at rest, so if a hacker got in, our data stores would still be encrypted. They wouldn’t be able to tie anything they found unencrypted back to any individual household.”
The other potential pitfall is human error, what Meier calls the “security practices and policies around the people that have access to that data”. Training not to inadvertently give away sensitive information is often overlooked. Tendril and other companies coming from more traditionally IT-linked sectors could be well placed to help.
“[Security and privacy] come as second nature to anyone who’s ever worked with consumer data before. We live, eat and breathe this stuff, whereas utilities are more used to thinking about electrons and physical security, not about cybersecurity.”
Another challenging aspect of connecting so many devices and systems together, apart from the obvious concerns of security and privacy, is compatibility. Devices from a broad range of manufacturers will have to be incorporated into networks, requiring either open standards or case-by-case compliance work.
Privacy and security
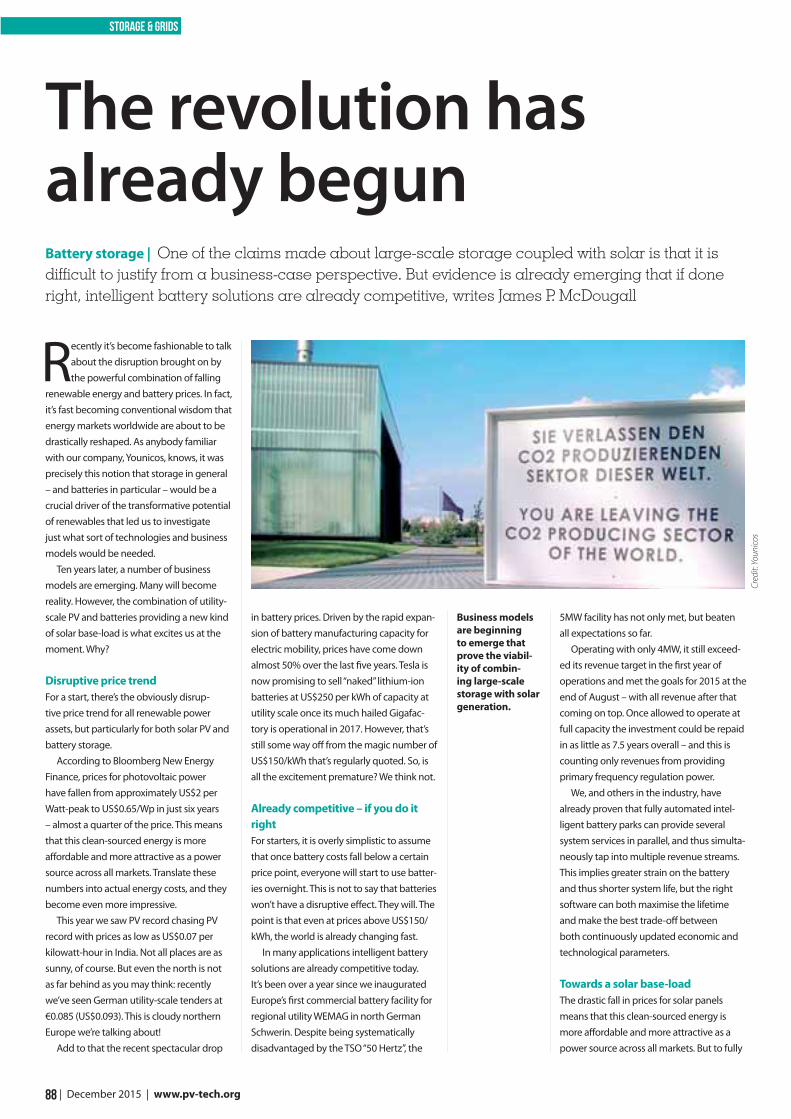
88 | December 2015 | www.pv-tech.org
storage & grids
Recently it’s become fashionable to talk about the disruption brought on by the powerful combination of falling
renewable energy and battery prices. In fact, it’s fast becoming conventional wisdom that energy markets worldwide are about to be drastically reshaped. As anybody familiar with our company, Younicos, knows, it was precisely this notion that storage in general – and batteries in particular – would be a crucial driver of the transformative potential of renewables that led us to investigate just what sort of technologies and business models would be needed.
Ten years later, a number of business models are emerging. Many will become reality. However, the combination of utility-scale PV and batteries providing a new kind of solar base-load is what excites us at the moment. Why?
Disruptive price trendFor a start, there’s the obviously disrup-tive price trend for all renewable power assets, but particularly for both solar PV and battery storage.
According to Bloomberg New Energy Finance, prices for photovoltaic power have fallen from approximately US$2 per Watt-peak to US$0.65/Wp in just six years – almost a quarter of the price. This means that this clean-sourced energy is more affordable and more attractive as a power source across all markets. Translate these numbers into actual energy costs, and they become even more impressive.
This year we saw PV record chasing PV record with prices as low as US$0.07 per kilowatt-hour in India. Not all places are as sunny, of course. But even the north is not as far behind as you may think: recently we’ve seen German utility-scale tenders at €0.085 (US$0.093). This is cloudy northern Europe we’re talking about!
Add to that the recent spectacular drop
in battery prices. Driven by the rapid expan-sion of battery manufacturing capacity for electric mobility, prices have come down almost 50% over the last five years. Tesla is now promising to sell “naked” lithium-ion batteries at US$250 per kWh of capacity at utility scale once its much hailed Gigafac-tory is operational in 2017. However, that’s still some way off from the magic number of US$150/kWh that’s regularly quoted. So, is all the excitement premature? We think not.
Already competitive – if you do it rightFor starters, it is overly simplistic to assume that once battery costs fall below a certain price point, everyone will start to use batter-ies overnight. This is not to say that batteries won’t have a disruptive effect. They will. The point is that even at prices above US$150/kWh, the world is already changing fast.
In many applications intelligent battery solutions are already competitive today. It’s been over a year since we inaugurated Europe’s first commercial battery facility for regional utility WEMAG in north German Schwerin. Despite being systematically disadvantaged by the TSO “50 Hertz”, the
5MW facility has not only met, but beaten all expectations so far.
Operating with only 4MW, it still exceed-ed its revenue target in the first year of operations and met the goals for 2015 at the end of August – with all revenue after that coming on top. Once allowed to operate at full capacity the investment could be repaid in as little as 7.5 years overall – and this is counting only revenues from providing primary frequency regulation power.
We, and others in the industry, have already proven that fully automated intel-ligent battery parks can provide several system services in parallel, and thus simulta-neously tap into multiple revenue streams. This implies greater strain on the battery and thus shorter system life, but the right software can both maximise the lifetime and make the best trade-off between both continuously updated economic and technological parameters.
Towards a solar base-load The drastic fall in prices for solar panels means that this clean-sourced energy is more affordable and more attractive as a power source across all markets. But to fully
Battery storage | One of the claims made about large-scale storage coupled with solar is that it is difficult to justify from a business-case perspective. But evidence is already emerging that if done right, intelligent battery solutions are already competitive, writes James P. McDougall
The revolution has already begun
Business models are beginning to emerge that prove the viabil-ity of combin-ing large-scale storage with solar generation.
Cred
it: Y
ouni
cos
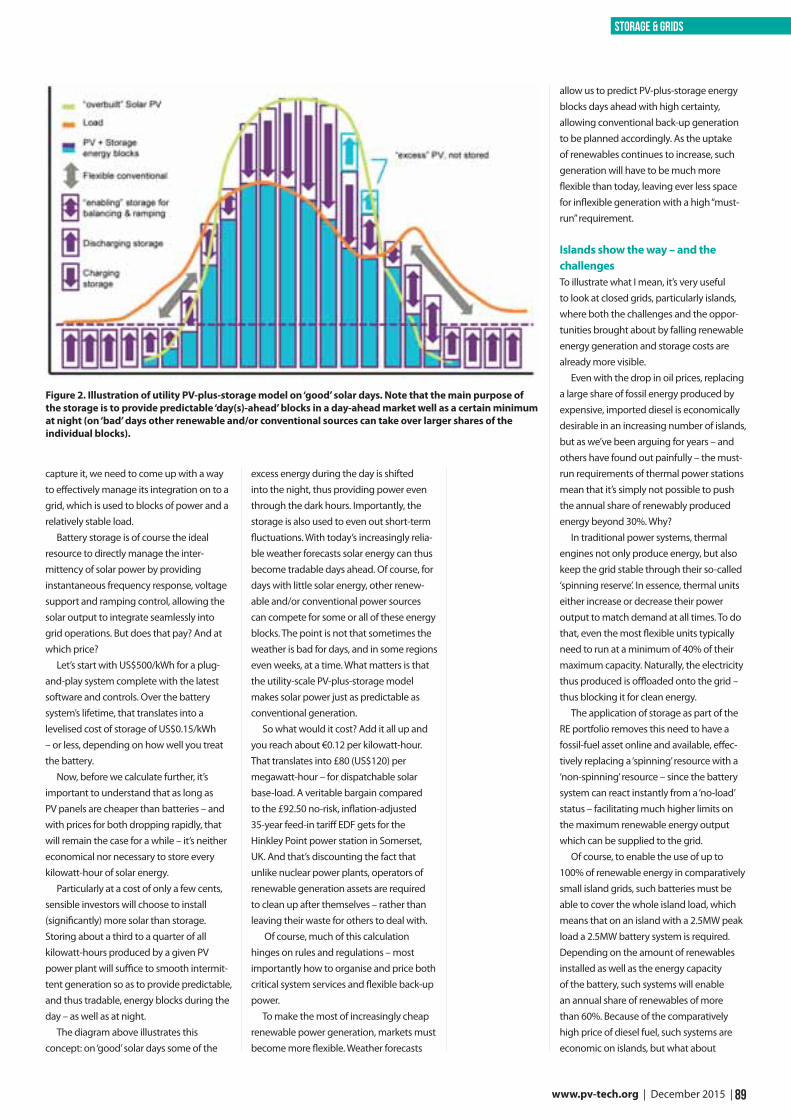
89 www.pv-tech.org | December 2015 |
storage & grids
capture it, we need to come up with a way to effectively manage its integration on to a grid, which is used to blocks of power and a relatively stable load.
Battery storage is of course the ideal resource to directly manage the inter-mittency of solar power by providing instantaneous frequency response, voltage support and ramping control, allowing the solar output to integrate seamlessly into grid operations. But does that pay? And at which price?
Let’s start with US$500/kWh for a plug-and-play system complete with the latest software and controls. Over the battery system’s lifetime, that translates into a levelised cost of storage of US$0.15/kWh – or less, depending on how well you treat the battery.
Now, before we calculate further, it’s important to understand that as long as PV panels are cheaper than batteries – and with prices for both dropping rapidly, that will remain the case for a while – it’s neither economical nor necessary to store every kilowatt-hour of solar energy.
Particularly at a cost of only a few cents, sensible investors will choose to install (significantly) more solar than storage. Storing about a third to a quarter of all kilowatt-hours produced by a given PV power plant will suffice to smooth intermit-tent generation so as to provide predictable, and thus tradable, energy blocks during the day – as well as at night.
The diagram above illustrates this concept: on ‘good’ solar days some of the
excess energy during the day is shifted into the night, thus providing power even through the dark hours. Importantly, the storage is also used to even out short-term fluctuations. With today’s increasingly relia-ble weather forecasts solar energy can thus become tradable days ahead. Of course, for days with little solar energy, other renew-able and/or conventional power sources can compete for some or all of these energy blocks. The point is not that sometimes the weather is bad for days, and in some regions even weeks, at a time. What matters is that the utility-scale PV-plus-storage model makes solar power just as predictable as conventional generation.
So what would it cost? Add it all up and you reach about €0.12 per kilowatt-hour. That translates into £80 (US$120) per megawatt-hour – for dispatchable solar base-load. A veritable bargain compared to the £92.50 no-risk, inflation-adjusted 35-year feed-in tariff EDF gets for the Hinkley Point power station in Somerset, UK. And that’s discounting the fact that unlike nuclear power plants, operators of renewable generation assets are required to clean up after themselves – rather than leaving their waste for others to deal with.
Of course, much of this calculation hinges on rules and regulations – most importantly how to organise and price both critical system services and flexible back-up power.
To make the most of increasingly cheap renewable power generation, markets must become more flexible. Weather forecasts
allow us to predict PV-plus-storage energy blocks days ahead with high certainty, allowing conventional back-up generation to be planned accordingly. As the uptake of renewables continues to increase, such generation will have to be much more flexible than today, leaving ever less space for inflexible generation with a high “must-run” requirement.
Islands show the way – and the challenges To illustrate what I mean, it’s very useful to look at closed grids, particularly islands, where both the challenges and the oppor-tunities brought about by falling renewable energy generation and storage costs are already more visible.
Even with the drop in oil prices, replacing a large share of fossil energy produced by expensive, imported diesel is economically desirable in an increasing number of islands, but as we’ve been arguing for years – and others have found out painfully – the must-run requirements of thermal power stations mean that it’s simply not possible to push the annual share of renewably produced energy beyond 30%. Why?
In traditional power systems, thermal engines not only produce energy, but also keep the grid stable through their so-called ‘spinning reserve’. In essence, thermal units either increase or decrease their power output to match demand at all times. To do that, even the most flexible units typically need to run at a minimum of 40% of their maximum capacity. Naturally, the electricity thus produced is offloaded onto the grid – thus blocking it for clean energy.
The application of storage as part of the RE portfolio removes this need to have a fossil-fuel asset online and available, effec-tively replacing a ‘spinning’ resource with a ‘non-spinning’ resource – since the battery system can react instantly from a ‘no-load’ status – facilitating much higher limits on the maximum renewable energy output which can be supplied to the grid.
Of course, to enable the use of up to 100% of renewable energy in comparatively small island grids, such batteries must be able to cover the whole island load, which means that on an island with a 2.5MW peak load a 2.5MW battery system is required. Depending on the amount of renewables installed as well as the energy capacity of the battery, such systems will enable an annual share of renewables of more than 60%. Because of the comparatively high price of diesel fuel, such systems are economic on islands, but what about
Figure 2. Illustration of utility PV-plus-storage model on ‘good’ solar days. Note that the main purpose of the storage is to provide predictable ‘day(s)-ahead’ blocks in a day-ahead market well as a certain minimum at night (on ‘bad’ days other renewable and/or conventional sources can take over larger shares of the individual blocks).
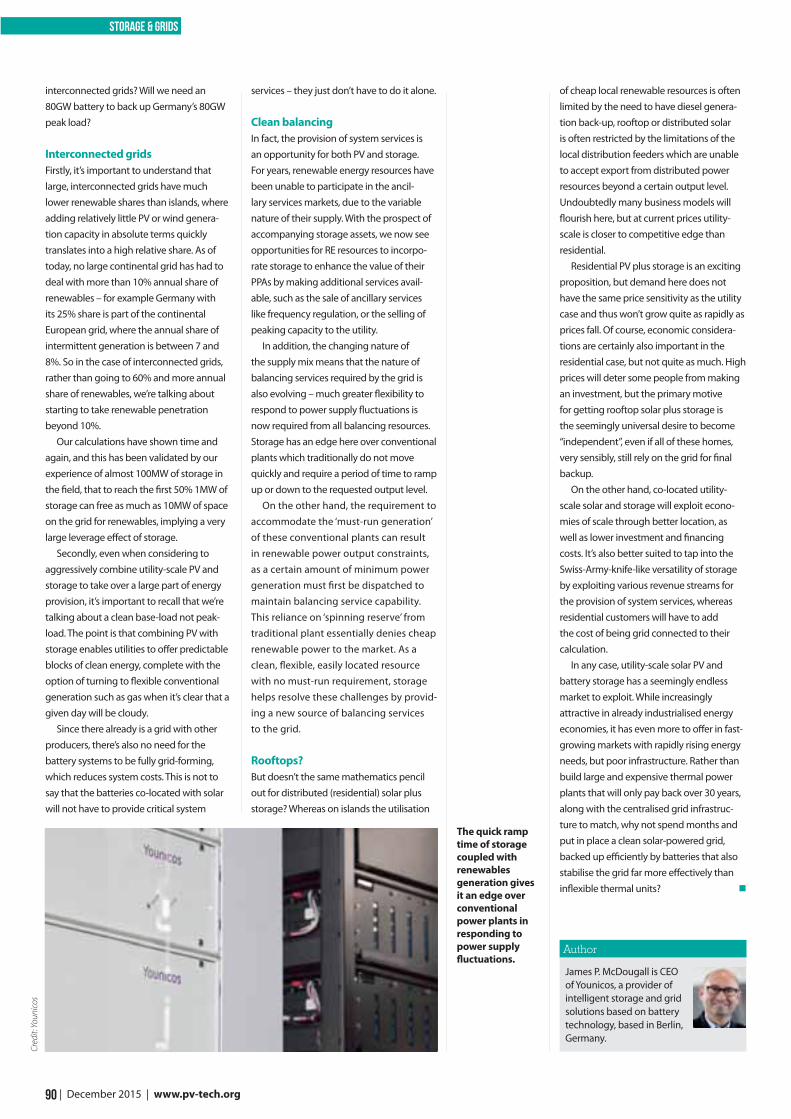
90 | December 2015 | www.pv-tech.org
storage & grids
James P. McDougall is CEO of Younicos, a provider of intelligent storage and grid solutions based on battery technology, based in Berlin, Germany.
Author
interconnected grids? Will we need an 80GW battery to back up Germany’s 80GW peak load?
Interconnected gridsFirstly, it’s important to understand that large, interconnected grids have much lower renewable shares than islands, where adding relatively little PV or wind genera-tion capacity in absolute terms quickly translates into a high relative share. As of today, no large continental grid has had to deal with more than 10% annual share of renewables – for example Germany with its 25% share is part of the continental European grid, where the annual share of intermittent generation is between 7 and 8%. So in the case of interconnected grids, rather than going to 60% and more annual share of renewables, we’re talking about starting to take renewable penetration beyond 10%.
Our calculations have shown time and again, and this has been validated by our experience of almost 100MW of storage in the field, that to reach the first 50% 1MW of storage can free as much as 10MW of space on the grid for renewables, implying a very large leverage effect of storage.
Secondly, even when considering to aggressively combine utility-scale PV and storage to take over a large part of energy provision, it’s important to recall that we’re talking about a clean base-load not peak-load. The point is that combining PV with storage enables utilities to offer predictable blocks of clean energy, complete with the option of turning to flexible conventional generation such as gas when it’s clear that a given day will be cloudy.
Since there already is a grid with other producers, there’s also no need for the battery systems to be fully grid-forming, which reduces system costs. This is not to say that the batteries co-located with solar will not have to provide critical system
services – they just don’t have to do it alone.
Clean balancing In fact, the provision of system services is an opportunity for both PV and storage. For years, renewable energy resources have been unable to participate in the ancil-lary services markets, due to the variable nature of their supply. With the prospect of accompanying storage assets, we now see opportunities for RE resources to incorpo-rate storage to enhance the value of their PPAs by making additional services avail-able, such as the sale of ancillary services like frequency regulation, or the selling of peaking capacity to the utility.
In addition, the changing nature of the supply mix means that the nature of balancing services required by the grid is also evolving – much greater flexibility to respond to power supply fluctuations is now required from all balancing resources. Storage has an edge here over conventional plants which traditionally do not move quickly and require a period of time to ramp up or down to the requested output level.
On the other hand, the requirement to accommodate the ‘must-run generation’ of these conventional plants can result in renewable power output constraints, as a certain amount of minimum power generation must first be dispatched to maintain balancing service capability. This reliance on ‘spinning reserve’ from traditional plant essentially denies cheap renewable power to the market. As a clean, flexible, easily located resource with no must-run requirement, storage helps resolve these challenges by provid-ing a new source of balancing services to the grid.
Rooftops?But doesn’t the same mathematics pencil out for distributed (residential) solar plus storage? Whereas on islands the utilisation
of cheap local renewable resources is often limited by the need to have diesel genera-tion back-up, rooftop or distributed solar is often restricted by the limitations of the local distribution feeders which are unable to accept export from distributed power resources beyond a certain output level. Undoubtedly many business models will flourish here, but at current prices utility-scale is closer to competitive edge than residential.
Residential PV plus storage is an exciting proposition, but demand here does not have the same price sensitivity as the utility case and thus won’t grow quite as rapidly as prices fall. Of course, economic considera-tions are certainly also important in the residential case, but not quite as much. High prices will deter some people from making an investment, but the primary motive for getting rooftop solar plus storage is the seemingly universal desire to become “independent”, even if all of these homes, very sensibly, still rely on the grid for final backup.
On the other hand, co-located utility-scale solar and storage will exploit econo-mies of scale through better location, as well as lower investment and financing costs. It’s also better suited to tap into the Swiss-Army-knife-like versatility of storage by exploiting various revenue streams for the provision of system services, whereas residential customers will have to add the cost of being grid connected to their calculation.
In any case, utility-scale solar PV and battery storage has a seemingly endless market to exploit. While increasingly attractive in already industrialised energy economies, it has even more to offer in fast-growing markets with rapidly rising energy needs, but poor infrastructure. Rather than build large and expensive thermal power plants that will only pay back over 30 years, along with the centralised grid infrastruc-ture to match, why not spend months and put in place a clean solar-powered grid, backed up efficiently by batteries that also stabilise the grid far more effectively than inflexible thermal units?
The quick ramp time of storage coupled with renewables generation gives it an edge over conventional power plants in responding to power supply fluctuations.
Cred
it: Y
ouni
cos
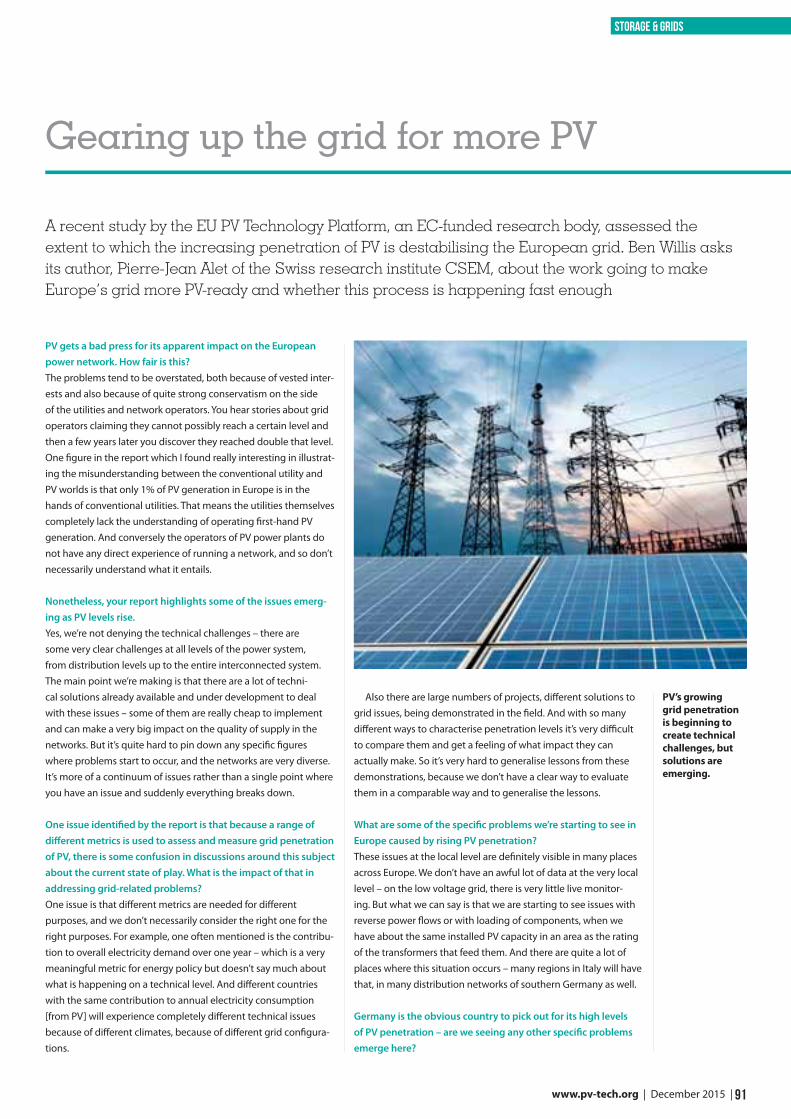
91 www.pv-tech.org | December 2015 |
storage & grids
Also there are large numbers of projects, different solutions to grid issues, being demonstrated in the field. And with so many different ways to characterise penetration levels it’s very difficult to compare them and get a feeling of what impact they can actually make. So it’s very hard to generalise lessons from these demonstrations, because we don’t have a clear way to evaluate them in a comparable way and to generalise the lessons.
What are some of the specific problems we’re starting to see in Europe caused by rising PV penetration?These issues at the local level are definitely visible in many places across Europe. We don’t have an awful lot of data at the very local level – on the low voltage grid, there is very little live monitor-ing. But what we can say is that we are starting to see issues with reverse power flows or with loading of components, when we have about the same installed PV capacity in an area as the rating of the transformers that feed them. And there are quite a lot of places where this situation occurs – many regions in Italy will have that, in many distribution networks of southern Germany as well.
Germany is the obvious country to pick out for its high levels of PV penetration – are we seeing any other specific problems emerge here?
PV gets a bad press for its apparent impact on the European power network. How fair is this?The problems tend to be overstated, both because of vested inter-ests and also because of quite strong conservatism on the side of the utilities and network operators. You hear stories about grid operators claiming they cannot possibly reach a certain level and then a few years later you discover they reached double that level. One figure in the report which I found really interesting in illustrat-ing the misunderstanding between the conventional utility and PV worlds is that only 1% of PV generation in Europe is in the hands of conventional utilities. That means the utilities themselves completely lack the understanding of operating first-hand PV generation. And conversely the operators of PV power plants do not have any direct experience of running a network, and so don’t necessarily understand what it entails.
Nonetheless, your report highlights some of the issues emerg-ing as PV levels rise. Yes, we’re not denying the technical challenges – there are some very clear challenges at all levels of the power system, from distribution levels up to the entire interconnected system. The main point we’re making is that there are a lot of techni-cal solutions already available and under development to deal with these issues – some of them are really cheap to implement and can make a very big impact on the quality of supply in the networks. But it’s quite hard to pin down any specific figures where problems start to occur, and the networks are very diverse. It’s more of a continuum of issues rather than a single point where you have an issue and suddenly everything breaks down.
One issue identified by the report is that because a range of different metrics is used to assess and measure grid penetration of PV, there is some confusion in discussions around this subject about the current state of play. What is the impact of that in addressing grid-related problems?One issue is that different metrics are needed for different purposes, and we don’t necessarily consider the right one for the right purposes. For example, one often mentioned is the contribu-tion to overall electricity demand over one year – which is a very meaningful metric for energy policy but doesn’t say much about what is happening on a technical level. And different countries with the same contribution to annual electricity consumption [from PV] will experience completely different technical issues because of different climates, because of different grid configura-tions.
A recent study by the EU PV Technology Platform, an EC-funded research body, assessed the extent to which the increasing penetration of PV is destabilising the European grid. Ben Willis asks its author, Pierre-Jean Alet of the Swiss research institute CSEM, about the work going to make Europe’s grid more PV-ready and whether this process is happening fast enough
Gearing up the grid for more PV
PV’s growing grid penetration is beginning to create technical challenges, but solutions are emerging.
92 | December 2015 | www.pv-tech.org
storage & grids
It is fairly well managed. The one issue they have at a national level is the fact they have negative electricity prices at some moments, which is good for the end user, but not so good for producers. On the local level they have already implemented quite a number of technical measures, particularly on inverters, so that they start having ways to manage voltage on the distribution level; they have improved their connection roles so they don’t have so many issues of general stability when frequency varies for example.
On solutions, your report highlights a few that have particular potential to address the issues arising. Which offer the most promise?Clearly inverters are centre-stage for managing integration into the network, and there are a number of functions they can provide which really improve the situation, especially at the local level: all the voltage control techniques are really powerful to improve the hosting capacity of distribution networks. Then inverters can also provide other support functions for the power system and features to improve the stability of the networks.
Grid-level storage is an oft-cited solution to the growing penetration of PV, but is also perhaps unrealistically seen as a magic bullet – how significant is storage in your view?It largely boils down to cost – if you had free storage there would be no issues with PV. What we are seeing is that from a system perspective and an economic perspective it would make much more sense to have storage as a shared service on the grid, rather than something that is tied to every PV generator – so really looking at storage as such rather than trying to mimic convention-al generators by bundling PV and storage together. Unfortunately at least in Europe that’s not really the way things are evolving; you see subsidy schemes being put in place that tend to favour storage at the residential level, tied to a single PV system.
I would say that the situation is it’s difficult to make storage at the grid level work; for grid operators the unbundled situation is very hard for them to monetise the energy that goes through the storage, so they really have to make a business case based only on the improvement it makes on the grid.
So where do think storage will go in terms of becoming a feature at the grid level?There will be a driver from large PV power plants for large-capaci-ty storage, because they will more and more have to comply with regular rules of generators; that will drive the technical develop-ment of large-scale storage. There is a lot of discussion going on in Europe on the roles of the different players in the electricity market. We don’t know exactly yet how it will evolve, but I’m pretty sure it will evolve in terms of the funding of the distribution networks and the transmission networks. And in this discussion the way storage is used and implemented will come into the picture; I think network operators will push for ways to use these new technologies that are being developed.
The management and development of the grid clearly involves a large number of players. Are you satisfied there’s enough coordination going on of what is obviously a very complex issue?It’s going in the right direction. We are seeing a lot of positive steps – for example what we saw around the solar eclipse, there was a very strong collaboration between [European transmission system operator umbrella body] Entso-e and SolarPower Europe both to prepare for the recent solar eclipse and to learn the lessons from that. On our side, we have representatives of utili-ties, of conventional power engineers, people who come from power engineering departments at universities. So that’s two worlds that didn’t use to talk together, but are now collaborating on a daily basis.
In which areas do think there is still the most work to be done?One big question is around electricity market design. The current design is absolutely not suited to PV, and I don’t think we are yet in very collaborative mode on this. So there is a lot of talk and lobbying to push PV generation more and more into the conven-tional electricity markets, but the electricity market hasn’t been designed for it. And so on the one hand, PV is blamed for some of the malfunctions of the current system, and on the other hand there isn’t much change being put in place to accommodate PV. There are different measures that need to be put in place to make it easier for PV to be traded on the electricity markets.
Your report highlights the needs for improvements to PV generation forecasting. What are the current deficiencies here?Forecasting of PV is a really powerful tool to include PV in the energy system for a number of different uses, from planning of PV systems down to market operations or management of the network. But for the moment, the quality of the forecasts, especially on short timescales, is quite poor. That’s really an area where we see a need for technical improvement and is one area where we’re going to put more effort in the future.
Are you satisfied the necessary work on improving grid is happening at sufficient pace?I think we need to accelerate and to put solutions into practice as fast as possible. But we’re faced with the conflict between the pace at which the deployment of PV is happening and needs to happen and the usual pace of technical changes in the power network, which typically has much longer technology and investment cycles.
We need a clear political message that this is the way we’re going; bearing in mind that network operation is a very regulat-ed business, operators need to have a very clear regulatory and political signal about where they need to go. And we need also more and more collaboration to make PV as much a part of the electricity system in the mind of engineers and managers as other generators, and not as something foreign to the grid.
Pierre-Jean Alet

regulars
93 www.pv-tech.org | December 2015 |
| advertisers & web index
Advertiser Web address PAGE No.
Clean Energy Summit summit.solarenergyevents.com 41
Delta T-Devices www.delta-t.co.uk/solar 76, 77
DuPont Photovoltaic Solutions solamet.dupont.com 7
HUAWEI Technologies Co., Ltd huawei.com/solar 5
Intersolar www.intersolarglobal.com 15
JA Solar Holdings Co., Ltd. www.jasolar.com Inside Front Cover
Kipp & Zonen www.kippzonen.com 45
Mounting Systems GmbH www.mounting-systems.com 63
PV CellTech Conference Malaysia celltech.solarenergyevents.com 31
PV Expo Japan / PV System Expo www.pvexpo.jp/en/ 28, 29
Schneider Electric solar.schneider-electric.com 17
SNEC 2016 www.snec.org.cn Inside Back Cover
Solar & Off -grid Renewables West Africa westafrica.solarenergyevents.com 53
Solar Finance & Investment Europe Forum fi nance.solarenergyevents.com 11
Solar Media Events 2016 www.solarenergyevents.com 35
Solar Middle East www.solarmiddleeast.ae 73
Suntech www.suntech-power.com Outside Back Cover
World Future Energy Summit www.worldfutureenergysummit.com 23
SUBSCRIBE TODAY! www.pv-tech.org/power
| next issueWhat electricity market deregulation in Japan means for PV
Can rooftop PV in India hit 40GW by 2022?
Replacement strategies for faulty modules

last word
94 | December 2015 | www.pv-tech.org
Despite solar’s stellar growth in recent years, one accusation sometimes levelled at the global
industry is that it has not been particularly effective at speaking with one voice and getting its message out to the wider world. That may not have been an impediment so far, but with solar seen as an increas-ingly vital part of the future energy mix, now more than ever there is a clear need for the industry to unite under a common purpose.
In early December, on the fringes of the crunch COP21 climate talks in Paris, the solar industry took a major step forwards in its evolution with the launch of the Global Solar Council.
The body will bring together 25 national and regional solar associations from around the world and boast some heavy-hitters from the industry on its board, including Trina Solar’s CEO Jifan Gao, GCL Poly chairman Zhu Gongshan and Rhone Resch, CEO of the US Solar Energy Industry Association.
“The council is a consequence of a maturing industry,” said Bruce Douglas, chief operating officer at SolarPower Europe and the inaugural chairman of the council. “It’s maturing in terms of technol-ogy, business models and practices, and the companies involved in it. It’s also a consequence of the globalisation of solar – as it’s shifted from Europe and the US, and moved strongly into the Asian markets, we see a need for this coordination at a global level and communication of the benefits of solar.”
The model for the council is the compa-rable body that Douglas helped set up and run for the wind industry – the Global Wind Energy Council. “The main thing the wind council did was coordinate information at a global level,” he said. “The council enabled us to pool our resources and remove dupli-cation – it was an information exchange.”
Another success of GWEC that Douglas hopes to replicate with the council is its
work in accelerating the development of emerging markets. He said GWEC helped wind take off in places like Mexico and Chile by presenting best practice from established markets to government and industry.
“That’s exactly what we’d like to do in solar – we’d like to go to those markets where we see potential and bring guide-lines and best practices to bear on what could be good opportunities,” Douglas said.
Aside from cooperation, the two other main priorities of the council will be educa-tion and training, said John Smrinow, the new body’s secretary-general. On educa-tion, he said the organisation will direct its efforts towards seeking to influence decision makers rather than the general public.
“We’re a lobbying organisation, so it won’t be the wider public,” said Smirnow. “We’ll be focusing on decision makers, to educate in the broadest possible sense about the opportunities that solar represents in terms of the lower cost of electricity, the scalability of it and also the CO2 implications that brings.”
On training, beyond the best practice exchange highlighted by Douglas, Smirnow said the council would work to build capacity within its member bodies, providing training around its three priority themes of reducing costs, scaling technol-ogy and ensuring quality. Although it currently only has 25 members, it has another 120 bodies worldwide on its list of prospective members, and the council’s aim will be to provide any that join up with a variety of training materials in the form of workshops, reports, guidelines and events.
Fostering unityAn obvious hurdle for the council will be to unite a global industry that has of late been characterised more by its differences than its sense of shared aims. One need think only of the increasingly fractious trade disputes that have blown up in the
past few years in the US and Europe, to name but two, to realise that this will be no mean feat.
But the recent launch of other international solar bodies suggests the industry is genuinely moving into a more collaborative era. Aside from the council, India’s prime minister Narendra Modi has led the formation of the International Solar Alliance, which is aiming to bring solar to the top of the energy policy agenda around the world. Meanwhile the private sector-led Terrawatt initiative, also launched during COP21, is seeking to secure US$1 trillion of investment to build a terawatt of solar by 2030. Douglas said together with the council, the solar indus-try now had worldwide representation in the key spheres of government, finance and industry.
And of course, this is all against the backdrop of COP21 itself. “It’s not a coinci-dence we’re launching in the middle of COP,” said Smirnow. “This is a turning point we’re at right now, and COP21 gives us the opportunity to really lay down a marker.
“Solar represents what we believe to be the largest opportunity for CO2 reductions going forward. BNEF forecast that up to 5TW of solar can be installed by 2040. And if we can do that then that’ll be the largest electricity generating source in the world and significantly help towards reducing CO2 towards the targets we’re trying to get to.”
This is an edited version of an article that first appeared on www.pv-tech.org
The solar industry has a new global council, launched on the fringes of the COP21 talks in Paris. Its chairman and secretary-general spoke to Ben Willis about what the body aims to achieve
Solar comes of age with launch of the Global Solar Council
The Global Solar Council gives the industry interna-tional representa-tion for the first time.


No matter where you are
together we the future.GREEN
We sincerely invite youto visit our booth at Hall 8 #81101 8 - 2 1 J A NUA R Y 2 0 1 6
ABU DHABI NAT IONAL EXHIB IT ION CENTRE