Embed Size (px)
DESCRIPTION
Results-Based Accountability for community organizations and networks. Facilitators: Lorna McCue and Pam Kinzie, HC Link Session 1 - March 7, 2012: Population Accountability Guest Presenter: Lisa Gallant , Coordinator, Healthy Living Niagara - PowerPoint PPT Presentation
Citation preview
1
Facilitators: Lorna McCue and Pam Kinzie, HC Link
Session 1 - March 7, 2012: Population AccountabilityGuest Presenter: Lisa Gallant, Coordinator, Healthy Living Niagara Session 2 - March 28, 2012: Performance AccountabilityGuest Presenter: Andrew Taylor, Taylor Newbury Consulting
Session 3 - April 11, 2012: Putting it All Together Guest Presenter: Shelley Lothian, Senior Research Advisor, Children’s Services, Halton Region
Results-Based Accountability
for community organizations and networks
Session 1 Agenda1. Welcome and Introductions2. Learning Objective & Agenda Review3. RBA Overview 4. Population Accountability• Creating Results/Quality of Life Statements• Turning the Curve• Indicators 5. Homework Asignment6. Q&A7. Wrap-Up
Introductions
Who’s Online?
Facilitators:• Pam Kinzie• Lorna McCue• Lisa Gallant
Please indicate your:• Name• Organization
Learning ObjectivesAfter participating in this webinar participants will be able to:
•Describe the RBA thinking process;
•Define population accountability;
•Identify possible population results for their own work;
•Describe the “turn the curve” process and identify how it may be useful to their organizations
•Take the next steps to find out more about RBA
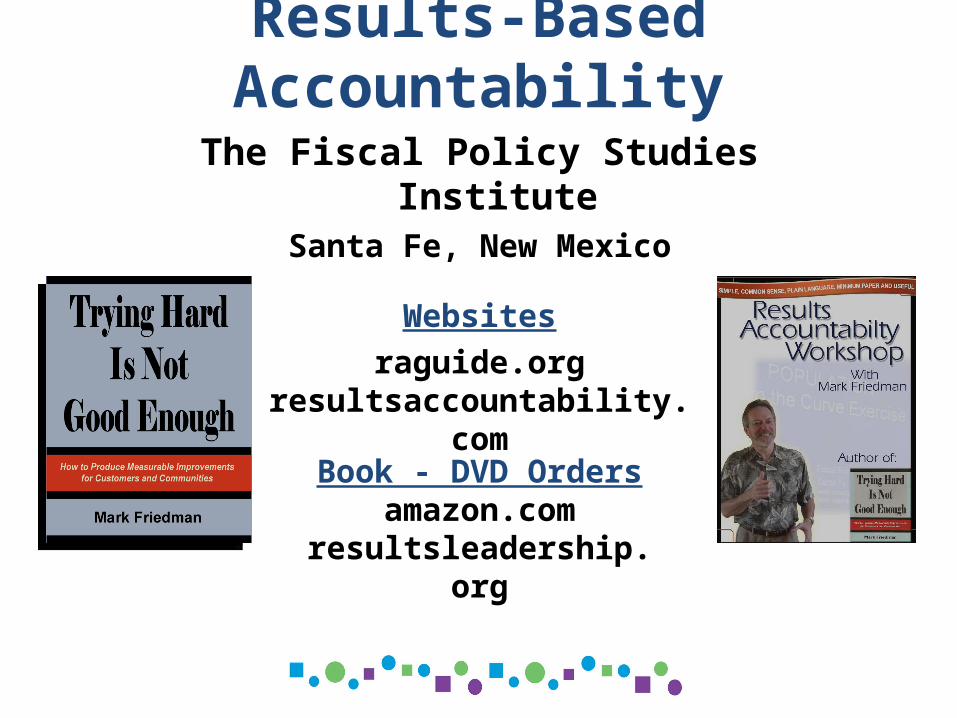
Results-Based AccountabilityThe Fiscal Policy Studies Institute
Santa Fe, New Mexico
Book - DVD Ordersamazon.com
resultsleadership.org
Websites
raguide.orgresultsaccountability.com

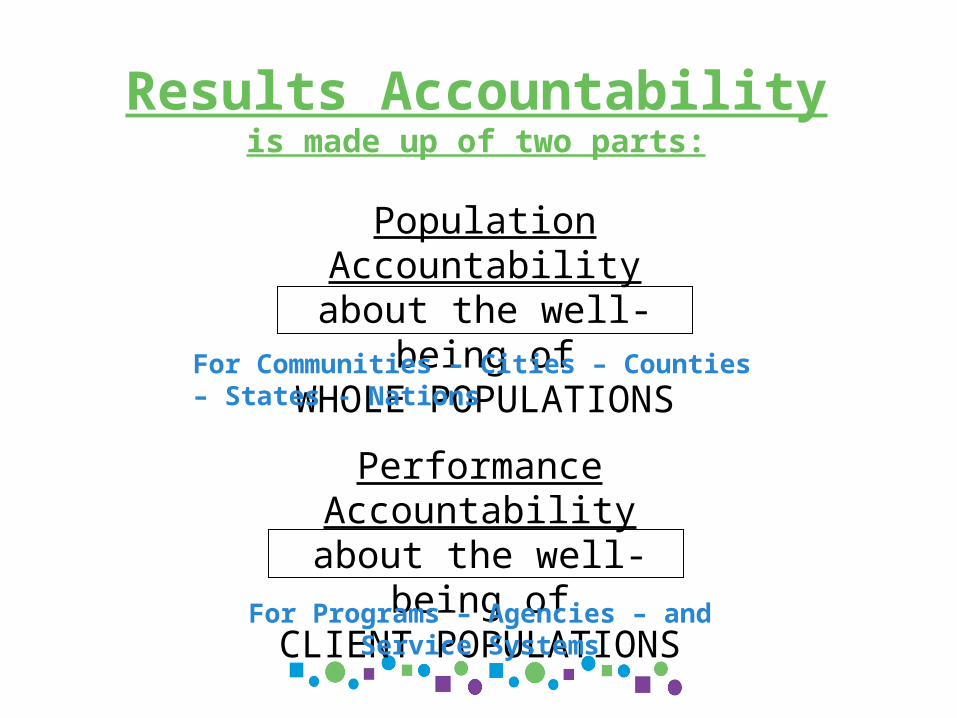
Results Accountabilityis made up of two parts:
Performance Accountabilityabout the well-being of
CLIENT POPULATIONS
For Programs – Agencies – and Service Systems
Population Accountabilityabout the well-being of
WHOLE POPULATIONSFor Communities – Cities – Counties – States - Nations
Results-Based Accountability
COMMON LANGUAGE
COMMON SENSE
COMMON GROUND
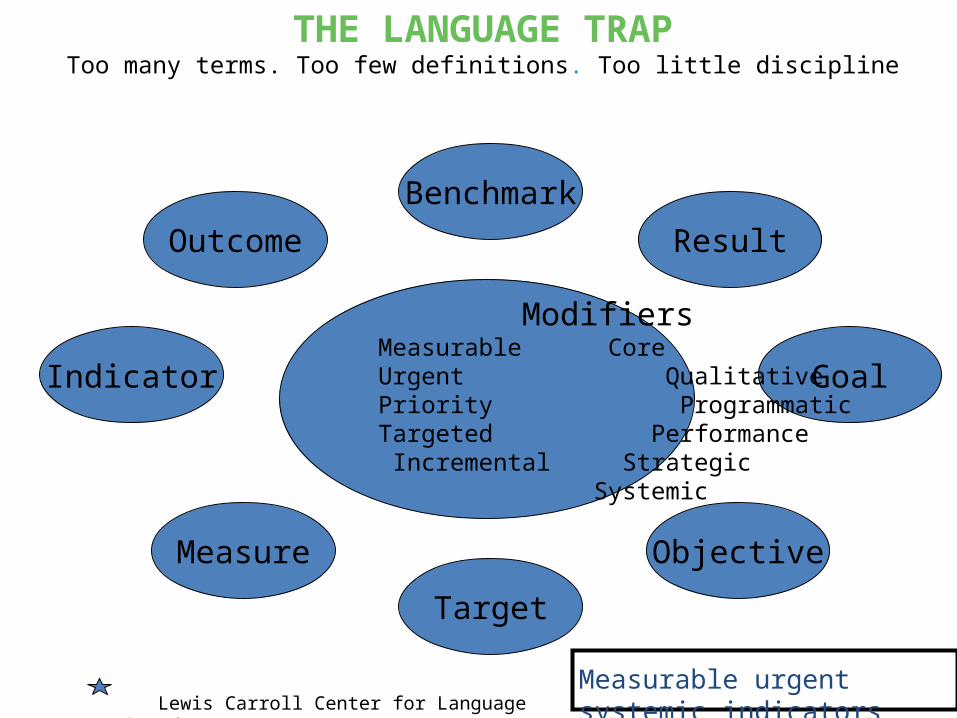
THE LANGUAGE TRAPToo many terms. Too few definitions. Too little discipline
Benchmark
Target
Indicator Goal
Result
Objective
Outcome
Measure
Modifiers Measurable Core Urgent Qualitative Priority Programmatic Targeted Performance Incremental Strategic Systemic
Lewis Carroll Center for Language DisordersMeasurable urgent systemic indicators
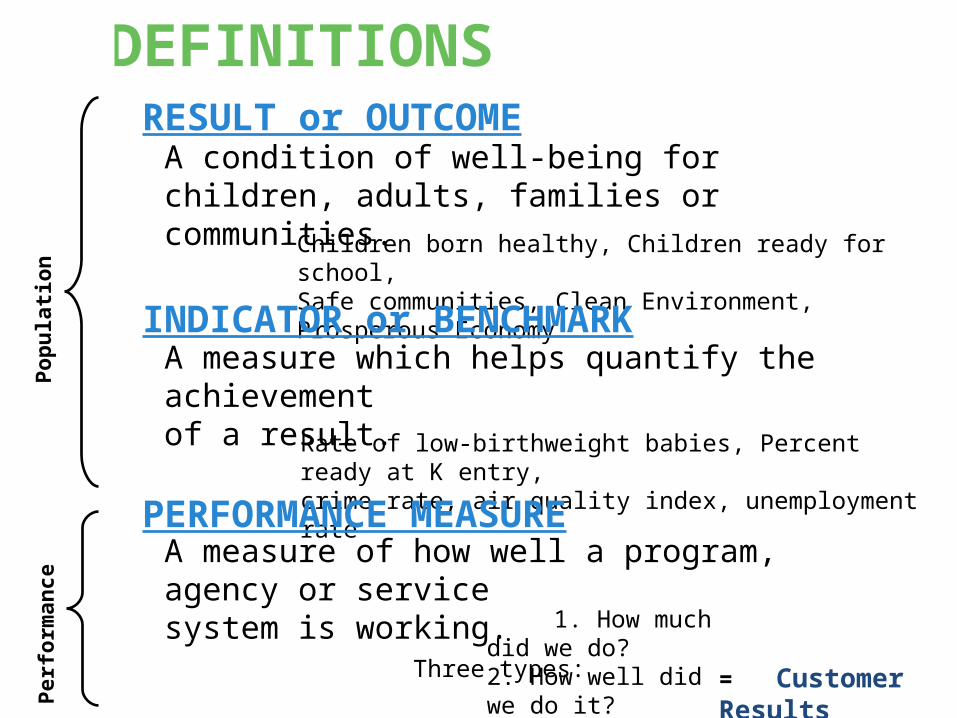
DEFINITIONS
Children born healthy, Children ready for school, Safe communities, Clean Environment, Prosperous Economy
Rate of low-birthweight babies, Percent ready at K entry, crime rate, air quality index, unemployment rate
1. How much did we do? 2. How well did we do it?
3. Is anyone better off?
RESULT or OUTCOME
INDICATOR or BENCHMARK
PERFORMANCE MEASURE
A condition of well-being for children, adults, families or communities.
A measure which helps quantify the achievement of a result.
A measure of how well a program, agency or service system is working. Three types:
= Customer Results
Popu
latio
nPe
rfor
man
ce
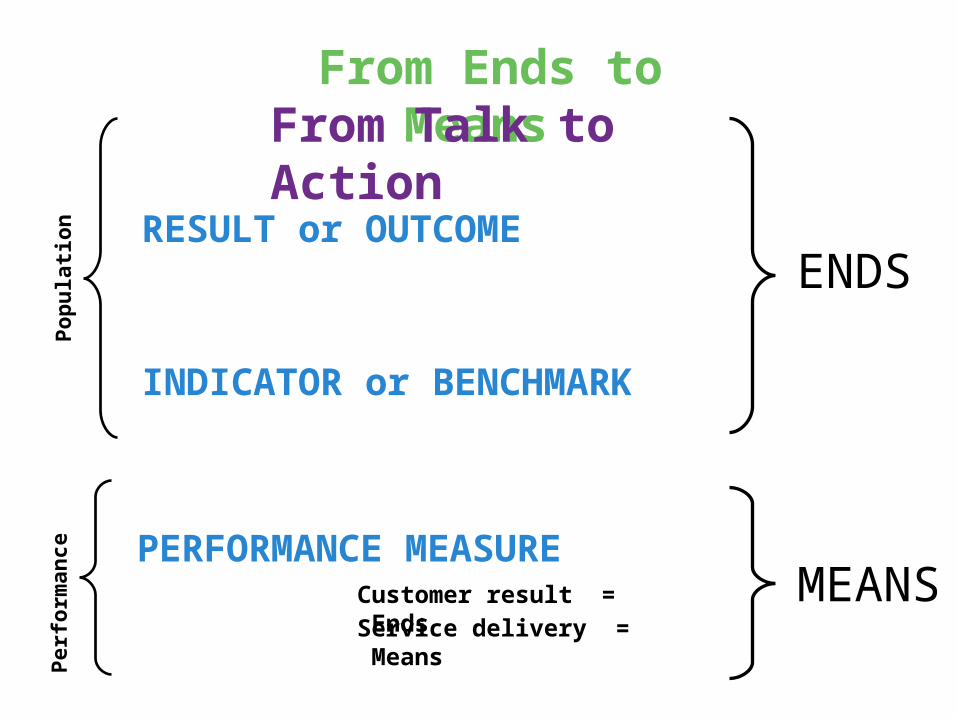
From Ends to Means
ENDS
MEANS
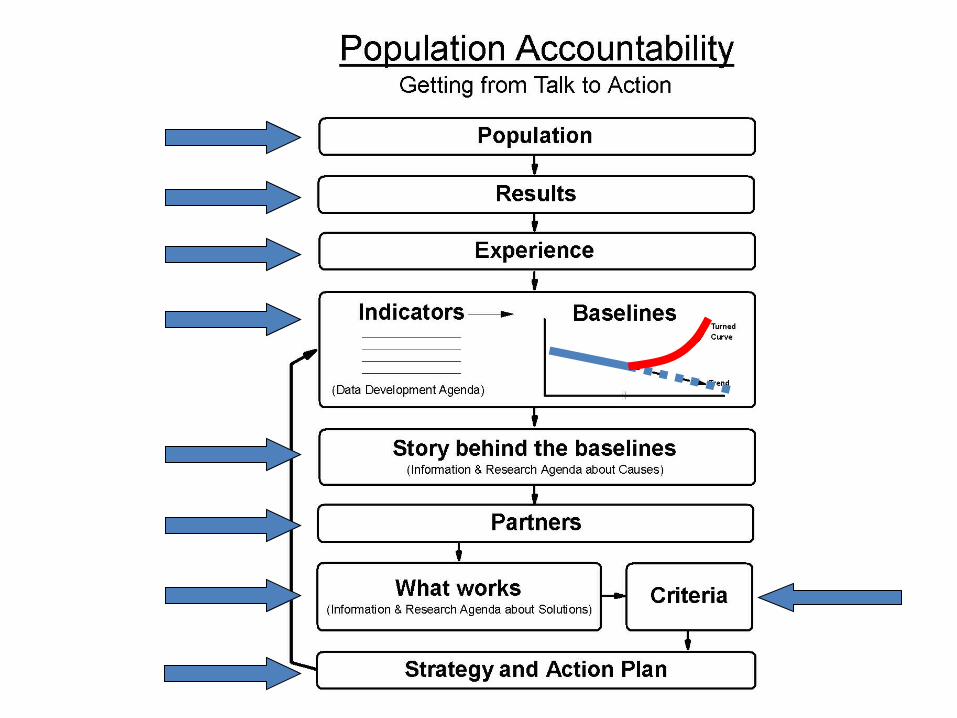
From Talk to Action
Popu
latio
nPe
rfor
man
ce
RESULT or OUTCOME
INDICATOR or BENCHMARK
PERFORMANCE MEASURECustomer result = EndsService delivery = Means
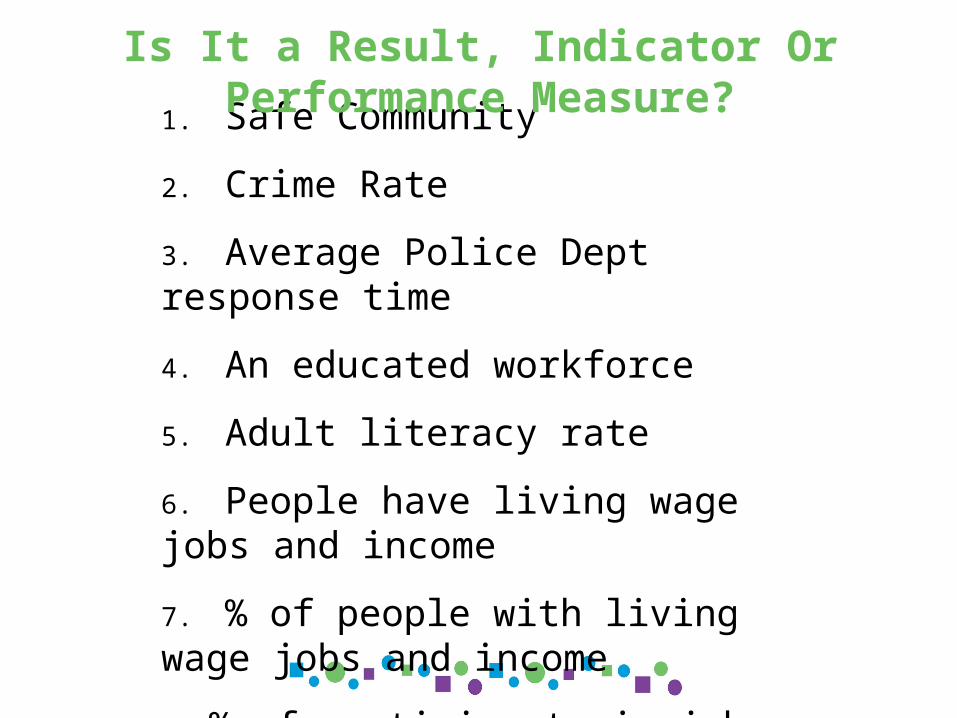
1. Safe Community
2. Crime Rate
3. Average Police Dept response time
4. An educated workforce
5. Adult literacy rate
6. People have living wage jobs and income
7. % of people with living wage jobs and income
8. % of participants in job training who get living wage jobs
Is It a Result, Indicator Or Performance Measure?
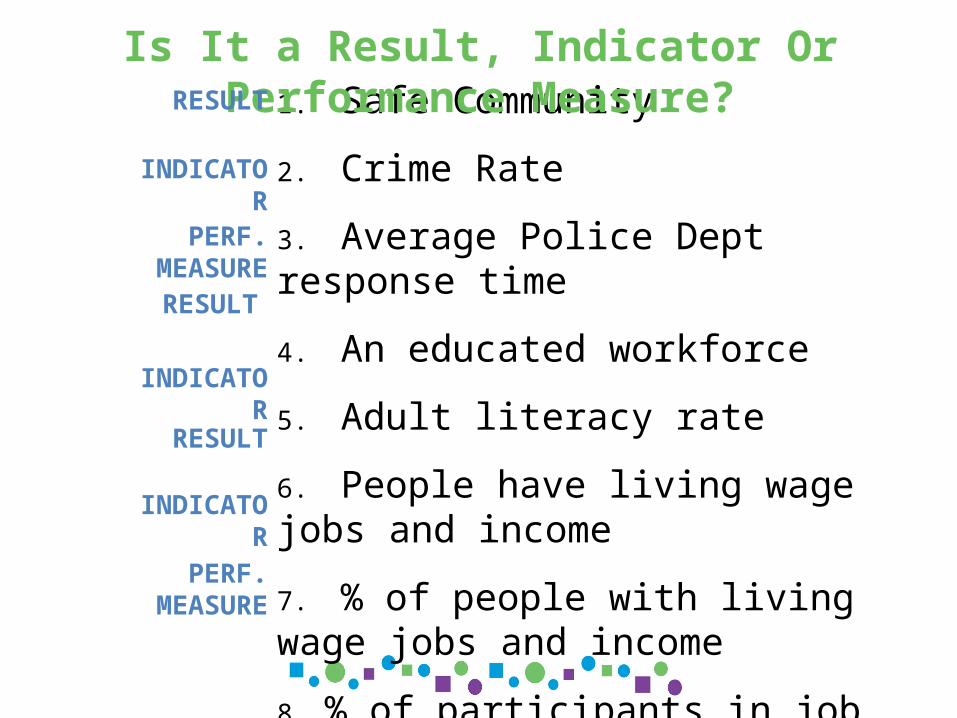
1. Safe Community
2. Crime Rate
3. Average Police Dept response time
4. An educated workforce
5. Adult literacy rate
6. People have living wage jobs and income
7. % of people with living wage jobs and income
8. % of participants in job training who get living wage jobs
Is It a Result, Indicator Or Performance Measure?RESULT
INDICATOR
PERF. MEASURE
RESULT
INDICATOR
RESULT
INDICATOR
PERF. MEASURE
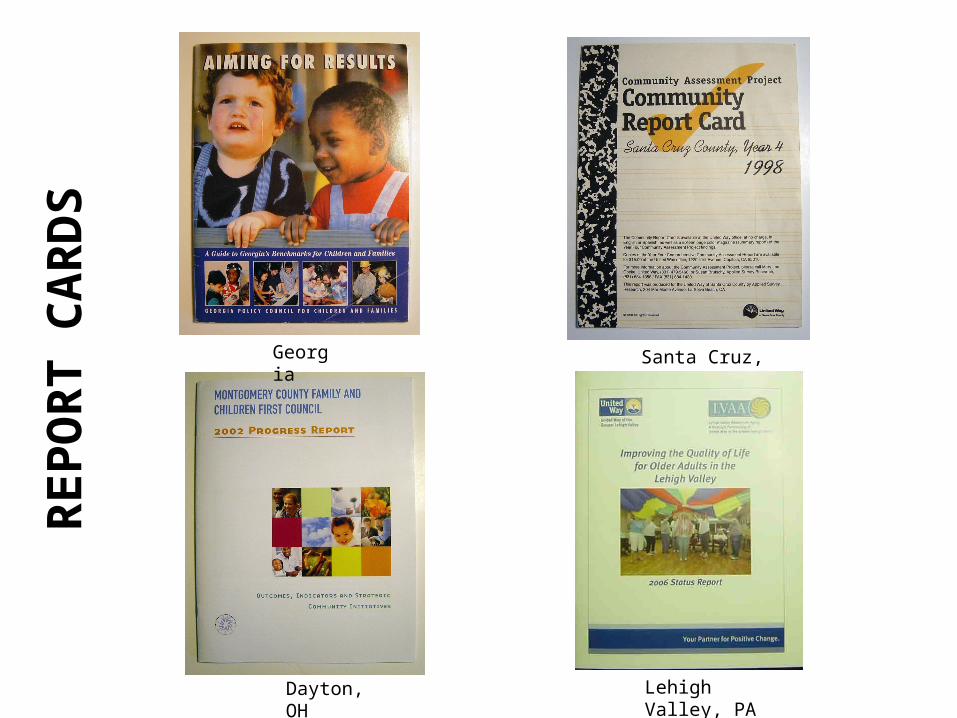
Georgia
Lehigh Valley, PA
Dayton, OH
Santa Cruz, CA
REP
OR
T C
AR
DS

POPULATIONACCOUNTABILITY
For Whole Populationsin a Geographic Area
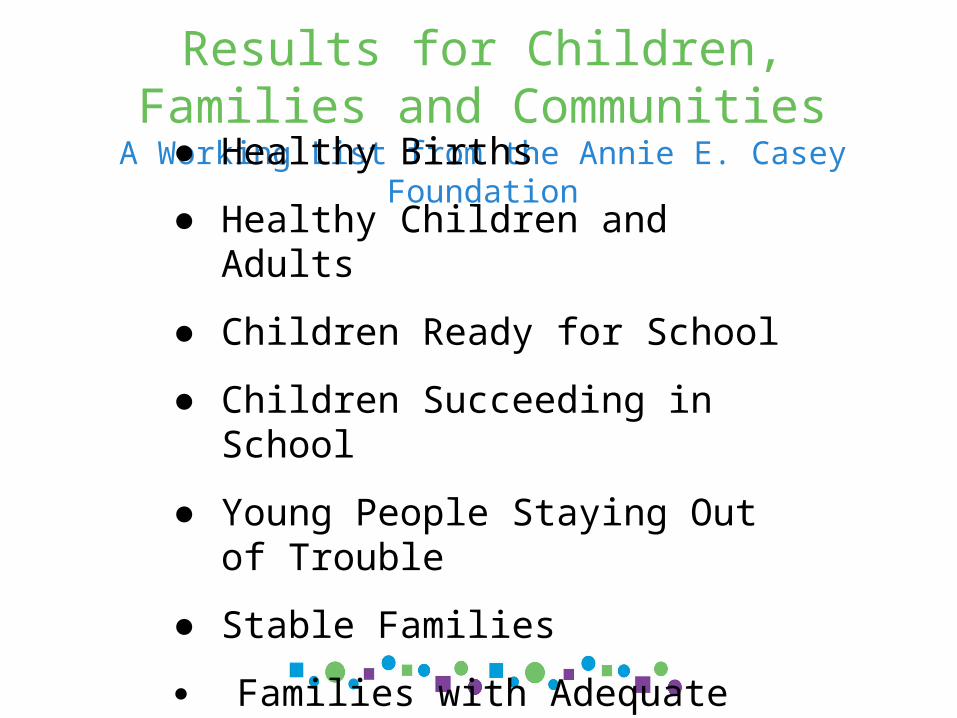
Results for Children, Families and CommunitiesA Working List from the Annie E. Casey Foundation
● Healthy Births
● Healthy Children and Adults
● Children Ready for School
● Children Succeeding in School
● Young People Staying Out of Trouble
● Stable Families
● Families with Adequate Income
● Safe and Supportive Communities
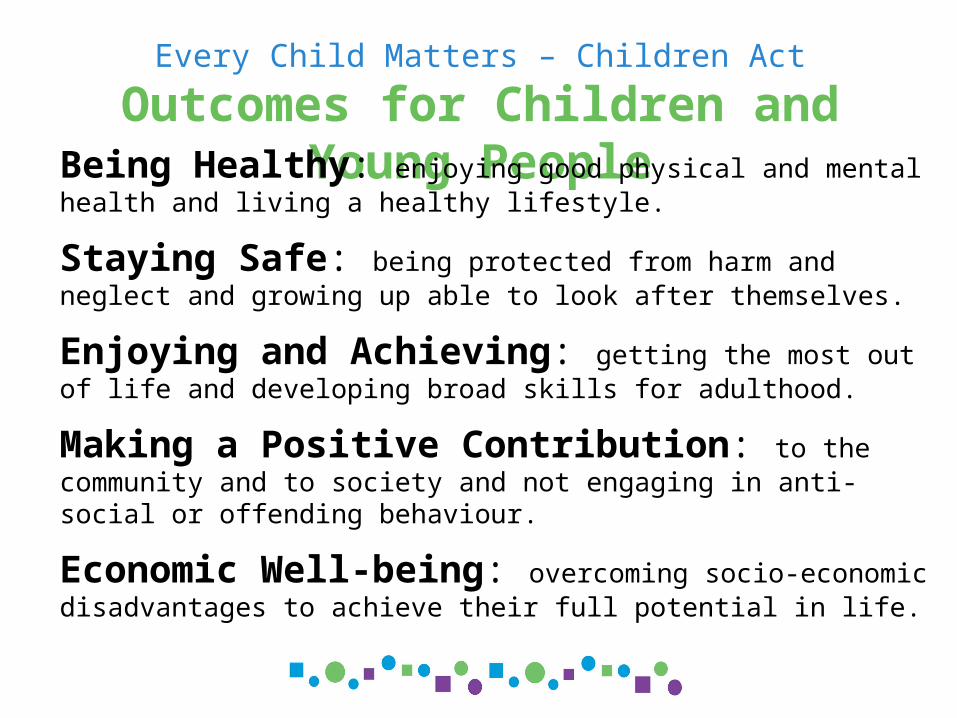
Every Child Matters – Children Act
Outcomes for Children and Young PeopleBeing Healthy: enjoying good physical and mental health and living a healthy lifestyle.
Staying Safe: being protected from harm and neglect and growing up able to look after themselves.
Enjoying and Achieving: getting the most out of life and developing broad skills for adulthood.
Making a Positive Contribution: to the community and to society and not engaging in anti-social or offending behaviour.
Economic Well-being: overcoming socio-economic disadvantages to achieve their full potential in life.
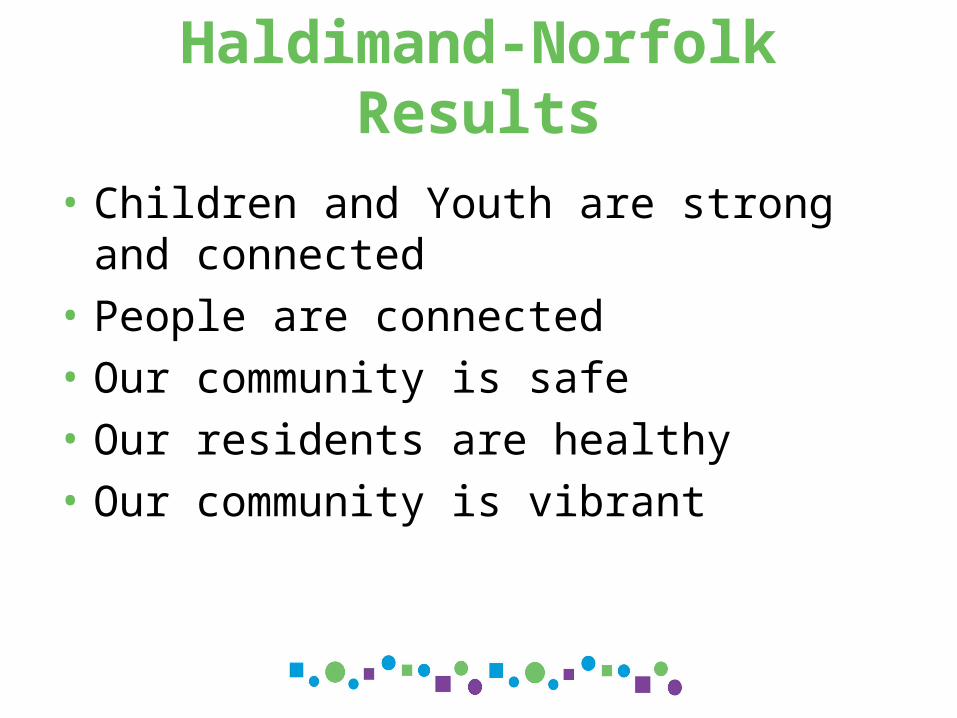
Haldimand-Norfolk Results
• Children and Youth are strong and connected• People are connected • Our community is safe• Our residents are healthy• Our community is vibrant
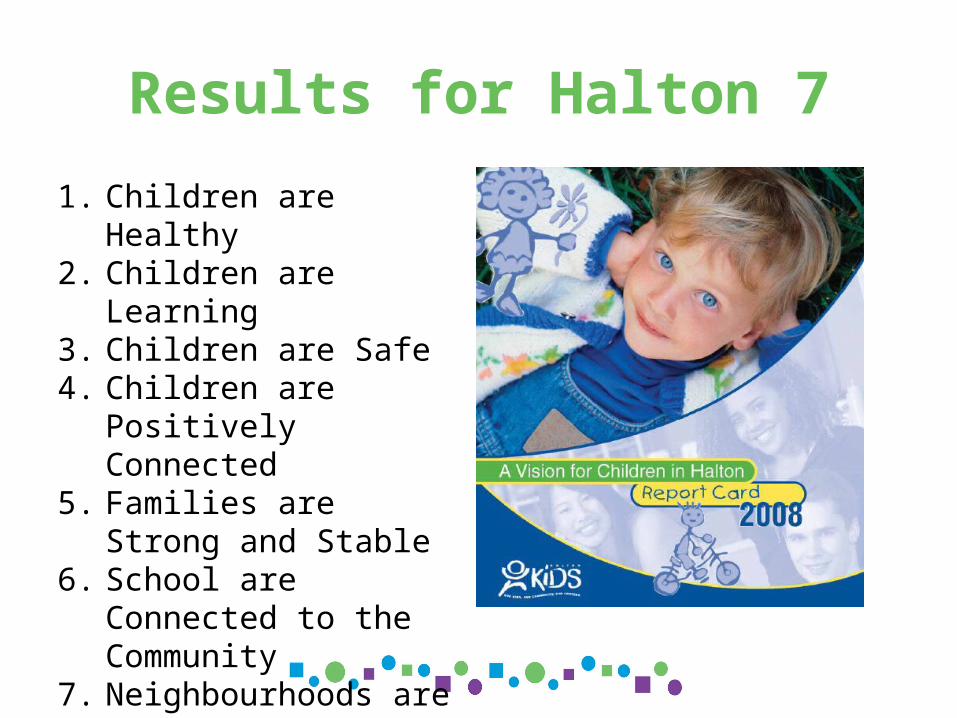
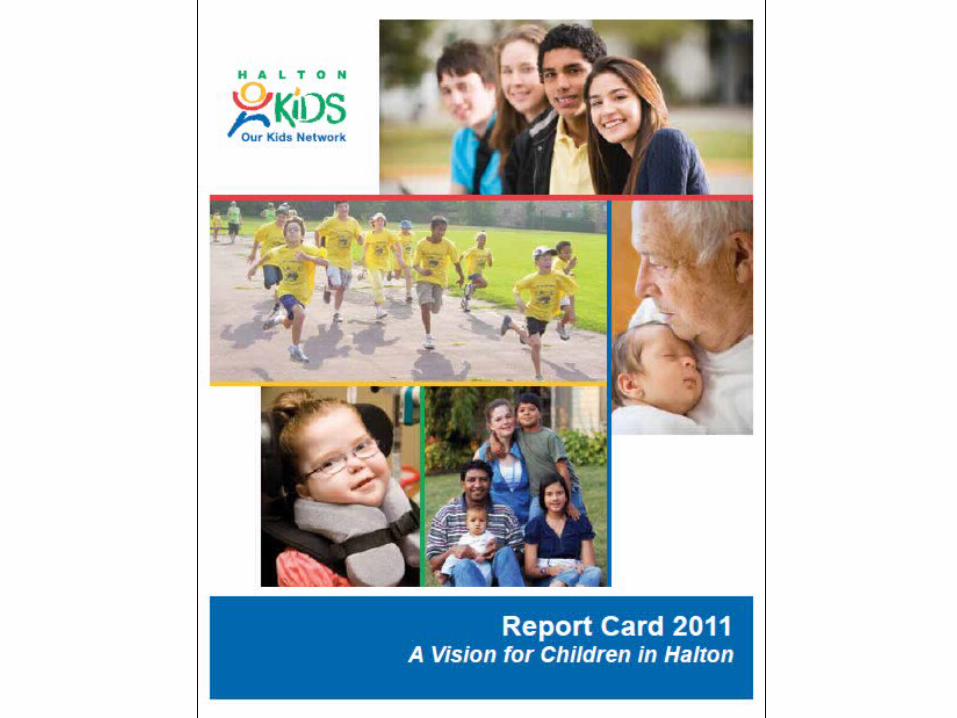
Results for Halton 7
1. Children are Healthy2. Children are Learning3. Children are Safe4. Children are Positively
Connected5. Families are Strong and
Stable6. School are Connected to
the Community7. Neighbourhoods are
Where we Live, Work and Play
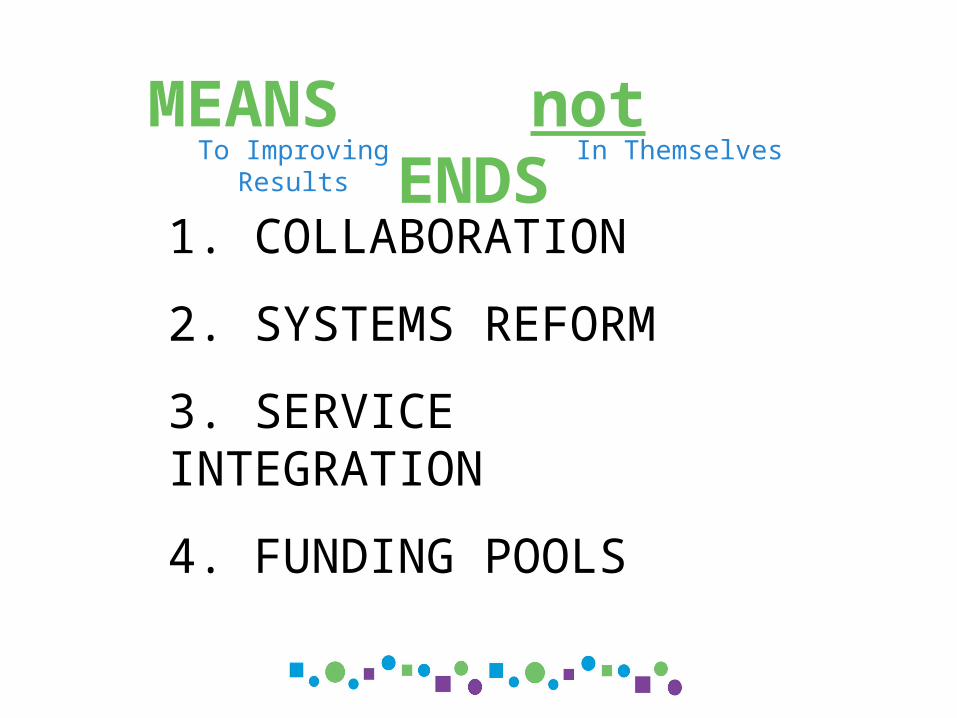
MEANS not ENDS
1. COLLABORATION
2. SYSTEMS REFORM
3. SERVICE INTEGRATION
4. FUNDING POOLS
To Improving Results In Themselves
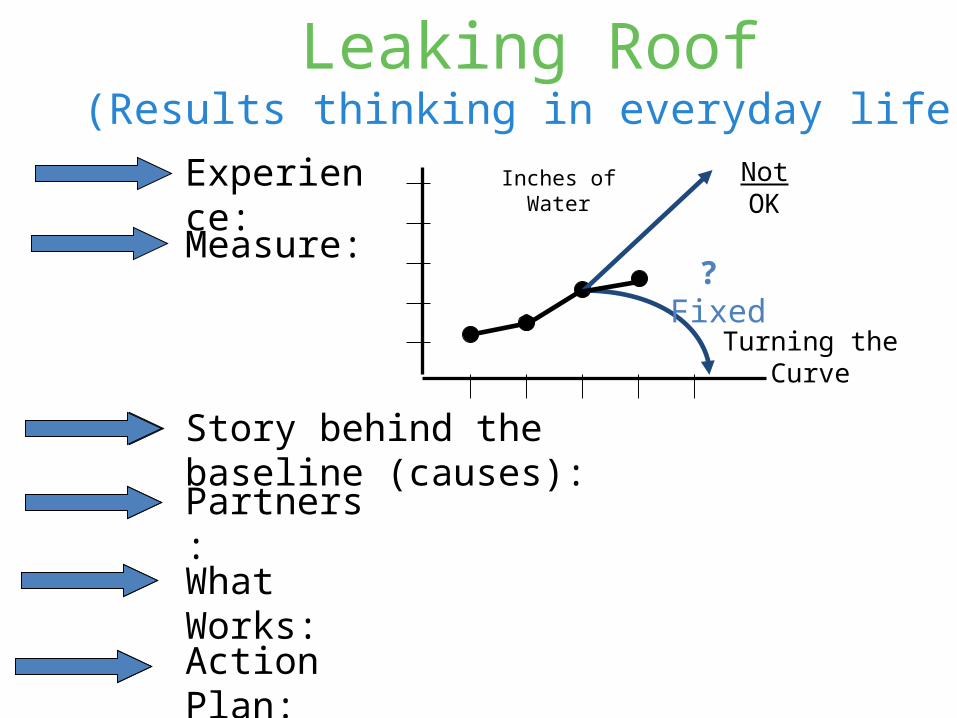
Leaking Roof(Results thinking in everyday life)
Experience:
Measure:
Story behind the baseline (causes):
Partners:
What Works:
Action Plan:
Inches of Water
? Fixed
Not OK
Turning the Curve
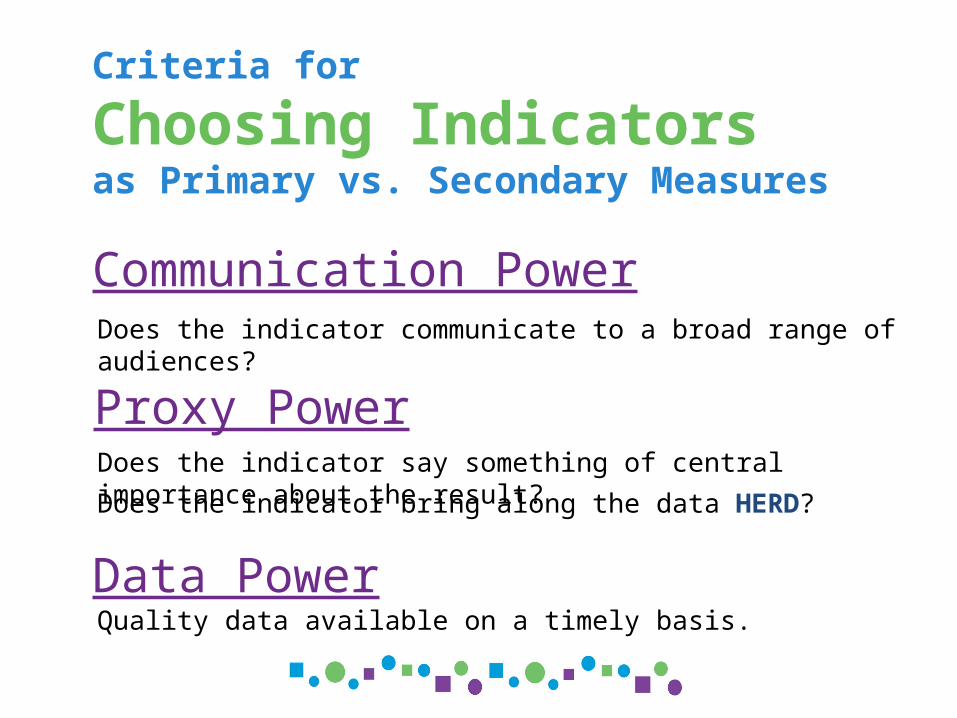
Criteria for
Choosing Indicatorsas Primary vs. Secondary Measures
Communication Power
Proxy Power
Data Power
Does the indicator communicate to a broad range of audiences?
Does the indicator say something of central importance about the result?
Does the indicator bring along the data HERD?
Quality data available on a timely basis.
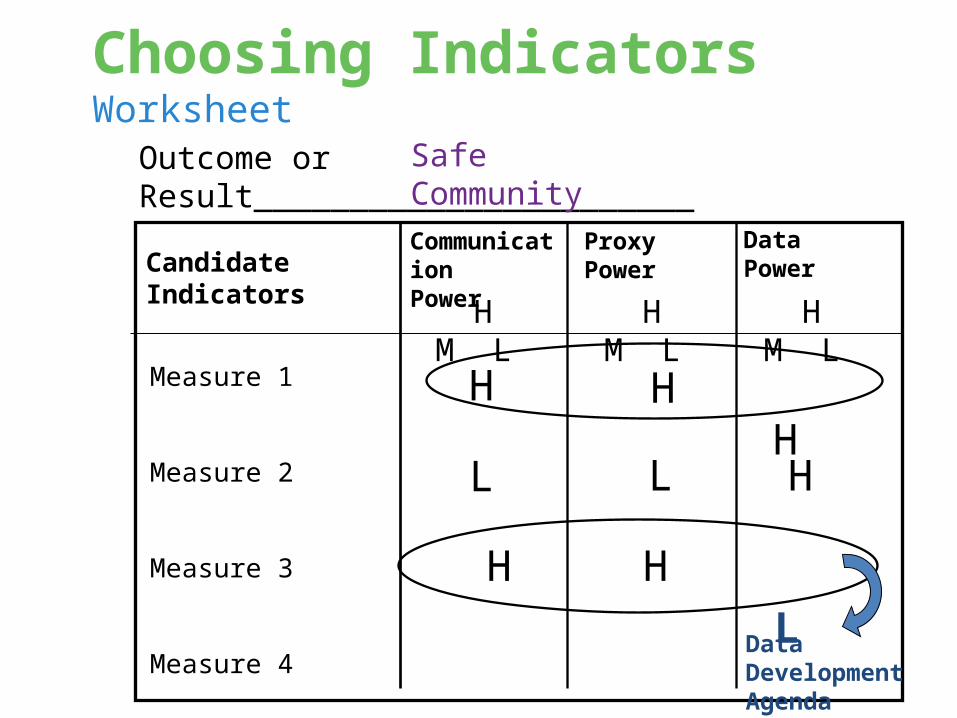
Choosing IndicatorsWorksheet
Outcome or Result_______________________
Candidate IndicatorsCommunicationPower
Proxy Power
DataPower
H M L
HMeasure 1
Measure 2
Measure 3
Measure 4
H
Data DevelopmentAgenda
Safe Community
H M L H M L
H H
H L
L HL
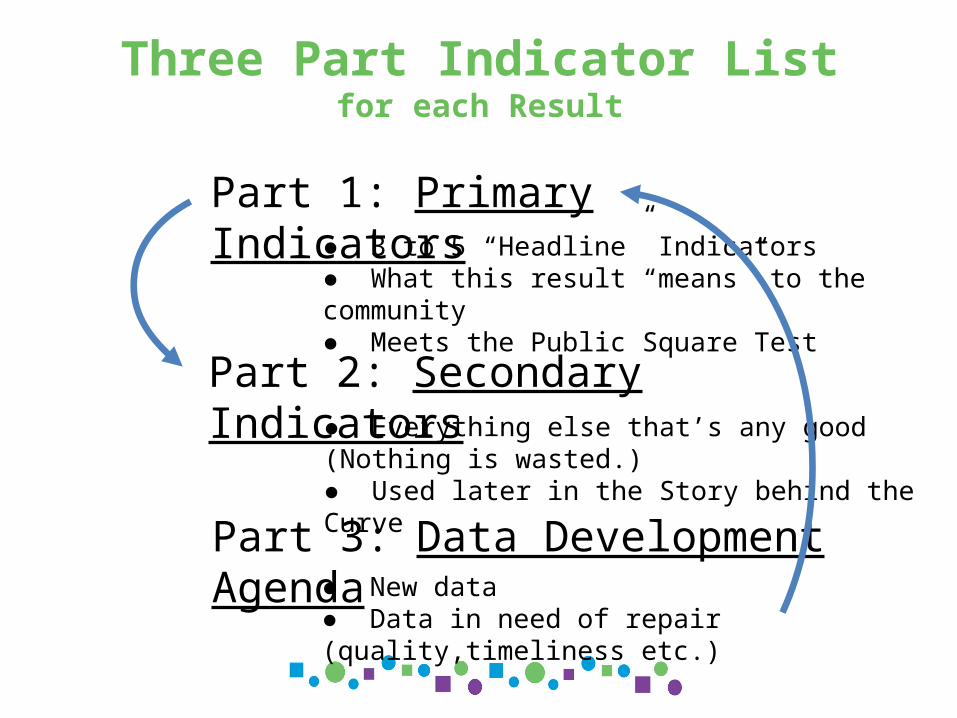
Three Part Indicator Listfor each Result
Part 1: Primary Indicators
Part 2: Secondary Indicators
Part 3: Data Development Agenda
● 3 to 5 “Headline” Indicators● What this result “means” to the community● Meets the Public Square Test
● Everything else that’s any good (Nothing is wasted.)● Used later in the Story behind the Curve
● New data● Data in need of repair (quality,timeliness etc.)
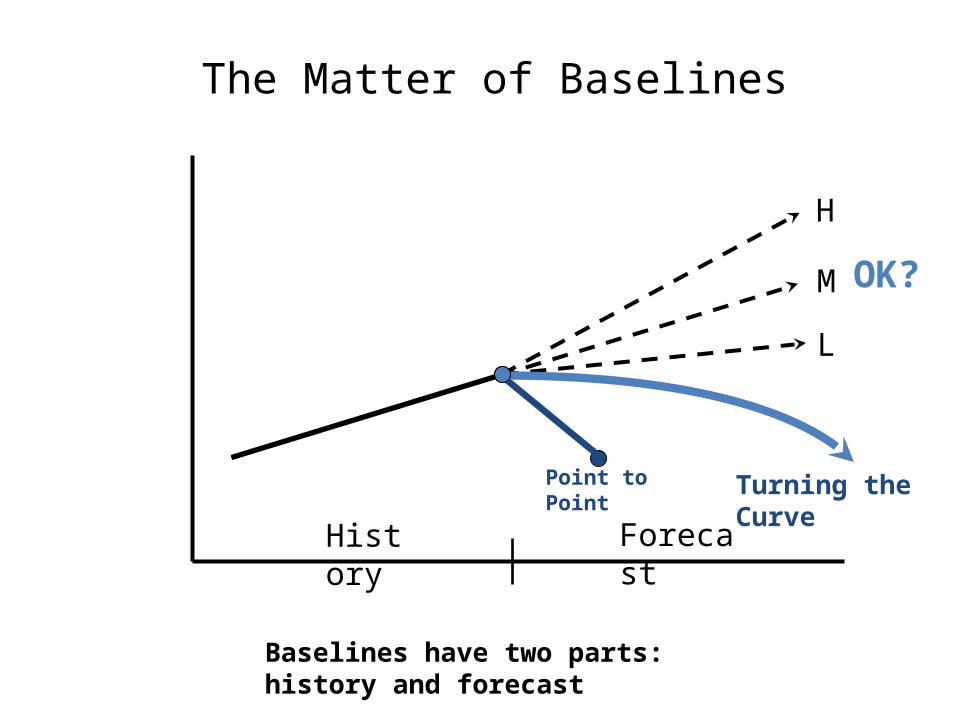
The Matter of Baselines
Baselines have two parts: history and forecast
H
M
L
History Forecast
Turning the CurvePoint to Point
OK?
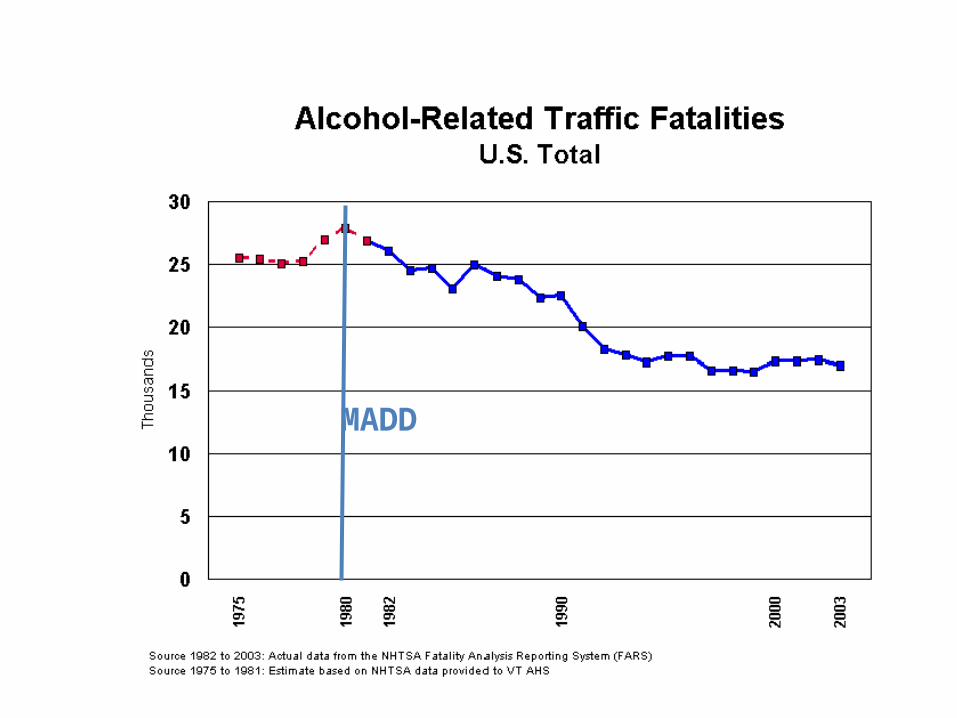
MADD
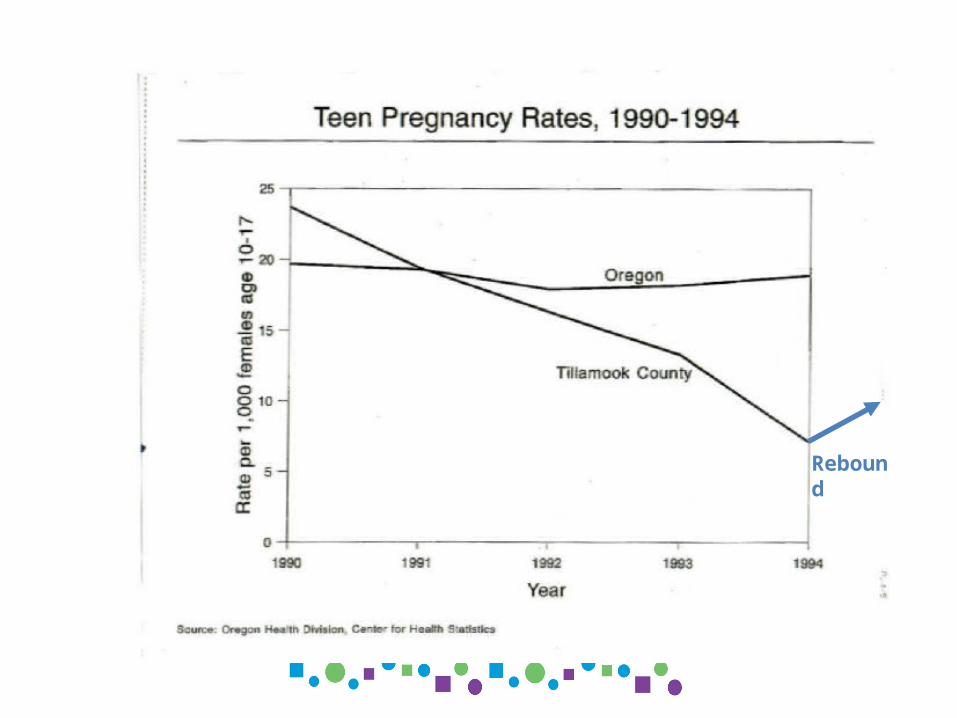
Rebound
Questions?
RBA in Niagara RegionLisa Gallant
Coordinator, Healthy Living Niagara