Embed Size (px)
Citation preview
Please cite this paper as:
Liapis, P. (2015-03-04), “Agricultural Specific Trade FacilitationIndicators: An Overview”, OECD Food, Agriculture andFisheries Papers, No. 74, OECD Publishing, Paris.http://dx.doi.org/10.1787/5js4wzp09q6f-en
OECD Food, Agriculture and FisheriesPapers No. 74
Agricultural Specific TradeFacilitation Indicators
AN OVERVIEW
Peter S. Liapis
OECD FOOD, AGRICULTURE AND FISHERIES PAPERS
This paper is published under the responsibility of the Secretary-General of the OECD.
The opinions expressed and the arguments employed herein do not necessarily reflect the
official views of OECD member countries.
The statistical data for Israel are supplied by and under the responsibility of the relevant
Israeli authorities. The use of such data by the OECD is without prejudice to the status of the
Golan Heights, East Jerusalem and Israeli settlements in the West Bank under the terms of
international law.
The publication of this document has been authorised by Ken Ash, Director of the Trade
and Agriculture Directorate.
Comments are welcome and may be sent to [email protected].
© OECD (2015)
You can copy, download or print OECD content for your own use, and you can include excerpts from OECD publications, databases and multimedia products in your own documents, presentations, blogs, websites and teaching materials, provided that suitable acknowledgment of OECD as source and copyright owner is given. All requests for commercial use and translation rights should be submitted to [email protected].
OECD FOOD, AGRICULTURE AND FISHERIES PAPER N°74 © OECD 2015
Abstract
AGRICULTURAL SPECIFIC TRADE FACILITATION INDICATORS:
AN OVERVIEW
Peter Liapis, Senior Agricultural Policy Analyst, OECD
Trade facilitation matters. Estimates of trade friction costs from border and custom
procedures are relatively high. Trade facilitation to allow for the speedy movement of traded goods
may be more important for agricultural, especially perishable, products than for other goods
because of their time sensitivity, especially for developing countries. Data suggest that many
countries across the geographic and income spectrum have improved their performance on several
trade facilitation variables. Concurrently, agricultural trade has grown substantially, especially
from low and lower middle income countries. The data suggest that further improvements to trade
facilitation in many low and lower middle income countries are needed for them to catch up with
best practices. Impediments to trade remain, as indicated by the relatively high tariff equivalent of
trade costs, especially on agricultural products.
Key words: Agricultural trade, perishable products, trade facilitation, developing countries,
sanitary and phytosanitary standards, trading time.
Acknowledgement
I would like to thank Jean-Louis Keene from Sciences-Po for his contribution to the
literature review section. The draft also benefited from comments and suggestions by the Delegates
to the Joint Working Party on Agriculture and Trade.
AGRICULTURAL SPECIFIC TRADE FACILITATION INDICATORS: AN OVERVIEW – 3
OECD FOOD, AGRICULTURE AND FISHERIES PAPER N°74 © OECD 2015
Table of contents
Summary .................................................................................................................................................... 5
1. Introduction ............................................................................................................................................ 6
2. WTO agreement on trade facilitation ..................................................................................................... 7
3. Applying the OECD trade facilitation indicators to agricultural trade data ........................................... 8
4. Trade facilitation: customs, logistics, infrastructure and trade time ...................................................... 9
Border procedures: time and documents ............................................................................................ 9
Trade Logistics performance ........................................................................................................... 12
5. Trade facilitation: non-tariff measures and trade restrictiveness ......................................................... 14
6. Trade facilitation: regulations, standards and compliance capacity ..................................................... 15
Impacts of Standards, sanitary and phytosanitary measures and technical barriers to trade ............ 16
Standards harmonisation .................................................................................................................. 17
Standards compliance capacity ........................................................................................................ 18
7. Summary of the literature review ......................................................................................................... 19
8. Evolution of selected trade facilitation measures ................................................................................. 23
9. How important is trade of perishable products? ................................................................................... 30
Who is exporting perishable products? ............................................................................................ 31
And which group of countries is importing them? ........................................................................... 33
Which direction is the trade flowing? .............................................................................................. 34
10. Which low income countries are the major traders? .......................................................................... 36
Which lower middle income countries are the major traders? ......................................................... 39
11. Use characteristics of traded agricultural products ............................................................................ 43
12. Value of saving time .......................................................................................................................... 46
13. Summary and conclusions.................................................................................................................. 48
References ................................................................................................................................................ 51
Annex I. Summary Of Reviewed Empirical Studies ................................................................................ 55
Annex II. List of perishable products ....................................................................................................... 61
Tables
Table 1. Summary of results reporting changes in trade or trade costs for different indicators
of trade facilitation ................................................................................................................ 22
Table 2. Summary statistics for selected indicators of timeliness to export in 2007 and 2014 ........... 24
Table 3. Summary statistics for selected indicators of cost to export in 2007 and 2014 ..................... 25
Table 4. Summary statistics for selected indicators of timeliness to import in 2007 and 2014........... 26
4 – AGRICULTURAL SPECIFIC TRADE FACILITATION INDICATORS: AN OVERVIEW
OECD FOOD, AGRICULTURE AND FISHERIES PAPER N°74 © OECD 2015
Table 5. Summary statistics for selected indicators for cost to import for 2007 and 2014 ................. 28
Table 6. Exports of perishable and other agricultural products 2000 and 2011 (USD million) .......... 31
Table 7. Direction of trade in 2000 and 2012 ...................................................................................... 35
Table 8. Where agricultural exports from low income countries went in 2000 and 2012 ................... 36
Table 9. Ten leading low income agricultural exporting countries ..................................................... 38
Table 10. Ten leading low income agriculture importing countries ...................................................... 39
Table 11. Ten leading lower middle income country agricultural exporters ......................................... 41
Table 12. Ten leading lower middle income country agricultural importers ........................................ 42
Figures
Figure 1. Average time delays to import or export in 2014 .................................................................. 29
Figure 2. Trade of all agricultural and perishable goods and their share .............................................. 31
Figure 3. Exports of perishable goods by income category (USD million) .......................................... 32
Figure 4. Exports of perishable goods as a percent of total agricultural exports
by income category ............................................................................................................... 33
Figure 5. Imports of perishable goods by income category (USD million) .......................................... 34
Figure 6. End use of traded agricultural and non-agricultural products ............................................... 44
Figure 7. Agricultural exports by income category and intended use by partners ................................ 45
Figure 8. Agricultural imports by income category and intended use .................................................. 45
AGRICULTURAL SPECIFIC TRADE FACILITATION INDICATORS: AN OVERVIEW – 5
OECD FOOD, AGRICULTURE AND FISHERIES PAPER N°74 © OECD 2015
Summary
Trade facilitation matters. Estimates of trade friction costs from border and custom
procedures (direct trade transaction cost) amount to 2% to 15% of the value of traded goods (Moïsé
and Le Bris (2013). As reported in Shephard and Wilson (2008), several studies show increased
trade flows and benefits from trade facilitation improvements comparable to full liberalization of
goods and services. Estimates from Hummels et al. (2007) suggest that the tariff equivalent of time
delays involved in processing documents, transporting goods to the border, clearing customs and
loading the cargo on to the vessel, are higher than applied tariffs faced by exporters in most
regions. Trade facilitation may be more important for agricultural rather than manufacturing trade,
especially from lower income countries. As reported by Moïsé and Le Bris (2013) trade transaction
costs (for narrowly defined trade facilitation) are higher for agro-food products than manufactured
goods due to more stringent and numerous border procedures, physical inspections and SPS
requirements, and the perishable nature of many agricultural products which entail a higher
sensitivity to delivery delays. Calculations of trade costs excluding tariffs by Duval et al. (2012)
confirm that they are higher for agricultural products compared to industrial goods.
The purpose of the study is: to provide an extensive literature review of empirical studies
on trade facilitation, including a specific analysis for agricultural goods; to give an overview of
recent trends in agricultural and merchandise trade, including relevant policy lessons; to identify
knowledge gaps and provide some guidance on information needs for developing trade facilitation
variables for agricultural specific trade.
International trade in goods has evolved, especially in the last two decades from trading
mostly goods destined for final consumption, to trading intermediate goods destined as inputs for
further processing prior to final consumption either domestically or abroad. The fragmentation of
production has been assembled into value chains either regional or global. A country’s ability to
connect to value chains and its location within the chain are partly determined by its ability to meet
standards and efficiently move goods through its borders. Innovative work by Hummels and his
various co-authors demonstrate that firms and consumers are willing to pay a premium to avoid
delays to receive time-sensitive imported goods. Such goods include not only perishable
agricultural products but manufactured intermediate inputs within GVCs. Trade facilitation
measures which aim to speed the trading process, lower costs and improve the efficiency of
procedures involved in moving goods between countries become more important in this context.
Time and motion data from the Trading Across Borders database suggest that many
countries across the geographic and income spectrum have improved their performance on several
trade facilitation variables. The number of documents needed to trade has been reduced and there
have been improvements in the timeliness of clearing customs, as well as the time needed to
transport the goods to the port and to get the shipment on-board a vessel for exported or imported
goods. Although these variables as measured are more representative of manufacturing rather than
agricultural trade, low income countries are diversifying their export basket and generating a larger
proportion of their export earnings from manufactures and improvements in these metrics suggest
an overall improvement in their trading environment.
At the same time, agricultural trade, including perishable products has grown substantially
especially for low and lower middle income countries. In addition to improvements in trade
facilitation, tariffs have fallen contributing to the trade expansion. Nonetheless, low income
countries, despite high growth rates only supply about 2% of the world’s agricultural exports and
6 – AGRICULTURAL SPECIFIC TRADE FACILITATION INDICATORS: AN OVERVIEW
OECD FOOD, AGRICULTURE AND FISHERIES PAPER N°74 © OECD 2015
less than 1% of the world’s non-agricultural exports. Lower middle-income countries on the other
hand, increased their market share especially of agricultural exports.
The specificities of trading agricultural products suggest that trade facilitation proxy
variables as currently measured, may not be representative of the trade frictions associated with
their trade. Better measurements of the conventional trade facilitation variables that single out
agricultural products are needed. Additionally, there are behind the border procedures such as
meeting SPS standards that are important for many agricultural products that need to be taken into
account along with potential differences associated with different modes of transporting
agricultural goods across international borders such as air transport or cold storage. The literature
review identified several variables that are useful for generating agricultural specific trade
facilitation indicators when they are measured with respect to trading agricultural particularly
perishable products.
For perishable agricultural products whose trade is particularly time sensitive and where
food safety and health standards may be more scrutinised, low income countries have increased the
share of earnings as their agricultural export basket has shifted to exporting relatively more of
these goods. The circumstantial evidence suggests that the capacity to meet food safety health and
other standards as well as timely delivery in many low and lower middle income countries may not
be binding constraints. This is not to imply that further improvements to trade facilitation are not
warranted. The data suggest that many low and lower middle income countries have some ways to
go to catch up with best practices. Impediments to trade remain as indicated by the relatively high
tariff equivalent of trade costs, especially on agricultural products.
1. Introduction
Trade facilitation refers to policies and measures aimed at easing trade costs by improving
efficiency at each stage of the international trade chain. According to the WTO definition, trade
facilitation is the “simplification of trade procedures”, understood as the “activities, practices and
formalities involved in collecting, presenting, communicating and processing data required for the
movement of goods in international trade.” This is the definition also followed by OECD work on
trade facilitation.
Taking a narrow approach, trade facilitation refers to policies and measures which address
the logistics of moving goods across borders and efficiently processing customs documentation
associated with cross-border trade (Wilson, Mann and Otsuki, 2005). Wider definitions often
expand the focus on customs and transit to also include transport and telecommunications
infrastructure, banking and insurance, business practices, and standards and regulations (Moïsé and
Sorescu, 2013). In this wider sense, trade facilitation measures address both at-the-border and
behind-the-border trade costs and bottlenecks throughout value chains. For example, measures
concerning trade finance, conforming to standards and regulations and logistics and transport
infrastructure can affect costs on either side of the border, while issues concerning customs
administrative steps and efficiency present at-the-border direct and indirect costs in terms of time
and procedural delays (Moïsé and Le Bris, 2013).
Whatever the definition and scope, existing economic analysis of trade facilitation usually
draws on the notion of trade transaction costs and seeks to assess the benefits of (efficiency-
enhancing) trade facilitating measures by estimating the costs of inefficiency in the various policy
areas influencing the movement of goods. It is within this context that the OECD has developed a
series of Trade Facilitation Indicators (TFIs) to evaluate the relative impact of trade facilitation
measures and further help identify and address specific facilitation hurdles of given countries
(Moïsé and Sorescu, 2013).
The purpose of the study is: to provide an extensive literature review of empirical studies
on trade facilitation, including a specific analysis for agricultural goods; to give an overview of
AGRICULTURAL SPECIFIC TRADE FACILITATION INDICATORS: AN OVERVIEW – 7
OECD FOOD, AGRICULTURE AND FISHERIES PAPER N°74 © OECD 2015
recent trends in agricultural and merchandise trade, including relevant policy lessons; to identify
knowledge gaps and provide some guidance on information needs for developing trade facilitation
variables for agricultural specific trade.
The rest of the paper is structured as follows. Section 2 provides a brief summary of the
recent WTO agreement on trade facilitation, sections 3 to 7 provide an extensive review of
empirical literature that examined border and other impediments to trade.1 First, the findings and
limitations from the OECD TFIs for agricultural trade by income and geographical groups are
outlined. Section 4 presents insights from studies using measures of customs performance,
logistics, infrastructure, and time delays in exports. Section 5 briefly reports on evaluations which
adopt more general indicators for trade restrictiveness and non-tariff measures. Section 6 explores
the literature on regulatory environments, standards compliance capacity, and standards
harmonisation. Section 7 concludes the literature review by summarising the main findings of the
review, identifying gaps and limitations in the empirical literature and suggesting potential avenues
for future research. For quick reference, Annex I provides a brief summary of the reviewed
empirical studies. The subsequent section provides a summary of some key trade facilitation
indicators often used in empirical analysis to document their progression. This is followed by
background information on general agricultural trade patterns especially for low and lower middle
income countries, emphasising trade in perishable goods. The last section summarises and
concludes.
2. WTO agreement on trade facilitation
WTO Members reached an important agreement to facilitate trade at the Bali Ministerial
in December 2013. The agreement is comprehensive covering the various border processes of
importing or exporting. An extensive discussion of the agreement is beyond the scope of this
paper. Suffice to say, the Agreement includes language on improving information flows, non-
discrimination and impartiality, disciplining fees and charges imposed on importation or
exportation among others, along with creating a Committee on Trade Facilitation so that Members
can meet and consult regarding the operation of the agreement. The Committee was tasked to
i) conduct a legal review of the Trade Facilitation Agreement, ii) receive notifications from
members on the commitments they can undertake immediately (Category A commitments) and
iii) draw up a Protocol of Amendments to insert the Agreement into Annex 1A of the WTO
Agreement. The Agreement also includes Special and Differential Treatment for Developing and
Least Developed Members. Developing and least developed Members have the option to place
each provision of the Agreement into one of three categories, with each Developing and Least
Developed Member self-selecting which provision is placed into which category.
Category A contains provisions that are designated by the country for implementation
upon entry into force of the Agreement, with least developed countries given up to one
year to implement the provisions.
Category B contains provisions that are designated for implementation on a date after a
transitional period of time following the entry into force of the Agreement.
Category C contains provisions that are designated for implementation on a date after the
transitional period of time following the Agreement’s entry into force and requiring
technical assistance in order to implement the provisions
The legal review was completed by members in July 2014. Delegations have begun to
submit their Category A notifications. Work on the Protocol started but the July 31 2014 deadline
passed without members reaching consensus on the adoption of the Protocol. Countries bridged
1. The literature review sections were prepared mainly by Mr Jean-Louis Keene.
8 – AGRICULTURAL SPECIFIC TRADE FACILITATION INDICATORS: AN OVERVIEW
OECD FOOD, AGRICULTURE AND FISHERIES PAPER N°74 © OECD 2015
their differences and reached an agreement in late November, 2014, placing the proceedings back
on track.
Of interest to this paper is the explicit signalling out perishable products under Article 7
paragraph 9 for their speedy release in order to prevent avoidable loss or deterioration given that all
regulatory requirements are met. The Agreement stipulates to release perishable goods under
normal circumstances within the shortest possible time; and provide for the release of perishable
goods, in exceptional circumstances where it would be appropriate to do so, outside the business
hours of customs and other relevant authorities. Furthermore, priority should be given to perishable
goods when scheduling any examination, and arrange or allow the importer to arrange proper
storage of perishable goods and where practical and consistent with domestic legislation, allow for
release to take place at the storage facilities.
3. Applying the OECD trade facilitation indicators to agricultural trade data
The Trade Facilitation Indicators developed by the OECD form a broad set of 16
indicators (derived from 97 variables collected from publicly available data and verified by the
authorities of concerned countries) on import, export and transit trade ranging from information
availability, advance rulings and appeals, to formalities concerning documentation, time delays,
automation and procedures.2 Applying these indicators in a quantitative setting, Moïsé and
Sorescu, (2013) estimate the impact of each TFI on bilateral trade flows of developing countries
through a gravity trade model. Estimations are conducted for their entire sample of 106 non-OECD
countries as well as for separate income and geographic country groupings. Sub-sample
regressions also differentiate between aggregate trade and manufacturing and agricultural sector
specific trade. Overall, the TFIs appear to perform quit well for estimations of aggregate trade and
manufacturing sector trade flows, with the most statistically meaningful results found when all
sectors are included. Results are however less consistent for agricultural trade where reported
coefficients tend to be non-significant and less robust to changes in model specifications.3 The
authors suggest that this may be due to the limited number of agricultural sector specific variables
included in the indicators’ design.
Results also appear to vary greatly across income groups and regions regardless whether
the sample included the country groupings only as importing - from or only as exporting - to other
countries in the sample. Running agricultural sector trade estimations split by income level sub-
samples finds that none of the TFIs are statistically significant and robust across all model
specifications for either agricultural imports by, or exports from, low income countries. Three
TFIs, namely information availability, formalities-documents and governance and impartiality,
appear to be robust in the case of imports to lower middle income countries, however only the
indicator for governance and impartiality is robust in the case of exports. For upper middle income
countries, only one TFI – formalities-procedures – appears significant and robust for either imports
or exports. In all these cases, robust TFIs show a positive relationship with agricultural trade flows;
improving the indicator increases agricultural trade.
Estimations for regional country grouping sub-samples also reveal similarly limited
results. None of the TFIs are significant and robust in the case of exports from Sub-Saharan Africa,
while only the indicator for governance and impartiality is robust in the case of imports to the
region. Only TFIs for formalities-documents and formalities-automation appear robust across all
2. A detailed presentation of the TFIs and their components and data sources are given in Moïsé,
Orliac and Minor (2011) and Moïsé et al. (2013a).
3. The Significance levels of coefficients for TFIs appear to be quite sensitive to model specifications
and are either not statistically significant across all regressions or reverse signs across the four
models tested.
AGRICULTURAL SPECIFIC TRADE FACILITATION INDICATORS: AN OVERVIEW – 9
OECD FOOD, AGRICULTURE AND FISHERIES PAPER N°74 © OECD 2015
model specifications for imports to the Middle East and North Africa region. Again, none of the
TFIs are robust across all specifications in the case of exports. Similar findings are reported for
Asia where only formalities-documents and formalities-automation are robust for imports and no
TFIs are robust in the case of exports. Focussing on Latin America and the Caribbean one TFI, for
formalities-automation, appears robust in the case of imports, although indicators for advance
rulings, formalities-documents, and formalities-procedures are all robust for exports. Finally,
formalities-documents is the only significant and robust TFI in the case of imports to non-OECD
Eastern Europe and Central Asia countries, while both formalities-procedures and governance and
impartiality are robust in the case of exports. Again, coefficients for this limited set of robust
indicators are positive throughout model specifications.
4. Trade facilitation: Customs, logistics, infrastructure and trade time
Aside from those focusing on measures of regulations, most empirical studies evaluating
the impacts of trade facilitation on agricultural trade tend to focus on customs performance,
infrastructure and logistics efficiency, and overall trade times. These evaluations tend to rely on
more general indicators such as the number of days for export and import, the number of
documents needed, infrastructure quality, and shipping connectivity and logistics performance
indices as proxies for more specific aspects of trade facilitation.4 Nearly all of the studies identified
by this review use more general indicators taken from the World Bank Doing Business surveys, the
World Bank Logistics Performance Index, World Trade Indicators, World Development Indicators
or the World Economic Forum Global Competitiveness Report. While these indicators may be
more representative of aggregate trade flows and stylised shipments than sector specific
constraints, the absence of agriculture-specific measures suggests that accessible cross-country
data on agricultural trade constraints may be limited. In an effort to discern wider trends in the
literature, empirical findings are grouped by general categories of indicators and reported in the
sub-sections below.
Border procedures: Time and documents
Import and export times and unreliable time delays can present important direct and
indirect trade costs through repercussions on inventory holding and buffer stocks, slowdowns in
production chains and just-in-time production, and deterioration of quality or value of perishable
and time-sensitive goods (Nordås, Pinali, and Grosso, 2006; Moïsé and Le Bris, 2013). Trade time
can be particularly important for agricultural products due to risks of spoilage, especially in the
case of more sensitive products such as fresh produce, horticultural goods or meats and dairy
products. While less specific than other proxies of trade facilitation, average measures of days to
export and import, such as the ones developed by the World Bank Doing Business Database, do
represent typically expected delays throughout the entire export or import process albeit not
reflecting time-sensitive products.5
Studies evaluating the impact of more general trade times tend to report a significant and
negative relationship between time delays and bilateral trade in most agricultural sectors, though
the importance of these effects seem to vary across types of goods. Not surprisingly, evaluations
generally find a stronger effect of time delays on more perishable and time-sensitive products.
4 Many of these are used as inputs in the construction of some of the 16 TFIs developed by the
OECD discussed above.
5 Trade times reported by the World Bank Doing Business reports are estimated for a standard cargo
of goods by sea transport, from the start of procedures until shipments leave the country. These
include time obtaining documents, inland transport and handling, customs clearance and
inspections, and port and terminal handling, but do not include ocean transport time. Note that the
standard cargo does not require cold storage or special handling.
10 – AGRICULTURAL SPECIFIC TRADE FACILITATION INDICATORS: AN OVERVIEW
OECD FOOD, AGRICULTURE AND FISHERIES PAPER N°74 © OECD 2015
Looking at bilateral trade flows of aggregate and processed agricultural goods6, Liapis
(2011) finds a statistically significant and negative association between time delays7 and
agricultural trade, suggesting that a 10% reduction in export time is associated with a 9.6%
increase in overall bilateral agricultural trade and a 17% increase in traded processed goods for the
given country sample. A 10% improvement in import times, on the other hand, is associated with a
22% increase for overall agricultural trade, but does not have a statistically significant effect on
processed products. Most of the impacts of export time on processed goods also appear to occur on
the extensive rather than intensive margin, with time delays affecting the price and variety of
products exported rather than volume. Using the number of days needed to export goods8 as a
proxy for trade transaction costs, Persson (2013) reports a negative and statistically significant
effect of export time on the number of agricultural products exported from developing countries to
the European Union (EU).
Looking at sector specific trade, effects appear to be stronger in the case of animal or
vegetables fats, waxes and oils, and live animal and animal products than in the case of vegetable
products. Export times are not statistically significant in the case of prepared foodstuffs, beverages,
spirits and vinegar and tobacco, which may reflect the lower time sensitivity of these types of
goods. Adopting a similar sectorial estimation approach, Martinez-Zarzoso and Marquez-Ramos
(2008) find that both time for import and time for export (as measured by the World Bank Doing
Business Database) are significant and negatively associated with trade volumes of coffee, tea,
cocoa, spices and manufactures thereof, though export times seem to have a somewhat stronger
effect than import times. Focusing on time-sensitive fruit and vegetable products9 Djankov, Freund
and Pham (2006, 2010) find a significant and negative effect of export times, estimating that a 10%
increase in time delays is associated with a 3.5% reduction in the volume of such exports in their
sample.
The impact of import and export times can vary across sectors depending on time
sensitivity, while reductions in trade times can affect aggregate trade volumes. Preliminary World
Bank research as reported in a presentation at Columbia University suggests that reducing time to
export by one day could increase industrial good exports by 3.4% and agricultural exports by 4.5%
(Wilson 2012). Trade time, is also likely to affect a country’s composition of trade. Minor and
Tsingas (2008) estimate average tariff equivalents of time savings per day for exports and use a
computable general equilibrium model to simulate the impact of a reduction in export times on the
trade composition of Sub-Saharan African countries. These simulations suggest that a 50%
decrease in export time triggers reduction in the share of basic agriculture to total exports and an
increase in the share of fresh and processed agriculture, most notably in the exports of vegetables,
fruits and nuts.
Other customs procedures, regulations and administrative requirements can present
important sources of trade frictions. These can involve significant direct costs in terms of
supplying information and documents and complying with inspection and clearance procedures, as
well as indirect costs linked to at-the-border slowdowns and time delays. The United Nations
Economic and Social Commission for Asia and the Pacific (UNESCAP) notes that bureaucratic
6. Processed goods are taken as goods that require extensive transformation and are closer to the
consumer, such as chocolates, beverages and fresh or chilled meats.
7. Time delays, expressed as the number of days needed to export or import a good, are taken from
the World Bank Trading Across Borders Database.
8. Numbers of days needed to export a good are taken from the World Bank Doing Business
Database.
9. Agricultural goods with a minimum storage life of three weeks or less are classified as time-
sensitive
AGRICULTURAL SPECIFIC TRADE FACILITATION INDICATORS: AN OVERVIEW – 11
OECD FOOD, AGRICULTURE AND FISHERIES PAPER N°74 © OECD 2015
procedures and documents needed for trade can be an important source of transaction delays and
inefficiencies such as the duplication of information, while delays at the border caused by
excessive controls and physical inspection procedures, lack of coordination among border
agencies, and lengthy clearance procedures can pose significant bottlenecks to trade (UNESCAP,
2011). That administrative procedures can add to time delays was also found by Djankov, Freund
and Pham (2010). In examining various components in export procedures they conclude that only
about one-fourth of export time delays were caused by poor road or port infrastructure. The rest
was from administrative hurdles including custom and tax procedures.
As UNESCAP suggests, agricultural products often face more complex border procedures
such as sanitary and phytosanitary certificates, export quota clearance, quarantine measures and
inspection controls which require additional documentation and clearance processes. An analysis
of surveys10
conducted by the OECD and the WTO under the aid-for-trade initiative reveals that
close to 60% of responding lead firms identified customs delays as the main trade problem when
dealing with agro-food suppliers from developing countries (OECD and WTO, 2013a). More than
30% of surveyed developing county private sector suppliers also identified customs paperwork and
delays as important difficulties in connecting to value chains. While evaluating the capacity of
customs and border services to handle and clear agro-food-products could provide a means to
measure trade facilitation performance, most empirical studies rely on broad measures such as
customs times or the number of documents needed to trade as proxies for the customs environment,
suggesting a gap in the available information on customs efficiency and procedures which can be
applied to cross-country analysis.
A few studies propose to evaluate the impacts of at-the-border delays using measures of
the average number of days to clear customs and technical controls provided by the World Bank
Doing Business reports. These evaluations, however, suggest a somewhat limited impact of
customs times on agricultural trade, which may also be sensitive to country particularities and
types of goods traded. Further highlighting the costs of trade delays on time-sensitive goods, Liu
and Yue (2013) find that customs clearance times have different quality and price effects across
agricultural exports. Taking exports in lettuce, apples and groundnuts to reflect three degrees of
perishability, estimations report a statistically significant and negative effect of customs times on
both quality and price of highly perishable goods (lettuce). Results further indicate a negative and
statistically significant relationship with quality, but no significant effect on price in the case of
moderately time-sensitive goods (apples), and no statistically significant effect on either quality or
price in the case of less perishable goods (groundnuts). Freund and Rocha (2005) also evaluate the
impact of customs and technical control clearance time on time-sensitive agricultural exports from
African countries using a similar approach to that of Djankov, Freund and Pham (2006, 2010) but
find no statistically significant relationship.
Studies using World Bank Doing Business measures for the number of documents and
time to obtain and complete documentation also seem to find similarly limited effects. Liapis
(2011) finds no statistically significant effect of number of documents needed for export on trade
flows of processed agricultural products. Freund and Rocha (2005) also report non-significant
coefficients for documentation time on time-sensitive African exports. Estimations by Martinez-
Zarzoso and Marquez-Ramos (2008), on the other hand, do present a significant and negative
effect of number of documents for import on bilateral trade in the case of coffee, tea, cocoa, spices
and manufactures thereof.
Taking an alternative approach, Hummels et al. (2007) using import data by mode of
transport (air or ocean shipping) into the United States, calculate the premium that firms are willing
10. The survey was undertaken by the OECD and the WTO, in collaboration with Growth Africa, in
preparation for the 4th
Global Review on Aid for Trade, and recorded 257 responses from agrifood
firms located in 78 countries or territories.
12 – AGRICULTURAL SPECIFIC TRADE FACILITATION INDICATORS: AN OVERVIEW
OECD FOOD, AGRICULTURE AND FISHERIES PAPER N°74 © OECD 2015
to pay to air ship rather than face an additional day’s delay of ocean shipping. They find that the
premium varies across products and it is higher for time sensitive goods. Their findings are
discussed in more detail below.
A couple of studies further suggest using measures of irregular payments connected with
import and export permits as an indicator for customs administration. Again, the significance of
results varies by country or region studied. Examining trade flows in food products in Southeast
Asia, Shepherd and Wilson (2008) find that irregularities in payments for permits are not
statistically significant. Soloaga, Wilson and Mejía (2006) construct a measure of customs
environment, composed of hidden import barriers other than published tariffs and quotas and
irregular payments or bribes connected with import and export permits, which they apply in gravity
model estimations for industrial sector trade flows in Mexico. Surprisingly, while their results
indicate that improving the customs environment has a positive impact for Mexican exporters, they
find a negative impact on food, beverage and tobacco product importers.
Trade logistics performance
Trade logistics play a fundamental role in facilitating the movement of goods and
exchange of related information across borders. Trade logistics systems broadly encompass
infrastructure, and transport procedures and services involved in the movement of goods
throughout trade chains, covering multimodal transportation networks, vehicles, and port facilities
as well as warehouses, storage and handling services, and information and communication
technology (UNESCAP, 2011). Efficient trade logistics can be particularly important for
agricultural products which may be sensitive to time and storage temperature. Illustrating this, the
IFC (2011) reported that in 2010 as much as a third of India’s fresh produce was lost as a result of
poor transportation and storage facilities, representing a waste in fruit, meat, and dairy products of
around USD 13 billion. Fernández et al. (2011) further estimated that logistics costs ranged from
36% to 40% of final price for wheat imports into Nicaragua and Honduras, and 45% to 48% for
corn imports to the two countries. UNESCAP (2011) observed that producers and exporters of
fresh fruits and vegetables in Thailand lost about USD 96.4 million a year due to spoilage and poor
storage, partly caused by a lack of proper cold chain maintenance throughout supply chains.
A couple of studies identified in this review propose to use the World Bank Logistics
Performance Index (LPI)11
in order to capture multiples measures of trade facilitation throughout
trade chains. Supporting the previously mentioned case studies, Arvis et al. (2013) analyse the
determinant of bilateral trade costs for a group of 178 countries and report a statistically significant
and negative effect of logistics performance on overall agricultural trade costs. Weerahewa (2009)
conducts gravity model estimations for food and agricultural exports of SAARC countries12
and
finds that the LPI of exporters and importers have a significant and positive impact on the value of
exports. Using a sub-component of the LPI, the infrastructure quality index13
, Moïsé et al. (2013)
find that agricultural exports of developing countries are highly responsive to the quality of
transport and trade related infrastructure, suggesting that a 10% improvement in infrastructure
11. The LPI is compiled based on ratings from individual country assessments by international freight
forwarders and includes six components: (1) efficiency of clearance process by border control
agencies; (2) quality of trade and transport related infrastructure; (3) ease of arranging
competitively prices shipments; (4) competence and quality of logistics services including
transport operators and customs brokers; (5) ability to track and trace consignments; (6) frequency
of shipments arriving within scheduled or expected delivery time (Arvis et al.. 2012).
12. South Asian Association for Regional Cooperation countries includes Afghanistan, Bangladesh,
Bhutan, India, Maldives, Nepal, Pakistan and Sri Lanka.
13. The index of infrastructure quality reflects the quality of a number of infrastructure elements
including ports, railroads, roads and information technology.
AGRICULTURAL SPECIFIC TRADE FACILITATION INDICATORS: AN OVERVIEW – 13
OECD FOOD, AGRICULTURE AND FISHERIES PAPER N°74 © OECD 2015
quality has the potential of increasing developing countries’ agricultural exports by around 30% for
their country sample. More broadly, Portugal-Perez and Wilson (2012) find that improvements in
hard infrastructure (ports, airports, road and rail and information and communication technology)
bring greater benefits in terms of export growth compared to soft infrastructure (border and
transport efficiency). They add however that such investments are expensive and net benefits and
costs cannot be stated with certainty for a given country.
Most studies identified by this review tend to favour measures of particular aspects of
transport infrastructure rather than broader logistics performance when evaluating the impacts of
trade infrastructure on agricultural products. More particularly, these studies employ indicator of
air and maritime connectivity, road networks and port efficiency, all of which form vital links in
trade networks where inefficiencies can contribute substantially to trade costs.
The OECD and the WTO (2013b) note that while transport costs may be somewhat lower
in the case of agro-food products, in part due to simpler supply chains, these can have a greater
proportional impact on the price of agricultural products due to their low value-to-weight ratio. As
such, transport performance can play an important role in ensuring effective participation in agro-
food chains. The OECD and the WTO (2013a) observe that 56% of surveyed agro-food suppliers
in developing countries identified transportation costs as a barrier to connect to value chains.
Inadequate maritime transport was also identified by around one-quarter of firms. Inadequate
airport capacity or links however, was identified by less than 10% of respondents.
Case studies on transportation and infrastructure costs often demonstrate significant
impacts on agricultural exporters. Looking at the implicit taxation on Ugandan exports caused by
land and sea transport in 1994, Milner, Morrisey and Rudaheranwa (2000) estimate that costs due
to poor marine and land infrastructure together represented an implicit tax of 12% and 40% on
coffee and food exports respectively. A case study of an agro-business firm in Brazil presented by
the World Economic Forum (2013) identified inadequate transport infrastructure as an important
source of delays and increased operational costs, with delays at ports costing as much as
USD 25 000 per vessel per day. Case studies presented by Nordås, Pinali, and Grosso (2006)
further highlighted trade impeding effects of poor quality in physical infrastructure and related
services on dairy exports from the Kyrgyz Republic. The authors also underlined the importance of
efficient air transport in allowing Kenya to exploit a comparative advantage in floriculture and
expand exports of cut flowers.
Evaluations which include a measure of inland transport infrastructure tend to identify a
significant effect on the composition of agricultural trade. Taking measures of inland transit times
from the World Bank Doing Business Reports, Freund and Rocha (2010) find that increases in
transit times reduce African exports of time-sensitive agricultural goods relatively more than time
insensitive goods. This, they suggest, implies that more time delays affect the composition of trade
and prevent countries from exporting higher-value time-sensitive products. Jongwanich (2009)
finds that the density of road networks14
does not have a significant effect on export volumes of
processed foods. However, Jongwanich and Magtibay-Ramos (2009) do identify a statistically
significant effect of road density on changes in the structure of agricultural exports implying that
improvements in transportation and infrastructure would have larger benefits for processed food
industries than for more traditional agricultural export sectors.
The efficiency of ports and maritime transport also appear to have an important effect on
agricultural trade, though this impact may vary across regions. Employing an air connectivity
index and a liner shipping connectivity index15
Arvis et al. (2013) find that maritime connectivity
14. Density of domestic road networks is taken from the World Development Indicators.
15. Air connectivity index is taken from Arvis and Shepherd (2011), while the Liner Shipping
Connectivity Index is computed by UNCTAD. This later index is composed of five components:
14 – AGRICULTURAL SPECIFIC TRADE FACILITATION INDICATORS: AN OVERVIEW
OECD FOOD, AGRICULTURE AND FISHERIES PAPER N°74 © OECD 2015
has a statistically significant and negative effect on trade costs of agricultural products. Air
connectivity, on the other hand, is found to be non-significant. Duval et al. (2012) also report a
negative and significant effect of shipping connectivity on agricultural trade costs, suggesting that
a 10% improvement in the liner shipping connectivity index implies a reduction in trade costs of
nearly 2%. The impact of port connectivity appears to be even greater for ASEAN-OECD trade
flows. Shepherd and Wilson (2008) however find that the quality of sea and air transport16
do not
have a statistically significant effect on trade flows in food products between Southeast Asian
countries. Merging indicators for both air and sea transport Soloaga, Wilson and Mejía (2006)
compute a composite index of port efficiency17
and observe a negative and significant effect of
port facilities on Mexican trade flows in food, beverages and tobacco. Port efficiency in importing
countries further appears to have a higher impact on food imports than exports.
Given the perishable and temperature sensitive nature of many agricultural products,
several case studies and reports have signalled the importance of proper cold storage transport and
handling infrastructure. Consultations with developing country suppliers conducted by the OECD
and WTO identified cold storage and cold chain management as one of the most important
constraints facing agro-food firms, with about one third of surveyed firms referring to it (OECD
and WTO, 2013a). USAID (2011) reported that the nonexistence of cold chain infrastructure
presented significant impediments to agricultural trade in West Africa where poor storage and poor
quality product represented about 20% of market logistics costs. This review however, did not
identify any empirical studies which included measures of cold chain infrastructure.
5. Trade facilitation: Non-tariff measures and trade restrictiveness
A few studies adopt a broader concept of trade facilitation, proposing to assess the impact
of wider trade policy environments using measures of trade restrictiveness. Most of these studies
tend to use an index of non-tariff measures (NTM) based on the tariff trade restrictiveness index
(TTRI) and the overall trade restrictiveness index (OTRI)18
which captures effects of quantitative
restrictions, technical product regulations, anti-dumping and countervailing measures, and
discretionary licensing as well as standards, licencing and similar regulatory environments
(Hoekman and Nicita, 2008). Both the TTRI and the OTRI represent ad valorem tariff equivalent
measures on a country’s imports implied by observed trade policies. While these indices do present
a much broader approach to quantifying the effects of non-tariff measures, Moïsé et al. (2013)
suggest that these provide the best country coverage available to date for non-tariff measures and
do give a realistic overview of constraints faced by countries in practice.
Evaluations quantifying the ad valorem tariff-equivalent of non-tariff measures tend to
find a significant impact of NTMs on overall trade costs of agricultural products, reflecting higher
trade barriers in agricultural sectors. Using the TTRI and OTRI to evaluate trade policy
restrictiveness across sectors, Hoekman and Nicita (2008) show that agricultural trade is
significantly more restricted than in manufacturing. Duvall et al. (2012) decomposed overall trade
restrictiveness into tariff and non-tariff components for regional grouping and also conclude that
(1) number of ships; (2) their container-carrying capacity; (3) maximum vessel size; (4) number of
services; and (5) number of companies that deploy container ships in a country's ports.
16. Quality of sea and air transport are taken from the World Economic forum Global Competitiveness
Report
17. Soloaga, Wilson and Mejía (2006) compute port efficiency as the average of two indexed inputs
for port facilities and inland waterways and air transport, both taken from the Global
Competitiveness Report 2001-2002.
18. Such studies tend to follow the methodology proposed by Kee, Nicita and Olarreaga (2009) to
calculate an overall trade restrictiveness index.
AGRICULTURAL SPECIFIC TRADE FACILITATION INDICATORS: AN OVERVIEW – 15
OECD FOOD, AGRICULTURE AND FISHERIES PAPER N°74 © OECD 2015
agricultural trade costs are much more costly than manufacturing and attribute it to the
perishability and higher level of regulations for food safety or food security reasons. Including
geometric averages of NTM indices for bilateral country pairs in estimations of an extended
gravity model, Duval et al. (2012) find a significant and negative effect of non-tariff measures on
trade costs. Preferred estimates suggest that a 10% reduction in nontariff measures is associated
with a 3% reduction in agricultural comprehensive trade costs. Their findings also indicate
however that natural barriers for example distance, substantially contribute to agricultural trade
costs. Depending on the estimation method, they find that natural barriers contribute from 19% to
30% of trade costs. Following a similar approach to that of the OTRI, Moïsé et al. (2013) include
an index of non-tariff measure restrictiveness19
and a TTRI in gravity model estimations of
agricultural trade flows of developing countries. Contrary to the authors’ expectations, they find a
positive and significant effect of the NTM restrictiveness index on agricultural exports from
developing countries. While they do not rule out data and measurement issues, the authors suggest
that NTMs, and particularly those concerning sanitary and phytosanitary standards, can potentially
increase trade by diminishing information asymmetries. Similarly, Beghin, Disdier and Marette
(2014) find that some NTMs, by addressing market imperfections such as asymmetric information,
can be trade facilitating and welfare enhancing.
6. Trade facilitation: Regulations, standards and compliance capacity
A significantly large body of literature evaluates the impact of standards and regulations
on trade flows of agricultural goods. Most recent empirical studies tend to focus on Sanitary and
Phytosanitary (SPS) standards and Technical Barriers to Trade (TBT), either taking broader
measures of the prevalence of SPS and TBTs or focusing on more specific standards such as
maximum residue levels for specific toxins or pesticides.20
Under the Agreement on Technical
Barriers to Trade and the Agreement on the Application of Sanitary and Phytosanitary Measures
included in the GATT 1994, countries have the right to implement health protection measures and
regulations concerning human, animal, and plant health, as well as accompanying technical
requirements, restrictions, and voluntary standards and procedures (WTO, 1994a, 1994b). While
these agreements recommend that such regulations follow international standards and guidelines
such as those developed by the Codex Alimentarius Commission, the World Organisation for
Animal Health (OIE) or other organizations operating with the framework of the International
Plant Protection Convention, members can implement their own regulations as long as these are
not shown to be discriminatory and comply with the agreements. Notifications of all new SPS
measures must also be submitted to the WTO.
SPS notifications have been used extensively since the ratification of the GATT 1994.
Ferro, Wilson and Otsuki (2013) observe that 10 366 notifications, along with another 2 980
additions, alterations or corrections were filed with the WTO between January 1995 and October
2011. 1 436 of these were filed in 2010 alone. Nicita and Gourdon (2013) estimate that trade of
more than 60% of food-related products are affected by at least one form of SPS measure.
However, the expected impact of standards on agricultural trade is not necessarily clear. As
Crivelli and Groschl (2012) propose, on the one hand compliance with standards may lead to
increased production costs which reduce trade, while on the other, standards may also increase
information on food safety and product quality which can lead to increased consumer confidence,
reduce transaction costs and thus facilitate trade. This would suggest that the effects of standards
19. The non-tariff measure restrictiveness index is compiled as a weighted average of non-tariff
measures tariff-equivalents which include, among others, price and quality control measures,
technical regulations, standards, and monopolistic measures.
20. A more detailed literature review of earlier empirical evaluations and case studies is presented in
OECD (2003) and OECD (2005).
16 – AGRICULTURAL SPECIFIC TRADE FACILITATION INDICATORS: AN OVERVIEW
OECD FOOD, AGRICULTURE AND FISHERIES PAPER N°74 © OECD 2015
likely depend on the capacity of a country’s industries to comply with domestic and foreign
standards. To this extent, Moïsé et al. (2013) suggest that the negative effects of complying with
standards and regulations may be stronger for developing countries where relevant agencies often
lack expertise and resources in standard setting and enforcement. Similarly, the OECD and the
WTO (2013a) find that 60% of surveyed lead firms in global agro-food value chains point to the
ability to meet quality and safety standards as one of the major difficulties in connecting with
developing country suppliers when making sourcing and investment decisions.
Impacts of standards, sanitary and phytosanitary measures and technical barriers to trade
A variety of measures, each with varying implications for trade, including standards on
finished products, standards on procedures, mutual recognition agreements, or embargos, among
others, can be applied under the SPS and TBT banner. Empirical evaluations of the effects of SPS
and TBT measures tend to find a negative effect on agricultural exports from developing countries
to high income countries, but little effect on trade between developed countries, which seems to
support the notion that the capacity of export industries to comply with standards play an important
role in determining the impacts of SPS measures on trade flows. A review and meta-analysis
conducted by Li and Beghin (2012) of 27 papers which employ gravity equations to estimate trade
effects of standards and technical measures finds that technical measures are more likely to have a
negative and significant effect on trade in agriculture and processed food products. SPS regulations
on agro-products and food trade are also more likely to be trade impeding on exports from
developing countries to high income importers than similar measures in North-North trade.
Reported impacts of standards, however, appear to vary significantly across agricultural
sectors. Using a count measure of notified SPS/TBT standards, a frequency index of notifications
and ad valorem equivalents of notifications as measures of standards, Disdier, Fontagné and
Mimouni (2008) find that SPS and TBTs have a significant and negative effect on agricultural
exports from developing countries to OECD countries, but do not have a significant impact on
bilateral trade between OECD countries. Reported results also show significant variations across
product sectors, indicating a negative effect in eight sectors, a positive effect in seven sectors, and
no significant effect in a further ten sectors. Similar variations are also reported by Fontagné,
Mimouni and Pasteels (2005) which find that environment related measures have a positive and
significant effect on trade in four agricultural product groups, a negative and significant effect in
six product groups, and a non-significant effect in nine product groups21
.
Evidence also suggests that standards can have different impacts at the extensive and
intensive margins, often forming a barrier to entry into export markets rather than volume reducing
constraints. Using data on concerns over SPS measures raised with the WTO by member
countries22
, Crivelli and Grӧschl (2012) find that SPS concerns have a negative impact on the
likelihood that firms export to a country for which SPS concerns were raised. However, conditional
on market entry, amounts of exports to markets with SPS measures in place also tend to be higher.
The authors further note that conformity assessment related SPS measures have a negative effect
on the likelihood of market entry while product characteristics related measures appear to have a
positive impact on the amount of trade, suggesting that product characteristics measures might
enhance consumer trust and increase trade for exporters who can overcome the fixed costs of
complying with standards. Similar barrier to entry effects are also observed by Chen, Otsuki and
Wilson (2006) who suggest that testing procedures and inspection times, as identified by firms’
21. SPS, TBTs and other non-tariff measures can be applied in a variety of ways and at varying stages
of the production process which complicates the construction of tariff equivalents.
22. Concerns raised by member countries over notified SPS measures are reported in the SPS
Information Management System of the WTO.
AGRICULTURAL SPECIFIC TRADE FACILITATION INDICATORS: AN OVERVIEW – 17
OECD FOOD, AGRICULTURE AND FISHERIES PAPER N°74 © OECD 2015
responses to World Bank Technical Barriers to Trade Surveys23
, have a negative impact on
agricultural firms’ propensity to export. Also using responses to Technical Barriers to Trade
Surveys, Maskus, Otsuki and Wilson (2005) find that the costs of compliance with standards
imposed by major importing countries do not have a statistically significant effect on variable costs
of firms in the foods, drugs and liquors product category. Ferro, Wilson and Otsuki (2013), for
their part, find that the number of regulated pesticides has a negative effect on the probability of
trade and that the restrictiveness of standards in a destination market is associated with fewer firms
exporting to the market. While tighter maximum residue levels (MRLs) have a negative and
significant impact on both the probability and the intensity of trade, there appears to be no
additional variable costs to comply with standards once fixed entry costs of compliance are
covered.
As Li and Beghin (2012) observe, evaluations tend to find more trade impeding effects in
the case of direct maximum residue limits (MRLs) than for other types of measures of standards.
Indeed, Kim and Reiner (2009) find a positive and significant effect of MRLs for aflotoxin B1 on
bilateral trade volumes of food and agricultural products, which suggest that more stringent
regulations on maximum toxin levels (lower MRLs) have a negative effect on agricultural trade
flows. Taking a more sector-specific approach, gravity model estimations by Otsuki, Wilson and
Sewadeh (2001a, 2001b) indicate a negative effect of aflotoxin MRLs on African agricultural
exports to European countries, suggesting that tightening maximum aflotoxin standards by 10%
reduces exports in edible groundnuts by 11% while a 1% reduction in MRLs reduces exports by
1.1% for cereals and 0.43% for fruits, nuts and vegetables for their country sample. However, these
findings are contradicted by Xiong and Beghin (2011) which take a similar dataset but find that
aflotoxin MRLs do not have a statistically significant effect on African groundnut exports, which
might suggest that findings can be sensitive to estimation approaches.
Standards coherence
Varying standards for the same product in different countries can increase trade costs.
Mutual recognition or harmonising standards and regulations can present efficiency gains for trade
procedures and facilitate the movement of goods across markets. UNESCAP (2011) suggests that
harmonising food standards can deepen regional and international integration and expand trade. In
addition to gains in customs efficiency, mutual recognition of conformity assessment or
harmonized standards can also potentially lower entry barriers by reducing the compliance costs
associated with multiple differing regulations and strengthen the trade enhancing effects of
standards through better information and increased consumer confidence (OECD, 2003; van
Tongeren, Beghin and Marette, 2009; ADB, 2013; Moïsé et al., 2013).
This review identified relatively few studies evaluating the impacts of standards
harmonization on agricultural trade. All of these studies either focused on a particular regional
grouping or single country exports, suggesting a gap in the country coverage of harmonization
measures. Looking at bilateral trade flows between OECD countries, Moenius (2004) finds that
shared standards, as well as importer country specific standards, appear to be negatively associated
with trade in food and beverage products. Country specific standards of exporters, for their parts,
have a positive relationship with trade in food products but a negative relationship in the case of
beverages. Focusing on EU countries between 1990 and 2001, de Frahan and Vancauteren (2006)
observe that standards harmonisation24
has a significant and positive effect on imports in all
agricultural sub-sectors, with the exception of condiments. Their estimates suggest that
harmonization in food regulations has increased intra-EU imports over the 1990-2001 time period
23. Responses are given by firms in 17 developing countries, exporting to five OECD countries.
24. de Frahan and Vancauteren (2006) measure harmonization of food regulations by an export-
weighted coverage ratio of relevant harmonization initiatives of technical regulations.
18 – AGRICULTURAL SPECIFIC TRADE FACILITATION INDICATORS: AN OVERVIEW
OECD FOOD, AGRICULTURE AND FISHERIES PAPER N°74 © OECD 2015
by about two-thirds for all food products, and around one-third for fruits and vegetables.
Evaluating Chinese exports between 1992 and 2008, Mangelsdorf, Portugal-Perez and Wilson
(2012) observe a generally positive and significant effect of mandatory domestic and international
harmonized food standards. Voluntary standards, for their part, appear to have a smaller or non-
significant effect. The authors note that the push effect of standards is larger when they are based
on international standards such as Codex Alimentarius, suggesting that one additional
internationally harmonised standard is associated with 0.38% to 0.64% increase in agricultural
exports.
Standards compliance capacity
As suggested in the previous sections, the capacity of firms in agricultural industries to
comply with standards and regulations likely plays an important role in determining whether
standards form barriers to trade. The United Nations Industrial Development Organization
(UNIDO) (2011a, 2011b) observes that compliance is associated with a wide range of services
including standard-setting, testing, system certification, inspection, traceability, packaging and
labelling. These services, in turn, depend heavily on national conformity and quality infrastructure
including national standard bodies and metrology institutes, product testing laboratories,
certification services and national accreditation boards (UNIDO, 2011a).
Few studies have attempted to include measures of compliance capacity and national
compliance infrastructure. Jongwanich (2009) uses data from the US Food and Drug
Administration to calculate the incidence of border detention of shipments of processed food
products25
as a measure of exporters’ capacity to meet food safety standards. The study reports a
positive and significant effect of the ratio of export value to the number of detained shipments in
the US market on the real value of process food exports which suggests that an increase in the
number of detentions lead to a decline in export volumes of processed foods. Using border
rejection data from 2002 to 2008 for the United States and the European Union, UNIDO (2011a,
2011b) conclude that there are significant differences in the patterns of rejections between the
United States and the European Union reflecting different trade patterns and different food safety
and other requirements. Focusing on four product groups (fruits and vegetables, fish, nuts and
herbs), the data suggest that border rejections were a very small (less than 0.5%) share of total
imports of these products and that a relatively small number of countries accounted for a large
share of the rejections. Ten countries (not all the same) accounted for 69% and 60% of rejections in
the European Union and United States, respectively. They were not all developing countries. The
United States was among the top five countries whose products were most often rejected by the
European Union while Canada and the United Kingdom were among the top six countries whose
products were rejected in the United States. These data suggest that problems in complying with
standards are not widespread and are not necessarily related to the exporting country’s level of
development, but more likely indicate problems with particular consignments. Kim and Reinert
(2009) compute indices of informational capacity, conformity capacity, enforcement capacity and
international standard-setting capacity as measures of institutional compliance capacity for a
dataset of 52 countries. Informational and conformity capacity are found to have a statistically
significant and positive effect on bilateral agricultural trade value between importing and exporting
country pairs, but international standard-setting capacity is not significant. Enforcement capacity
appears to have a negative and significant effect, though significance disappears in the case of
developing-country exporters.
25. Jongwanich (2009) calculate the incidence of detention as the ratio of export value of food
products to a number of detained shipments.
AGRICULTURAL SPECIFIC TRADE FACILITATION INDICATORS: AN OVERVIEW – 19
OECD FOOD, AGRICULTURE AND FISHERIES PAPER N°74 © OECD 2015
7. Summary of the literature review
The literature reporting empirical results for trade facilitation measures and agricultural
trade was reviewed in order to advise future work on trade facilitation processes focused on more
agriculture-specific constraints. While this exercise aims to identify evaluations using proxies of
trade facilitation, it does not discuss measures such as governance and access to finance which fall
outside of the scope of this paper but have been identified in the literature as potentially strong
impediments to trade in agricultural products. Indeed, surveys conducted under the aid-for-trade
initiative report that more than half of respondents from developing country agro-food suppliers
listed access to finance as the main obstacle to their participation in value chains (OECD and
WTO, 2013a). Similarly, Moïsé et al., (2013) point to issues of governance, and limited market
information and access to financial services as significant bottlenecks to agricultural trade in
developing countries. The studies identified in this review tend to focus predominantly on time
delays, logistics and infrastructure, and customs efficiency or sanitary and phytosanitary (SPS)
standards and technical barriers to trade (TBT), with very few studies overlapping into both
categories. Table 1 summarises the range of results reported for several measures when estimated
coefficients were significant in at least one study. This shows that results vary depending on
commodity composition and country coverage.
Overall, evaluations which take indicators of trade times, logistics performance and
infrastructure quality tend to find a significant relationship between trade facilitation proxies and
trade flows or trade costs, though results vary significantly across product sectors and regions.
These suggest that the length of export and import times and customs clearance delays can present
important impediments to trade for time-sensitive agricultural products. Logistics performance and
maritime connectivity also appear to have significant effects on trade costs. Nearly all of these
studies rely on more general indicators such as the number of days needed to export or connectivity
indices which may be more representative of aggregate trade flows and stylised shipments than
sector specific constraints. This suggests that data on agriculture-specific measures may be limited.
Whether or not these barriers have different implications for agricultural products than those
captured by the standard indicators for overall trade is worth investigating.
Most empirical studies which attempt to evaluate the effects of customs performance on
trade rely on broad measures such as customs times or the number of documents needed to trade as
proxies for the customs environment, reporting somewhat limited results. This suggests a gap in
available cross-country measures of customs efficiency pertaining not just to agricultural goods but
to all trade flows. Here, initiatives to develop measures of customs and border efficiency, such as
the OECD Trade Facilitation Indicators or ongoing efforts by the World Customs Organisation
could present promising avenues to evaluate more targeted at-the-border trade facilitation
measures.
Studies evaluating the impacts of sanitary and phytosanitary standards and technical
barriers to trade tend to report a negative effect on agricultural exports from developing countries
to high income countries, but little effect on trade between developed countries, though again
significant variations are observed across sectors. These studies also tend to highlight the
importance of compliance capacity in determining whether standards form impeding barriers to
trade.
While numerous studies evaluate the impacts of SPS and TBT measures on agricultural
trade flows, relatively few have assessed the impacts of standards harmonisation and compliance
capacities largely because of data issues for quantitative assessments. The reviewed evaluations of
standard harmonisation are limited to either country specific, intra-EU or intra-OECD trade.
Analysing harmonisation measures in other regional groupings or the adoption of international
standards across a wider sample of countries could provide valuable insight on the impacts of
harmonising standards on agricultural trade, though limited information on national standards may
be an issue. Expanding measures of institutional compliance capacity and infrastructure such as the
20 – AGRICULTURAL SPECIFIC TRADE FACILITATION INDICATORS: AN OVERVIEW
OECD FOOD, AGRICULTURE AND FISHERIES PAPER N°74 © OECD 2015
Relative Rejection Rate Indicator (UNIDO, 2011b), which summarises compliance performance
and at the border rejections of countries, and the Standards Compliance Capacity Index (UNIDO,
2011a), which aims to provide a systemic and consistent framework to evaluate standards
compliance capacity, could also present valuable openings to further assess the impact of
compliance capacity and national compliance infrastructure.
Although gravity model type estimations such as the ones covered in this review do not
directly identify the source of trade friction or trade costs at the country or country-pair level they
can, as Arvis et al. (2013) suggest, form part of a comprehensive diagnosis and help advise policy
packages, particularly when combined with country level assessments of trade facilitation, logistics
and trade policy. Arvis et al. (2013) suggest that trade facilitation policy should pay special
attention to improving transport and logistics performance, particularly in low income countries
and in Sub-Saharan Africa where these could have highly significant impacts on trade costs.
Improvements in such “hard” infrastructure have a greater impact on export growth compared to
“soft” infrastructure, but they are expensive (Portugal-Perez and Wilson (2012). Similarly, Moïsé
et al. (2013) propose that a significant expansion of agricultural trade in low income countries
could be achieved by easing constraints related to infrastructure quality and efficiently upgrading
standards implementation, monitoring and certification capacities. The OECD and the WTO
(2013a) further identified the removal of obstacles to trade, the reduction of customs delays and
border procedures, and the reduction of transport costs as key priorities for future aid-for-trade
initiatives in the agro-food sector. Echoing these policy recommendations, the agricultural trade
facilitation plan for the Greater Mekong Sub region outlined by the Asian Development Bank sets
out short-term development strategies to develop and enhance the capacities of the region’s
quarantine agencies in improving permit insurance systems, product certification and inspection
procedures through cooperation and information exchange (ADB, 2012). The plan further set out
to examine and review regulatory frameworks and assess the adequacy of agricultural
bureaucracies, in addition to a long-term strategy of liberalising trade and improving cooperation
among customs, border agencies and the private sector. Building upon research and policy lessons
from past empirical studies, future quantitative and qualitative evaluations of trade facilitation
focused on more agriculture-specific constraints could provide valuable insights on agricultural
trade constraints and help advise more targeted policy initiatives. Trade patterns are evolving with
traded intermediate inputs increasing in importance as firms increasingly engage in global value
chains and consumers demand more food variety including year-round supplies of seasonal
products. Consequently, trade facilitation measures that efficiently and speedily enable goods to
cross borders while assuring food safety become paramount.
Based on OECD’s work on the relationship between trade facilitation indicators and
agricultural trade, the initial purpose of this study was to compliment that information by collecting
data on the various procedures, timeliness and cost required for agricultural goods to cross a border
either to enter as imports or to leave as exports. Among the variables identified in the literature and
are of interest for this study, number of documents, time and cost, come from the World Bank’s
Doing Business database. But, those metrics are mostly based on trading manufactured goods that
do not reflect the peculiarities of agricultural trade. There is a need therefore to collect such metrics
specifically for agricultural products, especially perishable goods as they require special handling,
they need to pass SPS and other health and safety standards and they require clearance not only
from customs but also health authorities. Information on how long it takes to get agricultural goods
to the border (inland transport), because of the widely dispersed farms and in developing countries
the relatively small scale of production from small holders implies greater time and possibly cost
than merchandise goods that are produced in a few plants that are probably located near major
cities and transport hubs. There may be additional time required to clear customs because
inspections may occur more than once for the same consignment by customs and by health
authorities, if the various agencies do not co-ordinate. In addition to special logistics to assure
continued cold storage as goods transit to or depart the border, information on whether cold storage
is available and the procedures for getting goods in and out of those facilities and where they are
AGRICULTURAL SPECIFIC TRADE FACILITATION INDICATORS: AN OVERVIEW – 21
OECD FOOD, AGRICULTURE AND FISHERIES PAPER N°74 © OECD 2015
located (within or outside the clearance and release zone) could affect time and cost. The number
of documents required may also be different for agricultural products and all of these may
necessitate longer time.
Timeliness has been identified in the literature as important to trade. Time in motion
information as agricultural, especially perishable products move through the border would help
identify bottlenecks and suggest procedures to speed the process without impeding countries
abilities to provide the necessary food safety for their consumers or to protect their plants and
animals from pests and other risks. Improvements in procedures that can speed up the process
would facilitate trade. In general, to ascertain whether trade of agricultural goods, because of their
particularities, is different from trade in general merchandise, needs agricultural specific metrics.
The original intent was to contact relevant agencies in OECD Member and developing countries to
collect such information. The International Finance Corporation of the World Bank is in the
process of collecting such information in its “Benchmarking the Business of Agriculture” project,
an undertaking comparable to its “Doing Business” endeavour. A pilot to test the project in ten
countries was initiated in 2014 with plans to eventually cover some 80 countries. Among other
information, this project will provide time and motion indicators for the procedures and costs
associated with the process of complying with food safety and health standards, along with
describing the process for cross-border trade for specific agricultural produce. The aim is to
provide policy makers with laws and regulations affecting the business of agriculture that are
comparable across countries. Once these data become available, one would be able to revisit the
question of whether and to what extent, trade facilitation of agricultural; particularly perishable
products, differs from other goods and how they influence agricultural trade. This approach looks
more promising than the one whereby OECD would directly collect questionnaire based
information, given the difficulty of establishing the necessary contacts, especially in a number of
developing countries. For this study, the next section describes developments in a few trade
facilitating indicators from the Trading Across Borders component of the Doing Business database
and follows with a description of developments in agricultural trade since the beginning of the
21st century especially for low and lower middle income countries. An innovative approach by
Hummels and his co-authors to estimate the premium firms and consumers are willing to pay for
timely delivery of goods is also discussed.
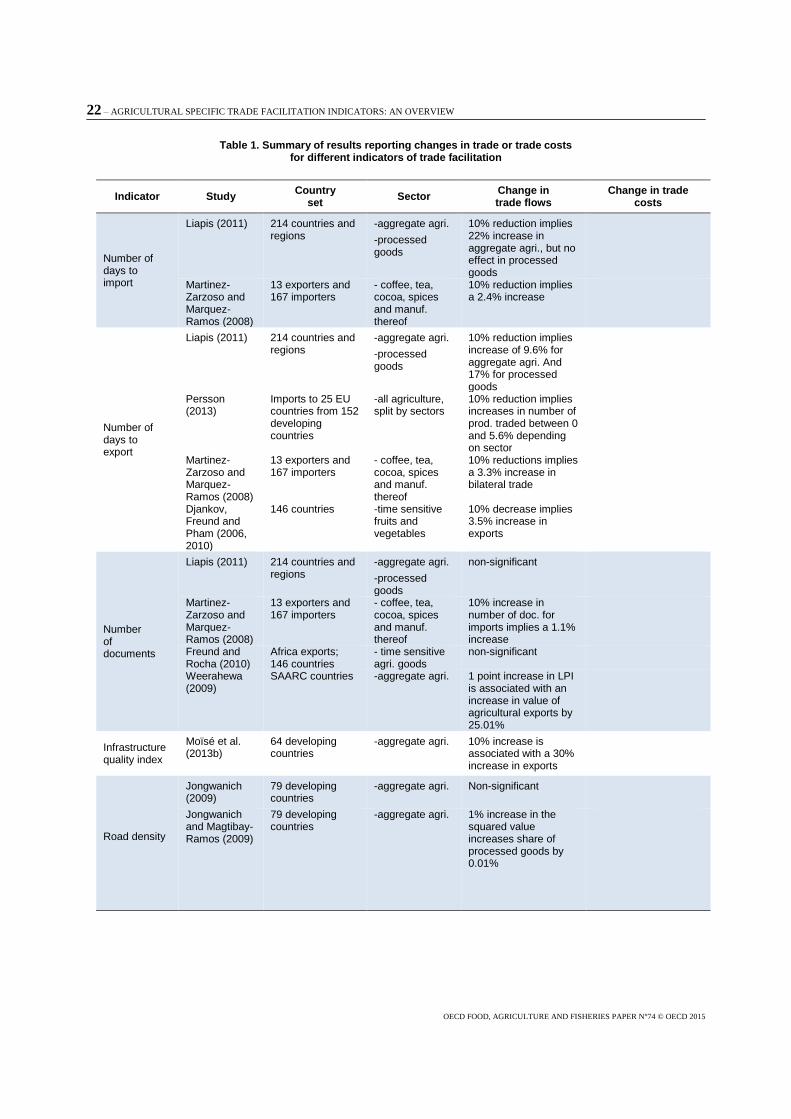
22 – AGRICULTURAL SPECIFIC TRADE FACILITATION INDICATORS: AN OVERVIEW
OECD FOOD, AGRICULTURE AND FISHERIES PAPER N°74 © OECD 2015
Table 1. Summary of results reporting changes in trade or trade costs for different indicators of trade facilitation
Indicator Study Country
set Sector
Change in trade flows
Change in trade costs
Number of days to import
Liapis (2011) 214 countries and regions
-aggregate agri.
-processed goods
10% reduction implies 22% increase in aggregate agri., but no effect in processed goods
Martinez-Zarzoso and Marquez-Ramos (2008)
13 exporters and 167 importers
- coffee, tea, cocoa, spices and manuf. thereof
10% reduction implies a 2.4% increase
Number of days to export
Liapis (2011) 214 countries and regions
-aggregate agri.
-processed goods
10% reduction implies increase of 9.6% for aggregate agri. And 17% for processed goods
Persson (2013)
Imports to 25 EU countries from 152 developing countries
-all agriculture, split by sectors
10% reduction implies increases in number of prod. traded between 0 and 5.6% depending on sector
Martinez-Zarzoso and Marquez-Ramos (2008)
13 exporters and 167 importers
- coffee, tea, cocoa, spices and manuf. thereof
10% reductions implies a 3.3% increase in bilateral trade
Djankov, Freund and Pham (2006, 2010)
146 countries -time sensitive fruits and vegetables
10% decrease implies 3.5% increase in exports
Number of documents
Liapis (2011) 214 countries and regions
-aggregate agri.
-processed goods
non-significant
Martinez-Zarzoso and Marquez-Ramos (2008)
13 exporters and 167 importers
- coffee, tea, cocoa, spices and manuf. thereof
10% increase in number of doc. for imports implies a 1.1% increase
Freund and Rocha (2010)
Africa exports; 146 countries
- time sensitive agri. goods
non-significant
Weerahewa (2009)
SAARC countries -aggregate agri.
1 point increase in LPI is associated with an increase in value of agricultural exports by 25.01%
Infrastructure quality index
Moïsé et al. (2013b)
64 developing countries
-aggregate agri.
10% increase is associated with a 30% increase in exports
Road density
Jongwanich (2009)
79 developing countries
-aggregate agri.
Non-significant
Jongwanich and Magtibay-Ramos (2009)
79 developing countries
-aggregate agri.
1% increase in the squared value increases share of processed goods by 0.01%
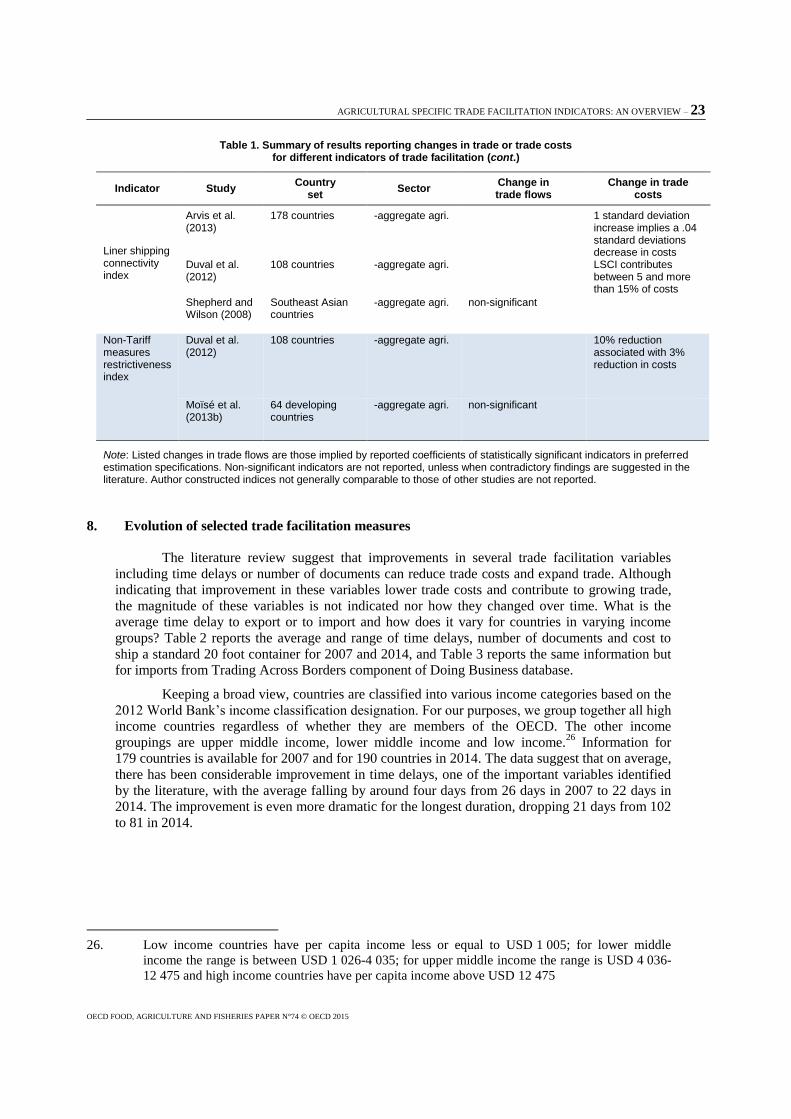
AGRICULTURAL SPECIFIC TRADE FACILITATION INDICATORS: AN OVERVIEW – 23
OECD FOOD, AGRICULTURE AND FISHERIES PAPER N°74 © OECD 2015
Table 1. Summary of results reporting changes in trade or trade costs for different indicators of trade facilitation (cont.)
Indicator Study Country
set Sector
Change in trade flows
Change in trade costs
Liner shipping connectivity index
Arvis et al. (2013)
178 countries -aggregate agri.
1 standard deviation increase implies a .04 standard deviations decrease in costs
Duval et al. (2012)
108 countries -aggregate agri.
LSCI contributes between 5 and more than 15% of costs
Shepherd and Wilson (2008)
Southeast Asian countries
-aggregate agri.
non-significant
Non-Tariff measures restrictiveness index
Duval et al. (2012)
108 countries -aggregate agri.
10% reduction associated with 3% reduction in costs
Moïsé et al. (2013b)
64 developing countries
-aggregate agri.
non-significant
Note: Listed changes in trade flows are those implied by reported coefficients of statistically significant indicators in preferred estimation specifications. Non-significant indicators are not reported, unless when contradictory findings are suggested in the literature. Author constructed indices not generally comparable to those of other studies are not reported.
8. Evolution of selected trade facilitation measures
The literature review suggest that improvements in several trade facilitation variables
including time delays or number of documents can reduce trade costs and expand trade. Although
indicating that improvement in these variables lower trade costs and contribute to growing trade,
the magnitude of these variables is not indicated nor how they changed over time. What is the
average time delay to export or to import and how does it vary for countries in varying income
groups? Table 2 reports the average and range of time delays, number of documents and cost to
ship a standard 20 foot container for 2007 and 2014, and Table 3 reports the same information but
for imports from Trading Across Borders component of Doing Business database.
Keeping a broad view, countries are classified into various income categories based on the
2012 World Bank’s income classification designation. For our purposes, we group together all high
income countries regardless of whether they are members of the OECD. The other income
groupings are upper middle income, lower middle income and low income.26
Information for
179 countries is available for 2007 and for 190 countries in 2014. The data suggest that on average,
there has been considerable improvement in time delays, one of the important variables identified
by the literature, with the average falling by around four days from 26 days in 2007 to 22 days in
2014. The improvement is even more dramatic for the longest duration, dropping 21 days from 102
to 81 in 2014.
26. Low income countries have per capita income less or equal to USD 1 005; for lower middle
income the range is between USD 1 026-4 035; for upper middle income the range is USD 4 036-
12 475 and high income countries have per capita income above USD 12 475
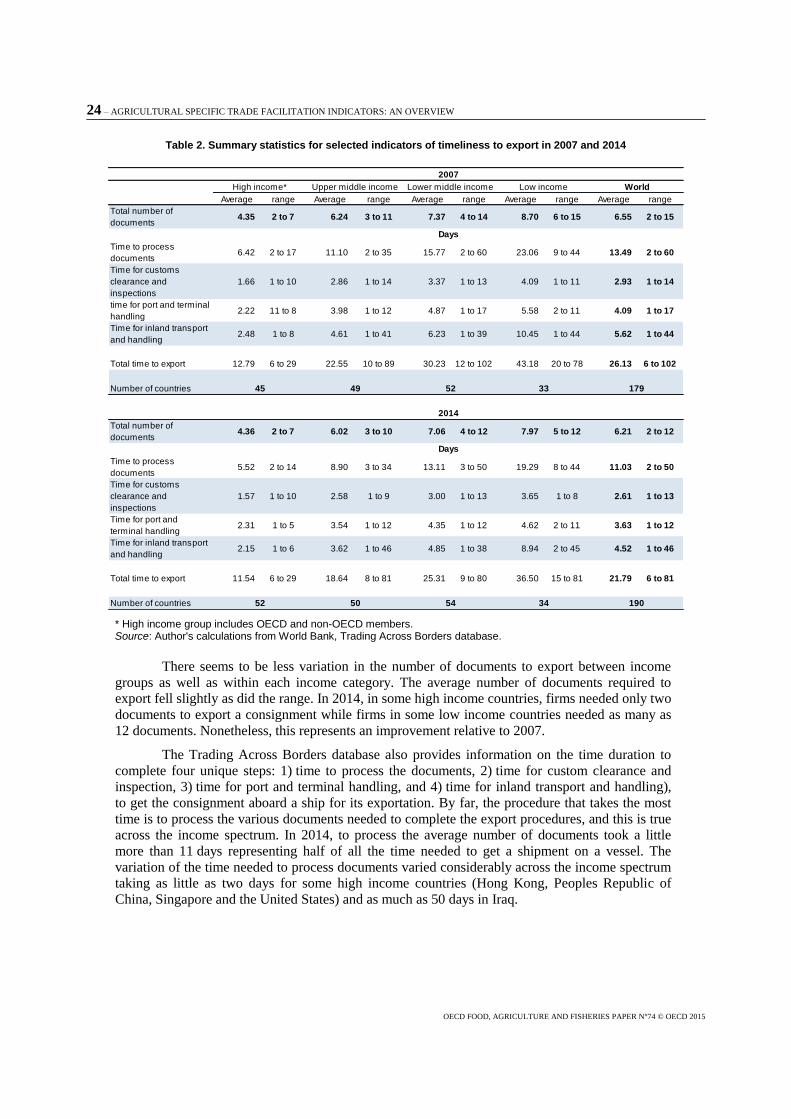
24 – AGRICULTURAL SPECIFIC TRADE FACILITATION INDICATORS: AN OVERVIEW
OECD FOOD, AGRICULTURE AND FISHERIES PAPER N°74 © OECD 2015
Table 2. Summary statistics for selected indicators of timeliness to export in 2007 and 2014
* High income group includes OECD and non-OECD members. Source: Author's calculations from World Bank, Trading Across Borders database.
There seems to be less variation in the number of documents to export between income
groups as well as within each income category. The average number of documents required to
export fell slightly as did the range. In 2014, in some high income countries, firms needed only two
documents to export a consignment while firms in some low income countries needed as many as
12 documents. Nonetheless, this represents an improvement relative to 2007.
The Trading Across Borders database also provides information on the time duration to
complete four unique steps: 1) time to process the documents, 2) time for custom clearance and
inspection, 3) time for port and terminal handling, and 4) time for inland transport and handling),
to get the consignment aboard a ship for its exportation. By far, the procedure that takes the most
time is to process the various documents needed to complete the export procedures, and this is true
across the income spectrum. In 2014, to process the average number of documents took a little
more than 11 days representing half of all the time needed to get a shipment on a vessel. The
variation of the time needed to process documents varied considerably across the income spectrum
taking as little as two days for some high income countries (Hong Kong, Peoples Republic of
China, Singapore and the United States) and as much as 50 days in Iraq.
Average range Average range Average range Average range Average range
Total number of
documents4.35 2 to 7 6.24 3 to 11 7.37 4 to 14 8.70 6 to 15 6.55 2 to 15
Time to process
documents6.42 2 to 17 11.10 2 to 35 15.77 2 to 60 23.06 9 to 44 13.49 2 to 60
Time for customs
clearance and
inspections
1.66 1 to 10 2.86 1 to 14 3.37 1 to 13 4.09 1 to 11 2.93 1 to 14
time for port and terminal
handling2.22 11 to 8 3.98 1 to 12 4.87 1 to 17 5.58 2 to 11 4.09 1 to 17
Time for inland transport
and handling2.48 1 to 8 4.61 1 to 41 6.23 1 to 39 10.45 1 to 44 5.62 1 to 44
Total time to export 12.79 6 to 29 22.55 10 to 89 30.23 12 to 102 43.18 20 to 78 26.13 6 to 102
Number of countries
Total number of
documents4.36 2 to 7 6.02 3 to 10 7.06 4 to 12 7.97 5 to 12 6.21 2 to 12
Time to process
documents5.52 2 to 14 8.90 3 to 34 13.11 3 to 50 19.29 8 to 44 11.03 2 to 50
Time for customs
clearance and
inspections
1.57 1 to 10 2.58 1 to 9 3.00 1 to 13 3.65 1 to 8 2.61 1 to 13
Time for port and
terminal handling2.31 1 to 5 3.54 1 to 12 4.35 1 to 12 4.62 2 to 11 3.63 1 to 12
Time for inland transport
and handling2.15 1 to 6 3.62 1 to 46 4.85 1 to 38 8.94 2 to 45 4.52 1 to 46
Total time to export 11.54 6 to 29 18.64 8 to 81 25.31 9 to 80 36.50 15 to 81 21.79 6 to 81
Number of countries 52 50 54 34 190
Days
2014
Days
45 49 52 33 179
2007
High income* Upper middle income Lower middle income Low income World
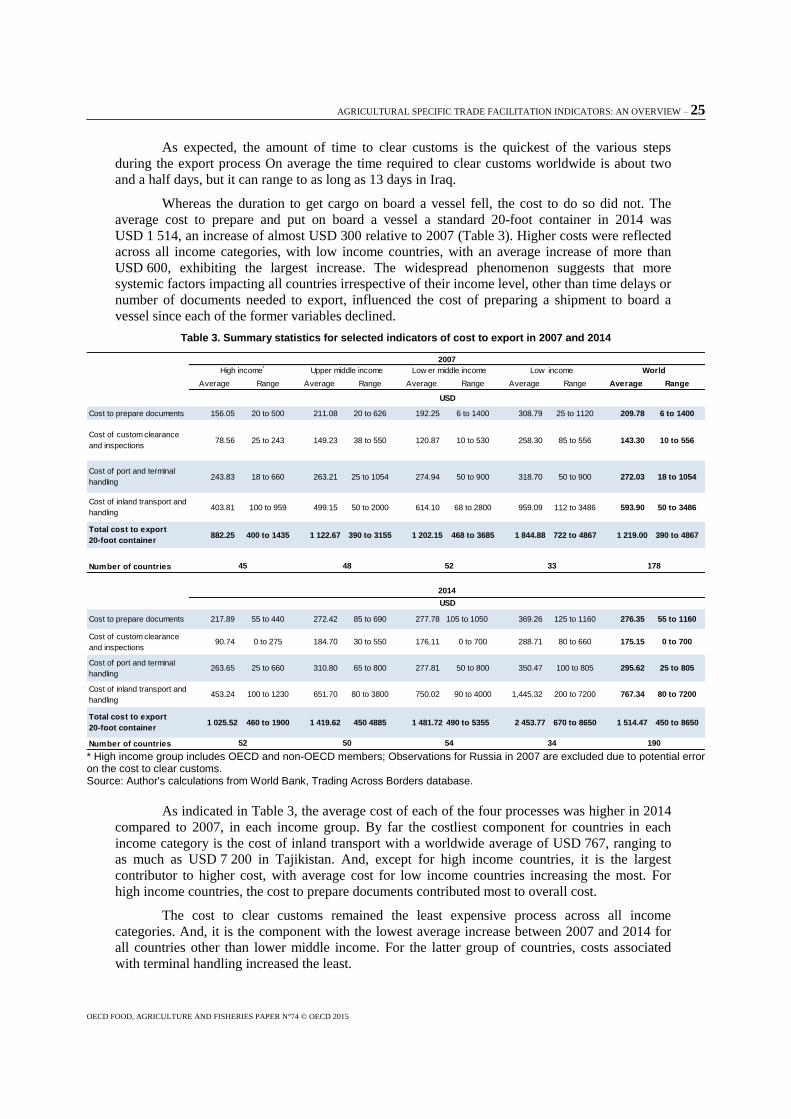
AGRICULTURAL SPECIFIC TRADE FACILITATION INDICATORS: AN OVERVIEW – 25
OECD FOOD, AGRICULTURE AND FISHERIES PAPER N°74 © OECD 2015
As expected, the amount of time to clear customs is the quickest of the various steps
during the export process On average the time required to clear customs worldwide is about two
and a half days, but it can range to as long as 13 days in Iraq.
Whereas the duration to get cargo on board a vessel fell, the cost to do so did not. The
average cost to prepare and put on board a vessel a standard 20-foot container in 2014 was
USD 1 514, an increase of almost USD 300 relative to 2007 (Table 3). Higher costs were reflected
across all income categories, with low income countries, with an average increase of more than
USD 600, exhibiting the largest increase. The widespread phenomenon suggests that more
systemic factors impacting all countries irrespective of their income level, other than time delays or
number of documents needed to export, influenced the cost of preparing a shipment to board a
vessel since each of the former variables declined.
Table 3. Summary statistics for selected indicators of cost to export in 2007 and 2014
* High income group includes OECD and non-OECD members; Observations for Russia in 2007 are excluded due to potential error on the cost to clear customs. Source: Author's calculations from World Bank, Trading Across Borders database.
As indicated in Table 3, the average cost of each of the four processes was higher in 2014
compared to 2007, in each income group. By far the costliest component for countries in each
income category is the cost of inland transport with a worldwide average of USD 767, ranging to
as much as USD 7 200 in Tajikistan. And, except for high income countries, it is the largest
contributor to higher cost, with average cost for low income countries increasing the most. For
high income countries, the cost to prepare documents contributed most to overall cost.
The cost to clear customs remained the least expensive process across all income
categories. And, it is the component with the lowest average increase between 2007 and 2014 for
all countries other than lower middle income. For the latter group of countries, costs associated
with terminal handling increased the least.
Average Range Average Range Average Range Average Range Average Range
Cost to prepare documents 156.05 20 to 500 211.08 20 to 626 192.25 6 to 1400 308.79 25 to 1120 209.78 6 to 1400
Cost of custom clearance
and inspections78.56 25 to 243 149.23 38 to 550 120.87 10 to 530 258.30 85 to 556 143.30 10 to 556
Cost of port and terminal
handling243.83 18 to 660 263.21 25 to 1054 274.94 50 to 900 318.70 50 to 900 272.03 18 to 1054
Cost of inland transport and
handling403.81 100 to 959 499.15 50 to 2000 614.10 68 to 2800 959.09 112 to 3486 593.90 50 to 3486
Total cost to export
20-foot container882.25 400 to 1435 1 122.67 390 to 3155 1 202.15 468 to 3685 1 844.88 722 to 4867 1 219.00 390 to 4867
Number of countries
Cost to prepare documents 217.89 55 to 440 272.42 85 to 690 277.78 105 to 1050 369.26 125 to 1160 276.35 55 to 1160
Cost of custom clearance
and inspections90.74 0 to 275 184.70 30 to 550 176.11 0 to 700 288.71 80 to 660 175.15 0 to 700
Cost of port and terminal
handling263.65 25 to 660 310.80 65 to 800 277.81 50 to 800 350.47 100 to 805 295.62 25 to 805
Cost of inland transport and
handling453.24 100 to 1230 651.70 80 to 3800 750.02 90 to 4000 1,445.32 200 to 7200 767.34 80 to 7200
Total cost to export
20-foot container1 025.52 460 to 1900 1 419.62 450 4885 1 481.72 490 to 5355 2 453.77 670 to 8650 1 514.47 450 to 8650
Number of countries
2014
USD
52 50 54 34 190
USD
45 48 52 33 178
2007
High income* Upper middle income Low er middle income Low income World
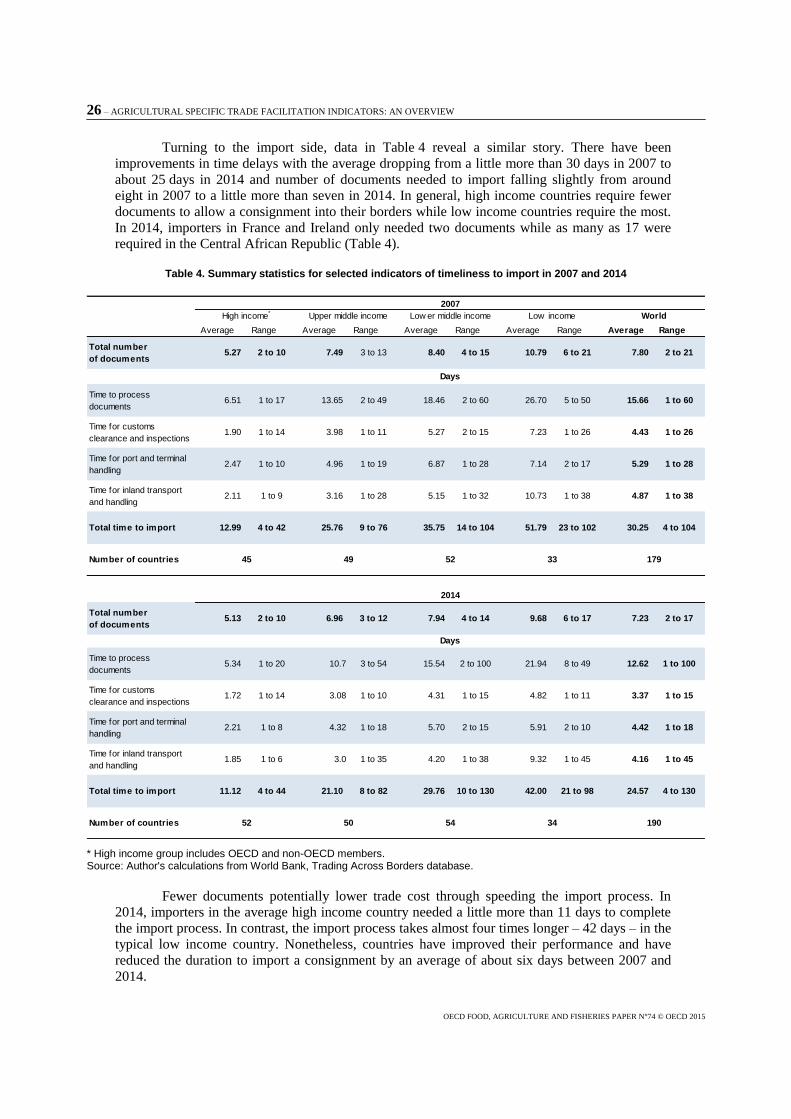
26 – AGRICULTURAL SPECIFIC TRADE FACILITATION INDICATORS: AN OVERVIEW
OECD FOOD, AGRICULTURE AND FISHERIES PAPER N°74 © OECD 2015
Turning to the import side, data in Table 4 reveal a similar story. There have been
improvements in time delays with the average dropping from a little more than 30 days in 2007 to
about 25 days in 2014 and number of documents needed to import falling slightly from around
eight in 2007 to a little more than seven in 2014. In general, high income countries require fewer
documents to allow a consignment into their borders while low income countries require the most.
In 2014, importers in France and Ireland only needed two documents while as many as 17 were
required in the Central African Republic (Table 4).
Table 4. Summary statistics for selected indicators of timeliness to import in 2007 and 2014
* High income group includes OECD and non-OECD members. Source: Author's calculations from World Bank, Trading Across Borders database.
Fewer documents potentially lower trade cost through speeding the import process. In
2014, importers in the average high income country needed a little more than 11 days to complete
the import process. In contrast, the import process takes almost four times longer – 42 days – in the
typical low income country. Nonetheless, countries have improved their performance and have
reduced the duration to import a consignment by an average of about six days between 2007 and
2014.
Average Range Average Range Average Range Average Range Average Range
Total number
of documents5.27 2 to 10 7.49 3 to 13 8.40 4 to 15 10.79 6 to 21 7.80 2 to 21
Time to process
documents6.51 1 to 17 13.65 2 to 49 18.46 2 to 60 26.70 5 to 50 15.66 1 to 60
Time for customs
clearance and inspections1.90 1 to 14 3.98 1 to 11 5.27 2 to 15 7.23 1 to 26 4.43 1 to 26
Time for port and terminal
handling2.47 1 to 10 4.96 1 to 19 6.87 1 to 28 7.14 2 to 17 5.29 1 to 28
Time for inland transport
and handling2.11 1 to 9 3.16 1 to 28 5.15 1 to 32 10.73 1 to 38 4.87 1 to 38
Total time to import 12.99 4 to 42 25.76 9 to 76 35.75 14 to 104 51.79 23 to 102 30.25 4 to 104
Number of countries
Total number
of documents5.13 2 to 10 6.96 3 to 12 7.94 4 to 14 9.68 6 to 17 7.23 2 to 17
Time to process
documents5.34 1 to 20 10.7 3 to 54 15.54 2 to 100 21.94 8 to 49 12.62 1 to 100
Time for customs
clearance and inspections1.72 1 to 14 3.08 1 to 10 4.31 1 to 15 4.82 1 to 11 3.37 1 to 15
Time for port and terminal
handling2.21 1 to 8 4.32 1 to 18 5.70 2 to 15 5.91 2 to 10 4.42 1 to 18
Time for inland transport
and handling1.85 1 to 6 3.0 1 to 35 4.20 1 to 38 9.32 1 to 45 4.16 1 to 45
Total time to import 11.12 4 to 44 21.10 8 to 82 29.76 10 to 130 42.00 21 to 98 24.57 4 to 130
Number of countries
2007
High income* Upper middle income Low er middle income Low income World
Days
45 49 52 33 179
2014
Days
52 50 54 34 190
AGRICULTURAL SPECIFIC TRADE FACILITATION INDICATORS: AN OVERVIEW – 27
OECD FOOD, AGRICULTURE AND FISHERIES PAPER N°74 © OECD 2015
However, there is considerable variation in time delays especially among countries within
a given income group. Importing in 2014 can take as few as four days in Singapore to as many as
130 days in South Sudan. The reader is reminded that the literature indicates that time delays are
the largest hindrance to trade and although the data suggest improvements, the typical developing
and emerging country has considerable scope for further progress to speed-up the trading process.
The most time-consuming procedure when importing, across all income groups, is
processing the necessary documents. Worldwide, this step, on average, takes almost 13 days,
taking up almost as much time as the other three procedures combined. Total duration of importing
goods seems to be positively correlated with the number of required documents, increasing as more
documents are mandated, and is inversely related to income, taking longer time in low income
countries.
The least time consuming process is to clear customs averaging a little more than three
days for all countries irrespective of income. There are countries across all income categories
where an importer can clear customs in a day. However, the process can take up to two weeks in
some high and lower middle income countries (Table 4).
The timeliness of getting a consignment ready to cross a border is not just about physical
infrastructure or logistics. The information in Tables 2 and 4 indicate that on average, the time for
inland transport reflecting road conditions, and the time for terminal handling, a proxy for port
infrastructure to get a consignment from the factory to the ship, combined, take less time than the
bureaucratic hurdles of processing the required documents whether this is to move a product out of
the country or to bring it into the country. As indicated in the literature review, studies have shown
that trade is reduced and the composition of the trade basket is altered the longer it takes to
complete the trading process. Streamlining and reducing the administrative hurdles, (the number of
documents and the duration to process them) may provide a relatively inexpensive way to increase
trade.
As in the case of exporting, the cost to import a standard 20-foot container increased
relative to 2007 across all income groups once again suggesting factors outside cost associated
with time delays at the border or the numbers of documents since both were lower in 2014
compared to 2007. In relative terms, costs increased the most in high income countries, almost
tripling since 2007, but in absolute terms, costs increased the most in low income countries
(Table 5). There is also considerable variation in the cost to bring a 20 foot container from the ship
across the border to the warehouse both within and between the various income groups, ranging
from as low as USD 440 in high income countries to more than USD 10 000 in low income
countries.
The least expensive procedure across all income groups is customs clearance and
inspections while inland transport and handling is the most expensive across all income groups.
Perhaps not surprising, although bureaucratic hurdles are the most time consuming of the identified
importing or exporting steps, they are less expensive than the physical moving and handling of the
container. Since the literature has identified timeliness as more germane than cost to expanding
trade, countries may want to consider ways to expedite and speed-up the trading process. More
information on the value of time in international trade is provided below.
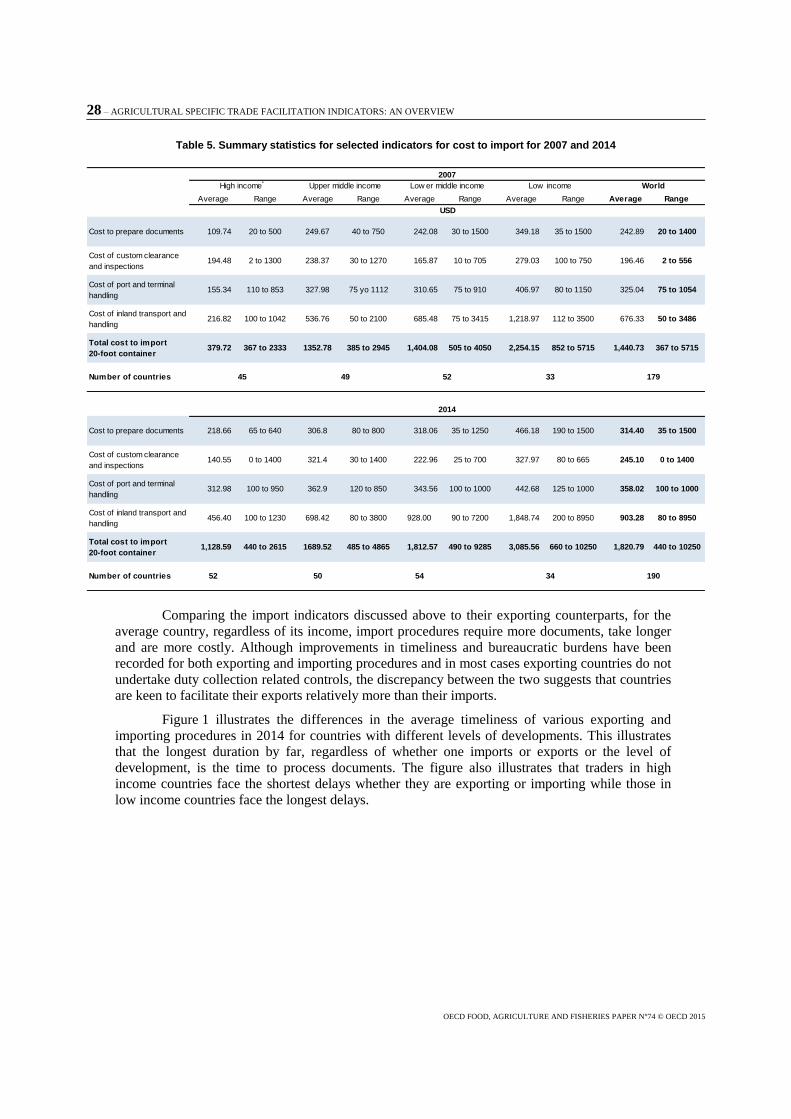
28 – AGRICULTURAL SPECIFIC TRADE FACILITATION INDICATORS: AN OVERVIEW
OECD FOOD, AGRICULTURE AND FISHERIES PAPER N°74 © OECD 2015
Table 5. Summary statistics for selected indicators for cost to import for 2007 and 2014
Comparing the import indicators discussed above to their exporting counterparts, for the
average country, regardless of its income, import procedures require more documents, take longer
and are more costly. Although improvements in timeliness and bureaucratic burdens have been
recorded for both exporting and importing procedures and in most cases exporting countries do not
undertake duty collection related controls, the discrepancy between the two suggests that countries
are keen to facilitate their exports relatively more than their imports.
Figure 1 illustrates the differences in the average timeliness of various exporting and
importing procedures in 2014 for countries with different levels of developments. This illustrates
that the longest duration by far, regardless of whether one imports or exports or the level of
development, is the time to process documents. The figure also illustrates that traders in high
income countries face the shortest delays whether they are exporting or importing while those in
low income countries face the longest delays.
Average Range Average Range Average Range Average Range Average Range
Cost to prepare documents 109.74 20 to 500 249.67 40 to 750 242.08 30 to 1500 349.18 35 to 1500 242.89 20 to 1400
Cost of custom clearance
and inspections194.48 2 to 1300 238.37 30 to 1270 165.87 10 to 705 279.03 100 to 750 196.46 2 to 556
Cost of port and terminal
handling155.34 110 to 853 327.98 75 yo 1112 310.65 75 to 910 406.97 80 to 1150 325.04 75 to 1054
Cost of inland transport and
handling216.82 100 to 1042 536.76 50 to 2100 685.48 75 to 3415 1,218.97 112 to 3500 676.33 50 to 3486
Total cost to import
20-foot container379.72 367 to 2333 1352.78 385 to 2945 1,404.08 505 to 4050 2,254.15 852 to 5715 1,440.73 367 to 5715
Number of countries
Cost to prepare documents 218.66 65 to 640 306.8 80 to 800 318.06 35 to 1250 466.18 190 to 1500 314.40 35 to 1500
Cost of custom clearance
and inspections140.55 0 to 1400 321.4 30 to 1400 222.96 25 to 700 327.97 80 to 665 245.10 0 to 1400
Cost of port and terminal
handling312.98 100 to 950 362.9 120 to 850 343.56 100 to 1000 442.68 125 to 1000 358.02 100 to 1000
Cost of inland transport and
handling456.40 100 to 1230 698.42 80 to 3800 928.00 90 to 7200 1,848.74 200 to 8950 903.28 80 to 8950
Total cost to import
20-foot container1,128.59 440 to 2615 1689.52 485 to 4865 1,812.57 490 to 9285 3,085.56 660 to 10250 1,820.79 440 to 10250
Number of countries 52 50 54 34 190
2007
High income* Upper middle income Low er middle income Low income World
2014
USD
45 49 52 33 179
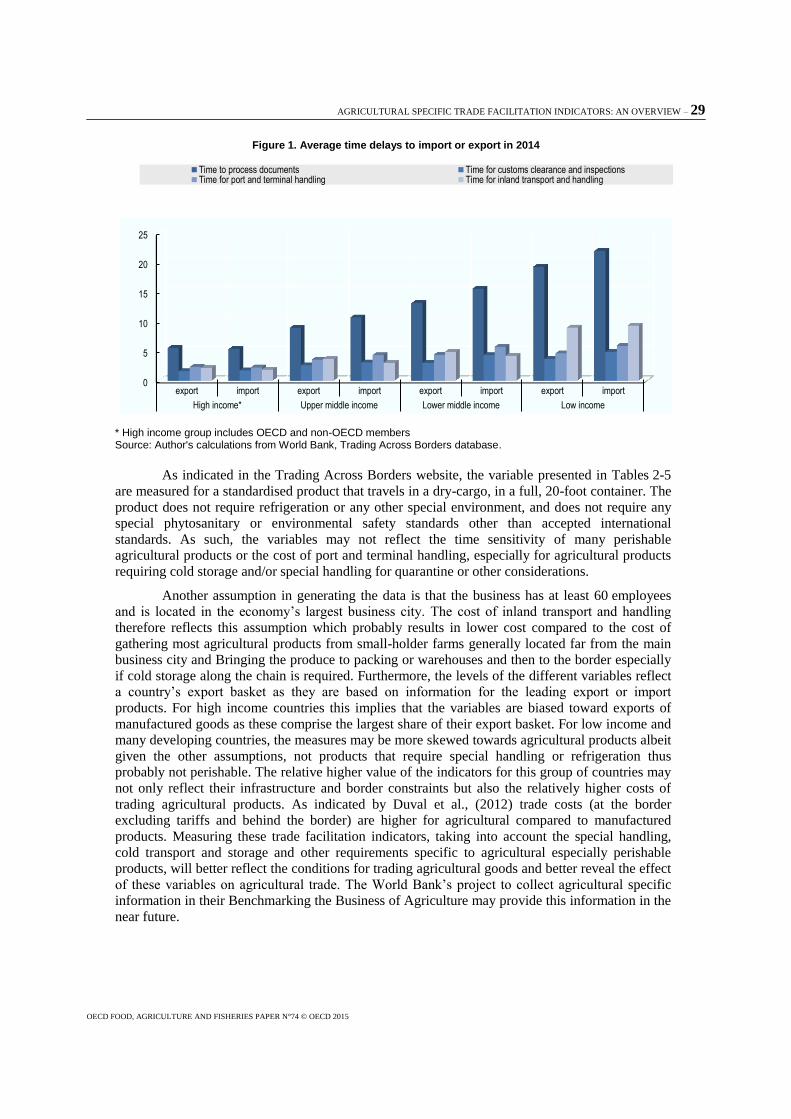
AGRICULTURAL SPECIFIC TRADE FACILITATION INDICATORS: AN OVERVIEW – 29
OECD FOOD, AGRICULTURE AND FISHERIES PAPER N°74 © OECD 2015
Figure 1. Average time delays to import or export in 2014
* High income group includes OECD and non-OECD members Source: Author's calculations from World Bank, Trading Across Borders database.
As indicated in the Trading Across Borders website, the variable presented in Tables 2-5
are measured for a standardised product that travels in a dry-cargo, in a full, 20-foot container. The
product does not require refrigeration or any other special environment, and does not require any
special phytosanitary or environmental safety standards other than accepted international
standards. As such, the variables may not reflect the time sensitivity of many perishable
agricultural products or the cost of port and terminal handling, especially for agricultural products
requiring cold storage and/or special handling for quarantine or other considerations.
Another assumption in generating the data is that the business has at least 60 employees
and is located in the economy’s largest business city. The cost of inland transport and handling
therefore reflects this assumption which probably results in lower cost compared to the cost of
gathering most agricultural products from small-holder farms generally located far from the main
business city and Bringing the produce to packing or warehouses and then to the border especially
if cold storage along the chain is required. Furthermore, the levels of the different variables reflect
a country’s export basket as they are based on information for the leading export or import
products. For high income countries this implies that the variables are biased toward exports of
manufactured goods as these comprise the largest share of their export basket. For low income and
many developing countries, the measures may be more skewed towards agricultural products albeit
given the other assumptions, not products that require special handling or refrigeration thus
probably not perishable. The relative higher value of the indicators for this group of countries may
not only reflect their infrastructure and border constraints but also the relatively higher costs of
trading agricultural products. As indicated by Duval et al., (2012) trade costs (at the border
excluding tariffs and behind the border) are higher for agricultural compared to manufactured
products. Measuring these trade facilitation indicators, taking into account the special handling,
cold transport and storage and other requirements specific to agricultural especially perishable
products, will better reflect the conditions for trading agricultural goods and better reveal the effect
of these variables on agricultural trade. The World Bank’s project to collect agricultural specific
information in their Benchmarking the Business of Agriculture may provide this information in the
near future.
0
5
10
15
20
25
export import export import export import export import
High income* Upper middle income Lower middle income Low income
Time to process documents Time for customs clearance and inspectionsTime for port and terminal handling Time for inland transport and handling
30 – AGRICULTURAL SPECIFIC TRADE FACILITATION INDICATORS: AN OVERVIEW
OECD FOOD, AGRICULTURE AND FISHERIES PAPER N°74 © OECD 2015
9. How important is trade of perishable products?
The literature review highlights some of the important issues considered to hinder trade in
agricultural products especially by developing and emerging economies. In this section,
developments in agricultural trade since 2000 are factually examined. Given the hypothesis that the
poor account of the perishability of certain agricultural products may be a reason for the poor
performance of some trade facilitation measures in explaining agricultural trade, trends in the trade
of a group of commodities classified as perishable are particularly highlighted.
A list identifying perishable agricultural products at the harmonized classification system
level is not readily available. Even the WTO Agreement on Trade Facilitation at its Bali
Ministerial in December 2013 which explicitly takes perishable goods into account defines them as
“…perishable goods are goods that rapidly decay due to their natural characteristics, in particular
in the absence of appropriate storage conditions” (WTO (2013) page 11). Given the lack of explicit
listing of which products are perishable, a rather subjective approach (but includes searching the
product description for the term “fresh” or “frozen”) is taken to identify these products explicitly
and provide a relative order of magnitude of their importance in trade. Annex II lists the products,
at the HS4 digit level that are classified as perishable for the purposes of the paper. The product
description is given at the HS4 digit level for convenience. The products were identified at the HS6
digit level which is also the basis of the trade data. A casual look at Annex II indicates that the
listed products belong to fresh or frozen meat, most dairy products (excluding skim milk and
whole milk powder), fresh fruit and vegetables and other products with the words fresh or frozen in
the description.
Table 6 provides data for the years 2000 and 2012 breaking down agricultural trade into
those products classified as “perishable” from all other. Data that includes intra-EU trade is
provided along with data that excludes it to illustrate the magnitude of trade between EU Members.
For other countries, this distinction does not matter, but the magnitude of intra EU trade skews
world totals and market shares.
Agricultural trade in 2012, when it includes trade within the members of the European
Union (top half of Table 6) totalled more than USD 1.3 trillion. Of the total; almost USD 411
billion or 30%, is trade of perishable products. The bottom half of the table excludes intra-EU
trade. It seems that a fair amount of agricultural trade is between EU Member states. Eliminating
this trade in 2012, shaved about USD 374 million or 28% from the world total. A good proportion
of the trade between EU Members is in perishable goods. Excluding intra-EU trade lowers the
share perishable goods to a little more than quarter of total agricultural trade compared to more
than 30% when intra-EU trade is included. The dynamics of agricultural trade is altered somewhat
when the data excludes intra-EU trade. Overall agricultural trade growth is little changed, but the
growth in the trade of perishable products is diminished. The rest of the discussion is based on data
that excludes intra-EU trade.
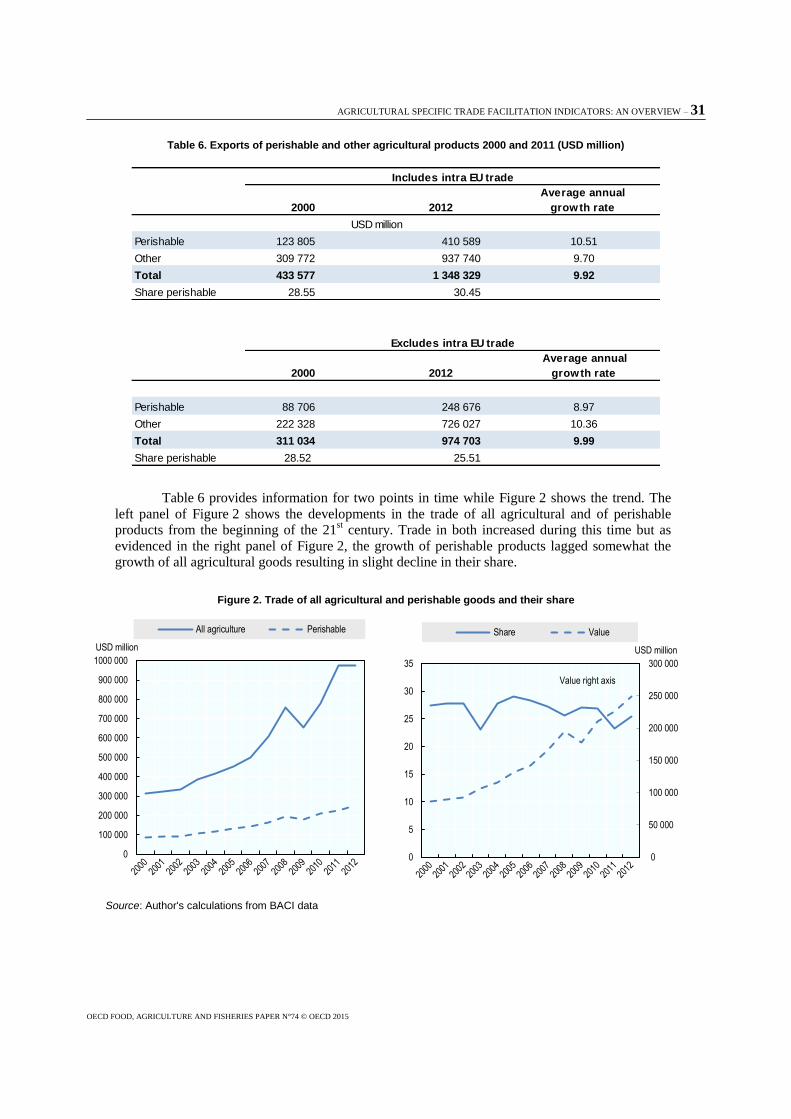
AGRICULTURAL SPECIFIC TRADE FACILITATION INDICATORS: AN OVERVIEW – 31
OECD FOOD, AGRICULTURE AND FISHERIES PAPER N°74 © OECD 2015
Table 6. Exports of perishable and other agricultural products 2000 and 2011 (USD million)
Table 6 provides information for two points in time while Figure 2 shows the trend. The
left panel of Figure 2 shows the developments in the trade of all agricultural and of perishable
products from the beginning of the 21st century. Trade in both increased during this time but as
evidenced in the right panel of Figure 2, the growth of perishable products lagged somewhat the
growth of all agricultural goods resulting in slight decline in their share.
Figure 2. Trade of all agricultural and perishable goods and their share
Source: Author's calculations from BACI data
2000 2012
Average annual
growth rate
Perishable 123 805 410 589 10.51
Other 309 772 937 740 9.70
Total 433 577 1 348 329 9.92
Share perishable 28.55 30.45
2000 2012
Average annual
growth rate
Perishable 88 706 248 676 8.97
Other 222 328 726 027 10.36
Total 311 034 974 703 9.99
Share perishable 28.52 25.51
Includes intra EU trade
Excludes intra EU trade
USD million
0
50 000
100 000
150 000
200 000
250 000
300 000
0
5
10
15
20
25
30
35
USD million
Share Value
Value right axis
0
100 000
200 000
300 000
400 000
500 000
600 000
700 000
800 000
900 000
1000 000
USD million
All agriculture Perishable
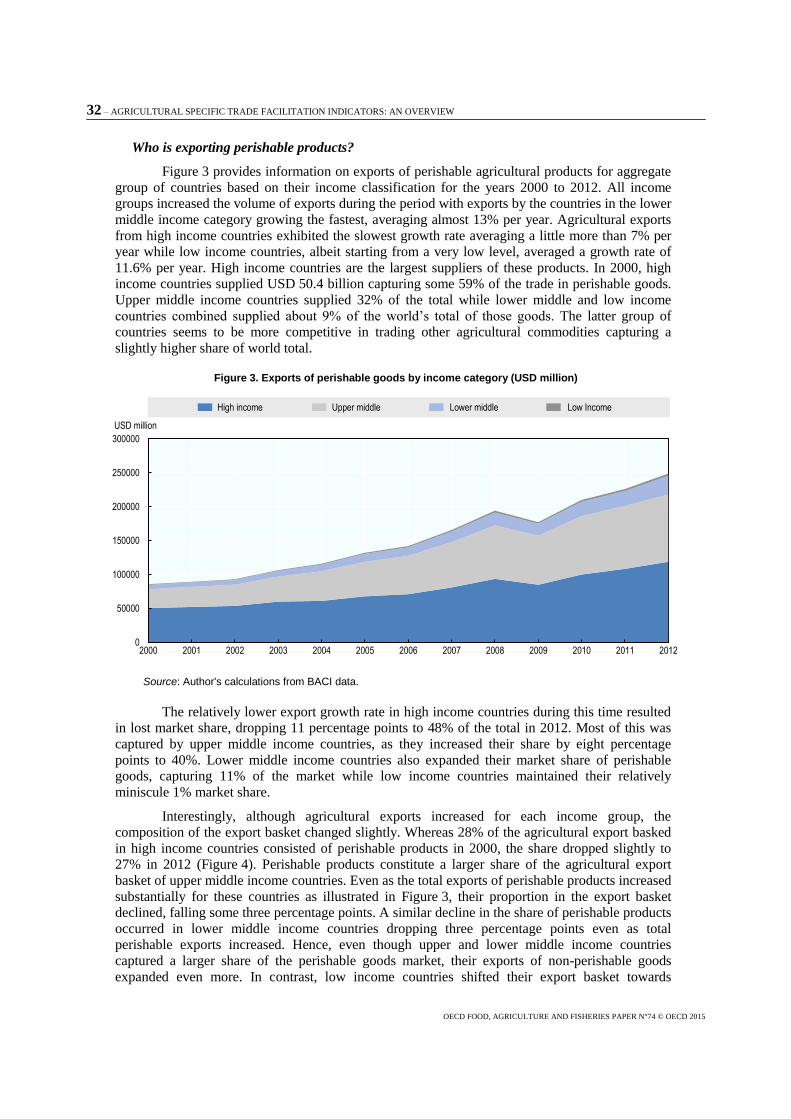
32 – AGRICULTURAL SPECIFIC TRADE FACILITATION INDICATORS: AN OVERVIEW
OECD FOOD, AGRICULTURE AND FISHERIES PAPER N°74 © OECD 2015
Who is exporting perishable products?
Figure 3 provides information on exports of perishable agricultural products for aggregate
group of countries based on their income classification for the years 2000 to 2012. All income
groups increased the volume of exports during the period with exports by the countries in the lower
middle income category growing the fastest, averaging almost 13% per year. Agricultural exports
from high income countries exhibited the slowest growth rate averaging a little more than 7% per
year while low income countries, albeit starting from a very low level, averaged a growth rate of
11.6% per year. High income countries are the largest suppliers of these products. In 2000, high
income countries supplied USD 50.4 billion capturing some 59% of the trade in perishable goods.
Upper middle income countries supplied 32% of the total while lower middle and low income
countries combined supplied about 9% of the world’s total of those goods. The latter group of
countries seems to be more competitive in trading other agricultural commodities capturing a
slightly higher share of world total.
Figure 3. Exports of perishable goods by income category (USD million)
Source: Author's calculations from BACI data.
The relatively lower export growth rate in high income countries during this time resulted
in lost market share, dropping 11 percentage points to 48% of the total in 2012. Most of this was
captured by upper middle income countries, as they increased their share by eight percentage
points to 40%. Lower middle income countries also expanded their market share of perishable
goods, capturing 11% of the market while low income countries maintained their relatively
miniscule 1% market share.
Interestingly, although agricultural exports increased for each income group, the
composition of the export basket changed slightly. Whereas 28% of the agricultural export basked
in high income countries consisted of perishable products in 2000, the share dropped slightly to
27% in 2012 (Figure 4). Perishable products constitute a larger share of the agricultural export
basket of upper middle income countries. Even as the total exports of perishable products increased
substantially for these countries as illustrated in Figure 3, their proportion in the export basket
declined, falling some three percentage points. A similar decline in the share of perishable products
occurred in lower middle income countries dropping three percentage points even as total
perishable exports increased. Hence, even though upper and lower middle income countries
captured a larger share of the perishable goods market, their exports of non-perishable goods
expanded even more. In contrast, low income countries shifted their export basket towards
0
50000
100000
150000
200000
250000
300000
2000 2001 2002 2003 2004 2005 2006 2007 2008 2009 2010 2011 2012
USD million
High income Upper middle Lower middle Low Income
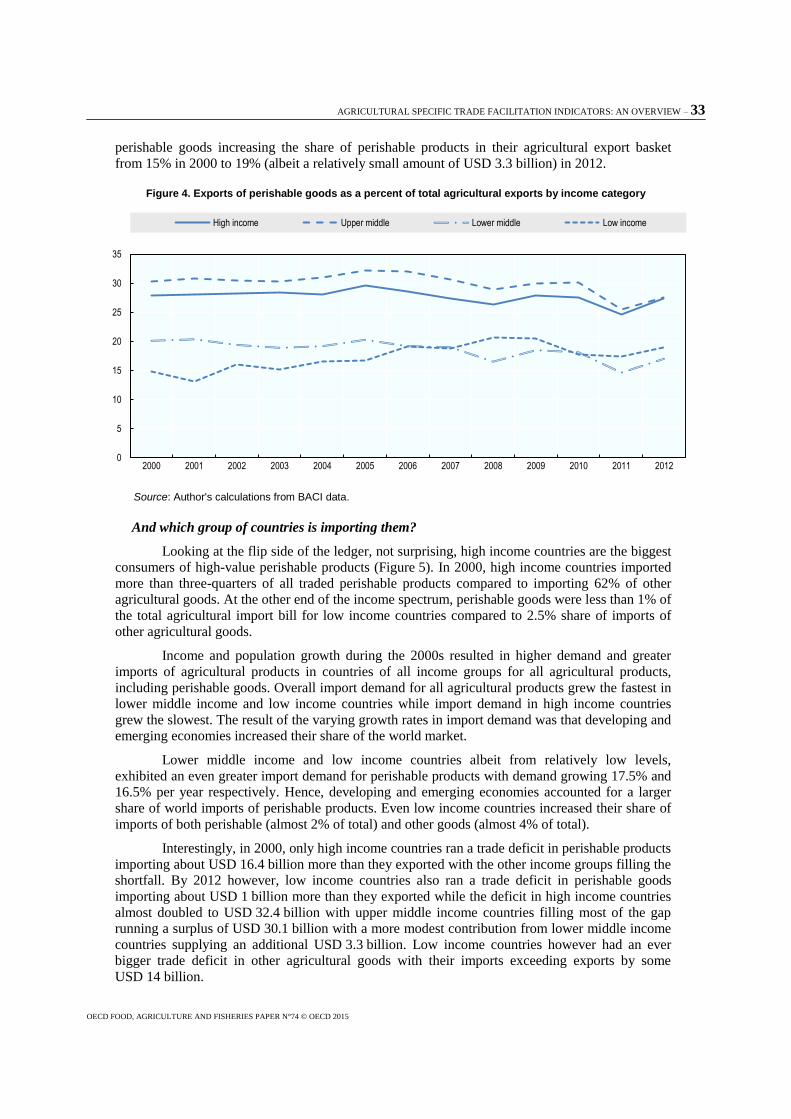
AGRICULTURAL SPECIFIC TRADE FACILITATION INDICATORS: AN OVERVIEW – 33
OECD FOOD, AGRICULTURE AND FISHERIES PAPER N°74 © OECD 2015
perishable goods increasing the share of perishable products in their agricultural export basket
from 15% in 2000 to 19% (albeit a relatively small amount of USD 3.3 billion) in 2012.
Figure 4. Exports of perishable goods as a percent of total agricultural exports by income category
Source: Author's calculations from BACI data.
And which group of countries is importing them?
Looking at the flip side of the ledger, not surprising, high income countries are the biggest
consumers of high-value perishable products (Figure 5). In 2000, high income countries imported
more than three-quarters of all traded perishable products compared to importing 62% of other
agricultural goods. At the other end of the income spectrum, perishable goods were less than 1% of
the total agricultural import bill for low income countries compared to 2.5% share of imports of
other agricultural goods.
Income and population growth during the 2000s resulted in higher demand and greater
imports of agricultural products in countries of all income groups for all agricultural products,
including perishable goods. Overall import demand for all agricultural products grew the fastest in
lower middle income and low income countries while import demand in high income countries
grew the slowest. The result of the varying growth rates in import demand was that developing and
emerging economies increased their share of the world market.
Lower middle income and low income countries albeit from relatively low levels,
exhibited an even greater import demand for perishable products with demand growing 17.5% and
16.5% per year respectively. Hence, developing and emerging economies accounted for a larger
share of world imports of perishable products. Even low income countries increased their share of
imports of both perishable (almost 2% of total) and other goods (almost 4% of total).
Interestingly, in 2000, only high income countries ran a trade deficit in perishable products
importing about USD 16.4 billion more than they exported with the other income groups filling the
shortfall. By 2012 however, low income countries also ran a trade deficit in perishable goods
importing about USD 1 billion more than they exported while the deficit in high income countries
almost doubled to USD 32.4 billion with upper middle income countries filling most of the gap
running a surplus of USD 30.1 billion with a more modest contribution from lower middle income
countries supplying an additional USD 3.3 billion. Low income countries however had an ever
bigger trade deficit in other agricultural goods with their imports exceeding exports by some
USD 14 billion.
0
5
10
15
20
25
30
35
2000 2001 2002 2003 2004 2005 2006 2007 2008 2009 2010 2011 2012
High income Upper middle Lower middle Low income
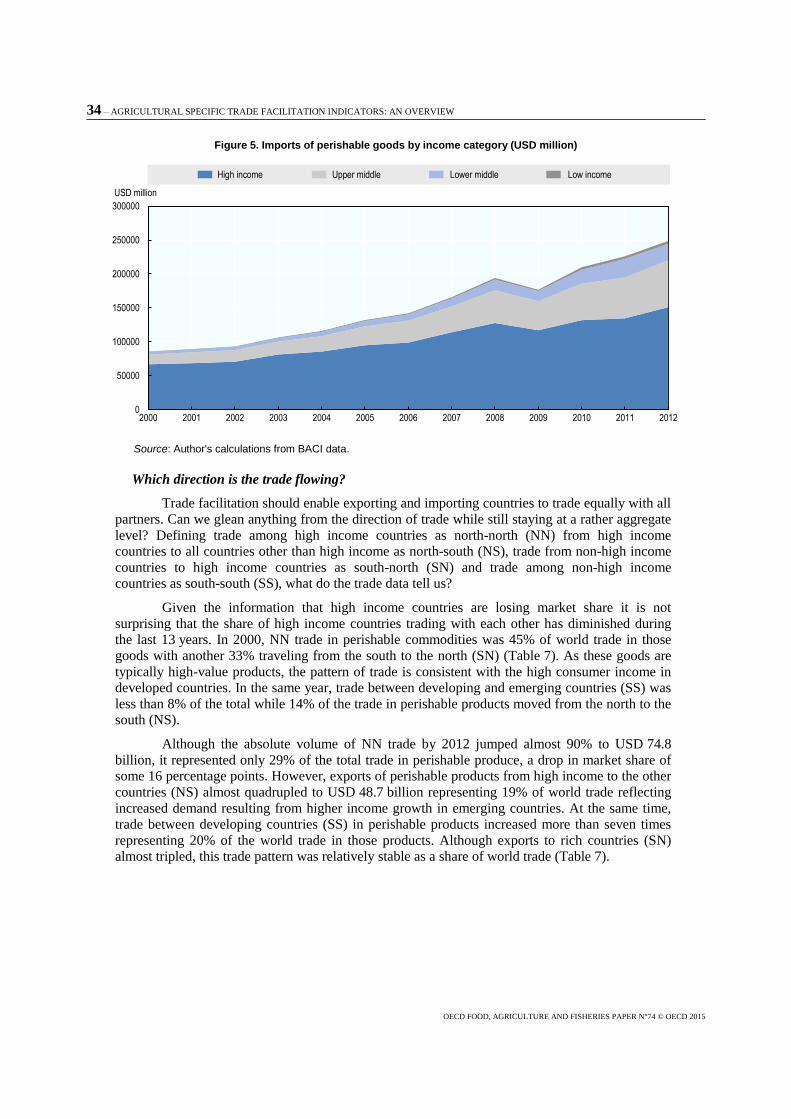
34 – AGRICULTURAL SPECIFIC TRADE FACILITATION INDICATORS: AN OVERVIEW
OECD FOOD, AGRICULTURE AND FISHERIES PAPER N°74 © OECD 2015
Figure 5. Imports of perishable goods by income category (USD million)
Source: Author's calculations from BACI data.
Which direction is the trade flowing?
Trade facilitation should enable exporting and importing countries to trade equally with all
partners. Can we glean anything from the direction of trade while still staying at a rather aggregate
level? Defining trade among high income countries as north-north (NN) from high income
countries to all countries other than high income as north-south (NS), trade from non-high income
countries to high income countries as south-north (SN) and trade among non-high income
countries as south-south (SS), what do the trade data tell us?
Given the information that high income countries are losing market share it is not
surprising that the share of high income countries trading with each other has diminished during
the last 13 years. In 2000, NN trade in perishable commodities was 45% of world trade in those
goods with another 33% traveling from the south to the north (SN) (Table 7). As these goods are
typically high-value products, the pattern of trade is consistent with the high consumer income in
developed countries. In the same year, trade between developing and emerging countries (SS) was
less than 8% of the total while 14% of the trade in perishable products moved from the north to the
south (NS).
Although the absolute volume of NN trade by 2012 jumped almost 90% to USD 74.8
billion, it represented only 29% of the total trade in perishable produce, a drop in market share of
some 16 percentage points. However, exports of perishable products from high income to the other
countries (NS) almost quadrupled to USD 48.7 billion representing 19% of world trade reflecting
increased demand resulting from higher income growth in emerging countries. At the same time,
trade between developing countries (SS) in perishable products increased more than seven times
representing 20% of the world trade in those products. Although exports to rich countries (SN)
almost tripled, this trade pattern was relatively stable as a share of world trade (Table 7).
0
50000
100000
150000
200000
250000
300000
2000 2001 2002 2003 2004 2005 2006 2007 2008 2009 2010 2011 2012
USD million
High income Upper middle Lower middle Low income
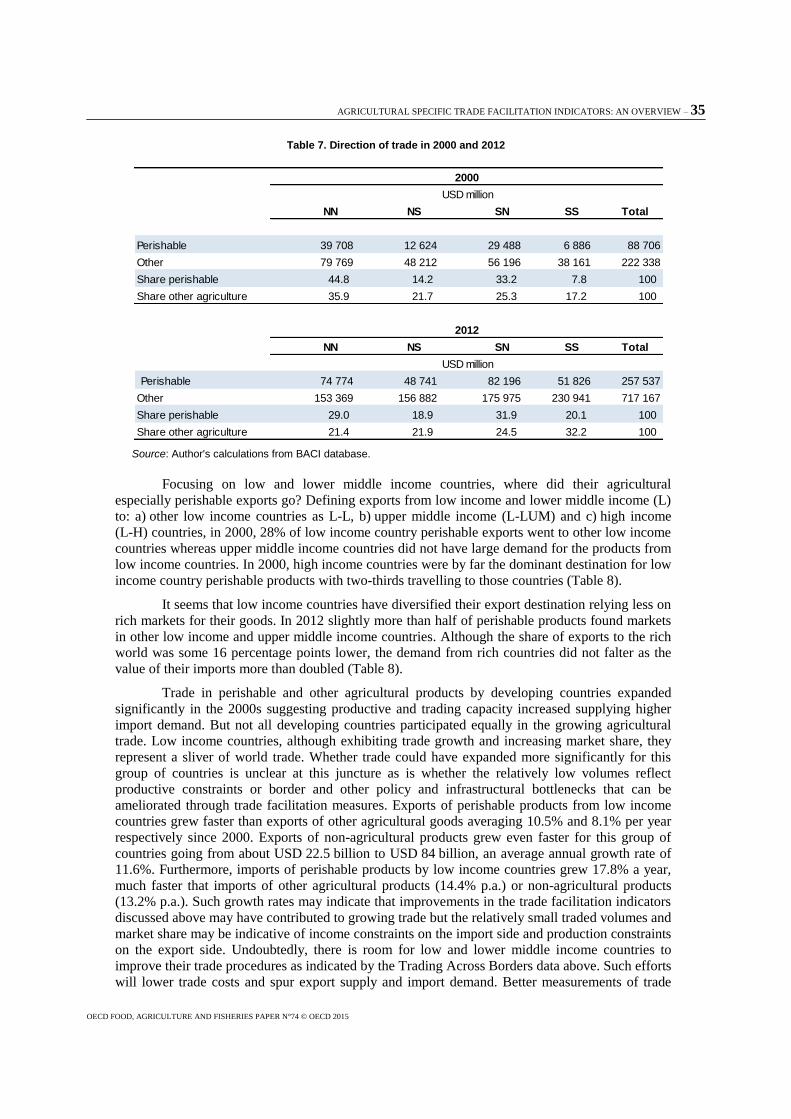
AGRICULTURAL SPECIFIC TRADE FACILITATION INDICATORS: AN OVERVIEW – 35
OECD FOOD, AGRICULTURE AND FISHERIES PAPER N°74 © OECD 2015
Table 7. Direction of trade in 2000 and 2012
Source: Author's calculations from BACI database.
Focusing on low and lower middle income countries, where did their agricultural
especially perishable exports go? Defining exports from low income and lower middle income (L)
to: a) other low income countries as L-L, b) upper middle income (L-LUM) and c) high income
(L-H) countries, in 2000, 28% of low income country perishable exports went to other low income
countries whereas upper middle income countries did not have large demand for the products from
low income countries. In 2000, high income countries were by far the dominant destination for low
income country perishable products with two-thirds travelling to those countries (Table 8).
It seems that low income countries have diversified their export destination relying less on
rich markets for their goods. In 2012 slightly more than half of perishable products found markets
in other low income and upper middle income countries. Although the share of exports to the rich
world was some 16 percentage points lower, the demand from rich countries did not falter as the
value of their imports more than doubled (Table 8).
Trade in perishable and other agricultural products by developing countries expanded
significantly in the 2000s suggesting productive and trading capacity increased supplying higher
import demand. But not all developing countries participated equally in the growing agricultural
trade. Low income countries, although exhibiting trade growth and increasing market share, they
represent a sliver of world trade. Whether trade could have expanded more significantly for this
group of countries is unclear at this juncture as is whether the relatively low volumes reflect
productive constraints or border and other policy and infrastructural bottlenecks that can be
ameliorated through trade facilitation measures. Exports of perishable products from low income
countries grew faster than exports of other agricultural goods averaging 10.5% and 8.1% per year
respectively since 2000. Exports of non-agricultural products grew even faster for this group of
countries going from about USD 22.5 billion to USD 84 billion, an average annual growth rate of
11.6%. Furthermore, imports of perishable products by low income countries grew 17.8% a year,
much faster that imports of other agricultural products (14.4% p.a.) or non-agricultural products
(13.2% p.a.). Such growth rates may indicate that improvements in the trade facilitation indicators
discussed above may have contributed to growing trade but the relatively small traded volumes and
market share may be indicative of income constraints on the import side and production constraints
on the export side. Undoubtedly, there is room for low and lower middle income countries to
improve their trade procedures as indicated by the Trading Across Borders data above. Such efforts
will lower trade costs and spur export supply and import demand. Better measurements of trade
USD million
NN NS SN SS Total
Perishable 39 708 12 624 29 488 6 886 88 706
Other 79 769 48 212 56 196 38 161 222 338
Share perishable 44.8 14.2 33.2 7.8 100
Share other agriculture 35.9 21.7 25.3 17.2 100
NN NS SN SS Total
USD million
Perishable 74 774 48 741 82 196 51 826 257 537
Other 153 369 156 882 175 975 230 941 717 167
Share perishable 29.0 18.9 31.9 20.1 100
Share other agriculture 21.4 21.9 24.5 32.2 100
2000
2012
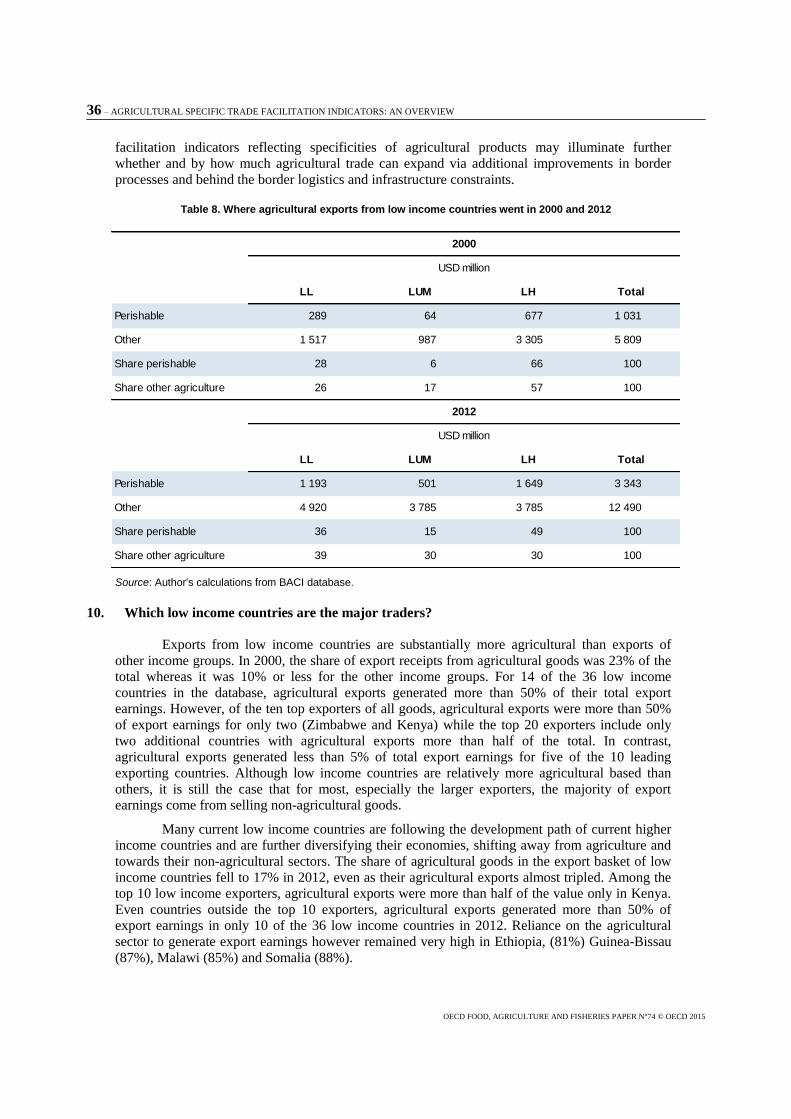
36 – AGRICULTURAL SPECIFIC TRADE FACILITATION INDICATORS: AN OVERVIEW
OECD FOOD, AGRICULTURE AND FISHERIES PAPER N°74 © OECD 2015
facilitation indicators reflecting specificities of agricultural products may illuminate further
whether and by how much agricultural trade can expand via additional improvements in border
processes and behind the border logistics and infrastructure constraints.
Table 8. Where agricultural exports from low income countries went in 2000 and 2012
Source: Author's calculations from BACI database.
10. Which low income countries are the major traders?
Exports from low income countries are substantially more agricultural than exports of
other income groups. In 2000, the share of export receipts from agricultural goods was 23% of the
total whereas it was 10% or less for the other income groups. For 14 of the 36 low income
countries in the database, agricultural exports generated more than 50% of their total export
earnings. However, of the ten top exporters of all goods, agricultural exports were more than 50%
of export earnings for only two (Zimbabwe and Kenya) while the top 20 exporters include only
two additional countries with agricultural exports more than half of the total. In contrast,
agricultural exports generated less than 5% of total export earnings for five of the 10 leading
exporting countries. Although low income countries are relatively more agricultural based than
others, it is still the case that for most, especially the larger exporters, the majority of export
earnings come from selling non-agricultural goods.
Many current low income countries are following the development path of current higher
income countries and are further diversifying their economies, shifting away from agriculture and
towards their non-agricultural sectors. The share of agricultural goods in the export basket of low
income countries fell to 17% in 2012, even as their agricultural exports almost tripled. Among the
top 10 low income exporters, agricultural exports were more than half of the value only in Kenya.
Even countries outside the top 10 exporters, agricultural exports generated more than 50% of
export earnings in only 10 of the 36 low income countries in 2012. Reliance on the agricultural
sector to generate export earnings however remained very high in Ethiopia, (81%) Guinea-Bissau
(87%), Malawi (85%) and Somalia (88%).
LL LUM LH Total
Perishable 289 64 677 1 031
Other 1 517 987 3 305 5 809
Share perishable 28 6 66 100
Share other agriculture 26 17 57 100
LL LUM LH Total
Perishable 1 193 501 1 649 3 343
Other 4 920 3 785 3 785 12 490
Share perishable 36 15 49 100
Share other agriculture 39 30 30 100
2000
USD million
2012
USD million
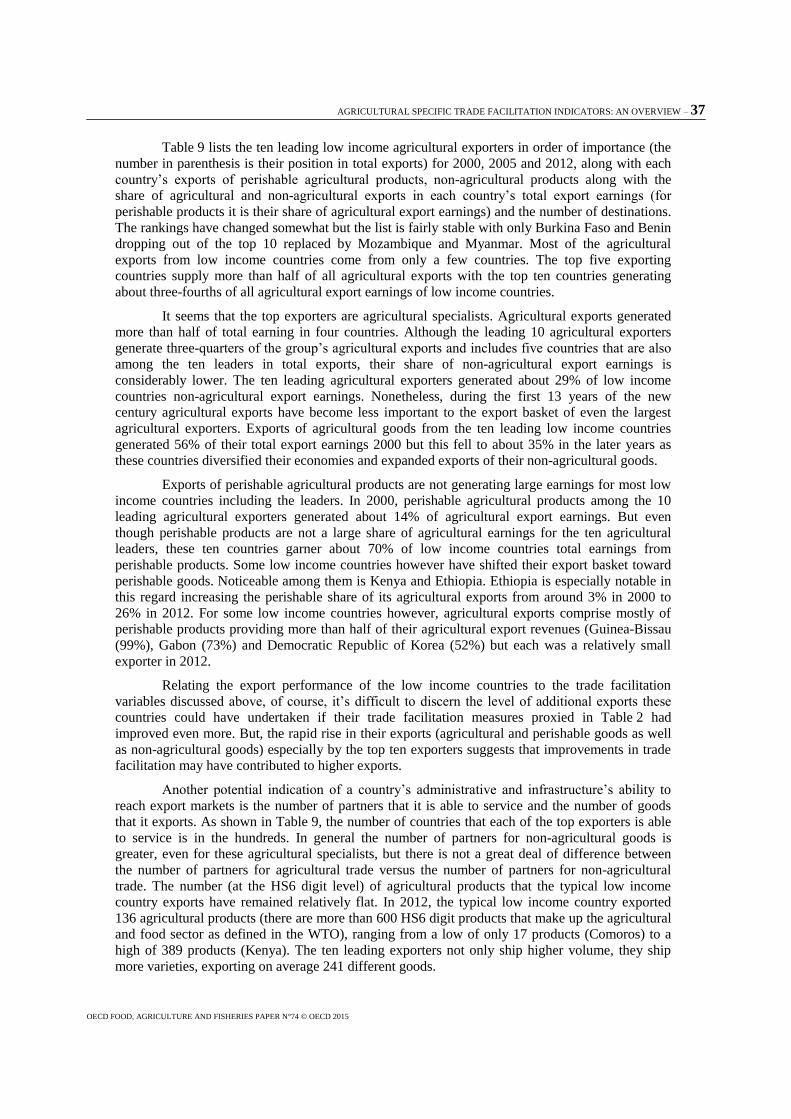
AGRICULTURAL SPECIFIC TRADE FACILITATION INDICATORS: AN OVERVIEW – 37
OECD FOOD, AGRICULTURE AND FISHERIES PAPER N°74 © OECD 2015
Table 9 lists the ten leading low income agricultural exporters in order of importance (the
number in parenthesis is their position in total exports) for 2000, 2005 and 2012, along with each
country’s exports of perishable agricultural products, non-agricultural products along with the
share of agricultural and non-agricultural exports in each country’s total export earnings (for
perishable products it is their share of agricultural export earnings) and the number of destinations.
The rankings have changed somewhat but the list is fairly stable with only Burkina Faso and Benin
dropping out of the top 10 replaced by Mozambique and Myanmar. Most of the agricultural
exports from low income countries come from only a few countries. The top five exporting
countries supply more than half of all agricultural exports with the top ten countries generating
about three-fourths of all agricultural export earnings of low income countries.
It seems that the top exporters are agricultural specialists. Agricultural exports generated
more than half of total earning in four countries. Although the leading 10 agricultural exporters
generate three-quarters of the group’s agricultural exports and includes five countries that are also
among the ten leaders in total exports, their share of non-agricultural export earnings is
considerably lower. The ten leading agricultural exporters generated about 29% of low income
countries non-agricultural export earnings. Nonetheless, during the first 13 years of the new
century agricultural exports have become less important to the export basket of even the largest
agricultural exporters. Exports of agricultural goods from the ten leading low income countries
generated 56% of their total export earnings 2000 but this fell to about 35% in the later years as
these countries diversified their economies and expanded exports of their non-agricultural goods.
Exports of perishable agricultural products are not generating large earnings for most low
income countries including the leaders. In 2000, perishable agricultural products among the 10
leading agricultural exporters generated about 14% of agricultural export earnings. But even
though perishable products are not a large share of agricultural earnings for the ten agricultural
leaders, these ten countries garner about 70% of low income countries total earnings from
perishable products. Some low income countries however have shifted their export basket toward
perishable goods. Noticeable among them is Kenya and Ethiopia. Ethiopia is especially notable in
this regard increasing the perishable share of its agricultural exports from around 3% in 2000 to
26% in 2012. For some low income countries however, agricultural exports comprise mostly of
perishable products providing more than half of their agricultural export revenues (Guinea-Bissau
(99%), Gabon (73%) and Democratic Republic of Korea (52%) but each was a relatively small
exporter in 2012.
Relating the export performance of the low income countries to the trade facilitation
variables discussed above, of course, it’s difficult to discern the level of additional exports these
countries could have undertaken if their trade facilitation measures proxied in Table 2 had
improved even more. But, the rapid rise in their exports (agricultural and perishable goods as well
as non-agricultural goods) especially by the top ten exporters suggests that improvements in trade
facilitation may have contributed to higher exports.
Another potential indication of a country’s administrative and infrastructure’s ability to
reach export markets is the number of partners that it is able to service and the number of goods
that it exports. As shown in Table 9, the number of countries that each of the top exporters is able
to service is in the hundreds. In general the number of partners for non-agricultural goods is
greater, even for these agricultural specialists, but there is not a great deal of difference between
the number of partners for agricultural trade versus the number of partners for non-agricultural
trade. The number (at the HS6 digit level) of agricultural products that the typical low income
country exports have remained relatively flat. In 2012, the typical low income country exported
136 agricultural products (there are more than 600 HS6 digit products that make up the agricultural
and food sector as defined in the WTO), ranging from a low of only 17 products (Comoros) to a
high of 389 products (Kenya). The ten leading exporters not only ship higher volume, they ship
more varieties, exporting on average 241 different goods.
38 – AGRICULTURAL SPECIFIC TRADE FACILITATION INDICATORS: AN OVERVIEW
OECD FOOD, AGRICULTURE AND FISHERIES PAPER N°74 © OECD 2015
Table 9. Ten leading low income agricultural exporting countries
* Top ten total as a share of total for all low income countries. Numbers in parenthesis is the country's rank in total exports. Source: Author's calculations from BACI database.
Turning to imports, Table 10 shows the ten leading low income agricultural importing
countries (the number is parenthesis is their rank in imports of non-agricultural goods), along with
imports of perishable and non-agricultural goods, the share for each country’s import expenditures
on agricultural (for perishable goods it is the share of agricultural expenditures) and non-
agricultural goods and the number of partners supplying each country’s import demand. The ten
leading agricultural importers substantially increased their imports of both agricultural and non-
agricultural goods but for each country, expenditures on agricultural goods are a relatively small
part of their import bill. Together however, the agricultural import bill of the top ten was 61% of
the total. The leading agricultural importers are also substantial importers of non-agricultural goods
as their combined import bill for non-agricultural goods was 58% of total expenditures by all low
income countries in 2012. Imports of perishable products are relatively small share of total
agricultural imports among the leading importers. In 2012 imports of perishable goods was more
than 20% of the agricultural import bill in only three of the leading importing countries while it
was in single digits in four (Table 10). Nonetheless, the leading importers account for more than
half of the import bill for perishables.
Country All agriculture PerishableNon-
agriculture
All
agriculturePerishable
Non-
agricultureAgriculture
Non-
agricultureAll goods
Zimbabw e (2) 1,303,049 194,085 1,055,149 55.26 14.89 44.74 110 129 143
Kenya (4) 1,174,114 314,738 773,839 60.27 26.81 39.73 125 126 138
Malaw i (19) 464,238 4,805 64,365 87.82 1.04 12.18 109 78 118
Ethiopia (15) 461,298 12,848 126,672 78.46 2.79 21.54 84 84 103
Tanzania (10) 397,936 69,650 531,824 42.80 17.50 57.20 111 112 128
Uganda (17) 386,775 19,191 168,610 69.64 4.96 30.36 79 89 107
Madagascar (8) 295,129 52,126 747,961 28.29 17.66 71.71 91 109 121
Mali (14) 237,492 6,041 355,434 40.05 2.54 59.95 68 86 101
Burkina Faso (24) 212,772 9,467 91,589 69.91 4.45 30.09 67 74 86
Benin (25) 205,591 21,079 82,211 71.43 10.25 28.57 60 68 87
Total above 5,138,393 704,030 3,997,654 75.13* 68.31* 17.78* N/A N/A N/A
Kenya (2) 1,754,724 652,195 1,943,912 47.44 37.17 52.56 150 170 176
Ethiopia (12) 1,134,597 59,915 191,578 85.55 5.28 14.45 116 95 131
Zimbabw e (6) 709,906 107,440 1,661,136 29.94 15.13 70.06 109 126 139
Tanzania (7) 705,198 107,591 1,589,372 30.73 15.26 69.27 113 133 139
Malaw i (19) 636,233 16,813 127,606 83.29 2.64 16.71 113 85 123
Uganda (17) 571,089 75,954 479,424 54.36 13.30 45.64 107 122 134
Myanmar (3) 467,359 16,829 3,078,853 13.18 3.60 86.82 55 89 94
Mali (15) 331,221 7,860 774,346 29.96 2.37 70.04 87 110 122
Mozambique (5) 265,901 32,948 2,191,251 10.82 12.39 89.18 77 104 115
Benin (24) 255,046 34,720 240,005 51.52 13.61 48.48 58 96 103
Total above 6,831,274 1,112,263 12,277,483 73.96* 72.25* 31.44* N/A N/A N/A
Kenya (6) 2,626,902 990,845 1,898,214 58.05 37.72 41.95 104 105 113
Ethiopia (11) 2,280,328 601,550 550,930 80.54 26.38 19.46 124 123 141
Tanzania (5) 1,768,049 273,252 3,798,771 31.76 15.46 68.24 110 135 142
Uganda (13) 1,276,720 125,425 860,859 59.73 9.82 40.27 104 122 135
Myanmar (3) 1,132,920 40,429 6,253,431 15.34 3.57 84.66 68 85 95
Zimbabw e (8) 1,057,786 73,078 2,495,532 29.77 6.91 70.23 84 89 107
Malaw i (20) 831,846 18,268 152,200 84.53 2.20 15.47 82 44 85
Mali (10) 828,174 24,994 2,065,370 28.62 3.02 71.38 66 105 116
Mozambique (4) 732,820 73,605 5,258,796 12.23 10.04 87.77 81 93 112
Madagascar (15) 551,516 49,369 1,120,214 32.99 8.95 67.01 108 117 132
Total above 13,087,061 2,270,816 24,454,316 75.83* 69.34* 29.11* N/A N/A N/A
2005
2012
Value (USD '000) Number of partners
2000
Share (%)
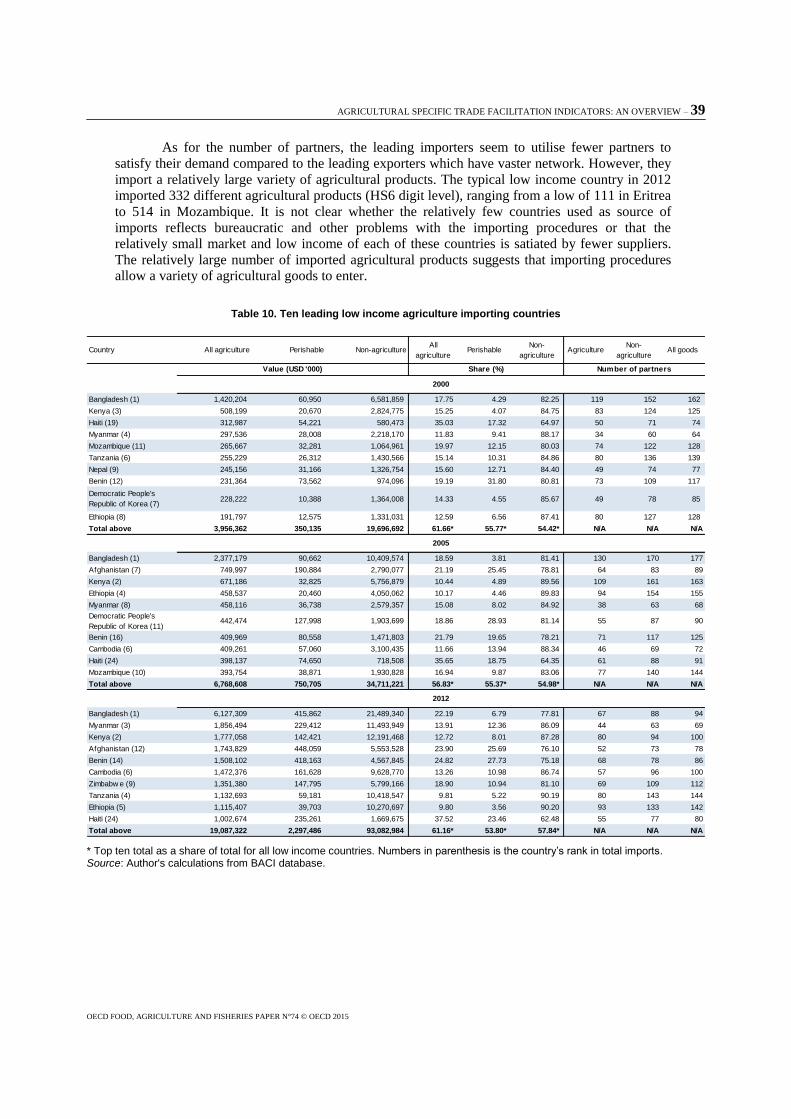
AGRICULTURAL SPECIFIC TRADE FACILITATION INDICATORS: AN OVERVIEW – 39
OECD FOOD, AGRICULTURE AND FISHERIES PAPER N°74 © OECD 2015
As for the number of partners, the leading importers seem to utilise fewer partners to
satisfy their demand compared to the leading exporters which have vaster network. However, they
import a relatively large variety of agricultural products. The typical low income country in 2012
imported 332 different agricultural products (HS6 digit level), ranging from a low of 111 in Eritrea
to 514 in Mozambique. It is not clear whether the relatively few countries used as source of
imports reflects bureaucratic and other problems with the importing procedures or that the
relatively small market and low income of each of these countries is satiated by fewer suppliers.
The relatively large number of imported agricultural products suggests that importing procedures
allow a variety of agricultural goods to enter.
Table 10. Ten leading low income agriculture importing countries
* Top ten total as a share of total for all low income countries. Numbers in parenthesis is the country’s rank in total imports. Source: Author's calculations from BACI database.
Country All agriculture Perishable Non-agricultureAll
agriculturePerishable
Non-
agricultureAgriculture
Non-
agricultureAll goods
Bangladesh (1) 1,420,204 60,950 6,581,859 17.75 4.29 82.25 119 152 162
Kenya (3) 508,199 20,670 2,824,775 15.25 4.07 84.75 83 124 125
Haiti (19) 312,987 54,221 580,473 35.03 17.32 64.97 50 71 74
Myanmar (4) 297,536 28,008 2,218,170 11.83 9.41 88.17 34 60 64
Mozambique (11) 265,667 32,281 1,064,961 19.97 12.15 80.03 74 122 128
Tanzania (6) 255,229 26,312 1,430,566 15.14 10.31 84.86 80 136 139
Nepal (9) 245,156 31,166 1,326,754 15.60 12.71 84.40 49 74 77
Benin (12) 231,364 73,562 974,096 19.19 31.80 80.81 73 109 117
Democratic People's
Republic of Korea (7)228,222 10,388 1,364,008 14.33 4.55 85.67 49 78 85
Ethiopia (8) 191,797 12,575 1,331,031 12.59 6.56 87.41 80 127 128
Total above 3,956,362 350,135 19,696,692 61.66* 55.77* 54.42* N/A N/A N/A
Bangladesh (1) 2,377,179 90,662 10,409,574 18.59 3.81 81.41 130 170 177
Afghanistan (7) 749,997 190,884 2,790,077 21.19 25.45 78.81 64 83 89
Kenya (2) 671,186 32,825 5,756,879 10.44 4.89 89.56 109 161 163
Ethiopia (4) 458,537 20,460 4,050,062 10.17 4.46 89.83 94 154 155
Myanmar (8) 458,116 36,738 2,579,357 15.08 8.02 84.92 38 63 68
Democratic People's
Republic of Korea (11)442,474 127,998 1,903,699 18.86 28.93 81.14 55 87 90
Benin (16) 409,969 80,558 1,471,803 21.79 19.65 78.21 71 117 125
Cambodia (6) 409,261 57,060 3,100,435 11.66 13.94 88.34 46 69 72
Haiti (24) 398,137 74,650 718,508 35.65 18.75 64.35 61 88 91
Mozambique (10) 393,754 38,871 1,930,828 16.94 9.87 83.06 77 140 144
Total above 6,768,608 750,705 34,711,221 56.83* 55.37* 54.98* N/A N/A N/A
Bangladesh (1) 6,127,309 415,862 21,489,340 22.19 6.79 77.81 67 88 94
Myanmar (3) 1,856,494 229,412 11,493,949 13.91 12.36 86.09 44 63 69
Kenya (2) 1,777,058 142,421 12,191,468 12.72 8.01 87.28 80 94 100
Afghanistan (12) 1,743,829 448,059 5,553,528 23.90 25.69 76.10 52 73 78
Benin (14) 1,508,102 418,163 4,567,845 24.82 27.73 75.18 68 78 86
Cambodia (6) 1,472,376 161,628 9,628,770 13.26 10.98 86.74 57 96 100
Zimbabw e (9) 1,351,380 147,795 5,799,166 18.90 10.94 81.10 69 109 112
Tanzania (4) 1,132,693 59,181 10,418,547 9.81 5.22 90.19 80 143 144
Ethiopia (5) 1,115,407 39,703 10,270,697 9.80 3.56 90.20 93 133 142
Haiti (24) 1,002,674 235,261 1,669,675 37.52 23.46 62.48 55 77 80
Total above 19,087,322 2,297,486 93,082,984 61.16* 53.80* 57.84* N/A N/A N/A
2012
Value (USD '000) Number of partners
2000
2005
Share (%)
40 – AGRICULTURAL SPECIFIC TRADE FACILITATION INDICATORS: AN OVERVIEW
OECD FOOD, AGRICULTURE AND FISHERIES PAPER N°74 © OECD 2015
Which lower middle income countries are the major traders?
Countries that fall within the lower middle income category are more numerous (49) than
low income countries and export substantially more. The ten leading exporting lower middle
income countries exported ten times more agricultural, including perishable goods and more than
four times as much non-agricultural goods in 2012 compared to 2000. And, just as in the case of
low income countries, the top exporters expanded their exports of all goods substantially during the
period and garnered most of the group’s export revenue.
Although the rankings changed somewhat, the leading agricultural exporting countries
remained relatively constant. Two countries among the top ten in 2000, Uzbekistan and Honduras,
dropped out in subsequent years replaced by Pakistan and Morocco in 2005 and Morocco was
replaced by Nigeria in 2012. The ten leading exporters increased their agricultural exports from
USD 23 billion in 2000 to almost USD 133 billion in 2012 (Table 11). This group of countries
expanded their agricultural exports relatively more than other lower middle income countries,
increasing their share of agricultural export earnings to more than 80% of the group’s total in 2012.
They also generated about three-fourths of the group’s earnings from perishable products and they
are also formidable exporters of non-agricultural products with more than 80% of export earnings
of all lower middle income countries.
Unlike the developments in export earnings for low income countries, the importance of
agricultural goods in generating export earnings in lower middle income countries increased over
time with agricultural exports providing 14% of their export earnings in 2012, increasing from
around 10% in 2000. In general, the ten leading lower middle income agricultural exporters
generated more than 80% of all agricultural export revenues for the group, but agricultural export
earnings for any one contributed a relatively small share to their total export earnings. The
importance of the agricultural sector varies even among the ten leading exporters with Nigeria
deriving only 4% of export earnings from agriculture while in Côte d’Ivoire almost half of export
earnings in 2012 are agricultural based. Furthermore, the agricultural export basket of the leading
exporting lower middle income countries shifted. Even though export earnings from perishable
goods by the ten leaders were about three-fourths of the total receipts from perishable products by
all lower middle income countries (Table 11), export earnings for the ten leaders from perishable
goods fell from around 20% of their total agricultural exports in 2000 to around 16% in 2012 even
as the total value of perishable exports increased from USD 4.7 billion to USD 20.7 billion.
Not surprisingly compared to low income countries, given the larger volumes exported by
each of the lower middle income countries, they ship more varieties to more destinations. The
average lower middle income country shipped 214 different products (HS6 digit) while among the
ten leaders, the average number of products exported was 429.
In 2012, the two leading exporters shipped to all but two of the 195 reporting countries in
the database. On average, the ten leading lower middle income exporters in 2012 shipped their
agricultural products to 152 destinations with an average value of USD 873 million per partner. As
a point of reference the leaders shipped their non-agricultural goods to165 partners collecting an
average USD 4.9 billion per partner. Among the ten leading exporting low income countries in
2012 their agricultural goods were shipped to 93 different partners with an average shipment per
market of USD 141 million while 102 partners were the destination on their non-agricultural goods
with an average value per partner of USD 240 million.

AGRICULTURAL SPECIFIC TRADE FACILITATION INDICATORS: AN OVERVIEW – 41
OECD FOOD, AGRICULTURE AND FISHERIES PAPER N°74 © OECD 2015
Table 11. Ten leading lower middle income country agricultural exporters
* Top ten total as a share of total for all lower middle income countries. Numbers in parenthesis is the country’s rank in total exports. Source: Author's calculations from BACI database.
The ten leading lower middle income agricultural importing countries materially expanded
their imports of all products and in the process increased their share of the group’s agricultural
imports from 71% to 76%, imports of perishable agricultural products from 63% to 74% and non-
agricultural imports from 79% to 85% (Table 12). Even as agricultural imports increased
substantially, they represent a relatively small share of these countries expenditures. The
agricultural import bill in 2012 for the ten largest agricultural importers was 8% of the total value
of their import bill. However, within the agricultural import basket, the ten leading agricultural
importing lower middle income countries increased imports of perishable goods relatively more
raising the share of the basket to 17% in 2012 from 12% in 2000. Imports of perishable agricultural
products for all lower middle income countries expanded relatively more than imports of all
agricultural goods, raising their share to 17% of the total agricultural import bill in 2012 compared
to 14% in 2000.
Country All agriculture PerishableNon-
agriculture
All
agriculturePerishable
Non-
agricultureAgriculture
Non-
agriculture
All
goods
India (1) 5,807,733 1,223,358 43,871,808 11.69 21.06 88.31 174 184 184
Indonesia (2) 4,949,564 315,071 66,702,812 6.91 6.37 93.09 179 190 190
Côte d'Ivoire (18) 2,388,933 364,522 2,013,518 54.26 15.26 45.74 117 140 149
Philippines (5) 1,984,908 922,453 43,220,368 4.39 46.47 95.61 127 167 168
Guatemala (19) 1,843,446 549,507 2,294,952 44.54 29.81 55.46 109 99 121
Viet Nam (4) 1,609,541 209,715 11,387,242 12.38 13.03 87.62 107 126 130
Ukraine (7) 1,574,351 325,819 14,142,617 10.02 20.70 89.98 121 164 169
Uzbekistan (24) 1,079,579 113,194 980,094 52.42 10.49 47.58 59 66 71
Honduras (17) 900,962 366,332 3,273,187 21.58 40.66 78.42 83 104 118
Egypt (8) 895,897 296,814 5,417,276 14.19 33.13 85.81 126 160 162
Total above 23,034,912 4,686,785 193,303,873 71.51* 70.31* 70.03* N/A N/A N/A
Indonesia (2) 9,603,577 521,759 93,831,736 9.28 5.43 90.72 186 191 191
India (1) 9,076,690 1,903,491 101,817,896 8.18 20.97 91.82 182 193 193
Ukraine (5) 4,618,405 765,929 33,052,974 12.26 16.58 87.74 147 170 171
Viet Nam (6) 4,015,249 832,714 32,973,906 10.86 20.74 89.14 167 187 187
Côte d'Ivoire 16) 3,472,206 523,244 4,504,888 43.53 15.07 56.47 124 138 150
Philippines (3) 2,972,821 1,277,639 56,195,984 5.02 42.98 94.98 159 179 183
Guatemala (18) 2,189,143 742,712 3,519,709 38.35 33.93 61.65 125 123 143
Egypt (9) 2,180,807 910,387 13,144,722 14.23 41.75 85.77 160 170 172
Pakistan (8) 2,032,584 232,720 13,278,210 13.28 11.45 86.72 161 192 192
Morocco (10) 1,878,097 1,260,481 11,887,701 13.64 67.11 86.36 129 158 161
Total above 42,039,578 8,971,076 364,207,726 72.62* 76.45* 75.84* N/A N/A N/A
India (2) 37,099,808 5,509,207 237,321,008 13.52 14.85 86.48 185 193 193
Indonesia (1) 32,548,830 1,196,855 179,688,464 15.34 3.68 84.66 182 193 193
Ukraine (5) 18,575,608 1,355,444 53,722,492 25.69 7.30 74.31 159 175 176
Viet Nam (7) 12,303,476 2,826,118 99,343,600 11.02 22.97 88.98 158 156 162
Côte d'Ivoire (16) 5,919,549 742,402 6,076,004 49.35 12.54 50.65 111 139 147
Philippines (3) 5,796,176 2,386,251 66,376,260 8.03 41.17 91.97 156 181 183
Guatemala (15) 5,398,596 1,658,497 5,995,026 47.38 30.72 52.62 135 129 147
Pakistan (9) 5,385,559 895,779 19,284,356 21.83 16.63 78.17 161 179 182
Nigeria (4) 5,022,802 1,709,329 116,957,416 4.12 34.03 95.88 114 139 145
Egypt (10) 4,678,132 2,465,160 30,220,632 13.40 52.70 86.60 160 165 166
Total above 132,728,535 20,745,041 814,985,257 81.44* 74.94* 81.92* N/A N/A N/A
2012
Value (USD '000) Number of partners
2000
2005
Share (%)
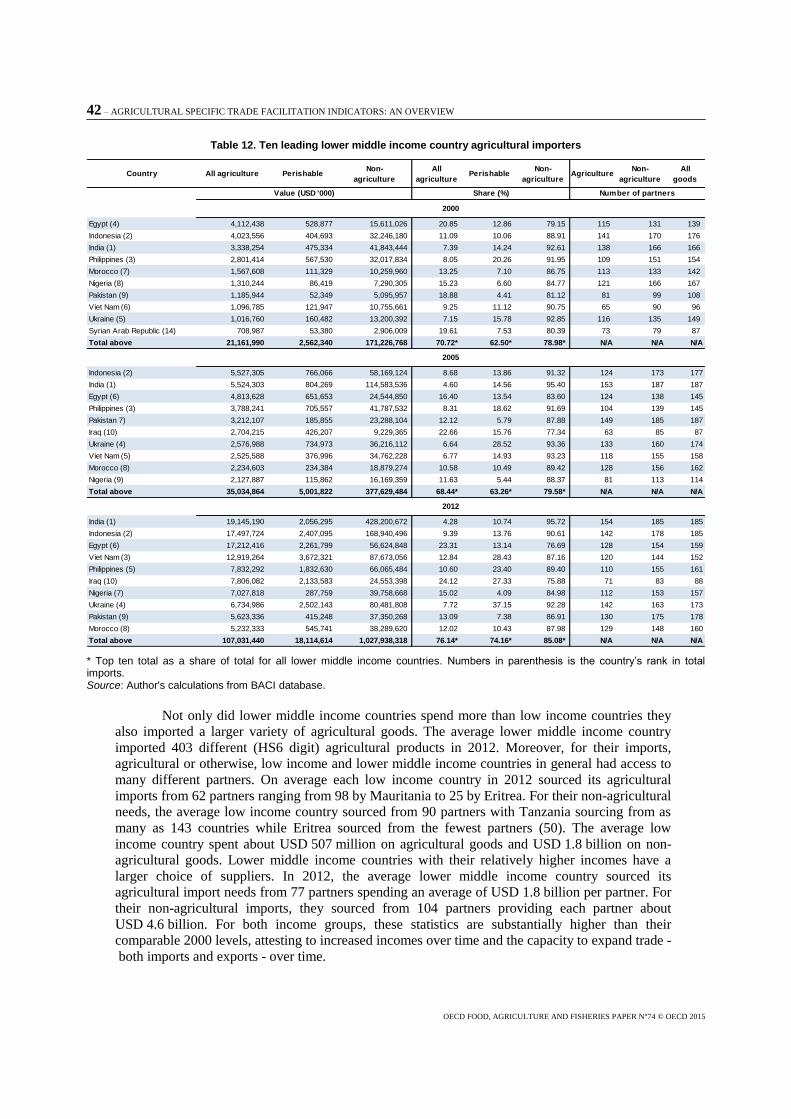
42 – AGRICULTURAL SPECIFIC TRADE FACILITATION INDICATORS: AN OVERVIEW
OECD FOOD, AGRICULTURE AND FISHERIES PAPER N°74 © OECD 2015
Table 12. Ten leading lower middle income country agricultural importers
* Top ten total as a share of total for all lower middle income countries. Numbers in parenthesis is the country’s rank in total imports. Source: Author's calculations from BACI database.
Not only did lower middle income countries spend more than low income countries they
also imported a larger variety of agricultural goods. The average lower middle income country
imported 403 different (HS6 digit) agricultural products in 2012. Moreover, for their imports,
agricultural or otherwise, low income and lower middle income countries in general had access to
many different partners. On average each low income country in 2012 sourced its agricultural
imports from 62 partners ranging from 98 by Mauritania to 25 by Eritrea. For their non-agricultural
needs, the average low income country sourced from 90 partners with Tanzania sourcing from as
many as 143 countries while Eritrea sourced from the fewest partners (50). The average low
income country spent about USD 507 million on agricultural goods and USD 1.8 billion on non-
agricultural goods. Lower middle income countries with their relatively higher incomes have a
larger choice of suppliers. In 2012, the average lower middle income country sourced its
agricultural import needs from 77 partners spending an average of USD 1.8 billion per partner. For
their non-agricultural imports, they sourced from 104 partners providing each partner about
USD 4.6 billion. For both income groups, these statistics are substantially higher than their
comparable 2000 levels, attesting to increased incomes over time and the capacity to expand trade -
both imports and exports - over time.
Country All agriculture PerishableNon-
agriculture
All
agriculturePerishable
Non-
agricultureAgriculture
Non-
agriculture
All
goods
Egypt (4) 4,112,438 528,877 15,611,026 20.85 12.86 79.15 115 131 139
Indonesia (2) 4,023,556 404,693 32,246,180 11.09 10.06 88.91 141 170 176
India (1) 3,338,254 475,334 41,843,444 7.39 14.24 92.61 138 166 166
Philippines (3) 2,801,414 567,530 32,017,834 8.05 20.26 91.95 109 151 154
Morocco (7) 1,567,608 111,329 10,259,960 13.25 7.10 86.75 113 133 142
Nigeria (8) 1,310,244 86,419 7,290,305 15.23 6.60 84.77 121 166 167
Pakistan (9) 1,185,944 52,349 5,095,957 18.88 4.41 81.12 81 99 108
Viet Nam (6) 1,096,785 121,947 10,755,661 9.25 11.12 90.75 65 90 96
Ukraine (5) 1,016,760 160,482 13,200,392 7.15 15.78 92.85 116 135 149
Syrian Arab Republic (14) 708,987 53,380 2,906,009 19.61 7.53 80.39 73 79 87
Total above 21,161,990 2,562,340 171,226,768 70.72* 62.50* 78.98* N/A N/A N/A
Indonesia (2) 5,527,305 766,066 58,169,124 8.68 13.86 91.32 124 173 177
India (1) 5,524,303 804,269 114,583,536 4.60 14.56 95.40 153 187 187
Egypt (6) 4,813,628 651,653 24,544,850 16.40 13.54 83.60 124 138 145
Philippines (3) 3,788,241 705,557 41,787,532 8.31 18.62 91.69 104 139 145
Pakistan 7) 3,212,107 185,855 23,288,104 12.12 5.79 87.88 149 185 187
Iraq (10) 2,704,215 426,207 9,229,365 22.66 15.76 77.34 63 85 87
Ukraine (4) 2,576,988 734,973 36,216,112 6.64 28.52 93.36 133 160 174
Viet Nam (5) 2,525,588 376,996 34,762,228 6.77 14.93 93.23 118 155 158
Morocco (8) 2,234,603 234,384 18,879,274 10.58 10.49 89.42 128 156 162
Nigeria (9) 2,127,887 115,862 16,169,359 11.63 5.44 88.37 81 113 114
Total above 35,034,864 5,001,822 377,629,484 68.44* 63.26* 79.58* N/A N/A N/A
India (1) 19,145,190 2,056,295 428,200,672 4.28 10.74 95.72 154 185 185
Indonesia (2) 17,497,724 2,407,095 168,940,496 9.39 13.76 90.61 142 178 185
Egypt (6) 17,212,416 2,261,799 56,624,848 23.31 13.14 76.69 128 154 159
Viet Nam (3) 12,919,264 3,672,321 87,673,056 12.84 28.43 87.16 120 144 152
Philippines (5) 7,832,292 1,832,630 66,065,484 10.60 23.40 89.40 110 155 161
Iraq (10) 7,806,082 2,133,583 24,553,398 24.12 27.33 75.88 71 83 88
Nigeria (7) 7,027,818 287,759 39,758,668 15.02 4.09 84.98 112 153 157
Ukraine (4) 6,734,986 2,502,143 80,481,808 7.72 37.15 92.28 142 163 173
Pakistan (9) 5,623,336 415,248 37,350,268 13.09 7.38 86.91 130 175 178
Morocco (8) 5,232,333 545,741 38,289,620 12.02 10.43 87.98 129 148 160
Total above 107,031,440 18,114,614 1,027,938,318 76.14* 74.16* 85.08* N/A N/A N/A
2012
Value (USD '000) Number of partners
2000
2005
Share (%)
AGRICULTURAL SPECIFIC TRADE FACILITATION INDICATORS: AN OVERVIEW – 43
OECD FOOD, AGRICULTURE AND FISHERIES PAPER N°74 © OECD 2015
The data suggest that trade, both imports and exports by low and lower middle income
countries, expanded substantially and at the same time, there were improvements in their trade
facilitation indicators reported in Trading Across Borders database. This suggests that developing
countries capacity to trade improved. This is not to imply that further improvements in border
procedures, logistics and other trade facilitating factors are not necessary. The data clearly suggest
that most low and lower middle income countries have considerably catching-up to attain best
practices. Perhaps the trade figures presented here would have been higher with additional
improvements in trade facilitation as the literature suggests. But the data suggest, especially among
the ten leading low and lower middle income exporters, that there have been improvements in
custom clearance, logistics and infrastructure and productive capacity as reflected in the jump in
trade since 2000.
11. Use characteristics of traded agricultural products
One of the big developments in international trade has been the “slicing and dicing” of
production into various tasks that are performed in multiple countries prior to their assembly for
sale to consumers. Improvements in communications, logistics, reductions in transport costs,
among other technological improvements have enabled firms to locate production in multiple
countries to improve profitability. A country’s ability to connect to value chains and its location
within the chain are partly determined by its ability to meet standards and efficiently move goods
through its borders. Trade facilitation measures which aim to lower costs and improve the
efficiency and reduce the timeliness of the procedures involved in moving goods between countries
become more important in this context. The speed by which goods clear borders is not only
relevant for perishable agricultural goods but also for other goods such as parts and components
that are part of value chains in different countries. Delays in their availability can be quite costly as
multiple plants in various countries can lie idle. Timeliness is also important for high tech goods
that may experience rapid technological obsolescence or fashion merchandise that can quickly go
out of fashion before firms can get their goods to the market. This phenomenon has increased the
value of co-ordination and timeliness in moving the various parts where they are needed in timely
manner. Thus, speedy movement of goods through borders has become more important as are
efforts that help expedite the timely movement of goods.
International merchandise trade reflects this trend in the way enterprises organise their
production and the prevalence of global value chains. Only a small portion of merchandise trade is
destined for final consumers. Agricultural markets have also been characterised by global chains as
agricultural goods move to deficit regions from surplus areas or seasonal and perishable produce
move to fulfil consumer year-round demand.
Figure 6 illustrates the phenomenon using the Broad Economic Classification
nomenclature to allocate traded agricultural and non-agricultural products into three broad groups
of capital, intermediate and final goods. The data are based on three years centred around 2000
(1999 to 2001), 2005 (2004-2006) and 2011 (2010-2012). The left hand panel excludes intra-EU
trade and the right hand panel includes it to illustrate that the relative magnitude of trade in
intermediate agricultural goods is affected by the choice. The rest of the section, as in previous
sections is based on data that excludes intra-EU trade.
It is apparent from Figure 6 that trade of agricultural products is different from non-
agriculture with a much larger proportion of traded agricultural goods destined for final
consumption, especially when intra EU trade is considered. Interestingly, the allocation of traded
non-agricultural goods is little affected whether or not data include intra-EU trade. For agricultural
goods however, the relative importance of traded intermediate goods diminishes when the figures
reflect trade among the EU members. Nonetheless, in the more recent period, trade in agricultural
products that are used as inputs by other countries (intermediate goods) have increased in
importance.
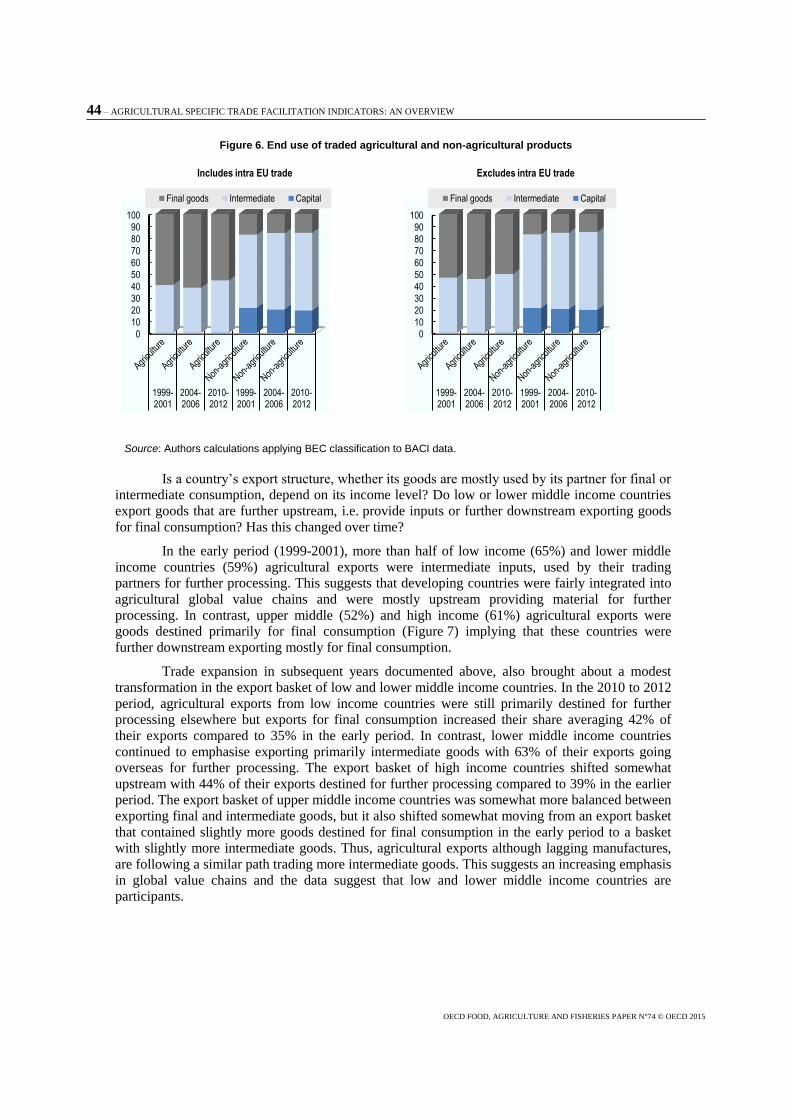
44 – AGRICULTURAL SPECIFIC TRADE FACILITATION INDICATORS: AN OVERVIEW
OECD FOOD, AGRICULTURE AND FISHERIES PAPER N°74 © OECD 2015
Figure 6. End use of traded agricultural and non-agricultural products
Source: Authors calculations applying BEC classification to BACI data.
Is a country’s export structure, whether its goods are mostly used by its partner for final or
intermediate consumption, depend on its income level? Do low or lower middle income countries
export goods that are further upstream, i.e. provide inputs or further downstream exporting goods
for final consumption? Has this changed over time?
In the early period (1999-2001), more than half of low income (65%) and lower middle
income countries (59%) agricultural exports were intermediate inputs, used by their trading
partners for further processing. This suggests that developing countries were fairly integrated into
agricultural global value chains and were mostly upstream providing material for further
processing. In contrast, upper middle (52%) and high income (61%) agricultural exports were
goods destined primarily for final consumption (Figure 7) implying that these countries were
further downstream exporting mostly for final consumption.
Trade expansion in subsequent years documented above, also brought about a modest
transformation in the export basket of low and lower middle income countries. In the 2010 to 2012
period, agricultural exports from low income countries were still primarily destined for further
processing elsewhere but exports for final consumption increased their share averaging 42% of
their exports compared to 35% in the early period. In contrast, lower middle income countries
continued to emphasise exporting primarily intermediate goods with 63% of their exports going
overseas for further processing. The export basket of high income countries shifted somewhat
upstream with 44% of their exports destined for further processing compared to 39% in the earlier
period. The export basket of upper middle income countries was somewhat more balanced between
exporting final and intermediate goods, but it also shifted somewhat moving from an export basket
that contained slightly more goods destined for final consumption in the early period to a basket
with slightly more intermediate goods. Thus, agricultural exports although lagging manufactures,
are following a similar path trading more intermediate goods. This suggests an increasing emphasis
in global value chains and the data suggest that low and lower middle income countries are
participants.
0
10
20
30
40
50
60
70
80
90
100
1999-2001
2004-2006
2010-2012
1999-2001
2004-2006
2010-2012
Includes intra EU trade
Final goods Intermediate Capital
0
10
20
30
40
50
60
70
80
90
100
1999-2001
2004-2006
2010-2012
1999-2001
2004-2006
2010-2012
Excludes intra EU trade
Final goods Intermediate Capital
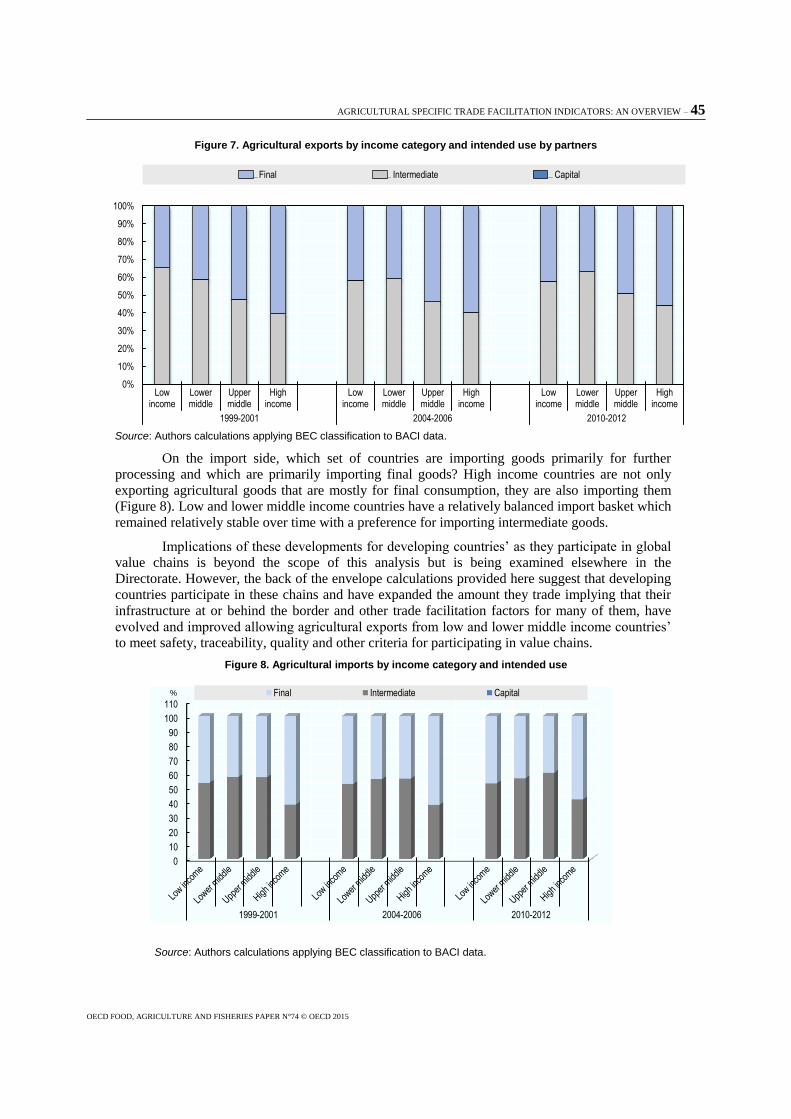
AGRICULTURAL SPECIFIC TRADE FACILITATION INDICATORS: AN OVERVIEW – 45
OECD FOOD, AGRICULTURE AND FISHERIES PAPER N°74 © OECD 2015
Figure 7. Agricultural exports by income category and intended use by partners
Source: Authors calculations applying BEC classification to BACI data.
On the import side, which set of countries are importing goods primarily for further
processing and which are primarily importing final goods? High income countries are not only
exporting agricultural goods that are mostly for final consumption, they are also importing them
(Figure 8). Low and lower middle income countries have a relatively balanced import basket which
remained relatively stable over time with a preference for importing intermediate goods.
Implications of these developments for developing countries’ as they participate in global
value chains is beyond the scope of this analysis but is being examined elsewhere in the
Directorate. However, the back of the envelope calculations provided here suggest that developing
countries participate in these chains and have expanded the amount they trade implying that their
infrastructure at or behind the border and other trade facilitation factors for many of them, have
evolved and improved allowing agricultural exports from low and lower middle income countries’
to meet safety, traceability, quality and other criteria for participating in value chains.
Figure 8. Agricultural imports by income category and intended use
Source: Authors calculations applying BEC classification to BACI data.
0%
10%
20%
30%
40%
50%
60%
70%
80%
90%
100%
Lowincome
Lowermiddle
Uppermiddle
Highincome
Lowincome
Lowermiddle
Uppermiddle
Highincome
Lowincome
Lowermiddle
Uppermiddle
Highincome
1999-2001 2004-2006 2010-2012
Final Intermediate Capital
0
10
20
30
40
50
60
70
80
90
100
110
1999-2001 2004-2006 2010-2012
Final Intermediate Capital%
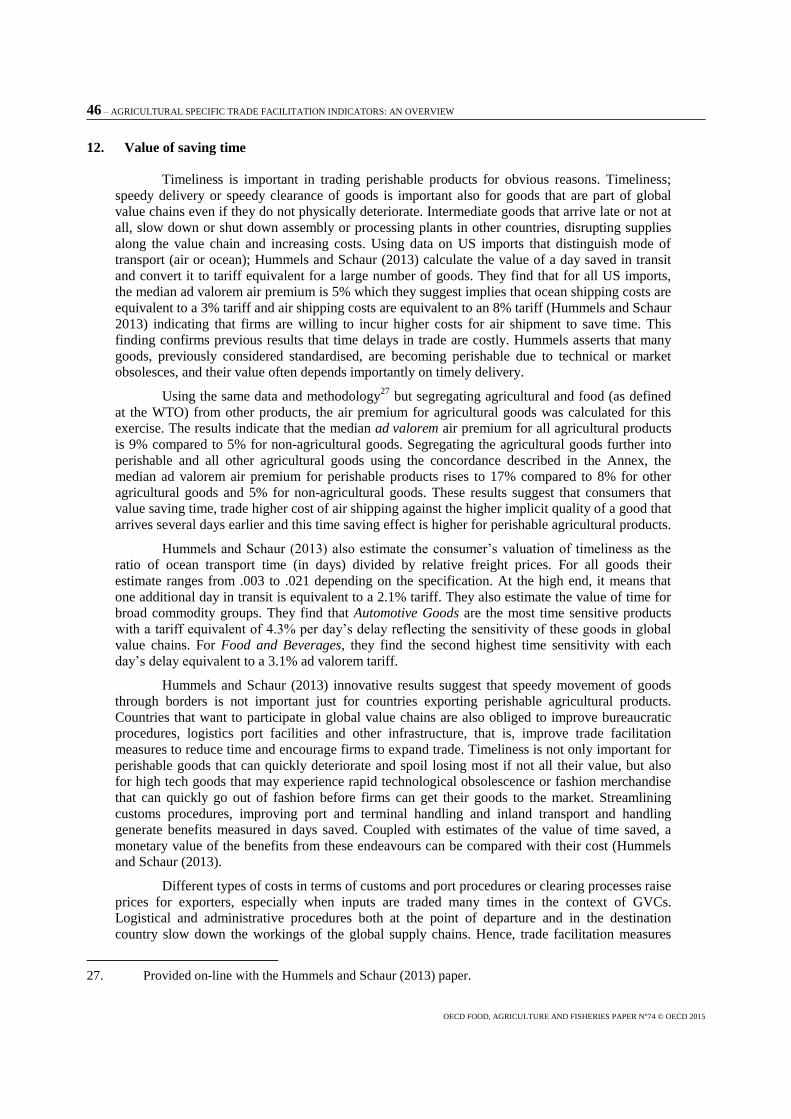
46 – AGRICULTURAL SPECIFIC TRADE FACILITATION INDICATORS: AN OVERVIEW
OECD FOOD, AGRICULTURE AND FISHERIES PAPER N°74 © OECD 2015
12. Value of saving time
Timeliness is important in trading perishable products for obvious reasons. Timeliness;
speedy delivery or speedy clearance of goods is important also for goods that are part of global
value chains even if they do not physically deteriorate. Intermediate goods that arrive late or not at
all, slow down or shut down assembly or processing plants in other countries, disrupting supplies
along the value chain and increasing costs. Using data on US imports that distinguish mode of
transport (air or ocean); Hummels and Schaur (2013) calculate the value of a day saved in transit
and convert it to tariff equivalent for a large number of goods. They find that for all US imports,
the median ad valorem air premium is 5% which they suggest implies that ocean shipping costs are
equivalent to a 3% tariff and air shipping costs are equivalent to an 8% tariff (Hummels and Schaur
2013) indicating that firms are willing to incur higher costs for air shipment to save time. This
finding confirms previous results that time delays in trade are costly. Hummels asserts that many
goods, previously considered standardised, are becoming perishable due to technical or market
obsolesces, and their value often depends importantly on timely delivery.
Using the same data and methodology27
but segregating agricultural and food (as defined
at the WTO) from other products, the air premium for agricultural goods was calculated for this
exercise. The results indicate that the median ad valorem air premium for all agricultural products
is 9% compared to 5% for non-agricultural goods. Segregating the agricultural goods further into
perishable and all other agricultural goods using the concordance described in the Annex, the
median ad valorem air premium for perishable products rises to 17% compared to 8% for other
agricultural goods and 5% for non-agricultural goods. These results suggest that consumers that
value saving time, trade higher cost of air shipping against the higher implicit quality of a good that
arrives several days earlier and this time saving effect is higher for perishable agricultural products.
Hummels and Schaur (2013) also estimate the consumer’s valuation of timeliness as the
ratio of ocean transport time (in days) divided by relative freight prices. For all goods their
estimate ranges from .003 to .021 depending on the specification. At the high end, it means that
one additional day in transit is equivalent to a 2.1% tariff. They also estimate the value of time for
broad commodity groups. They find that Automotive Goods are the most time sensitive products
with a tariff equivalent of 4.3% per day’s delay reflecting the sensitivity of these goods in global
value chains. For Food and Beverages, they find the second highest time sensitivity with each
day’s delay equivalent to a 3.1% ad valorem tariff.
Hummels and Schaur (2013) innovative results suggest that speedy movement of goods
through borders is not important just for countries exporting perishable agricultural products.
Countries that want to participate in global value chains are also obliged to improve bureaucratic
procedures, logistics port facilities and other infrastructure, that is, improve trade facilitation
measures to reduce time and encourage firms to expand trade. Timeliness is not only important for
perishable goods that can quickly deteriorate and spoil losing most if not all their value, but also
for high tech goods that may experience rapid technological obsolescence or fashion merchandise
that can quickly go out of fashion before firms can get their goods to the market. Streamlining
customs procedures, improving port and terminal handling and inland transport and handling
generate benefits measured in days saved. Coupled with estimates of the value of time saved, a
monetary value of the benefits from these endeavours can be compared with their cost (Hummels
and Schaur (2013).
Different types of costs in terms of customs and port procedures or clearing processes raise
prices for exporters, especially when inputs are traded many times in the context of GVCs.
Logistical and administrative procedures both at the point of departure and in the destination
country slow down the workings of the global supply chains. Hence, trade facilitation measures
27. Provided on-line with the Hummels and Schaur (2013) paper.
AGRICULTURAL SPECIFIC TRADE FACILITATION INDICATORS: AN OVERVIEW – 47
OECD FOOD, AGRICULTURE AND FISHERIES PAPER N°74 © OECD 2015
that expedite border crossings become even more important for intermediate inputs that are part of
GVCs.
A study for the USAID by Hummels et al., (2007) using data on imports to the United
States via air and ocean transport (as above), calculated the tariff equivalent of a day’s saving for
various products. For example, they report that the tariff equivalent for the value of time saving per
day is 0.9% for Vegetables and fruit, 0.8% for Cereals and cereal preparations, and 1.1% for
Coffee, tea, cocoa, spices and manufactures thereof. They combined this type of information for
all products with data form Trading Across Borders and each country’s trade basket (imports or
exports) to calculate the tariff equivalent of time delays in: i) inland transport, ii) port handling and
iii) custom procedures for each country’s imports or exports.28
Aggregating the country
information into various regions, the study concludes that for imports, the tariff equivalent of time
delays is greater than the applied tariff in each region supporting other studies that find that non-
tariff measures are a greater hindrance to trade. For exports, the tariff equivalent of time delays
exceeds tariffs faced by exporters in all regions except high income OECD countries and countries
in East Asia and the Pacific. Delays at customs were the largest contributor to the tariff equivalent
of time delays only in East Asia and the Pacific. But, it was the second leading contributor to tariff
equivalent of time delays in Europe and Central Asia, Latin America and the Caribbean, Middle
East and North Africa and Sub Saharan Africa. Inland transport and handling was the leading
contributor to the tariff equivalent of time delays in Europe and Central Asia and in South Asia,
while port and terminal handling delays contributed the most to the tariff equivalent of time delays
in High Income OECD, Latin America and the Caribbean, Middle East and North Africa and Sub-
Saharan Africa. Given that countries have improved their performance in reducing time delays
across the spectrum since 2007, the magnitude of the tariff equivalent of time delays may have
declined. However, applied tariffs have mostly fallen during this period. It may still be the case
that improvements in border procedures that reduce time delays may have a larger impact on trade
than tariff reduction.
For the low income countries in his sample, the overall tariff equivalent of time delays to
export averaged 19.7% ranging from 59% in Burundi to 3.5% in Cambodia. In contrast, the applied
tariff faced by exporters from low income countries averaged 6.1% ranging from 17.1% for Nepal
and 0.5% for Chad. The largest contributor to the cost of time delays for 18 of the 27 low income
countries in his sample was delays in inland transportation while port handling or customs
clearance each represented the largest share to time delay cost in seven countries.
The difference between the ad valorem equivalent of time delays and the applied tariff
faced by exporters from lower middle income countries was less dramatic. The ad valorem
equivalent of time cost to export averaged 9.9% ranging from a low of 2.5% in Syria to a high of
32% in Uzbekistan. The applied tariff faced by exporters from lower middle income countries
averaged 7% ranging from a low of 0.3% in Iraq to a high of 38.1% in Fiji. Inland transportation
was the highest contributor to the tariff equivalent of time cost to export for 25 of the 45 lower
middle income countries in the sample while the tariff equivalent of time delays to clear customs
was the largest contributor in 15 countries and port handling contributed the most in 14 countries.29
The findings from Hummel et al., (2007) confirm results of others that trade delays are costly.
They also indicate that the steps low income countries need to take to speed delivery of their
exports may involve relatively high-cost infrastructural investments in roads and logistics to
improve their inland transportation system along with improvements in handling the merchandise
while in the port. Customs clearance, although also slowing trade, for low (lower middle) income
28. The ad valorem equivalent of a day saved is product but not country specific and the time value is
based on US import data and are assumed to apply to all countries.
29. The number of countries is greater than 45 because in some cases there was a tie between the
different procedures for the largest contributor to the tariff equivalent.
48 – AGRICULTURAL SPECIFIC TRADE FACILITATION INDICATORS: AN OVERVIEW
OECD FOOD, AGRICULTURE AND FISHERIES PAPER N°74 © OECD 2015
countries provided about 25% (29%) of the overall cost of time delays. The results from Hummel
et al., (2007) although derived only from US import data, may be indicative of agricultural trade
for other countries as they are based on the value traders place on speedy delivery of specific
products including agricultural goods, which are then applied to an individual country’s export
basket to calculate the tariff equivalent of time delays for that country. With information on the
cost to improve the timeliness of clearance at customs or to speed-up inland transport or port
handling, one could conduct cost benefit analysis on the desirability of a country to undertake such
projects.
13. Summary and conclusions
The literature reporting empirical results for trade facilitation measures and agricultural
trade was reviewed in order to advise future work on trade facilitation processes focused on
agriculture-specific constraints. The studies identified in this review tend to focus predominantly
on time delays, logistics and infrastructure, and customs efficiency or sanitary and phytosanitary
(SPS) standards and technical barriers to trade (TBT), with very few studies overlapping into both
categories. The results vary depending on commodity composition and country coverage.
Overall, evaluations which take indicators of trade times, logistics performance and
infrastructure quality tend to find a significant relationship between trade facilitation proxies and
trade flows or trade costs, though results vary significantly across product sectors and regions.
These suggest that the length of export and import times and customs clearance delays can present
important impediments to trade for time-sensitive agricultural products. Results suggest that firms
are willing to pay a premium for air shipment in order to avoid an extra day delay from ocean
freight and this premium is higher for perishable agricultural products than for other goods.
Logistics performance and maritime connectivity also appear to have significant effects on trade
costs. Nearly all of these studies rely on more general indicators such as the number of days needed
to export or connectivity indices which may be more representative of aggregate trade flows and
stylised shipments than sector specific constraints. This suggests that data on agriculture-specific
measures may be limited. Whether or not these barriers have different implications for agricultural
products than those captured by the standard indicators for overall trade is worth investigating.
Summary statistics of key facilitation metrics such as the time to get the goods to the
border, to clear customs, and to load a consignment onto a vessel from the World Bank’s Doing
Business database were also provided. The data indicate the measures have improved for most
countries across the various income groupings suggesting that countries have taken steps to
improve their performance.
Trade facilitation matters. Estimates of trade friction costs from border and custom
procedures (direct trade transaction cost) amount to 2% to 15% of the value of traded goods (Moïsé
and Le Bris (2013). As reported in Shephard and Wilson (2008), several studies show increased
trade flows and benefits from trade facilitation improvements comparable to full liberalisation of
goods and services. Results from Hummels et al. (2007) suggest that the tariff equivalent of time
delays involved in processing documents, transporting goods to the border, clearing customs and
loading the cargo on to the vessel, are higher than applied tariffs faced by exporters in most
regions. Trade facilitation may be more important for agricultural rather than manufacturing trade
especially from lower income countries. As reported by Moïsé and Le Bris (2013) trade transaction
costs (for narrowly defined trade facilitation) are higher for agro-food products than manufactured
goods due to more stringent and numerous border procedures, physical inspections and SPS
requirements and the perishable nature of many agricultural products which entail a higher
sensitivity to delivery delays. Calculations of trade costs excluding tariffs by Duval et al. (2012)
confirm that they are higher for agricultural products compared to industrial goods.
The specificities of trading agricultural products may imply that trade facilitation variables
discussed above, as currently measured, are not representative of the trade frictions associated with
AGRICULTURAL SPECIFIC TRADE FACILITATION INDICATORS: AN OVERVIEW – 49
OECD FOOD, AGRICULTURE AND FISHERIES PAPER N°74 © OECD 2015
their trade. Better measurements of the conventional trade facilitation variables that single out
agricultural products are needed. Additionally, there are behind the border procedures such as
meeting SPS standards that are important for many agricultural products and any additional time
delays and documents (if any) required prior to importing or to exporting these goods needs to be
taken into account. Additional specificity in trading some agricultural products is the potential
differences associated with different modes such as air transport or cold storage of transporting
these goods across international borders.
Specifically for any country exporting and importing a particular set of agricultural
products perishable and others, a questionnaire distributed to custom officials, health and sanitary
certificate providers, logistic operators and traders designed to collect time and motion information
on the following set of variables, among others, would be helpful:
Total number of documents to import or export identifying documents needed
specifically to meet sanitary and phytosanitary standards (SPS).
Total time to process the documents explicitly identifying time needed to receive SPS
approval.
Availability and capacity of cold storage facilities at the border.
Collaboration or not, between different agencies at the border.
Coordination or not, of consignment inspections.
Time to clear customs.
Time to load cargo on vessel from the time good arrived at customs (port handling).
Time to collect goods and ship to warehouse or packing facility (inland transport).
Time to transport goods from warehouse or packing facility to border.
Choice of specific mode of trading agricultural products, which mode for which
product for which market.
The World Bank’s International Finance Corporation has started a project to Benchmark
the Business of Agriculture which includes collecting indicators on doing business in agriculture
behind, at and beyond the border. The project started in 2014 with a pilot test in ten countries with
plans to eventually include some 80 countries by 201630
. Undoubtedly, food safety and health
standards along with cold storage throughout the chain of many agricultural goods, sets their trade
somewhat apart from trading general merchandise. But, agricultural products are not the only ones
where speedy delivery and quick processing through border is important. Products involved in
sequential multi-stage processing in various countries also benefit from speedy delivery and quick
passage through borders.
Trade developments during the last 13 years suggest that developing countries as a group
have materially expanded their ability to trade, both as exporters and as importers. Even low
income countries have demonstrated very high growth rates in agricultural trade, including for
products classified as perishable. Although the grouping of products is subjective, it is probably
safe to say that the general pattern will not change significantly with a more refined list of relevant
products given that the general trade pattern for all agricultural trade is very similar. Furthermore,
30. Information will be collected on the time needed and fees assessed for all required procedures such
as necessary public and commercial documents including sanitary and phytosanitary certificates,
certificate of origin, customs export declaration and bill of lading other conformity related
procedures such as testing and certification, terminal handling and any other procedures before and
at the border post.
50 – AGRICULTURAL SPECIFIC TRADE FACILITATION INDICATORS: AN OVERVIEW
OECD FOOD, AGRICULTURE AND FISHERIES PAPER N°74 © OECD 2015
trade in non-agricultural products for low and lower middle income countries expanded even
faster. Data on border rejections, although limited to the United States and the European Union,
suggest that rejections are a very small share of imports of affected products and that a relatively
small number of countries, spanning all income levels, account for a large part of the rejections.
Coupled with the findings that timeliness in trade is not unique to perishable agricultural products,
it may be the case that trade frictions at the border may not have impeded trade of agricultural
products any more than trade of industrial goods. Data from Benchmarking the Business of
Agriculture will help shed light on the uniqueness or not of trade facilitating measures in trading
agricultural products.
AGRICULTURAL SPECIFIC TRADE FACILITATION INDICATORS: AN OVERVIEW – 51
OECD FOOD, AGRICULTURE AND FISHERIES PAPER N°74 © OECD 2015
References
ADB (2013), Modernizing Sanitary and Phytosanitary Measures to Facilitate Trade in Agricultural and Food
Products: Report on the Development of an SPS Plan for the CAREC Countries. Mandaluyong City: Asian
Development Bank.
ADB (2012), Agricultural Trade Facilitation in the Greater Mekong Subregion. Mandaluyong City: Asian
Development Bank.
Arvis. J. F. et al. (2013), "Trade Costs in the Developing World", World Bank Policy Research Working Paper No
6309, January.
Arvis, J.F. et al. (2012), Connecting to Compete 2012: Trade Logistics in the Global Economy – The Logistics
Performance Index and its Indicators. Washington D.C.: The World Bank.
Arvis, J.F., and B. Shepherd (2011) “The Air Connectivity Index: Measuring Integration in the Global Air
Transport Network”, World Bank Policy Research Working Paper No. 5722, June.
John Beghin, Anne-Célia Disdier, Stéphan Marette, “Trade Restrictiveness Indices in Presence of Externalities: An
Application to Non-Tariff Measures”, CESIFO WORKING PAPER NO. 4968, SEPTEMBER 2014
Brenton, P., J. Sheehy, and M. Vancauteren (2002), “Technical barriers to trade in the European Union: importance
for accession countries”, Journal of Common Market Studies, 39, 265-284.
CEC (Commission of the European Communities) (1998), Technical Barriers to Trade, Volume 1 of Sub-series 3
Dismantling of Barriers of the Single Market Review. Luxembourg: Office for Official Publications.
Chen, M.X., T. Otsuki, and J.S Wilson (2006), "Do Standards Matter for Export Success?," World Bank Policy
Research Working Paper No. 3809, January.
Crivelli, P., and J. Gröschl (2012), “SPS Measures and Trade: Implementation Matters” World Trade Organization
Staff Working Paper ERSD-2012-05, February.
Disdier, A-C., L. Fontagné, and M. Mimouni (2008), "The Impact of Regulations on Agricultural Trade: Evidence
from the SPS and TBT Agreements", American Journal of Agricultural Economics 90 (2), 336-350.
Djankov, S., C. Freund, and C.S. Pham (2010), "Trading on time", Review of Economics and Statistics 92 (1), 166-
173.
Djankov, S., C. Freund, and C.S. Pham (2006), "Trading on time", World Bank Working Paper No. 3909.
Duval, F. et al. (2012) "Agricultural Trade Costs in Asia and the Pacific: Patterns, Compositions and
Determinants", UNESCAP Trade and Investment Division Staff Working Paper No. 02/12, November.
Fernández et al. (2011) “Supply Chain Analyses of Exports and Imports of Agricultural Products: Case Studies of
Costa Rica, Honduras, and Nicaragua”, in J. H. López J., and R. Shankar eds Getting the Most Out of Fre
Trade Agreements in Central America. Washington D.C.: The World Bank.
Ferro, E., J.S. Wilson, and T. Otsuki (2013), "The Effect of Product Standards on Agricultural Exports from
Developing Countries", World Bank Policy Research Working Paper No. 6518, June.
52 – AGRICULTURAL SPECIFIC TRADE FACILITATION INDICATORS: AN OVERVIEW
OECD FOOD, AGRICULTURE AND FISHERIES PAPER N°74 © OECD 2015
Fontagné, L., M. Mimouni, and J.-M. Pasteels (2005), “Estimating the Impact of Environmental SPS and TBT on
International Trade”, Integration and Trade Journal, 22, 7–37.
de Frahan, B.H., and M. Vancauteren (2006), "Harmonisation of Food Regulations and Trade in the Single Market:
Evidence from Disaggregated Data", European Review of Agricultural Economics 33 (3), 337–360.
Freund, C. and N. Rocha (2010), "What Constraints Africa's Exports?", World Bank Research Working Paper No
5184, January.
Hufbauer, Gary Clyde, Martin Vieiro, John S. Wilson, “Trade Facilitation Matters!” Vox, 14 September, 2012,
http://voxeu.com/article/trade-facilitation-matters.
Hummels, David L. and Georg Schaur (2013), “Time as a Trade Barrier”, American Economic Review 103(7),
2935-2959.
Hummels, David L., Peter Minor, Matthew Reisman and Erin Endean (2007), “Calculating Tariff Equivalents for
Time in Trade,” Arlington, VA: Nathan Associates Inc. for the United States Agency for International
Development (USAID). Available at:
http://www.krannert.purdue.edu/faculty/hummelsd/research/tariff_equivalents.pdf.
IFC (2011), Where Innovation Meets Impact: IFC Annual Report 2010. Washington D.C.: International Finance
Corporation.
Jongwanich, J. (2009), "The Impact of Food Safety Standards on Processed Food Exports from Developing
Countries," Food Policy, 34, 447-457.
Jongwanich, J., and N. Magtibay-Ramos (2009), "Determinants of Structural Changes of Food Exports from
Developing Countries", ADB Working Paper Series, No.166, Asian Development Bank, July.
Kee, H.L., A. Nicita, and M. Olarreaga (2009), “Estimating Trade Restrictiveness Indices”, The Economic Journal,
Vol. 119, 172-199.
Kim, S. J. and K. A. Reinert (2009), "Standards and Institutional Capacity: An Examination of Trade in Food and
Agricultural Products", The International Trade Journal, 23 (1), 54–77.
Li, Y., and J. C. Beghin (2012), "A Meta-Analysis of Estimates of the Impact of Technical Barriers to Trade",
Journal of Policy Modeling, 34, 497-511.
Liapis, P. (2011), "Changing Patterns of Trade in Processed Agricultural Products", OECD Food, Agriculture and
Fisheries Working Papers, No. 47, OECD Publishing, Paris.
Liu, L., and C. Yue (2013), "Investigating the Impacts of Time Delays on Trade", Food Policy, 39, 108-114.
Mangelsdorf, A., A. Portugal-Perez, and J.S. Wilson (2012), "Food Standards and Exports: Evidence from China",
World Bank Policy Research Working Paper No. 5976, February.
Martinez-Zarzoso, I., and L. Marquez-Ramos (2008), "The Effect of Trade Facilitation on Sectoral Trade", The B.E.
Journal of Economic Analysis & Policy 8 (1): Article 42.
Maskus, K.E., T. Otsuki, and J.S. Wilson (2005), "The Cost of Compliance with Product Standards for Firms in
Developing Countries: An Econometric Study", World Bank Policy Research Working Paper No.3590,
May.
Minor P., and M. Tsigas (2008), "Impacts of Better Trade Facilitation in Developing Countries", paper presented at
the 11th Annual Conference on Global Economic Analysis, Global Trade Analysis Project, Helsinki, 12-14
June.
AGRICULTURAL SPECIFIC TRADE FACILITATION INDICATORS: AN OVERVIEW – 53
OECD FOOD, AGRICULTURE AND FISHERIES PAPER N°74 © OECD 2015
Milner, C., O. Morrisey, and N. Rudaheranway (2000), “ Policy and Non-Policy Barriers to Trade and Implicit
Taxation of Exports in Uganda”, Journal of Development Studies, 37 (20), 67-90.
Moenius, J. (2004), “Information versus Product Adaptation: The Role of Standards in Trade”, Working paper,
Northwestern University, Evanston, IL.
Moïsé, E., and F. Le Bris (2013), “Trade Costs: What Have we Learned? A Synthesis Report”, OECD Trade Police
Papers, No. 150, OECD Publishing.
Moïsé, E. and S.Sorescu (2013), "Trade Facilitation Indicators. The Potential Impact of Trade Facilitation on
Developing Countries Trade", OECD Trade Policy Papers, No. 144, OECD Publishing
Moïsé, E., T. Orliac and P. Minor (2011), “Trade Facilitation Indicators: The Impact on Trade Costs”, OECD Trade
Policy Papers, No. 118, OECD Publishing.
Moïsé, E. et al. (2013), “Estimating the Constraints to Agricultural Trade of Developing Countries”, OECD Trade
Policy Papers, No. 142, OECD Publishing.
Nicita, A., and J. Gourdon (2013), “A Preliminary Analysis on Newly Collected Data on Non-Tariff Measures”,
UNTAD Policy Issues in International Trade and Commodities Study Series, No.53.
Nordås, H.K., M.G. Grosso, and E. Pinali (2008), "Market Structure in the Distribution Sector and Merchandise
Trade", OECD Trade Policy Working Paper, No 68, OECD Publishing.
Nordås, H.K., E. Pinali, and M.G. Grosso (2006), “Logistics and Time as a Trade Barrier”, OECD Trade Policy
Working Paper No. 35, OECD Publishing.
OECD (2005), “Analysis of Non-Tariff Barriers of Concern to Developing Countries”, OECD Trade Policy
Papers, No. 16, OECD Publishing.
OECD (2003), The Impact of Regulations on Agro-food Trade: The Technical Barriers to Trade (TBT) and
Sanitary and Phytosanitary Measures (SPS) Agreements. Paris: OECD Publishing.
OECD (2012), “Trade Policy Implications of Global Value Chains: Contributions to the Synthesis Report”
OECD and WTO (2013a), Aid for Trade and Value Chains in Agrifood. Paris: OECD Publishing.
OECD and WTO (2013b), Aid for Trade and Value Chains in Transport and Logistics. Paris: OECD Publishing.
Otsuki, T., J.S. Wilson, and M. Sewadeh (2001a), "What Price Precaution? European Harmonisation of Aflatoxin
Regulations and African Groundnut Exports", European Review of Agricultural Economics, 28 (3), 263-
284.
Otsuki, T., J.S. Wilson, and M. Sewadeh (2001b), "Saving Two in a Billion: Quantifying the Trade Effect of
European Standards on African Exports", Food Policy, 26 (5), 495-514.
Persson, M. (2013), "Trade Facilitation and the Extensive Margin," Journal of International Trade & Economic
Development: An International and Comparative Review, 22 (5), 658-693.
Portugal-Perez, Alberto and John S Wilson (2012), “Export Performance and Trade Facilitation Reform: Hard and
Soft Infrastructure”, World Development, 40(7), 1295-1307.
Shepherd, B., and J. S. Wilson (2008), "Trade Facilitation in ASEAN Member Countries: Measuring Progress and
Assessing Priorities", World Bank Policy Research Working Paper No. 4615, May.
Soloaga, I., J.S. Wilson, and A. Mejía (2006), “Moving Forward Faster: Trade Facilitation Reform and Mexican
Competitiveness”, World Bank Policy Research Working Paper No. 3953, June.

54 – AGRICULTURAL SPECIFIC TRADE FACILITATION INDICATORS: AN OVERVIEW
OECD FOOD, AGRICULTURE AND FISHERIES PAPER N°74 © OECD 2015
van Tongeren, F., J. Beghin, and S. Marette (2009), “A Cost-Benefit Framework for the Assessment of Non-Tariff
Measures in Agro-Food Trade”, OECD Food, Agriculture and Fisheries Working Papers, No. 21, OECD
Publishing.
UNESCAP (2011), “Facilitating Agricultural Trade in Asia and the Pacific”, Studies in Trade and Investment
No.74.
UNIDO (2011a), Meeting Standards, Winning Markets: Trade Standards Compliance 2010.Vienna; United Nations
Industrial Development Organization.
UNIDO (2011b), What do Border Rejections Tell us About Trade Standards Compliance of Developing Countries?
Analysis of EU and US Data 2002-2008. Vienna; United Nations Industrial Development Organization.
USAID (2011), Regional Agricultural Transport and Trade Policy Study, West Africa Trade Hub Technical Report
No. 41, March.
Weerahewa, J (2009), "Impact of Trade Facilitation Measures and Regional Trade Agreements on Food and
Agricultural Trade in South Asia," Asia-Pacific Research and Training Network on Trade Working Paper
Series, No 69, June.
Wilson, John S (2012), “Why Trade Costs Matter: Recent Work from the World Bank” Presentation at Columbia
University, February 28, 2012.
Wilson, J.S., C.L. Mann, and T. Otsuki (2005), “Assessing the Benefits of Trade Facilitation: A Global
Perspective”, The World Economy 28 (6), 841-871.
Wilson, J.S., C.L. Mann, and T. Otsuki (2003), “Trade Facilitation and Economic Development: Measuring the
Impact”, World Bank Working Paper, No.2988, March.
World Economic Forum (2013), Enabling Trade Valuing Growth Opportunities. Geneva: World Economic Forum.
WTO (2013), “Bali Agreement on Trade Facilitation” WT/MIN(13)/W/8, 6 December.
WTO (2004), Doha Work Programme: Decision Adopted by the General Council on 1 August 2004, WT/L/579,
August.
WTO (1994a), Agreement on the Application of Sanitary and Phytosanitary Measures. Agreement included within
the comprehensive text of the GATT 1994. Geneva: World Trade Organization.
WTO (1994b), Agreement on technical Barriers to Trade. Agreement included within the comprehensive text of
the GATT 1994. Geneva: World Trade Organization.
Xiong, B. and J.C. Beghin (2011), "Aflatoxin Redux: Does European Aflatoxin Regulation Hurt Groundnut
Exporters from Africa?", European Review of Agricultural Economics, 39 (4), 589-609.
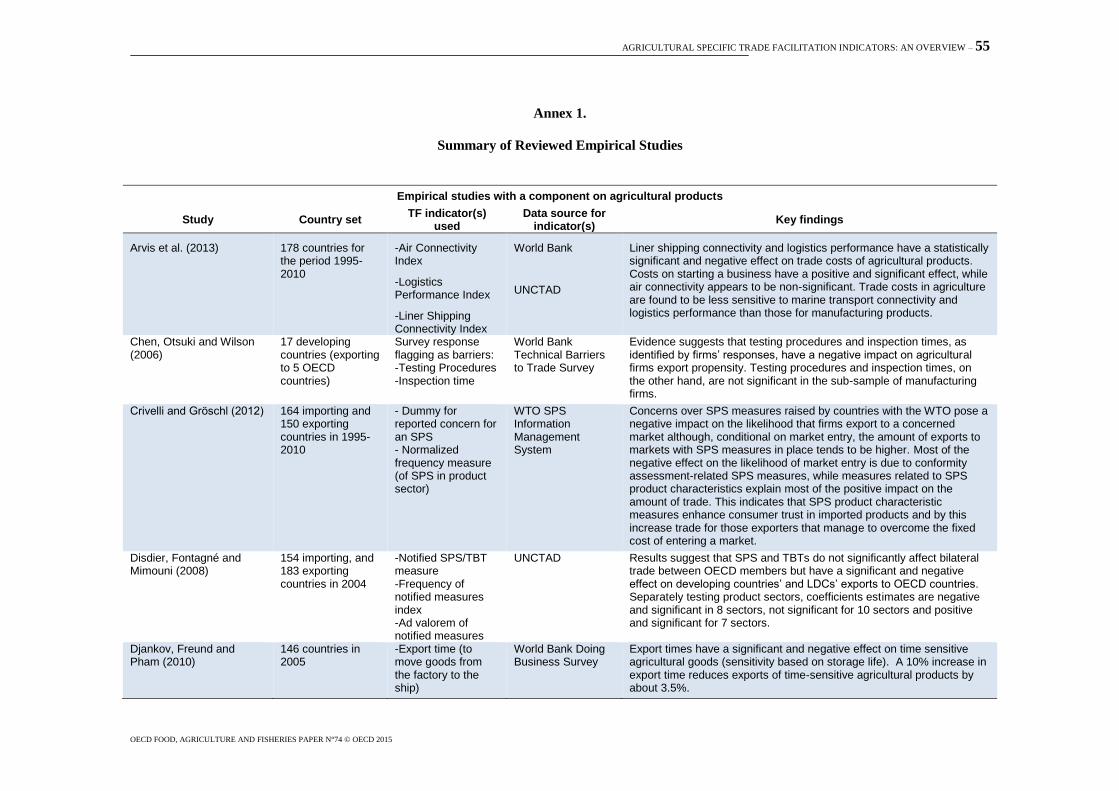
AGRICULTURAL SPECIFIC TRADE FACILITATION INDICATORS: AN OVERVIEW – 55
OECD FOOD, AGRICULTURE AND FISHERIES PAPER N°74 © OECD 2015
Annex 1.
Summary of Reviewed Empirical Studies
Empirical studies with a component on agricultural products
Study Country set TF indicator(s)
used Data source for
indicator(s) Key findings
Arvis et al. (2013) 178 countries for the period 1995-2010
-Air Connectivity Index
-Logistics Performance Index
-Liner Shipping Connectivity Index
World Bank
UNCTAD
Liner shipping connectivity and logistics performance have a statistically significant and negative effect on trade costs of agricultural products. Costs on starting a business have a positive and significant effect, while air connectivity appears to be non-significant. Trade costs in agriculture are found to be less sensitive to marine transport connectivity and logistics performance than those for manufacturing products.
Chen, Otsuki and Wilson (2006)
17 developing countries (exporting to 5 OECD countries)
Survey response flagging as barriers: -Testing Procedures -Inspection time
World Bank Technical Barriers to Trade Survey
Evidence suggests that testing procedures and inspection times, as identified by firms’ responses, have a negative impact on agricultural firms export propensity. Testing procedures and inspection times, on the other hand, are not significant in the sub-sample of manufacturing firms.
Crivelli and Grӧschl (2012) 164 importing and 150 exporting countries in 1995-2010
- Dummy for reported concern for an SPS - Normalized frequency measure (of SPS in product sector)
WTO SPS Information Management System
Concerns over SPS measures raised by countries with the WTO pose a negative impact on the likelihood that firms export to a concerned market although, conditional on market entry, the amount of exports to markets with SPS measures in place tends to be higher. Most of the negative effect on the likelihood of market entry is due to conformity assessment-related SPS measures, while measures related to SPS product characteristics explain most of the positive impact on the amount of trade. This indicates that SPS product characteristic measures enhance consumer trust in imported products and by this increase trade for those exporters that manage to overcome the fixed cost of entering a market.
Disdier, Fontagné and Mimouni (2008)
154 importing, and 183 exporting countries in 2004
-Notified SPS/TBT measure -Frequency of notified measures index -Ad valorem of notified measures
UNCTAD Results suggest that SPS and TBTs do not significantly affect bilateral trade between OECD members but have a significant and negative effect on developing countries’ and LDCs’ exports to OECD countries. Separately testing product sectors, coefficients estimates are negative and significant in 8 sectors, not significant for 10 sectors and positive and significant for 7 sectors.
Djankov, Freund and Pham (2010)
146 countries in 2005
-Export time (to move goods from the factory to the ship)
World Bank Doing Business Survey
Export times have a significant and negative effect on time sensitive agricultural goods (sensitivity based on storage life). A 10% increase in export time reduces exports of time-sensitive agricultural products by about 3.5%.
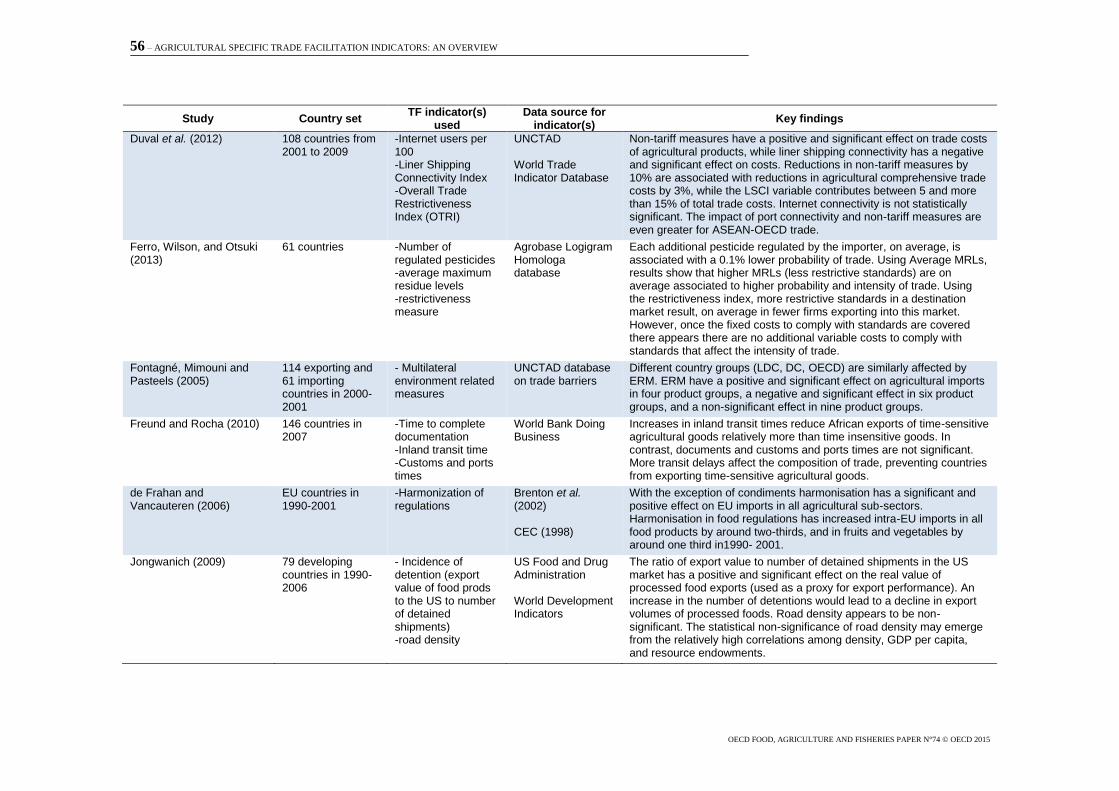
56 – AGRICULTURAL SPECIFIC TRADE FACILITATION INDICATORS: AN OVERVIEW
OECD FOOD, AGRICULTURE AND FISHERIES PAPER N°74 © OECD 2015
Study Country set TF indicator(s)
used Data source for
indicator(s) Key findings
Duval et al. (2012) 108 countries from 2001 to 2009
-Internet users per 100 -Liner Shipping Connectivity Index -Overall Trade Restrictiveness Index (OTRI)
UNCTAD World Trade Indicator Database
Non-tariff measures have a positive and significant effect on trade costs of agricultural products, while liner shipping connectivity has a negative and significant effect on costs. Reductions in non-tariff measures by 10% are associated with reductions in agricultural comprehensive trade costs by 3%, while the LSCI variable contributes between 5 and more than 15% of total trade costs. Internet connectivity is not statistically significant. The impact of port connectivity and non-tariff measures are even greater for ASEAN-OECD trade.
Ferro, Wilson, and Otsuki (2013)
61 countries -Number of regulated pesticides -average maximum residue levels -restrictiveness measure
Agrobase Logigram Homologa database
Each additional pesticide regulated by the importer, on average, is associated with a 0.1% lower probability of trade. Using Average MRLs, results show that higher MRLs (less restrictive standards) are on average associated to higher probability and intensity of trade. Using the restrictiveness index, more restrictive standards in a destination market result, on average in fewer firms exporting into this market. However, once the fixed costs to comply with standards are covered there appears there are no additional variable costs to comply with standards that affect the intensity of trade.
Fontagné, Mimouni and Pasteels (2005)
114 exporting and 61 importing countries in 2000-2001
- Multilateral environment related measures
UNCTAD database on trade barriers
Different country groups (LDC, DC, OECD) are similarly affected by ERM. ERM have a positive and significant effect on agricultural imports in four product groups, a negative and significant effect in six product groups, and a non-significant effect in nine product groups.
Freund and Rocha (2010) 146 countries in 2007
-Time to complete documentation -Inland transit time -Customs and ports times
World Bank Doing Business
Increases in inland transit times reduce African exports of time-sensitive agricultural goods relatively more than time insensitive goods. In contrast, documents and customs and ports times are not significant. More transit delays affect the composition of trade, preventing countries from exporting time-sensitive agricultural goods.
de Frahan and Vancauteren (2006)
EU countries in 1990-2001
-Harmonization of regulations
Brenton et al. (2002) CEC (1998)
With the exception of condiments harmonisation has a significant and positive effect on EU imports in all agricultural sub-sectors. Harmonisation in food regulations has increased intra-EU imports in all food products by around two-thirds, and in fruits and vegetables by around one third in1990- 2001.
Jongwanich (2009) 79 developing countries in 1990-2006
- Incidence of detention (export value of food prods to the US to number of detained shipments) -road density
US Food and Drug Administration World Development Indicators
The ratio of export value to number of detained shipments in the US market has a positive and significant effect on the real value of processed food exports (used as a proxy for export performance). An increase in the number of detentions would lead to a decline in export volumes of processed foods. Road density appears to be non-significant. The statistical non-significance of road density may emerge from the relatively high correlations among density, GDP per capita, and resource endowments.
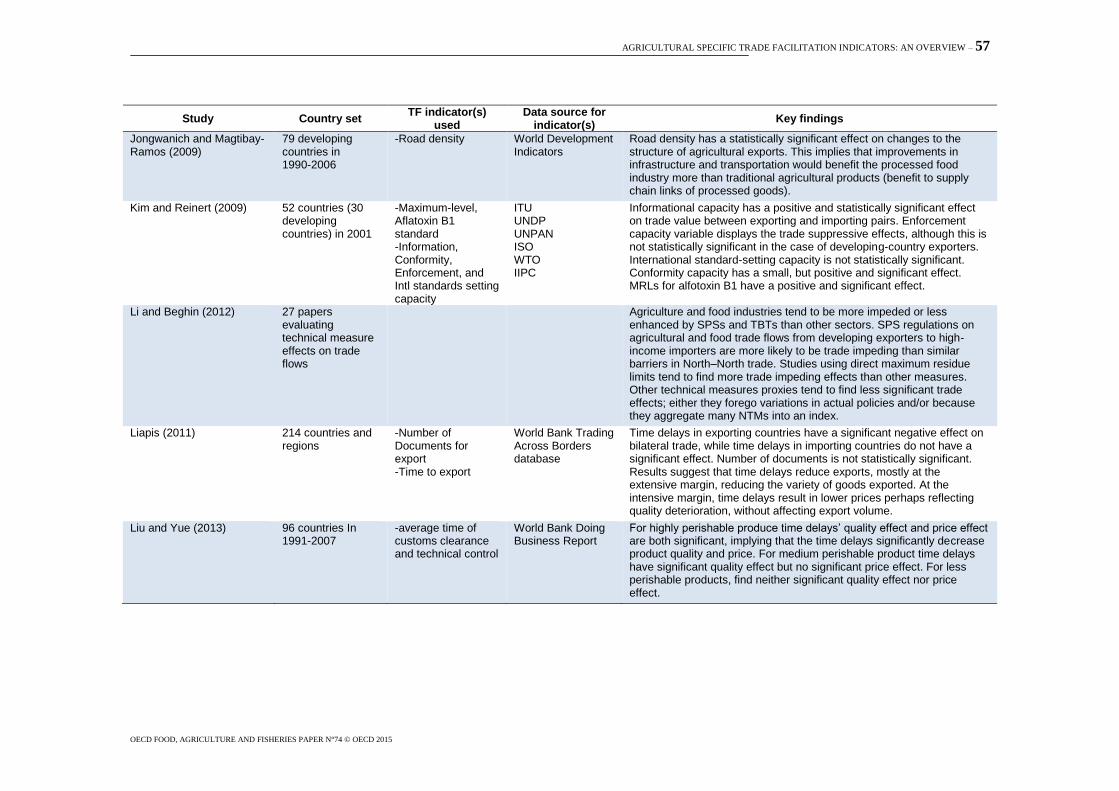
AGRICULTURAL SPECIFIC TRADE FACILITATION INDICATORS: AN OVERVIEW – 57
OECD FOOD, AGRICULTURE AND FISHERIES PAPER N°74 © OECD 2015
Study Country set TF indicator(s)
used Data source for
indicator(s) Key findings
Jongwanich and Magtibay-Ramos (2009)
79 developing countries in 1990-2006
-Road density World Development Indicators
Road density has a statistically significant effect on changes to the structure of agricultural exports. This implies that improvements in infrastructure and transportation would benefit the processed food industry more than traditional agricultural products (benefit to supply chain links of processed goods).
Kim and Reinert (2009) 52 countries (30 developing countries) in 2001
-Maximum-level, Aflatoxin B1 standard -Information, Conformity, Enforcement, and Intl standards setting capacity
ITU UNDP UNPAN ISO WTO IIPC
Informational capacity has a positive and statistically significant effect on trade value between exporting and importing pairs. Enforcement capacity variable displays the trade suppressive effects, although this is not statistically significant in the case of developing-country exporters. International standard-setting capacity is not statistically significant. Conformity capacity has a small, but positive and significant effect. MRLs for alfotoxin B1 have a positive and significant effect.
Li and Beghin (2012) 27 papers evaluating technical measure effects on trade flows
Agriculture and food industries tend to be more impeded or less enhanced by SPSs and TBTs than other sectors. SPS regulations on agricultural and food trade flows from developing exporters to high-income importers are more likely to be trade impeding than similar barriers in North–North trade. Studies using direct maximum residue limits tend to find more trade impeding effects than other measures. Other technical measures proxies tend to find less significant trade effects; either they forego variations in actual policies and/or because they aggregate many NTMs into an index.
Liapis (2011) 214 countries and regions
-Number of Documents for export -Time to export
World Bank Trading Across Borders database
Time delays in exporting countries have a significant negative effect on bilateral trade, while time delays in importing countries do not have a significant effect. Number of documents is not statistically significant. Results suggest that time delays reduce exports, mostly at the extensive margin, reducing the variety of goods exported. At the intensive margin, time delays result in lower prices perhaps reflecting quality deterioration, without affecting export volume.
Liu and Yue (2013) 96 countries In 1991-2007
-average time of customs clearance and technical control
World Bank Doing Business Report
For highly perishable produce time delays’ quality effect and price effect are both significant, implying that the time delays significantly decrease product quality and price. For medium perishable product time delays have significant quality effect but no significant price effect. For less perishable products, find neither significant quality effect nor price effect.
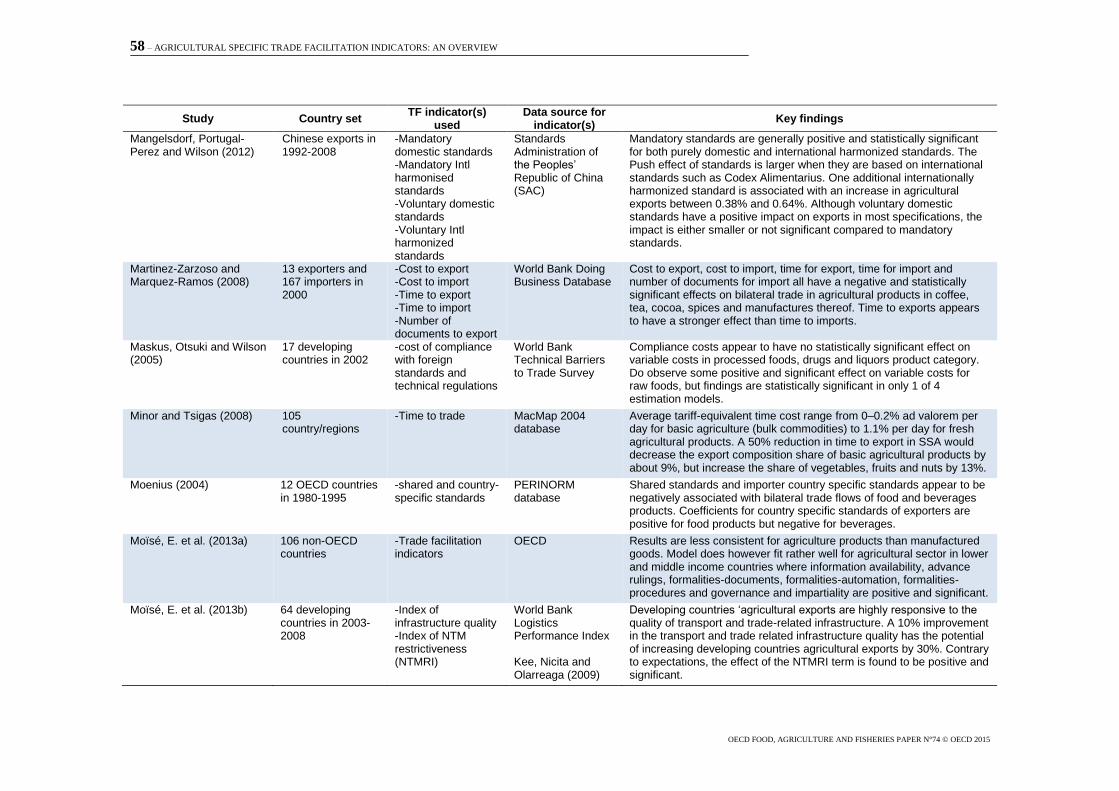
58 – AGRICULTURAL SPECIFIC TRADE FACILITATION INDICATORS: AN OVERVIEW
OECD FOOD, AGRICULTURE AND FISHERIES PAPER N°74 © OECD 2015
Study Country set TF indicator(s)
used Data source for
indicator(s) Key findings
Mangelsdorf, Portugal-Perez and Wilson (2012)
Chinese exports in 1992-2008
-Mandatory domestic standards -Mandatory Intl harmonised standards -Voluntary domestic standards -Voluntary Intl harmonized standards
Standards Administration of the Peoples’ Republic of China (SAC)
Mandatory standards are generally positive and statistically significant for both purely domestic and international harmonized standards. The Push effect of standards is larger when they are based on international standards such as Codex Alimentarius. One additional internationally harmonized standard is associated with an increase in agricultural exports between 0.38% and 0.64%. Although voluntary domestic standards have a positive impact on exports in most specifications, the impact is either smaller or not significant compared to mandatory standards.
Martinez-Zarzoso and Marquez-Ramos (2008)
13 exporters and 167 importers in 2000
-Cost to export -Cost to import -Time to export -Time to import -Number of documents to export
World Bank Doing Business Database
Cost to export, cost to import, time for export, time for import and number of documents for import all have a negative and statistically significant effects on bilateral trade in agricultural products in coffee, tea, cocoa, spices and manufactures thereof. Time to exports appears to have a stronger effect than time to imports.
Maskus, Otsuki and Wilson (2005)
17 developing countries in 2002
-cost of compliance with foreign standards and technical regulations
World Bank Technical Barriers to Trade Survey
Compliance costs appear to have no statistically significant effect on variable costs in processed foods, drugs and liquors product category. Do observe some positive and significant effect on variable costs for raw foods, but findings are statistically significant in only 1 of 4 estimation models.
Minor and Tsigas (2008) 105 country/regions
-Time to trade MacMap 2004 database
Average tariff-equivalent time cost range from 0–0.2% ad valorem per day for basic agriculture (bulk commodities) to 1.1% per day for fresh agricultural products. A 50% reduction in time to export in SSA would decrease the export composition share of basic agricultural products by about 9%, but increase the share of vegetables, fruits and nuts by 13%.
Moenius (2004) 12 OECD countries in 1980-1995
-shared and country-specific standards
PERINORM database
Shared standards and importer country specific standards appear to be negatively associated with bilateral trade flows of food and beverages products. Coefficients for country specific standards of exporters are positive for food products but negative for beverages.
Moïsé, E. et al. (2013a) 106 non-OECD countries
-Trade facilitation indicators
OECD Results are less consistent for agriculture products than manufactured goods. Model does however fit rather well for agricultural sector in lower and middle income countries where information availability, advance rulings, formalities-documents, formalities-automation, formalities-procedures and governance and impartiality are positive and significant.
Moïsé, E. et al. (2013b) 64 developing countries in 2003-2008
-Index of infrastructure quality -Index of NTM restrictiveness (NTMRI)
World Bank Logistics Performance Index Kee, Nicita and Olarreaga (2009)
Developing countries ‘agricultural exports are highly responsive to the quality of transport and trade-related infrastructure. A 10% improvement in the transport and trade related infrastructure quality has the potential of increasing developing countries agricultural exports by 30%. Contrary to expectations, the effect of the NTMRI term is found to be positive and significant.
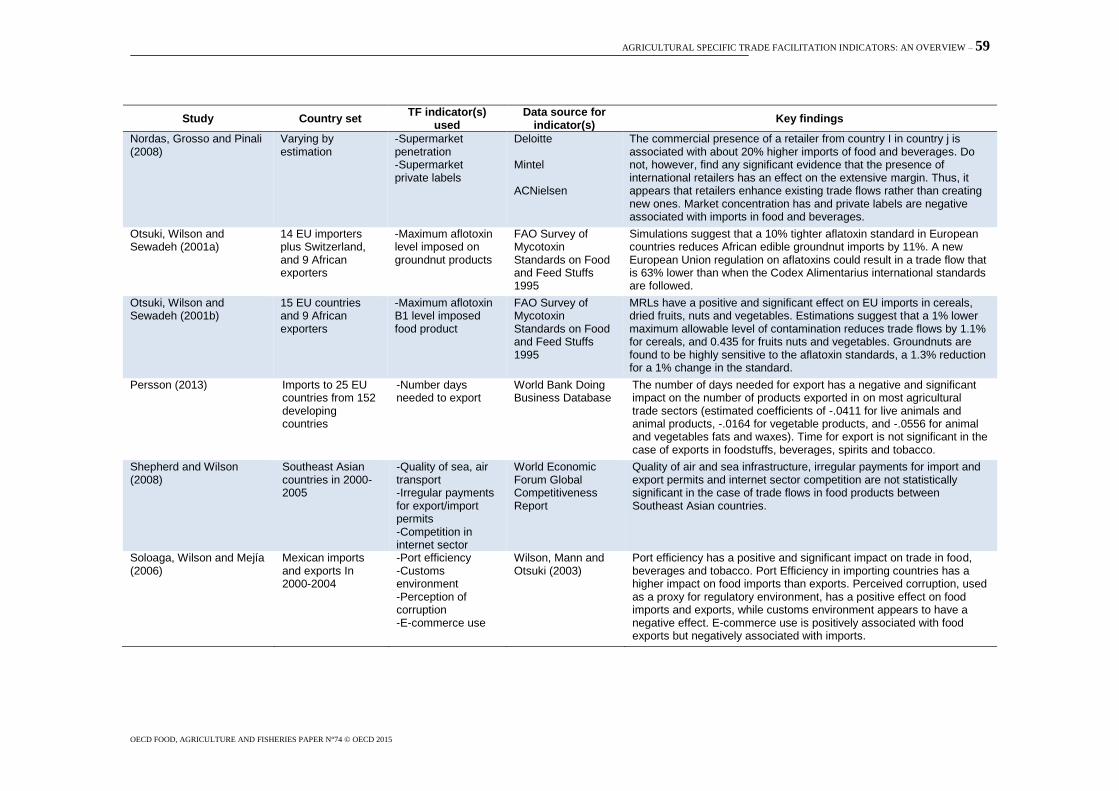
AGRICULTURAL SPECIFIC TRADE FACILITATION INDICATORS: AN OVERVIEW – 59
OECD FOOD, AGRICULTURE AND FISHERIES PAPER N°74 © OECD 2015
Study Country set TF indicator(s)
used Data source for
indicator(s) Key findings
Nordas, Grosso and Pinali (2008)
Varying by estimation
-Supermarket penetration -Supermarket private labels
Deloitte Mintel ACNielsen
The commercial presence of a retailer from country I in country j is associated with about 20% higher imports of food and beverages. Do not, however, find any significant evidence that the presence of international retailers has an effect on the extensive margin. Thus, it appears that retailers enhance existing trade flows rather than creating new ones. Market concentration has and private labels are negative associated with imports in food and beverages.
Otsuki, Wilson and Sewadeh (2001a)
14 EU importers plus Switzerland, and 9 African exporters
-Maximum aflotoxin level imposed on groundnut products
FAO Survey of Mycotoxin Standards on Food and Feed Stuffs 1995
Simulations suggest that a 10% tighter aflatoxin standard in European countries reduces African edible groundnut imports by 11%. A new European Union regulation on aflatoxins could result in a trade flow that is 63% lower than when the Codex Alimentarius international standards are followed.
Otsuki, Wilson and Sewadeh (2001b)
15 EU countries and 9 African exporters
-Maximum aflotoxin B1 level imposed food product
FAO Survey of Mycotoxin Standards on Food and Feed Stuffs 1995
MRLs have a positive and significant effect on EU imports in cereals, dried fruits, nuts and vegetables. Estimations suggest that a 1% lower maximum allowable level of contamination reduces trade flows by 1.1% for cereals, and 0.435 for fruits nuts and vegetables. Groundnuts are found to be highly sensitive to the aflatoxin standards, a 1.3% reduction for a 1% change in the standard.
Persson (2013) Imports to 25 EU countries from 152 developing countries
-Number days needed to export
World Bank Doing Business Database
The number of days needed for export has a negative and significant impact on the number of products exported in on most agricultural trade sectors (estimated coefficients of -.0411 for live animals and animal products, -.0164 for vegetable products, and -.0556 for animal and vegetables fats and waxes). Time for export is not significant in the case of exports in foodstuffs, beverages, spirits and tobacco.
Shepherd and Wilson (2008)
Southeast Asian countries in 2000-2005
-Quality of sea, air transport -Irregular payments for export/import permits -Competition in internet sector
World Economic Forum Global Competitiveness Report
Quality of air and sea infrastructure, irregular payments for import and export permits and internet sector competition are not statistically significant in the case of trade flows in food products between Southeast Asian countries.
Soloaga, Wilson and Mejía (2006)
Mexican imports and exports In 2000-2004
-Port efficiency -Customs environment -Perception of corruption -E-commerce use
Wilson, Mann and Otsuki (2003)
Port efficiency has a positive and significant impact on trade in food, beverages and tobacco. Port Efficiency in importing countries has a higher impact on food imports than exports. Perceived corruption, used as a proxy for regulatory environment, has a positive effect on food imports and exports, while customs environment appears to have a negative effect. E-commerce use is positively associated with food exports but negatively associated with imports.
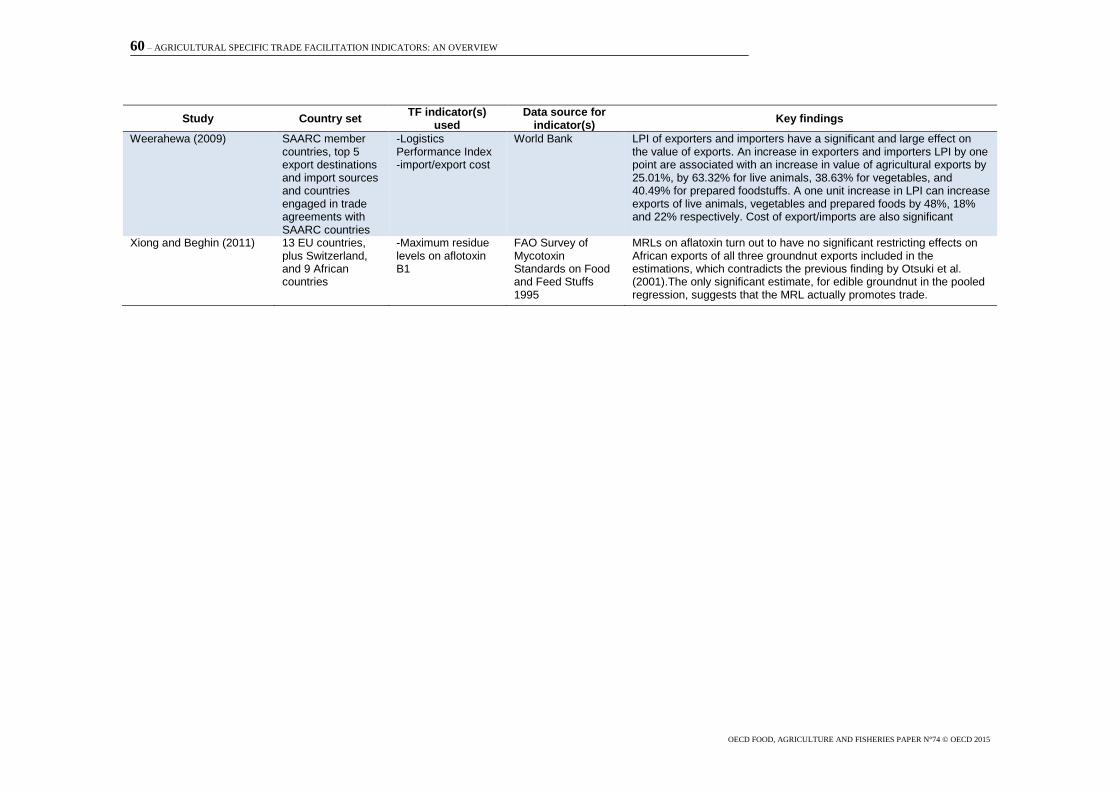
60 – AGRICULTURAL SPECIFIC TRADE FACILITATION INDICATORS: AN OVERVIEW
OECD FOOD, AGRICULTURE AND FISHERIES PAPER N°74 © OECD 2015
Study Country set TF indicator(s)
used Data source for
indicator(s) Key findings
Weerahewa (2009) SAARC member countries, top 5 export destinations and import sources and countries engaged in trade agreements with SAARC countries
-Logistics Performance Index -import/export cost
World Bank LPI of exporters and importers have a significant and large effect on the value of exports. An increase in exporters and importers LPI by one point are associated with an increase in value of agricultural exports by 25.01%, by 63.32% for live animals, 38.63% for vegetables, and 40.49% for prepared foodstuffs. A one unit increase in LPI can increase exports of live animals, vegetables and prepared foods by 48%, 18% and 22% respectively. Cost of export/imports are also significant
Xiong and Beghin (2011) 13 EU countries, plus Switzerland, and 9 African countries
-Maximum residue levels on aflotoxin B1
FAO Survey of Mycotoxin Standards on Food and Feed Stuffs 1995
MRLs on aflatoxin turn out to have no significant restricting effects on African exports of all three groundnut exports included in the estimations, which contradicts the previous finding by Otsuki et al. (2001).The only significant estimate, for edible groundnut in the pooled regression, suggests that the MRL actually promotes trade.
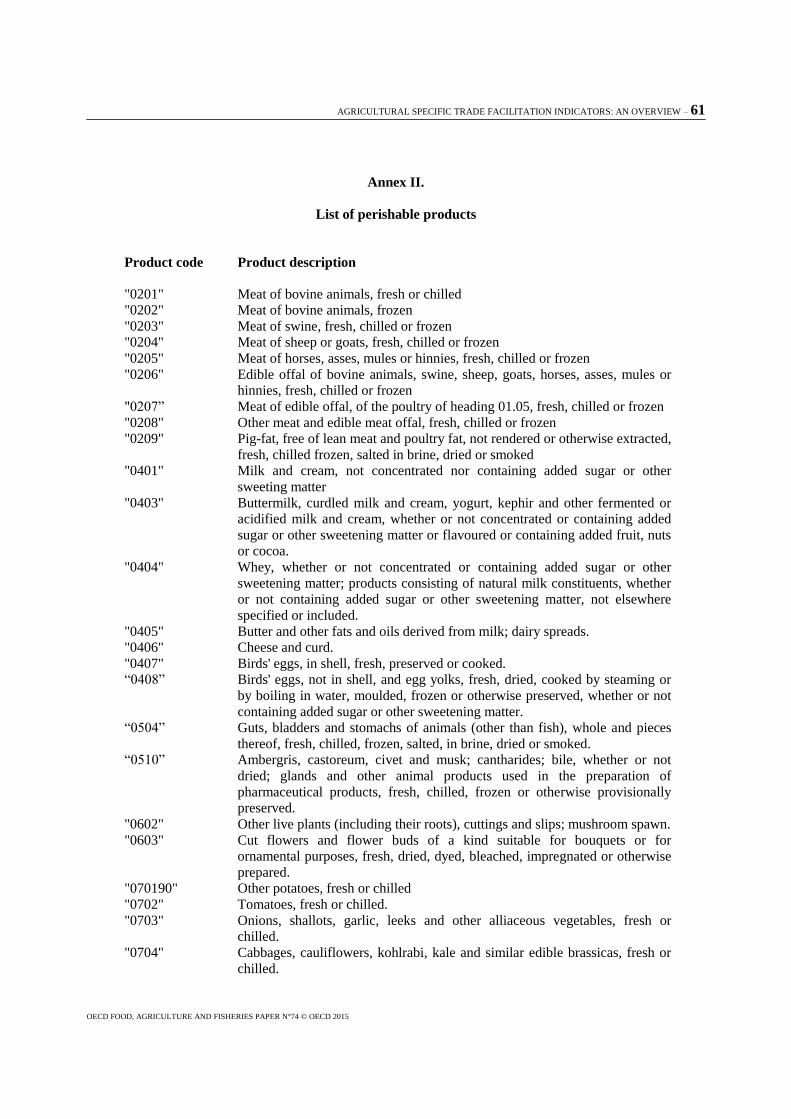
AGRICULTURAL SPECIFIC TRADE FACILITATION INDICATORS: AN OVERVIEW – 61
OECD FOOD, AGRICULTURE AND FISHERIES PAPER N°74 © OECD 2015
Annex II.
List of perishable products
Product code Product description
"0201" Meat of bovine animals, fresh or chilled
"0202" Meat of bovine animals, frozen
"0203" Meat of swine, fresh, chilled or frozen
"0204" Meat of sheep or goats, fresh, chilled or frozen
"0205" Meat of horses, asses, mules or hinnies, fresh, chilled or frozen
"0206" Edible offal of bovine animals, swine, sheep, goats, horses, asses, mules or
hinnies, fresh, chilled or frozen
"0207” Meat of edible offal, of the poultry of heading 01.05, fresh, chilled or frozen
"0208" Other meat and edible meat offal, fresh, chilled or frozen
"0209" Pig-fat, free of lean meat and poultry fat, not rendered or otherwise extracted,
fresh, chilled frozen, salted in brine, dried or smoked
"0401" Milk and cream, not concentrated nor containing added sugar or other
sweeting matter
"0403" Buttermilk, curdled milk and cream, yogurt, kephir and other fermented or
acidified milk and cream, whether or not concentrated or containing added
sugar or other sweetening matter or flavoured or containing added fruit, nuts
or cocoa.
"0404" Whey, whether or not concentrated or containing added sugar or other
sweetening matter; products consisting of natural milk constituents, whether
or not containing added sugar or other sweetening matter, not elsewhere
specified or included.
"0405" Butter and other fats and oils derived from milk; dairy spreads.
"0406" Cheese and curd.
"0407" Birds' eggs, in shell, fresh, preserved or cooked.
“0408” Birds' eggs, not in shell, and egg yolks, fresh, dried, cooked by steaming or
by boiling in water, moulded, frozen or otherwise preserved, whether or not
containing added sugar or other sweetening matter.
“0504” Guts, bladders and stomachs of animals (other than fish), whole and pieces
thereof, fresh, chilled, frozen, salted, in brine, dried or smoked.
“0510” Ambergris, castoreum, civet and musk; cantharides; bile, whether or not
dried; glands and other animal products used in the preparation of
pharmaceutical products, fresh, chilled, frozen or otherwise provisionally
preserved.
"0602" Other live plants (including their roots), cuttings and slips; mushroom spawn.
"0603" Cut flowers and flower buds of a kind suitable for bouquets or for
ornamental purposes, fresh, dried, dyed, bleached, impregnated or otherwise
prepared.
"070190" Other potatoes, fresh or chilled
"0702" Tomatoes, fresh or chilled.
"0703" Onions, shallots, garlic, leeks and other alliaceous vegetables, fresh or
chilled.
"0704" Cabbages, cauliflowers, kohlrabi, kale and similar edible brassicas, fresh or
chilled.
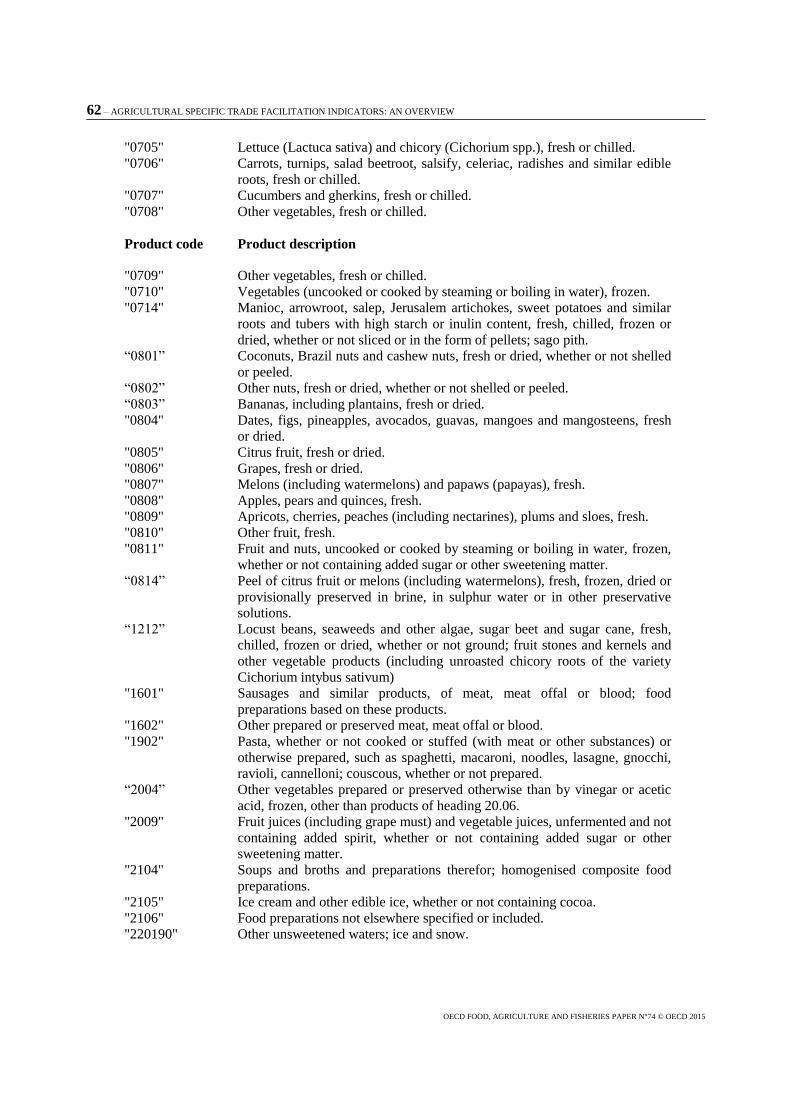
62 – AGRICULTURAL SPECIFIC TRADE FACILITATION INDICATORS: AN OVERVIEW
OECD FOOD, AGRICULTURE AND FISHERIES PAPER N°74 © OECD 2015
"0705" Lettuce (Lactuca sativa) and chicory (Cichorium spp.), fresh or chilled.
"0706" Carrots, turnips, salad beetroot, salsify, celeriac, radishes and similar edible
roots, fresh or chilled.
"0707" Cucumbers and gherkins, fresh or chilled.
"0708" Other vegetables, fresh or chilled.
Product code Product description
"0709" Other vegetables, fresh or chilled.
"0710" Vegetables (uncooked or cooked by steaming or boiling in water), frozen.
"0714" Manioc, arrowroot, salep, Jerusalem artichokes, sweet potatoes and similar
roots and tubers with high starch or inulin content, fresh, chilled, frozen or
dried, whether or not sliced or in the form of pellets; sago pith.
“0801” Coconuts, Brazil nuts and cashew nuts, fresh or dried, whether or not shelled
or peeled.
“0802” Other nuts, fresh or dried, whether or not shelled or peeled.
“0803” Bananas, including plantains, fresh or dried.
"0804" Dates, figs, pineapples, avocados, guavas, mangoes and mangosteens, fresh
or dried.
"0805" Citrus fruit, fresh or dried.
"0806" Grapes, fresh or dried.
"0807" Melons (including watermelons) and papaws (papayas), fresh.
"0808" Apples, pears and quinces, fresh.
"0809" Apricots, cherries, peaches (including nectarines), plums and sloes, fresh.
"0810" Other fruit, fresh.
"0811" Fruit and nuts, uncooked or cooked by steaming or boiling in water, frozen,
whether or not containing added sugar or other sweetening matter.
“0814” Peel of citrus fruit or melons (including watermelons), fresh, frozen, dried or
provisionally preserved in brine, in sulphur water or in other preservative
solutions.
“1212” Locust beans, seaweeds and other algae, sugar beet and sugar cane, fresh,
chilled, frozen or dried, whether or not ground; fruit stones and kernels and
other vegetable products (including unroasted chicory roots of the variety
Cichorium intybus sativum)
"1601" Sausages and similar products, of meat, meat offal or blood; food
preparations based on these products.
"1602" Other prepared or preserved meat, meat offal or blood.
"1902" Pasta, whether or not cooked or stuffed (with meat or other substances) or
otherwise prepared, such as spaghetti, macaroni, noodles, lasagne, gnocchi,
ravioli, cannelloni; couscous, whether or not prepared.
“2004” Other vegetables prepared or preserved otherwise than by vinegar or acetic
acid, frozen, other than products of heading 20.06.
"2009" Fruit juices (including grape must) and vegetable juices, unfermented and not
containing added spirit, whether or not containing added sugar or other
sweetening matter.
"2104" Soups and broths and preparations therefor; homogenised composite food
preparations.
"2105" Ice cream and other edible ice, whether or not containing cocoa.
"2106" Food preparations not elsewhere specified or included.
"220190" Other unsweetened waters; ice and snow.