Embed Size (px)
Citation preview
Facilitating University Success During an Economic and Technological Revolution
Challenges, opportunities, and a few ideas for your consideration
September 5, 2012
Selected slide materials from:
George Mehaffy, AASCU, and
Howard Charney, CISCO systems
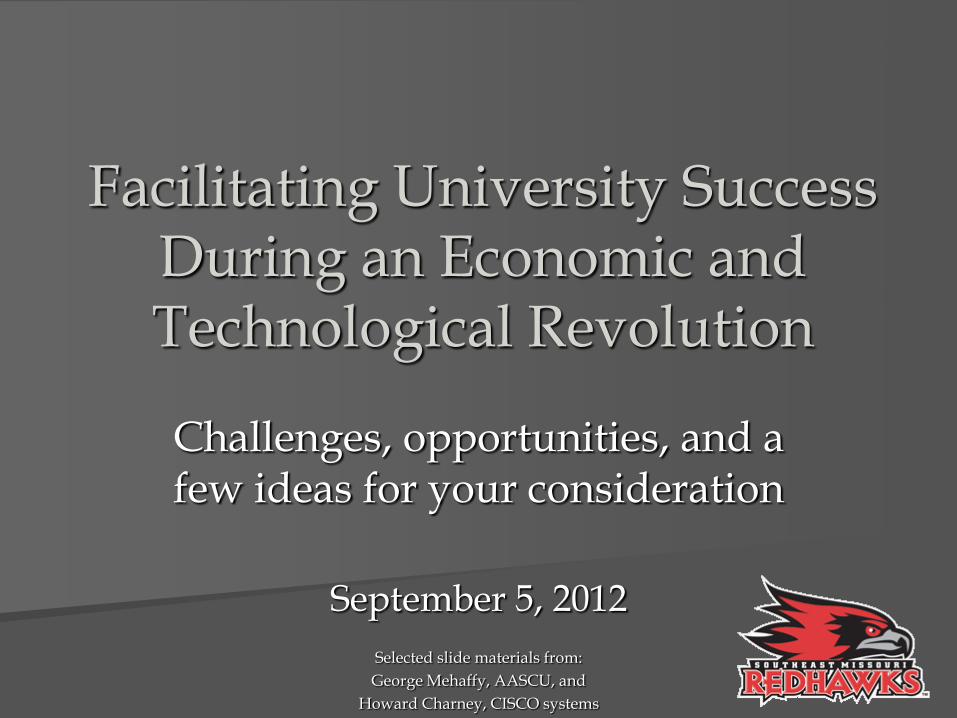
The Rapidly Changing Higher Education Environment
Economics
– State funding decreasing
– Cost per credit hour increasing
– Private sector investment increasing
Technology and the Information Revolution
– Amounts of information
– Methods of information development
– Methods of information dissemination
Accountability and assessment
– Student learning outcomes
– Serve broader segment of society
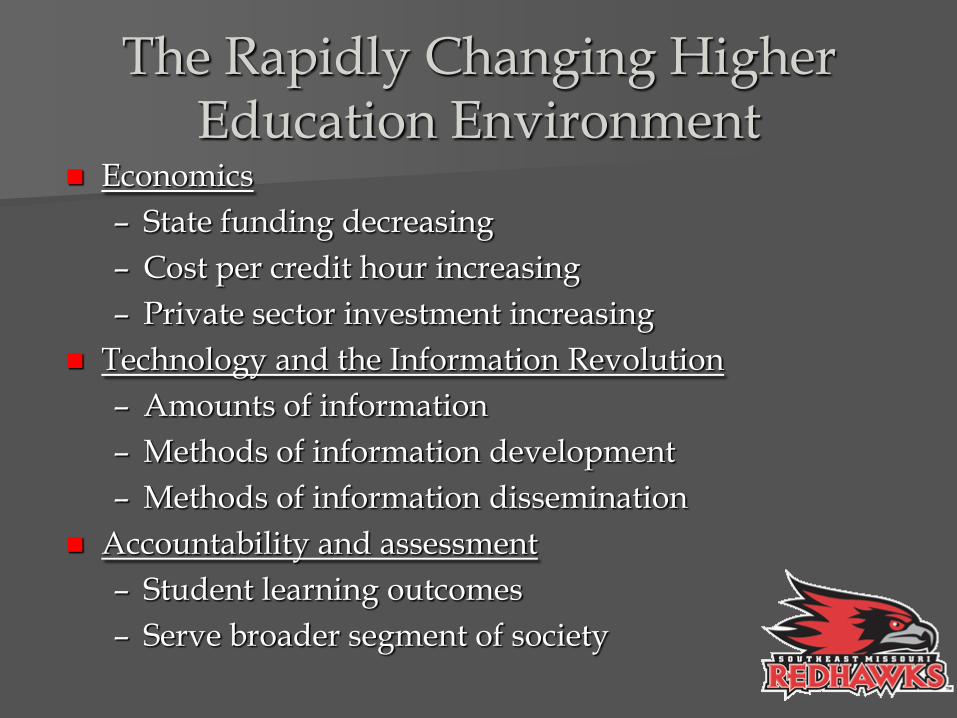
Smaller state appropriations, Nat’l stats
Source: http://www.cbpp.org/cms/?fa=view&id=711
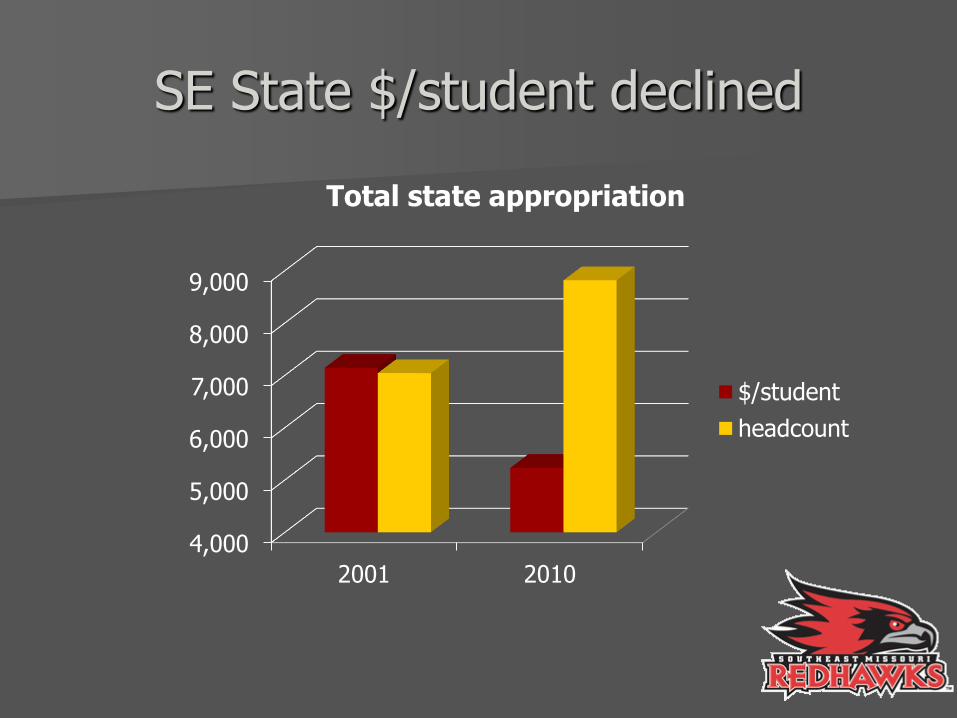
SE State $/student declined
4,000
5,000
6,000
7,000
8,000
9,000
2001 2010
Total state appropriation
$/student
headcount
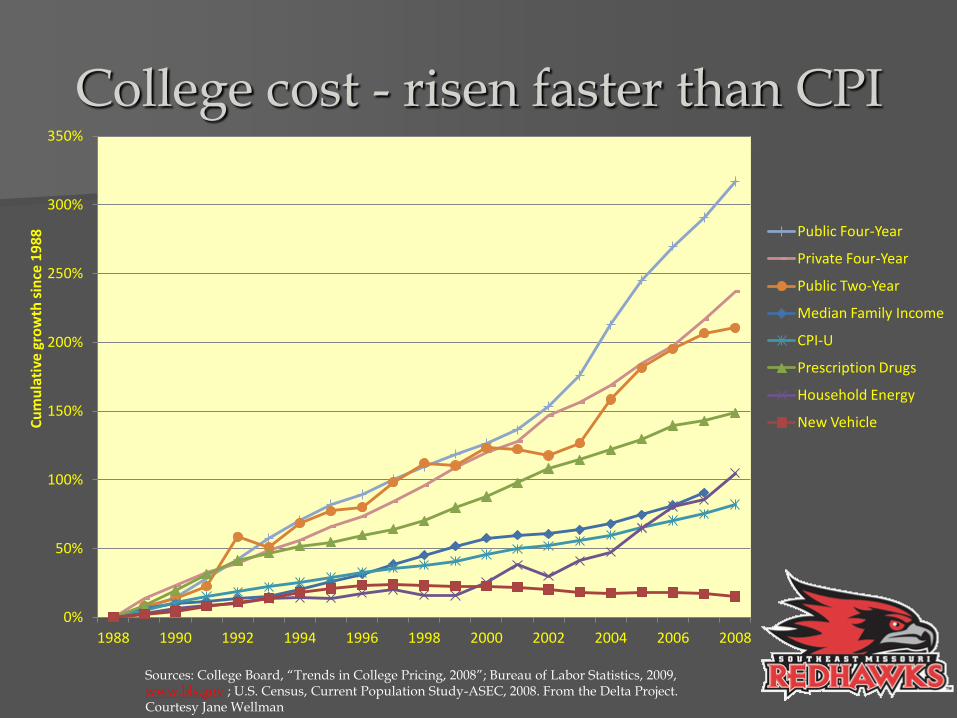
College cost - risen faster than CPI
0%
50%
100%
150%
200%
250%
300%
350%
1988 1990 1992 1994 1996 1998 2000 2002 2004 2006 2008
Cu
mu
lati
ve g
row
th s
ince
19
88
Public Four-Year
Private Four-Year
Public Two-Year
Median Family Income
CPI-U
Prescription Drugs
Household Energy
New Vehicle
Sources: College Board, “Trends in College Pricing, 2008”; Bureau of Labor Statistics, 2009, www.bls.gov ; U.S. Census, Current Population Study-ASEC, 2008. From the Delta Project. Courtesy Jane Wellman
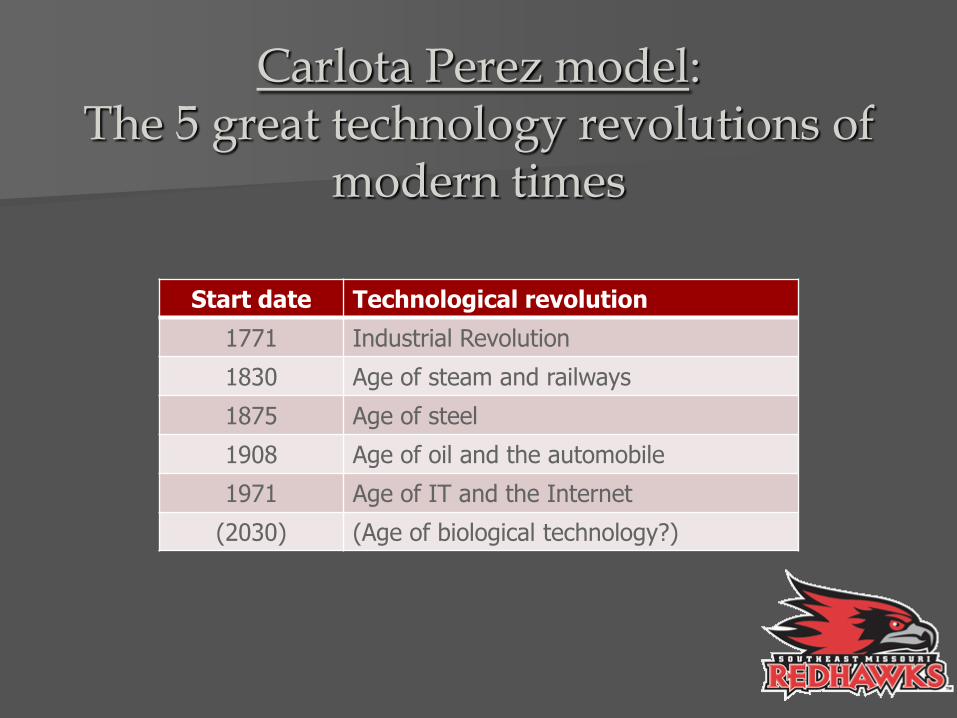
Carlota Perez model: The 5 great technology revolutions of
modern times
Start date Technological revolution
1771 Industrial Revolution
1830 Age of steam and railways
1875 Age of steel
1908 Age of oil and the automobile
1971 Age of IT and the Internet
(2030) (Age of biological technology?)
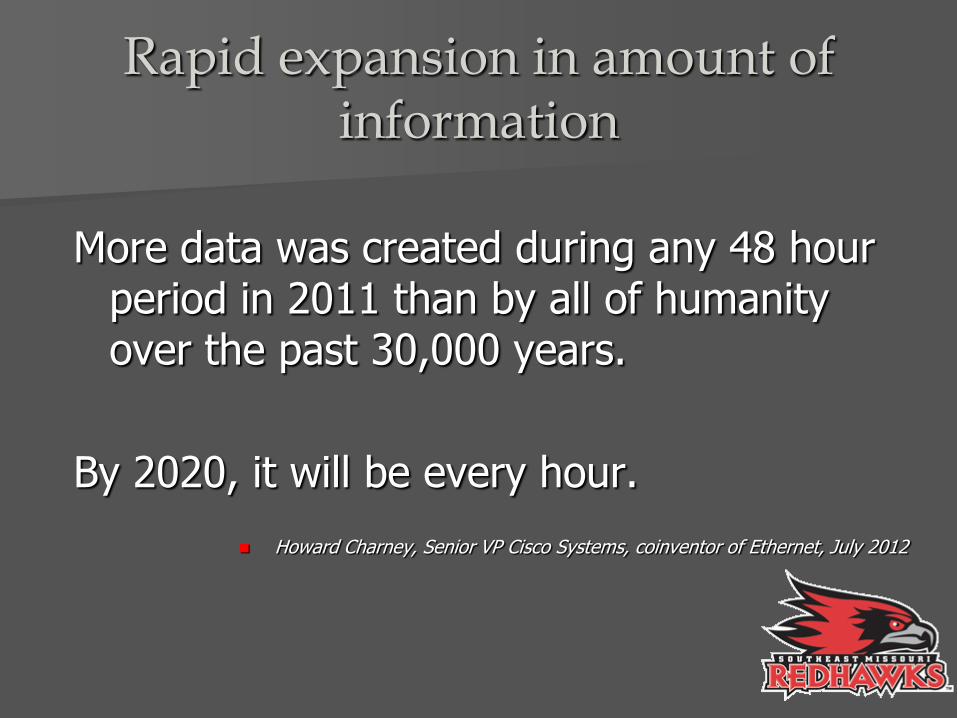
Rapid expansion in amount of information
More data was created during any 48 hour period in 2011 than by all of humanity over the past 30,000 years.
By 2020, it will be every hour.
Howard Charney, Senior VP Cisco Systems, coinventor of Ethernet, July 2012
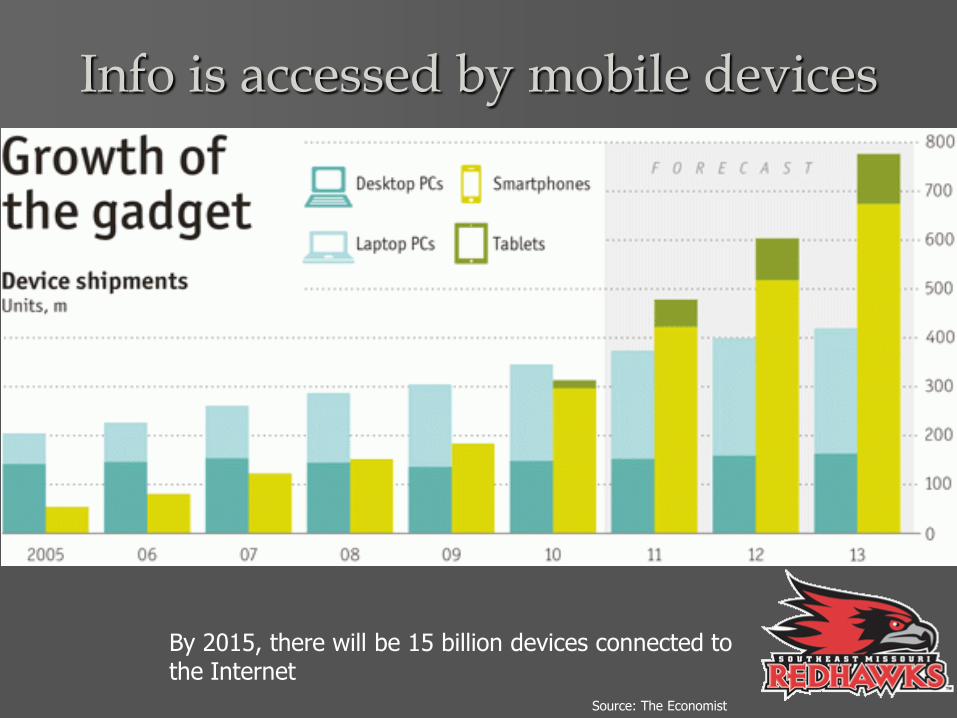
Info is accessed by mobile devices
Source: The Economist
By 2015, there will be 15 billion devices connected to the Internet
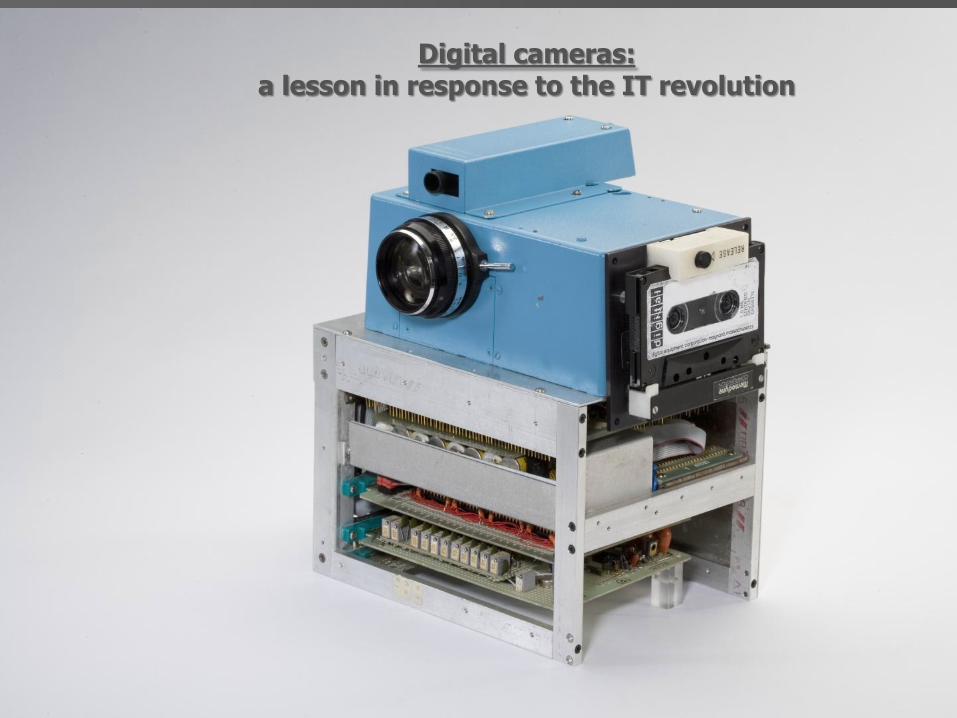
Digital cameras:
a lesson in response to the IT revolution
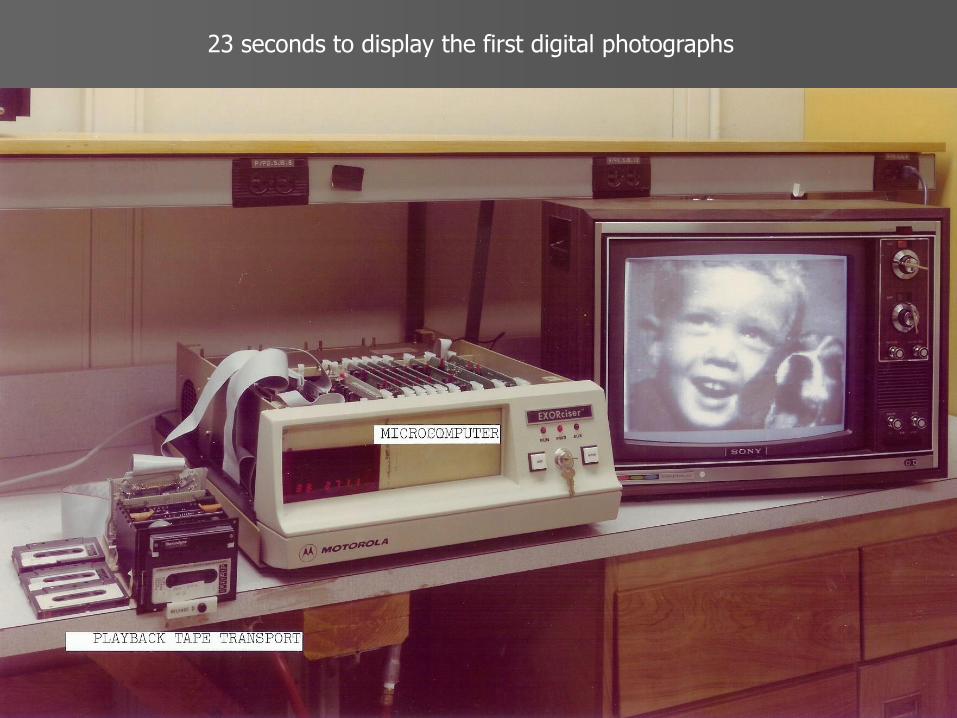
23 seconds to display the first digital photographs
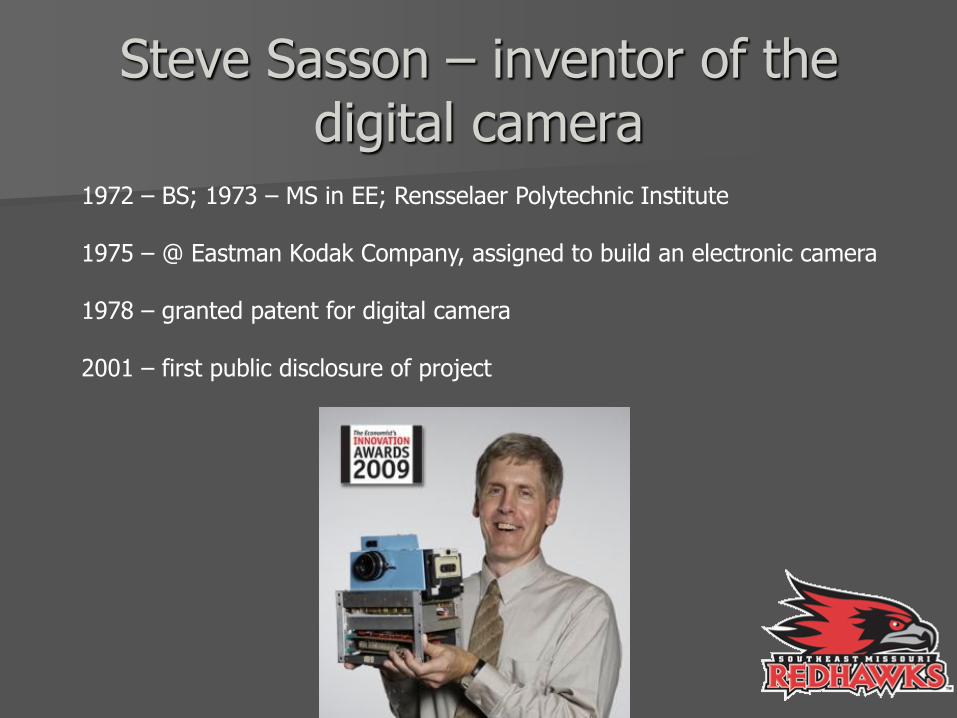
Steve Sasson – inventor of the digital camera
1972 – BS; 1973 – MS in EE; Rensselaer Polytechnic Institute 1975 – @ Eastman Kodak Company, assigned to build an electronic camera 1978 – granted patent for digital camera 2001 – first public disclosure of project
Eastman Kodak company
1975 – developed the digital camera 1976 – 90% market share of photographic film sales in the US 2001 – first public disclosure of digital photography project 2012 – filed Chapter 11 bankruptcy
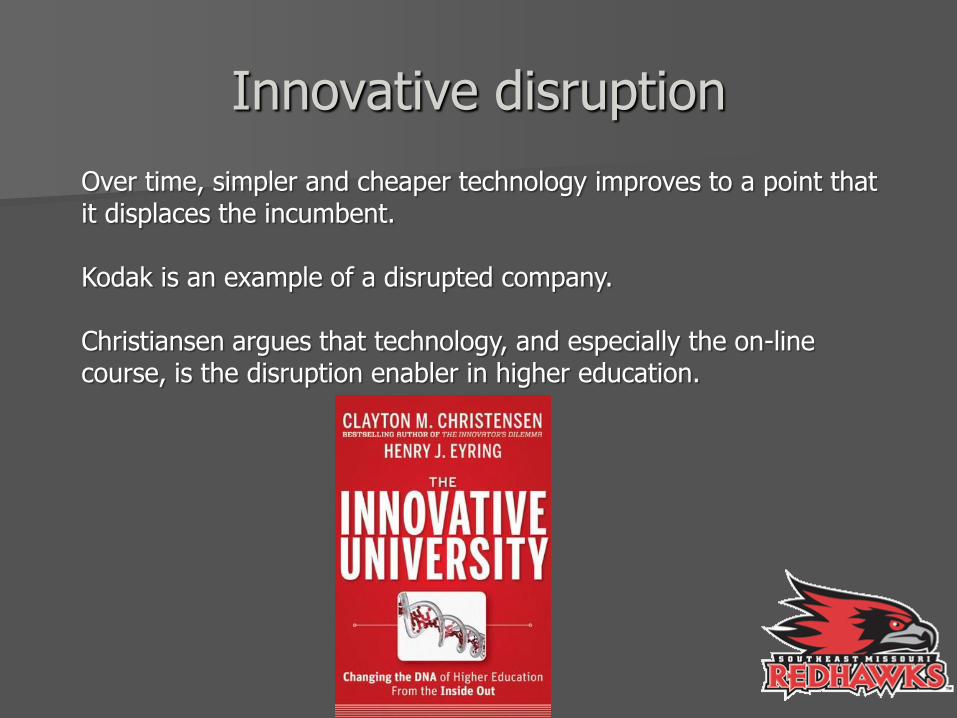
Innovative disruption
Over time, simpler and cheaper technology improves to a point that it displaces the incumbent. Kodak is an example of a disrupted company. Christiansen argues that technology, and especially the on-line course, is the disruption enabler in higher education.
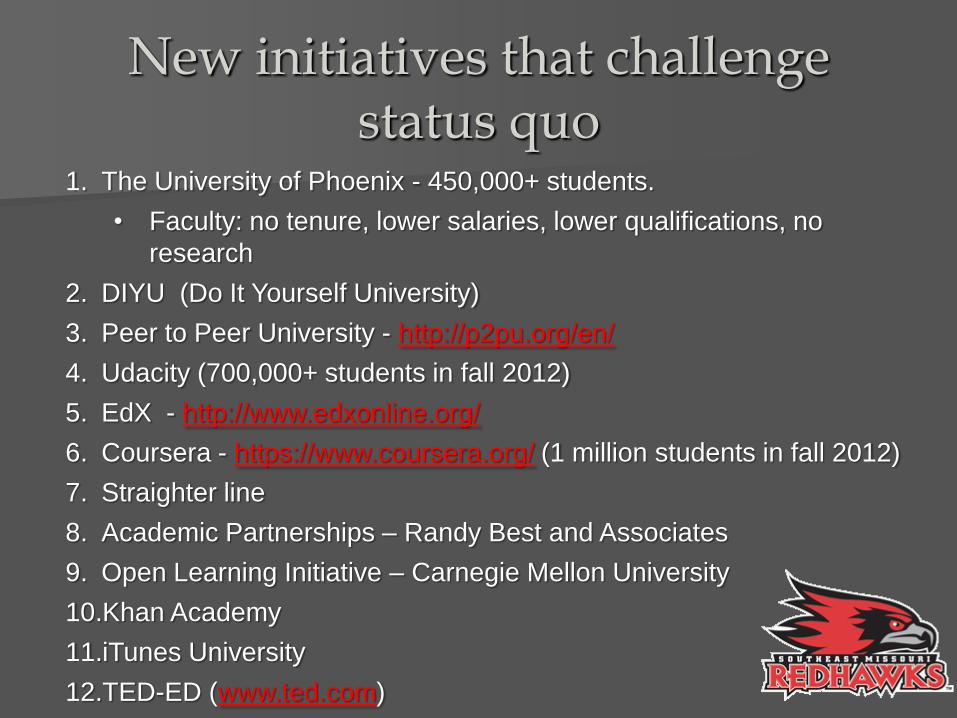
New initiatives that challenge status quo
1. The University of Phoenix - 450,000+ students.
• Faculty: no tenure, lower salaries, lower qualifications, no
research
2. DIYU (Do It Yourself University)
3. Peer to Peer University - http://p2pu.org/en/
4. Udacity (700,000+ students in fall 2012)
5. EdX - http://www.edxonline.org/
6. Coursera - https://www.coursera.org/ (1 million students in fall 2012)
7. Straighter line
8. Academic Partnerships – Randy Best and Associates
9. Open Learning Initiative – Carnegie Mellon University
10.Khan Academy
11.iTunes University
12.TED-ED (www.ted.com)
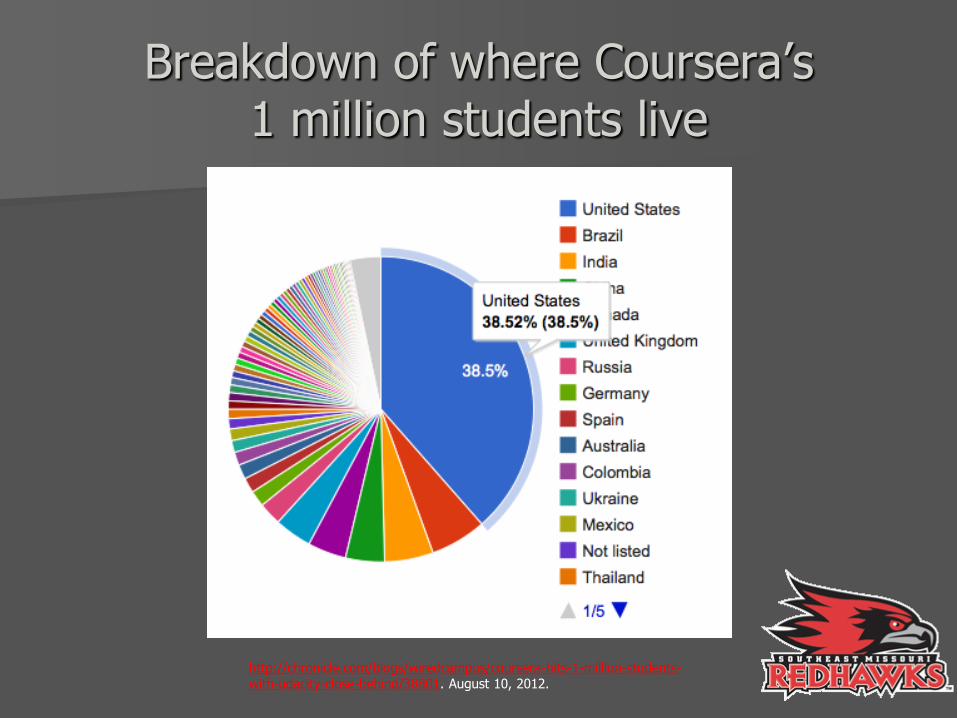
Breakdown of where Coursera’s 1 million students live
http://chronicle.com/blogs/wiredcampus/coursera-hits-1-million-students-with-udacity-close-behind/38801. August 10, 2012.
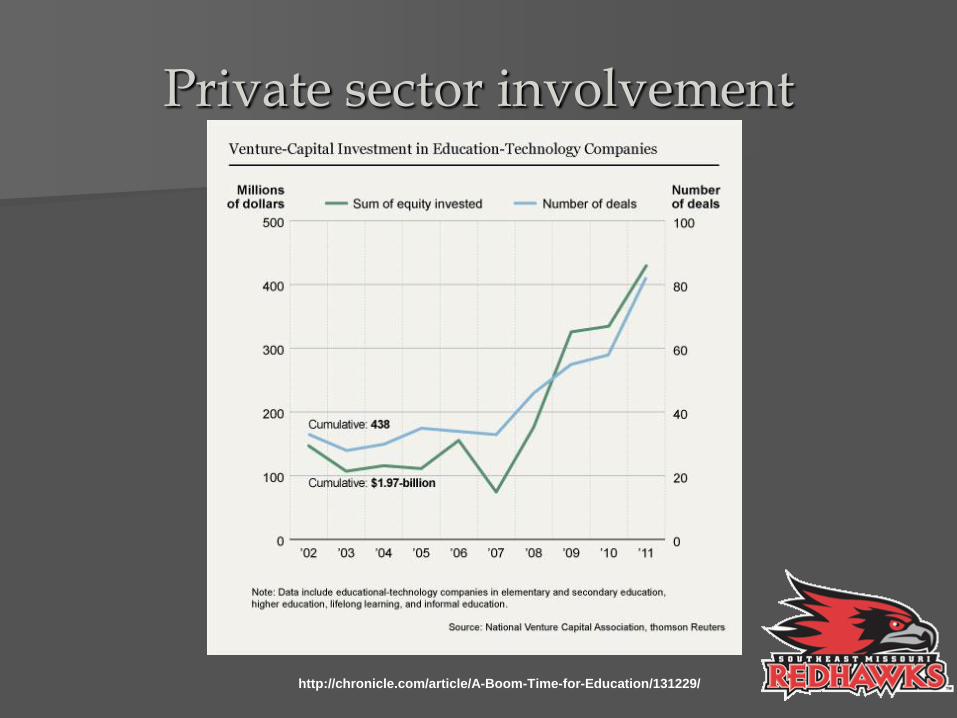
Private sector involvement
http://chronicle.com/article/A-Boom-Time-for-Education/131229/
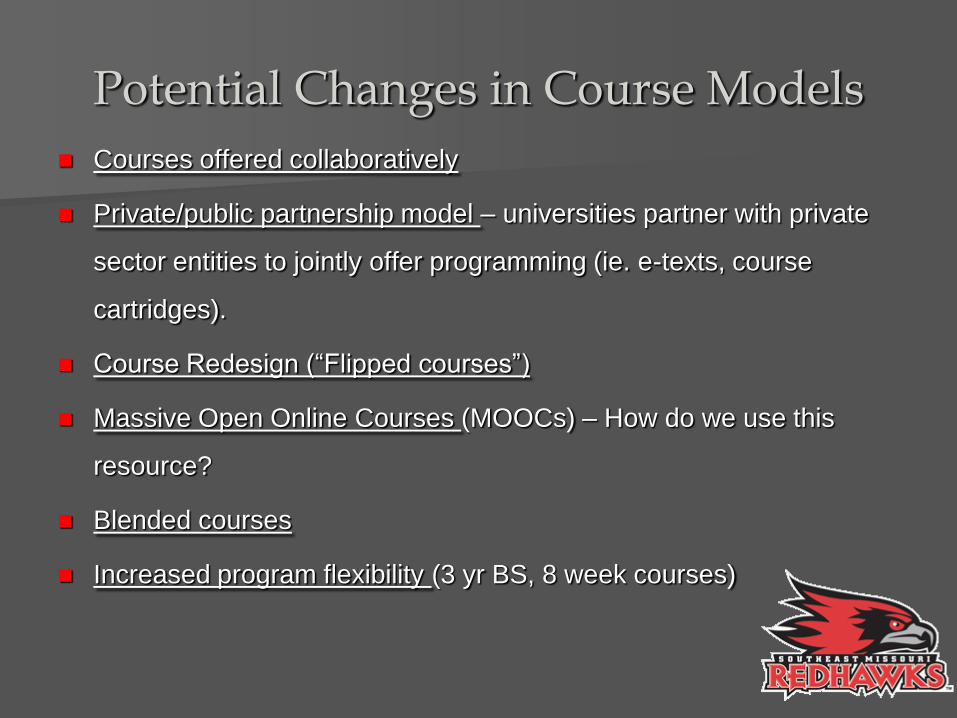
Potential Changes in Course Models
Courses offered collaboratively
Private/public partnership model – universities partner with private
sector entities to jointly offer programming (ie. e-texts, course
cartridges).
Course Redesign (“Flipped courses”)
Massive Open Online Courses (MOOCs) – How do we use this
resource?
Blended courses
Increased program flexibility (3 yr BS, 8 week courses)
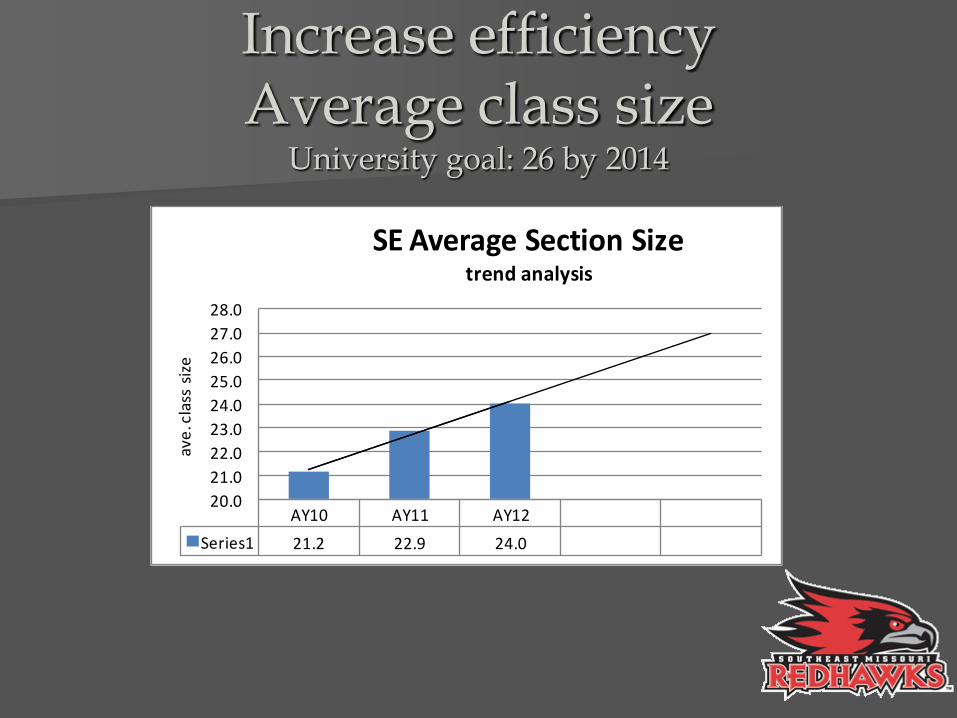
Increase efficiency Average class size
University goal: 26 by 2014
AY10 AY11 AY12
Series1 21.2 22.9 24.0
20.0
21.0
22.0
23.0
24.0
25.0
26.0
27.0
28.0
ave
. cla
ss s
ize
SE Average Section Sizetrend analysis
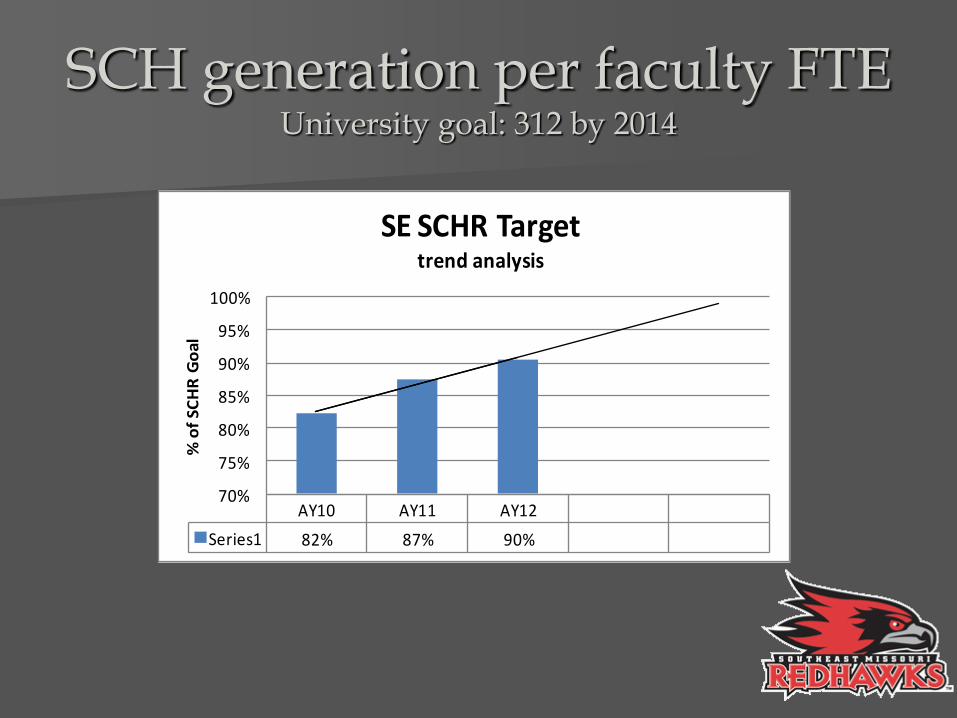
SCH generation per faculty FTE University goal: 312 by 2014
AY10 AY11 AY12
Series1 82% 87% 90%
70%
75%
80%
85%
90%
95%
100%
% o
f SC
HR
Go
al
SE SCHR Targettrend analysis
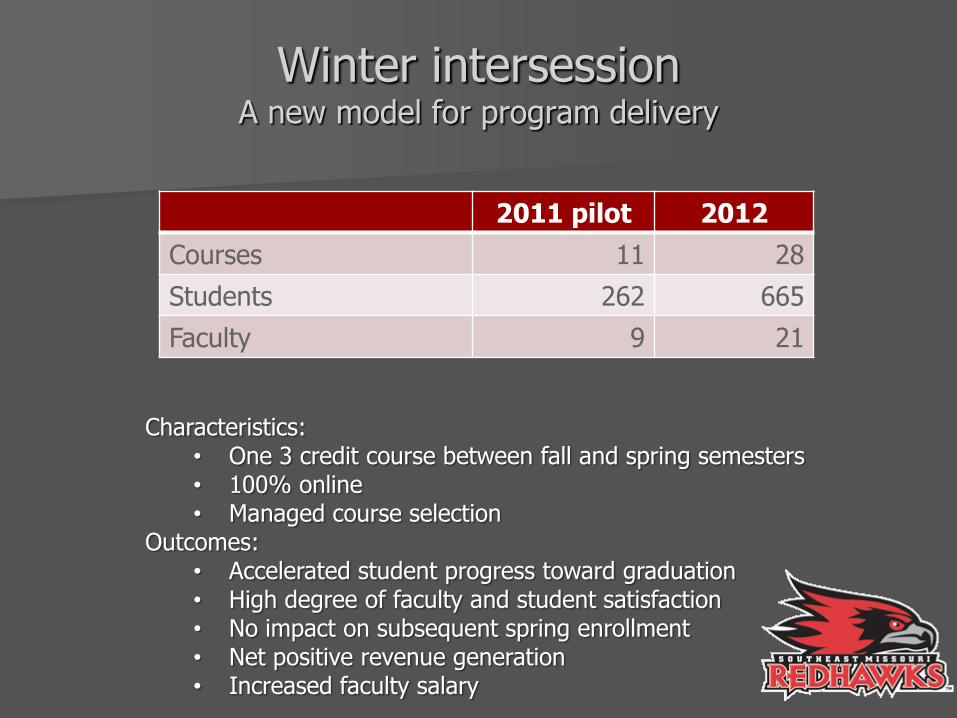
Winter intersession A new model for program delivery
2011 pilot 2012
Courses 11 28
Students 262 665
Faculty 9 21
Characteristics: • One 3 credit course between fall and spring semesters • 100% online • Managed course selection
Outcomes: • Accelerated student progress toward graduation • High degree of faculty and student satisfaction • No impact on subsequent spring enrollment • Net positive revenue generation • Increased faculty salary
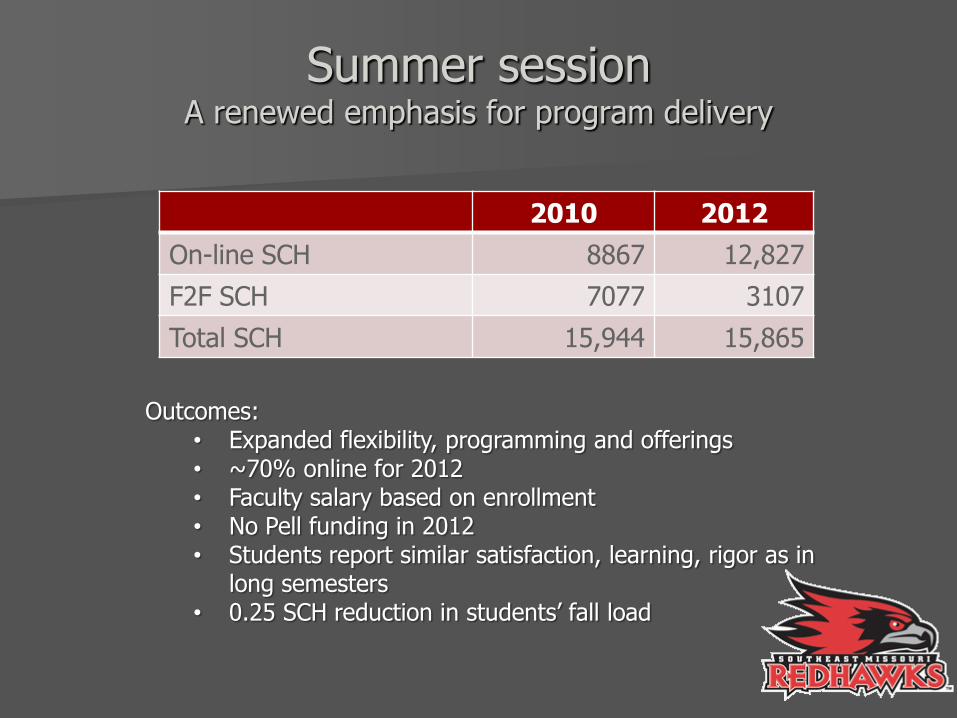
Summer session A renewed emphasis for program delivery
2010 2012
On-line SCH 8867 12,827
F2F SCH 7077 3107
Total SCH 15,944 15,865
Outcomes: • Expanded flexibility, programming and offerings • ~70% online for 2012 • Faculty salary based on enrollment • No Pell funding in 2012 • Students report similar satisfaction, learning, rigor as in
long semesters • 0.25 SCH reduction in students’ fall load
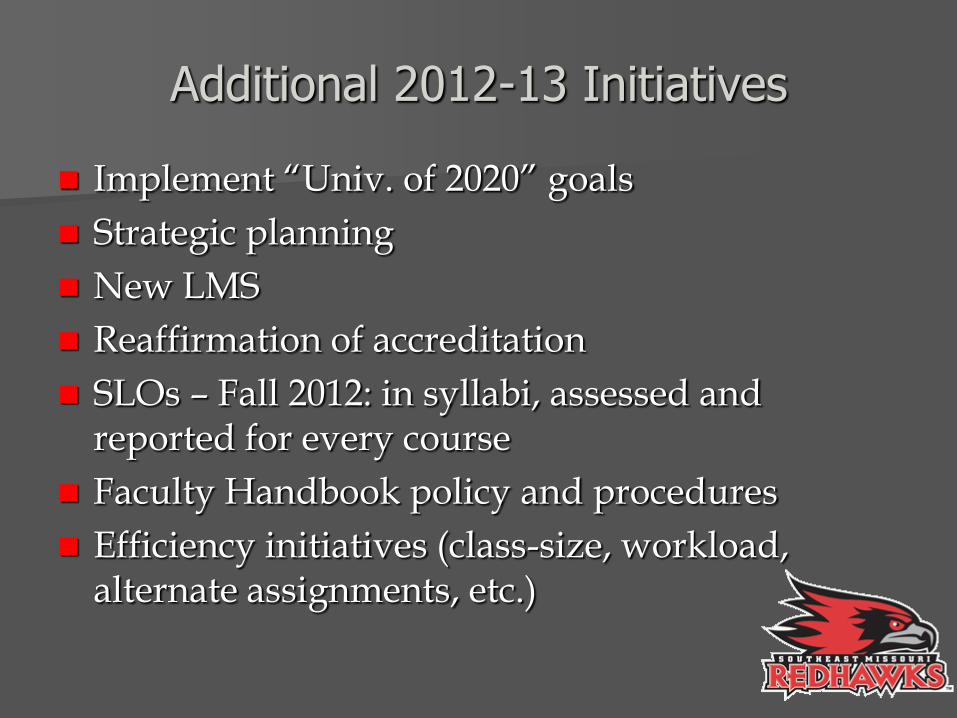
Additional 2012-13 Initiatives
Implement “Univ. of 2020” goals
Strategic planning
New LMS
Reaffirmation of accreditation
SLOs – Fall 2012: in syllabi, assessed and reported for every course
Faculty Handbook policy and procedures
Efficiency initiatives (class-size, workload, alternate assignments, etc.)
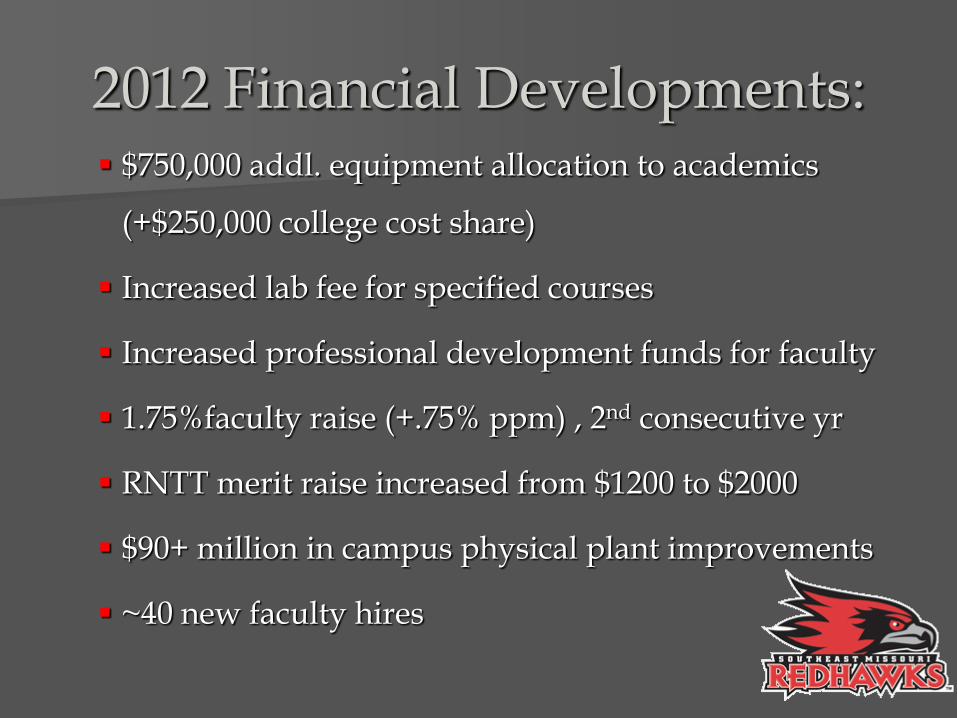
2012 Financial Developments: $750,000 addl. equipment allocation to academics
(+$250,000 college cost share)
Increased lab fee for specified courses
Increased professional development funds for faculty
1.75%faculty raise (+.75% ppm) , 2nd consecutive yr
RNTT merit raise increased from $1200 to $2000
$90+ million in campus physical plant improvements
~40 new faculty hires
Summary: We are in a time of exciting, revolutionary change
in higher education.
Southeast is proactively engaged in these changes.
Faculty Senate is playing a key leadership role
keeping the University effective and responsive.
Thank you for your hard work, creativity, ideas,
energy!