Embed Size (px)
Citation preview
University of South FloridaScholar Commons
Graduate Theses and Dissertations Graduate School
January 2013
Fabricating and Characterizing Physical Propertiesof Electrospun Polypeptide-based NanofibersDhan Bahadur KhadkaUniversity of South Florida, [email protected]
Follow this and additional works at: http://scholarcommons.usf.edu/etd
Part of the Biomedical Engineering and Bioengineering Commons, Biophysics Commons, andthe Materials Science and Engineering Commons
This Dissertation is brought to you for free and open access by the Graduate School at Scholar Commons. It has been accepted for inclusion inGraduate Theses and Dissertations by an authorized administrator of Scholar Commons. For more information, please [email protected].
Scholar Commons CitationKhadka, Dhan Bahadur, "Fabricating and Characterizing Physical Properties of Electrospun Polypeptide-based Nanofibers" (2013).Graduate Theses and Dissertations.http://scholarcommons.usf.edu/etd/4707

Fabricating and Characterizing Physical Properties of Electrospun Polypeptide-based
Nanofibers
by
Dhan Bahadur Khadka
A dissertation submitted in partial fulfillment
of the requirements for the degree of
Doctor of Philosophy
Department of Physics
College of Arts and Sciences
University of South Florida
Major Professor: Donald T. Haynie, Ph.D.
Martin Muschol, Ph.D.
Garrett Matthews, Ph.D.
Kirpal Bisht, Ph.D.
Piyush Koria, Ph.D.
Date of Approval:
July 1, 2013
Keywords: biomaterials, aqueous feedstocks, crosslinking, self-organization, stability
Copyright © 2013, Dhan Bahadur Khadka

Dedication
To my family.
Acknowledgment
I would like to extend my sincere gratitude to my advisor, Prof. Donald T.
Haynie, for his trust, mentorship, time, encouragement and support throughout the course
of this research. I am grateful for his care about my work as a scientist but also his
interest and encouragement in my endeavors outside of the lab.
I would also like to thank Dr. Martin Muschol, Dr. Garrett Matthews, Dr. Kirpal
Bisht and Dr. Piyush Koria for serving on my committee and advising my research. Your
inputs have been crucial. I am grateful to the University of South Florida, Physics
Department for all their support and encouragement as well as providing a great working
environment.
I would also like to thank all of the members in Dr. Haynie's lab. Especially, I
would like to thank Michael Cross who helped a lot of the ways in for my research work
and helpful discussion.
Finally, I would like to thank to my amazing wife Sushma, for her dedication to
my time and inspiration for continued study, my lovely son and daughter Sushant and
Sambidha, my parents and parents in law, brothers and brothers in law for their priceless
support and love. I love all of you with all of my heart. I also thank peoples who directly
or indirectly contributed in my education carrier, country where I born, country where I
got opportunity to get education and mighty God for many blessings.

i
TABLE OF CONTENTS
LIST OF TABLES……………………………………………………………………….. v
LIST OF FIGURES……………………………………………………………………... vi
ABSTRACT…………………………………………………………………………….. vii
CHAPTER 1: INTRODUCTION………………………………………………………… 1
1.1 Polymer-based materials………………………………………………………….. 1
1.2 Polypeptide…………………..…………………………………………………… 2
1.3 Electrospinning…………………………………………………………………… 5
1.4 Proteins and polypeptides in electrospinning……………………………………. 7
1.5 Characterizing physical properties of electrospun fibers…………………........... 10
1.6 Thesis motivation …………….……………………………………………….… 12
1.7 Thesis objective…………………………………………………………………. 13
1.8 References……….……………………………………………………………… 14
CHAPTER 2: GENERAL METHODS……………………………………………….… 17
2.1 Fiber electrospinning …………………………………………………………… 17
2.2 Fibers crosslinking……………………………………………………………… .18
2.3 UV spectroscopy………………………………………………………………… 19
2.4 Circular dichroism spectroscopy………………………………………………… 19
2.5 Attenuated total reflection-Fourier transforms infrared spectroscopy………….. .19
2.6 Bright-Field and Fluorescence Microscope ………………………………….…. 20
2.7 Scanning electron microscopy…………………………………………………... 20
2.8 Energy-dispersive X-ray spectroscopy………………………………………. ….20
2.9 Atomic force microscopy…………………………………………………………21
2.10 Dynamic light scattering………………………………………………………….21
CHAPTER 3: ELECTROSPINNING OF SYNTHETIC POLY PEPTIDE
POLY(L-ORNITHINE) FROM AQUEOUS SOLUTION……………………..……… 22
3.1 Introduction……………………............................................................................ 22
3.2 Materials and methods……………………………………………………… …...24
3.3 Results ……………………………………………………………………… ...…25
3.4 Discussions………………………………………………………………… ……28
3.5 Conclusion………………………………………………………………… …….32
3.6 References……………………………………………………………………….. 32

ii
CHAPTER 4: ELECTROSPINNING OF SYNTHETIC POLY PEPTIDE
POLY(L-GLU, L-TYR) FROM AQUEOUS SOLUTION………………………………36 37
4.1 Introduction …………………………………………………………………….. 36
4.2 Materials and methods…………………………………………………………... 38
4.3 Results……………………………………………………………………………39
4.4 Discussions……………………………………………………………………… 45
4.5 Conclusion………………………………………………………………………. 52
4.6 References………………………………………………………………………. 53
CHAPTER 5: STRUCTURE, COMPOSITION AND ELECTRICAL PROERTIES
OF POLYPEPTIDE ELECTROSPUN NANOFIBER…………………………………. 57
5.1 Introduction……………………………………………………………………… 57
5.2 Materials and methods…………………………………………………………... 59
5.3 Results…………………………………………………………………………… 61
5.4 Discussions……………………………………………………………………….70
5.5 Conclusion………………………………………………………………………. 80
5.6 References……………………………………………………………………….. 81
CHAPTER 6: MECHANISM OF STABILITY OF FIBERS ELECTOSPUN
FROM PEPTIDES WITH IONIZED SIDE CHAINS……………………………………85
6.1 Introduction………………………………………………………………………85
6.2 Materials and methods…………………………………………………………... 87
6.3 Results…………………………………………………………………………… 92
6.4 Discussions…………………………………………………………………….. 102
6.5 Conclusion……………………………………………………………………... 112
6.6 References……………………………………………………………………… 113
CHAPTER 7: SELF-ORGANIZATION KINETICS IN POLYPEPTIDE
ELECTROSPUN FIBERS…………………………………………………………….. 115
7.1 Introduction…………………………………………………………………… 115
7.2 Materials and methods………………………………………………………… 117
7.3 Results…………………………………………………………………………. 120
7.4 Discussions……………………………………………………………………. 130
7.5 Conclusion……………………………………………………………………... 139
7.6 References……………………………………………………………………… 139
CHAPTER 8: BLENDED FIFBERS OF NOVEL ELASTIN-LIKE POLYPEPTIDES
WITH HIGHLY-IONIZED SYNTHETIC POLYPEPTIDE BY
LECTROSPINNING…………………………………………………………………... 141
8.1 Introduction……………………………………………………………………. 141
8.2 Materials and methods…………………………………………………………. 144
8.3 Results and discussions…………………………………………………………147
8.4 Conclusion……………………………………………………………………... 156
8.5 References……………………………………………………………………… 157

iii
CHAPTER 9: CHARACTERIZIN MECHANICAL PROPERTIES OF POLYPEPTIDE
ELECTROSPUN SINGLE FIBERS USING ATOMIC FORCE MICROSCOP………160
9.1 Introduction……………………………………………………………………. 160
9.2 Materials and methods…………………………………………………………. 166
9.3 Results and discussions………………………………………………………… 167
9.4 Conclusion……………………………………………………………………... 173
9.5 References……………………………………………………………………… 173
CHAPTER 10: RESEARCH SUMMARY…………………………………………….. 176
APPENDICES………………………………………………………….…………….. 181
Appendix A: List of accomplishments………………………………………… 181
Appendix B: List of copyright permissions…………………………………… 186
ABOUT THE AUTHOR………………………………………………………… End Page

iv
LIST OF TABLES
Table 4.1 Processing parameters for electrospinning of PLEY………………………… 40
Table 4.2 Result of fiber mat crosslinking and solubility tests…………………………. 42
Table 7.1 Fitting parameters for kinetic modeling at 22 °C…………………………… 123
Table 7.2 PLEY fitting parameters for fiber annealing at 45 °C………………………. 129
Table 8.1 ELPs and blends electrospinning condition…………………………………. 147
Table 9.1 Young’s moduli of PLO and PLEY nanofibers……………………………... 172
Table 9.2 Young’s moduli of some other polymeric nanofibers form literatures………172

v
LIST OF FIGURES
Figure 1.1 Four levels of protein structure……………………………………………….. 3
Figure 1.2 Electrospinning scheme and collector geometry……………………………… 7
Figure 1.3 Schematic depiction of the interdisciplinary research………………………… 9
Figure 3.1 Electrospun mats of fibrous polypeptides…………………………………… 26
Figure 3.2 Variation of fibers diameters with PLO concentration……………………… 27
Figure 3.3 Insolubility of fibrous PLO mats upon cross-linking………………………... 28
Figure 4.1 SEM micrographs of PLEY fibers electrospun at 55% (w/v)………………. 40
Figure 4.2 PLEY fiber diameters as a function of polymer concentration……………… 41
Figure 4.3 Solubility of PLEY fiber…………………………………………………….. 42
Figure 4.4 Fluorescence micrographs of crosslinked PLEY fibers……………………... 43
Figure 4.5 In-situ FTIR spectra of an as-cast film and electrospun fibers………………. 44
Figure 4.6 Cosslinked electrospun PLEY fibers proteolysis digestion…………………. 45
Figure 5.1 Far-UV CD spectra of PLO and PLEY in water…………………………….. 62
Figure 5.2 PLEY Fiber mat morphology………………………………………………... 64
Figure 5.3 FTIR analysis of films and fibers of PLO and PLEY………………………...65
Figure 5.4 EDX analysis of PLO and PLEY fibers……………………………………... 66
Figure 5.5 Protein adsorption on PLEY fibers and glass………………………………... 69
Figure 6.1 PLEY structure, side chains and backbone………………………………….. 88
Figure 6.2 PLEY crosslinking scheme………………………………………………….. 89

vi
Figure 6.3 PLEY UV absorbance and fluorescence emission………………………… 93
Figure 6.4 PLEY fibers crosslinking estimation………………………………………… 95
Figure 6.5 PLEY fibers composition analysis…………………………………………... 96
Figure 6.6 Crosslinked PLEY fiber stability…………………………………………… 98
Figure 6.7 Time series of PLEY fiber behavior on pH shift…………………………… 99
Figure 6.8 Time series of crosslinked PLEY fiber behavior at pH 12 and fibers……… 100
Figure 6.9 PLEY fiber morphology at different pH…………………………………….101
Figure 6.10 Mechanisms of fiber stability in phosphate buffer at pH 12 and pH 2…….108
Figure 7.1 Annealing spectra for PLEY………………………………………………...121
Figure 7.2 Time series of integrated peak areas of PLO and PLEY…………………… 122
Figure 7.3 Normalized PLO and PLEY amide I spectra………………………………..124
Figure 7.4 Spectral properties of crosslinked PLEY fibers………………………….. 126
Figure 7.5 EDX spectra of PLEY fibers before and after crosslinking………………... 128
Figure 7.6 PLEY fiber morphology after annealing at 45 °C………………………….. 129
Figure 7.7 Kinetic schemes for annealing of PLO or PLEY fibers in water…………... 133
Figure 7.8 Schematic of putative ion coordination in β sheets………………………… 134
Figure 7.9 Resonance frequency trajectories…………………………………………... 137
Figure 8.1 E14 fiber morphology at different polymer feedstock concentrations……... 150
Figure 8.2 PLEY and V40C2/PLEY blend fibers fluorescence micrographs……….…151
Figure 8.3 SEM image of a non-woven fibers electrospun from blend feedstock…...…154
Figure 8.4 Infrared analysis of PLEY, ELPs and blend cast films and fibers……………….. 155
Figure 9.1 Major components of an atomic force microscope (AFM)………………... 161
vii
Figure 9.2 An experimental force curve with schematic labeling……………………... 165
Figure 9.3 Typical experimental force curve produced in PLEY……………………… 167
Figure 9.4 Section analysis of crosslinked PLEY fiber………………………………... 168
Figure 9.5 Deflection vs. piezo position for crosslinked PLEY……………………….. 169
Figure 9.6 The variation of Young’s moduli with PLEY fiber diameters……………... 170
Figure 9.7 The variation of Young’s moduli with PLO fiber diameters………………. 171

viii
ABSTRACT
This dissertation has aimed to fabricate polypeptide based biomaterial and
characterize physical properties. Electrospinning is used as a tool for the sample
fabrication. Project focused on determining the feasibility of electrospinning of certain
synthetic polypeptides and certain elastin-like peptides from aqueous feedstocks and to
characterize physical properties of polymer aqueous solution, cast film and spun fibers
and fiber mats. The research involves peptide design, polymer electrospinning, fibers
crosslinking, determining the extent of crosslinking, fibers protease degradation study,
fibers stability and self-organization analysis, structure and composition determination by
various spectroscopy and microscopy techniques and characterization of mechanical
properties of individual suspended fibers.
Fiber mats of a synthetic cationic polypeptide poly(L-ornithine) (PLO) and an
anionic co-polypeptide of L-glutamic acid and L-tyrosine (PLEY) of defined composition
have been produced by electrospinning. Fibers were obtained from polymer aqueous
solution at concentrations of 20-45% (w/v) in PLO and at concentrations of 20-60%
(w/v) in PLEY. Applied voltage and spinneret-collector distance were also found to
influence polymer spinnability and fibers morphology. Oriented fibers were obtained by
parallel electrodes geometry. Fiber diameter and morphology was analyzed by scanning
electron microscopy (SEM) and atomic force microscopy (AFM).

ix
PLO fibers exposed on glutaraldehyde (GTA) vapor rendered fiber mats water-
insoluble. A common chemical reagent, carbodiimide was used to crosslink PLEY
fibers. Fiber solubility in aqueous solution varied as a function of crosslinking time and
crosslinker concentration. Crosslink density has been quantified by a visible-wavelength
dye-based method. Degradation of crosslinked fibers by different proteases has been
demonstrated.
Investigation of crosslinked PLEY fibers has provided insight into the
mechanisms of stability at different pH values. Variations in fiber morphology,
elemental composition and stability have been studied by microscopy and energy-
dispersive X-ray spectroscopy (EDX), following the treatment of samples at different pH
values in the 2-12 range. Fiber stability has been interpreted with reference to the pH
dependence of the UV absorbance and fluorescence of PLEY chains in solution. The
data show that fiber stability is crucially dependent on the extent of side chain ionization,
even after crosslinking.
Self-organization kinetics of electrospun PLO and PLEY fibers during solvent
annealing has been studied. After being crosslinked in situ, fibers were annealed in water
at 22 °C. Analysis by Fourier transform infrared spectroscopy (FTIR) has revealed that
annealing involved fiber restructuring with an overall time constant of 29 min for PLO
and 63 min for PLEY, and that changes in the distribution of polymer conformations
occurred during the first 13 min of annealing. There was a substantial decrease in the
amount of Na+ bound to PLEY fibers during annealing. Kinetic modeling has indicated
that two parallel pathways better account for the annealing trajectory than a single
pathway with multiple transition states.

x
Bacteria have been engineered to make novel 250-mer elastin-like polypeptides
(ELPs). Each was predicted to have an absolute net charge of less than 0.05 electron
charges per amino acid residue in aqueous solution at neutral pH. Polymer structure in
solution has been assessed by Circular dichroism spectroscopy (CD) and dynamic light
scattering (DLS). Suitability for materials manufacture has been tested by
electrospinning.
Here, we have also tested the hypothesis that blending polypeptides of radically
different amino acid composition will enable the realization of novel and potentially
advantageous material properties. Aqueous polymer feedstock solutions consisted of
pure ELP or ELP blended with a synthetic polypeptide, PLEY, which is highly ionized at
neutral pH and spinnable. Morphology analysis of blended fibers by SEM has revealed
the formation of a surprising variety of structures that are not seen in fibers of ELP or
PLEY alone, for example, hollow beads. Analysis of blended fibers by fluorescence
microscopy showed that there was little or no phase separation, despite the large
difference in electrical properties between ELP and the synthetic polymers.
Structure and composition of PLO, PLEY, ELPs and blends and electrospun
fibers made of these polymers have been determined and compared. CD and FTIR have
been utilized to obtain structural information on these polymers in aqueous solution, cast
films and fibers. Fiber composition has been analyzed by EDX. Protein adsorption has
been analyzed by quantitative fluorescence microscopy. The polymers adopted random
coil-like conformations in aqueous feedstocks at neutral pH and in dehydrated cast films
and fibers on glass, and the fibers comprised numerous counterions, according to spectral
analysis. Adsorption of model proteins and serum proteins onto hydrated and crosslinked
xi
fibers depended on the electrical charge of the proteins and the fibers. The surface charge
density of the fibers will be comparable to, but less than, the charge density on the outer
leaflet of the plasma membrane of usual eukaryotic cells.
Mechanical properties of a series of as-spun and crosslinked PLO and PLEY
nanofibers with various diameters have been analyzed by using the pure bending mode
and AFM technique. Aligned nanofibers were deposited on top of a microsized groove
etched on a glass substrate. AFM tip was used as a probe, which could apply a
measurable deflection and force onto the suspended nanofiber at a force calibration
mode, so that the Young’s modulus of a single nanofiber can be calculated based on the
basic beam bending theories. The Young’s moduli of the studied peptide nanofibers
increased significantly with decreased fiber diameters. This study has also demonstrated
that crosslinked electrospun PLO and PLEY fibers have a higher Young’s modulus
compared with their as-spun counterparts.
Taken together, the results will advance the rational design of polypeptides for
peptide-based materials, especially materials prepared by electrospinning. It is believed
that this research will increase basic knowledge of polymer electrospinning and advance
the development of electrospun materials, especially in medicine and biotechnology. The
study has yielded two advances on previous work in the area: avoidance of an animal
source of peptides and avoidance of inorganic solvent. The present results thus advance
the growing field of peptide-based materials. Non-woven electrospun fiber mats made of
polypeptides are increasingly considered attractive for basic research and technology
development in biotechnology, medicine and other areas.

1
CHAPTER 1
INTRODUCTION
1.1 Polymer-based materials
Materials made of synthetic organic polymers are ubiquitous. Objects in which
polymeric materials are significant constituents range from toys to biomedical devices to
microprocessors to spacecraft. Indeed, it is difficult to imagine the modern world without
them. These polymers, however, are made from precursors that are byproducts of the oil
refinement industry, and the availability of oil is strictly limited.
On other hand organic polymers derived from an animal source also have been
widely used for research and development of humankind. These materials have raised
health concerns in recent years, especially in the wake of the mad cow disease scare in
the United Kingdom. Quality assurance and patient acceptability are key product
concerns for pharmaceutical and biotechnology companies, consumers and government.
Organic polymers, synthetic or natural, or solvent residue, however, may lead to
unwanted side effects in a biomedical context. Another negative is that preparations tend
to vary by the batch.
Given that polymer-based materials have proved useful or desirable to humans for
at least 20,000 years, in the forms of wood, animal fur, wools and silks, it seems likely
that such materials will continue to be in demand long into the future. A need therefore

2
exists to identify and develop alternative polymers for materials. It is hard to imagine
that this need will decrease anytime soon. Moreover, the scale of the need will be global.
It seems all but certain that lucrative future commercial opportunities will arise from the
development of alternative polymers for materials. The production of alternative
polymers will ideally be renewable and sustainable, as will the processing of the
polymers in materials manufacture.
A promising class of alternative polymers for addressing the need is designed
polypeptides. These polymers are already of interest in medicine and biotechnology, and
some investigators study polypeptides for their own sake. It may be possible to avoid
problematic aspects of synthetic organic polymers and animal originated organic
polymers by turning to synthetic polypeptides of defined composition. These
polypeptides can be chemically or bacterially synthesize in commercials scale.
1.2 Polypeptide
Nucleic acids, polysaccharides and polypeptides – the three classes of biological
macromolecule account for a large fraction of the matter of a living organism.
Polypeptides constitute about half the dry mass of cells in living organisms ranging from
bacteria to humans. Polypeptides are linear chains of amino acids, connected by peptide
bonds. The amino acid sequences of polypeptides synthesized on ribosomes in vivo are
encoded in genes. There are 20 common amino acid types in the peptides and proteins
synthesized in living organisms.1
Polypeptides may be divided into several categories by provenance: endogenous
proteins, recombinant polypeptides and synthetic polypeptides. Every protein molecule

3
comprises at least one polypeptide. A common classification scheme for proteins has
three categories: membrane proteins, globular proteins and structural proteins.
The peptide bond is rigid and planar, restricting the degrees of freedom of the
polymer backbone and thereby enabling the formation of secondary structures. Once a
secondary structure is formed, its backbone conformation is stabilized by relatively weak
electrostatic interactions called hydrogen bonds. Homopolypeptides and
heteropolypeptides are readily prepared by solid-phase or solution-phase chemical
synthesis2 or genetic engineering of microorganisms.
3
Protein and polypeptides display different levels of structural organization. The
complex three-dimensional structure of a polypeptide molecule in its native conformation
Figure 1.1 Four levels of protein structure, using hemoglobin as an example. (Adopted
from Kingeley R. Stern, visual resource library ©1997.4

4
is stabilized by many non-covalent interactions. The native conformation is especially
pertinent to biological function. Many polypeptides are enzymes that catalyze
biochemical reactions vital to metabolism. Other polypeptides are important in cell
signaling, immune responses, cell adhesion and the cell cycle. Still other proteins form
fibrous structures that primarily play structural or mechanical roles in the organism.
Examples of cellular proteins that form fibers include actin, myosin, tubulin and other
constituents of the cytoskeleton. Protein fibers may be considered building blocks of
organisms, enabling scaffolding, stabilization, protection, elasticity and motility at length
scales ranging from macromolecular assemblies to whole organisms. Fibrous proteins
are increasingly being used to enhance the performance of synthetic biomaterials.
Increased understanding of how these proteins function in biology has inspired
researchers to utilize them in a wide range of technical applications, including
electrospun biomaterials.5
Much interest has been generated recently in the area of tissue engineering to
create biological alternatives for implants. Biodegradable polymers in the form of highly
porous nanofibrous scaffolds are ideal in accommodating cells and guiding their growth
for tissue regeneration in three dimensions. Polypeptides are the potential polymers for
biomaterials due to superior in biocompatibility, biodegradability, biofunctionality and
non-toxicity. Besides these properties, the structural integrity of the scaffold is important
for tissue regeneration to proceed. Therefore, there is a need to study the key physical
properties along with structural and nanomechanical properties of individual nanofibers
that make up the entire scaffold.

5
1.3 Electrospinning
Nanoscience and nanotechnology have emerged as powerful fields throughout the
past few decades; in part because of the unique physical properties and biological
significance of nanoscale materials.6 Electrospinning is a one of the materials processing
method which is used to fabricate continuous, ultra-fine fibers of nano to microscale
diameter from polymers in solution.7-12
The approach is versatile, inexpensive, scalable
and reliable. Various polymers, additional solutes and solvents are compatible with
successful spinning. The structure, chemical and mechanical stability, functionality, and
other properties of electrospun fibers can be tailored for specific applications. A variety
of physical properties of the spun materials can be controlled by polymer properties and
processing parameters.
The recent explosion of interest in electrospinning has tended to obscure its long
developmental trajectory. In the eighteenth century, a University of Leipzig instructor
named Bose described aerosol generation by applying a high electrical potential to drops
of fluid.13
Much later, aspects of electrospinning were patented in the USA in 1902 by
Cooley and by Morton.14,15
In patents issued 1934-1944, Formhals describes an
electrospinning setup for producing textile yarns.16-20
Nevertheless, academics did not
pay much heed to electrospinning until the mid-1990s, when the Reneker group
published a work entitled “Electrospinning process and applications of electrospun
fibers”.21
Now, over 200 universities and research institutes the world over are studying or
developing electrospinning, and the number of related scientific publications and patents
is skyrocketing. In addition, electrospun materials have been commercialized recently by

6
numerous companies. Further details of the fascinating history of electrospinning are
available in recent reviews.22-24
In this process a high voltage is applied to a droplet of polymer solution at the end
of a metallic needle, or spinneret. When a sufficiently high voltage is applied to a liquid
droplet, surface charge are induced on the surface of polymer droplet, and electrostatic
repulsion among surface charges counteract the surface tension and the droplet is
stretched until a critical point is reached. A stream of liquid then bursts forth from the
droplet surface, forming the Taylor cone (after the Cambridge physicist Sir Geoffrey
Ingram Taylor). If the molecular cohesion of the liquid is sufficiently high, stream
breakup does not occur (if it does, droplets are electrosprayed) and a charged liquid jet is
formed. As the jet dries in flight, the mode of current flow changes from ohmic to
convective as the charge migrates to the surface of the fiber. The jet is then elongated by
a whipping process caused by electrostatic repulsion initiated at small bends in the fiber,
until it is finally deposited on the grounded collector. The elongation and thinning of the
fiber resulting from this bending instability leads to the formation of uniform fibers with
nano to micrometer-scale diameters.25
Synthetic polymers are usually simpler to process
than natural polymers and more likely to yield controlled nanofiber morphology.26
Applications of the electrospun materials are wide-ranging, encompassing
filtration devices, textiles, electrical and optical components, and sensors. Arguably, one
of the most promising application areas for modern electrospinning is biomedical
materials.22-24

7
Polymer solution
Power supply
Electrospun jet
Collector
Syringe
Fiber mat
Metallic needle
Figure 1.2 Electrospinning. Left column, schematic of apparatus. Center column,
common collector geometries. Top, planar. Middle, square frame. Bottom, cylindrical.
Right column, fiber orientations. Top, random, non-woven fiber mat. Middle, oriented
fibers. Bottom, tubular oriented fibers. Reprinted with permission from Khadka and
Haynie,27
copyright ©2012 Elsevier.
1.4 Proteins and polypeptides in electrospinning
A variety of fibrous proteins, globular proteins, engineered recombinant proteins, blends
of proteins with other kinds of polymer and synthetic polypeptides have been electrospun
by different researchers for different purposes.27
Most such works have had a
biomedical orientation. The structural proteins collagen, silk-fibroin, fibrinogen and
tropoelastin have been studied, and the globular proteins casein, serum albumin,

8
hemoglobin and myoglobin. The wool protein S-sulfo-keratin and a couple of major
plant proteins also have been successfully electrospun. The utilization of protein- or
peptide-based nanofibers in medicine and biotechnology will require controlled
conditions for materials preparation, storage and utilization.
The great majority of scholarly papers on protein or peptide electrospinning to date have
involved organic solvents to achieve polymer solubility and spinnability.27
The solvent
must be volatile and the polymer soluble, and the conductivity, surface tension, dielectric
constant and other properties of solution should maintain polymer structure and promote
spinnability. Fiber morphology, structure, diameter and mechanical properties will
largely depend on polymer structure and the solvent. The main polymer dissolution
reagents have been hexafluroisopropanol (HFP), tetrahydrofuran (THF), chloroform,
ethanol, dimethylformamide (DMF), trifluoroacetic acid (TFA), dichloromethane
(DCM), formic acid (FA) and hydrochloric acid (HCL).27
Different organic polymers have been blended with proteins in electrospinning
feedstock solutions. The purposes have included improving protein spinnability,
enhancing the mechanical properties of fibers (thermal stability, morphology and
degradability) and improving fiber biofunctionality. The polymers used in this way
include poly(dioxanone), poly(ethylene oxide), poly(ethylene terephthalate),
poly(glyconate), poly(D,L-lactide-co-glycolide), poly(L-lactide), poly(D,L-lactide-co-ε-
caprolactone), poly(styrene) and poly(vinyl alcohol), and chitosan and hyaluronic acid.27
Interest has tended towards polymers that are approved by the US Food and Drug
Administration.
9
Several electrospinning studies have focused on recombinant protein mimics or
synthetic polypeptides. Huang et al. and Nagapudi et al. have electrospun elastin-like
peptides from aqueous solution.28,29
Minato et al. have investigated the structure of
poly(γ-benzyl-L-glutamate), a synthetic homopolymer of a non-natural amino acid that
resembles glutamic acid, one of the 20 usual amino acids, before and after fiber
formation.30
The peptide was dissolved in trifluoroacetic acid and trifluoroethanol. Ner
et al., also mentioned above, have found that a designed 84 kDa elastin-like peptide can
be electrospun from water.31
We have recently spun poly(L-ornithine) from water.32
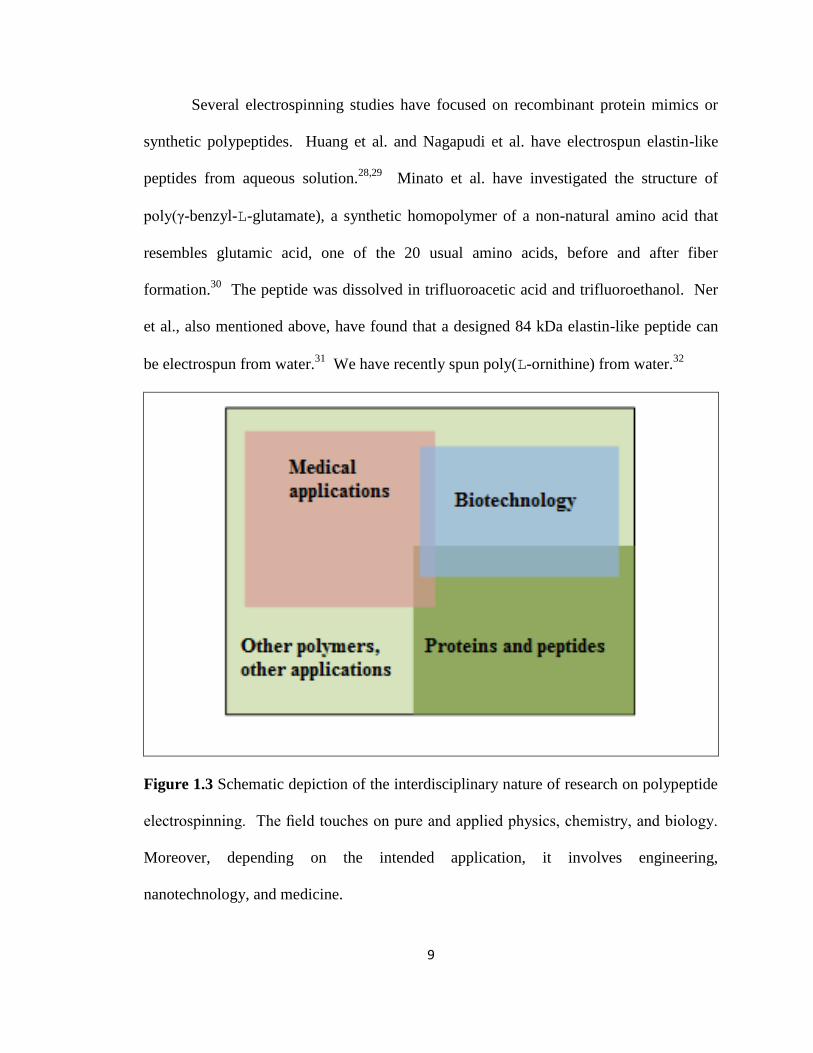
Figure 1.3 Schematic depiction of the interdisciplinary nature of research on polypeptide
electrospinning. The field touches on pure and applied physics, chemistry, and biology.
Moreover, depending on the intended application, it involves engineering,
nanotechnology, and medicine.

10
The amino acid ornithine is a precursor in the synthesis of arginine and relevant to
the urea cycle. The result was surprising because poly(L-lysine) was not spinnable under
comparable conditions, despite the structural similarity of L-lysine and L-ornithine.
More recently, we have demonstrated the spinnability of co-poly(L Glu4, L-Tyr1) from
water and the cytocompability of fibers crosslinked with carbodiimide.33
An advantage
of synthetic or recombinant peptides for the development of applications of protein-like
nanofibers in biomedicine and biotechnology is the avoidance of animal source materials,
organic solvents and non-biological polymers. The ability to tune amino acid
composition and to produce polymers at the large scale without animals or plants is other
advantages.
1.5 Characterizing physical properties of electrospun fibers
The properties of nanocomposite materials depend not only on the properties of their
individual parents, but also on their morphology and interfacial characteristics. There is
also the possibility of new properties which are unknown in the parent constituent
materials. Polymer materials in the form of nano fibers are useful due to certain
advantages such as high surface area to volume ratio and high aspect (length to diameter)
ratio. In fact, many nanomaterials show unique structural properties different from their
bulk properties.
The macroscale architecture and material properties of an electrospun scaffold can
be manipulated by regulating fiber composition, fiber diameter, fiber morphology, fiber
crosslinking and mechanical strength introduced into a scaffold during the fabrication

11
process. In turn, the physical cues provided by these macroscopic features can be used to
modulate cell phenotype.
Characterizing specified physical properties of the resulting electrospun materials
enables assessment of the predictability of non-woven fiber mat spinnability and
properties on the basis of amino acid sequence or composition. In this study we have
used several analytical tools to characterize physical properties of polymer feedstocks,
cast film and electrospun fibers and fibers mats made of these polymers. Here, CD has
been used to get information on polymer structures adopted by polypeptides in aqueous
solution. The optical activity of the polymer backbone strongly depended on
conformation in the far UV, and a comparison of polymer spectra in solution with fibers
spectra has been investigated structural change during fiber formation. The comparison,
though largely qualitative, was nonetheless useful for estimating structure in fibers. FTIR
has been used to study secondary structure of cast film and electrospun fibers before and
after crosslinking in attenuated total reflectance (ATR) mode. This method also provided
information about crosslinking process and extent qualitatively by peptide backbone
conformation. Secondary structure has been studied primarily by analysis of the amide I
bands (1600-1700 cm−1
, C=O bond stretching) and amide III bands (1200-1350 cm−1
, in-
phase combination of in-plane N-H bond bending and C-N bond stretching); amide II
bands (1510-1570 cm−1
) are less sensitive to changes in secondary structure and they
overlap strongly with bands attributable to side chain vibrations, but they are nevertheless
potentially informative. EDX has been used to study polymer composition analysis and
polymer side chains ionization correlation upon pH shift.

12
An understanding of the mechanical properties of single fiber is very important
for quality control. Utilizing AFM technique to obtain the elastic modulus of nano-scale
fibers employing the nano-scale three point bending test is a relatively new method. The
mechanical properties of electrospun fibers are important because of their potential for
tissue engineering, due to their biocompatibility. AFM also has been used to analyze
surface morphology, fiber diameters of individual electrospun fibers.
1.6 Thesis motivation
Protein fibers are fundamental building blocks of life playing an essential role in
motility, elasticity, scaffolding, stabilization and the protection of cells, tissues and
organisms. Despite nearly a century of research into the assembly mechanisms and
structures of fibrous proteins, only limited information is still available. Within the past
decade, however, insights have been provided into how some fibrous proteins assemble
and how they function in biology. In addition, efforts are increasingly being made to
employ protein fibers as performance molecules in man-made medical and technical
applications. A variety of proteins have been used for biomedical application.34
Many natural and synthetic proteins have been used for electrospinning.27
Soluble or solubilized proteins are widely considered promising for fiber production.27
Innovative technologies focused around synthetic proteins and copolymers are currently
of high urgency as they can decrease dependencies of bio-based materials and avoidance
of hazardous organic solvents. To date, however, protein-based fiber production has
relied on extraction of proteins from an animal or a plant source, solubilization of
proteins in organic solvents, or addition of non-natural organic polymers to the protein

13
solution feedstock – all potentially problematic for regulatory approval or consumer
acceptability. These importance and shortcomings led us to explore electrospinning of
synthetic polypeptide.
1.7 Thesis objective
A major objective of this dissertation was to fabricate and characterize
polypeptide based-biomaterial. Electrospinning is used as a tool to fabricate biomaterial.
Scientific emphases have been given in the fundamental study as as-spun materials, the
product architecture, physical properties of polymer feed stocks, cast film and
electrospun fibers aiming to explore biomedical applications.
The specific aims are as follows:
1. Designing, fabricating and characterizing polypeptide-based biomaterial
2. Exploring the possibility of electrospinning of synthetic and designed
polypeptides from aqueous solution
3. Crosslinking of electrospun fibers and quantification of degree of crosslinking
4. Analyzing fiber stability, composition and strength of electrospun fibbers at
different electronic environments
5. Enzymatic digestion of crosslinked fibers, dye labeling, electrostatic adsorption of
different model proteins onto the fibers
6. Characterization of key physical properties of polymers solution, cast film and
electrospun fibers
7. Analysis of mechanical behaviors of single electrospun fibers by AFM technique

14
1.8 References
1. Creighton, T. E. Proteins: Structures and Molecular Properties. New York:
Freeman; 1993.
2. Lloyd-Williams, W.; Albericio, F.; Giralt, E. Chemical Approaches to the
Synthesis of Peptides and Proteins. Boca Raton: CRC Press; 1997.
3. Hardin, C.; Edwards, J.; Riell, A.; Presutti, D.; Miller, W.; Robertson, D. Cloning,
Gene Expression, and Protein Purification: Experimental Procedures and Process
Rationale. New York: Oxford University Press; 2001.
4. Stern, K. R. Four levels of protein structure, using hemoglobin as an example.
Visual resource library ©1997.
5. Grafahrend, D.; Heffels, K. H.; Moller, M.; Klee, D.; Groll, J. Macromol. Biosci.
2010, 10, 1022-7.
6. Roco, M. C. Handbook of Nanoscience, Engineering, and Technology. Vol. 2nd
Edition. Boca Raton: CRC Press; 2007.
7. Huang, Z. Compos Sci Technol 2003, 63, 2223–53.
8. Chronakis, I. J. Mater. Process Technol. 2005, 167, 283–93.
9. Greiner, A.; Wendorff, J. H. Angew Chem. Int. Ed. Engl. 2007, 46, 5670–703.
10. Schiffman, J.; Schauer, C. Polym. Rev. 2008, 48, 317–52.
11. Teo, W. E.; Ramakrishna, S. Compos. Sci. Technol. 2009, 69, 1804–17.
12. Yoo, H. S.; Kim, T. G.; Park, T. Adv. Drug. Delivery Rev. 2009, 61, 1033–42.
13. Bose, G. M. Wittenberg 1745.

15
14. Cooley, J. F. Apparatus for electrically dispersing fluids. 1902.
15. Morton, W. J. Method of dispersing fluid. 1902.
16. Formhals, A. Process and apparatus for preparing artificial threads. 1934.
17. Formhals, A. Method and apparatus for spinning. 1939.
18. Formhals, A. Artificial thread and method of producing same. 1940.
19. Formhals, A. Production of artificial fibers from fiber forming liquids. 1943.
20. Formhals, A. Method and apparatus for spinning. 1944.
21. Doshi, J.; Reneker, D. H. J. Electrostatics 1995, 35, 151–60.
22. Teo, W. E.; Ramakrishna, S. Nanotechnology 2006, 17, 89–106.
23. Bhardwaj, N.; Kundu, S. C. Biotechnol. Adv. 2010, 28, 325–47.
24. Sell, S. A.; Wolfe, P.S.; Garg, K.; McCool, J. M.; Rodriguez, I. A.; Bowlin, G. L.
Polymers 2010, 2, 522–53.
25. Reneker, D. H.; Chun, I. Nanotechnology 1996, 7, 216–23.
26. Yoo, H. S.; Kim, T. G.; Park, T. G. Adv. Drug Delivery Rev. 2009, 61, 1033–42.
27. Khadka, D. B.; Haynie, D. T. Nanomedicine NBM 2012.
28. Huang, L.; McMillan, R. A.; Apkarian, R. P.; Pourdeyhimi, B.; Conticello, V. P.;
Chaikof, E. L. Macromolecules 2000, 33, 2989–97.
29. Nagapudi, K.; Brinkman, W. T.; Leisen, J. E.; Huang, L.; McMillan, R. A.;
Apkarian, R. P. Macromolecules 2002, 35, 1730–7.
30. Minato, K.; Ohkawa, K.; Yamamoto, H. Macromol. Biosci. 2006, 6, 487–95.
31. Ner, Y.; Stuart, J. A.; Whited, G.; Sotzing, G. A. Polymer 2009, 50, 5828–36.
32. Khadka, D. B.; Haynie, D. T. ACS Appl. Mater. Interfaces, 2010, 2, 2728–273.
16
33. Khadka, D. B.; Cross, M. C.; Haynie, D. T. ACS Appl. Mater. Interfaces, 2011, 3,
2994–3001.
34. Maham, A.; Tang, Z.; Wu, H.; Wang, J.; Lin, Y. Small 2009, 5, 1706–21.

17
CHAPTER 2
GENERAL METHODS
2.1 Fiber Electrospinning
Polymer feedstocks were taken up in to 1 mL plastic syringes from Fisher (USA)
outfitted with a 0.5-mm metallic blunt-end needle (Jensen Global, USA). A positive
potential in the 5-20 kV range was applied to the needle with a Glassman High-Voltage
PS/FX20P15.0-11 power supply (USA). Fibers were collected 5-15 cm from the
spinneret on indium tin oxide-coated polyethylene terephthalate, 60 Ω/in2 surface
resistivity (ITO-PET), was from Sigma-Aldrich or 12-mm glass cover slips (Fisher,
USA) placed on top of a grounded sheet of metal. The feedstock flow rate was not
regulated. This substrate material is particular useful for use as a fiber collector because
it is both conductive and semi-transparent in the visible range.
Oriented fibers were produced by connecting the power supply ground to a
parallel plate collector, assembled from two 5 cm-long copper electrodes separated by a
distance of 2 cm. All other conditions were the same as for fibers spun onto a planar
collector.

18
2.2 Fibers crosslinking
PLO was crosslinked with GTA vapor (25% w/v in water; Sigma); PLEY, with 50
mM EDC (Thermo Scientific, USA) in 90% ethanol/10% water. 10 mL of crosslinking
solution was deposited in a petri dish for each reaction. PLO fiber-coated substrates were
suspended over the liquid phase; Each dish was covered, sealed with parafilm and
maintained at 22 °C overnight. Next day, fiber samples, now crosslinked, were rinsed 4
times with 5 mL of deionized water. The duration of each rinse was 5 s, and fresh water
was utilized for each rinse. The final rinse was in 5 mL of deionized water for 1 min on
an orbital shaker. GTA was selected for the study because it is readily available,
inexpensive, and known to be an effective cross-linker of proteins in other contexts,
notably, cell biology; formulation development could involve a different cross-linking
method.
PLEY fibers and blend of PLEY and ELPs fibers were chemically crosslinked by
submersing samples on 2 cm 2 cm ITO-PET substrates or on glass cover slip in 5 mL
of 50 Mm (otherwise indicated) 1-ethyl-3-(3-dimethylaminopropyl) carbodiimide (EDC)
(Thermo Scientific, USA) in 90% ethanol/10% deionized water overnight at ambient
temperature. This water-soluble reagent, which is common in biochemistry and indeed in
protein electrospinning, activates carboxyl groups for spontaneous reaction with primary
amines. There are in every PLEY molecule one carboxyl group per glutamic acid side
chain, one carboxylic acid group at the carboxyl terminus of the polymer chain and one
amino group at the amino terminus.

19
2.3 UV spectroscopy
UV absorbances measured were carried out in a quartz cuvette in the 200-350 nm
range with a Jasco V-660 instrument (Japan). The bandwidth was 2.0 nm, the scanning
rate was 400 nm min–1
. The nominal polymer concentrations were 0.1 mg mL–1
unless
indicated otherwise. The small baseline artifact at 340 nm which arises from a change in
the photon source was subtracted from spectra.
2.4 Circular Dichroism Spectroscopy
An Aviv 215 CD instrument (Aviv Biomedical, Inc., USA) was utilized for
measurement of far-UV diachronic spectra of PLO, PLEY and ELPs dissolved in DI
water. 5-7 scans were averaged for measurement in the 200-260 nm range at a rate of 1
nm s-1
, a step size of 1 nm, a path length of 0.1 cm and a bandwidth of 1 nm. The peptide
concentration was 1.3 μM for PLO and 5.7 μM for PLEY. The path length was 1.0 cm.
The temperature was 25 °C.
2.5 Attenuated Total Reflection-Fourier transform infrared spectroscopy
A Jasco FT/IR 4100 spectrometer (Japan) outfitted with a HorizonTM
multiple-
reflection attenuated total reflection (ATR) accessory with a ZnSe crystal (Harrick
Scientific Products, Inc., USA) was used to analyze PLO, PLEY, ELPs and blends
spectra of cast films, fibers and crosslinked fibers. ZnSe transparency is approximately
independent of wavelength in the range 1200-4000 cm−1
. Samples were analyzed in situ
as polymer deposited directly from solution or as fiber mats on ITO-PET, before and
20
after crosslinking. All spectra were acquired as 256 scan averages at a resolution of 4
cm−1
.
2.6 Bright-Field and Fluorescence Microscope
A Zeiss Axiovert 200 M inverted microscope (Germany) equipped with an
incandescent source, a mercury vapor source, a filter set, various objective lenses and a
Roper Scientific MicroMAX System CCD camera (USA) or a Sony DNL140 CMOS
sensor (Japan) were utilized to initial visualization of electrospun fibers and to monitor
and document the stability of fiber samples and to capture bright-field and fluorescence
micrographs of fibers after protein adsorption.
2.7 Scanning electron microscopy
A JEOL JSM-6390LV scanning electron microscope (Japan) was utilized for fiber
morphology analysis and diameter measurements after metalized with a 10 nm layer of
gold-platinum. The accelerating potential used was in the range of 10-30 kV.
2.8 Energy-dispersive Spectrometry
Spectra of glass, PLO fibers on glass and PLEY fibers glass were collected with
an INCA X-sight 7582M energy-dispersive spectrometer (Oxford Instruments, UK)
mounted on a JSM-6390LV scanning electron microscope (SEM; JEOL, Japan). The
working distance was 10 mm, and the accelerating voltage was 15 kV. Copper tape in
some cases and silicon piece in some cases were utilized as a calibration standard without
changing focus, spot size or accelerating voltage.

21
2.9 Atomic Force Microscopy
A Digital Instruments Dimension 3100 AFM (Santabarbara, CA) available in
NERC was used for surface analysis operating in tapping mode and for bending moment
analysis operating in contact mode. Tap300-G cantilever tips (Budget Sensors, USA)
with nominal frequency of 300 kHz, a force constant of 40 N/m and a tip radius < 10 nm
were used for surface analysis. To obtain observable cantilever deflection, triangular SiN
cantilevers with a nominal spring constant of 0.15 N/m (Nanoworld USA) were utilized.
A tip attached to the end of a cantilever was scanned across the sample surface while the
change in cantilever deflection was monitored with a photodiode detector. A cantilever
that is soft enough to be deflected by very small forces and that has a high enough
resonant frequency to not be susceptible to vibrational instabilities is needed.
2.10 Dynamic Light Scattering
A Zetasizer Nano S (ZEN 1600, Malvern Instruments Ltd.) was utilized for
measurement of polymer size in solution. ELP samples at nominal concentration of 2
mg/mL in deionized water were passed through a 0.2 μm membrane prior to
measurement at 25 °C. The count rate was 254.0 kcps and 18 scans were averaged.

22
CHAPTER 3
ELECTROSPINNING OF SYNTHETIC POLYPEPTIDE POLY(L-ORNITHINE)
FROM AQUEOUS SOLUTION
3.1 Introduction
Electrospinning is a versatile means of fabricating continuous, ultrafine,
indefinitely long fibers of nanometer diameter from polymers in solution.1-3
The
structure, mechanical stability, chemical or biochemical functionality, and other
properties of the fibers can be controlled.4,5
Nonwoven textile mats, oriented fibrous
bundles, and three-dimensional structured scaffolds with a large surface area and high
porosity can be formed.6-8
Electrospun nanofibers are being studied for a variety of
human purposes in different areas of science and technology. In medicine and
biotechnology, current or envisioned applications of insoluble or slowly degrading
electrospun fibers include scaffolds for cell and tissue culture, drug delivery depots,
medical implant coatings, wound dressings, dental applications, antimicrobial delivery
vehicles, protective coatings for clothing, and biomimetic actuators and sensors.9-22
Many biopolymers, modified biopolymers, and blends of biopolymers with
synthetic polymers have been used for electrospinning.23
Soluble or solubilized proteins
are widely considered promising for nanofiber production. To date, however, protein-
based fiber production has involved organic solvents, animal source materials, or non-
23
biological polymer blends-all problematic for product development and medical
regulatory approval processes. A variety of proteins have been used to develop
applications of electrospun fibers in drug-delivery and Nanomedicine.24
For example,
Huang et al. found in 2001 that collagen could be electrospun from solution in the
presence of poly(ethylene oxide).25,26
Wnek et al. then electrospun human and bovine
plasma fibrinogen from 9:1 hexafluoroisopropanol: modified Eagle’s medium and
minimum essential medium (Earle’s salt).27
Xie and Hsieh electrospun a mixture of
casein and poly(ethylene oxide).28
Bowlin and co-workers then showed electrospinning
of collagen dissolved in hexafluoroisopropanol29,30
and Ramakrishna and co-workers
electrospun gelatin, a complex mixture of proteins and other biological macromolecules,
in 2,2,2- trifluoroethanol, producing bead-free fibers.31,32
In 2005, gelatin was
electrospun from 49:1 formamide:water.33
Chen et al. electrospun a composite fibrous
mat of chitosan/collagen dissolved in hexafluoroisopropanol/trifluoroacetic acid in
2007.34
Dror et al. then electrospun bovine serum albumin from toluene.35
In all these cases, the proteins were from an animal source. Other sources of
peptides are important for key reasons. Polypeptides can be produced at the industrial
scale by well established chemical synthetic methods and procedures involving
microorganisms. A practically unlimited number of different polypeptide sequences can
be made by these methods, not only ones occurring in nature, even if just the 20 usual
amino acids are considered. The biochemical functionality or general utility of
polypeptides thus produced can be controlled to a remarkable extent, especially if no
complex polymer folding process is required. Peptide-based materials can be cross-
linked in different ways, including disulfide bond formation, enabling a further degree of

24
control over aspects of mechanical properties. Ideally, it would be possible to
electrospun peptides of any desired amino acid sequence. Nevertheless, to the best of our
knowledge, there is no prior report on electrospinning fibers of synthetic polypeptides of
defined composition, much less from water in the absence of non-biological organic
polymers and organic co-solvents.
We have tested whether synthetic peptides of defined composition could be used
to electrospun fibers, whether water could be used as the solvent in the absence of
organic solvents and non-biological polyelectrolytes, and whether the resulting fibers
were water-insoluble or could readily be made insoluble. We were motivated by the
knowledge that the avoidance of animal source materials, organic solvents and non-
biological polymers would be advantageous for the development of applications of
peptide-based nanofibers in biomedicine and biotechnology. Here, we present initial
results on poly(L-ornithine), a polymer of amino acids relevant to the urea cycle and to
biotechnology.
3.2 Materials and methods
PLO (153.5 kDa by viscometry and 196.8 kDa by multiple-angle laser light
scattering) and PLEY (20–50 kDa by viscometry) were synthesized in solution and
obtained from Sigma (USA) as lyophilized polydisperse salts. The polydispersity index,
defined as the ratio of the weight-average molar mass to the number-average molar mass,
or MW/MN, is a way of quantifying the heterogeneity of polymer length. Light scattering
measures MN; viscometry measures the viscosity-average, MV, not MW. Because MN < MV

25
< MW, MV/MN can be taken as a lower bound on MW/MN. For PLO, MV/MN ≈ 1.3 and
MV/MN was probably less than 20% higher.
Lyophilized PLO was dissolved in deionized (DI) water in the range 10-40% w/v
and electros punned. All peptide solution samples were studied at ambient temperature,
pressure and humidity. Preliminary visualization of the nanofibers was done with an
inverted microscope with CCD camera. Diameters and morphology of nanofiber were
analyzed by SEM. Fibers were crosslinked with GTA vapor. Detail about the method
has been described in general method section in chapter 2.
3.3 Results
Experiments showed that PLO nanofibers could be spun from an aqueous solution. For
PLO as n prepared in this work, however, fibers were obtained only when the polymer
concentration was at least 20% w/v for an applied voltage of 5-20 kV and a nozzle-to-
electrically grounded collector distance of 5-15 cm; the electric field was 1 × 10⁵Vm
-1.
The optimal values for PLO fiber production suggested by the present work are 9 kV and
10 cm. Fibers produced at 20, 25, or 30% w/v PLO contained beads, perhaps because of
limited polymer entanglement. At 35% and 40%, by contrast, the fibers were long,
continuous, essentially bead-free, and suitable for mat production (see Figure 3.1). Less
promising fibers were obtained at 45%, and none at 50%. Solution viscosity increased as
PLO concentration increased. The influence of polymer concentration, viscosity, and
other electrospinning parameters on fiber production broadly resembles results obtained
with other synthetic and natural polymers.27,36
The underlying causes of the dependence
of fiber formation on PLO concentration are not entirely clear at the present stage of

26
research. As in other cases, however, spinnability it is likely to reflect the complex
interplay of chain entanglement, solution viscosity and other process variables that vary
with polymer concentration. Determination of the rate of water evaporation during
electrospinning and the amount of water present in the fiber mats was beyond the scope
of this initial study. Fiber diameter varied approximately linearly with concentration
when the needle gauge and applied voltage were held constant (Figure 3.2), consistent
with the results of others.27,36
The ability to control fiber diameter will allow for
flexibility in the design and fabrication of nanofibers for different applications.
The solubility of PLO fibers was tested. Fibers as spun dissolved readily in
aqueous solution at any pH and were sensitive to high humidity. It was therefore
attempted to cross-link the fibers with the vapor of GTA solution. A single GTA
Figure 3.1 Electrospun mats of fibrous polypeptides. Visualization was by SEM: (A)
200× magnification, scale bar, 50 μm; (B) 1200× magnification, scale bar, 10 μm. The
feedstock was 40% w/v PLO in water. Reprinted with permission from Khadka and
Haynie,52
copyright ©2010 American Chemical Society.
27
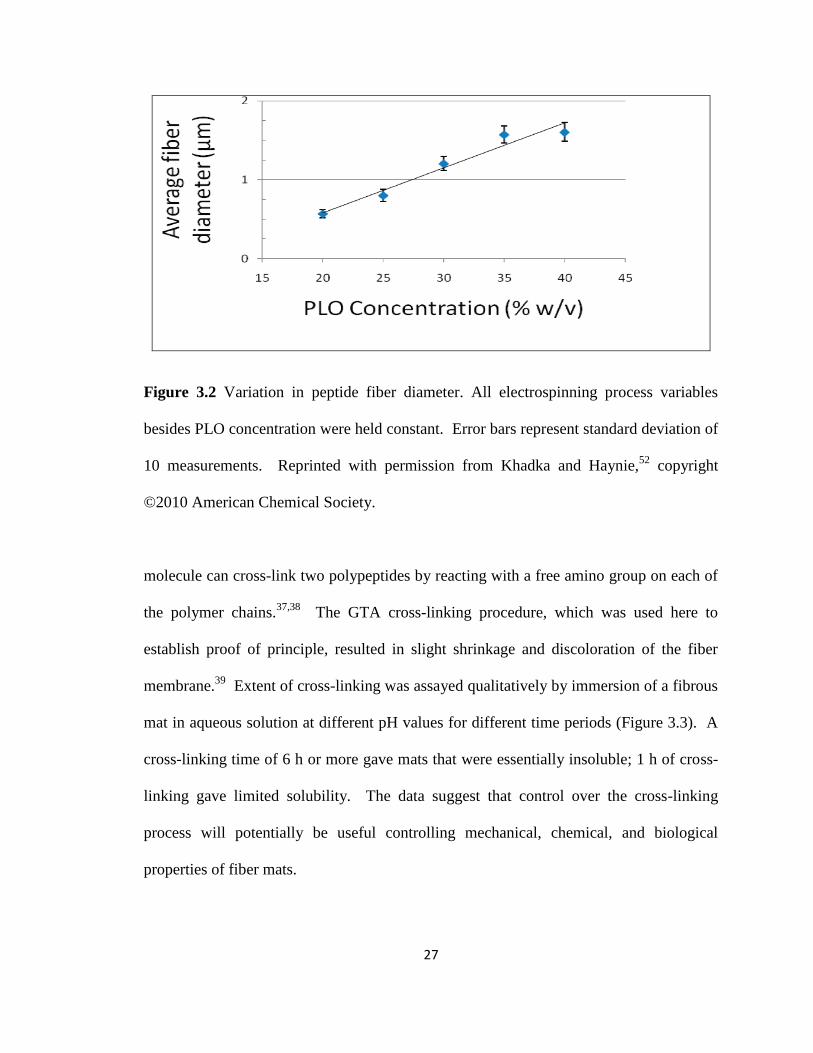
Figure 3.2 Variation in peptide fiber diameter. All electrospinning process variables
besides PLO concentration were held constant. Error bars represent standard deviation of
10 measurements. Reprinted with permission from Khadka and Haynie,52
copyright
©2010 American Chemical Society.
molecule can cross-link two polypeptides by reacting with a free amino group on each of
the polymer chains.37,38
The GTA cross-linking procedure, which was used here to
establish proof of principle, resulted in slight shrinkage and discoloration of the fiber
membrane.39
Extent of cross-linking was assayed qualitatively by immersion of a fibrous
mat in aqueous solution at different pH values for different time periods (Figure 3.3). A
cross-linking time of 6 h or more gave mats that were essentially insoluble; 1 h of cross-
linking gave limited solubility. The data suggest that control over the cross-linking
process will potentially be useful controlling mechanical, chemical, and biological
properties of fiber mats.

28
Figure 3.3 Insolubility of fibrous peptide mats upon cross-linking in situ on the collector.
Feedstock was 40% w/v PTO in water. (A) Unmodified control. Scale bar, 100 μm. (B)
No cross-linking, 1 min immersion in DI water, 1 h drying. Scale bar, 10 μm. (C) 15 min
GTA vapor cross-linking, 1 h immersion in DI water, 1 h drying. Scale bar, 200 μm. (D)
6 h GTA vapor cross-linking, 48 h immersion in DI water, 1 h drying. Scale bar, 100 μm.
Reprinted with permission from Khadka and Haynie,52
copyright ©2010 American
Chemical Society.
3.4 Discussion
In this work, we were more concerned with polymer provenance and structure and
proof of specific principles than physiological function, exhaustive characterization or
formulation development per se. The data show that nanofibers of PLO, a synthetic
polypeptide of defined composition, can be prepared by electrospinning from aqueous
solution. To the best of our knowledge, there is no other report in the scientific literature
on electrospun nanofibers made of synthetic polypeptides, much less polypeptide
nanofibers spun from aqueous solution. Moreover, the data show that neither organic
solvents nor non-biological organic polymers were required to achieve the outcome.

29
Furthermore, it was found that water-insoluble PLO nanofibers could be prepared by at
least one simple chemical cross-linking procedure. Taken together, the data support the
view that PLO may be taken as an exemplar of synthetic peptide spinnability and
insoluble peptide fiber mat production.
Electrospun nanofibers are being studied for a variety of human purposes in
different areas of science and technology.1-8
In medicine and biotechnology, for instance,
envisaged applications of these nanofibers range from scaffolds for cell and tissue
culture to drug delivery depots to medical implant coatings and beyond.9-22
The value of
materials made of the fibers will probably depend on the degree of control one can
exercise over the rate of degradation under conditions of interest. To date, most
nanofiber-based materials for biomedical applications have been made of non-biological
polymers.21,22
Proteins are considered advantageous for the development of electrospun
biomaterials.24-35
Biodegradable, absorbable, and environmentally benign, proteins
encode potentially useful biochemical information in a completely natural way; the
molecules can be purified relatively inexpensively, at least in some cases; and
collectively proteins display a remarkable range of functional properties under mild
solution conditions. Certain proteins exhibit extraordinary mechanical properties, for
example, wool, spider silk and silkworm silk.39-41
Sequence motifs in other proteins play
an indispensible role in specific molecular recognition, for instance, the RGD sequence of
fibronectin in integrin-based cell adhesion.42
For these reasons and others, proteins have
been objects of considerable interest for nanofiber production, especially for applications
in biotechnology and medicine. The development of protein-based nanofibers for use in
vivo has unfortunately been limited in several key ways. These include the use of

30
organic solvents or non-natural organic polymers to achieve spinnability, and the need to
extract desired proteins from an animal source.24-35
It is apparently necessary to denature
proteins to achieve appropriate chain entanglement or solution viscosity for fibril
formation by electrospinning, and protein denaturation in the absence of aggregation
often requires a strong chemical denaturant. Many organic solvents are toxic in small
amounts, non-natural organic polymers may be toxic or undesirable for medical
applications for other reasons, and proteins purified from an animal source may contain
transmissible pathogens. These conditions may present significant hurdles for product
function, quality assurance and product regulation.43
Some non-biological polymers
cause a severe immune response or are poorly absorbed.44
For such reasons, there has
been increasing interest in synthetic polypeptides for many years. Ideally, at least for
many applications, it will be possible to electrospun nanofibers made of synthetic
functional peptides from aqueous solution containing no organic solvent and no non-
biological synthetic organic polymers. Polypeptide cross-linking could be achieved by
disulfide bond formation, as in many secreted proteins, hair, and certain peptide-based
biomaterials.45
What makes a peptide structure appropriate for electrospinning under the
ideal conditions discussed in this work? The three methylene groups are hydrophobic in
nature. The δ-amino group titrates above pH 10. It is hardly obvious from this
information and the data presented above, however, which other peptide sequences will
be spinnable from a completely aqueous feedstock in the absence of non-biological
polymers. Indeed, ornithine closely resembles lysine, which has just one additional
methylene group in the side chain and a ε-amino group. The linear charge density of both
polymers is ca. +1 per residue at neutral pH.46
Nevertheless, we have not yet succeeded

31
in finding conditions that support fibril formation from poly(L-lysine) (PLL) dissolved in
water. The balance of charge and hydrophobic surface per unit length, in combination
with solvent polarity, counter ion concentration, charge screening, degree of
polymerization, polymer concentration, nozzle diameter, and electric field strength,
evidently combine in a way that supports fiber spinning more readily with PLO than
PLL. In any case, it would be unduly speculative, we believe, to say at this point what
determines the spinnability of PLO in aqueous solution. The present result can
nevertheless be assumed to suggest that polypeptides have an amino acid composition
other than 100% L-ornithine will show similar behavior.
As to ornithine itself, related reports from the scientific literature are, we believe,
worth mentioning here. Thanos et al., for instance, have described how the biochemical
stability of alginate-PLO microcapsules depends on the site of transplantation.47
Yamamoto and Hirata have used organic cross-linking agents to study the hydrogel-like
properties of cross-linked PLO.48
The physical model of axonal elongation described by
O’Toole et al. involves surfaces coated with PLO and laminin, an extracellular matrix
protein.49
Finally, the amino acid L-ornithine is a key component of the urea cycle, the
main role of which is biosynthesis of L-arginine, which is one of the 20 usual amino
acids.50
These facts may suggest possible uses of nanofiber mats made of electrospun
PLO.

32
3.5 Conclusions
The present results show that electrospun fibers can be made from at least one
synthetic polypeptide of defined composition dissolved in an aqueous solution containing
no organic solvent or non-biological organic polymer. The ability to control the
solubility of the resulting peptide nanofibers by a simple chemical cross-linking method
has also been demonstrated. Current widespread interest in utilizing solubilized proteins
in electrospinning would suggest that the ability to electrospun synthetic polypeptides of
defined composition could be important for the development of applications of
electrospun materials, perhaps most in medicine and biotechnology.
3.6 References
1. Huang, Z. M.; Zhang, Y.-Z.; Kotaki, M.; Ramakrishna, S. Compos. Sci. Technol.
2003, 63, 2223–2253.
2. Schiffman, J. D.; Schauer, C. L. Polym. Rev. 2008, 48, 317–352.
3. Chen, H.; Palmese, G. R.; Elabd, Y. A. Macromolecules 2007, 40, 781–782.
4. Ashammakhi, N.; Ndreu, A.; Piras, A. M.; Nikkola, L.; Sindelar, T.; Ylikauppila,
H.; Harlin, A.; Gomes, M. E.; Neves, N. M.;
5. Chiellini, E.; Chiellini, F.; Hasirci, V.; Redl, H.; Reis, R. L. J. Nanosci.
Nanotechnol. 2007, 7, 862–882.
6. Weisel, J. W. J. Thromb. Haemost 2007, 5, 116–124.
7. Muller, K.; Quinn, J. J.; Johnston, A. P. R.; Becker, M.; Greiner, A.; Caruso, F.
Chem. Mater. 2006, 18, 2397–3403.
8. Teo, W. E.; Ramakrishna, S. Compos. Sci. Technol. 2009, 69, 1804–1817.

33
9. Cui, W.; Zhou, Y.; Chang, J. Sci. Technol. Adv. Mater. 2010, 11, 14108–14119.
10. Fong, H.; Chun, I.; Reneker, D. H. Polymer 1999, 40, 4585–4592.
11. Li, W.-J.; Laurencin, C. T.; Caterson, E. J.; Tuan, R. S.; Ko, F. K. J. Biomed.
Mater. Res. 2002, 60A, 613–621.
12. McKee, M. G.; Elkins, C. L.; Long, T. E. Polymer 2004, 45, 8705– 8715.
13. Li, D.; Xia, Y. Adv. Mater. 2004, 16, 1151–1170.
14. He, W.; Ma, Z. W.; Yong, T.; Teo, W. E.; Ramakrishna, S. Biomaterials 2005,
26, 7606–7615.
15. Riboldi, S. A.; Sampaolesi, M.; Neuenschwander, P.; Cossu, G.; Mantero, S.
Biomaterials 2005, 26, 4606–4615.
16. Li, W.-J.; Tuli, R.; Huang, X.; Laquerriere, P.; Tuan, R. S. Biomaterials 2005, 26,
5158–5166.
17. Sill, T. J.; von Recum, H. A. Biomaterials 2008, 29, 1989–2006.
18. Fang, J.; Niu, H.-T.; Lin, T.; Wang, X.-G. Chin. Sci. Bull. 2008, 53, 2265–2286.
19. Vince, B.; Wen, X. J. Mater. Sci. Eng., C 2009, 663–668.
20. Wang, W.; Li, Z.; Liu, L.; Zhang, H.; Wang, H.; Wang, Z.; Wang, C. Sens.
Actuators, B 2009, 141, 276–283.
21. McCullen, S. D.; Ramaswamy, S.; Clarke, L. I.; Gorga, R. E. Wiley Interdiscip.
Rev. Nanomed. Nanobiotechnol. 2009, 1, 369–390.
22. Agarwal, S.; Wendorff, J. H.; Greiner, A. Polymer 2008, 49, 5603– 5621.
23. Agarwal, S.; Wendorff, J. H.; Greiner, A. Macromol. Rapid Commun. 2010, 31,
5603–5621.
24. Greiner, A.; Wendorff, J. H. Angew. Chem., Int. Ed. 2007, 46, 5670–5703.
34
25. Maham, A.; Tang, Z.; Wu, H.; Wang, J.; Lin, Y. Small 2009, 5, 1317–1331, 15.
26. Huang, L.; Nagapudi, K.; Apkarian, R.; Chaikof, E. L. Scanning 2001, 23, 372–
377.
27. Huang, L.; Nagapudi, K.; Apkarian, R.; Chaikof, E. L. J. Biomater. Sci., Polym.
Ed. 2001, 12, 979–994.
28. Wnek, G. E.; Carr, M. E.; Simpson, D. G.; Bowlin, G. L. Nano Lett. 2003, 3,
213–216.
29. Xie, J.; Hsieh, Y.-L. J. Mater. Sci. 2003, 38, 2125–2133.
30. Matthews, J. A.; Simpson, D. G.; Wnek, G. E.; Bowlin, G. L. Biomacromolecules
2002, 3, 232–238.
31. Bowlin, G. L.; Wnek, G.; Simpson, D. G.; Terracio, L. U.S. Patent 6 592 623
2003.
32. Zhang, Y.; Ouyang, H.; Lim, C. T.; Ramakrishna, S.; Huang, Z.- M. J. Biomed.
Mater. Res. 2005, 72B, 156–165.
33. Huang, Z. M.; Zhang, Y. Z.; Ramakrishna, S.; Lim, C. T. Polymer 2004, 45,
5361–5368.
34. Ki, C. S.; Baek, D. H.; Gang, K. D.; Lee, K. H.; Um, I. C.; Park, Y. H. Polymer
2005, 46, 5094–5102.
35. Chen, Z.; Mo, X.; Qing, F. Mater. Lett. 2007, 61, 3490–3494.
36. Dror, Y.; Ziv, T.; Makarov, V.; Wolf, H.; Admon, A.; Zussman, E.
Biomacromolecules 2008, 9, 2749–2754.
37. Boland, E. D.; Wnek, G. E.; Simpson, D. G.; Pawlowski, K. J.; Bowlin, G. L. J.
Macromol. Sci. 2001, 38, 1231–1243.

35
38. Zhang, Y. Z.; Venugopal, J.; Huang, Z. M.; Lim, C. T.; Ramakrishna, S. Polymer
2006, 47, 2911–2917.
39. Sell, S. A.; Francis, M. P.; Garg, K.; McClure, M. J.; Simpson, D. G.; Bowlin, G.
L. Biomed. Mater. 2008, 3, 45001–45012.
40. Becker, N.; Oroudjev, E.; Mutz, S.; Cleveland, J.; Hansma, P.; Hayashi, C.;
Makarov, D.; Hansma, H. Nat. Mater. 2003, 2, 278– 283.
41. Zheng, Y.; Bai, H.; Huang, Z.; Tian, X.; Nie, F.-Q.; Zhao, Y.; Zhai, J.; Jiang, L.
Nature 2010, 463, 640–643.
42. Shao, Z.; Vollrath, F. Nature 2002, 418, 741–741.
43. Arnaout, M. A.; Mahalingam, B.; Xiong, J.-P. Annu. Rev. Cell Dev. Biol. 2005,
21, 381–410.
44. CDRH BSE Working Group, Guidance for FDA Reviewers and Industry, 1998.
45. Rihova, B. Adv. Drug Delivery Rev. 1996, 21, 157–176.
46. Li, B.; Haynie, D. T. Biomacromolecules 2004, 5, 1667–1670.
47. Doty, P.; Wada, A.; Yang, J. T.; Blout, E. R. J. Polym. Sci. 1957, 23, 851–861.
48. Thanos, C. G.; Bintz, B. E.; Emerich, D. F. J. Biomed. Mater. Res. 2007, 81A, 1–
11.
49. Yamamoto, H.; Hirata, Y. Macromolecules 1995, 28, 6701–6704.
50. O’Toole, M.; Lamoureux, P.; Miller, K. E. Biophys. J. 2008, 94, 2610–2620.
51. Berg, J. M.; Tymoczko, J. L.; Stryer, L. Biochemistry, 6th ed. 2002.
52. Khadka, D. B.; Haynie, D. T. ACS Appl. Mater. Interfaces 2010, 2, 2728–2732.

36
CHAPTER 4
ELECTROSPINNING OF A SYNTHETIC POLYPEPTIDE CO-POLY(L-GLU, L-
TYR) FROM AQUOUS SOLUTION
4.1 Introduction
Considerable effort has gone into the development of biodegradable,
biofunctional and biocompatible nanostructured materials.1-3
Electrospinning is a simple
and versatile method of fabricating continuous nanometer-to-micrometer-diameter fibers
from polymers in solution.4-6
Non-woven textile mats, oriented fibrous bundles and
three-dimensional scaffolds can be formed by this method. The structure, chemical and
mechanical stability, functionality and other properties of electrospun fibers can be
tailored to specific applications. A variety of applications of these materials are
envisioned.
In medicine and biotechnology, applications of electrospun nanofibers include
drug delivery vehicles, tissue engineering scaffolds, implant coatings, wound dressings,
dental coatings, enzyme immobilization and antimicrobial materials, chemical and
biological protective clothing and biomimetic actuators and sensors.7-14
It has been noted
that the large surface area and high porosity of the fibers mimic key features of the
extracellular matrix13,15
, a biological structure that plays an important role in the
attachment, migration, proliferation and other aspects of cell behavior in vivo.13,16

37
Surface area and porosity are also important for the dissolution of entrapped solute
particles and solvent evaporation; fiber mats could also be useful in drug delivery.17
Many biopolymers, modified biopolymers, and blends of biopolymers and
synthetic organic polymers have been electrospun.5,13,17-19
Soluble or solubilized proteins
are widely considered promising for fiber production.4,5,13,20
To date, however, protein-
based fiber production has relied on extraction of proteins from an animal or a plant
source, solubilization of proteins in organic solvents, or addition of non-natural organic
polymers to the protein solution feedstock – all potentially problematic for regulatory
approval or consumer acceptability.
Earlier, we showed that the synthetic cationic peptide poly(L-ornithine) (PLO)
was not only spinnable but spinnable from water, and we provided an introductory
technical description of the fibers.21
PLO spinnability was surprising because poly(L-
lysine) (PLL), which is very closely related in structure, is apparently not spinnable under
comparable conditions. Neither lysine nor ornithine has an aromatic group in its side
chain. Here, we describe the electrospinning of the synthetic anionic polypeptide PLEY
from water. Carboxylic acid groups and aromatic groups are present in the side chains.
Data are provided on physical and chemical properties of the resulting fibers: the
relationship of peptide concentration to spinnability and fiber diameter, fiber crosslinking
and solubility, electrostatic properties of fibers, polymer structure in solution and in fibers
and fiber degradation by proteases.

38
4.2 Materials and methods
PLEY [(L-Glu, L-Tyr) 4:1 or poly(L-Glu4-co-L-Tyr1); E = Glu, Y = Tyr in single-
letter code], 20-50 kDa by viscometry, was from Sigma-Aldrich (USA). Information on
the choice of this polymer is provided in the Discussion. Lyophilized PLEY was
dissolved in deionized water at 60% (w/v), a concentration close to the solubility limit,
and serially diluted with water. Fibers were spun from the polymer feedstock in a
syringe; a blunt-tip needle served as the spinneret. The feedstock flow rate was otherwise
determined by solution viscosity and gravity. All fiber production was done at ambient
temperature, pressure and humidity. Preliminary visualization of fibers on planar
collectors was done with a Zeiss Axiovert 200M inverted microscope. Higher resolution
images were obtained with a SEM. Fiber diameter was determined by analysis of SEM
data.
PLEY fibers were chemically crosslinked by submersing samples on 4 cm 4 cm
ITO-PET substrates in 20 mL of 50 mM 1-ethyl-3-(3-dimethylaminopropyl)
carbodiimide (EDC) (Thermo Scientific, USA) in 90% ethanol/10% deionized water at
ambient temperature.22
The duration of the crosslinking reaction was 0-6 h. Crosslinked
samples were rinsed extensively with deionized water prior to further analysis.
Crosslinked fibers were visualized by SEM as described above or fluorescence
microscopy following adsorption of dye-conjugated peptides. Fiber samples on 2 cm 2
cm ITO-PET were fully immersed for 1 h in 2 mg/mL fluorescein isothiocyanate (FITC)-
PLL (Sigma) in deionized water or 5 mg/mL FITC (Sigma) in deionized water and then
rinsed with deionized water. Samples and controls were then analyzed with a

39
fluorescence microscope equipped with a fluorescein filter set. PLEY structure was
analyzed by CD and FTIR.
Enzymatic degradation of crosslinked fiber mats was tested with two protease
species. Lyophilized Glu-C endoproteinase (Thermo Scientific) was reconstituted at a
concentration of 0.2% (w/v) in 50 mM ammonium bicarbonate, pH 8.0, and successive
10-fold dilutions were prepared with the same buffer. Lyophilized protease XIV (Sigma)
was reconstituted at 2% (w/v) in phosphate-buffer saline (PBS), and successive 10-fold
dilutions were prepared with the same buffer. ITO-PET substrates covered with
crosslinked fiber mats were divided into 6 equal areas, 2 cm 2 cm each. 20 L of
enzyme solution or buffer was then deposited on the corresponding sector of fiber mat
and incubated at 37 °C for 0-5 h. The resulting samples were rinsed with deionized
water, dried and analyzed by SEM as described above.
4.3 Results
PLEY was not spinnable at concentrations below 20% (w/v). Fibers produced in
the 20-35% concentration range contained beads; the fibers were not smooth and
continuous. At 50-60%, fibers were continuous, long and suitable for mat production.
Less attractive fibers were obtained with 40-45% PLEY. The spinneret-collector distance
and the applied voltage were tested at 3 or more values in the 5-15 cm and 7-20 kV range
for each polymer concentration; the electric field was ~103 Vm
−1. The most attractive
fibers were obtained at 50-55% PLEY, 12 kV and 10 cm. Table 1 shows the main
electrospinning process variables considered in this study and the corresponding apparent
optimal values for fiber mat production.

40
Figure 4.1 presents typical SEM images of fibers electrospun at 55% PLEY.
Panel A shows a non-woven fiber mat on a planar ITO collector at different
magnifications; Panel B, aligned fibers obtained with the parallel-plate collector
described above. In both cases, the fibers are smooth and bead-free. The average fiber
diameter, determined by analysis of SEM images, was 670 nm-9.10 µm, depending on
polymer concentration (Figure 4.2). In general, the variance in fiber diameter increased
as the mean value increased. At 55%, the average diameter was 7 ± 1 µm.
Table 4.1 Processing parameters for electrospinning of PLEY.
Quantity Range tested Apparent optimal value
Polymer concentration (w/v %) 10-60 55
Spinneret-collector distance (cm) 5-15 10
Applied voltage (kV) 7-20 12
Figure 4.1 SEM micrographs of PLEY fibers electrospun at 55% (w/v). A) Randomly-
oriented fibers at 140× and 15 kV (100 m scale bar), 850× and 30 kV (large inset, 20
m scale bar) and 1700× and 25 kV (small inset, 10 m scale bar). B) Aligned fibers at
900× and 19 kV (20 m scale bar). Reprinted with permission from Khadka et al.45
copyright ©2011 American Chemical Society.
A B

41
PLEY fiber solubility has been tested at different pH values, above and below the
pKa of glutamic acid. This amino acid accounts for 4 in 5 of all residues of PLEY (see
Materials and Methods). Side chain ionization was considered relevant because it
strongly influences polymer solubility. In the absence of crosslinking, fibers were
sensitive to water throughout the tested range, pH 2 (below the pKa of Glu) to pH 12
(above the pKa of Tyr), and at high humidity (Figure 4.3). Crosslinking was achieved by
immersing fiber samples in EDC in ethanol/water at room temperature for defined
periods of time. 6 h of crosslinking was sufficient for essentially complete fiber mat
insolubility. The results of the crosslinking and solubility tests are summarized in Table
4.2.
Figure 4.2 Fiber diameters as a function of polymer feedstock concentration. Diamonds,
PLEY. Squares, PLO. Applied voltage and spinneret-collector distance were held
constant. The values were 10 cm and 12 kV for PLEY and 10 cm and 10 kV for PLO.
Each data point represents the average of 20 independent measurements. The error bars
represent standard deviations. The PLO data are from ref. 21. Reprinted with permission
from Khadka et al.45
copyright ©2011 American Chemical Society.

42
Table 4.2 Result of fiber mat crosslinking and solubility tests. The duration of fiber mat
exposure to crosslinking reagent and to water are given.
Crosslinking time (h) Dissolution time (h) Result
0.25 0.25 ~100%
0.5 0.5 <75% dissolution
1.0 1.0 <25% dissolution
6.0 12, 24, 48 <5% dissolution
Figure 4.3 Solubility of fiber mats on ITO-PET before and after crosslinking. As-spun
fiber mat; 15 kV, 140×; 100 μm scale bar. Large inset, fiber mat following immersion in
water for 1 min and drying for 1 h; 25 kV, 400×; 50 μm scale bar. Small inset, fiber mat
following crosslinking with EDC for 4 h, immersion in water for 2 days and drying for 3
h; 15 kV, 400×; 50 μm scale bar. Reprinted with permission from Khadka et al.45
copyright ©2011 American Chemical Society.

43
PLL-FITC has been used to visualize fiber mats by fluorescence microscopy.
PLL-FITC (Figure 4.4A) but almost no free FITC (Figure 4.4B) became bound to PLEY
molecules in fiber mats during incubation and remained bound following extensive
rinsing with deionized water. The binding process resulted in essentially no change in
fiber diameter. Any FITC that became bound to ITO-PET did so at an approximately
uniform surface density (Figure 4.4C). Fibers on ITO could not be visualized by
fluorescence microscopy in the absence of a dye (Figure 4.4D).
CD has been used to gain information on PLEY structure in solution. FTIR-ATR
has been used to demonstrate fiber crosslinking and assess PLEY structure in fibers
before and after crosslinking. The spectra of the polymer cast from solution and in fibers
Figure 4.4 Fluorescence micrographs of crosslinked PLEY fibers on ITO-PET
electrospun at 50% (w/v). The applied voltage was 10 kV, the spinneret-collector
distance 9 cm. A) Sample incubated with 2 mg/mL FITC-PLL for 1 h and rinsed with
deionized water. B) Sample incubated with 5 mg/mL FITC for 1 h and rinsed with
deionized water. C) Sample incubated with 5 mg/mL FITC for 1 h and rinsed with
deionized water. D) Sample rinsed with deionized water. All micrographs were obtained
with a 10× objective lens. The scale bar is 20 μm in each case. Reprinted with
permission from Khadka et al.45
copyright ©2011 American Chemical Society.
D C B A
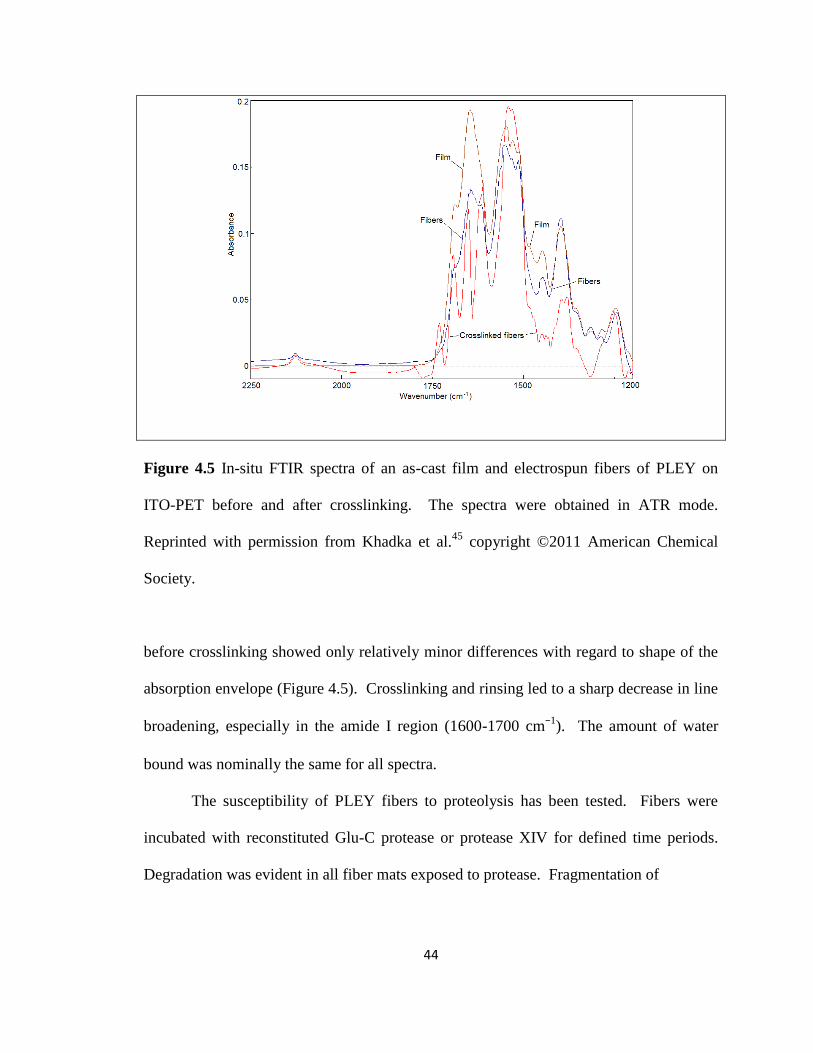
44
Figure 4.5 In-situ FTIR spectra of an as-cast film and electrospun fibers of PLEY on
ITO-PET before and after crosslinking. The spectra were obtained in ATR mode.
Reprinted with permission from Khadka et al.45
copyright ©2011 American Chemical
Society.
before crosslinking showed only relatively minor differences with regard to shape of the
absorption envelope (Figure 4.5). Crosslinking and rinsing led to a sharp decrease in line
broadening, especially in the amide I region (1600-1700 cm−1
). The amount of water
bound was nominally the same for all spectra.
The susceptibility of PLEY fibers to proteolysis has been tested. Fibers were
incubated with reconstituted Glu-C protease or protease XIV for defined time periods.
Degradation was evident in all fiber mats exposed to protease. Fragmentation of

45
Figure 4.6 SEM micrographs of crosslinked electrospun 55% PLEY fibers following
proteolytic digestion for 5 h at 37 °C. A) 0%, B) 0.002%, C) 0.02%, D) 0.2% (w/v) Glu-
C protease in 50 mM ammonium bicarbonate buffer, pH 8. A) 200×, all others, 180×.
The accelerating potential was 25 kV or 30 kV. The scale bar is 100 μm in each case.
See also supplemental information. Reprinted with permission from Khadka et al.45
copyright ©2011 American Chemical Society.
individual fibers increased with time (Figure 4.6). Fibers were almost completely
degraded within 5 h by 0.2% (w/v) Glu-C or 2% (w/v) protease XIV. 20-25% of the
fibers remained in 0.02% Glu-C and 0.2% protease XIV after the same amount of time;
40-45% of the fibers remained in 0.002% Glu-C and 0.02% protease XIV. The protease
XIV SEM data, which closely resemble the Glu-C data, are provided in supplemental
information.
4.4 Discussion
Every protein in nature comprises at least one polypeptide chain. What we mean
by polypeptide in this paper is a certain kind of polymer of human design, whether the
polymer is made by a chemical method or a biological approach. Dozens of
A B C D

46
electrospinning studies on proteins have appeared in the scientific literature13
; there are
apparently only five published electrospinning studies on polypeptides. A brief summary
of the peptide papers follows. Minato et al. have investigated poly(-benzyl-L-
glutamate), a synthetic homopolymer of a non-natural amino acid that resembles glutamic
acid, one of the 20 usual amino acids.23
This polypeptide, which is insoluble in water,
was spinnable from dichloromethane and trifluoroacetic acid. We have found that fibers
of PLO but not PLL could be electrospun from water.21
This was surprising because the
ornithine and lysine side chains differ by a single methylene group. Ornithine, a natural
but unusual amino acid, plays a role in the urea cycle and the biosynthesis of arginine,
another of the 20 usual amino acids.24
Ner et al. have found that a synthetic 84 kDa
elastin-like peptide can be electrospun from water.25
The structure of this polymer
was (S2E3EkE4S2)13, where S = GAGAGS, E = GVGVP and Ek = GVGKP (G = glycine,
A = alanine, S = serine, V = valine, P = proline and K = lysine all used amino acids).
Huang et al. have found that a similarly large but more practical elastin-like peptide was
spinnable from water.26
Having a mass of 81 kDa, [(VPGVG)4VPGKG]39 was produced
by a recombinant DNA method in bacteria. Nivison-Smith et al. (2010) have recently
electrospun synthetic human tropoelastin fibers dissolved in hexafluoroisopropanol.27
The fibers were then crosslinked with di-isohexanecyanate or glutaraldehyde and rinsed
extensively with graded dilutions of isopropanol in water or phosphate-buffered saline,
respectively. To date, none of the published polypeptide electrospinning studies except
the last one has included biological characterization of electrospun fibers.
In the present work, electrospinning was used to produce fibers of synthetic
PLEY. The selection of this polymer may seem arbitrary. It was not. All chiral amino

47
acids in proteins, that is, all amino acids other than glycine, are levororotary – in all
known organisms. PLEY consisted of L-amino acids only. The mere demonstration of
PLEY electrospinning may seem insignificant. It is not. To date, few polypeptides of
any sequence have been proved spinnable – under any conditions, let alone from water.
Only a handful of different proteins have thus far been spinnable – collagen, silkworm
silk, a few others – and usually only after solubilization in a toxic organic solvent13
.
PLEY, by contrast, is spinnable from water. Aromatic side chains play an important role
in nucleating protein folding and forming the hydrophobic core of the native state of
globular proteins.28
No other spinnable polypeptide (on the definition used here) has side
chains with aromatic rings. The exception is poly(-benzyl-L-glutamate), which is
insoluble in water. PLEY contains tyrosine, the side chain of which has an aromatic ring,
and it is soluble in and spinnable from water.
The spinnability of PLEY, though significant on its own, should nevertheless be
considered in a broader context. PLO was spinnable at a concentration of 20-40% (see
Figure 4.2). The PLEY molecules of the present work had an approximate average mass
of 35 kDa, and continuous fibers were obtained at a concentration of 55% (w/v). The
volume occupied per polymer molecule at this concentration is about 105 nm3, or a cube
with sides of about 4.7 nm. The average contour length of the PLEY molecules was
about 180-fold greater. Hemoglobin, by contrast, with a molecular mass of 68 kDa and a
partial molar volume of 0.74, occupies a volume of about 85 nm3 in the folded, organic
crystal-like native state.29
The density of amino acid residues in 55% (w/v) PLEY is then
about 2.4-fold smaller than in native hemoglobin. That is, PLEY chains were
substantially solvated at 55% (w/v), but the polymer concentration was still high enough
48
for continuous formation of bead-free fibers. Inter-chain hydrophobic interactions may
have played a significant role in fiber formation. In PLO fibers, by contrast, inter-chain
hydrophobic interactions are improbable: the side chain consists of three methylene
groups and, at the distal end, an amino group. This amino group, which has a nominal
pKa of 10.75, will be charged with high probability at neutral pH.30
PLO fibers are likely
to be stabilized mostly by ionic interactions involving counterions.
Continuous spinning of PLEY resulted in porous scaffolds (Figure 4.1A). It has
been suggested that fibrous scaffolds, which resemble some features of the ECM, could
provide advantages for the attachment, proliferation, maturation and activation of cells in
vitro relative to solid films cast from the same polymer in solution.15
PLEY scaffolds
may therefore be useful for achieving desired biomedical aims. It was also possible to
produce aligned fibers of PLEY (Figure 4.1B). In specific tissue engineering
applications, such as controlling the guidance and alignment of nerve cells, tendons and
ligaments, a common approach has been to prepare aligned rather than randomly-oriented
fibers. Aligned fibrous scaffolds can provide topographic guidance to cells.31
Again,
PLEY scaffolds may be useful for achieving desired biomedical aims.
Fibers spun from 20-35% (w/v) PLEY contained beads, similar to report by
Reneker et al. (1999). This may be due to an insufficient concentration of polymer for
uniform chain entanglement during solvent evaporation.32
The optimal conditions for
spinning were 55% polymer, 12 kV applied voltage, and 10 cm spinneret-to-collector
distance (Table 1). Fiber diameter varied with PLEY concentration (Figure 4.2), as with
other synthetic and natural polymers.33,34
The trend was non-linear, as with other
polymers.35
For PLO, by contrast, fiber diameter varied approximately linearly with

49
polymer concentration, at least in the spinnable range.21
The ability to control fiber
structure and diameter could be useful in the design and fabrication of fibers for different
applications.
PLEY fibers readily dissolved in water in the absence of crosslinking, reflecting
the solubility of the polymer prior to spinning. For biomedical applications, which will
generally require immersion in an aqueous medium, the fibers must be crosslinked. Here,
EDC was employed for the purpose, as in several protein electrospinning studies.22
An
advantage of EDC, a so-called zero-length crosslinker, is that it does not become
incorporated into the macromolecule (see reaction scheme in supplemental information).
This decreases the potential that crosslinking will lead to cytotoxic effects.36
Fiber
dissolution during the crosslinking step was limited by applying EDC to fibers in
ethanol/water (see Materials and Methods). Excess EDC was removed by rinsing after
crosslinking.
Biodegradable materials are becoming increasingly attractive for surgery: with
increasing practicality, they can diminish the need for subsequent removal of an
implanted device.1,3,37,38
Biodegradable products will decompose naturally. The
experiments described here have shown that Glu-C protease and protease XIV digested
PLEY fibers over time. These proteases, from Staph. aureus and Strep. greiseus,
respectively, were selected for study because they are known to recognize glutamic acid.
Specifically, Glu-C, a serine protease, and protease XIV, a mixture of at least three
proteolytic activities, cleave peptide bonds at the C-terminus of glutamic acid residues.
The susceptibility of a polypeptide fiber mat to proteolysis will presumably be a tunable
function of polymer structure and crosslinking.

50
Charge properties of the fibers were further revealed by a simple binding
experiment. PLL-FITC (Figure 4.4A) but not FITC (Figure 4.4B) became appreciably
associated with crosslinked PLEY fiber mats and remained bound after extensive rinsing
with deionized water. This provides indirect evidence that the EDC crosslinking reaction
did not consume all available carboxyl groups in the fibers. Lysine side chains in PLL
will have bound glutamate side chains in the fibers, as in electrostatic layer-by-layer
assembly;39
hydrophobic interactions between side chains too may have contributed to
the binding free energy. The resulting increase in fiber diameter was in any case too
small to be visualized at the resolution of the micrographs in Figure 4.4; under the
conditions of the experiment, polyelectrolyte layer-by-layer assembly is a self-liming
process, resulting in a layer of PLL-FITC with a thickness on the order of nanometers.40
To the extent that PLL-FITC models an active small molecule conjugated to a carrier
peptide, the approach outlined here provides a means of “functionalizing” an ECM-like
scaffold made of PLEY. The physical adsorption of molecules onto insoluble but
degradable fibers could be useful for biomedical applications of polypeptide fibers, for
example, delivery of biologics to targeted organs and or suppression of tumors.41
FTIR is widely used to obtain information on the structural properties of peptides
and proteins. The amide I, amide II and amide III bands are key ones in peptide structure
analysis42
. The amide I band (1600-1700 cm–1
) is mainly due to C=O stretching and
directly related to polymer backbone conformation. Amide II resonances (1500-1600
cm–1
), which are mostly attributable to N-H bending and C-N stretching, are not
especially sensitive to conformation. Amide III (1200-1450 cm–1
) resonances depend on

51
side chain structure and hydrogen bonding. These bands can therefore shift with changes
in conformation.
The most significant resonances displayed by the cast peptide film in the 1200-
1700 cm–1
range were at 1240, 1395, 1445, 1512-1550, 1614, 1641 and 1687 cm–1
(Figure 4.5). These resonances are tentatively assigned to sheet, COO– symmetric
stretch, 1445, sheet and NH3+, sheet, random coil and turn, respectively. The peak
right at 1512 cm–1
appears to be due to the ring-OH vibration in the tyrosine side chain.
An absorption envelope encompassing perhaps several resonances stretches across the
entire amide I range, complicating analysis of secondary structure. Essentially the same
resonances are seen in the fiber spectrum before crosslinking, though the band at 1614
cm–1
, which is probably due to sheet, seems significantly less prominent. The
reduction of intensity in the amide I region may be due to somewhat less water being
present in the sample.
Crosslinking fibers increased the sharpness of absorption bands and, in several
cases, resulted in a shift of resonant frequency, despite extensive rinsing with water to
remove residual EDC. The most prominent bands were at 1251, 1375, 1540, 1611, 1650,
1697 and 1729 cm–1
. The respective tentative assignments are to sheet, CH2 in
crosslinked glutamic acid side chains, sheet and NH3+, sheet, random coil, turn and
COOH. It is unclear why the last resonance appears in the crosslinked fiber data but not
the other spectra. In general, the decreased line broadening will have been due to
increased polymer rigidity. In summary, the FTIR spectra provide evidence of polymer

52
crosslinking, and they suggest that some fraction of polymers adopted a -sheet
conformation in the crosslinked fibers.
Various investigators have studied the incorporation of protein-based electrospun
fibers into different biomaterials.5,11,43
Proteins are in general biodegradable,
biocompatible and environmentally benign. To date, though, most protein
electrospinning has required either organic solvent for polymer solubilization or non-
natural polymers for electrospinning or fiber stability13
. Such materials may be toxic or
undesirable for reasons of cost, manufacture logistics, quality assurance, product
regulation or patient acceptability. Some non-biological polymers are known to cause
severe immune responses.44
Others, including polymers approved for various purposes
by the US Food and Drug Administration, are non-immunogenic but yield breakdown
products that influence the pH of the surrounding physiological environment, possibly
resulting in tissue necrosis. Most proteins of interest in electrospinning have been
obtained from an animal source. There is increasing resistance from regulatory agencies,
however, to approve medical products containing animal source material. Some
problematic aspects of biomaterials development may be overcome by the use of
synthetic polypeptides of defined composition that are soluble in water.
4.5 Conclusion
The data presented here show that fibers of the synthetic co-polypeptide PLEY
can be prepared by electrospinning from aqueous solution under certain conditions.
Important, neither organic solvents nor non-biological organic polymers were needed for
polymer solubilization or spinning. Fiber diameter varied with polymer feedstock
53
concentration. Fibers became water-insoluble after crosslinking. PLEY was largely
unstructured in solution but appears to have adopted a combination of sheet and
random coil in fibers. Charge properties enabled rapid and stable functionalization of
crosslinked fibers in an aqueous medium by physical association with oppositely-charged
peptides. Proteases degraded fibers over time. The results seem promising for
applications of fiber mats in tissue engineering, drug delivery, surface modification of
medical implant devices and wound dressings.
4.6 References
1. Vert, M. J. Mater. Sci. Mater. Med. 2009, 20, 437–446.
2. Yoo, H. S.; Kim, T. G.; Park, T. G., Adv. Drug Deli. Rev. 2009, 61, 1033–1042.
3. Gunatillake, P.; Mayadunne, R.; Adhikari, R. Biotechnol. Annu. Rev. 2006, 12,
301–347.
4. Huang, Z. M.; Zhang, Y. Z.; Kotaki, M.; Ramakrishna, S. Comp. Sci. Technol.
2003, 63, 2223–2253.
5. Schiffman, J. D.; Schauer, C. L. Polym. Rev. 2008, 48, 317–352.
6. Reneker, D. H.; Yarin, A. L. Polymer, 2008, 49, 2387–2425.
7. McCullen, S. D.; Ramaswamy, S.; Clarke, L. I.; Gorga, R. E. Wiley Interdiscip.
Rev. Nanomed. Nanobiotechnol. 2009, 1, 369–390.
8. Sill, T. J.; von Recum, H. A. Biomaterials 2008, 29, 1989–2006.
9. McCullen, S. D.; Ramaswamy, S.; Clarke, L. I.; Gorga, R. E. Wiley Interdiscip.
Rev. Nanomed. Nanobiotechnol. 2009, 1, 369–390.

54
10. Agarwal, S.; Wendorff, J. H.; Greiner, A. Macromol. Rapid Commun. 2010, 31,
5603–5621.
11. Cui, W.; Zhou, Y.; Chang, J. Sci. Technol. Adv. Mater. 2010, 11, 14108–14118.
12. Bhardwaj, N.; Kundu, S. C. Biotech. Adv. 2010, 28, 325–347.
13. Sell, S. A.; Wolfe, P. S.; Garg, K.; McCool, J. M.; Rodriguez, I. A.; Bowlin, G. L.
Polymers 2010, 2, 522–553.
14. Kumbar, S. G.; Nukavarapu, S. P.; James, R.; Hogan, M. V.; Laurencin, C. T.
Rec. Pat. Biomed. Eng. 2008, 1, 68–78.
15. Teo, W. E.; Ramakrishna, S. Nanotechnology, 2006, 17, R89–R106.
16. Schultz GS, Wysocki A. Extracellular matrix: review of its roles in acute and
chronic wounds. Available at: http://www.worldwidewounds.
com/2005/august/Schultz/Extrace-Matric-Acute-Chronic- Wounds.html
17. Verreck, G.; Chum, I.; Peeters, J.; Brewster, M. E. Pharm. Res. 2003, 20, 810–
817.
18. Greiner, A.; Wendorff, J. H. Angew. Chem. Int. Ed. 2007, 46, 5670–5703.
19. Maham, A.; Tang, Z.; Wu, H.; Wang, J.; Lin, Y. Small 2009, 5, 1706–1721.
20. Zhang, X.; Reagan M. R.; Kaplan, D. L. Adv. Drug Deli. Rev. 2009, 61, 988–
1006.
21. Khadka, D. B.; Haynie, D. T. ACS Appl. Mater. Interfaces 2010, 2, 2728–2732.
22. Barnes, C. P.; Pemble, C. W.; Brand, D. D.; Simpson, D. G.; Bowlin, G. L. Tissue
Eng. 2007, 13, 1593–1605.
23. Minato, K. I.; Ohkawa, K.; Yamamoto, H. Macromol. Biosci. 2005, 6, 487–495.
24. Wu, G.; Morris, S. M. Biochem. J. 1998, 336, 1–17.

55
25. Ner, Y.; Stuart, J. A.; Whited, G.; Sotzing, G. A. Polymer 2009, 50, 5828–5836.
26. Huang, L.; McMillan, R. A.; Apkarian, R. P.; Pourdeyhimi, B.; Conticello, V. P.;
Chaikof, E. L. Macromolecules 2000, 33, 2989–2997.
27. Nivison-Smith, L.; Rnjak, J.; Weiss, A. S. Acta. Biomater. 2010, 6, 354–359.
28. Creighton, T. E. Protein: Structure and molecular properties 1993 2nd
edition.
29. Sugumar, V.; Munuswamy, N. Comp. Biochem. Physiol. 2007, 146, 291–298.
30. Dawson, R. M. C.; Elliott, D. C.; Elliott, W. H. Data for biochemical research et
al. 3rd
edn, Clarendon Press, 1989.
31. Shang, S.; Yang, F.; Cheng, X.; Walboomers, X. F.; Jansen, J. A. Eur. Cells
Mater. 2010, 19, 180–192.
32. Fong, H.; Chun, I.; Reneker, D. H. Polymer 1999, 40, 4585–4592.
33. Matthew, J. A.; Simpson, D. G.; Wnek, G. E.; Bowlin, G. L. Biomacromolecules
2002, 3, 232–238.
34. Zhang, Y. Z.; Venugopal J.; Huang, Z. M.; Lim, C. T.; Ramakrishna, S. Polymer
2006, 47, 2911–2917.
35. Deitzel, J. M.; Kleinmeyer, J. M.; Hariris, J.; Beek, D.; Tan, N. C. Polymer 2001,
42, 261–272.
36. Sung, H. W.; Chang, W. H.; Ma, C. Y.; Lee, M. H. J. Biomed. Mater. Res. 2003,
64, 427–438.
37. Kim, S. H.; Nam, Y. S.; Lee, T. S.; Park, W. H. Soc. Polym. Sci. Japan 2003, 35,
185–190.
38. Park, K. E.; Jung, S. Y.; Lee, S. J.; Min, B. M.; Park, W. H. Int. J. Biol.
Macromol. 2006, 38, 165–173.
56
39. Haynie, D. T.; Balkundi, S.; Palath, N.; Chakravarthula, K.; Dave, K. Langmuir
2004, 20, 4540–4547.
40. Zhi, Z.; Haynie, D. T. Macromolecules 2004, 37, 8668–8675.
41. Arap, W.; Pasqualini, R.; Ruoslahti, E. Science 1998, 279, 377–380.
42. Haris, P. I; Chapman, D. Biopolymers 1995, 37, 251–263.
43. Li, M.; Mondrinos, M. J.; Gandhi, M. R.; Ko, F. K.; Weiss, A. S.; Lelkes, P. L.
Biomaterials, 2006, 26, 5999–6008.
44. Rihova, B. Adv. Drug Del. Rev. 1996, 21, 157–176.
45. Khadka, D. B.; Haynie, D. T. ACS Appl. Mater. Interfaces 2011, 3, 2994–3001

57
CHAPTER 5
STRUCTURE, COMPOSITION AND ELECTRICAL PROPERTIES OF
POLYPEPTIDE ELECTROSPUN NANOFIBER
5.1 Introduction
Electrospun fiber mats hold out promise for realizing perceived advantages of
nanostructured materials in many areas, including medicine and biotechnology. Fibers
can be made of biocompatible and biodegradable synthetic organic polymers. Such
polymers include poly(lactide-co-glycolide) and poly(caprolactone). Interest in
electrospun materials for in vitro tissue culture coatings, in vivo medical implant device
coatings and other applications is now global and likely to continue growing for the
foreseeable future.1–4
Investigators have taken a variety of approaches to increasing the desirability of
electrospun materials for biomedical applications and reducing the environmental
footprint of materials production.2–7
In some cases, the polymers were polypeptides (see
reference 7 for a recent review). Whether natural or biomimetic, whether pure or blended
with synthetic organic polymers, these polymers can provide further advantages for
compatibility, degradability, absorbability and, crucially, functionality. Most polypeptide
electrospinning studies have involved purified proteins that require an organic solvent for
chain entanglement.7 Lately, interest has grown in polymer electrospinning from
58
aqueous feedstocks.5,7,8
Model polypeptides that have a simple amino acid sequence or
composition, display little persistent structure in aqueous solution under usual conditions
and therefore tend to be non-immunogenic are also receiving increasing attention
(reviewed in reference 7). Such peptides can represent different degrees of biomimicry in
terms of amino acid composition and sequence and functional properties. In any case, the
diameter of polypeptide fibers typically ranges from 100 nm to 2 μm, though thinner and
thicker fibers are spun.
It is generally held that quantitative analysis of the physical properties of
feedstock solutions, the electrospinning process and the resulting fibers will lead to
advances in electrospinning technology. Deitzel et al., Yarin et al. and Minato et al., for
example, have studied the relationship of process variables to chain conformation and
fiber spinnability, bending instability, diameter and morphology.9-11
Hohman et al.,
Fridrikh et al. and He et al. have developed theoretical models of electrospun fibers, fiber
diameter and fiber stability.12-14
The primary aim of the present study was to produce a
quantitative description of physical properties of polypeptide fibers on a wettable solid
support.
The synthetic model polypeptides PLO and PLEY have now been analyzed in
greater depth than in our previous work.4,6
CD and FTIR have been utilized to obtain
structural information on these polymers in aqueous solution, cast films and fibers. Fiber
composition has been analyzed by EDX. Protein adsorption has been analyzed by
quantitative fluorescence microscopy. A model of key electrical properties of fibers has
been described and compared to literature values for the corresponding properties of glass
and cells. The surface energy of the fibers has been analyzed and compared to values for
59
various cell culture materials. The results of this work are relevant to applications of
electrospun materials in medicine and biotechnology, for example, tissue engineering
scaffolds and wound healing biomaterials.
5.2 Materials and methods
All processes were carried out at ambient temperature and humidity unless
indicated otherwise. All fiber mat properties were measured in situ on a glass substrate.
PLO (153.5 kDa by viscometry and 196.8 kDa by multiple-angle laser light
scattering) and PLEY (20–50 kDa by viscometry) were used as model polypeptide for
electrospinning. For PLO, MV/MN ≈ 1.3 and MV/MN was probably less than 20% higher.
For PLEY, if the number density of polymers was uniform, MN = 35.0 kDa, MW = 37.3
kDa, MV = 37.1 kDa. Typical synthetic materials have MW/MN ≈ 4, a value that is often
improved by size-exclusion chromatography and polymer fractionation.15
The
polydispersity of PLO or PLY is rather unlikely to have influenced the present results.
The counterions were Br− for PLO and Na
+ for PLEY. Aqueous feedstocks for
electrospinning were prepared by dissolving as-received peptide in deionized water (40%
w/v or 2 mM polymer, and 50% w/v or 14 mM polymer, respectively). The feedstock
solutions will therefore have consisted of three main components: water (and its ionized
forms), ionized polypeptide and counterions. Fibers were prepared as described
previously in the general method section.4,6
The feedstock flow rate was not regulated.
Two methods were utilized for in situ polymer crosslinking at ambient
temperature: Exposure to glutaraldehyde vapor (25% w/v in water; Sigma) for PLO, and
immersion in 50 mM 1-ethyl-3-(3-dimethylaminopropyl) carbodiimide (EDC; Thermo

60
Scientific, USA) in 90% ethanol/10% water for PLEY.4,6
Relevant details of the
chemistry now follow. The symmetrical glutaraldehyde molecule will have reacted with
amino groups in two ornithine side chains or, with much lower probability, N-termini,
yielding no change in the number of amide groups present. As to EDC, a symmetrical
diimide, the most likely reaction in this study will have involved the carboxylate moieties
of two glutamic acid side chains. The resulting acid anhydrides, however, will have been
unstable in aqueous solution. Formation of a stable crosslink, a peptide bond, will have
required an EDC molecule to react with a glutamate side chain and the resulting O-
acylisourea intermediate with an amino terminus; N-termini are the only amino groups in
PLEY. The byproduct of this reaction will have been a soluble urea derivative.
Additional stable crosslinks may have formed between the phenolic oxygen atoms
of tyrosinate residues and N-termini, albeit with lower probability. Following
crosslinking, PLO and PLEY fiber mesh samples were rinsed extensively with aqueous
solution at neutral pH. Residual O-acylisourea intermediates, whether formed with
glutamic acid or tyrosine, will have been unstable in aqueous solution; N-
hydroxysulfosuccinimide (sulfo-NHS) was not utilized for intermediate stabilization;
failure to react with an amine will have resulted in hydrolysis, regenerating glutamate or
tyrosinate and releasing an N-unsubstituted urea molecule to solution.
Model proteins were assayed for adsorption onto fibers versus glass. Visualization of
adsorbed material was enabled by labeling with fluorescein isothiocyanate (FITC), which is
selective for free amino groups; no sulfhydryl groups were present. The test species were
serum proteins, FITC-labeled hen egg white lysozyme (FITC-HEWL; Sigma) in phosphate-
buffered saline (PBS) and FITC-labeled bovine serum albumin (FITC-BSA; Sigma) in PBS.

61
For PLEY, fibers and serum proteins were labeled in situ; HEWL and BSA, ex situ. For
PLO, serum proteins, HEWL and BSA were labeled ex situ.
All labeling reactions were carried out overnight at 4 °C, the dye concentration was 1
mg/mL in dimethylsulfoxide, and the buffer was 20 mM sodium carbonate, pH 9. For
HEWL and BSA labeling, the protein concentration was 2 mg/mL. Carbonate buffer was
diluted 1:100 in PBS after labeling, and the final protein concentration was adjusted to 2
mg/mL, the approximate concentration of BSA in cell culture medium; 10% fetal bovine
serum (FBS) has a protein concentration of 3–4.5 mg/mL, and the concentration of BSA
is 0.69–1.52 mg/mL.16
For direct labeling of PLEY fibers, FITC will have reacted with
free amino termini. Non-specific adsorption of FITC onto fibers or glass may also have
been strong enough to remain bound after rinsing. For PLO fibers, too many free amino
groups were present in side chains for direct labeling. Some PLEY fiber samples were
incubated overnight with fibroblast culture medium (Lonza, USA) supplemented with
10% FBS. These samples were then rinsed with PBS and labeled with FITC as described
above. FITC will have reacted with free amino groups on bound serum proteins and
amino termini in fibers. All fiber samples were rinsed with deionized water for
visualization and image capture by fluorescence microscopy. Other detail spectroscopy
and microscopy are described general method section in Chapter 2
5.3 Results
PLO and PLEY chains will have been extensively ionized in water at 25 °C and
neutral pH.17,18
Both polymers adopted a mostly random coil conformation under these
conditions, according to analysis by CD (Figure 5.1). Evidence is provided by the large

62
narrow absorption band near 205 nm, which is a general indicator of a disordered
polypeptide backbone, and by the absence of a negative band in the 210–220 nm range,
which would be expected for α helix or β sheet.19
The main difference between the PLO
and PLEY spectra is the contribution of the tyrosine rings in PLEY. The molar
absorptivity of the tyrosine side chain is ca. 8000 M−1
cm−1
at 225 nm, and this can
influence the CD signal to within about 25 nm of the center of the band.20,21
What is
important here is that both polymers were mostly unstructured in the aqueous feedstock.
Figure 5.1 Far-UV dichroic spectra of polymers in water. Poly(ornithine) (red),
poly(glutamic acid, tyrosine) (black). The polymer concentration, 0.02 mg/mL in each case,
was ca. 2000× lower than for electrospinning. Reprinted with permission from Haynie et
al.51
copyright ©2012 Polymers.

63
Electrospinning the polymer solutions represented by Figure 5.1 produced fibers
represented by the scanning electron micrographs shown in Figure 5.2. Panels a and b
show PLEY fibers before and after crosslinking; panels c and d, PLO fibers. Fiber
diameter ranged from ~0.1 to several microns, based on analysis of digital micrographs.
Mat thickness, a function of the fiber production rate and time, was always under 50 μm
here. There was no obvious change in fiber morphology on crosslinking.
Analysis of the amide I region of the IR spectra of fibers prepared as in Figure 5.2
showed that most polymers were in a random coil conformation prior to crosslinking, in
PLO and in PLEY. Key differences were evident, however, on closer comparison.
Resonances in the amide I region are primarily due to stretching vibrations of main-chain
carbonyl groups. For PLEY, the close similarity of the fiber spectrum to the cast film
spectrum suggests that molecules lacked a preferred orientation in fibers and, therefore,
that polymer chains in the fiber interior had little regular structure (Figure 5.3a).
Some residues evidently adopted a β sheet conformation prior to crosslinking,
however, based on the amplitude, resolvability and width of absorbance bands in the
amide I region, especially near 1651 cm−1
(coil), 1617 cm−1
(β sheet) and 1681 cm−1
(turn).22,23
β sheets are characterized by hydrogen bonds formed between polymer
backbone amide groups and carbonyl groups. Here, β sheet formation will presumably
have made a favorable contribution to the enthalpy of the polymer system during solvent
evaporation; it may also have influenced the entropy by releasing to bulk solution and
then to the vapor phase water molecules initially hydrogen bonded to donors and
acceptors in the polymer backbone.

64
(a)
(b)
(c)
(d)
Figure 5.2 Fiber mat morphology. PLEY: (a) Non-crosslinked; (b) Crosslinked. PLO: (c)
Non-crosslinked; (d) Crosslinked. All micrographs were obtained at 1400× magnification
and 30 kV accelerating potential. Reprinted with permission from Haynie et al.51
copyright ©2012 Polymers.
Crosslinking is necessary to make PLEY fibers and PLO fibers water-insoluble.4,6
For PLEY, the EDC crosslinker will have reacted with the carboxylate group in a

65
glutamate side chain and an N-terminal amino group. This will have increased the
number of peptide bonds present, but only by a maximum of 1 per polymer chain; a mere
0.5% rise in the number of carbonyl groups contributing to the amide I spectrum for the
PLEY molecules of this study. The β-sheet bands around 1617 cm−1
and 1682 cm−1
decreased and the random-coil band around 1651 cm−1
increased on crosslinking. The
large change in shape of the amide I envelope (Figure 5.3a) must therefore be due to a
large change in the average conformation of polymers in the fibers—despite a lack of
change in fiber morphology (Figure 5.2a,b). The crosslinking reaction evidently
decreased the ability of PLEY molecules to form β sheets in fibers. Rinsing crosslinked
fibers in aqueous solution will presumably have reversed any changes in the average
backbone conformation of PLEY due to ethanol, the solvent for EDC. The spectral
changes on crosslinking were internal to the fibers.
(a)
(b)
Figure 5.3 Infrared analysis of cast films and fibers. Cast film (red), fibers (blue) and
crosslinked fibers (black). All but the amide I envelope was subtracted from the spectra during
baseline treatment. (a) PLEY; (b) PLO. There is a vertical offset of 0.05 between the spectra in
this panel. Reprinted with permission from Haynie et al.51
copyright ©2012 Polymers.

66
Figure 5.4 Energy-dispersive X-ray spectroscopic analysis of fibers. Spectra of glass,
PLEY fibers on glass and PLO fibers on glass. Note the relative sizes of the oxygen,
sodium and silicon peaks. The silicon peak occurs at ca. 1.8 keV. In the fibers samples,
the silicon peak is lost in the noise; bare glass contributes relatively little to the measured
values; the most prominent peaks are for carbon and oxygen (PLEY and PLO), sodium
(PLEY) and bromide (PLO). Reprinted with permission from Haynie et al.51
copyright
©2012 Polymers.
As to PLO, crosslinking depended on the reactivity of side chains, just as for
PLEY. Each end of a glutaraldehyde molecule will have reacted with a side-chain amino
group, forming an imine. Unlike PLEY, PLO showed almost no difference between the
cast film, fiber and crosslinked fiber spectra (Figure 3b). The largest peak in the spectra, at

67
1651 cm−1
, can be assigned to random coil. A second large peak, at ca. 1640 cm−1
, may be
due to α helix. Both peaks are very broad, consistent with both a broad range of dihedral
angles in any secondary structure present and limited thermostability.22
In any case, most
residues had random backbone dihedral angles in PLO fibers and in PLEY fibers after
crosslinking.
Both PLO and PLEY fibers display considerable post-spinning stability in dry air
in the absence of crosslinking.4,6
This alone implies that counterions will be present
inside the fibers, which would otherwise be very unstable due to charge repulsion. EDX
analysis has confirmed this view (Figure 5.5). For PLEY, the relative abundance of
carbon, oxygen and sodium atoms was respectively 62.3%, 56.7% and 15.4% for the
fiber sample on glass and 6.4%, 44.4% and 3.9% for the glass control. The abundance of
silicon was 9.1% and <1%, respectively. These measurements translate into atomic ratios
of 16.3 for C:N, 1.1 for C:O and 4.1 for O:Na for PLEY fibers on glass. The
corresponding data for PLO are shown in spectral form in Figure 5.4.
The EDX results can be compared with predictions based on polymer structure.
For PLEY, for instance, there were 30 C atoms for every 5 of N, 14 of O and 4 of Na,
assuming complete ionization of glutamic acid side chains, no ionization of tyrosine side
chains and complete charge compensation by counterions. The corresponding ratios are
6 for C:N, 2.1 for C:O and 7.5 for C:Na. The difference from the corresponding measured
value may be attributed to a deviation of Glu:Tyr from 4.0:1.0, incomplete side chain
ionization, incomplete removal of excess Na+ from PLEY prior to lyophilization or
substitution of H3O+ for Na
+ in PLEY fibers. PLO could not be analyzed in this way

68
because the extent of crosslinking was not determined. The main point here is that Na+
was abundant in PLEY fibers and Br− was in PLO fibers.
Serum protein adsorption onto the surface of a biomaterial influences the foreign
body response and therefore clinical complications arising from implantation. Protein
binding affinity to a material is determined by Coulomb forces and van der Waals
interactions. Adsorption of the model proteins HEWL and BSA and serum proteins onto
PLEY fibers and PLO fibers has been studied here. Unmodified HEWL has an
isoelectric point of 11.5 and therefore a positive net charge at neutral pH; BSA has an
isoelectric point of 4.7 and therefore a negative net charge at neutral pH.24,25
Limited
FITC labeling will not have altered either isoelectric point by a significant margin.
Figure 5.5a shows PLEY fibers after direct labeling with FITC. Dye molecules
will have become conjugated to N-termini still available after EDC crosslinking or bound
non-specifically to fibers or glass. PLEY fibers were scarcely more densely coated with
FITC-labeled serum proteins than was the glass substrate, according to Figure 5.5b.
Many of the proteins adsorbed onto fibers will have been positively charged by virtue of
ionized lysine residues. This amino acid, which has a primary amino group in the side
chain, is labeled by FITC. The high background staining evident in panels a and b can be
attributed to in situ labeling and non-specific FITC adsorption. Contrast in the FITC-
BSA micrograph (Figure 5.5c) is comparatively high, and the overall signal intensity is
low. This suggests that BSA had greater affinity for fibers than glass, despite the
negative charge on PLEY. BSA is well-known to be “sticky”, to bind non-specifically to
many materials; the hydrophobic component of binding may have been greater for fibers

69
Figure 5.5 Protein adsorption onto fibers or glass. Proteins became deposited during
overnight incubation at 37 °C. Bright-field images have been inverted and equalized to
increase contrast; there was no processing of the fluorescence micrographs. (a, a’)
Fluorescein (FITC)-labeled PLEY fibers. (b, b’) FITC-labeled proteins on PLEY fibers.
(c, c’) FITC-bovine serum albumin on PLEY fibers. (d, d’) FITC-hen egg white
lysozyme on PLEY fibers. And (e) Grayscale histogram of pixel intensities for
fluorescence micrographs in (a–d). Reprinted with permission from Haynie et al.51
copyright ©2012 Polymers.
0
10000
20000
30000
40000
0
30
6
0
90
1
20
1
50
1
80
Pix
el c
ou
nt
Pixel grayscale value
Fiber
Medium
BSA
HEWL
a
a
b c d
a’ b’ c’ d’
e
70
than glass. Panel d shows the result of incubating FITC-HEWL with PLEY fibers. This
cationic protein was expected to bind both PLEY fibers and glass. The contrast between
fibers and glass was correspondingly low. A hydrophobic contribution to HEWL binding
cannot be excluded. Similar results were obtained for PLO binding to fibers.
Figure 5.5 summarize the fluorescence data for PLEY fibers (panels a–d) and
PLO fibers (panels e–g) and quantify fluorescence as distributions of pixel intensities.
BSA binding to PLEY fibers resulted in a high frequency of low grayscale values (light
intensities). This makes sense because both BSA and PLEY were anionic in the
experiments. The maximum in the BSA distribution was at a much higher grayscale
value for PLO fibers. Just the opposite was found for HEWL, which was cationic in the
experiments.
The inward spikes in the BSA profile in Figure 5.5i are image processing artifacts
that arose from increasing the contrast between the fiber signal and the glass signal; the
shape of the envelope was not altered. The protein adsorption data are
substantiallyexplained by the sign of charge of the glass, the sign of charge and relative
charge density of the fibers and the sign of charge of the model proteins. Evidently,
serum contains proteins that will bind to either positive fibers or negative fibers having
the surface density of charge of the fibers studied here.
5.4 Discussion
Chain entanglement is a major requirement for fiber spinning from a polymer
feedstock.26
Here, the feedstock concentration was ~40% (w/v) for PLO and ~50% for

71
PLEY. The corresponding concentration of small counterions was ~1 M in each case,
assuming the charge per residue at neutral pH was ca. +0.8 for PLO and ca. −0.8 for
PLEY.27
Charge repulsion between polymer molecules will have been significant,
though at close range only. Such considerations suggest that PLO chains and PLEY
chains will behave as statistical coils in aqueous solution at neutral pH below the
solubility limit.
The spectral data in Figure 4.1 show that PLO formed little helical structure in
water at neutral pH. Even at strongly basic pH, PLO will adopt only a modest amount of
helical structure, even though PLL, which differs from PLO by just one extra methylene
group in the side chain, converts to helix when the side-chain amino groups are
deionized.17
Poly(glutamic acid) forms α-helical structure at acidic pH, where the side-
chain carboxyl groups are deionized, but the polymer is mostly unstructured at neutral
pH, where the side chains are protonated.18
PLEY, like poly(glutamic acid), displayed a
random coil-like conformation in water at neutral pH (Figure 5.1).
Polymer conformation in solution may be compared with conformation in a cast
film or in fibers. The IR data in Figure 3 indicate that a large proportion of residues in
PLEY molecules participated in β-sheet structure in the cast film and in fibers prior to
crosslinking. Bands at 1617 cm−1
and 1681 cm−1
support the claim. Similarities and
differences with respect to globular proteins and amyloid fibrils are worth mentioning
here for the sake of interpreting the IR data. In a recent study by Zandomeneghi et al., for
example, amide I’ data were reported for transthyretin, a β-sheet protein.28
(The
measurements were made in D2O rather than water; the change in isotope will have had

72
little effect on the shape of the distribution of stretching vibrations of main-chain
carbonyl groups.)
The native protein in solution displayed a broad amide I’ envelope with a
maximum at 1630 cm−1
. Fibrils of this protein, by contrast, showed a large and narrow
band at 1615 cm−1
and a corresponding peak of lower intensity at 1684 cm−1
, similar to
amyloid fibrils. A close resemblance of the transthyretin fibril and amyloid fibril IR
bands to the PLEY data in Figure 3 is evident. Zandomeneghi et al. further interpreted
their results as follows. β-sheet residues will have greater structural homogeneity in the
core of amyloid fibrils than in native proteins. Amyloid fibrils correspond to very low
free energy states, much deeper than the potential wells of native proteins, even if the
polymers are kinetically trapped in amyloid material.
A large right-handed β-sheet twist angle correlated with a high wavenumber
maximum for the amide I’ band, and the amide I’ band wavenumber maximum correlated
with the average number of strands per β sheet in transthyretin. Protein structure analysis
by Richardson concluded that β sheets with fewer strands tend to have larger average
twist angles.29
No significant shift in the amide I band of the β-sheet protein lithostathine
occurred on oligomerization into non-amyloid fibrils.30
Zandomeneghi et al. proposed on
these grounds that IR analysis, and more specifically a shift of the amide I band from
about 1630 cm−1
to about 1615 cm−1
and the simultaneous appearance of a band at about
1684 cm−1
, could be a diagnostic for amyloid fibril formation.28
The data in Figure 5.3 show that bands at 1615 cm−1
and 1684 cm−1
are not
unambiguous indicators of amyloid fibril formation. The band shift from about 1630
cm−1
to about 1615 cm−1
merits further attention for reasons that will become evident

73
presently. Dimerization of a carboxylic acid, for example, propanoic acid in CCl4, can
decrease the vibrational frequency of the carbonyl oxygen by as much as 45 cm−1
.31
A
low wavenumber maximum for a β sheet, as in transthyretin fibrils and PLEY cast films
or fibers, may therefore represent an average structure in which backbone hydrogen
bonds deepen the free energy well more than in native proteins.
The energetic unfavorability of an increased average twist angle in a β strand in a
native protein can apparently be more than offset by other kinds of interaction, for
example, hydrophobic contacts between side chains. Such interactions are less probable
in a cast film or electrospun fiber of PLO or PLEY, because the amino acid sequence
diversity of these molecules is vastly lower than in a protein-encoding polypeptide and
there are therefore vastly fewer distinguishable ways in which side chains can pack
together, especially under the constraint of forming a large number of energetically
significant interactions with counterions, as in the present study (Figure 5.4). PLEY
chain oligomerization was presumably uncoordinated and in any case rapid during the
dehydration of polymer jets or cast films. Both processes were nevertheless sufficient to
give rise to resonances near 1615 cm−1
and 1680 cm−1
(Figure 5.3). Therefore, these
bands cannot be considered unambiguous markers of amyloid fibrils. Further, PLEY
residues in a β sheet conformation are likely to have but modest average right-handed
twist angles. It is less clear whether the available fiber data also provide evidence for a
relatively large average number of strands per β sheet.
The data in Figure 5.3 also show that the EDC crosslinking reaction disrupted the
β sheets formed between PLEY molecules during fiber production or further dehydration
on the collector. The enthalpy of hydrogen bond formation will be relatively small, ~4
74
kJ/mol, close to thermal energy at 25 °C.32
In PLEY fibers, perhaps 1 in 4 of all residues
was in a β sheet conformation prior to crosslinking, judging by the area of the resonance
at 1617 cm−1
vis-à-vis the total area of the amide I envelope. The distribution of β-strand
lengths was probably broad, some chains of ideal backbone geometry will not have
formed a β sheet, some β sheets will have comprised non-ideal backbone angles, and the
composition of individual β sheets will probably have fluctuated more rapidly than in
amyloid fibrils. It is probable that the mean number of consecutive residues in a β strand
was modest for the same reason that many relatively small α helices are more probable
than one long helix in a long chain of PLL or PLE Entropy maximization.33
It is likely,
therefore, that little energy was required to disrupt most β sheets in PLEY fibers during
EDC crosslinking. This energy will have been provided by thermal fluctuations and,
possibly, the interaction of ethanol with the fibers. It was not determined whether
crosslinking involved polymers throughout the fiber or only on the fiber surface.
Elementary electrical properties of PLO and PLEY fibers are usefully discussed
here for the sake of interpreting the data in Figure 5.5. Such properties are of interest not
only for their own sake but also for a variety of potential applications of electrospun
materials. The surface charge density and the sign of the net charge of a fiber mat could
determine its utility, for instance, for ion exchange in a filter application or for protein
adsorption in a tissue culture scaffold application or an implantable biomaterial
application. Cell-substrate interactions in serum-supplemented tissue culture in vitro are
relevant to cell adhesion, proliferation, morphology, activation, differentiation and
senescence.34
In vivo, serum protein adsorption onto a biomaterial plays a crucial role in

75
the foreign body response, leading in turn to the broad range of clinical complications
associated with device implantation.35
The surface charge density for glass and for fibers can be compared as follows.
The properties of glass are relevant here because it was the material on which fibers were
collected in the present study. For glass in contact with deionized water, the effective
charge density is ~2 × 10³ electronic charges μm
−2.36,37
This value will be lower in a
physiological buffer, for example cell culture medium, which has a high ionic strength.
As to fibers, assuming a density matching that of small globular proteins (~1.45 g/cm3),
the outermost 5 Å of a 1 µm radius fiber (confer Figure 5.2) with a length of 1 µm will
have a mass of ~4.4 fg.38
(The thickness of the fiber surface in which side chains will
contribute to the net charge of the fiber must be estimated in the absence of additional
data.) The mass fraction of Glu in PLEY is 0.79 (assuming complete charge
compensation with Na+), giving ~14 × 10
6 Glu side chains on the surface per 1 μm of
fiber. The surface density of charge will then be ~2.2 × 10⁶ electronic charges μm
−2. This
value should probably be taken as an upper bound, as the fibers are not likely to be as
dense as small globular proteins, even after crosslinking, a small proportion of glutamic
acid side chains will be lost on EDC crosslinking, and some unreacted glutamate side
chains may be protonated, even at pH 7.4. The surface charge density will be of similar
magnitude for PLO, but of course the sign of charge must be just the opposite. The point
here is that the surface charge density on a PLO fiber or a PLEY fiber will be greater than
the surface charge density on glass.
Now, σG ≈ σF/1100, where the subscripts signify glass and fiber. Taking the
nominal diameter of a well-spread adhesive cell to be 50 μm, the charge on the

76
corresponding surface area of glass will be QG ≈ (2 103 electronic charges/μm
2)/[π (25
μm)2] ≈ 1 electronic charge. QF ≈ 1100 electronic charges for the same surface area. The
field strength in air due to glass will be EG = σ/ε ≈ 3.6 10−5
N/C at any distance from the
surface (the field lines will be perpendicular to the surface and parallel to each other to
the extent that glass is planar) and the field strength due to a fiber with a radius of 1 μm
will be EF ≈ 4000 10−5
N/C at the fiber surface. The fields will be about 80-fold
smaller due to water, which has a high relative permittivity, and smaller still and strongly
distance-dependent with salt present, as in cell culture medium, due to Debye-Hückel
screening; the Debye length, the distance over which the electrical potential falls by a
factor of 1/e, is ~1 nm for a 1:1 electrolyte solution at 100 mM. In summary, thicker
fibers will influence the local electric field more than thinner fibers, but only close to the
fiber surface; charge screening will ensure that the field is negligible farther away.
Five points of contact between the foregoing electrostatic calculations, the
experimental results of this work and cell culture applications of electrospun fibers will
now be discussed in turn. One, the calculated upper bound on the surface charge density
of PLEY or PLO fibers was ~2.2 × 10⁶ electronic charges μm
−2 (~3.5 × 10
−13 C/μm
2).
Surface charge is known to influence different aspects of adhesive cell behavior. The
molecular composition of the membrane (sialic acid is a major contributor) and the pH
and composition of the surrounding medium together give cells a negative surface
charge.
Curtis et al. have observed that, whereas surfaces bearing cations are very
adhesive for cells, adhesion of red blood cells on anionic surfaces decreases as charge
density decreases.39-41
This suggests that nucleated cell adhesion could be greater on

77
fibers than glass after topographical differences were accounted for. Separate work has
found that fibronectin, a prominent component of the extracellular matrix and serum,
undergoes a transition from monolayer to multilayer adsorption on sulfonated
poly(styrene) at a surface charge density above 3 × 10¹⁰
C/μm2 and forms fibrillar
networks beyond 8 × 10¹⁰
C/μm2.42
These charge density values are many orders of
magnitude greater than the calculated charge density of PLEY fibers or PLO fibers, so
monolayer adsorption of fibronectin and other serum proteins is probable.
Two, if a cell can sense the electric field of glass, the cell may also be able to
distinguish between PLEY or PLO fibers of different diameter. Surface charge density
will be largely independent of fiber diameter, because the typical fiber radius is much
greater than the length scale of an amino acid side chain. The net surface charge on a
given length of fiber will therefore be higher for a thick fiber than a thin one, and the
electric field will be higher for the thick fiber at the same perpendicular distance from the
fiber axis. The mechanisms whereby a cell might detect differences in surface charge
density are not well understood (see below).
Three, anionic fibers will attract not only Na+ and other small counterions but also
cationic serum proteins (Figure 5.5). The serum proteins that became bound to fibers or
glass during overnight incubation with culture medium therefore depended on the
composition of serum. The binding affinity and therefore the equilibrium ratio of bound
versus free proteins will have varied with the net charge on the proteins at neutral pH. A
cluster of acidic or basic residues on a protein may also have influenced binding,
enabling an anionic protein, say, to bind an anionic fiber. Many adhesive cells, including
fibroblasts, attach more readily to poly(lysine)-coated glass than glass, and PLO fibers

78
will presumably attract anionic serum proteins as readily as PLEY fibers bind cationic
serum proteins. The data in Figure 5.5 are consistent with this view.
Four, application of a static external electric field to fibroblasts in aqueous cell
culture medium reportedly makes them elongate, orienting their bodies, actin stress fibers
and microtubules perpendicular to the direction of the field.43
Within the aqueous
medium, the field will be small, owing to the polarizability of water, and there will be a
current of mobile ions. The presumed cellular mechanisms involved in responding to the
applied field are varied and complex: Interactions with sensors located at the cell
membrane, the iontophoresis of receptors, channels and other molecules, and the
separation of charged membrane components are possible explanations.44
Cell
reorientation on application of an external field of 5 V/cm is essentially complete after 3
h. This field, it should be noted, is ~3 orders of magnitude larger than that calculated for
PLEY fibers or PLO fibers in air.
Five, many cells, including fibroblasts, display net migration toward the cathode,
the negative pole of an applied external field. Directed fibroblast migration occurs at
applied fields as low as 0.1 V/cm in three-dimensional collagen gels but not conventional
two-dimensional culture.45
This field magnitude is thought to be relevant to embryonic
development, healthy epithelial tissue function and wound healing in response to
epithelial cell disruption.46,47
For comparison, cell electroporation for drug delivery is
achieved with external fields ~105 larger, and the electric field on the surface of a PLEY
or PLO fiber in air is ~103 smaller.
48 PLEY is negatively charged.
The surface charge density calculation for PLEY or PLO fibers may be utilized to
estimate the maximum surface charge density on a protein or peptide fiber in the absence

79
of post-translational modification. The qualification is needed because phosphorylation
of side chains can significantly change the net charge on a protein. The mass fraction of
glutamic acid in a PLEY fiber is ~0.8. What if fibers were made of polypeptides that
were completely ionized? Taking 5 Å within the fiber surface as the limit for
uncompensated side chain ionization, the maximum charge density would be
~3 × 10⁶ electronic charges μm
−2 for a mass density like that of a small globular protein.
Essentially the same value is obtained by different reasoning. Let all polymer molecules
on a polypeptide fiber surface have anti-parallel β-sheet geometry, neglect backbone
twist, and let the surface formed by the β sheet coincide with the surface of the fiber.
Successive side chains will point above and below the fiber surface. There will be ~1
electronic charge for every 30 Å of surface, or 3.3 × 10⁶ electronic charges μm
−2. The
value found above for the surface charge density of PLEY or PLO fibers, ~2.2 × 10⁶
electronic charges μm−2
, is therefore of the same order of magnitude as the theoretical
maximum on a protein- or peptide-based material. These values may be compared with
experimental data for cells. The surface charge density on red blood cells is ~2.8 × 10⁵
electronic charges μm−2
, and for other eukaryotic cells it is as high as ~1.3 × 10⁸ electronic
charges μm−2
.49,50
The maximum protein fiber surface charge density approaches but
probably does not exceed the charge density of a membrane in a living cell. The
maximum value is unlikely to be realized in a living organism. For a strongly anionic
polypeptide could compete with DNA for DNA-binding proteins and thus interfere with
regulation of gene expression; and a strongly cationic polypeptide could form an
interpolyelectrolyte complex with DNA and thus interfere with gene expression and
possibly DNA replication, and it could disrupt membrane structure.

80
Finally, if the surface charge density of a PLEY or a PLO fiber does depend on
fiber radius, there are only two possibilities. A lower charge density for a thick fiber
would imply greater charge repulsion on a thin fiber closer to the structure-imposed limit
of surface charge density. This must be considered implausible. If the surface density of
ionizable groups is essentially independent of fiber radius, there will be a larger driving
force for side chain neutralization on a thin fiber, lowering the effective surface density
of charge. Therefore, the surface charge density can only be higher on a thick fiber. The
field of a thick fiber will in any case exceed that of a thin fiber at a given distance from
the fiber axis.
5.5 Conclusions
Key physical properties of polypeptides in solution and peptide-based electrospun
fibers on glass have been analyzed. PLEY and PLO were random coil-like in aqueous
solution, whereas in fibers and cast films, a large fraction of residues in PLEY but not
PLO adopted a β-sheet conformation prior to crosslinking. Significant IR absorption
bands near 1615 cm−1
and 1680 cm−1
were displayed by cast films of PLEY, so the bands
cannot be taken as unambiguous indicators of amyloid fibril formation. Crosslinking
PLEY fibers with a diimide reagent resulted in a large increase in irregular backbone
structure. The backbones of PLO molecules were irregular before and after crosslinking.
EDX analysis has confirmed that PLEY fibers contained Na+ and PLO fibers contained
Br−. The adsorption of model proteins onto PLEY fibers or PLO fibers on glass was
consistent with the net charge on the proteins and the relative surface charge density of
the fibers and the substrate at neutral pH. The electric field of a thick fiber is larger than

81
that of a thin fiber for a given surface density of charge and a given distance from the
fiber axis. Calculations showed that the maximum surface charge density on a peptide-
based material will be less than the charge density on the outer leaflet of the plasma
membrane of typical eukaryotic cells. The results, taken together, provide a foundation
for analyzing the behavior of adhesive cells on electrospun fiber mats on a wettable
substrate in the presence of serum. Such behavior is relevant to fiber mat applications in
biotechnology and medicine, for instance, in vitro tissue engineering, ex vivo stem cell
therapy, wound healing and biomaterial implantation.
5.6 References
1. Rutledge, G.C.; Fridrikh, S.V. Adv. Drug Deliv. Rev. 2007, 59, 13841391.
2. Sill, T.J.; von Recum, H.A. Biomaterials 2008, 29, 19892006.
3. Yoo, H.S.; Kim, T.G.; Park, T.G. Adv. Drug Deliv. Rev. 2009, 61, 10331042.
4. Khadka, D.B.; Haynie, D.T. ACS Appl. Mater. Interfaces 2010, 2, 27282732.
5. Agarwal, S.; Greiner, A. Polym. Adv. Technol. 2011, 22, 372378.
6. Khadka, D.B.; Cross, M.C.; Haynie, D.T. ACS Appl. Mater. Interfaces 2011, 3,
29943001.
7. Khadka, D.B.; Haynie, D.T. Nanomedicine 2012, in press.
8. Ner, Y.; Stuart, J.A.; Whited, G.; Sotzing, G.A. Polymer 2009, 50, 5828–5836.
9. Deitzel, J.M.; Kleinmeyer, J.; Harris, D.; Beck Tan, N.C. Polymer 2001, 42,
261272.
10. Yarin, A.L.; Koombhongse, S.; Reneker, D.H. J. Appl. Phys. 2001, 89,
30183026.

82
11. Minato, K.I.; Ohkawa, K.; Yamamoto, H. Macromol. Biosci. 2006, 6, 487495.
12. Hohman, M.M.; Shin, M.; Rutledge, G.; Brenner, M.P. Phys. Fluids 2001, 13,
22012220.
13. Fridrikh, S.V.; Yu, J.H.; Brenner, M.P.; Rutledge, G.C. Phys. Rev. Lett. 2003, 90,
114502:1–114502:4.
14. He, J.H.; Xu, L.; Wu, Y.; Liu, Y. Polym. Int. 2007, 56, 13231329.
15. Strobl, G. The Physics of Polymers; Springer: Berlin, Germany, 2007.
16. Zheng, X.; Baker, H.; Hancock, W.S.; Fawaz, F.; McCaman, M.; Pungor, E.
Biotechnol. Prog. 2006, 22, 12941300.
17. Chaudhuri, S.R.; Yang, J.T. Biochemistry 1968, 7, 13791383.
18. Wada, A. Mol. Phys. 1960, 3, 409416.
19. Greenfield, N.; Fasman, G.D. Biochemistry 1969, 8, 41084116.
20. Wetlaufer, D. Adv. Protein. Chem. 1962, 17, 303390.
21. Chakrabartty, A.; Kortemme, T.; Padmahabhan, S.; Baldwin, R.L. Biochemistry
1993, 32, 55605565.
22. Chirgadze, Y.N.; Nevskaya, N.A. Biopolymers 1976, 15, 637648.
23. Jackson, M.; Mantsch, H.H. Crit. Rev. Biochem. Mol. Biol. 1995, 30, 95120.
24. Imoto, T.; Johnson, L.N.; North, A.T.C.; Phillips, D.C.; Rupley, J.A. Vertebrate
lysozymes. In The Enzymes; Boyer, P.D., Lardy, H., Myrback, K., Eds.;
Academic: New York, NY, USA, 1972; pp. 665868.
25. Malamud, D.; Drysdale, J.W. Anal. Biochem. 1978, 86, 620647.

83
26. Shenoy, S.L.; Bates, W.D.; Frisch, H.L.; Wnek, G.E. Polymer 2005, 46,
33723384.
27. Doty, P.; Wada, A.; Yang, J.T.; Blout, E.R. J. Polym. Sci. 1957, 23, 851857.
28. Zandomeneghi, G.; Krebs, M.R.H.; McCammon, M.G.; Fändrich, M. Protein Sci.
2004, 13, 33143321.
29. Richardson, J.S. Adv. Protein Chem. 1981, 34, 167339.
30. Laurine, E.; Gregoire, E.; Fändrich, M.; Engemann, S.; Marchal, S.; Thion, L.;
Mohr, M.; Monsarrat, B.; Michel, B.; Dobson, C.M.; et al. J. Biol. Chem. 2003,
278, 5177051778.
31. Nyquist, R.A.; Clark, T.D.; Streck, R. Vib. Spectrosc. 1994, 7, 275286.
32. Baldwin, R.L. J. Biol. Chem. 2003, 278, 1758117588.
33. Poland, D.; Scheraga, H.A. Theory of Helix-Coil Transition Theory in
Biopolymers; Academic: New York, NY, USA, 1970.
34. Wozniak, M.A.; Modzelewska, K.; Kwong, L.; Keely, P.J. Biochim. Biophys.
Acta 2004, 1692, 103119.
35. Junge, K.; Binnebösel, M.; von Trotha, K.T.; Rosch, R.; Kling, U.; Neumann,
U.P.; Jansen, P.L. Langenbecks Arch. Surg. 2012, 397, 255270.
36. Squires, T.M.; Brenner, M.P. Phys. Rev. Lett. 2000, 85, 49764979.
37. Behrens, S.H.; Grier, D.G. J. Chem. Phys. 2001, 115, 67166721.
38. Fischer, H.; Polikarpov, I.; Craievich, A.F. Protein Sci. 2004, 13, 28252828.
39. Curtis, A.S.G.; Forrester, J.V.; McInnes, C.; Lawrie, F. J. Cell Biol. 1983, 97,
15001506.

84
40. Curtis, A.S.G. Prog. Biophys. Mol. Biol. 1973, 27, 317375.
41. Gingell, D.; Todd, I. J. Cell Sci. 1980, 41, 135149.
42. Pernodet, N.; Rafailovich, M.; Sokolov, J.; Xu, D.; Yang, N.-L.; McLeod, K.J. J.
Biomed. Mater. Res. A 2003, 64, 684692.
43. Harris, A.K.; Pryer, N.K.; Paydarfar, D. J. Exp. Zool. 1990, 253, 163176.
44. Poo, M. Annu. Rev. Biophys. Bioeng. 1981, 10, 245276.
45. Sun, S.; Wise, J.; Cho, M. Tissue. Eng. 2004, 10, 15481557.
46. Nuccitelli, R. Curr. Top. Dev. Biol. 2003, 58, 126.
47. Borgens, R.B.; Vanable, J.W., Jr.; Jaffe, L.F. Proc. Nat. Acad. Sci. USA 1977, 74,
45284532.
48. Mir, L.M.; Bureau, M.F.; Gehl, J.; Rangara, R.; Rouy, D.; Caillaud, J.M.; Delaere,
P.; Branellec, D.; Schwartz, B.; Scherman, D. Proc. Nat. Acad. Sci. USA 1999,
96, 42624267.
49. Hochmuth, R.M. J. Biomech. 2000, 33, 1522.
50. Kinraide, T.B.; Wang, P. J. Exp. Bot. 2010, 61, 25072518.
51. Haynie, D. T.; Khadka, D. B.; Cross, M. C. Polymers 2012, 4, 1535.

85
CHAPTER 6
MECHANISM OF STABILITY OF FIBERS ELECTROSPUN FROM PEPTIDES
WITH IONIZED SIDE CHAINS
4.1 Introduction
Electrospun non-woven materials have been a topic of fervent scientific and
technological interest since the mid-1990s.1-3
Research sub-topics have ranged from the
physics of the spinning process4,5
to mechanical properties of electrospun materials,6-8
chemical functionalization of electrospun materials9,10
and the interaction of biological
cells and tissues with electrospun materials.11,12
Mechanical properties of interest have
included the average diameter and tensile strength of individual fibers, and Young’s
modulus, porosity and strength at breaking of fiber mats.
Numerous synthetic organic polymers and feedstock solvents have been utilized
in an electrospinning context. Different polymers and processing conditions have been
found to yield materials of different physical properties. Nevertheless, little is known
about how to predict the properties of individual fibers and fiber mats from the
knowledge of polymer structure, feedstock solvent and necessary details of materials
processing. Making progress in this direction will surely require focusing attention on
model polymers and a detailed assessment of elemental contributions to macroscopic
properties.
86
Non-crosslinked polymers in an electrospun fiber will interact with each other by
a variety of non-covalent interactions. The relative importance of the interactions present
will of course depend on polymer structure and spinning conditions. Ion-ion, ion-dipole,
dipole-dipole, ion-induced dipole and dispersion interactions will span several orders of
magnitude of energy, from as high as ~50 kJ mol–1
for ion-ion interactions ~25 kJ mol–1
for ion-induced dipole interactions in a molecular environment. Ion-dipole and dipole-
dipole interactions will make a net positive or negative contribution to energy.
Dispersion interactions will range from 0 to ~40 kJ mol–1
in a molecular environment.
Non-covalent interactions will play a particularly important role in determining the
physical properties of thermoplastic elastomers. Quantifying the contribution of each
type of interaction to the overall physical properties of a polymer-based material must be
considered a formidable task, even when solvent molecules can be ignored and no
chemical crosslinks are present.
Crosslinking polymer chains by forming covalent bonds between them can
strongly influence the physical properties of individual molecules, bulk polymeric
materials and electrospun fibers. The bond energy will typically be in the 250-400 kJ
mol–1
range. Crosslinking will necessarily reduce the motional freedom of individual
chains, and it can convert a polymer liquid into a gel or a solid. The mechanical
properties of the crosslinked material will depend on the crosslink density. A low density
will decrease the viscosity of a polymer melt, whereas an intermediate density can result
in an elastomeric material and a high density will greatly increase rigidity. There will be
an upper limit on fiber stabilization by chemical crosslinking. The ability to control the
extent of crosslinking and environmental conditions could both provide insight on

87
mechanisms of fiber stability and increase the utility of a material for a specific
application.
A topic of concentrated effort within the electrospinning community in recent
years has been fiber mats made of proteins and polypeptides.13
Proteins are potentially
valuable from the point of view of function. Solubilization of proteins in an organic
solvent, however, which is usually needed to make them spinnable, typically destroys the
functional information that depends on three-dimensional structure. Peptide-based fibers
are potentially of value for a broad range of technological applications and for basic
research. Polymer structure can be changed by existing methods, and properties of the
corresponding peptide-based material can be determined. Two model synthetic peptides
for electrospinning research are PLEY and poly(L-ornithine).14,15
Both are extensively
ionized at neutral pH, both are mostly random coils in aqueous solution and fibers made
of these polymers readily dissolve in water in the absence of covalent crosslinks.16
In the present work, PLEY was adopted as a model polymer for analysis of fiber
stability. Crosslink density was quantified by a visible wavelength dye-based method.
The stability of crosslinked fibers and the variability in their morphology and elemental
composition were assayed in the pH 2-12 range by microscopy and EDX. The results
were interpreted with reference to UV photon absorption and fluorescence emission by
PLEY chains in the same pH range.
4.2 Materials and methods
PLEY (20-50 kDa by viscometry) was synthesized in solution and obtained from
Sigma (USA) as a lyophilized polydisperse salt. The polydispersity index was ~1.1;16

88
Figure 6.1 PLEY structure. A) Side chains. Both are ionizable. The nominal pKa values
are 4.1 for glutamic acid (Glu) and 10.5 for tyrosine (Tyr). The right-most atom of the
right-most bond is the Cα in each case. B) Backbone. R1 and R2 represent side chains.
There is considerable freedom of rotation about the torsion angles φ and ψ but very little
about ω, owing to electron delocalization in the peptide group (CONH). Each residue
will contribute ~0.36 nm to the contour length of the polymer. Reprinted with permission
from Haynie et al.33
copyright © 2013 WILEY-VCH.
polydispersity is rather unlikely to have influenced the present results. The counterions
were Na+. The structural elements of PLEY, viz. backbone and side chains, are depicted
in Figure 6.1.
Aqueous feedstocks for electrospinning were prepared by dissolving as-received
peptide in DI water from a Marlo MRO-3600-4V reverse osmosis system (USA); the
conductivity was 0.9 μS. The feedstock solution will have consisted of three main
components: water (including OH– and H3O
+), ionized polypeptide and counterions.
B A

89
PLEY fiber stability was assessed at several pH values: 2.0, 3.8, 5.5, 7.0 and 12.0. At pH
2.0, 7.0 and 12.0, the buffer was 50 mM sodium phosphate. The solutions were prepared
separately with appropriate quantities of monobasic and dibasic sodium phosphate
(Sigma). At pH 3.8 and 5.5, the buffer was 50 mM sodium acetate. The solutions were
prepared separately with appropriate quantities of acetic acid and sodium acetate (Fisher,
USA). The pH of solution was adjusted to the final value with concentrated HCl or
NaOH (Sigma).
PLEY fibers were crosslinked overnight with 1-ethyl-3-(3-dimethylaminopropyl)
carbodiimide (EDC; Sigma-Aldrich) dissolved in 95% ethanol (Sigma). The EDC
concentration was 50 mM unless indicated otherwise, and the volume was 10 mL. After
crosslinking, fiber samples were rinsed extensively with DI water. The only product of
Figure 6.2 PLEY crosslinking. Two PLEY chains and an EDC molecule are shown as
reactants. The solvent is ethanol. Two crosslinked chains and a urea molecule are shown
as products. An EDC molecule reacts with the carboxylate group of a glutamate side
chain (not shown) and an amino group of a polymer (shown), forming a peptide bond
between them (not shown); a urea molecule is a byproduct. Reprinted with permission
from Haynie et al.33
copyright © 2013 WILEY-VCH

90
the crosslinking reaction that is stable in water is a peptide bond formed between the
carboxylate group of a glutamate side chain (or, with much lower probability, the C-
terminal carboxylate group) and an N-terminal amino group (Figure 6.2). An increase in
crosslink density implies a loss of free N-terminal amino groups. This is relevant to
crosslink density measurement.
2,4,6-trinitrobenzene sulfonic acid (TNBSA, Sigma-Aldrich) is reactive towards
free amino groups. An estimate of the degree of crosslinking of PLEY chains in fiber
samples was obtained by incubating the fibers in an aqueous preparation of TNBSA at
pH 8.5 and then quantifying the formation of reaction product by measuring the
absorbance of the soluble fraction in the 335-355 nm range. Fiber samples were prepared
as follows. 2.0 mg of fiber was collected on 6 separate glass cover slips, treated
overnight with EDC dissolved in 10 mL ethanol to give a final concentration in the 0-200
mM range, rinsed gently next day with DI water for 2 min, incubated in DI water for 1 h
to ensure hydrolysis of residual O-acylosourea intermediates, rinsed again with deionized
water and finally air dried for 2 h. Crosslinked fibers were desorbed from the substrate
with 4% sodium bicarbonate solution and mechanical agitation. Inspection of substrates
by light microscopy indicated that this treatment resulted in the removal of all, or nearly
all, fibrous material. Collected material was maintained in separate glass tubes, one per
fiber sample. 4% sodium bicarbonate was then added to a final volume of 1.5 mL in each
tube to control the pH of the dye conjugation reaction. A 1.0 mL aliquot of 0.01%
TNBSA in 4% sodium bicarbonate was then added to each tube. This resulted in a 6:1

91
mole ratio of dye to PLEY chains. Samples were sealed with screw caps, wrapped tightly
with parafilm and then heated at 40 °C for 2 h to promote the reaction of TNBSA with
free amino groups. Next, 3 mL of 6 N HCl was added to each sample. Samples were
sealed with screw caps, wrapped tightly with parafilm and heated at 60 °C for 2 h to
hydrolyze the PLEY molecules into individual amino acids or short oligopeptides. After
30 min of cooling, the pH of each sample was measured. Inspection by light microscopy
indicated that no fibers remained in any sample at this point. The absorbance of each
sample was then measured at 345 nm, where there is a large peak in the spectrum (see
Figure 6.4).
The approximate amount of water present in fiber samples was determined as
follows. 2.0 mg of fiber without crosslinks were dissolved in water, the absorbance at
274 nm was measured, the number of moles of Tyr was calculated from the extinction
coefficient (1400 103 cm
2 mol
–1) and the Beer-Lambert law; this result was divided by
the number of Tyr residues per PLEY chain (~46) to find the number of moles of
polymer; this result was multiplied by the average molecular weight of the polymer
(35,000 g mol–1
); and this result was subtracted from 2.0 mg. The amount of water thus
determined was 0.53 mg, or ~25%, in the absence of further dehydration. The efficiency
of the dye labeling reaction was determined by dissolving a nominal mass of 2 mg of
lyophilized PLEY (~1017
polymer molecules) in 1.5 mL 4% sodium bicarbonate,
measuring the absorbance of the resulting solution at 274 nm and following the
remaining steps of the procedure outlined above. The mole ratio of dye to PLEY chains
under these conditions is 6:1. The percentage of sites crosslinked was calculated as 1 –

92
(Ac/mc)/(Anc/mnc), where A is the measured absorbance, m is measured mass of the fiber
sample, and the subscripts represent samples that were crosslinked or not crosslinked.
EDX spectra of crosslinked fibers were obtained in the 0-4 keV range to quantify
the relative abundance of sodium, the counterion in as-received PLEY and the cation in
the phosphate and acetate buffers utilized here. Spectra were normalized with reference
to the carbon peak; this element was present in the polymers but its abundance in the
substrates was essentially nil. The phosphorous peak served as a control on sample
processing for fiber treatment at pH 2 and pH 7; phosphate was the buffer at these pH
values, and the abundance of phosphorous in the substrates was essentially nil. Samples
were incubated in buffer for 24 h at 22 °C and rinsed extensively in water prior to EDX
analysis.
4.3 Results
The pH of PLEY solution after dissolution of the lyophilized polymer in DI water
was mildly acidic, ~5.2. Control absorbance spectra and fluorescence emission spectra
have been obtained for PLEY in aqueous solution at different pH values (Figure 6.3).
Panel A shows UV absorbance. The large peak in the 200-225 nm range for DI water
and phosphate buffer at pH 7 is due to the absorbance of the peptide group and aromatic
side chains. A more distinct aromatic absorption band was evident near 275 nm.

93
Figure 6.3 PLEY chain spectra. A) UV absorbance. 0.1 mg/mL PLEY in DI Water or
50 mM phosphate buffer at pH 7 or pH 12. B) Fluorescence emission. Intensity is
shown as counts s–1
. 1.0 mg/mL PLEY (B) in DI water, or in 50 mM phosphate buffer at
(C) pH 2, (E) pH 7 or (F) pH 12. (D) Legend for the fluorescence spectra. Reprinted
with permission from Haynie et al.33
copyright © 2013 WILEY-VCH.
The relative isolation of this absorption band, and of the corresponding bands for
tryptophan and phenylalanine, is why the concentration of peptides and proteins is often
measured around 275 nm. The amplitude and energy of this band were, as expected,
Legend for fluor. Emission
0.0E+00
5.0E+05
1.0E+06
1.5E+06
2.0E+06
2.5E+06
250 350 450 550
A B
Wavelength (nm) Wavelength (nm)
Flu
or.
Inte
nsi
ty
Flu
or.
Inte
nsi
ty
Wavelength (nm)
Ab
sorb
ance
DI pH 2
C
Wavelength (nm) Wavelength (nm) Fl
uo
r. In
ten
sity
pH 12
Flu
or.
Inte
nsi
ty
0.0E+00
5.0E+05
1.0E+06
1.5E+06
2.0E+06
2.5E+06
250 350 450 550 0.0E+00
5.0E+05
1.0E+06
1.5E+06
2.0E+06
2.5E+06
250 350 450 550
0.0E+00
5.0E+05
1.0E+06
1.5E+06
2.0E+06
2.5E+06
250 350 450 550
0
0.02
0.04
0.06
0.08
0.1
0.12
200 250 300 350
DI Water
pH 7
pH 12
DI
D F
C
E
C pH 12 pH 7

94
significantly increased and red-shifted at pH 12 relative to neutral pH. The new
absorbance maximum occurred near 295 nm. pH jump from 7 to 12 results in the
ionization of the phenolic tyrosine side chain, increasing its electric dipole moment.
Fluorescence emission spectra for different pH values are shown in panels B, C, E
and F of Figure 6.3. Emission was insignificant when excitation occurred at 250 nm or
280 nm. At an excitation wavelength of 300 nm, by contrast, an emission peak was
evident in some samples at around 440 nm. The size of this peak was about the same for
PLEY dissolved in DI water or in aqueous buffer at pH 2, and ~10% smaller for PLEY in
the same buffer at pH 7. The same peak was barely detectable at pH 12. Excitation of
PLEY molecules at 350 nm resulted in a large emission peak near 440 nm for all
samples. As before, however, the amplitude of the peak was about the same for DI water
and aqueous buffer at pH 2, ~10% smaller at pH 7 and another ~5% smaller at pH 12.
The emission spectrum was about the same for all samples when excitation occurred at
400 nm. Taken together, the spectroscopic results provide key details for modeling the
molecular basis of stability of crosslinked PLEY fibers.
The extent of polymer crosslinking in fibers has been measured (Figure 6.4).
Spectra representing various EDC concentrations tested are shown in the inset. Crosslink
percentage, calculated as described in Experimental Section, rose monotonically from 0%
for no crosslinker to over 70% for 200 mM EDC. A single decaying exponential function
of the form percentage crosslinked = A1 – exp(–[EDC]/B) was fit to all data points by

95
Figure 6.4 Fraction of potential crosslinks formed versus concentration of crosslinking
reagent. Experiments were done at 0, 10, 20, 50, 100 and 200 mM EDC. The percentage
crosslinked increases with concentration of crosslinking reagent, reaching a maximum
value at about 200 mM EDC. Inset, TNBS spectra for the various EDC concentrations.
Most fiber samples in the present work were crosslinked at 50% EDC, which corresponds
to about 60% crosslinked. Reprinted with permission from Haynie et al.33
copyright ©
2013 WILEY-VCH.
non-linear least-squares regression. The best-fit values of the adjustable parameters A
and B were thus determined as 70% and 17 mM.
Side chain ionization in fibers under different conditions has been assessed by
EDX. It was assumed that the extent of ionization would correlate with the amount of
sodium present in fibers, as both glutamic acid and tyrosine are acidic, aqueous sodium is
cationic, sodium was the cation in the phosphate and acetate buffer salts, sodium was the

96
Figure 6.5 Analysis of fiber composition. Samples were incubated in buffer at pH values
in the range 2-7. Spectra have been normalized for the integrated area of the carbon
peak. The other peaks indicated are for nitrogen, oxygen, sodium, silicon and
phosphorus. Experiments were done at pH 2.0 (broken line), pH 3.8 (solid line), pH 5.5
(broken line) and pH 7.0 (solid line). Right inset, sodium peak. Left inset, integrated
sodium signal versus pH. Solid line, model function after fitting for the pKa of glutamic
acid. Reprinted with permission from Haynie et al.33
copyright © 2013 WILEY-VCH.
counterion in the commercial preparation of PLEY utilized here, and sodium is present in
PLEY fibers electrospun from feedstocks prepared by dissolving the polymer in DI
water.[16]
The EDX spectra are presented in Figure 6.5. The data have been normalized
for the relative abundance of carbon, which was assumed to be independent of the
amount of fiber in a sample. The left inset focuses on the sodium peak. Signal intensity
varied with pH, consistent with a pH-dependent ionization of the Glu side chain in the

97
acidic range. Phosphate is unlikely to have contributed to sodium binding, as the
phosphorus peak (2.01 keV) was insignificant in all cases. The silicon peak (1.74 keV)
was so small because the substrate was thoroughly covered with fibers in each case. The
integrated sodium peak after normalization is plotted in the right inset.
The model function integrated area = C + D10(pH – pKa)
/[1 + 10(pH – pKa)
], which
assumes a single class of dissociating protons, was fit to the data points shown. The
resulting pKa was 3.9, which is close to the nominal value for the glutamic acid side
chain, ~4.1.17
The decrease in pKa implies both a increase in the concentration of H3O+
required to protonate a glutamate side chain in a PLEY fiber, relative to the free amino
acid, and an increase in thermodynamic stability of 0.5 kJ mol–1
. The negative ΔpKa is
consistent with the energetic favorability of electrostatic interactions between COO– and
Na+ in the fiber. The data suggest that the increase in side-chain pKa due to the
unfavorability of a high density of negative charge was offset within the fiber by the
association of ionized side chains with counterions. The parameter C in the fitting
function represents sodium ion association with fibers in the absence of side-chain
ionization, presumably by ion-dipole interactions.
Fiber stability under different conditions has been assessed by microscopy.
Figure 6.6 shows the effect of submersing crosslinked PLEY fibers in DI water. The
fibers had been treated with 50 mM EDC as outlined in Experimental Section. The
refractive index of the fiber sample decreased relative to its surroundings on submersion

98
Figure 6.6 Crosslinked PLEY fiber stability. Fibers were spun from a DI water
feedstock onto glass and then imaged after A) 0 min and B) 1 min of submersion in 100
μL DI water. Scale bar, 100 μm. Reprinted with permission from Haynie et al.33
copyright © 2013 WILEY-VCH.
in buffer, decreasing contrast. Nevertheless, image quality was sufficient to document
fiber stability or dissolution. The data show that there was but limited disintegration of
fibers in DI water, consistent with previous results.15
Figure 6.7 displays the effect of submersing PLEY fibers in 50 mM phosphate
buffer. Without crosslinking, fibers degraded rapidly at any pH. At pH 2, for instance,
most fibers vanished within 10 s, though a residue of some fibers, more than likely ones
in direct contact with glass, was visible by microscopy as long as 15 min after
submersion (panels A-E). At pH 7, fibers crosslinked in 50 mM EDC were stable after
15 min (panels F-J) and indeed for days.15
The half-life of crosslinked PLEY fibers in an
aqueous medium at neutral pH is on the order of months if not years (unpublished data).
B A

99
Figure 6.7 Time series of fiber behavior on pH shift. Fibers were spun from DI water
onto glass and then submersed in acidic or basic phosphate buffer. The micrographs were
obtained by light microscopy. Fibers lacking crosslinks are shown at pH 2 (A-E, 10×
objective), while fibers crosslinked in 50 mM EDC are shown at pH 2 (F-J, 20×
objective) and at pH 12 (K-O, 20× objective), after A, F, K) 0 s; B, G, L) 1 min; C, H, M)
5 min; D, I, N) 10 min; E, J, O) 15 min. Fibers were submersed by applying 400 μL of 50
mM phosphate buffer to each sample. Scale bars, 100 μm. Reprinted with permission
from Haynie et al.33
copyright © 2013 WILEY-VCH.
At pH 12, fibers dissolved within 7 min, even if crosslinked in 50 mM EDC
(panels K-O). Figure 6.8 highlights specific details of fiber behavior at pH 12. Some
fibers buckled prior to dissolving (panels A-C), and increasing the EDC concentration
O N M L K
J I H G F
A B C D E

100
during crosslinking from 50 to 200 mM increased fiber resistance to dissolution (panels
D-F). The results are consistent with the data in Figure 6.4.
Figure 6.8 Time series of crosslinked fiber behavior at pH 12. A-C) Buckling. The data
are from the lower right-hand corners of panels K-M in Figure 6.7. Fibers were
crosslinked in 50 mM EDC. The approximate dimensions of panels A-C are 100 150
μm2. A) Dry fiber. B) 1 min and C) 5 min after submersion. Fiber buckling is
highlighted by arrows in B). The arrow in C) highlights buckling that was not evident in
B). D-F) Effect of increasing EDC concentration on fiber stability. Fibers were
crosslinked in 200 mM EDC. D) Dry fiber. E) 1 min and F) 15 min after submersion.
Fibers were submersed by applying 400 μL of 50 mM phosphate buffer to each sample.
The approximate dimensions of panels D-F are 425 425 μm2. Reprinted with
permission from Haynie et al.33
copyright © 2013 WILEY-VCH.
A B C

101
Figure 6.9 Fiber morphology. A) No crosslinking but treated with ethanol. Crosslinking
with 50 mM EDC followed by submersion in 100 μL buffer for 1 h at B) pH 2.0, C) pH
3.8, D) pH 5.5 and E) pH 7.0. All samples were rinsed with DI water and metalized with
gold prior to analysis by SEM. Scale bars, 50 μm (A) and 10 μm (B-E). Reprinted with
permission from Haynie et al.33
copyright © 2013 WILEY-VCH.
Effects on fiber morphology due to submersion of samples in different aqueous
media have been assessed by SEM. Samples were submersed for 1 h in 50 mM aqueous
buffer in the range pH 2.0-pH 7.0. The data are presented in Figure 6.9. Fibers without
crosslinks displayed only limited changes in morphology from submersion in ethanol
only (panel A), consistent with our previous results.16
EDC-crosslinked fibers remained
intact throughout the acidic pH range (panels B-E), not only at neutral pH. 15,16
Some
A B C
D E

102
fiber annealing and degradation may have occurred during treatment at pH 5.5 and below
(panels B-D).
4.4 Discussion
The average degree of polymerization of PLEY was ~230. The nominal pKa
values of the titratable side chains were 4.1 (glutamic acid) and 10.5 (tyrosine).17
The
actual values in PLEY will have been different, owing to the perturbation of the local
electronic environment by the large number of surrounding carboxyl groups, aromatic
groups and counterions. Few if any tyrosine residues will have been ionized in the
lyophilized polymer or in DI water. Side chain ionization is relevant to interpreting the
spectral properties of PLEY (Figure 6.3) and fiber stability in an aqueous medium (Figure
5.6-5.8). Other polymer properties are no less consequential for the same purpose, for
instance, non-polar surface for forming hydrophobic interactions and polar surface for
forming hydrogen bonds. The non-polar and polar accessible surface areas for the side
chains in PLEY, based on leucine-X-leucine models, where X is an amino acid residue,
are 52 Å2 and 79 Å
2 for Glu and 131 Å
2 and 49 Å
2 for Tyr.
18 For comparison, the
surface area of the polymer backbone, which is significantly polar due to the amide bond
in the peptide group, is 23 Å2 per residue. The overall balance of the non-polar and polar
surface area, combined with side-chain ionization, will determine the solubility of a
peptide. Here, PLEY solubility was crucial to feedstock preparation and fiber stability.
50% (w/v) PLEY corresponds to 14 mM. The ionization of lyophilized PLEY
chains was an estimated ~0.6 per residue, or ~1/4 less than the fraction of Glu residues in
PLEY; the sign of charge was negative in any case. This translates into [Na+] = 1-2 M in
103
the polymer feedstock; the average volume occupied per counterion was ~1 nm3 prior to
electrospinning. As this concentration far exceeds [OH–] = [H3O
+] = 10
–7 M at pH 7,
mobile Na+ ions and the ionized glutamic acid side chains in PLEY will have dominated
the role of charged particles in the electrospinning process. Na+ ions, which have a
hydrated radius of ~0.8 nm, will diffuse faster than PLEY chains, which are mostly
random coils in the feedstock solution[16]
and have an approximate root-mean-squared
radius of 230 0.36 nm = 5.5 nm, ignoring hydration (cf. Figure 6.1). For comparison,
the Bjerrum length, the separation distance at which the electrostatic force between two
charges will have the same magnitude as thermal energy, is ~0.7 nm in water at 300 K.
This length is ~0.1 nm greater than the distance between α carbons i and i + 2 in the
polymer backbone in a β strand conformation, and ~0.1 nm smaller than the hydration
radius of Na+.
The vapor pressure of the polymer is extremely low. During fiber production,
water molecules will evaporate from the polymer jet, decreasing the solvent quality. The
concentrations of PLEY and Na+ increased on spinning, and the resulting intra- and inter-
chain interactions promoted both charge compensation at close range and chain
entanglement. Few counterions will have been lost in the process, as solvation greatly
increases the effective mass of a small counterion and ion-ion interactions with
oppositely-charged polymer side chains are energetically favorable.
Relevant thermodynamic quantities here include the following. Side-chain
ionization enthalpy varies with polymer concentration and pH for poly(L-glutamic acid),
ranging from c. 2 to 15 kJ mol–1
.19-21
The corresponding range for PLEY, the
composition of which is 80% glutamic acid, is probably somewhat smaller due to a

104
decrease in charge repulsion between side chains. At 298 K, the ionization enthalpy of
water is –56 kJ mol–1
and the enthalpy of vaporization is a comparable +44 kJ mol–1
.22-24
The enthalpy of ion hydration is c. –400 kJ mol–1
for Na+.25
The enthalpy of hydrating
carboxylic acid is c. –63 kJ mol–1
, and c. –380 kJ mol–1
for the conjugate base.26
In
words, the heat released on ionizing water or hydrating the polar part of the glutamic acid
side chain is about the same as the heat required to vaporize water, and the heat released
on hydrating Na+ or –COO
– is about an order of magnitude greater. Ion dehydration
during PLEY fiber spinning will presumably depend on the extraction of thermal energy
from the air surrounding a fiber and the formation of exothermic ion-ion interactions
between Na+ and ionized side chains within fibers. Further solvent evaporation from
fibers will have occurred on the collector, the amount depending on the humidity and
interactions between polymers and counterions. Some annealing is known to occur while
the fibers are in flight or after they reach the collector.16
Few residues in PLEY, if any, form persistent secondary structures in the
electrospinning feedstock, whereas in fibers, about 1 residue in 4 is in a β sheet prior to
crosslinking.16
Assuming an irregular backbone for all other residues, the energetic cost
of forming a β sheet in a fiber is then ~2.7 kJ (mol-residues)–1
, essentially the same as
thermal energy. The ionization energy of glutamic acid is comparable. Regular structure
formation in PLEY fibers is presumably enabled by the favorable energetics of side
chain-counterion interactions. In any case, the large percentage of residues with an
irregular backbone is consistent with the Flory theorem, according to which increasing
the concentration of chain molecules, as happens on going from feedstock to fiber, does
not bias the distribution of conformations. No matter how closely associated the
105
polymers are in a crosslinked fiber submersed in solvent, thermal fluctuations will enable
some solvent molecules and small counterions to penetrate inside.
Biophysical studies have revealed that the enthalpy of specific ion binding to
proteins is typically far smaller than the enthalpy of hydrating the same ion. Ion binding
in biology is therefore often entropy-driven. An example is provided by the high-affinity
association of Ca2+
with α-lactalbumin. The Kd for binding is ~10–9
M. The ion binding
site is located near the protein surface, and Ca2+
is coordinated by acidic side chains in
the binding pocket.[27]
The enthalpy of Ca2+
binding is substantially smaller than the
enthalpy of hydration, however, and binding is accompanied by a large gain in entropy.28
The data are explained by the association of several water molecules with Ca2+
in the
binding pocket,27
the relative contribution of the first few solvating water molecules to
the enthalpy of hydration versus the last few, and the entropy gained by the release of
water molecules from the hydration shell of Ca2+
to bulk solution on ion binding. The
comparison suggests that dehydrated PLEY fibers will contain numerous counterions and
some water molecules, and the energetic cost of losing either will be high. EDX analysis
has confirmed the presence of sodium in PLEY fibers.16
Na+ binding in PLEY fibers will
surely be less specific than Ca+ binding to α-lactalbumin, at least in general terms; Kd was
not determined in this work but a range of values extending from 10–3
M to perhaps 10–6
M seems probable. A significant amount of water was present in PLEY fiber samples
(see Experimental Section), and it is likely that some water would have remained on
further sample dehydration, similar to the retention of water on the surface of lyophilized
proteins.29

106
General electrical properties of PLEY fibers are worth noting. For simplicity, let
the fiber geometry be cylindrical and the surface density of charge the same for two
fibers of different radius. The net charge on a PLEY molecule will be due primarily to
side chain ionization, which will depend on the pH of the surrounding medium. The side
chains of glutamic acid residues but not tyrosine residues will be ionized with high
probability at neutral pH. A diffuse counterion cloud will surround each PLEY molecule,
giving a net charge of zero within a Gaussian surface that encompasses not only the
polymer but also some of the surrounding solvent and small counterions dissolved in the
solvent. Ionized side chains will be located on the fiber surface and in the fiber interior.
Within the fiber, side-chain charges will be compensated by small mobile counterions,
giving a net charge of zero.
On the fiber surface, by contrast, small counterions will occasionally escape from
the electrical potential well formed by the ionized side chains; the random forces of
thermal motion will compete with the deterministic forces of charge-charge interactions,
resulting in a non-zero average net charge. The sign of charge will be negative for
PLEY. The resultant electric field lines will be located outside the fiber only. The
nominal direction of the field will be perpendicular to the fiber surface. The field lines
will diverge more rapidly for a thin fiber than a thick one, so the electric flux in a unit
area parallel to the fiber surface will be lower for a thin fiber at a given distance from the
fiber axis. A thick fiber will for the same reason have a larger field over a longer
distance. The electric field of charges on the fiber surface will not extend more than ~1
nm into the surrounding solution, due to Debye-Hückel screening.

107
The UV absorbance and fluorescence emission data presented in Figure 6.3 are
consistent with a key role for tyrosine ionization in the spectral properties of PLEY. The
closer similarity of the DI water spectra to the pH 2 than the pH 7 spectra suggests that
the degree of ionization of PLEY in DI water was closer to that at pH 2 than pH 7.
Glutamic acid side chains, in addition to tyrosine side chains, are ionizable. The data are
consistent with an anomalously high average pKa for glutamic acid in PLEY, just as in
poly(glutamic acid).21
The EDX data shown in Figure 6.5 support this view.
PLEY solubility in ethanol is evidently rather low (Figure 6.9A). The
crosslinking mechanism, described in Experimental Section, is relevant to interpreting the
results of fiber stability experiments. Four classes of stable crosslink were possible; all
involve the N-terminal amino group of a first PLEY chain, x. The carboxyl group is
provided by a side chain or the C-terminus of polymer x or polymer y. xx crosslinks
cyclize the chain, xy crosslinks do not. In the most probable xx crosslinks and xy
crosslinks, the carboxyl group will be provided by a side chain. The probability of
cyclization in a random-flight chain goes as N–3/2
, where N is the number intervening
residues.30
The most probable crosslinks will therefore be xyside chain crosslinks (Figure
6.2). More than one crosslink per chain will be possible in individual cases, but not on
the average; there is only one amino group per polymer. The data in Figure 6.4 suggest
that ~60% of sites were crosslinked at 50 mM EDC, increasing to ~75% at 200 mM. The
percentages must be considered rough, as EDC will have crosslinked PLEY molecules
more readily on the fiber surface than in the interior, the dye labeling efficiency may have
varied with crosslink density because the number of sites available for labeling varied
from sample to sample and the mole ratio of dye molecules to reactive sites (primary

108
amino groups) was therefore variable. This ratio was 6:1 in the control sample (treated
with ethanol but not EDC) and ~24:1 in the 200 mM EDC sample. The percentage of
intra-chain crosslinks was not determined in this study. An estimated 50 106 crosslinks
Figure 6.10 Mechanisms of fiber stability and dissolution in phosphate buffer at pH 12
and pH 2. Reprinted with permission from Haynie et al.33
copyright © 2013 WILEY-
VCH.
were formed per micron of fiber at 50 mM EDC, assuming that fiber density was
comparable to that of proteins (~1.4 g mL–1
).
PLEY fibers are stabilized by various types of non-covalent interaction before
crosslinking. EDC crosslinking of the fibers alters the distribution of backbone

109
conformations, converting most residues to a random coil.16
The relative contribution of
different non-covalent interactions to overall fiber stability changes on crosslinking. In
the present work, all fibers were spun from a DI water feedstock and some were
crosslinked with EDC. Stability was then assessed by submersing fiber samples in
aqueous solution at different pH values and characterizing the samples with different
analytical methods. Experiments were done at neutral pH, acidic pH and basic pH.
Models based on the results obtained at the extremes of pH are illustrated in Figure 5.10.
Neutral pH. PLEY is highly soluble in water, even if some Glu side chains are
not ionized. In the absence of crosslinking, PLEY fibers dissolve rapidly. Crosslinking
with 50 mM EDC overcomes most if not all of the tendency of fibers to dissolve (Figure
6.6). Crosslinking decreases the conformational freedom of chains. In an aqueous
medium, there is a maximum of one crosslink per chain on the average (Figure 6.2); there
is only one amino group per chain. The energy of the crosslink, though covalent, is only
~12 kJ mol–1
. In shifting from DI water to pH 7 buffer there is a modest increase in the
protonation of Glu side chains (cf. Figure 6.1 and 5.3) and therefore a modest influx of
Na+ from bulk solution (Figure 6.5).
Acidic pH. There were ~184 Glu residues per polymer chain on the average.
H3O+ (or H
+), aided somewhat by the solubility of the PLEY backbone, migrates into the
fibers and transfers a proton to glutamate, forming a water molecule and dislodging Na+.
The timescale for the process is uncertain, but it must be rapid (Figure 6.7B). The free
energy of transfer of the proton to the Glu side chain exceeds that of Na+ binding; the ion
is probably partially solvated when bound. Few Glu side chains are ionized; essentially
all Tyr side chains are protonated. The hydrophobicity of the side chains impedes

110
dissolution (Figure 6.7A-E) but does not prevent it in the absence of crosslinks (Figure
5.9B); the peptide group has a dipole moment of 3.5 Debye, nearly twice that of water,
and the side chains, though neutral, have polar carboxyl groups (Figure 6.1). See Figure
6.7A-E. Lyophilized PLEY chains aggregate and are poorly soluble in pH 2 buffer (data
not shown). Crosslinking the fibers in 50% EDC will overcome much of the tendency of
the polymers to dissolve (Figure 6.7F-J).
Basic pH. There were ~46 Tyr residues per polymer chain on the average. OH–,
aided by the solubility of the PLEY backbone and the ionized side chains, migrates into
the fibers and extracts a proton from a tyrosine side chain, forming a water molecule and
creating a Na+ binding site. The existing covalent crosslinks and Na
+ ions from bulk
solution together stabilize the fibers, slowing dissolution but not preventing it (Figure
5.7K-O) in a manner that scales with the crosslink density (Figure 6.6 and 6.8D-F).
Fluctuations in electrostatic repulsion between chains are substantially greater than at pH
7, owing to the ionization of Tyr (Figure 6.1 and 6.3). Either the mobility of Na+ is too
low or the number of sodium ions in the volume of 50 mM sodium phosphate buffer
applied to the sample is too small to neutralize the ionization of tyrosine residues that
results from the pH shift. Fiber buckling occurs (Figure 6.8A-C), apparently due to a
bending instability with a significant electrostatic component. For comparison, the well-
known bending of the fiber jet during electrospinning, as the electrically-charged jet is
stretched along its axis by the applied field and Coulomb repulsion between successive
segments, can be attributed to perturbations that move a segment off-axis, the distance of
the segment from the axis increasing in time.31,32
Here, thermal fluctuations associated
with the exchange of heat energy between a fiber and the surrounding buffer perturb

111
chain association within a fiber, the density of charge on the fiber surface and within, and
the trajectory of the fiber on the substrate, leading to buckling. At equilibrium, all or
nearly all Tyr side chains are ionized; essentially all Glu side chains will be ionized.
Finally, the behavior of PLEY fibers at pH 12 may be compared with results
obtained for other ionizable polypeptides in an electrospinning context. Poly(L-
ornithine) is spinnable from an aqueous feedstock, but closely related poly(L-lysine) is
not.14
The side chains in both cases consist of several methylene groups and a terminal
amino group; both side chains are basic. Lysine differs from ornithine in that four rather
than three consecutive methylene groups are present. This small structural difference has
significant consequences for side chain ionization at neutral pH, and for the ability of the
polymer to become helical at basic pH. Whereas poly(lysine) is almost completely
ionized near pH 7, a substantial proportion of ornithine side chains are uncharged. The
side-chain amino groups are closer to the polymer backbone in poly(ornithine), and the
higher electrostatic potential resulting from the greater charge repulsion between side
chains is decreased by neutralization of the charge on the amino group. The lack of
spinnability of poly(lysine), then, results from the high charge per residue at neutral pH.
If the surrounding environment of poly(lysine) is made more basic, leading to fewer
ionized side chains, the polymer will become helical and its aqueous solubility will
greatly decrease, making it unspinnable from water. A similar conclusion regarding
mechanism is reached on comparing PLEY with poly(L-glutamic acid). The latter is not
spinnable. Nearly all glutamyl side chains will be ionized at neutral pH. If the
surrounding environment of poly(glutamic acid) is made more acidic, leading to fewer
ionized side chains, the polymer will become helical and its aqueous solubility will

112
greatly decrease, making it unspinnable from water. The Tyr residues in PLEY limit the
charge per residue, enhancing polymer spinnability, but the charge remains high enough
at neutral pH for the polymer to remain soluble in the electrospinning feedstock.
Spinnability and fiber stability are presumably enhanced by interactions between in
tyrosine side chains. At pH 12, however, well above the pKa of the side chain, the charge
per residue on PLEY is too large for the fiber to remain intact, even in the presence of
crosslinks formed on treatment with 50 mM EDC (Figure 6.7K-O). Crosslinking at 200
mM reduces the rate and extent of fiber dissolution but does not prevent it (Fig. 6.8D-F).
4.5 Conclusion
This study adopted PLEY, a synthetic polypeptide with ionizable side chains, as a
model for electrospun fiber stability analysis. The charge per unit length on the polymer
increased significantly upon pH-jump from 7 to 12. Fibers dissolved on a time scale of
seconds in aqueous solution in the absence of crosslinks between polymers. The
maximum average number of crosslinks per polymer was about 0.75 under the selected
reaction conditions. An average of 0.6 crosslinks per polymer was sufficient to prevent
fiber disintegration throughout the acidic pH range, and to slow fiber disintegration but
not prevent it at pH 12. The relative amount of small counterions in fibers correlated
with side chain ionization in the acidic pH range. The morphology of crosslinked fibers
was relatively insensitive to pH throughout the acidic range but not under strongly basic
conditions. The results constitute a step towards explaining fiber stability in terms of the
structural properties of the constituent molecules and fiber processing methods.

113
4.6 References
1. Greiner, A.; Wendorff, J. H. Angew. Chem. Int. Ed. 2007, 46, 5670.
2. Bellan, L. M.; Craighead, H. G. Polym. Adv. Technol. 2011, 22, 304.
3. Teo, W.-E.; Inai, R.; Ramakrishna, S. Sci. Technol. Adv. Mater. 2011, 12, 013002.
4. Yarin, A. L.; Koombhongse, S.; Reneker, D. H. J. Appl. Phys. 2001, 90, 4836.
5. Shin, Y. M.; Hohmann, M. M.; Brenner, M.; Rutledge, G. C. Polymer 2001, 42,
9955.
6. Kim, J.-s.; Reneker. D. H. Polym. Comp. 1999, 20, 124.
7. Gu, S.-Y.; Wu, Q.-L.; Ren, J.; Vansco. G. J. Macromol. Rapid. Comm. 2005, 26,
716.
8. Baji, A.; Mai, Y.-W.; Wong, S.-C.; Abtahi, M.; Chen, P. Comp. Sci. & Tech.
2010, 70, 703.
9. Casper, C. L.; Yamaguchi, N.; Kiick, K. L.; Rabolt, J. F. Biomacromolecules
2005, 6, 1998.
10. Yoo, H. S.; Kim, T. G.; Park, T. G. Adv. Drug Deliv. Rev. 2009, 61, 1033.
11. Pham, Q. P.; Sharma, U.; Mikos. A. G. Tissue Eng. 2006, 12, 1197.
12. Sill, T. J.; von Recum, H. A. Biomaterials 2008, 29, 1989.
13. Khadka, D. B.; Haynie, D. T. Nanomedicine: NBM 2012, 8,1242.
14. Khadka, D. B.; Haynie, D. T. ACS Appl. Mater. Interfaces 2010, 2, 2728.
15. Khadka, D. B.; Cross, M. C.; Haynie, D. T. ACS Appl. Mater. Interfaces 2011, 3,
2994.
16. Haynie, D. T.; Khadka, D. B.; Cross, M. C. Polymers 2012, 4, 1535.

114
17. Dawson, R. M. C.; Elliott, D. C.; Elliott, W. H.; Jones, K. M. Data for
Biochemical Research, 3ed, Clarendon Press, Oxford, UK 1986.
18. Wimley, W. C.; Creamer, T. P.; White, S. H. Biochemistry 1996, 35, 5109.
19. Doty, P.; Wada, A.; Yang, J. T.; Blout, E. R. J. Polym. Sci. 1957, 23, 851.
20. Kitzinger, C.; Hems, R. Biochem. J. 1959, 71, 395.
21. Godec, A.; Škerjanc, J. J. Phys. Chem. B 2005, 109, 13363.
22. Vanderzee, C. E.; Swanson, J. A. J. Phys. Chem. 1963, 67, 2608.
23. Hale, J. D.; Izatt, R. M.; Christensen, J. J. J. Phys. Chem. 1967, 67, 2605.
24. Gray, D. E. American Institute of Physics Handbook, McGraw-Hill, New York,
NY, USA 1972.
25. Smith, D. W. J. Chem. Ed. 1977, 54, 540.
26. Wilson, B.; Georgiadis, R.; Bartmess, J. E. J. Am. Chem. Soc. 1991, 113, 1762.
27. Acharya, K. R.; Stuart, D. I.; Walker, N. P.; Lewis, M.; Philips, D. C. J. Mol.
Biol. 1989, 208, 99.
28. Griko, Y. V.; Remeta, D. P. Protein Sci. 1999, 8, 554.
29. Wang, W. Int. J. Pharmaceut. 2000, 203, 1.
30. Jacobson, H.; Stockmayer, W. H. J. Chem. Phys. 1950, 18, 1600.
31. Reneker, D. H.; Yarin, A. L.; Fong, H.; Koombhongse, S. J. Appl. Phys. 2000,
87, 4531.
32. Han, T.; Reneker, D. H.; Yarin, Y. L. Polymer 2007, 48, 6064.
33. Haynie, D.T., Khadka, D.B., Cross, M.C., Gitnik, A., Nicole, L.K. Macromol.
Mater. Eng. 2013, 298, 529–540.

115
CHAPTER 7
SELF-ORGANIZATION KINETICS IN POLYPEPTIDE ELECTROSPUN
FIBERS
7.1 Introduction
The self-organizing tendencies of matter form a major topic of research and
technology development today. Moreover, interest is strong across science disciplines.
In engineering, studies have sought to harness principles of self-organization for novel
materials fabrication and device development. A sub-area of great practical significance
is guided self-organization, in which human control over a feature of a process, for
instance, a thermodynamic quantity in materials manufacture, can have a marked impact
on the product without completely determining it. One of many guided self-organization
processes is known as annealing.
Annealing brings about a change in the macroscopic properties of a material, for
instance its crystallinity, by influencing microstructure, for instance, the average
conformation of a polymer. Various methods are practiced. In one, called thermal
annealing, a material is heated and then cooled gradually.1 Computational analogs are
used to prepare energy-minimized molecular structures of large molecules; increasing the
average kinetic energy of atoms can help to avoid a structure remaining trapped in a local
free energy minimum.2 Annealing a plastic can alter the conformations of chains and

116
thus relieve internal stresses. Solvent uptake from the vapor phase can yield a change in
material properties in solvent-vapor annealing.3 Solvent annealing can bring about
changes in material properties by way of solvent evaporation.4 Solvent selection and
dosing can markedly influence the annealing process and therefore material properties.
Annealing thus can potentially enhance the structure or strength of a material. Typical
annealing processes place few restrictions on the geometry of the bulk material.
Polymer-based production of nano- and microscale fibers by electrospinning is
currently of broad interest for advancing basic scientific knowledge and developing
materials of commercial value.5-7
Electrospinning itself may be described as a guided
self-assembly process. A small quantity of polymer solution leaves the feedstock through
a die, or spinneret, as a liquid jet. Susceptible to various physical instabilities, the stream
trajectory changes spontaneously as the solvent evaporates spontaneously and the
polymers within the fiber reorient themselves spontaneously. Small differences in
polymer structure and solvent properties can have a marked impact on spinnability and
fiber properties, notably, morphology. For such reasons, the discovery or invention of
ways of increasing the predictability of final products and controlling materials
production is desired. Control could be achieved in part by manipulating polymer
structure. Applications of electrospun materials include filtration devices, high-strength,
low-weight composites and scaffolds for cell and tissue culture.
Electrospinning research in our laboratory has been focused on aqueous
feedstocks of designed polypeptides. Such polymers constitute about half of the dry mass
of living organisms; every protein molecule comprises at least one polypeptide chain.
Polypeptides are interesting for a wide range of materials applications in biotechnology,

117
medicine and other areas. A comprehensive review of protein-based electrospun fibers
has recently appeared.8 In the present work, PLO and PLEY were adopted as model
polymers. PLO is a polycation at neutral pH, PLEY a polyanion. These polymers are
readily crosslinked in situ with GTA and EDC, respectively, making the fibers insoluble
in water at neutral Ph.9-12
The structures of PLO and PLEY are simple in comparison
with proteins. Nevertheless, the corresponding fibrous materials are complex, so that
predicting the physical, chemical and biological properties of the materials based on
polymer structure alone remains a significant challenge. Experimental studies are needed
to improve the predictive value of existing empirical models and to select between
competing explanations of physical properties. The present study aimed to contribute to
the available empirical data by focusing on the kinetics of polymer self-organization in
crosslinked fibers during solvent annealing in water.
7.2 Materials and methods
Aqueous feedstocks of PLO and PLEY were prepared by dissolving as-received
peptide in DI water (Marlo MRO-3600-4V reverse osmosis system, USA); the
conductivity was 0.9 μS cm−1
prior to polymer dissolution. The nominal final polymer
concentration was 40% w/v for PLO and 50% w/v for PLEY. Fibers were spun from
these preparations and crosslinked as described previously9-12.
Next day, fiber samples,
now crosslinked, were rinsed 4 times with 5 mL of deionized (DI) water. The duration of
each rinse was 5 s, and fresh water was utilized for each rinse. The final rinse was in 5
mL of DI water for 1 min on an orbital shaker. Fibers samples were blotted with porous
paper to remove solvent and dried thoroughly with N2 gas within 30 s prior to annealing.

118
Fiber-coated substrates were then divided into 12 pieces of equal area. The final size of
each piece, 8 cm 6 cm, matched the size of the ATR crystal for IR spectral analysis.
Crosslinked fibers on ITO-PET were annealed in situ by submersing each sample
in 3 mL of DI water for 0, 1, 2, 3, 4, 5, 8, 13, 21, 34, 55, 89 or 144 min at 22 °C, or for 0,
15, 45, 75, 300 or 3600 s at 45 oC followed by rapid cooling to 22 °C. Immediately
thereafter, each fiber sample was blotted for less than 5 s to remove excess water, dried
thoroughly with N2 gas within 30 s and then analyzed by IR spectroscopy. A different
fiber sample was analyzed for each time point.
Crosslinked fiber samples on ITO-PET were annealed in situ for 4.5 h, blotted
and dried with N2 gas as described above. Each sample was then submersed in 3 mL of
D2O (Sigma) for 0, 5, 10, 15, 20, 25, 40, 65, 105, 170, 275, 445 or 1200 min at 22 °C,
blotted, dried with N2 gas and maintained in a dessicator for 24 h prior to IR analysis. A
different fiber sample was analyzed for each time point.
Spectra were analyzed in the amide I and II (bond stretching) regions and the
amide III (bond bending) region. A two-point baseline correction was systematically
applied in the 2100-1000 cm–1
range prior to analysis. Distinctive, apparently non-
overlapping resonances were identified outside of the amide I region. The integrals of
distinctive resonances were evaluated numerically for each time point.
Samples were metalized with a 10-nm layer of gold. High resolution images were
obtained with a SEM.
Fibers composition was analyzed by EDX. Approximately 5 mg of PLEY fibers
were collected on glass cover slips and crosslinked overnight in 5 mL of 50 mM EDC in
ethanol. The fibers were then rinsed thoroughly with DI water and annealed at 22 °C in 3
119
mL of DI water for 4 h. The accelerating potential was 15 kV. Finally, the data were
normalized for the integrated intensity of the carbon peak; the assumption being that for a
well-coated substrate, peptide alone would contribute the carbon intensity.
Amide I spectra were analyzed using computational approach using sequential
model and parallel model. In the sequential model, the amount of product formed is P =
(1 + [I0(ka – kb)/R0 + ka]exp(–kbt) – kbexp(–kat)/(kb – ka))R0 + P0. Here, R0, I0 and P0
are the proportions of reactant, intermediate and product initially present, ka is the rate of
forming I from R, and kb is the rate of forming P from I. This model has 5 adjustable
parameters. In the parallel pathways model, the amount of product formed is P = [1 –
exp(–kat)]R0a + [1 – exp(–kbt)]R0b + P0, where R0a and R0b are the proportions of reactant
a and b initially present, ka and kb are the rates of formation of Pa and Pb from R, and Pa
and Pb are assumed to be indistinguishable from P0. Again, there are 5 parameters. Here,
the parameters were determined with a Marquardt-Levenberg algorithm by fitting the
model function to time series of integrated areas for individual resonant frequencies in
the 1200-1800 cm–1
range.
A two-point baseline was subtracted from each amide I envelope, and the
resulting spectra were normalized for integrated area, correcting for differences between
samples in the amount of material which contributed to the recorded signal. Multiple
Gaussian functions were then fit simultaneously to each experimental spectrum with a
Marquardt-Levenberg algorithm.
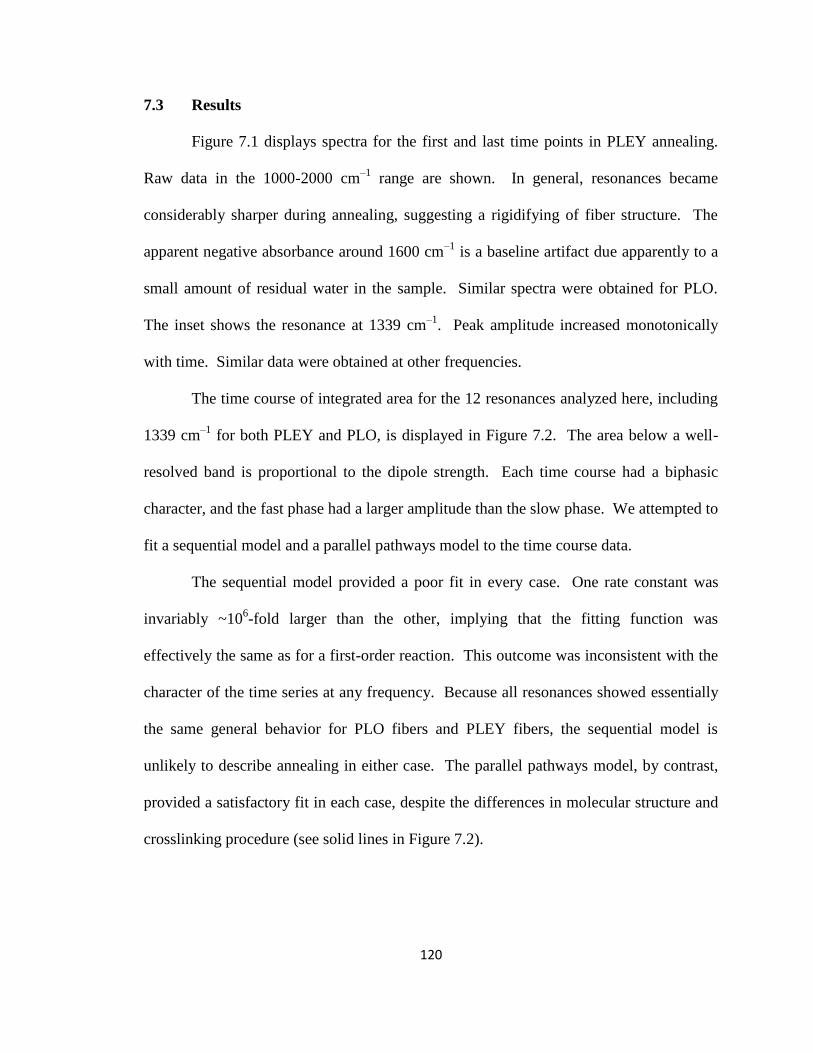
120
7.3 Results
Figure 7.1 displays spectra for the first and last time points in PLEY annealing.
Raw data in the 1000-2000 cm–1
range are shown. In general, resonances became
considerably sharper during annealing, suggesting a rigidifying of fiber structure. The
apparent negative absorbance around 1600 cm–1
is a baseline artifact due apparently to a
small amount of residual water in the sample. Similar spectra were obtained for PLO.
The inset shows the resonance at 1339 cm–1
. Peak amplitude increased monotonically
with time. Similar data were obtained at other frequencies.
The time course of integrated area for the 12 resonances analyzed here, including
1339 cm–1
for both PLEY and PLO, is displayed in Figure 7.2. The area below a well-
resolved band is proportional to the dipole strength. Each time course had a biphasic
character, and the fast phase had a larger amplitude than the slow phase. We attempted to
fit a sequential model and a parallel pathways model to the time course data.
The sequential model provided a poor fit in every case. One rate constant was
invariably ~106-fold larger than the other, implying that the fitting function was
effectively the same as for a first-order reaction. This outcome was inconsistent with the
character of the time series at any frequency. Because all resonances showed essentially
the same general behavior for PLO fibers and PLEY fibers, the sequential model is
unlikely to describe annealing in either case. The parallel pathways model, by contrast,
provided a satisfactory fit in each case, despite the differences in molecular structure and
crosslinking procedure (see solid lines in Figure 7.2).
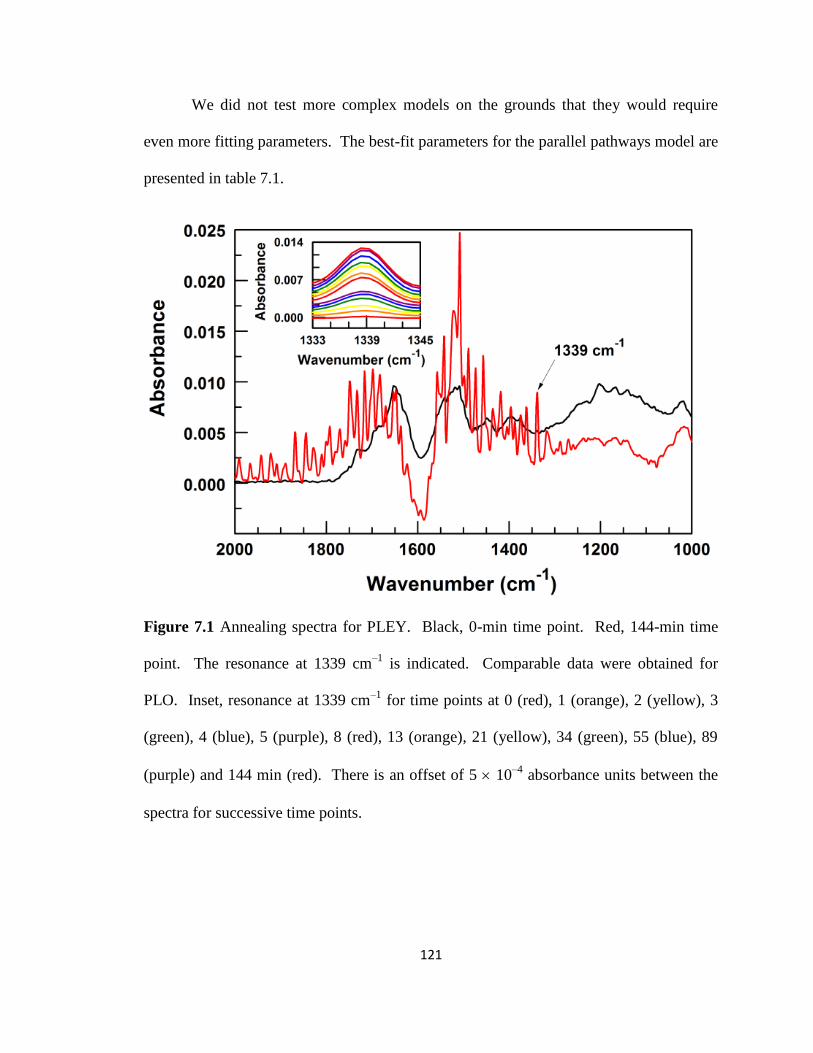
121
We did not test more complex models on the grounds that they would require
even more fitting parameters. The best-fit parameters for the parallel pathways model are
presented in table 7.1.
Figure 7.1 Annealing spectra for PLEY. Black, 0-min time point. Red, 144-min time
point. The resonance at 1339 cm–1
is indicated. Comparable data were obtained for
PLO. Inset, resonance at 1339 cm–1
for time points at 0 (red), 1 (orange), 2 (yellow), 3
(green), 4 (blue), 5 (purple), 8 (red), 13 (orange), 21 (yellow), 34 (green), 55 (blue), 89
(purple) and 144 min (red). There is an offset of 5 10–4
absorbance units between the
spectra for successive time points.

122
Figure 7.2 Time series of integrated peak areas. A) PLO. B) PLEY. The frequencies
analyzed are given in Table 7.1. Symbols, experimental data points. Solid lines, fitting
results.
The kinetic modeling data, it should be noted, were obtained over a broad spectral range,
not only in the more usual amide I region. Good agreement was found for the fast-phase
and slow-phase time constants, τa and τb: 4.4 0.2 min and 29 2 min (mean S.E.) for
PLO and 7.0 0.2 min and 63 3 min (mean S.E.) for PLEY. τi = 1/ki. The time
constants were longer for PLEY by a factor of 1.6 and 2.2. The offset parameter, P0,
represents 15 2% of the overall integrated area for PLO (Table 7.2). For PLEY, P0 is –
2 3% of the overall area. This suggests that about 15% of PLO molecules but
essentially no PLEY molecules were in or near the final conformation before IR analysis
began. The relationship between R0a, R0b and P0 and polymer conformation cannot be
judged by the kinetic data alone. We therefore examined the amide I band.
A B

123
Table 7.1 Fitting parameters for kinetic modeling at 22 °C*
Absorbance band (cm–1
) R0a τa (min) R0b τb (min) P0
PLO
1339 230 4.3 140 31 72
1362 120 7.1 70 52 28
1374 190 4.3 60 33 41
1475 180 3.9 200 16 80
1488 200 3.4 150 24 56
1733 170 3.1 170 19 65
Average 50 10% 4.4 0.2 35 9% 29 2 15 2%
PLEY
1339 290 5.6 130 51 1
1362 150 9.1 80 56 –11
1455 260 5.6 210 35 –12
1490 260 6.6 90 86 –10
1508 390 7.2 190 62 20
1747 410 7.8 100 84 –19
Average 70 9% 7.0 0.2 32 8% 63 3 –2 3%
*Amplitude averages are reported as percentage mean S.D., time constant averages as
mean S.E.
Spectra for PLO fibers and PLEY fibers are shown in Figure 7.3 In both cases,
the amide I band became progressively more distinctive with time. The spectrum of the
final time point was broadly similar for PLO and PLEY. The peaks in the vicinity of
1625 cm–1
and 1685 cm–1
strongly suggest the presence of β sheets and β turns.13
Apparent isosbestic points are evident. At such points, two chemical species have the

124
Figure 7.3 Normalized amide I spectra of crosslinked A) PLO fibers and B) PLEY fibers
during annealing in water. Different colors represent different time points throughout the
annealing process. 0 min, red. 1 min, orange. 2 min, yellow. 3 min, green. 4 min, blue.
5 min, purple. 8 min, red. 13 min, orange. 21 min, yellow. 34 min, green. 55 min,
blue. 89 min, purple. 144 min, red.
A
B

125
same absorption or are linearly related. The species in the present work could be
different secondary structures. The approximate locations of the isosbestic points are
1634, 1637, 1645, 1655 and 1668 cm–1
in PLO and 1608, 1645 and 1668 in PLEY.
The one at 1608 may be an artifact of baseline subtraction. Because 1645 and
1668 are apparent isosbestic points in both data sets, they may represent either the same
structural transition or two transitions that are common to both annealing processes.
Each spectrum was fit with a set of Gaussian functions. Each function had three fitting
parameters: mean, amplitude and standard deviation. Possible drying inconsistencies
between samples limited further analysis of the amide I band; water absorbs strongly in
this region.
D2O is often utilized in place of water in the spectral analysis of peptides and
proteins. The increase in the mass of hydrogen shifts the water absorption band out of
the amide I region. Deuterium also exchanges with labile protons in some amino acid
side chains and in the amide group in the polymer backbone. In the present work, PLEY
fiber samples were crosslinked with EDC in ethanol, rinsed briefly in water, annealed in
water for 4 h, dried with N2 gas to remove water, submersed in D2O for 0 to 1200 min,
dried again with N2 gas, stored in a dessicator for 24 h and then analyzed by FTIR.
The annealing time was chosen so that the process would be >95% complete
before samples were submersed in D2O (see Table 7.1). Any contribution by water to the
amide I spectra could thus be assessed. The rate of hydrogen exchange in backbone
amide protons depends on pH, sequence, temperature and protection from exchange by
hydrogen bonding, as in a secondary structure.

126
Figure 7.4 Spectral properties of crosslinked PLEY fibers after annealing in water for 4 h
and during incubation in D2O. A) Normalized amide I spectra. Different colors represent
different time points throughout the annealing process. B) Selected resonant frequencies
outside of the amide I region. Solid lines connect experimental data points. Broken lines
represent an exponential fit to the experimental data.
A
B

127
The amide I spectra thus obtained are presented in Figure 7.4A. Comparison with
Figure 7.3B shows that the spectral changes for the earliest time points are due in large
measure to the structural reorganization of polymers following the change of solvent;
water contributed little if any to the spectra in Figure 7.3. In addition, hydrogen
exchange had virtually no effect on the locations or intensities of the amide I peaks. An
interesting effect of D2O treatment was a change in time course of integrated intensities
of resonant frequencies outside the amide I region. Representative examples are
displayed in Figure 7.4B. The data suggest an underlying process with an overall time
constant longer than 200 min. The calculated intrinsic rate of exchange, that is, the
expected rate in the absence of protection in a secondary structure, was in the 0.4-1.0 s−1
range.14,15
The measured time constant therefore translates into a protection factor P =
7200 and a stability against exchange of ΔG = RTln(P) = 22 kJ mol–1
. The fibers in
Figure 7.3, by contrast, were not dried prior to data collection, and there was no exchange
of deuterium for hydrogen. Close examination of the time course data in Figure 7.4B
suggests that not one process but two occurred, possibly in sequence; the first being
essentially complete after about 40 min and the second after about 275 min.
EDX spectra have been obtained for PLEY fiber samples under different
conditions (Figure 7.5). The spectra were normalized for the intensity of the carbon
peak; all contributions to this peak were assumed to be due to peptide. The fiber mat was
especially thick for these samples, and the fibers were deposited on glass instead of ITO-
PET. In one case, fibers were neither crosslinked nor annealed. In another, fibers were
crosslinked but not annealed. In yet another, fibers were crosslinked and annealed in

128
Figure 7.5 EDX spectra of PLEY fibers before and after crosslinking and before and
after annealing in water at 22 °C.
water at 22 °C for 4 h. EDX analysis showed that little if any loss of Na+ occurred during
crosslinking but that a large amount of Na+ was lost from fibers during annealing.
Effects of temperature on annealing have been tested. Fiber morphology was
characterized by SEM. Representative data for PLEY are shown in Figure 7.6. Surface
defects are evident. There was no discernible difference in fiber morphology, however,
from annealing at room temperature (data not shown). Table 7.2 shows the kinetic
parameters for annealing at 45 °C. IR spectra were obtained at 0, 15, 45, 75, 300 and
3600 s. There was a significant reduction in time constant and increase in P0, the
apparent proportion of molecules in the product conformation, relative to annealing at 22
°C (Table 7.1).

129
Figure 7.6 PLEY fiber morphology after annealing at 45 °C. Arrows highlight surface
defects. Such imperfections are also found in PLEY fibers annealed at 22 °C and in
fibers that have not been annealed.
Table 7.2 PLEY fitting parameters for fiber annealing at 45 °C*
Absorbance band (cm–1
) R0a τa (min) R0b τb (min) P0
1339 140 0.37 180 7.4 75
1362 50 0.14 47 3.4 34
1455 240 0.44 220 5.3 160
1475 320 0.65 170 17 150
1747 50 0.08 170 1.3 94
Avg. 36 12 0.34 0.04 40 11 7 1 25 4
*Amplitude averages are reported as percentage mean S.D., time constant averages as mean
S.E.
The time constant fell by a factor of 21 for the fast phase and 9 for the slow. P0 increased
from 0% at the lower temperature (Table 7.1) to 25% at 45 °C (Table 7.2). The
calculated activation energy, Ea, was 100 kJ mol–1
for the fast phase and 75 kJ mol–1
for
the slow, and the corresponding natural logarithms of the frequency factors were 40 L
mol–1
min–1
and 26 L mol–1
min–1
. Heating fibers to 45 °C did not “denature” them.

130
7.4 Discussion
A few general points are worth noting. The polymer chains of this study were
nominally randomly distributed in the electrospinning feedstock. Each was akin to a
denatured protein and nominally unstructured prior to spinning. There will have been
chain entanglement in the feedstock.5-7
This may have resulted in the formation of β
sheets between polymers.11
Some orienting of polymers may have occurred as feedstock
flowed through the electrospinning nozzle, the jet formed or the solvent evaporated.
Fiber formation was irreversible in any case. Polymers on or near the surface of a
polymeric material will show some structural preferences, whereas chains in the interior
of the material are more likely to adopt a random coil conformation at equilibrium.
Fibers were not preferentially ordered in this work. All fibers were crosslinked in situ.
Fiber annealing, done in water, will also have been irreversible. The process may have
involved transitions between kinetically-trapped states as internal stresses were relieved
by changes in electrical and van der Waals interactions and heat was exchanged with the
surrounding solvent. The enthalpy change for annealing was presumably non-zero but
possibly insignificant in comparison with the entropy change. Probable major
contributors to the entropy increase during annealing were fiber-associated water
molecules and counterions; there is vastly more translational freedom in bulk solution
than fibers. Annealing may result in a change in the average dielectric within fibers.
The amide I region is of particular interest in IR studies of proteins and peptides.
C=O bond stretching makes the main contribution to the IR spectrum in this range, and
the vibrational frequency has some dependence on the conformation of the polymer
backbone. Water, however, absorbs strongly at the same frequency, so it is often

131
replaced by D2O in transmission or ATR mode. D2O was not considered necessary for
the analysis leading to Figures 7.2 or 7.3, because the process was arrested by sample
dehydration immediately prior to data acquisition. The spectra in Figure 7.4, which were
obtained after sample treatment with D2O, support this view.
The fits shown in Figure 7.2 were obtained with a phenomenological model.
None of the absorption bands analyzed, however, was in the amide I region, where water
absorbs, and the phenomenological model plausibly represents two parallel pathways for
final structure attainment. On the parallel pathways view, the rate-limiting step for each
was the formation of a transition state that rapidly converted to a final product, and the
product in each case was a structure that is thermostable on the timescale of the
observations. The consecutive states model may have stronger intuitive appeal, and in
any case it has the same number of fitting parameters as the parallel pathways model.
What matters more here, however, is that the consecutive model simply did not fit the
experimental data well for any choice of parameters, and in all cases one of the fitted rate
constants was so large as to make the corresponding process virtually instantaneous. In
effect, then, the consecutive model was not essentially different from the model needed to
describe a single exponential decay, and the experimental data are inconsistent with a
process of this sort.
PLO fibers and PLEY fibers showed remarkably similar annealing kinetics
(Figure 7.2). The differences in parameters may be but are not necessarily attributable to
polymer structure (Table 7.1). The crosslinking processes were rather different. The
bound counterions were rather different. PLEY crosslinking in ethanol may have
resulted in the adoption of conformations or molecular interactions which had to be

132
undone for energy minimization to proceed in water (Figures 7.2 and 7.3). PLO was
crosslinked in the presence of water vapor. The upper bound on the average number of
crosslinks per PLO molecule was the degree of polymerization, whereas for PLEY it was
just 1.11
Crosslinks limit the number of conformations that coupled chains can adopt,
reducing entropy and increasing the rate at which an elastic material can reorganize after
deformation. It seems plausible, then, that if PLO chains were more constrained than
PLEY chains during annealing, and if other structural differences between the polymers
were comparatively insignificant, PLO chains will have annealed faster.
The fitting data in Table 1 may be interpreted as follows. P0, the offset parameter,
corresponds to the proportion of molecules in the P state when monitoring began. This
number may reflect an inherent tendency of molecules to adopt certain structures. It
could also be an artifact of sample preparation. Both PLO fibers and PLEY fibers were
rinsed briefly in water immediately after crosslinking. The completeness of solvent
replacement at the interface between PLEY fibers and bulk ethanol solution during
rinsing was not determined in this work. PLO fiber rinsing will not have involved gross
solvent replacement, however, because crosslinking was done in 25% glutaraldehyde in
water in the vapor phase. Therefore, if the fitting data are interpreted as showing that
15% of molecules were in the P state when PLO fiber annealing began, these molecules
were either in the P state before the first water rinse or they reached the P state by the end
of the final water rinse. In either case, about 65% of PLO molecules were in the P state
within ~10 min of annealing, and the remaining 35% of molecules reached this state
within about 2.5 h. On this view, the average annealing kinetics were different for PLO

133
fibers and PLEY fibers, but both displayed a biphasic time course and the percentages of
“fast” and “slow” molecules were roughly the same.
The annealing process may be summarized as follows. The starting material for
PLO fibers or PLEY fibers was apparently a mixture of Ra, Rb and P. Rb may be
identified as intermediate I, which converts rapidly to P but slowly back to Ra on the 144
min timescale. By the time a substantial number of Ra molecules have converted to Rb
during annealing, the percentage of molecules in the P state will be large, making the
time required for Rb to convert to P of little consequence for the magnitude of the slower
time constant. In other words, R0a = R0, R0b = I0 and I rapidly converts to P. This view is
presented in Figure 7.7.
Figure 7.7 Kinetic schemes for annealing of PLO or PLEY fibers in water.

134
6 Å
5 Å
N N
NN
First strand
Second strand
H
H H
H
Br–
6 Å
5 Å
C C
CC
First strand
Second strand
O
O O
O
Na+
Na+
Br–
Na+
A
B
C
D
Figure 7.8 Schematic of putative ion coordination in β sheets. A, B) Br– in PLO. C, D)
Na+ in PLEY. Panels B and D are drawn to scale. A, C) Part of the polymer backbone is
omitted for clarity. C) The carboxylate groups may be resonance structures.
PLO fibers comprise numerous bromide ions; PLEY fibers, sodium ions.11
Schematics of
key geometrical features of ideal anti-parallel β sheets in these fibers are shown in Figure
8. The distance between the α-carbons in residues i and i+2 in a given strand is ~6 Å.
The distance between strands is ~5 Å. Other relevant distances are the following: NH
bond length, 1.0 Å; CO bond length, 1.4 Å; Br– radius, 1.8 Å; Na
+ radius, 1.2 Å; water
radius, 1.4 Å; NH3 bond angle, 109°; and CO2 bond angle, 120°. Ignoring the natural
tendency of a β strand to twist, the bond angles and bond lengths translate into separation
distances of 1.15 Å between H and Br– in PLO and 1.5 Å between O and Na
+ in PLEY.
Of course, side chain bond can rotate, so actual separation distances will be smaller, even

135
with thermal agitation; the interposition of water molecules between O and Na+ in PLEY
seems improbable.
The number of ions coordinated as shown in Figure 8 will be limited by the amino
acid composition of PLEY and the side chain structure of PLO. For PLEY, only 4
residues in 5 are glutamic acid, so the odds of all 4 corners of a rectangular array of side
chains being glutamate are ~0.4, independent of the probability of ionization.
Crosslinking will not have had a large effect on the number of such structures, because
EDC-crosslinking of PLEY results in less than 1 crosslink per polymer molecule on the
average.11
For PLO, all residues are ornithine. Many side chains will be ionized at
neutral pH. The probability that all 4 corners of a rectangular array of side chains are
charged, however, will be diminished not only by the relatively short length of the
ornithine side chain but also by crosslinking, which can result in multiple crosslinks per
polymer on the average. As a rough approximation, the probability for all 4 corners of
the rectangle being ionized is ~0.4 at most. Of course, it is possible that fewer ligands
were required to coordinate counterions than depicted in Figure 7.7, and other
arrangements of side chains may have bound counterions just as well or better.
The EDX data in Figure 7.5 support the view that fiber annealing involved a loss
of counterions to the surrounding solution. Lyophilized PLEY is electroneutral; both
ionized polymers and Na+ counterions are present in lyophilized material, 1 counterion
for each ionized side chain. Dissolution of the lyophilized polymer in water, which itself
is electroneutral, does not nullify the electroneutrality requirement. Fiber production by
electrospinning requires extensive solvent evaporation. In the present work, the loss of
counterions was vastly less probable than the loss of water, despite the relatively small
136
mass of Na+, as each ion will have been surrounded by about 8 water molecules in
solution, making the effective mass of an ion far greater than 23 Da. As-spun fibers too
will be electroneutral. Few sodium ions will have been lost during crosslinking, because
the reagent was applied in 90% ethanol and Na+ is rather insoluble in ethanol. In water,
the solubility of NaCl is 360 g/kg at 25 °C, whereas in ethanol it is over 550-fold lower.16
Ethanol cannot solvate Na+ as well as water does at virtually any concentration.
The data in Figure 7.2 provide evidence of the structural reorganization of
crosslinked fibers upon submersion in water. The mobility of Na+ will have been greater
in hydrated than dehydrated fibers. Thermal fluctuations in fiber structure will have
increased the odds of release of Na+, and any released ions will have been rapidly
surrounded by water molecules and carried off into bulk solution. Hence the decrease in
the relative height of the sodium peak over time in the EDX data (Figure 7.4). The
increase in accessible volume upon release of Na+ from a fiber will have been vastly
greater than ~1000, the approximate ratio of liquid volume to fiber volume in the
experiments. There was therefore great potential for a gain in the entropy of Na+ during
PLEY fiber annealing in water. Ion release will have resulted in a net charge on the fiber,
but carboxylate will have converted rapidly to carboxyl by way of proton transfer from
bulk solvent, resulting in the release of OH− to solution and the maintenance of
electroneutrality. The newly formed carboxyl group will then have formed one or more
hydrogen bonds to donors or acceptors in the fiber, making the odds of unsatisfied
hydrogen bonding potential very low.
PLO fibers and PLEY fibers showed very similar amide I spectra after 144 min of
annealing, despite the substantial differences in average degree of polymerization, amino

137
acid composition, side chain structure and propensity to form secondary structures
(Figure 7.3). The average DP of PLO was about 4-fold greater than for PLEY. All
residues in PLO were potentially ionizable. It is rather unlikely that tyrosine side chains
were ionized under the conditions of the present experiments. Glutamic acid is a
relatively good helix former, better than tyrosine but not nearly as good as lysine.17
The
ornithine side chain has three methylene groups but is otherwise identical to lysine.
Nevertheless, ornithine forms helix less well than lysine; ionized groups repel each other
more effectively in ornithine than lysine. The hydrophobicity of the tyrosine side chain
may help promote β sheet formation. In any case, the locations of resonances in Figures
7.3 and 7.4A suggest that secondary structures formed no less well in PLO fibers than in
PLEY fibers.
Time (min)
0 5 10 15 20 25
m
ax (
cm
-1)
1622
1623
1624
1625
1626
1627
1628
1629
Figure 7.9 Resonance frequency trajectories. Data are plotted for the lines at c. 1624 cm–
1 in PLO fibers (open symbols) and in PLEY fibers (filled symbols). The fitted time
constants were 6.0 min for PLO and 4.9 min for PLEY.

138
Little evidence was obtained that the amide I absorption peaks migrated during
annealing. An exception was the resonance at 1624 cm–1
in PLO fibers and PLEY fibers
(Figure 7.9). The 5 cm–1
shift, from about 1628 cm–1
at 0 min to about 1623 cm–1
at 20
min, corresponds to an energy change of 60 J mol–1
, ~100-fold smaller than kT. A
reduction in wavenumber represents a more constrained, more hydrogen bonded, state.
For comparison, and to cite but one of numerous possible examples, the N-H stretching
frequency of N-methylformamide in CCl4 is about 3466 cm–1
, whereas in the presence of
an ether the frequency is about 3350 cm–1
, more than 100 cm–1
lower, due to hydrogen
bonding.18
The noted peak shifts in the present work are consistent with a change in the
local environment of an absorbing group or change in the structure of that group. In
general, however, there was little in the energy of the corresponding vibrational
transitions.
Line broadening in the amide I region, by contrast, decreased extensively and
rapidly with annealing time in water, for PLO fibers and PLEY fibers (Figure 7.3). This
suggests that conformational heterogeneity decreased as polymers self-organized and
fiber energy decreased; spectral bands are sharper for molecules in a rigid matrix than in
a low-viscosity solvent. Energy minimization during annealing may have involved some
changes in secondary structure, and presumably it will have increased the number of
backbone-backbone hydrogen bonds. The EDX data show that annealing involved the
release of ions from fibers, providing a significant entropic contribution to the free energy
change. Water molecules too will have been released in the process.
139
7.5 Conclusions
Self-organization kinetics of electrospun PLO and PLEY fibers during solvent
annealing has been studied. After being crosslinked in situ, fibers were annealed in water
at 22 °C. Analysis by Fourier transform infrared spectroscopy (FTIR) has revealed that
annealing involved fiber restructuring with an overall time constant of 29 min for PLO
and 63 min for PLEY, and that changes in the distribution of polymer conformations
occurred during the first 13 min of annealing. There was a substantial decrease in the
amount of Na+ bound to PLEY fibers during annealing. Kinetic modeling has indicated
that two parallel pathways better account for the annealing trajectory than a single
pathway with multiple transition states.
7.6 References
1. Verploegen, E., Mondal, R., Bettinger, C.J., Sok, S., Toney, M.F. and Bao, Z.
Adv. Func. Mater. 2010, 20, 3519–3529.
2. Brünger, A.T., Kuriyan, J. and Karplus, M. Science 1987, 235, 458–460.
3. Zhao, Y., Xie, Z.Y., Qu, Y., Geng, Y. and Wang, L. Appl. Phys. Lett. 2007, 90,
43504–43507.
4. Li, G., Yao, Y., Yang, H., Shrotriya, V., Yang, G. and Yang, Y. Adv. Funct.
Mater. 2007, 17, 1636–1644.
5. Teo, W.E. and Ramakrishna, S. Nanotechnology 2006, 17, R89–106.
6. Reneker, D.H., Yarin, A.L., Zussman, E. and Xu, H. Adv. Appl. Mech. 2007, 41,
44–195.
7. Greiner, A., Wendorff, J.H. Chem. Int. Ed. 2007, 46, 5670–5703.

140
8. Khadka, D.B., Haynie, D.T. Nanomedicine: NBM 2012, 8, 1242–1262.
9. Khadka, D.B., Haynie, D.T. ACS Appl. Mater. Interfaces 2010, 2, 2728–2732.
10. Khadka, D.T., Cross, M.C., Haynie, D.T. ACS Appl. Mater. Interface 2011, 3,
2994–3001.
11. Haynie, D.T., Khadka, D.B., Cross, M.C. Polymers 2012, 4, 1535–1553.
12. Haynie, D.T., Khadka, D.B., Cross, M.C., Gitnik, A., Nicole, L.K. Macromol.
Mater. Eng. 2013, 298, 529–540.
13. Chirgadze, Yu. N. and Nevskaya, N.A. Biopolymers 1976, 15, 627–636.
14. Bai, Y.; Milne, J. S.; Mayne, L.; Englander, S. W. Proteins: Struct. Func. Genet.
1993, 17, 150–158.
15. Connelly. G. P.; Bai, Y.; Jeng, M. F.; Englander, S.W. Proteins 1993, 17, 87–92.
16. Burgess, J. Metal Ions in Solution. New York: Ellis Horwood, 1978.
17. Pace, C. N. and Scholtz, J. M. Biophys. J. 1998, 75, 422–427.
18. Jović, B., Nikolić, A., Davidović and Petrović, S. J. Serb. Chem. Soc. 2010, 75,
157–163.
141
CHAPTER 8
BLENDED FIFBERS OF NOVEL ELASTIN-LIKE POLYPEPTIDES WITH
HIGHLY-IONIZED SYNTHETIC POLYPEPTIDE BY ELECTROSPINNING
8.1 Introduction
Engineered polypeptides are of increasing interest for the development of novel
materials.1-3
The structure of these polymers can be controlled at the monomer level and
genetically programmed for recombinant production in a microbial host, for example, E.
coli. Designed polypeptides can display a wide range of physical, chemical, biological
and mechanical properties, many of which cannot be realized by typical synthetic organic
polymers.4 Structural regularity, good biocompatibility and low cytotoxicity are potential
advantages of polypeptides over chemically-synthesized biomaterials.1 Polypeptides
constitute about half of the dry mass of the cell. The breakdown products of peptides are
amino acids, that is, components of biosynthetic pathways.
ELPs are repetitive polypeptides. Based on the structure of tropoelastin, ELPs
typically consist of some number of tandem repeats of Val-Pro-Gly-Xaa-Gly, where Xaa
is any amino acid except proline. Elastin, a naturally crosslinked form of tropoelastin, is
found in muscle, ligaments, cartilage and other soft vascular tissues, where it plays a key
biomechanical role.5 A technological advantage of ELPs over other repetitive
polypeptides6 is that they are routinely expressed at >200 mg/L in shaker flask culture

142
and in some cases as high as 1.6 g/L.7 Another potential advantage is the typically high
inverse transition (cold-denaturation) temperature of ELPs, which can enable rapid batch
purification by a simple, non-chromatographic process under mild conditions.8
Electrospinning is an inexpensive, reliable and scalable materials processing
method for fabricating continuous, ultra-fine fibers of nanoscale to microscale diameter
from polymers in solution.9-12
Electrospun fibers have been investigated for a variety of
applications. Active areas of current research and development include medical implants,
antimicrobial materials, wound dressings, drug delivery vehicles, enzyme immobilization
scaffolds, biomimetic actuators and sensors, and protective textiles.12,13
Many different
synthetic organic polymers and proteins derived from an animal or a plant source have
been utilized in fiber electrospinning. Usually, an organic solvent is required to make
synthetic polymers or proteins suitable for spinning. Designed peptides could enable
avoidance of animal- or plant-sourced materials, reducing the cost of polymer preparation
and eliminating or reducing the need for organic solvents.14
To date, few electrospinning studies have involved recombinant or synthetic
peptides. Huang et al. and Nagapudi et al. have electrospun a large recombinant ELP
from aqueous solution.15,16
SEM revealed that the fibers were barbed, and they dissolved
in water in the absence of crosslinks. Multiple steps were required for crosslinking. A
few years later, Minato et al. electrospun poly(γ-benzyl-L-glutamate), a synthetic non-
natural-amino-acid homopolymer, from a trifluoroacetic acid/trifluoroethanol feedstock.17
The polymer is water-insoluble. Analysis by infrared spectroscopy revealed evidence for
secondary structures in fibers. A few years later, Ner et al. presented electrospinning
results for a designed 84 kDa ELP, one that could potentially be crosslinked via lysine

143
side chains, mimicking elastin.18
We have recently found that the synthetic polypeptides
PLO and PLEY, which are highly charged under usual conditions, are spinnable in water
at neutral pH.19
The fibers are stabilized by counterions, Br− for PLO and Na
+ for PLEY.
Each PLO side chain has a terminal amino group, which is reactive towards
glutaraldehyde, a small symmetrical molecule. The carboxylic acid side chains in PLEY
are crosslinked to N-terminal amino groups by 1-ethyl-3-(3-dimethylaminopropyl)
carbodiimide (EDC).20
In the absence of crosslinks, PLO fibers and PLEY fibers
dissolve rapidly in water.
An important question for peptide-based materials research is whether
advantageous material properties can be realized by blending polypeptides of different
structure, and if so, whether the compatibility of polymers will depend on details of
structure. Here, genes encoding ELPs were designed and utilized for recombinant
production of the corresponding peptides. Each ELP consisted of 50 tandem repeats of
Val-Pro-Gly-Xaa-Gly (VPGXG) and had a small net charge at neutral pH. ELP
spinnability from an aqueous feedstock was tested, alone and when blended with PLEY.
Polymer structure was analyzed by physical methods in solution and in fibers. Fiber
morphology was analyzed by SEM. Possible phase separation of polymers in fibers was
analyzed by fluorescence microscopy.
8.2 Materials and methods
PLEY (20-50 kDa by viscometry) was obtained from Sigma (USA) as lyophilized
polydisperse salts. The counterions were Na+. Aqueous feedstocks for electrospinning
were prepared by dissolving as-received peptide in deionized water (50% w/v or 14 mM

144
polymer). The feedstock solutions will therefore have consisted of three main
components: water (and its ionized forms), ionized polypeptide and counterions.
Three ELPs, each consisting of 50 tandem pentapeptide motifs, were studied:
“V40C2”, “E14” and “K14”. In V40C2, Cys (C) was substituted in for X in two VPGXG
pentapeptides. Each VPGCG was combined with two copies of (VPGVG)2 to give
(VPGVG)2VPGCG(VPGVG)2, and both of these 25-residue sequences were situated in
tandem at the C-terminus of the ELP. The 200 residues of ELP towards the N-terminus
of the peptide consisted of (VPGVG)40. In addition, there was a 5-residue cloning artifact
at the N-terminus, MGPGW. V40C2 has no ionizable side chains besides those of Cys,
which has a nominal pKa of 8.5.21
In E14, X was Glu (E) in 14 pentapeptides. The
VPGEG sequences were distributed uniformly throughout the chain. In addition, X was
Lys (K) in 2 pentapeptides in E14. The VPGKG sequences were located near the N-
terminus and near the C-terminus of the ELP. In K14, K was substituted for E and vice
versa. The Glu side chain features a terminal carboxyl group; Lys has a side-chain amino
group. The nominal pKas of these groups are 4.07 and 10.53, respectively. Further
details of polymer sequence are provided in supporting information.
The V40C2 expression plasmid has been described elsewhere.22
Expression
plasmids for E14 and K14 were constructed as follows. For each, a pMA cloning vector
containing a synthetic gene (Invitrogen, USA) that consisted entirely of highest-
frequency codons was digested with PflMI (New England BioLabs, USA) at 37 °C for 1
h. The reaction product was then purified with QIAquick Spin Columns (Qiagen, USA)
and digested with HindIII (New England BioLabs) at 37 °C for 1 h. The final products
were verified on a 1.2% agarose gel and purified for ligation in a modified pET-25b(+)

145
expression vector.22
Purified vector was prepared for molecular cloning by digesting
with BglI (New England BioLabs) at 37°C for 1 h, purifying the product as described
above, and digesting with HindIII at 37 °C for 1 h. The product was verified and purified
as described above. Each digested synthetic gene was ligated into the expression vector
with Quick Ligase (New England BioLabs) and then transformed into NovaBlue
competent cells (Novagen, USA). The transformation product was plated on LB agar
containing 100 μg/mL carbenicillin (LB Carb100) and incubated overnight at 37 °C.
Distinct colonies were screened by colony polymerase chain reaction (PCR),
utilizing standard T7 promoter and terminator primers. Positive clones were grown
overnight in LB Carb100, and plasmid DNA was purified from the overnight cultures with
QIAprep Spin Miniprep Kit (Qiagen). The insert was further verified by digesting the
plasmids with BglI and HindIII as described above. Positive plasmid DNA, that is,
modified pET-25b(+) containing the E14 or the K14 insert, was then transformed into
BLR(DE3) competent cells (Novagen). Transformation products were plated onto LB
Carb100 agar and incubated overnight at 37 °C. Distinct colonies were screened by
colony PCR utilizing standard T7 promoter and terminator primers. Positive clones were
utilized for recombinant protein expression.
5-mL starter cultures of V40C2, E14, and K14 clones were grown overnight in 5
mL Terrific Broth (TB) supplemented with 11.5 g/L proline and 100 g/mL carbenicillin
at 37 °C with shaking at 250 rpm. 1 L of TB media supplemented with 11.5 g/L proline
and 100 g/mL carbenicillin was then inoculated with the starter culture and grown
overnight (16 h) at 37 °C with shaking at 250 rpm. Bacterial cells were harvested by
centrifugation at 5,000g for 20 min at 4 °C. Bacterial pellets were resuspended in ice

146
cold phosphate-buffered saline (PBS) and lysed by sonic disruption. The cell lysate was
cleared of insoluble debris by centrifugation at 20,000g for 15 min at 4 °C. The
supernatant was cleared of nucleic acid by addition of 0.5% (w/v) polyethylenimine and
centrifugation at 20,000g for 15 min at 4 °C. The supernatant was retained for inverse
transition cycling. To improve the precipitation of V40C2, E14, and K14, 1-3 M NaCl
was added. Precipitation/aggregation of V40C2 supernatant was done at 42 °C for 15
min. For E14, the temperature was 45 °C and the time was 30 min. For K14, it was 50
°C for 30 min. ELPs were then pelleted by centrifugation at 10,000g for 15 min at 40
°C. The pellet was completely resuspended in ice-cold PBS containing 10 mM DTT and
centrifuged at 15,000g for 15 min at 4 °C to remove insoluble bacterial contaminants.
This process was repeated twice more, and the product was resuspended in 20 mL
deionized (DI) water. Polymers were then dialyzed in DI water and lyophilized for
storage. Polymers were analyzed by CD and DLS. CD spectra were normalized for
polymer concentration, which was estimated on the basis of the number of tryptophan
residues in each polymer and the absorbance of tryptophan at 280 nm.
Feedstocks were prepared by dissolving lyophilized ELP, alone or with PLEY, in
deionized water at different concentrations (Table 8.1). Blend concentrations are shown
as weight-average concentrations [(c1v1 + c2v2)/(v1 + v2), where c represents concentration
and v, volume]. Feedstock conductivity was measured with a PC 510 Oakton
Instruments benchtop conductivity meter (USA) at a polymer concentration of 1 mg/mL.
Fibers were spun as described elsewhere.20,23-25
All fiber production was carried out at
ambient temperature, pressure and humidity. ELP/PLEY fiber blends were crosslinked at
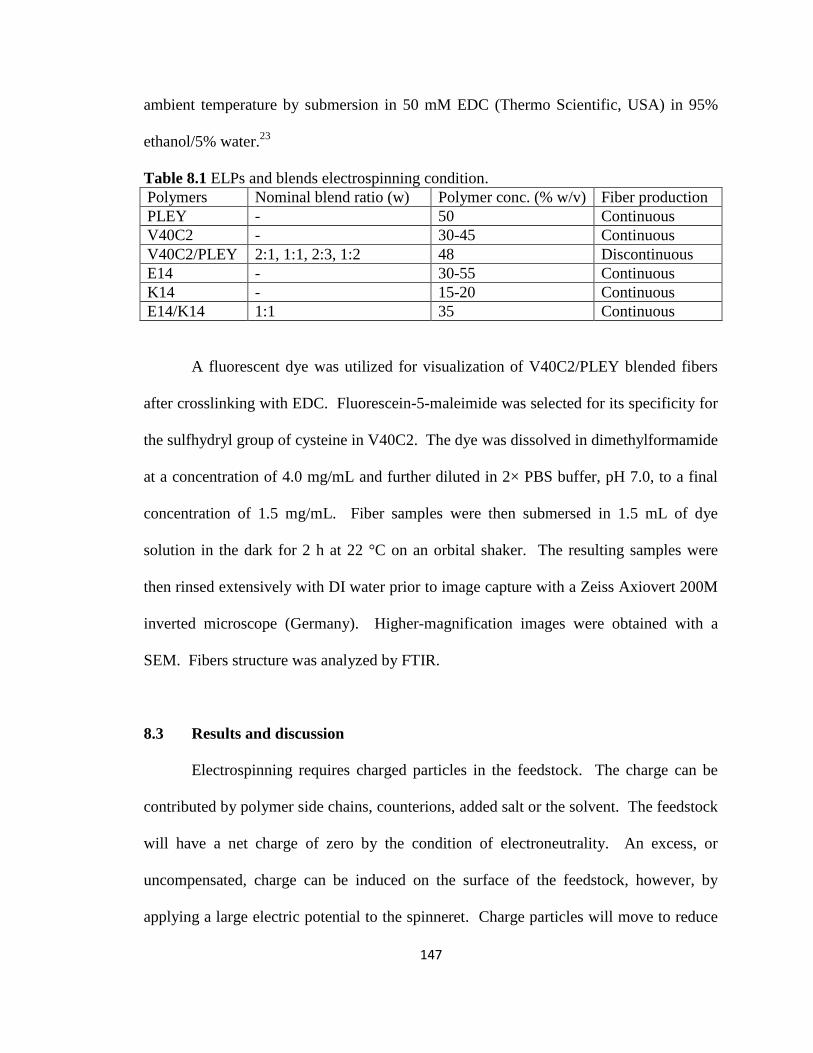
147
ambient temperature by submersion in 50 mM EDC (Thermo Scientific, USA) in 95%
ethanol/5% water.23
Table 8.1 ELPs and blends electrospinning condition.
Polymers Nominal blend ratio (w) Polymer conc. (% w/v) Fiber production
PLEY - 50 Continuous
V40C2 - 30-45 Continuous
V40C2/PLEY 2:1, 1:1, 2:3, 1:2 48 Discontinuous
E14 - 30-55 Continuous
K14 - 15-20 Continuous
E14/K14 1:1 35 Continuous
A fluorescent dye was utilized for visualization of V40C2/PLEY blended fibers
after crosslinking with EDC. Fluorescein-5-maleimide was selected for its specificity for
the sulfhydryl group of cysteine in V40C2. The dye was dissolved in dimethylformamide
at a concentration of 4.0 mg/mL and further diluted in 2× PBS buffer, pH 7.0, to a final
concentration of 1.5 mg/mL. Fiber samples were then submersed in 1.5 mL of dye
solution in the dark for 2 h at 22 °C on an orbital shaker. The resulting samples were
then rinsed extensively with DI water prior to image capture with a Zeiss Axiovert 200M
inverted microscope (Germany). Higher-magnification images were obtained with a
SEM. Fibers structure was analyzed by FTIR.
8.3 Results and discussion
Electrospinning requires charged particles in the feedstock. The charge can be
contributed by polymer side chains, counterions, added salt or the solvent. The feedstock
will have a net charge of zero by the condition of electroneutrality. An excess, or
uncompensated, charge can be induced on the surface of the feedstock, however, by
applying a large electric potential to the spinneret. Charge particles will move to reduce
148
repulsive interactions and establish a constant electrical potential everywhere on the
surface. In the present work, ELPs had a charge per unit length of polymer close to zero,
whereas PLEY, an anionic polypeptide, was highly charged under the conditions for
electrospinning. All spinning was done from aqueous feedstocks.
We found in previous work that PLEY is spinnable from water at neutral pH, but
that the closely related peptide poly(L-glutamic acid) (PLGA), which has a higher charge
per unit length under the same conditions, is not spinnable.23
We have also shown that
crosslinked PLEY fibers are polar in aqueous solution at neutral Ph.20
Here, the
concentration of ionized PLEY side chains and counterions ions was orders of magnitude
greater than the concentration of water ions in the feedstock. The ELPs, by contrast, had
few or no ionized side chains. Neither of the two Cys residues of V40C2 was expected to
be ionized at neutral pH. E14 has 14 Glu and 2 Lys side chains, which translates into an
expected net charge of −12 electronic charges at neutral pH. For K14, the expected net
charge was +12 electronic charges at neutral pH. The measured conductivity of 1 mg/mL
solutions of PLEY, E14 and K14 were 96.2 μS/cm, 15.3 μS/cm and 17.3 μS/cm; the
conductivity of DI water 1.1 μS/cm. 1 mg/mL PLEY was 14-fold less concentrated than
50% (w/v) PLEY. E14 and K14 were dialyzed extensively, though not exhaustively,
prior to lyophilization. The conductivity measurements show that ions remained
associated with E14 and K14 after dialysis, as expected. The charge requirements for
polymer spinnability were met mostly by polymer side chains and counterions for PLEY
and by residual ions following dialysis for ELP.
Figure 8.1 shows representative SEM images of the morphology of E14 fibers
spun from aqueous feedstocks at a nominal concentration in the 30-55% (w/v) range.

149
The other electrospinning parameters were constant, though increasing the polymer
concentration will also have increased the conductivity of solution. Fiber diameter
depended strongly on concentration. The average size was <1 m at 30%, and the
variance was large (Figure 8.1A). As the polymer concentration increased, the average
diameter increased and the variance decreased.
Numerous beads and branched fibers were obtained at 30% polymer. The
capillary instability of a cylindrical fluid jet results in bead formation.26
The surface
energy of an element of a jet is higher than the surface energy of a sphere of the same
volume. Excess electrical charges carried with the jet will create a strong elongational
flow and stabilize or destabilize the capillary instability, depending on the wavelength of
the bead-forming instability.27
The stretching of entangled polymers between growing
droplets can result in the formation beads on a string, which then solidify upon solvent
evaporation. Increasing the viscoelasticity of the polymer feedstock or the concentration
of dissolved salt can stabilize the jet against bead formation.26
At 35% polymer, beads were less numerous than at lower concentrations but
branches formed (Figure 8.1B). Branching results from the ejection of small jets from
the primary jet, and it is explained in much the same way as the ejection of the primary
jet from the charged droplet on the electrospinning die. As the primary jet moves toward
the collector, changes in both the charge density and the local polymer concentration
result in local instabilities, and energy is minimized by the formation of smaller jets.
Branching tends to decrease on increasing the polymer concentration.18
Secondary jet
formation is retarded by a high local concentration of polymer chains in the primary jet,
which minimizes local instabilities by inhibiting solvent evaporation.13,28

150
Figure 8.1 E14 fiber morphology at different polymer feedstock concentrations. A) 30%,
B) 35%, C) 45%, D) 50% and E) 55% (w/v). The applied voltage was 10 kV, the
spinneret-collector distance was 9 cm and the flow rate was 0.5 μL/min.
At 50-55% polymer, uniform, predominantly flat, ribbon-like fibers were obtained
(Figures 8.1D and 8.1E).16,18
The viscosity and surface tension were apparently high
enough at this concentration for continuous fiber production. Ribbon-like fibers are
believed to result from the rapid evaporation of solvent from the jet surface. A solid-like
skin thus forms around a liquid-like core of the electrospinning jet. The tube then
collapses into a ribbon at the collector as the remaining solvent evaporates.13,28
Polymers
having a tendency to form strong intra- and inter-chain interactions may be able to form
semi-crystalline microparticles in solution and thus increase the odds of ribbon-like fiber
production in electrospinning.29
A B C
D E

151
Electrospinning of natural proteins has proved a challenge.14
Proteins do not
behave like typical organic polymers. Most proteins have complicated amino acid
sequences, consisting of as many as 20 different monomers, each chemically different.
Natural polypeptides tend to adopt complicated and compact three-dimensional structures
under mild conditions.
Figure 8.2 PLEY and PLEY/V40C2 fibers. Crosslinked PLEY fibers were imaged by
(A) bright field microscopy, (B) PLEY auto-fluorescence, and (C) fluorescein
fluorescence (negative control for panel F). V40C2: PLEY:: 1:1 fibers were imaged by
(D) bright field microscopy, (E) PLEY auto-fluorescence, and (F) fluorescein
fluorescence. Bright field images have been inverted and equalized to increase contrast;
there was no processing of the fluorescence micrographs. All images were taken at 10×
objective magnification.
A B C
D E F

152
Consequently, proteins studied to date have required solubilization by an organic solvent
to achieve change entanglement, a requirement of fiber formation. Various proteins have
been blended and co-spun with synthetic polymers to achieve spinnability or to confer a
biological aspect on fibers.14
Nagepudi et al. utilized visible-light irradiation to crosslink
acrylate-modified ELP fibers (Nagapudi et al., 2002). They then estimated the degree of
crosslinking by 13
C solid-state NMR. The insolubility of the crosslinked fibers in water
provided further evidence for crosslinking. Welsh et al. have crosslinked an ELP film
with glutaraldehyde via available lysine residue.30
Urry et al. have generated tubular
hydrogels of ELP by γ-irradiation-mediated cross-linking.31
None of these studies
provided a detailed determination of the crosslink locations.
The present work found that V40C2 is spinnable. V40C2 fibers dissolved rapidly,
however, in ethanol or water (data not shown). Crosslinked V40C2 fibers were obtained
by blending the polymer with PLEY in the feedstock. Different concentration ratios were
tested for spinning. The resulting fibers were then crosslinked with EDC in ethanol. The
blended fibers were apparently sufficiently insoluble in ethanol for EDC crosslinking of
PLEY, which is insoluble in ethanol.
Figure 8.2 shows PLEY and PLEY/V40C2 fibers imaged by light microscopy
(panels A and D) or fluorescence microscopy (panels B, C, E and F). Comparison of
panels A and B reveals that PLEY fibers were autofluorescent at 390 nm (DAPI filter).
A classic study by Lehrer and Fasman (1967) suggests that the autofluorescence was due
to bi-tyrosine, which forms on exposure of tyrosine to UV,32
or possible incomplete
removal of fluorescing side chain protecting groups. We attempted to label crosslinked

153
PLEY fibers in situ with fluorescein-5-maleimide. This reagent is reactive toward
sulfhydryl, forming at stable thioether bond. The result of the labeling reaction was
negative, as expected: no fluorescence was detected with a fluorescein filter (Figure
8.2C); PLEY has no free sulfhydryl groups. In panels D-F, the mass concentration ratio
for PLEY/V40C2 fiber spinning was 1:1. Crosslinked fibers were labeled in situ with
fluorescein-5-maleimide. Comparison of panels D and F shows that PLEY/V40C2 fibers
became labeled, demonstrating at once that sites on ELP were accessible to the solvent
during the labeling reaction, blended fibers could be spun from the 1:1 feedstock, and any
phase separation of the polymer species occurred on a length scale smaller than the
resolution limit of the light microscope, if at all. Blending PLEY with V40C2 in fibers
also sharply reduced the auto-fluorescence of PLEY (Figure 8.2E). It is not clear whether
this reduction was more attributable to chromophore dilution, a change in the surrounding
environment of chromophores or some other cause.
Examples of the morphology of blended fibers are presented in Figure 8.3. A
ribbon-like morphology is seen in panel A. The nominal polymer concentration was 48%
(w/v); the polymer mass ratio was 2:1 for V40C2: PLEY. Ribbons have not been
obtained for PLEY electrospinning at any concentration.20,23,24
As a jet dries, the tensile
and compressive strength of the skin will increase and may dominate the effective surface
tension and rheological properties of the polymer solution. It the circular cross-section of
the jet shrinks uniformly, a cylindrical fiber will result. If the skin solidifies quickly, by
contrast, a skin of high mechanical strength will form prior to the complete evaporation
of solvent. Further, if the skin remains intact as evaporation proceeds, the tube will

154
Figure 8.3 Scanning electron microscope image of a non-woven fibers electrospun from
blend feedstock. In each case nominal final polymer concentration was 48% (w/v) A)
V40C2:PLEY::2:1, B) V40C2:PLEY::1:1, C) V40C2:PLEY::2:3, D) V40C2:PLEY::1:2.
collapse into a ribbon, probably on the collector.13 Different morphologies were obtained
at different mass ratios of V40C2 and PLEY. Figures 8.3B-D show networked fibers.
Such networks are formed when two different partially solidified segments of jets
intersect with each other. Formation of these structures will stiffen a non-woven sheets.13
The surface properties of electrospun fibers are relevant to end-use applications.
The ability to introduce porous features of a known size, for example, could be useful for
depositing nanoparticles on the fiber surface or, if drug molecules are to be incorporated,
for controlled release. Figure 8.3B shows evidence of pores on the surface of fiber
C
A B
D

155
networks. Casper et al. have studied the effect of increasing humidity and varying the
molecular weight of polystyrene on nonwoven pore size and distribution.33
Pores began appearing on the fiber surface when the relative humidity rose to
30%. Further increases in the humidity increased the number, diameter, shape and
distribution of the pores. Increasing the molecular weight of the polymer resulted in
larger, less uniform pores. There is substantial agreement among electrospinning
researchers that porous membrane morphology depends on liquid-liquid phase
separation.34
Figure 8.4 Infrared analyses of cast films and fibers. All but the amide I envelope was
subtracted from the spectra during baseline treatment. All spectra were normalized for the size
of the amide I envelope.

156
The present fluorescence microscopy data show that V40C2/PLEY fibers were
relatively uniform mixed for all concentration ratios of the two polymers in the feedstock
was tested. It therefore appears that phase separation, humidity or molecular weight
alone cannot fully explain pore formation.
In previous studies we found that PLEY fibers spun from aqueous solvent had a
significant percentage of residues in a secondary structure.20
Figure 8.4 compares the
amide I band for PLEY, V40C2, E14, K14 and PLEY-V40C2 blend cast films and fibers.
The data show that each polymer formed predominantly random coils (bands at 1636
cm−1
and 1652 cm−1
) and β sheets (bands at 1617 cm−1
, 1624 cm−1
, 1617 cm
−1, 1682 cm
−1
and 1698 cm
−1) in cast films and fibers.
8.4 Conclusions
Novel ELPs having a small charge per unit length at neutral pH and an
approximate molecular weight of 22 kDa have been prepared by recombinant synthesis
and electrospun from aqueous solution, alone and in blends with PLEY, a polyionic
synthetic polypeptide. Blended fibers of ELP and PLEY were spun and crosslinked in
ethanol, despite the high solubility of ELP in this solvent. The shape and surface
morphology of ELP fibers depended strongly on concentration and on the blend ratio
with PLEY. Analysis of blended fibers by fluorescence microscopy showed that two
polymers were uniformly mixed. Blended fibers displayed morphological properties,
namely, pores, which were not displayed by ELP alone or PLEY alone.

157
8.5 References
1. Langer, R.; Tirrell, D. A. Nature 2004, 428, 487−492.
2. Chilkoti, A.; MacEwan, S. R. Biopolymers 2010, 94, 60−77.
3. Scheller, J.; Floss, D. M.; Schallau, K.; Rose-John, S.; Conrad, U. Trends
Biotechnol 2010, 28, 37−45.
4. Nagapudi, K.; Brinkman, W. T.; Leisen, J.; Thomas, B. S.; Wright, E. R.; Haller,
C.; Wu, X. Y.; Apkarian, R. P.; Conticello, V. P.; Chaikof, E. L. Macromolecules
2005, 38, 345−354.
5. Gray, W. R.; Sandberg, L. B.; Foster, J. A. Nature 1973, 246, 461−466.
6. Tatham, A. S.; Shewry, P. R. Trends Biochem Sci 2000, 25, 567−571.
7. Chilkoti, A.; Chow, D. C.; Dreher, M. R.; Trabbic-Carlson, K. Biotechnol Progr
2006, 22, 638−646.
8. Meyer, D. E.; Chilkoti, A. Nat Biotechnol 1999, 17, 1112−1117.
9. Greiner, A.; Wendorff, J. H. Angew Chem Int Ed Engl 2007, 46, 5670−57703.
10. Schiffman, J.; Schauer, C. Polym Rev 2008, 48, 317−358.
11. Teo, W. E.; Ramakrishna, S. Compos. Sci. Technol. 2009, 69, 1804−1817.
12. Bhardwaj, N.; Kundu, S. C. Biotechnol. Adv. 2010, 28, 325−347.
13. Reneker, D. H.; Yarin, A. L. Polymer 2008, 49, 2387−1425.
14. Khadka, D. B.; Haynie, D. T. Nanomed-Nanotechnol 2012, 8, 1242−1262.
15. Huang, L.; McMillan, R. A.; Apkarian, R. P.; Pourdeyhimi, B.; Conticello, V. P.;
Chaikof, E. L. Macromolecules 2000, 33, 2989−2997.

158
16. Nagapudi, K.; Brinkman, W. T.; Leisen, J. E.; Huang, L.; McMillan, R. A.;
Apkarian, R. P.; Conticello, V. P.; Chaikof, E. L. Macromolecules 2002, 35,
1730−1737.
17. Minato, K.; Ohkawa, K.; Yamamoto, H. Macromol. Biosci. 2006, 6, 487−495.
18. Ner, Y.; Stuart, J. A.; Whited, G.; Sotzing, G. A. Polymer 2009, 50, 5828−5836.
19. Khadka, D. B.; Haynie, D. T. ACS Appl. Mater. Interfaces 2010, 2, 2728−2732.
20. Donald T. Haynie, D. B. K., Michael C. Cross Polymer 2012, 4, 1535−1553.
21. Nelson, K. J.; Parsonage, D.; Hall, A.; Karplus, P. A.; Poole, L. B. Biochemistry-
Us 2008, 47, 12860−12868.
22. Koria, P.; Yagi, H.; Kitagawa, Y.; Megeed, Z.; Nahmias, Y.; Sheridan, R.;
Yarmush, M. L. Proceedings of the National Academy of Sciences of the United
States of America 2011, 108, 1034−1040.
23. Khadka, D. B.; Cross, M. C.; Haynie, D. T. Acs Appl Mater Inter 2011, 3,
2994−3001.
24. Donald T. Haynie, D. B. K., Michael C. Cross, Alina Gitnik and Nicole Le
Macromol. Mater.Eng. 2013, 6, 529−540.
25. Khadka, D. B.; Haynie, D. T. ACS Appl Mater Interfaces 2010, 2, 2728−2732.
26. Fong, H.; Chun, I.; Reneker, D. H. Polymer 1999, 40, 4585−4592.
27. Huebner, A. L.; Chu, H. N. J Fluid Mech 1971, 49, 361−372.
28. Koombhongse, S.; Liu, W. X.; Reneker, D. H. J Polym Sci Pol Phys 2001, 39,
2598−2606.
29. Koski, A.; Yim, K.; Shivkumar, S. Mater Lett 2004, 58, 493−497.
30. Welsh, E. R.; Tirrell, D. A. Biomacromolecules 2000, 1, 23−30.

159
31. Urry, D. W.; Pattanaik, A. Ann Ny Acad Sci 1997, 831, 32−46.
32. Lehrer, S. S.; Fasman, G. D. Biochemistry-Us 1967, 6, 757−767.
33. Casper, C. L.; Stephens, J. S.; Tassi, N. G.; Chase, D. B.; Rabolt, J. F.
Macromolecules 2004, 37, 573−578.
34. vandeWitte, P.; Dijkstra, P. J.; vandenBerg, J. W. A.; Feijen, J. J Membrane Sci
1996, 117, 1−31.

160
CHAPTER 9
CHARACTERIZING MECHANICAL PROPERTIES OF POLYPEPTIDE
ELECTROSPUN SINGLE FIBERS USING ATOMIC FORCE MICROSCOPY
4.1 Introduction
AFM offers the opportunity to measure the topography of surfaces at the
nanoscale, and to investigate the mechanical properties of surfaces and fibers at the same
length scale. Mechanical properties are determined by utilizing an AFM tip to apply a
nanoscale force on the sample surface. Young’s modulus can be estimated from
measured mechanical properties of the material, the cantilever and the AFM tip
information. Here, we have characterized mechanical properties of individual
electrospun polypeptide fibers. Young’s modulus of individual electrospun polypeptide-
based nanofiber has been measured by a three-point bending method. This method is
based on the elastic response of the materials from the force curve by AFM.
Most bending techniques reported in the literature are three-point bending tests
(Fig. 9.1) on suspended nanofibers spanning a gap, with their two ends fixed on a
substrate, in accordance with Euler-Bernoulli beam theory1. The elastic modulus of these
fibers can be determined by measuring the deflection of the fibers after an AFM tip
applied a force at the centre point of the suspended fibers.2,3
Several models can be
applied to analyze the behavior of a beam under loading. However, these models differ

161
in their assumptions and the level of accuracy. The Euler- Bernoulli model is one of the
simplest models, and was developed based on the assumption that the beam’s deflection
is small enough that the restoring force is only due to the compressive and tensile stresses
along the axis of the beam. For long, slender beams of isotropic materials with uniform
solid cross section, these assumptions are valid.1
In the three point bending method, the nanofiber was taken as an isotropic beam
suspended over a microsized groove etched on a glass substrate. Due to the adhesion
between the fiber and the glass substrate and the much greater length of the nanofiber
than the suspended length, it is reasonable to assume that both ends of the nanofibers are
fixed and remain in place even after the test is conducted.
The AFM tips were dulled by strongly tapping them with the AFM against a hard
glass substrate for more than 25 min. The resultant radii of curvature of the tips were
comparable to the fiber diameters, and thus it was unlikely that they would penetrate the
Figure 9.1 Major components of an atomic force microscope (AFM). Adapted from Sara
Makaremi thesis "Nanomechanics of Electrospun Fibres."

162
fiber. Force curves were acquired at the mid points of the suspended fibers (Fig.
9.2), and the rigid flat areas of the glass substrate. Slopes of the force calibration plots
were measured from the contact region of the approach curves. On the glass surface, the
cantilever’s deflection (Δy) is found to be equal to the sample displacement (Δz).
As shown in Figure 9.5, the slopes obtained on the glass substrate are steeper
compared with that of the suspended portion. The theoretical slope (dy/dz) on the glass
substrate was equal to unity. This value was used to calibrate the cantilever deflection’s
sensitivity (Δy). For the suspended portion of the fiber, the total piezo displacement is
greater than the deflection of the cantilever (Δz > Δy). This is due to the fiber’s
deformation δ (i.e., Δz = Δy + δ). Therefore the slope obtained from the suspended fibers
of the force plot is less than unity (i.e., dy/dz < 1). The section analysis of height image
was used to measure the fiber diameter on which the fiber deflection was measured.
For a fiber of suspended length L, a concentrated force F applied at the middle
point (L/2) (Fig. 9.1), the beam’s deflection is given by4
Where I is the area moment of inertia of a circular cross-section beam and Eb is the
Young’s modulus.
For a solid beam with circular cross section, the area moment of inertia is given by
Where d is the diameter.

163
The applied force by the cantilever on the suspended fiber is given by ,
where k is the spring constant of the cantilever and is the deflection of the cantilever
from its equilibrium position. Then Equation 9.1 reduced to
As the piezo scanner moves vertically, its displacement is given by the sum of the
cantilever deflection and the fiber deflection.
Therefore, combining equation (9.3) and (9.4) gives:
The Young’s modulus of the fiber is the only unknown variable in equation (9.6).
It is determined by solving equation (9.6) with measured slope, diameter and cantilever
tips information.
A schematic illustration of the experimental set up for determining Young’s
modulus as outlined above is shown in the Figure 9.1. A force calibration plot is an
observation of tip-sample interactions (Figure 9.2), and it gives information regarding the
sample and tip interaction (Figure 9.5). In Force Calibration mode, the x and y voltages
applied to the piezo tube are zero and a triangular waveform is applied to z electrodes of
the piezo tube. The cantilever tip moves up and down relative to the stationary sample,
as a result of the applied voltage.

164
As the piezo moves the tip also moves up and down, the cantilever-deflection
signal from the photodiode is monitored. The force curve just plots the cantilever
deflection signal as a function of the voltage applied to the piezo tube. By adjusting the
detailed parameters controlling the microscope, a complete force curve can be displayed.
A typical example force curve is shown in Figure 9.2. The horizontal axis plots
the tip movement relative to the sample. By extending the z-axis piezo crystal, the tip
descends toward the sample and the tip-sample distance decreases. The descent plots
from right to left from point 0 to 3 in Figure 9.2. By retracting the z-axis piezo crystal,
the tip ascends away from the sample, and the tip-sample distance increases. The ascent
plots from left to right from point 3 to 5 in Figure 9.2 Cantilever deflection plots on the
vertical axis of the graph. When the cantilever deflects downward, it plots on the graph’s
downward vertical; when it deflects upward, it plots on the upward vertical. A detailed
process is described step by step as following:
1. Starting from point 0 to 1, piezo extends; tip descends toward the sample surface,
but at this moment there is no tip-sample contact.
2. As tip approaching the sample surface, an attractive force near the surface pull tip
down (point 1to 2). The tip begins to press into the surface, and the cantilever
bends upward. The deflection of the cantilever vs. descending distance of the
piezo is plotted as a straight line from point 2 to 3.
3. After reaching the z limit, piezo tube retracts. The tip ascends until forces are in
equilibrium with surface force. Then tip ascends further, but cantilever bends
downward as surface attraction holds onto the tip. At a certain critical point 4, the
bending force overwhelms the surface attraction.

165
4. Cantilever rebounds sharply upward (point 4 to 5). Then the tip continues
ascending without any contact with the sample surface (point 5 to 0). A circle
ends at point 0.
Figure 9.2 An experimental force curve with schematic labeling at corresponding tip-
sample interaction points.
Force curves provide the important information about the elasticity of the sample
material. Cantilever deflection is directly related to the material’s elastic properties. For
hard materials, the cantilever experiences larger deflections as compared with softer
samples.The Euler-Bernoulli beam theory1 was used in this study to analyze the
behaviour of all PLO and PLEY electrospun fibers.5-7
This model is based on the
assumption that the supported ends of the fiber remain attached to the substrate when the
force is applied. Here, we have estimated young modulus of the PLO and PLEY
123
5
123
4
3
3
1
0
0
1
2
0
0
0
1
0
3
0
4
0
5
0

166
individual fibers by using AFM bending beam technique. This work will be crucial for
advancing towards a molecular understanding of the physical properties of peptide-based
materials.
4.1 Material and methods
Substrates for fiber analysis were prepared by cutting 20-μm- and 50-μm-wide
and 20-μm-deep trenches on glass slides. A standard diamond saw (Disco Hi-tec
America Inc.) available in Nanotechnology Research and Education Center (NREC) were
used to make trenches. Aligned fibers were spun directly over the trenches using parallel
electrodes.6 A Digital Instruments Dimension 3100 AFM (Santabarbara, CA) available
in NERC was used in contact mode. A tip attached to the end of a cantilever was
scanned across the sample surface while the change in cantilever deflection was
monitored with a photodiode detector. A cantilever that is soft enough to be deflected by
very small forces and that has a high enough resonant frequency to not be susceptible to
vibrational instabilities is needed.
To obtain observable cantilever deflection, triangular SiN cantilevers with a
nominal spring constant of 0.15 N/m (Nanoworld USA) were selected. A clean glass
substrate was utilized to calibrate the deflection sensitivity of the force curve so that
cantilever deflection distances can be read directly from the force curve. The AFM probe
was aligned to the center of the suspended fiber (L/2) by continuous scanning of the
suspended fibers and step-by-step zooming-in. Finally, the force curve was obtained
from the middle of an individually suspended electrospun nanofiber. A series of fibers
with different diameters were measured. Diameters of the tested fibers were measured by

167
AFM surface profilometry (that is, in contact mode). Young’s moduli of the nanofibers
were calculated by a three-point bending method, making use of known mechanical
parameters of the material, the cantilever and the AFM tip.
9.3 Results and discussion
Mechanical characterization of electrospun scaffold is essential for the biomedical
and other applications.8 Several nanomechanical characterization techniques have been
developed and reported in the literature to determine the mechanical properties of
nanofibres.9 The three-point bending technique based on the AFM has recently seen an
increasing interest.
Figure 9.3 A) Typical experimental force curve produced in PLEY crosslinked fiber of
diameter 1000 nm, B) AFM 3-D images of the fibers.
AA
BA

168
Figure 9.4 Section analysis of crosslinked PLEY fiber.
Here, Mechanical properties of a series of as-spun and crosslinked PLO and
PLEY nanofibers with different diameters have been analyzed by AFM technique.
Force-displacement curves have been used to analyze young’s modulus of electrospun
fibers. Young’s moduli of electrospun individual PLEY and PLO fibers were determined
using the pure bending model. Effect of shear and tensile forces were not taken into
account. Electrospun PLEY and PLO fibers were cross-linked in order to compare the
Young’s modulus of as-spun PLEY and PLO fibers.
Typical force curves and AFM 3-D images of the fibers are shown in Figure 9.3.
Force curve are the result of sample-cantilever tips interaction. These curves associate
the important mechanical properties of the electrospun fibers. Section analysis of
electrospun fibers AFM surface image is carried out to estimate fiber diameters. Figure
9.4 shows the section analysis of electrospun fiber. Figure 9.5 shows the typical force
deflection diagrams obtained for fibers with range of diameters. Different slopes of the

169
Figure 9.5 Deflection vs. piezo position for crosslinked PLEY fiber of different
diameters.
initial portion of the curves indicate the difference of Young’s modulus values for
different fiber diameters.
PLEY and PLO electrospun fibers are not stable in the wet state and dissolve
rapidly in an aqueous medium. Therefore, it is necessary to stabilize them using a
crosslinking agent for further applications. Chemical crosslinking of linear polymers
may provide feasible routes for the improvement of the mechanical properties and
thermal stability. In this study PLO was crosslinked with GTA vapor and PLEY fibers
were chemically crosslinked by submersing samples on TO- PET or glass cover slip.5-7

170
Figure 9.6 The variation of Young’s moduli with as spun and crosslinked PLEY fiber
diameters. Error bars represents standard deviation of 5 data points.
The variation Young’ modulus with the fiber diameters of as spun and crosslinked
PLEY fibers are plotted in Figure 9.6. and PLO fibers are plotted in Figure 9.7. PLEY
and PLO fibers with diameters less than 400nm have much higher Young’s modulus
(more than 5 GPa) than the fiber with larger diameter. The table 9.1 summarizes the
results of as-spun and cross-linked PLEY and PLO fibers. The Young’s modulus of as-
spun and crosslinked PLEY fibers were determined with a range of 31.751–0.047and
37.456 – 0.051GPa and the Young’s modulus of as-spun and crosslinked PLO fibers
were determined with a range of 38.137–0.047GPa and 44.0921–0.046, respectively.
Data indicates that cross-linked fibers have a higher stiffness compared to as-spun both
types of fibers.

171
Figure 9.7 The variation of Young’s moduli with as spun and crosslinked PLO fiber
diameters. Error bars represents standard deviation of 5 data points.
Several investigators have reported a correlation between mechanical properties
and diameter of nanofibers. These reports also indicate that the mechanical properties are
significantly enhanced as the diameter is decreased.10
The stiffness of genipin-cross-
linked collagen fibers was found with a mean value of 21.95 GPa which is significantly
higher than that of as-spun collagen fibers 1.66 – 13.9 GPa.10
Table 9.2 shows Young’s
modulus of some polymeric fibers form literature. Carlisle et al. studied mechanical
properties of single electrospun collagen type I nanofibers using three-point bending test
with an atomic force microscope.11
For fibers with diameters in the range of 302-126
nm, a Young’s modulus of 2.8 0.4 GPa was obtained. They also reported that the
Young’s modulus increased as the fiber diameter was decreased.11

172
Table 9.1 Young’s moduli of as-spun and crosslinked PLO and PLEY nanofibers
Material Diameter range (nm) Condition Young’s modulus E (GPa)
PLO 303-1510 Uncrosslinked 38.137 – 0.047
PLO 277-1523 Crosslinked 44.0921 – 0.046
PLEY 307-1512 Uncrosslinked 31.751 – 0.047
PLEY 298-1480 Crosslinked 37.456 – 0.051
Table 9.2 Young’s moduli of some other polymeric nanofibers form literatures.
Materials Diameter
(nm)
Condition Young’s
modulus
(GPa)
References
Polyacrylonitrile 358–816 – 47.49–3.79 Gu et al. 200512
PCL fibers 250–700 – 3.7– 0.7 Croisier et al. 2012 13
Lyocell fibres 1264 ±115 11–13 Lee et al. 200714
Collagen type I
fibers
– 30% relative
humidity
14.7 Harley et al. 197915
Collagen type I
fibers
– 0% relative
humidity
21.5 Harley et al. 197915
Collagen type I
fibers
179–356 Ambient 1.4–7.5 Yang et al.2008 16
Collagen type I fibers 179–356 PBS buffer 0.07–0.26 Yang et al. 200817
Collagen type I fibers 179–356 EDC
Crosslinked
0.06–0.14 Yang et al. 200817
Collagen type I fibers 73–113 Genipin-
Crosslinked
8.22–40.1 Bi et al. 201110
Collagen type I fibers – Ambient 2–7 van der Rijt et al. 200618
Collagen fibers 50–200 Ambient 5–11.5 Wenger et al.19
Wenger et al. also investigated the mechanical properties of collagen type I fibrils
from rat tail using nanoindentation with AFM for fibrils with diameter of 50 to 200 nm.19
The Young’s modulus was found to be in the range of 5 to 11.5 GPa. Yang et al.’s study
on cross-linking of collagen type I fibrils with EDC revealed no significant difference in
the stiffness of fibers compared with their uncrosslinked counterparts, both in PBS and in
the dry state.17
In Yang et al.’s reported that, the Young’s modulus of collagen fibers was
reduced to a range of 0.07 – 0.26 GPa after crosslinking with glutaraldehyde and
immersion in PBS.17
In another study conducted by the same group, Young’s modulus in

173
the range of 0.06 to 0.14 GPa was obtained for collagen fibers which were crosslinked
with EDC and were immersed in PBS solution.
Sources of errors in the results come from the nominal value of the cantilever’
spring constant, the measurement of the fiber diameter and the length of the suspended
fiber, the difference between the middle point of the suspended fiber and the realistic
contact position for the force curve, and also, the reading from the force curve for the
deflection parameters.
9.4 Conclusion
Here we have measured Young’s moduli of as spun and crosslinked PLO and
PLEY fibers by AFM technique. Aligned nanofibers were deposited on top of a
microsized groove etched on a glass slide; three point beam bending technique was used.
AFM tip was used as a probe, which could apply a measurable deflection and force onto
the suspended nanofiber at a force calibration mode, so that the Young’s modulus of a
single nanofiber can be calculated based on the basic beam bending theories. The
Young’s moduli of the studied peptide nanofibers increased significantly with decreased
fiber diameters. This study has also demonstrated that crosslinked electrospun PLO and
PLEY fibers have a higher Young’s modulus compared with their as-spun counterparts.
For the crosslinked nanofibers with diameters less than 400nm, the nanofibers displayed
a Young’s modulus over 5 GPa.
9.5 References
1. Civalek, O.; Demir, C. Appl. Math. Model 2011, 35, 2053–2063.

174
2. Salvetat, J. P.; Briggs, G. A. D.; Bonard, J. M.; Bacsa, R. R.; Kulik, A. J.; Stockli,
T.; Burnham, N. A.; Forro, L. Phys. Rev. Lett. 1999, 82, 944–951.
3. Bellan, L. M.; Kameoka, J.; Craighead, H. G. Nanotechnology 2005, 16, 1095–
1104.
4. James M. Gere, S. P. T.; Boston PWS Pub Co.: 1997, 912–919.
5. Khadka, D. B.; Haynie, D. T. ACS. Appl. Mater. Interfaces 2010, 2, 2728–2732.
6. Khadka, D. B.; Cross, M. C.; Haynie, D. T. Acs. Appl. Mater. Interfaces 2011, 3,
2994–3001.
7. Donald T. Haynie, D. B. K., Michael C. Cross Polymer 2012, 4, 1535–1553.
8. Discher, D. E.; Janmey, P.; Wang, Y. L. Science 2005, 310, 1139–1143.
9. Tan, E. P. S.; Lim, C. T. Compos. Sci. Technol. 2006, 66, 1102–1111.
10. Bi. L. C. Z.; Hu, Y.; Song, Y.; Yu, L.; Yang, B.; Mu, J.; Huang, Z.; Han, Y. J.
Mater. Sci. Mater. Med. 2011, 22, 51–62.
11. Carlisle, C. R. C.; Guthold, M. Acta. Biomater. 2010, 6, 2997–3003.
12. Gu, S. Y.; Wu, Q. L.; Ren, J.; Vancso, G. J. Macromol. Rapid. Comm. 2005, 26,
716–720.
13. Croisier, F.; Duwez, A. S.; Jerome, C.; Leonard, A. F.; van der Werf, K. O.;
Dijkstra, P. J.; Bennink, M. L. Acta Biomater 2012, 8, 218–224.
14. Lee, S. H.; Wang, S. Q.; Pharr, G. M.; Kant, M.; Penumadu, D. Holzforschung
2007, 61, 254–260.
15. Harley, R.; James, D.; Miller, A.; White, J. W. Nature 1977, 267, 285–292.
16. Yang, L.; Fitie, C. F. C.; van der Werf, K. O.; Bennink, M. L.; Dijkstra, P. J.;
Feijen, J. Biomaterials 2008, 29, 955–962.

175
17. Yang, L.; Van der Werf, K. O.; Fitie, C. F. C.; Bennink, M. L.; Dijkstra, P. J.;
Feijen, J. Biophy.s J. 2008, 94, 2204–2211.
18. van der Rijt, J. A. J.; van der Werf, K. O.; Bennink, M. L.; Dijkstra, P. J.; Feijen,
J. Macromol. Biosci. 2006, 6, 697–702.
19. Wenger, M. P. E.; Bozec, L.; Horton, M. A.; Mesquida, P. Biophys. J. 2007, 93,
1255–1263.

176
CHAPTER 10
RESEARCH SUMMARY
Here, we have fabricated and characterize physical properties of polypeptide-
based biomaterials. We have explored the possibility of electrospinning of synthetic
polypeptides and elastin-like polypeptides from aqueous solution. We have characterized
physical properties of bulk materials as well as resulting fibers and fiber mats. A
scientific emphasis has been placed in the fundamental study of as-spun materials. From
an applications standpoint, the product architecture and its potential biomaterial
applications have been explored. The project involved fibers crosslinking to enhance
mechanical properties and stability, functionalizing fibers for specific biomedical
applications and investigating key physical properties for structural integrity, stability and
quality of the product. Polymer electrospinning from water avoided organic solvents,
organic polymers and animal-based sources. Knowledge of physical properties is crucial
for biomaterial development. It is believed that this research work increased basic
knowledge of polymer design, especially polypeptide for electrospinning, and advance
the development of electrospun materials, especially for applications in medicine and
biotechnology.

177
Although electrospinning technique has been introduced for producing 1D
nanofiber for a decade, we have greatly extended the capability of some advanced
characterization methods. Highlights in this research are listed below:
1. Synthetic polypeptide-based fibers have been successfully prepared from aqueous
polymer feed stock by electrospinning method. Systematic studies have been
carried out to determine the detailed processing parameters for the morphology
control of peptides-based fibers.
2. The present results show that electrospun fibers can be made from synthetic
polypeptides of defined composition dissolved in an aqueous solution containing
no organic solvent or non-biological organic polymer. The ability to control the
solubility of the resulting peptides fibers by simple chemical crosslinking methods
has also been demonstrated.
3. Key physical properties of polypeptides in solution and peptide-based electrospun
fibers on glass have been analyzed. PLO, PLEY, ELPs and blend of PLEY and
ELPs were random coil-like in aqueous solution, whereas in fibers and cast films,
a large fraction of residues in PLEY but not PLO adopted a β-sheet conformation
prior to crosslinking. Significant IR absorption bands near 1615 cm−1 and 1680
cm−1 were displayed by cast films of PLEY, so the bands cannot be taken as
unambiguous indicators of amyloid fibril formation. Crosslinking PLEY fibers
with a diimide reagent resulted in a large increase in irregular backbone structure.
The backbones of PLO molecules were irregular before and after crosslinking.
EDX analysis has confirmed that PLEY fibers contained Na+ and PLO fibers

178
contained Br−. The adsorption of model proteins onto PLEY fibers or PLO fibers
on glass was consistent with the net charge on the proteins and the relative surface
charge density of the fibers and the substrate at neutral pH. The electric field of a
thick fiber is larger than that of a thin fiber for a given surface density of charge
and a given distance from the fiber axis. Calculations showed that the maximum
surface charge density on a peptide-based material will be less than the charge
density on the outer leaflet of the plasma membrane of typical eukaryotic cells.
4. This study has also provided insight into the mechanisms of stability of a
polypeptide with ionizable side chains at different pH values. Crosslink density
has been quantified by a visible-wavelength dye-based method. Variations in
fiber morphology, elemental composition and stability have been studied by
microscopy and EDX, following the treatment of samples at different pH values
in the 2-12 range. Fiber stability has been interpreted with reference to the pH
dependence of the UV absorbance and fluorescence of PLEY chains in solution.
Taken together, the data show that fiber stability is crucially dependent on the
extent of side chain ionization, even after crosslinking. The results will advance
the rational design of polypeptides for peptide-based materials, especially
materials prepared by electrospinning.
5. The annealing of crosslinked PLO fibers and of crosslinked PLEY fibers in water
at 22 °C was remarkably similar in key respects, despite the differences in average
DP, amino acid composition, counterion and crosslinking. A double-exponential
model was needed to account for annealing kinetics, and the fast-phase and slow-
phase time constants were roughly the same in both cases. The amide I envelope

179
of pre-annealed PLO fibers and PLEY fibers resembled the broad, overlapping
bands typical of proteins in aqueous solution. Annealing had a dramatic impact
on shape of the amide I envelope, greatly decreasing line widths for PLO fibers
and PLEY fibers. The similarity of the amide I spectra for annealed PLO fibers
and PLEY fibers suggest that similar outcomes could be obtained for a broad
range of peptide designs.
6. Novel ELPs alone and in blends with PLEY has been electrospun from aqueous
solution. Blended fibers of ELP and PLEY were spun and crosslinked in ethanol,
despite the high solubility of ELP in this solvent. The shape and surface
morphology of ELP fibers depended strongly on concentration and on the blend
ratio with PLEY. Analysis of blended fibers by fluorescence microscopy showed
that two polymers were uniformly mixed. Blended fibers displayed
morphological properties, namely, pores that were not displayed by ELP alone or
PLEY alone.
7. AFM has been applied to study nano-mechanical properties of the individual
nanofibers based on the classic beam bending mechanics. Aligned nanofibers
were deposited on top of a microsized groove etched on a glass slide. Force
curves were recorded as a tip-sample interaction in force calibration mode, so that
the Young’s modulus of a single nanofiber can be calculated based on the basic
beam bending theories and known parameters. The Young’s moduli of the studied
peptide nanofibers increased significantly with decreased fiber diameters. This
study has also demonstrated that crosslinked electrospun PLO and PLEY fibers
have a higher Young’s modulus compared with their as-spun counterparts. For the

180
crosslinked nanofibers with diameters less than 400nm, the nanofibers displayed a
Young’s modulus over 5 GPa.
8. Taken together, the results will advance the rational design of polypeptides for
peptide-based biomaterials, especially materials prepared by electrospinning.
Research provided a foundation for current widespread interest in utilizing
solubilized proteins in electrospinning. Results also suggested that the ability to
electrospun synthetic polypeptides of defined composition could be important for
the development of applications of electrospun materials, perhaps most in
medicine and biotechnology, for instance, in vitro tissue engineering, ex vivo stem
cell therapy, wound healing and biomaterial implantation.

181
APPENDICES
Appendix: A
List of accomplishments
Peer-reviewed journals publications
1. Dhan B. Khadka and Donald T. Haynie, “Insoluble synthetic polypeptide mats
form aqueous solution by electrospinning” ACS Appl. Mater. Interfaces, 2010, 2
(10), 2728−273.
2. Dhan B. Khadka, Michael C. Cross and Donald T, Haynie, “A synthetic
polypeptide electrospun biomaterial” ACS Appl. Mater. Interfaces, 2011, 3 (8),
2994−3001.
3. Dhan B. Khadka and Donald T. Haynie, “Protein-and peptide-based electrospun
nanofiber in medical biomaterials” Nanomedicine NBM, 2012, (8), 1242–1262.
4. Donald T. Haynie, Dhan B. Khadka and Michael C. Cross, "Physical properties
of polypeptide electrospun nanofiber cell culture scaffolds on a wettable
substrate" Polymers, 2012, 4(3), 1535−1553.
5. Donald T. Haynie, Dhan B. Khadka, Michael C. Cross, Alina Gitnik and Nicole
Le, “Mechanism of stability of fibers electrospun from peptides with ionized side
chains” Macromol. Mater. Eng. 2013, 298, 529–540.

182
Manuscripts in preparation
1. Dhan B. Khadka, Melissa I. Niesen, Jagannath Devkota, Piyush Koria and
Donald T. Haynie, “
Fiber Blends of Novel Elastin-like Polypeptides and Highly-
ionized Synthetic Polypeptides by Electrospinning.”
2. Dhan B. Khadka, Zephra Bell and Donald T. Haynie, “Role of chirality in
polypeptide multilayer nanofilm buildup, internal structure, elemental
composition, surface morphology and thermostability.”
3. Dhan B. Khadka and Donald T. Haynie, “Regulated release of an entrapped
model biologic from poly(histidine) multilayer-coated microparticles upon pH
shift in the physiological range.”
4. Pradeep Waduge, Dhan B. Khadka and Donald T. Haynie, “Branched polymer
models and the mechanism of multilayer film buildup.”
5. Melissa Niesen, ChuMin Lo, Eunhee Cho, Dhan B. Khadka and Donald T.
Haynie, “Use of synthetic biometric to enhance autologous peripheral stem cell
transplantation.”
6. Michael C. Cross, Dhan B. Khadka and Donald T. Haynie, “Competition
between nano- and microtopographical surface features in fibroblast adition in
vitro.”
7. Michael C. Cross, Dhan B. Khadka and Donald T. Haynie, “Synthetic
polypeptide-based electrospun fibers enhance fibroblast proliferation in serum
free culture medium.”
8. Donald T. Haynie, Dhan B. Khadka and Gabriel Marcus, “Polymer self-
organization kinetics in electrospun fibers.”

183
Invited talks
1. Dhan B. Khadka, “Designing, Fabricating, and Characterizing polypeptide-based
Biomaterials” April 17th
2012, University of Maryland, College Park, Maryland,
USA.
Conference presentations
1. Dhan B. Khadka, Michael C. Cross, Melissa I. Niesen and Donald T. Haynie,
“Electrospun synthetic polypeptide fibers for potential biomedical application” 5th
Annual Graduate and Postdoctoral Scholar Research Symposium, March 22nd
,
2012, Tampa, Florida, USA.
2. Dhan B. Khadka, Michael C. Cross and Donald T. Haynie, “Electrospinning of
polypeptide-based fibers and characterizing their physical, chemical and
biological properties” 5th
Annual NanoFlorida NanoScience Technology
Symposium, Sep. 28-29, 2012, Tampa, Florida, USA.
3. Dhan B. Khadka, Michael C. Cross and Donald T. Haynie, “Electrospun
synthetic polypeptide fibers for potential biomedical application” 4th
Annual
Graduate Student Research Symposium, Apr. 5th
, 2012, Tampa, Florida, USA.
4. Dhan B. Khadka, Michael C. Cross and Donald T. Haynie, “Electrospun
synthetic polypeptide fibers for potential biomedical application” NANOSMAT
International Conference, March 27−30, 2012, Tampa, Florida, USA.
5. Dhan B. Khadka, Michael C. Cross and Donald T. Haynie, “Electrospun
synthetic polypeptide fibers for potential biomedical application” Nano-Bio

184
Collaborative International Conference, March 22−24, 2012, Tampa, Florida,
USA.
6. Dhan B. Khadka, Michael C. Cross and Donald T. Haynie, “Electrospun
synthetic polypeptide fibers for potential biomedical application” Annual Meeting
of the Florida Academy of Science, March 16−17, 2012, Tampa, Florida, USA.\
7. Dhan B. Khadka, Khagendra P. Bhattarai and Donald T. Haynie,
“Electrospinning of synthetic polypeptide nanofibers” Oktoberfest, Oct 21st, 2011,
Tampa, Florida, USA.
8. Dhan B. Khadka, Jagannath Devkota, Piyush Koria and Donald T. Haynie,
“Electrospinning of genetically engineered elastin like polypeptide for potential
biomedical application” 4TH
Annual NanoFlorida Symposium, Sept. 30th
t 2011,
Miami, Florida, USA.
9. Dhan B. Khadka, Zephra Bell and Donald T. Haynie, “Polypeptide chirality
influences multilayer nanofilms growth and structure” 3rd
Annual Graduate
Student Research Symposium, Apr. 4th
, 2011, Tampa, Florida, USA.
10. Dhan B. Khadka and Donald T. Haynie, “Electrospun synthetic polypeptide
nanofibrous biomaterials” American Physical Society Annual Meeting, March
21−25, 2011, Dallas, Texas, USA.
11. Dhan B. Khadka, Khagendra P. Bhattarai and Donald T. Haynie,
“Electrospinning of synthetic polypeptide nanofibers” 3rd
Annual NanoFlorida
NanoScience Technology Symposium, Sept. 24th
, 2010, Orlando, Florida, USA.
12. Dhan B. Khadka, Zephra Bell, Khagendra P. Bhattarai and Donald T. Haynie,
“Polypeptide chirality influences multilayer nanofilm growth and structure” 3rd

185
Annual NanoFlorida NanoScience Technology Symposium, Sept. 24th
, 2010,
Orlando, Florida, USA.
13. Dhan B. Khadka and Donald T. Haynie, “Buildup, structure and stability of
poly(histidine) multilayer nanofilm” 3rd
Annual Symposium, Oct. 15th
, 2010,
Tampa, Florida, USA.

186
Appendix: B
List of copyright permissions
Title: A Synthetic Polypeptide
Electrospun Biomaterial
Author: Dhan B. Khadka, Michael C. Cross, and Donald T. Haynie
Publication: Applied Materials
Publisher: American Chemical Society
Date: Aug 1, 2011
Copyright © 2011, American Chemical Society
PERMISSION/LICENSE IS GRANTED FOR YOUR ORDER AT NO CHARGE
This type of permission/license, instead of the standard Terms & Conditions, is sent to you because no
fee is being charged for your order. Please note the following:
Permission is granted for your request in both print and electronic formats, and translations.
If figures and/or tables were requested, they may be adapted or used in part.
Please print this page for your records and send a copy of it to your publisher/graduate school.
Appropriate credit for the requested material should be given as follows: "Reprinted (adapted) with permission from (COMPLETE REFERENCE CITATION). Copyright (YEAR) American Chemical Society." Insert appropriate information in place of the capitalized words.
One-time permission is granted only for the use specified in your request. No additional uses are granted (such as derivative works or other editions). For any other uses, please submit a new request.

187
Title: A Synthetic Polypeptide
Electrospun Biomaterial
Author: Dhan B. Khadka, Michael C.
Cross, and Donald T. Haynie
Publication: Applied Materials
Publisher: American Chemical Society
Date: Aug 1, 2011
Copyright © 2011, American Chemical Society
PERMISSION/LICENSE IS GRANTED FOR YOUR ORDER AT NO CHARGE
This type of permission/license, instead of the standard Terms & Conditions, is sent to you because no fee is being charged for your order. Please note the following:
Permission is granted for your request in both print and electronic formats, and translations.
If figures and/or tables were requested, they may be adapted or used in part.
Please print this page for your records and send a copy of it to your publisher/graduate school.
Appropriate credit for the requested material should be given as follows: "Reprinted (adapted) with permission from (COMPLETE REFERENCE CITATION). Copyright (YEAR) American Chemical Society." Insert appropriate information in place of the capitalized words.
One-time permission is granted only for the use specified in your request. No additional uses are granted (such as derivative works or other editions). For any other uses, please submit a new request.

188
Title: Protein- and peptide-based electrospun nanofibers in medical biomaterials
Author: Dhan B. Khadka,Donald T. Haynie
Publication: Nanomedicine: Nanotechnology, Biology and Medicine
Publisher: Elsevier
Date: November 2012
Copyright © 2012, Elsevier
Thank you very much for your order.
This is a License Agreement between Dhan B Khadka ("You") and Elsevier ("Elsevier"). The license consists of
your order details, the terms and conditions provided by Elsevier, and the payment terms and conditions.
Get the printable license.
License Number 3172621351748
License date Jun 19, 2013
Licensed content publisher Elsevier
Licensed content publication Nanomedicine: Nanotechnology, Biology and Medicine
Licensed content title Protein- and peptide-based electrospun nanofibers in medical biomaterials
Licensed content author Dhan B. Khadka,Donald T. Haynie
Licensed content date November 2012
Licensed content volume number 8
Licensed content issue number 8
Number of pages 21
Type of Use reuse in a thesis/dissertation
Portion figures/tables/illustrations
Number of
figures/tables/illustrations
2
Format both print and electronic
Are you the author of this
Elsevier article?
Yes
Will you be translating? No
Order reference number
Title of your thesis/dissertation Fabricating and Characterizing Physical Properties of Electrospun Polypeptide-based
Nanofibers
Expected completion date Jul 2013
Elsevier VAT number GB 494 6272 12
Permissions price 0.00 USD
VAT/Local Sales Tax 0.00 USD
Total 0.00 USD

189
Title: Mechanisms of Stability of Fibers
Electrospun from Peptides with
Ionized Side Chains
Author: Donald T. Haynie,Dhan B. Khadka,Michael C. Cross,Alina
Gitnik,Nicole K. Le
Publication: Macromolecular Materials &
Engineering
Publisher: John Wiley and Sons
Date: Dec 13, 2012
Copyright © 2013 WILEY-VCH Verlag GmbH & Co.
KGaA, Weinheim
Order Completed
Thank you very much for your order.
This is a License Agreement between Dhan B Khadka ("You") and John Wiley and Sons ("John Wiley and
Sons"). The license consists of your order details, the terms and conditions provided by John Wiley and
Sons, and the payment terms and conditions.
Get the printable license.
License Number 3172630353015
License date Jun 19, 2013
Licensed content publisher John Wiley and Sons
Licensed content
publication
Macromolecular Materials & Engineering
Licensed content title Mechanisms of Stability of Fibers Electrospun from Peptides with Ionized Side Chains
Licensed copyright line Copyright © 2013 WILEY-VCH Verlag GmbH & Co. KGaA, Weinheim
Licensed content author Donald T. Haynie,Dhan B. Khadka,Michael C. Cross,Alina Gitnik,Nicole K. Le
Licensed content date Dec 13, 2012
Start page 529
End page 540
Type of use Dissertation/Thesis
Requestor type Author of this Wiley article
Format Print and electronic
Portion Full article
Will you be translating? No
Total 0.00 USD

About the author
Dhan Khadka was born and grew up in the Himalayan Kingdom of Nepal. He
received his Bachelor of Science and Master of Science degree in Physics from the
Tribhuvan University. He held physics lecturer position from 2003 to 2007 at the
Intensive International College, the Gyankunj College and the St. Xavier's College,
Kathmandu, Nepal.
He came to USA, in August 2007 for the graduate study in Physics at the
University of Southern Mississippi, Hattiesburg, Mississippi. He received Masters
Degree of Science in Physics from the University of Southern Mississippi, in August
2008.
He joined in Applied Physics program at the University of South Florida, Tampa,
Florida USA in August 2008 to pursue his Doctoral Degree in Physics. He worked under
the supervision of Professor Donald T. Haynie at the Nanomedicine and
Nanobiotechnology Laboratory. His research work has already resulted in five peer-
reviewed journals. More than three other manuscripts are in preparation. He has
presented his research at over 20 international, national and local conferences. He
received the Outstanding Graduate Student Paper Poster Award at the Florida Academy
of Sciences 76th Annual Meeting in March 2012. He has also received a Research
Symposium Award for NanoFlorida 2010.