Embed Size (px)
Citation preview

1KIWIRAIL ANNUAL REPORT | 2015
ANNUAL REPORTF.18a
2015
2 TRUSTED KIWI-OWNED LOGISTICS PARTNER GROWING NEW ZEALAND
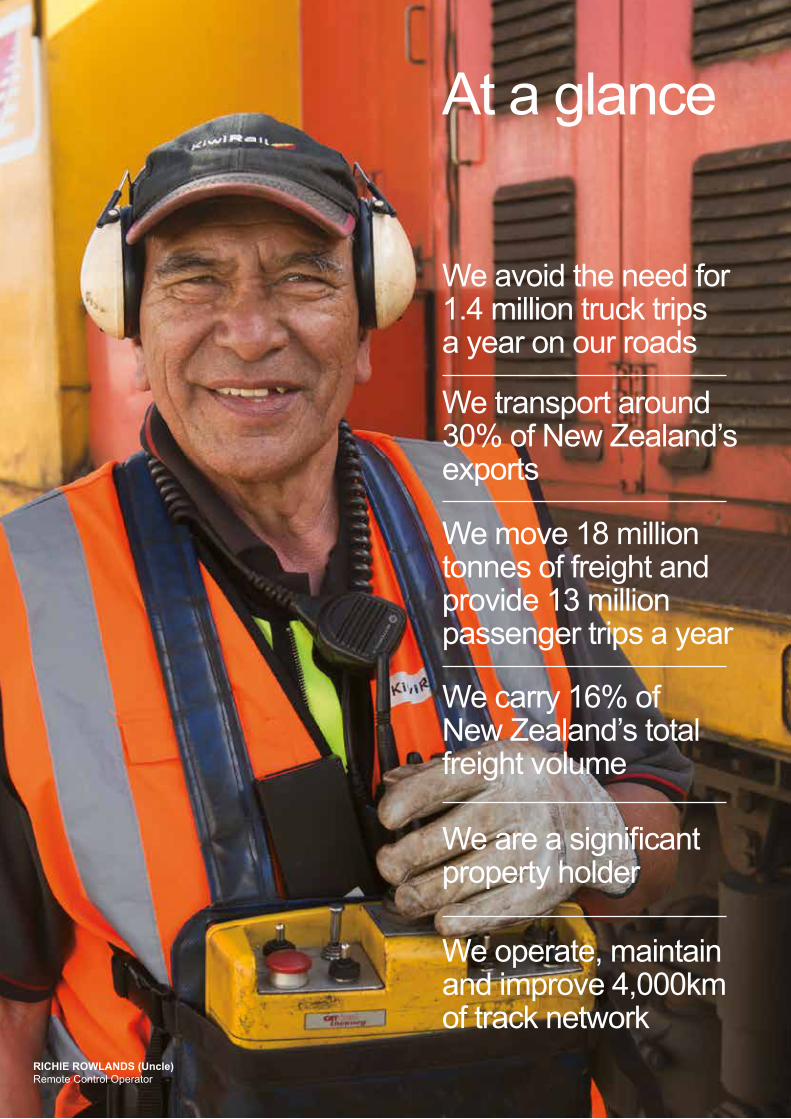
At a glance
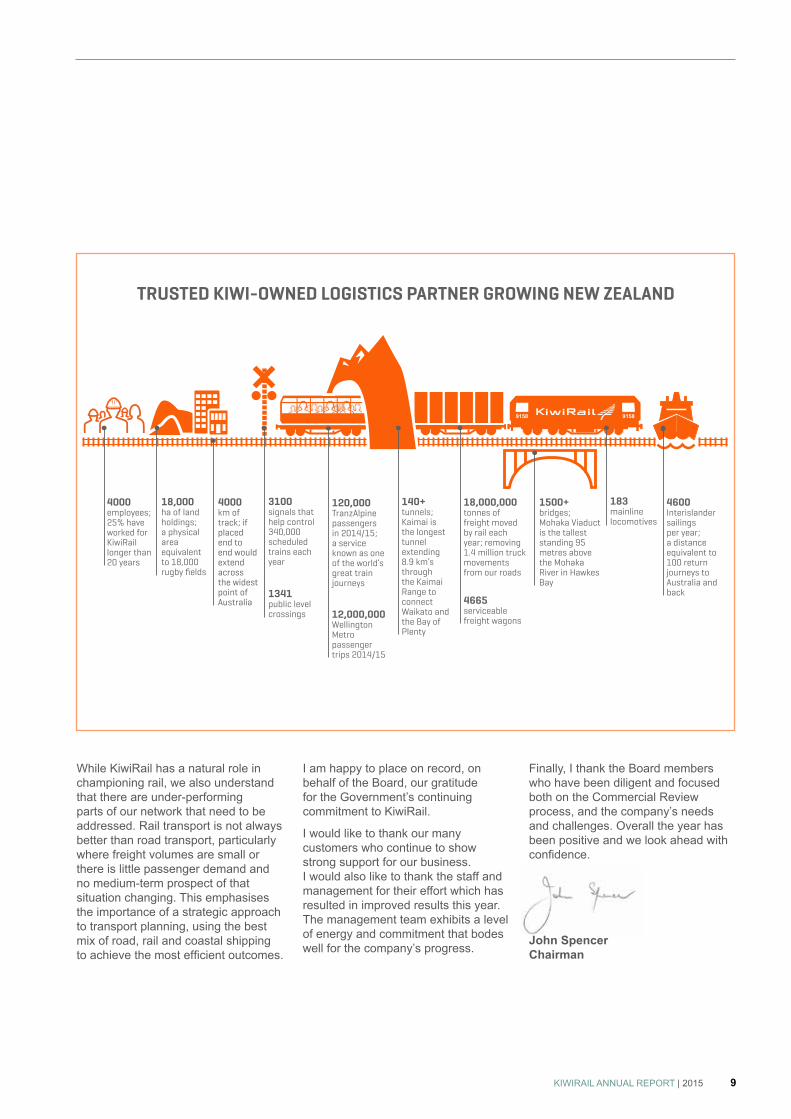
We avoid the need for 1.4 million truck trips a year on our roads
We transport around 30% of New Zealand’s exports
We move 18 million tonnes of freight and provide 13 million passenger trips a year
We carry 16% of New Zealand’s total freight volume
We are a significant property holder
We operate, maintain and improve 4,000km of track network
RICHIE ROWLANDS (Uncle)Remote Control Operator
3KIWIRAIL ANNUAL REPORT | 2015
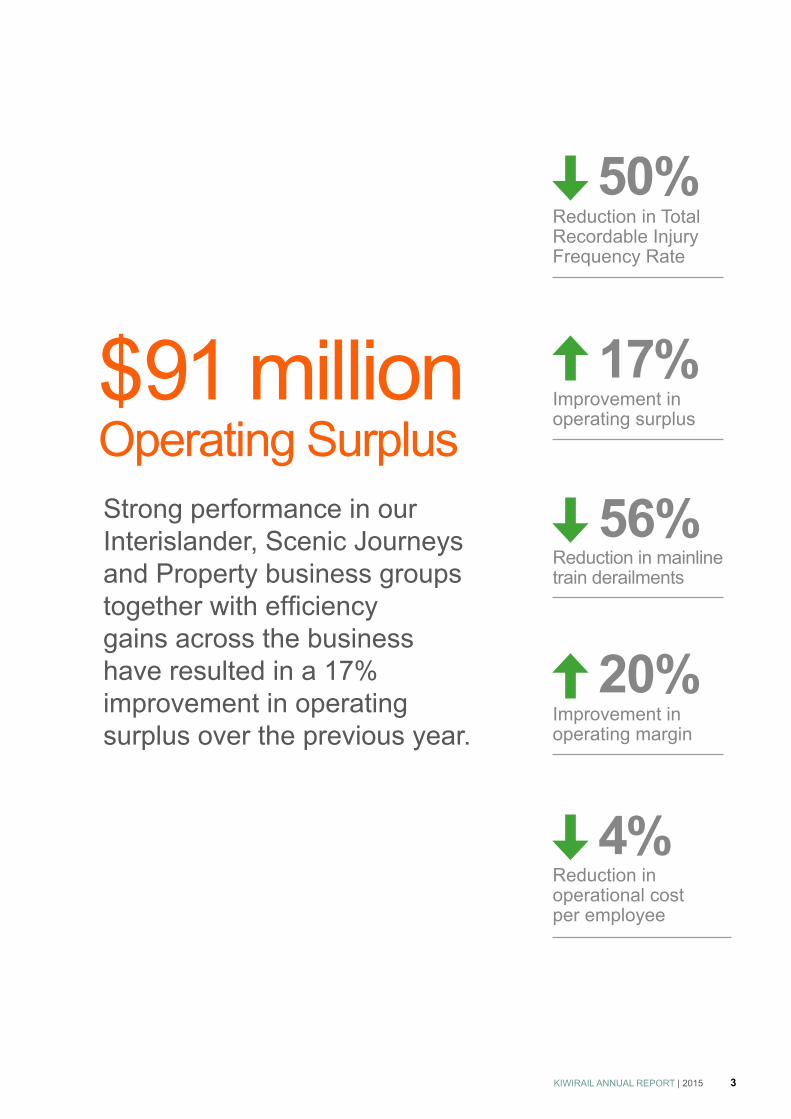
Strong performance in our Interislander, Scenic Journeys and Property business groups together with efficiency gains across the business have resulted in a 17% improvement in operating surplus over the previous year.
Reduction in operational cost per employee
$91 millionOperating Surplus
4%
Reduction in Total Recordable Injury Frequency Rate
50%
Improvement in operating surplus
17%
Reduction in mainline train derailments
56%
Improvement in operating margin
20%
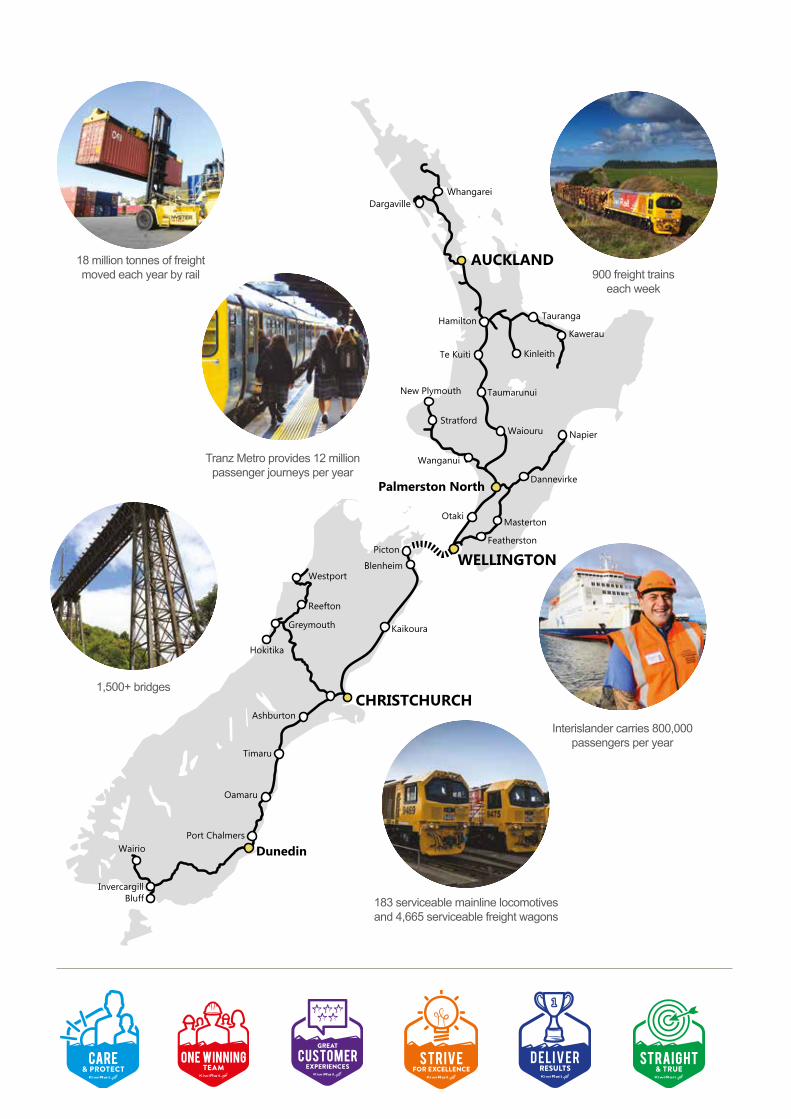
183 serviceable mainline locomotives and 4,665 serviceable freight wagons
18 million tonnes of freight moved each year by rail
1,500+ bridges
Interislander carries 800,000 passengers per year
Tranz Metro provides 12 million passenger journeys per year
900 freight trains each week
PictonBlenheim
Kaikoura
Ashburton
Timaru
Oamaru
Dunedin
Invercargill
Wairio
CHRISTCHURCH
Hokitika
Greymouth
Westport
Reefton
WhangareiDargaville
Tauranga
Kawerau
Kinleith
Hamilton
Te Kuiti
New Plymouth
Stratford
Taumarunui
Waiouru Napier
Dannevirke
Masterton
Featherston
WELLINGTON
Wanganui
Palmerston North
Otaki
Bluff
Port Chalmers
AUCKLAND
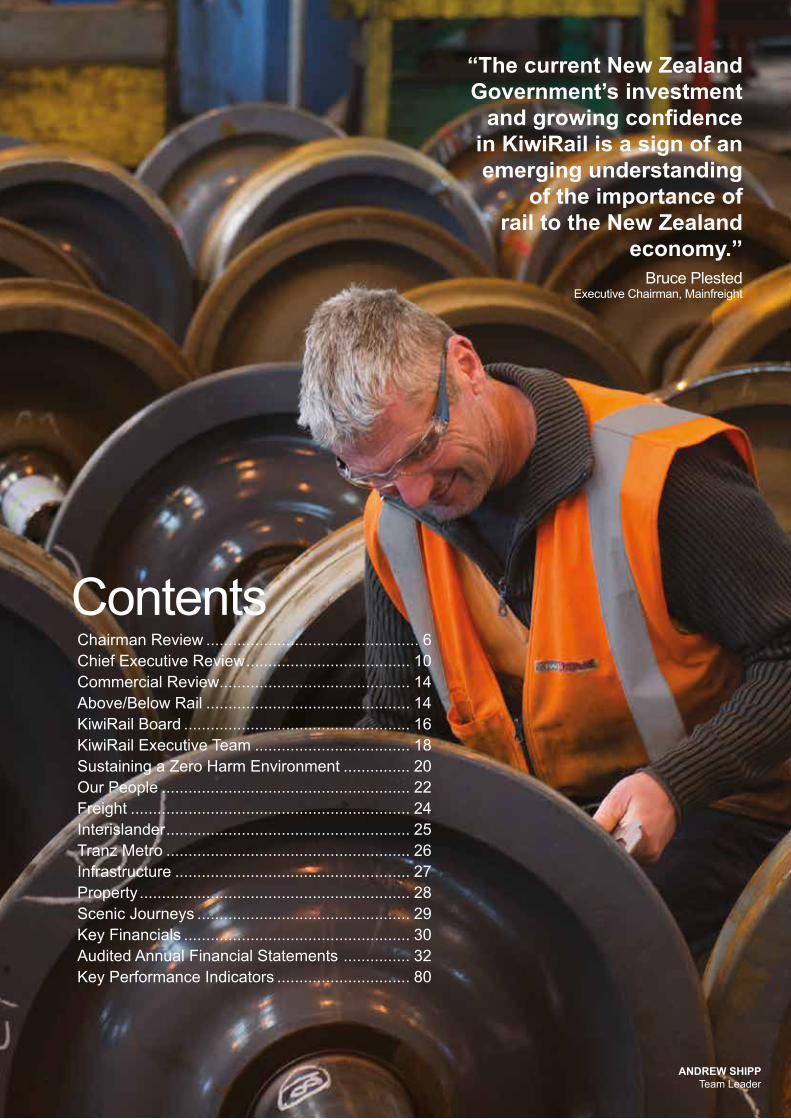
ContentsChairman Review ................................................ 6Chief Executive Review ..................................... 10Commercial Review........................................... 14 Above/Below Rail .............................................. 14 KiwiRail Board ................................................... 16KiwiRail Executive Team ................................... 18Sustaining a Zero Harm Environment ............... 20Our People ........................................................ 22 Freight ............................................................... 24Interislander ....................................................... 25Tranz Metro ....................................................... 26Infrastructure ..................................................... 27Property ............................................................. 28Scenic Journeys ................................................ 29Key Financials ................................................... 30Audited Annual Financial Statements ............... 32Key Performance Indicators .............................. 80
ANDREW SHIPPTeam Leader
“The current New Zealand Government’s investment
and growing confidence in KiwiRail is a sign of an emerging understanding
of the importance of rail to the New Zealand
economy.”Bruce Plested
Executive Chairman, Mainfreight

“I would like to thank our many customers who continue to show strong support for our business.”John SpencerChairman

7KIWIRAIL ANNUAL REPORT | 2015
ChairmanReview
After significant disruptions in the 2014 financial year, 2015 was a year of consolidation with the new management team led by Chief Executive Peter Reidy focusing on its task of uniting “One KiwiRail”, building customer confidence, aspiring to Zero Harm and lifting the company’s financial performance.
During the year we adopted a new vision statement for the company, which is to be a “trusted Kiwi-owned logistics partner growing New Zealand”.
The aspiration to be trusted is important. It means being trusted by our customers and passengers to get them and their freight delivered safely and efficiently. It means being trusted by our staff to be a good employer, and trusted by our shareholding ministers to continually look for improvements in running the company. On all those counts, the Board, management and staff share a strong commitment to delivery.
Financial Performance KiwiRail’s operating surplus of $91m in FY15 is a 17% improvement over the previous year and is a credible result in the current environment, despite revenue falling by 3% to $721m.
Our Interislander, Scenic Journeys and Property business groups all
increased their revenues, reflecting our ongoing commitment to lift KiwiRail’s financial performance by focusing on customers’ needs and working with our employees and unions to improve efficiency.
Commercial ReviewDuring the year the most significant piece of work for the Board was the Commercial Review. It arose from an undertaking given by the KiwiRail Board to Shareholding Ministers that the company would develop a refreshed, comprehensive long-term view of its business.
The Review was completed in December 2014 and was an opportunity to engage with Government on long-term funding options and future network configurations. The Review found that financial self-sufficiency of the network is not achievable. It confirmed that it is difficult for KiwiRail to increase revenue from commodity-based sectors and to improve productivity given historical inflexible labour agreements. Additionally, given the capital-intensive nature of rail, there are implications should we retain the national network in its entirety. However, the Review also identified a number of opportunities for KiwiRail. It reviewed the economics of each rail corridor and service, and provided
a range of future options from maintaining the status quo to closing the network entirely.
Ministers considered the Review and in Budget 2015 they expressed their commitment to a national freight network. Finance Minister Bill English announced $210m in new capital for the company in Budget 2015, and announced a pre-commitment of a further $190m against Budget 2016. However, the Government also indicated KiwiRail must continue to drive significant efficiency and productivity improvements to reduce the ongoing level of Crown funding required.
Over the last financial year the Board and the Executive Team have had a strong focus on simplifying the business, reducing the cost of operations and building the consistent on-time performance that our customers expect. The Government’s Budget announcements and expectations reinforce our on-going commitment to drive savings and improve efficiency across the business.
True ValueThe public release of Treasury documents relating to the Commercial Review sparked debate over the true value of rail. One oft-quoted figure is that if all the freight currently carried by our trains was moved to the road, it would need an additional 1.4m truck trips. That is another way of looking at the value of rail.
It is pleasing to reflect on a year of recovery and consolidation in which KiwiRail improved its profitability, worked on implementing its customer-focused business model, and considered its role in the wider transport sector.
8 TRUSTED KIWI-OWNED LOGISTICS PARTNER GROWING NEW ZEALAND
Media reporting that Ministers could have decided to close the freight network prompted some of our important customers to go public in their support of KiwiRail, and of rail generally.
While we welcome this broader discussion, it in no way undermines or distracts the Board and management from the importance of lifting the company’s performance.
Local communities are certainly willing to be vocal in their support of retaining rail services in their own areas. However, there is a balance to be struck here because while regions may value the presence of rail, KiwiRail cannot continue to support lines that are plainly uneconomic and where there is no prospect of profitability occurring in the medium term.
In some cases, the company would be prepared to look at other funding models if communities choose to offer support to maintain a service that they value, and which is uneconomic for KiwiRail to continue. This year,
for example, there was doubt over the future of the Capital Connection
commuter service between Wellington and Palmerston North because it was uneconomic for KiwiRail to operate. However, with financial contributions from Greater Wellington
Regional Council and Horizons Regional Council, who wanted the link to continue, the service has been secured for another three years.
Optimising InvestmentTaking a wider view of the value and funding of rail will inevitably lead to questions about the sustainability of the current structure. In addition, thinking more broadly about rail invites further discussion about integrating rail into land transport planning and investment, so that optimal use is made of public and private investment in transport infrastructure.
KiwiRail welcomes the opportunity to work more closely with the New Zealand Transport Agency to ensure we make best use of taxpayer money and deliver a transport system that is as effective, efficient and resilient as possible. I believe that not only KiwiRail, but New Zealand as a whole has much to gain from a strategy that values rail’s contribution to moving freight and people.
ChairmanReviewcontinued
“Ministers considered the Review and it is well known that in Budget 2015 they expressed their commitment to a national freight network.”
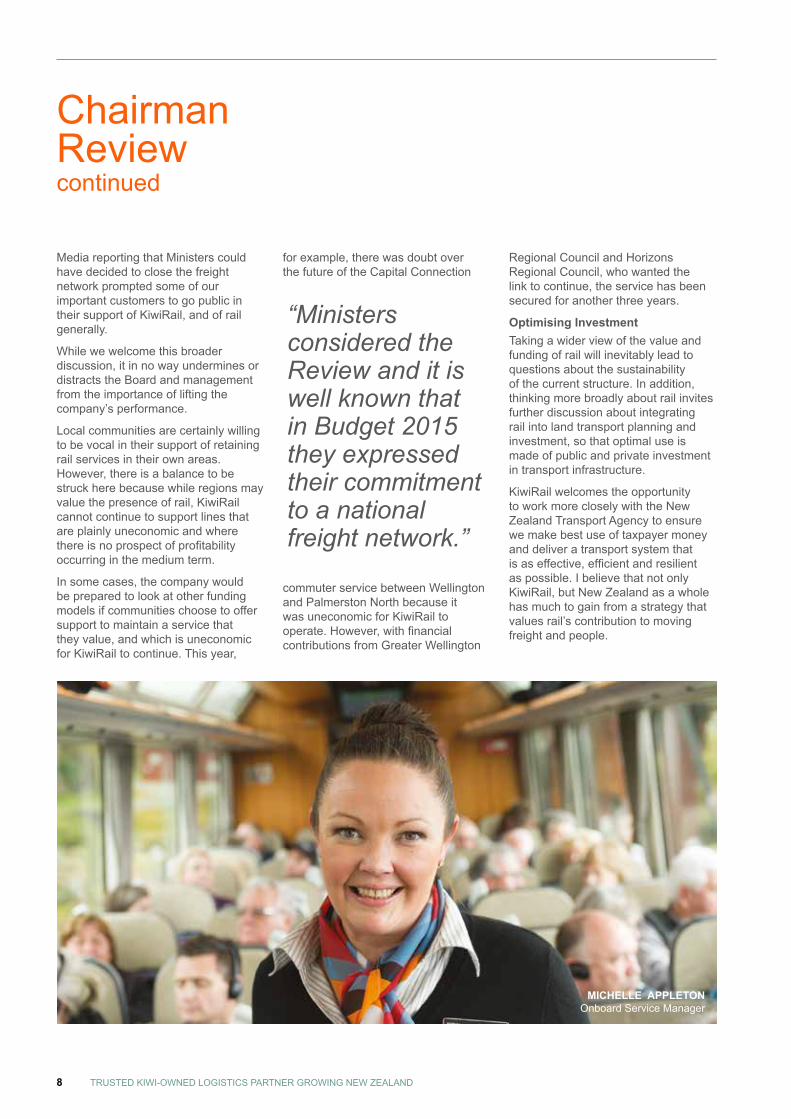
MICHELLE APPLETONOnboard Service Manager
9KIWIRAIL ANNUAL REPORT | 2015
91589158
While KiwiRail has a natural role in championing rail, we also understand that there are under-performing parts of our network that need to be addressed. Rail transport is not always better than road transport, particularly where freight volumes are small or there is little passenger demand and no medium-term prospect of that situation changing. This emphasises the importance of a strategic approach to transport planning, using the best mix of road, rail and coastal shipping to achieve the most efficient outcomes.
I am happy to place on record, on behalf of the Board, our gratitude for the Government’s continuing commitment to KiwiRail.
I would like to thank our many customers who continue to show strong support for our business. I would also like to thank the staff and management for their effort which has resulted in improved results this year. The management team exhibits a level of energy and commitment that bodes well for the company’s progress.
Finally, I thank the Board members who have been diligent and focused both on the Commercial Review process, and the company’s needs and challenges. Overall the year has been positive and we look ahead with confidence.
John SpencerChairman
TRUSTED KIWI-OWNED LOGISTICS PARTNER GROWING NEW ZEALAND
4000 employees; 25% have worked for KiwiRail longer than 20 years
18,000ha of land holdings; a physical area equivalent to 18,000 rugby fields
1341public level crossings
120,000 TranzAlpine passengers in 2014/15; a service known as one of the world’s great train journeys
140+tunnels; Kaimai is the longest tunnel extending 8.9 km’s through the Kaimai Range to connect Waikato and the Bay of Plenty
18,000,000 tonnes of freight moved by rail each year; removing 1.4 million truck movements from our roads
183mainline locomotives
4600Interislander sailings per year; a distance equivalent to 100 return journeys to Australia and back
4665serviceable freight wagons
1500+ bridges; Mohaka Viaduct is the tallest standing 95 metres above the Mohaka River in Hawkes Bay
12,000,000 Wellington Metro passenger trips 2014/15
3100signals that help control 340,000 scheduled trains each year
4000km of track; if placed end to end would extend across the widest point of Australia

10 TRUSTED KIWI-OWNED LOGISTICS PARTNER GROWING NEW ZEALAND
“KiwiRail has many valuable
assets but none is more valuable than its people.”
Peter ReidyChief Executive

11KIWIRAIL ANNUAL REPORT | 2015
Chief Executive Review
Zero Harm The safety of our staff, contractors and the public is critical. In the year under review the Total Recordable Injury Frequency Rate (TRIFR) reduced by 50% compared with the previous year, and the Lost Time Injury Frequency Rate (LTIFR) reduced by 36%. These
are important gains and build on last year’s improvement indicating that our commitment to a safer environment is reaping rewards. Safety is paramount in a company like ours where the potential for harm is constant. We continue to drive a safety culture, with a strong focus on engaging our
My first full financial year at KiwiRail has been all-consuming, getting to better know our staff, customers and stakeholders and confirming my early impressions of a company that has both considerable potential and very real challenges. Our strategy of simplifying our business, standardising our assets and investing in our people is showing results. A 50% decrease in our injury frequency rate and a 17% improvement in our net operating surplus in FY15 are good outcomes. Overall, FY15 has been a year of recovery and consolidation and I am pleased by the momentum we are building.
people to create and sustain a Zero Harm environment. I am on the record as making no apologies for putting Zero Harm first and my commitment to that priority is unwavering. A safe workplace is no accident.
Engaging Our Customers A relatively new Executive Team is now well established and during the year its members have led the implementation of the “One KiwiRail” strategy, including the premise that our business is about moving people and freight, rather than moving trains and ships. This focus helps make the needs of the customer paramount in everything we do.
We are committed to helping make our customers competitive in their markets, being easy and reliable to do business with, and offering a logistics service that seamlessly bundles our rail, ferry, infrastructure and property services.
Shifting our focus
Assets
Customer
Employees
Employees
Asset centric‘moving trains & ships’
Customer centric‘moving freight and people’
AssetsCustomer
12 TRUSTED KIWI-OWNED LOGISTICS PARTNER GROWING NEW ZEALAND
Chief ExecutiveReviewcontinued
Core to this strategy is the development of road/rail transport hubs which enable us to improve the utilisation of our assets across our customer base. In the last 12 months KiwiRail has worked closely with key partners in Rolleston, Hamilton and Wanganui to develop new rail-served infrastructure operations that will improve the flow of our customers’ goods.
Operational PerformanceWe are continuing to simplify our operating model and standardise our assets to drive improved operational performance. We have continued to standardise our rolling stock with the purchase of 120 new wagons and 200 intermodal containers, and the commissioning of eight locomotives. The shift towards a standardised fleet will help improve our efficiency
and productivity, and provide our customers with more flexibility to meet future freight demand.
Other changes we have made over the last financial year to strengthen the company include using technology to help reduce our fuel consumption, moving to take-or-pay contracts with key customers where possible, optimising our train plans over core rail corridors and putting a commercial
CRAIG HARBOURTraction and Systems Controller

13KIWIRAIL ANNUAL REPORT | 2015
focus on our property portfolio. We are engaging staff in the process of reshaping the company and delivering on our commitments to both customers and shareholders.
Our PeopleKiwiRail has many valuable assets but none is more valuable than its people. Our 4000 staff between them represent a wide range of trades, professions and other skills that are essential for our 24-hour-a-day operations.
We place a high priority on the development of our people, and have continued to invest in a number of staff initiatives including safety leadership and our future leaders programme.
During the year there was a summit with key unions to work towards implementation of a High Performance High Engagement (HPHE) relationship with staff. When fully in place, we anticipate HPHE becoming a way of managing and engaging with staff, and valuing their input into problem-solving. It will become a strategic partnership capable of producing durable solutions to future challenges.
Financial TargetsIt is pleasing to see an improvement in the annual results, in particular, the operating surplus increasing by 17% to $91m over the last 12 months, despite revenue falling by 3%. Higher passenger numbers saw Interislander’s revenue grow 9% to $127m and Scenic Journeys’ revenue increase 18% to $25m. Property’s revenue increased 20% to $39m in line with a stronger commercial focus on returns from our property assets.
Freight revenue fell by 6% to $434m. Bulk freight revenue was down, although reduced coal volumes from Solid Energy were partially offset by higher Fonterra milk volumes. Forestry, Import/Export and Domestic freight categories performed slightly ahead of last year.
Rail has high fixed costs and is capital intensive. While the cost of operating our services is cash-positive, the cost of maintaining the network, which includes more than 1500 bridges and more than 140 tunnels, is not. Additionally, the network suffers from past periods of deferred maintenance.
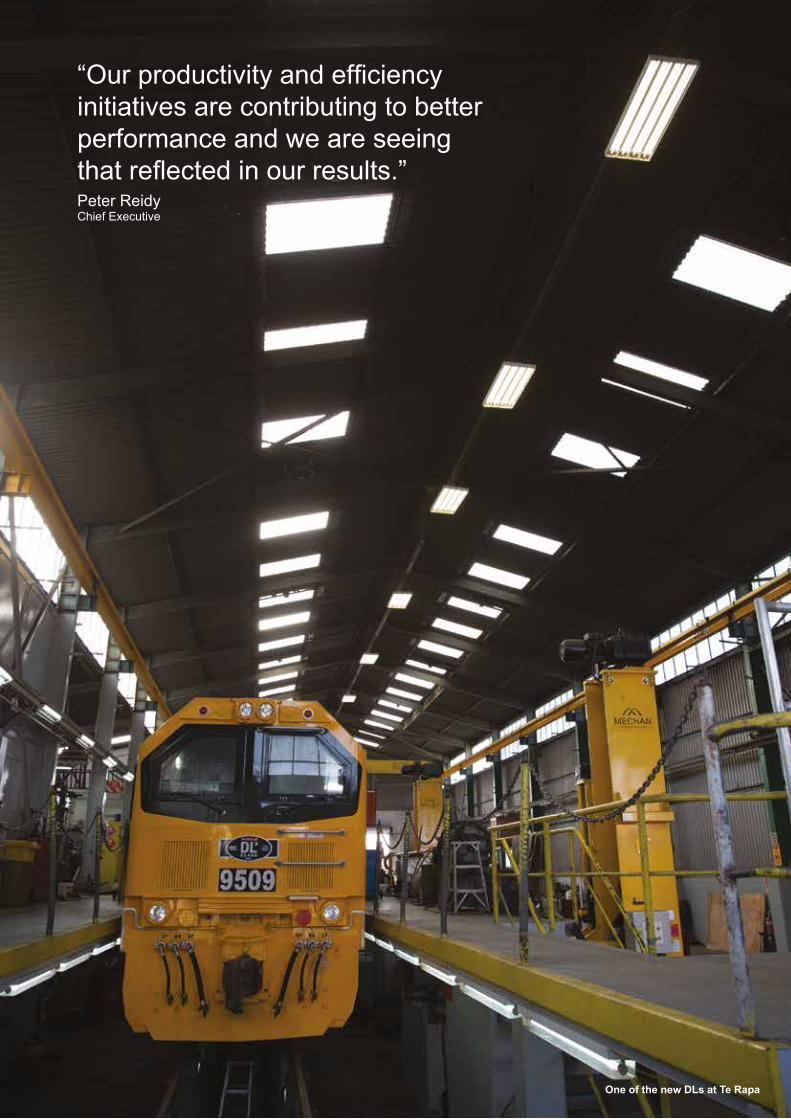
The financial challenges of maintaining a 4000km network with a backlog of work means we will continue to rely on Crown support for the foreseeable future. However, our productivity and efficiency initiatives are contributing to better performance and we are seeing that reflected in our results.
Outlook The outlook for the next financial year remains challenging, particularly given our exposure to global commodity markets. However, there are more productivity gains to be
made. By continuing this cultural and organisational change, and focusing on costs, we expect to reduce the level of Crown support required over time.
I would like to place on record my thanks to the Board for their guidance, the Executive team for their commitment and the staff for their effort. Together we are making KiwiRail stronger.
Peter ReidyChief Executive Officer
Removing 1.4 million truck movements from our roads
Helping commuters make 24 million low-carbon journeys each year
Diverting 470,000 tonnes of carbon emissions
Avoiding 185 million litres of diesel consumption
Creating long-lasting two-way relationships with customers, suppliers and other stakeholders
Helping community groups, schools and sports groups to travel
Reducing congestion, making our roads safer
Contributing to New Zealand’s economic growth
CO2

14 TRUSTED KIWI-OWNED LOGISTICS PARTNER GROWING NEW ZEALAND
Commercial Review
Above/Below Rail
The Commercial Review (the ‘Review’) was completed in December 2014. It was an opportunity to engage with the Government on long term funding and support for rail, and to gain clarity on the most favoured network configuration. The Review examined the economics of each rail corridor and service, and explored four high level options as follows:• Trimmed network• ‘Golden Triangle’ (Auckland-
Hamilton-Tauranga) only• Separate Island networks• Exit
No changes were proposed to Metro services in Auckland and Wellington.
Key FindingsThe Review found that financial self-sufficiency of the network is not
achievable. It is difficult for KiwiRail to increase revenue from commodity-based sectors, and there is insufficent freight density in New Zealand to fully fund the network. There are also limited revenue diversification opportunities for rail in a growing New Zealand freight market. Given the capital-intensive nature of rail, owning and operating the network has a very high fixed cost component, but a competitive marginal cost when compared to road.
The Review underlined the challenges that KiwiRail faces in reducing the cost of the network. Historic under-investment in the network only makes those challenges larger.
The Review also identified a number of opportunities for KiwiRail. There were a number of uneconomic rail corridors identified that could be closed with little ripple effect to the rest of the network; there are implications for our future funding requirements should we retain the national network in its entirety. Additionally,
opportunities were identified to reduce costs and improve productivity to reduce the amount of taxpayer funding required.
Next StepsAfter considering the range of options in the Review, the Government signalled a long-term commitment to a national rail network and committed $400m in funding over the next two years. However, the Government also indicated that KiwiRail must continue to drive significant efficiency and productivity improvements to reduce the level of ongoing taxpayer support required.
In line with the findings of the Review, a number of cost-reduction and productivity initiatives have been put in place, and we are already seeing the benefits of those initiatives. KiwiRail is committed to fully engaging with our staff as we continue to improve our productivity and efficiency, and to providing an increasingly high level of service to our passengers and freight customers.
Above Rail/Below Rail is a different way of presenting and considering the cost of providing rail services.Viewed this way, the cost of providing the infrastructure of New Zealand’s rail
network, including the signals, tunnels, bridges and the track itself would be considered “Below Rail” costs. Currently, providing and maintaining this infrastructure costs about $200m a year and is largely paid for by the Government.
“Above Rail” costs include the locomotives, carriages, wagons, staff, ticketing systems and other assets that are typically considered as operational costs. Currently, KiwiRail’s operational costs are broadly covered by the revenue it earns.
91589158

15KIWIRAIL ANNUAL REPORT | 2015
“Our partnership with KiwiRail has benefited
our neighbouring communities, as
increased rail services to the port took 53,500
containers off local roads this year. We will grow
this partnership, not just to get more containers
off local roads, but also to drive efficiencies in the
supply chain by linking the Waitematā seaport
by rail to our network of North Island freight hubs.”
Tony GibsonCEO Ports of Auckland Ltd
JOHN MITCHELLTeam Leader
16 TRUSTED KIWI-OWNED LOGISTICS PARTNER GROWING NEW ZEALAND
KiwiRailBoard
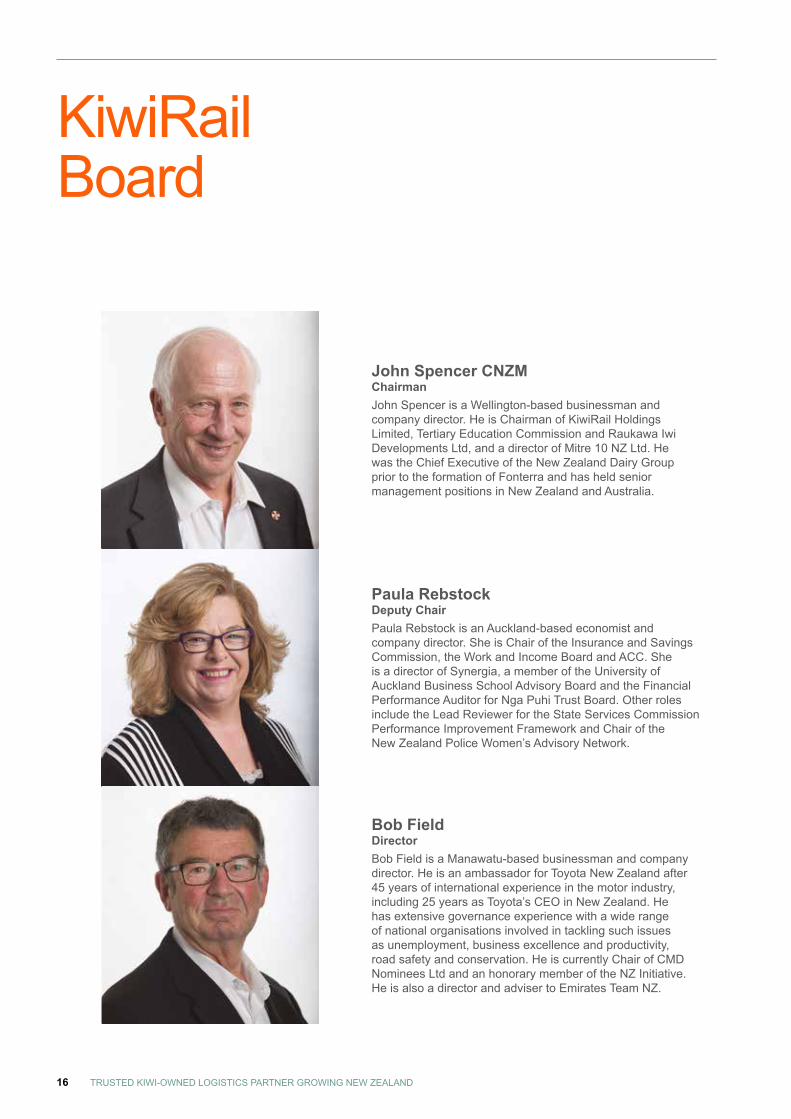
John Spencer CNZMChairmanJohn Spencer is a Wellington-based businessman and company director. He is Chairman of KiwiRail Holdings Limited, Tertiary Education Commission and Raukawa Iwi Developments Ltd, and a director of Mitre 10 NZ Ltd. He was the Chief Executive of the New Zealand Dairy Group prior to the formation of Fonterra and has held senior management positions in New Zealand and Australia.
Paula RebstockDeputy ChairPaula Rebstock is an Auckland-based economist and company director. She is Chair of the Insurance and Savings Commission, the Work and Income Board and ACC. She is a director of Synergia, a member of the University of Auckland Business School Advisory Board and the Financial Performance Auditor for Nga Puhi Trust Board. Other roles include the Lead Reviewer for the State Services Commission Performance Improvement Framework and Chair of the New Zealand Police Women’s Advisory Network.
Bob FieldDirectorBob Field is a Manawatu-based businessman and company director. He is an ambassador for Toyota New Zealand after 45 years of international experience in the motor industry, including 25 years as Toyota’s CEO in New Zealand. He has extensive governance experience with a wide range of national organisations involved in tackling such issues as unemployment, business excellence and productivity, road safety and conservation. He is currently Chair of CMD Nominees Ltd and an honorary member of the NZ Initiative. He is also a director and adviser to Emirates Team NZ.

17KIWIRAIL ANNUAL REPORT | 2015
Rebecca ThomasDirectorRebecca Thomas has more than 29 years’ experience in financial markets in New Zealand and overseas. She has a background in law and business having held roles as both a CEO and Independent Director on UK-based Boards. She is Chair of the Audit, Finance and Risk Committee of the Financial Markets Authority (FMA), a director of Mint Asset Management Ltd and a director of Black and White Group Ltd. Rebecca is also an associate member of the Foundation Board of the FMA.
Dr Kevin ThompsonDirectorKevin Thompson is a Nelson based professional director and civil engineer. He was Chief Executive of Opus International Consultants from 2001 to 2010. He is Deputy Chair of the Environmental Protection Authority and Chair of the Authority’s HSNO Committee. He is a Distinguished Fellow and immediate Past President of the Institution of Professional Engineers New Zealand.
John LeucharsDirectorJohn Leuchars is a professional company director. He was a consulting engineer who held director and managing director positions in international consulting engineering companies for 30 years. These included Managing Director of Connell Wagner (NZ) Limited (now Aurecon) and of Connell Mott MacDonald, when he was based in London. He has experience in a broad range of industries in a hands-on design role or at governance level. John has had governance experience in a number of private and public companies and not-for-profit organisations. John is currently a director of Genesis Energy Limited, The Wellington Gateway General Partnership Companies Nos.1 and 2 (Transmission Gully motorway) and Milmeq Ltd.
Guy RoyalDirectorGuy Royal has a background in private equity with commercial and corporate law for more than 18 years in New Zealand, Hong Kong, Vietnam and the United Kingdom. While in the UK Guy worked for CDC Capital plc, a private equity fund with more than NZ$3 billion in direct investments and lending in various industries internationally. He is an executive director of Tuia Group, a professional advisory firm with offices in New Zealand, PNG and Samoa.

18 TRUSTED KIWI-OWNED LOGISTICS PARTNER GROWING NEW ZEALAND
Kate JorgensenChief Financial OfficerKate joined KiwiRail in March 2015. She is responsible for KiwiRail’s Commercial, Property, IT, Legal, Procurement and Government Relations portfolios, and partners with the other businesses to drive financial results. Prior to KiwiRail, Kate worked for Fletcher Building for six years, where she held several senior commercial roles, including GM Finance for Heavy Building Products and GM Finance for the Infrastructure Products Division. Kate is a Chartered Accountant and holds a Bachelor of Business Studies from Auckland University of Technology.
Iain HillGroup General Manager OperationsIain joined KiwiRail in October 2009 as General Manager Freight. He has been in his current role since 2014 and is responsible for rail freight, ferry operations, rail freight terminal and container terminal operations, ferry terminals, crew-scheduling, rolling stock and mechanical and maintenance. Prior to joining KiwiRail Iain worked for 15 years at Express Couriers Limited, where he held various General Manager roles including GM Logistics and Distribution.
Peter ReidyChief ExecutivePeter commenced his role as Chief Executive, KiwiRail on March1, 2014. He brings to KiwiRail a successful track record of leading and building service and infrastructure-based businesses in the logistics, energy, building products and asset management sectors in Australia, New Zealand, Asia and the United Kingdom. Previously Chief Operating Officer Infrastructure Services with Downer Group in Australia, Peter held a number of senior leadership roles with Downer Group since joining them in 2006, both in New Zealand and Australia, including Board roles on the KeolisDowner Joint Venture operating Yarra Trams in Melbourne and Gold Coast Light Rail. Prior to joining Downer Group, Peter held senior leadership roles with Fletcher Building, Todd Energy and Freightways in New Zealand.
KiwiRailExecutive Team

19KIWIRAIL ANNUAL REPORT | 2015
Alan PiperGroup General Manager Sales and CommercialAlan joined KiwiRail in September 2013 and is responsible for the freight, commercial vehicles and passenger revenue portfolios. This includes marketing, pricing and sales planning to improve margin and revenue. He previously worked in freight and logistics sales and general management roles with CourierPost and Pace Couriers and had a successful 23-year career with the Bank of New Zealand in retail banking and branch strategy. Alan holds a Masters of Business Administration and Management from Southern Cross University in Australia.
Dr Bob StacyGroup General Manager Zero HarmBob joined KiwiRail in March 2014 and is responsible for Health, Safety and Environment. He previously worked in leadership roles in Australia, including BHP Engineering, BHP Transport, CSR, Downer Group and General Electric. His experience covered shipping, mining, rail and road operations. Dr Stacy holds a PhD in Organisational Development from the University of Ballarat, a Master’s of Human factors and Ergonomics from Loughborough University (UK) and a Bachelor of Science in Physiology from the University of New England (NSW Australia).
Andrew NortonGroup General Manager Human ResourcesAndrew joined KiwiRail in June 2014 and has extensive experience in Human Resources and Industrial Relations in NZ and Australia, strong engagement skills with frontline engineering and customer service teams and developing Executive leadership. He previously held high-level roles with Public Service Association (PSA) NZ, Auckland District Health Board and worked as Downer Australia’s Executive General Manager Human Resources. He holds a Diploma in Applied Social Science, Social Work and Community Work from Auckland University and studied Human Resources at Michigan University.
Todd MoyleGroup General Manager Network ServicesTodd joined KiwiRail in February 2007 and is responsible for the delivery of infrastructure maintenance and renewals, Zero Harm performance, inventory and plant management, contractor management and leadership development. Before moving into his current role, Todd worked as KiwiRail’s Southern Development Manager and Southern Regional Manager - Infrastructure. Todd joined KiwiRail following a stint in the United Kingdom working for London Underground. Todd has a New Zealand Certificate of Mechanical Engineering and a Bachelor of Mechanical Engineering with first class honours.
Stephen O’KeefeGroup General Manager Strategy and TransformationStephen joined KiwiRail in 2012 and is currently KiwiRail’s Group General Manager Strategy and Business Transformation, a position he has held since December 2014. Stephen also leads the Tranz Metro division of KiwiRail which operates Wellington’s commuter train services. Before joining KiwiRail, Stephen worked for over 20 years at Fonterra where he held a number of senior finance roles in various countries. Stephen has a Bachelor of Commerce degree from Canterbury University.
David GordonGroup General Manager Asset Management, Engineering and InnovationDavid joined KiwiRail in 2007 when he began working on the Wellington Regional Rail Programme as the Project Director. Most recently, David held the role of General Manager Network Performance overseeing the Infrastructure and Engineering’s change-management and change-delivery programme, asset and business planning, finance, major plant & equipment, IT and network control. He previously worked as a consultant in the transport infrastructure business for organisations such as Wellington International Airport. David holds a Bachelor of Arts from Otago Univeristy.

20 TRUSTED KIWI-OWNED LOGISTICS PARTNER GROWING NEW ZEALAND
Sustaining a Zero Harm EnvironmentThe inherent risks associated with our business means the safety of our people, the public and the environment is critical. Zero Harm is our proxy for leadership – it represents our commitment to actively care for and protect our people, the public and the environment while growing our business. Worker SafetyOver the past 12 months there have been notable improvements in the number of work-related safety incidents, with the Total Recordable Injury Frequency Rate reducing by 50% and Lost Time Injury Frequency Rate reducing by 36%.
Several initiatives have been introduced to improve the capability of our people, empower our leaders to take an active and visible position on safety, and work collaboratively on critical risk areas. This includes the SafespineTM Programme, customised to the key injury risks present in the KiwiRail work environment, and a $4m investment in auto-coupling devices, designed to significantly reduce manual lifting for front line staff.
This year also saw the introduction of a new ‘lock-on lock off procedure’, requiring workers to carry a personal padlock that they lock onto an alumina frame carried by the site protector. This provides the site protector with certainty that workers have moved to a dedicated safe place before a train can proceed through a worksite. This simple low technology solution has contributed to a significant reduction in the number of incidents involving workers and trains in the corridor – a decrease of 41% over the last year.
Public SafetyOver the last twelve months there were two fatalities at level crossings and seven trespass fatalities.
We have continued to work closely with local communities and partner agencies, including TrackSAFE a charitable trust sponsored by KiwiRail, to improve awareness and target behaviours that are putting people at risk. This work complements our ongoing investment in level crossing
upgrades and fencing programmes to discourage trespassing on the rail corridor.
An unprecedented three month period without any vehicle collisions at level crossings was a highlight this year, and coincided with a holiday advertising campaign led by TrackSAFE NZ, with support from KiwiRail, to encourage drivers to concentrate at level crossings.
SCOTT ANDREWSCorridor Access and Protection Planner

21KIWIRAIL ANNUAL REPORT | 2015
Zero Harm continued
Operational SafetySignals passed at danger (SPADs) have been a specific safety focus this year, with the development of a strategic response and action plan. The frequency of SPADs has been declining since 2012/13, with a 16% reduction achieved this year compared with the previous year.
Collisions with slips increased during this year with a number of significant weather events taking a toll on the network. Many frequently affected slip sites have since had civil engineering remedial works completed to lower the risk in the long term.
EnvironmentIt has been a positive year for delivering operational and strategic improvements in environmental performance at KiwiRail.
Our energy intensity is decreasing as a direct result of the introduction of a new diesel locomotive fleet and implementation of the energy miser fuel optimising technology in locomotives. Interislander undertook a successful trial of a fuel emulsifier demonstrating the potential for both
savings in fuel consumption and a reduction in emissions. KiwiRail is committed to continuously improving energy management to enhance the advantage of rail as an energy-efficient and low carbon mode of transport.
Trackside fires caused concern in Spring 2014. Early trend analysis and proactive risk management resulted in a reduction in the number of fires over the summer.
OutlookEmbedding a safety culture and sustaining a Zero Harm environment will remain a key priority for KiwiRail in FY16. We will be benchmarking ourselves against international operators and will leverage successful strategies. We will continue to work towards eliminating serious incidents and reducing lost time and total recordable injuries. We will continue to work closely with communities and partner agencies to improve public safety and to promote the low carbon advantages offered by rail.
KiwiRail will increase its focus on the strategic context and long-term vision for environmental management.
Expect a train A new multi agency awareness campaign which aims to improve driver behaviour at rural level crossings throughout New Zealand was launched during this year’s Rail Safety Week.
The ‘Expect a train’ campaign is aimed at getting local drivers off autopilot when approaching level crossings. The campaign includes a mobile ‘locomotive sized’ billboard which was launched in Carterton and will be taken to other high-risk crossings.
9%
2%Rail accounts for less than 2% of the energy used by the transport sector while completing 16% of
the freight task.
Reduction in carbon intensity for freight services since 2010
5%Improvement in locomotive fuel burn efficiency FY15
Mobile ‘locomotive sized’ billboard, Carterton

22 TRUSTED KIWI-OWNED LOGISTICS PARTNER GROWING NEW ZEALAND
Our People
KiwiRail’s 4,000 staff are the company’s most important resource and our investment in them will help us deliver our vision. Our aim through this investment is to lift our engagement with staff to help unleash the potential they hold to improve the business. A number of staff development initiatives were undertaken during the year.
Safety LeadershipThe safety leadership programme is designed to engage the Frontline, middle and senior managers to build their personal commitment to driving safety as a core function of their leadership role at KiwiRail. 510 staff completed the programme this year.
KiwiRail Leadership Development ProgrammeThis programme is aimed at leaders across our business at senior, middle management and at the frontline. During the past 12 months 160 leaders
have completed the programme which focuses on our “Back to Basics” business framework and the KiwiRail Leadership Capabilities which are derived from the framework. Over the course of the next two years we are aiming to have a further 200 leaders complete the programme.
Toitoi – Maori Cadetship ProgrammeThis programme is for our staff who identify as New Zealand Maori with Iwi affiliation, and who demonstrate strong potential to further develop our business in a technical speciality or leadership role. During the year, six cadets entered the programme with the support of mentors within the business, and we expect a further 12 cadets to go through the programme in FY16.
High Performance High EngagementFY15 also saw the introduction of our High Performance High Engagement (HPHE) strategy, which is being increasingly adopted by modern companies. HPHE seeks to engage workers and their unions in the process of problem-solving in the workplace. It is based on mutual respect, and values the input and
decision-making of those most closely related to a problem or a challenge. It is a modern version of the very old union-management collaboration practices of some decades ago.
KiwiRail faces some considerable market and operational challenges in the next two years, and has been charged by our shareholding Ministers with being more productive. In order to get the highest quality, most durable decisions about our future, it makes sense to draw on the expertise of our staff and the unions which represent them.
OutlookWe will continue to work in FY16 to lift the quality of leadership within the company, and to embed the HPHE strategy within the business.
4,000Staff working to deliver our vision
LUPE UALOMechanical Engineer

23KIWIRAIL ANNUAL REPORT | 2015
VICTOR FOONMaintenance Engineer

24 TRUSTED KIWI-OWNED LOGISTICS PARTNER GROWING NEW ZEALAND
Freight
KiwiRail plays an important role in New Zealand’s freight and supply chain markets. Our customers trust us to move their valuable freight efficiently and safely. Delivering on their expectations is a vital part of our business. Freight FleetFreight is KiwiRail’s single biggest income earner accounting for 60% of the company’s total operating revenue in FY15. To ensure KiwiRail remains relevant and competitive we are investing in assets and infrastructure that increases our capacity to meet our customers’ needs.
During the year KiwiRail ordered its 1,000th new container flat deck wagon which arrived in September 2015. These new wagons can each carry 56 tonnes of freight, a 30% increase per wagon from the previous fleet. Increased loads help New Zealand’s supply chain operate more efficiently by offering more flexibility.
Our target to improve our fuel burn efficiency this year was exceeded, which is good for business and for the environment. Further efficiencies in our freight operations are expected with the arrival of our eight new diesel locomotives.
Freight FacilitiesWe are actively working with our customers to promote easier freight movements and have been involved in a number of key supply chain infrastructure developments.
Over the last 12 months freight hubs or “inland ports” have been opened in Rolleston by Port of Timaru; in Longburn (near Palmerston North) as a joint venture between Ports of Auckland, Napier Port and Icepak, and in Whanganui by Wellington-based CentrePort.
We expect the number of freight hubs to grow in FY16 as more integration of ports, road and rail continues.
Freight MarketKiwiRail’s customer base means that we are dependent on demand for bulk commodities like coal and forestry, which are heavily impacted by global demand and prices. Whilst we have little ability to influence volume in these markets, we have achieved growth in the domestic market sector through the ongoing shift from road to rail. This will continue to be an area of focus for us in FY16.
OutlookNew Zealand’s supply chain is undergoing rapid change driven by a desire to create more supply-chain efficiency.
While the current outlook for key commodities is challenging, the prospect of bigger ships, more freight hubs and inland ports that connect rail and road, alongside a strong domestic market, all position KiwiRail well for growth.
We will be actively targeting the development of strategic partnerships in order to optimise our market share.
“KiwiRail is a critical cornerstone of
New Zealand’s supply chain and a major partner
in our growth plans.”Blair O’Keeffe
CentrePort Chief Executive
$434mFreight revenue FY15
$132m
10%Freight operating surplus FY15
Increase in import/export freight volumes FY15

25KIWIRAIL ANNUAL REPORT | 2015
Interislander
Interislander provides a critical transport link between the North and South Island for freight customers and passengers.Higher revenues from Interislander were one of the highlights of KiwiRail’s annual results for FY15. Interislander’s revenue grew 9% to $127m, supported by a positive trend in customer satisfaction performance. Interislander was certainly helped by New Zealand attracting more tourists during the year, which boosted passenger numbers.
Interislander achieved a 22% increase in passengers in FY15 over the previous year, and had its busiest summer season in a decade. The reliability performance against scheduled sailings for the year was 99%.
The fleet carried passengers to special events such as the Cricket World Cup, and continued to be an attractive option for tourists wanting to experience travelling through the beautiful Marlborough Sounds.
There were more than 4,500 crossings during the year that carried more than one million passengers and vehicles. Interislander carried around 70% of the total passengers across Cook Strait.
Whilst Interislander’s public face is about carrying passengers, it also transports the majority of the freight that moves between the North and South Islands, taking more than 80% of the freight load in the last year. Our freight customers are very important to us, and rail links to our terminals enable us to offer a unique service. Annually Interislander ferries carry 59,000 freight wagons, 68,000 trucks and 217,000 cars. The ships transport several types of freight which do not suit coastal shipping, such as bulk fresh milk, livestock, perishables, courier freight and mail.
OutlookInterislander welcomed Kaiarahi to the fleet in September 2015. She will provide greater freight capacity across Cook Strait. We intend to build on our successful FY15 with a continued focus on strengthening our customer
experience and providing a seamless connection for freight customers and passengers between Auckland and Christchurch.
Farewell to the Arahura On 29 July 2015, the Arahura completed its final sailing across the Cook Strait after 52,000 crossings since coming in to service in December 1983. She carried more than eight million passengers and retired with just under five million kilometres on the clock.
$127mInterislander revenue FY15
$25m
22%
Interislander operating surplus FY15
Increase in Interislander passenger journeys

26 TRUSTED KIWI-OWNED LOGISTICS PARTNER GROWING NEW ZEALAND
Tranz Metro
Long-valued by Wellingtonians, Tranz Metro is the capital city’s increasingly popular commuter train network that runs more than 2000 services a week linking the Hutt Valley, northern suburbs and Kapiti Coast with the central city.For the first time in a financial year, more than 12m passengers trips were taken on the Wellington network, with both the Kapiti and Hutt Valley lines carrying 5.1m passengers each. It was also a busy year for special events, including the Cricket World Cup, FIFA Under 20 World Cup, and Anzac celebrations.
Customer satisfaction for the year was 92%, with ticketing and interactions with on-board staff identified as particular areas of strength. While this is a pleasing result, Tranz Metro will continue to identify areas where the customer experience could be improved to increase customer satisfaction even further.
There are more than 2,000 scheduled services on the Tranz Metro network every week, and full-year on-time performance across the network was 93%. On-time performance for the Wairarapa line was 75%, largely due to the age and condition of the line. The NZ Transport Agency has provided $2.3m of funding which will enable some of the most urgent work on the line to be completed during FY16. Tranz Metro and Greater Wellington Regional Council have a joint project underway with the goal of elevating the Wairarapa line’s on-time performance to the same level as the other lines within the network.
Severe storms affected services from time to time over the year and staff and contractors worked hard in difficult conditions to restore services as quickly as possible.
OutlookFY16 is the last year of Tranz Metro’s current contract with Greater Wellington Regional Council to deliver metro passenger services in the Wellington region. KiwiRail is currently working with partner Keolis Downer to submit a joint bid under the ‘WMetro’ brand for the 15-year
contract to provide metro passenger services from 1 July 2016.
$54m
$4m
12m
Tranz Metro revenue FY15
Tranz Metro operating surplus FY15
Tranz Metro passenger trips FY15
Tranz Metro passengers at morning peak

27KIWIRAIL ANNUAL REPORT | 2015
KiwiRail’s Infrastructure team maintains and upgrades 4,000km of rail corridor, bridges, tunnels, viaducts, overhead wires, signals and level crossings. It is also responsible for all train movements on the network managed by the National Train Control Centre.In keeping with our customer focus, maintenance through the year centred on the business-critical Auckland to Tauranga route. We set the goal of eliminating timber bridges on this route by the end of 2015 and remain on track to do so. We have also been working on the removal of a further seven timber bridges on the North Island Main Trunk Line (NIMT), which feeds the Auckland to Tauranga route (amongst others).
We made changes to Auckland yards to better accommodate traffic growth on the Auckland Tauranga route, and NIMT. We now have a regular works programme operating in the Kaimai tunnel strengthening the floor. Our goal is to have this work complete prior to the arrival of super-ships when we expect to carry heavier loads.
New Zealand‘s weather and terrain make operating a railway network challenging. We have teams that work in all areas of the country in sometimes very difficult conditions to repair infrastructure as required to minimise disruptions for our customers. The June 2015 storms in the Lower North Island and Dunedin, for example, caused extensive damage, costing approximately $4m to repair.
The rail grinding programme, which began in 2013, completed another full year on the network. The grinder extends the life-span of track by smoothing and removing defective metal from the rail head.
It also has long term cost saving benefits by reducing the amount of maintenance needed, and reducing fuel consumption.
Work was done in preparation for the creation of a third line which will enable freight traffic to operate more independently of the increasing commuter traffic on the Auckland network. From KiwiRail’s perspective, completing the third main is critical to accommodating freight growth and providing network capacity to handle the metro traffic.
Mainline DerailmentsOne of the most significant measures of network robustness is the incidence of derailments. It is pleasing to record the continuing reduction in derailments over time. This year’s figure of eight is an improvement on last year’s 18 which itself stands in stark contrast to the 60 to 70 that were the norm a decade ago.
Auckland and Wellington Suburban NetworksBoth Auckland and Wellington suburban networks have benefitted from extensive upgrades over a number of years.
In Auckland, the electrification projects culminated with the introduction of Auckland Transport’s new Electric Multiple Units onto the network.
Improvements on the Wellington network have concentrated on replacement of ageing overhead wiring and support masts, with the goal of having the Kapiti Line fully upgraded at the end of the project.
Outlook We will continue managing our programme of maintenance, repair and upgrade of our network, including the need for greater capacity and resilience in the Auckland and Wellington metro networks, while meeting financial targets.
Infrastructure
82,000
$198mInfrastructure & Asset Management capital
investment FY15
New sleepers laid FY15
Track staff undertaking maintenance and renewal

28 TRUSTED KIWI-OWNED LOGISTICS PARTNER GROWING NEW ZEALAND
Property
Property is an important part of KiwiRail’s business, which enables our operations and makes a significant contribution to our bottom line annually.PortfolioWe own more than 1,500 property assets, around 1,230 of which are used to support our business operations with the remainder being leased. The replacement cost of all our building assets is around $800 million, reflecting the significant investment we have in property nationally. Our land holdings, totalling 17,800ha, are owned by New Zealand Railways Corporation (NZRC) and managed by KiwiRail under a lease arrangement.
We have a dedicated Property team to provide direction and service to the business on all property matters; generate income growth through long-term sustainable leasing arrangements with commercial terms; and increase use of our property assets to achieve business growth and maximise profitability.
Commercial FocusImproving our property management and adopting a more commercial approach, particularly with those parties undertaking commercial activity on leased land, was a big focus for us during FY15. It also includes making better use of our land outside the rail corridor, and may mean selling surplus land where appropriate and increasing rents to market levels. We are also partnering with our customers to identify opportunities to lease land for new freight hubs, adjacent to our rail yards.
In the past 12 months, we have seen a number of new rail-served infrastructure operations open, including Mainfreight opening enlarged premises in Christchurch and Hamilton.
KiwiRail is currently reviewing its property leases and identifying sub-market rates, as part of a wider commercial review of its property portfolio. This approach will result in some changes to businesses and organisations that are using our land, and we are adopting an open approach to keep tenants informed of changes.
We believe we have balanced fairness to our tenants with fairness to taxpayers who are putting money into KiwiRail every year and are entitled to expect us to set a market price on our commercial tenancies.
OutlookOur focus is on continuing to review and rationalise our property portfolio. We will seek improved leasing arrangements to generate market-aligned returns, as well as property development and sales initiatives where these make commercial sense.
$18m
$39m
Property operating surplus FY15
Property revenue FY15
Southdown Container Terminal Site

29KIWIRAIL ANNUAL REPORT | 2015
Scenic Journeys
KiwiRail’s Scenic Journeys tourist services continue to gain favourable domestic and international coverage. The Northern Explorer service running between Auckland and Wellington, the seasonal Coastal Pacific service between Christchurch and Picton and the iconic TranzAlpine service between Christchurch and Greymouth each offer different but compelling vistas of New Zealand.
Boosted by record levels of inbound tourists to New Zealand, all three Scenic services performed very well during the year, with a 15% increase on FY14 patronage. Although there had been a significant decline in patronage on the South Island services following the Christchurch earthquakes of 2010 and 2011, passenger numbers on the TranzAlpine and Coastal Pacific
have now almost returned to pre-earthquake levels.
The Scenic services are increasingly gaining recognition as ‘must do’ activities for visitors to New Zealand and a unique way to experience Kiwi hospitality and to see parts of our country that are otherwise inaccessible. The services have been featured in a variety of travel magazines during the year, and have been rated one of the best in the world by Tourism New Zealand.
Customer satisfaction increased to record levels for the Scenic services in FY15, reflecting well on the quality of the journeys and the efforts of frontline staff.
OutlookOur focus for FY16 and beyond will be to continue marketing all of our tourist services to build on the strong volume and revenue growth seen in FY15.
$25m
$3m
15%
Scenic Journeys revenue FY15
Scenic Journeys operating surplus FY15
Increase in passengers FY15
TRESNA HONSONScenic Journeys Train Attendant
30 TRUSTED KIWI-OWNED LOGISTICS PARTNER GROWING NEW ZEALAND
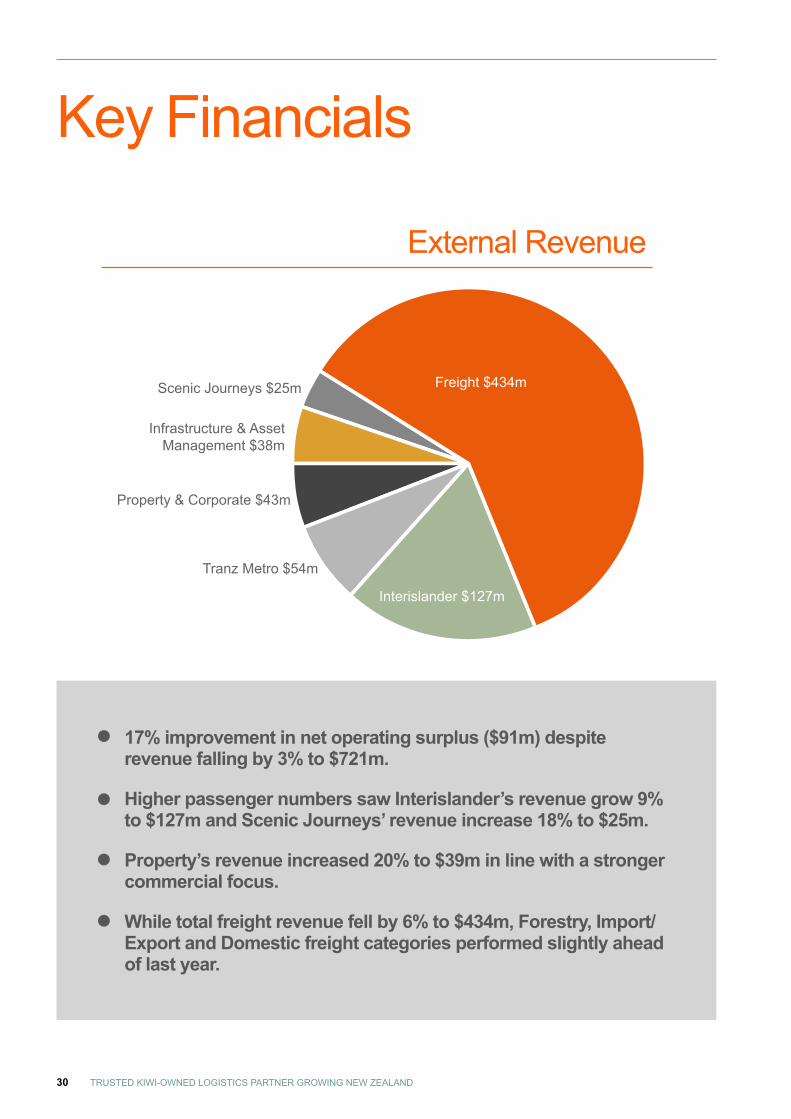
Freight $434m
Interislander $127m
Tranz Metro $54m
Property & Corporate $43m
Scenic Journeys $25m
Infrastructure & AssetManagement $38m
Key Financials
External Revenue
• 17% improvement in net operating surplus ($91m) despite revenue falling by 3% to $721m.
• Higher passenger numbers saw Interislander’s revenue grow 9% to $127m and Scenic Journeys’ revenue increase 18% to $25m.
• Property’s revenue increased 20% to $39m in line with a stronger commercial focus.
• While total freight revenue fell by 6% to $434m, Forestry, Import/Export and Domestic freight categories performed slightly ahead of last year.
31KIWIRAIL ANNUAL REPORT | 2015
“Our productivity and efficiency initiatives are contributing to better performance and we are seeing that reflected in our results.”Peter ReidyChief Executive
One of the new DLs at Te Rapa

32 TRUSTED KIWI-OWNED LOGISTICS PARTNER GROWING NEW ZEALAND
Audited Annual Financial StatementsFor the financial year ended 30 June 2015
Statement of Comprehensive Income .......................................33Statement of Financial Position .................................................34Statement of Movements in Equity ............................................35Statement of Cash Flows ..........................................................36Notes to the Financial Statements.............................................37Independent Auditor’s Report ....................................................78

KiwiRail Holdings Ltd
The accompanying notes form part of these financial statements.
For the financial year ended 30 June 2015
33KIWIRAIL ANNUAL REPORT | 2015
Statement of Comprehensive Income
Note 2015 2014
$m $mOperating revenues 2 720.6 740.9
Operating expenses 3 (630.1) (663.4)
Operating surplus 90.5 77.5Grant income 4 44.6 93.4
Depreciation and amortisation expenses 5 (68.8) (69.7)
Foreign exchange and commodity gains and losses 6 7.2 (1.5)
Net finance costs 7 (17.8) (9.2)
Impairment 9(d) (224.7) (331.3)
Movement in value of investment properties 14 1.7 (7.2)
Other income 0.8 -
Net loss before taxation (166.5) (248.0)Income tax (expense)/credit 8 - -
Net loss after taxation (166.5) (248.0)Other comprehensive income/(loss)Items that can be reclassified into net surplus or deficit:
Gains/(losses) from cash flow hedges 1.5 (2.9)
Items that cannot be reclassified into net surplus or deficit:
Transfer to asset carrying value from cash flow hedge reserve 0.1 (0.9)
Building revaluation 9(d) - 13.5
Building impairment 9(d) (3.1) -
Vesting of assets and liabilities - 9.0
Total comprehensive loss (168.0) (229.3)

KiwiRail Holdings Ltd
As at 30 June 2015
The accompanying notes form part of these financial statements.
34 TRUSTED KIWI-OWNED LOGISTICS PARTNER GROWING NEW ZEALAND
Statement of Financial Position
John SpencerChair28 August 2015
Paula RebstockDeputy Chair28 August 2015
Note 2015 2014
$m $mCurrent assets
Cash and cash equivalents 10 50.0 15.4
Trade and other receivables 11 87.6 93.4
Inventories 12 56.5 58.7
Financial assets 13 6.5 2.6
Assets held for sale 9(b) 2.1 1.6
202.7 171.7Non-current assetsProperty, plant and equipment 9(a) 675.9 710.4
Investment property 14 67.6 39.9
Intangible assets 9(c) 0.6 0.3
Financial assets 13 0.2 0.3
Trade and other receivables 11 - 0.1
Investment in joint venture 16 1.6 -
745.9 751.0Total assets 948.6 922.7Current liabilitiesTrade and other liabilities 17 150.5 152.2
Financial liabilities 13 31.6 21.3
Income taxes payable 8 - -
Provisions 18 4.7 15.3
186.8 188.8Non-current liabilitiesTrade and other liabilities 17 35.0 37.3
Financial liabilities 13 201.7 214.0
Provisions 18 4.7 5.6
241.4 256.9Total liabilities 428.2 445.7Net assets 520.4 477.0EquityShare capital 23 403.8 205.8
Retained earnings 94.2 235.4
Asset revaluation reserve 22.6 37.6
Cash flow hedge reserve (0.2) (1.8)
Total equity 520.4 477.0

KiwiRail Holdings Ltd
The accompanying notes form part of these financial statements.
For the financial year ended 30 June 2015
35KIWIRAIL ANNUAL REPORT | 2015
Statement of Movements in Equity
Share Capital Retained Earnings
Asset Revaluation
Reserve
Cash Flow Hedge
ReserveTotal
$m $m $m $m $m
As at 30 June 2013 87.0 442.3 56.2 2.0 587.5
Net loss for the period - (248.0) - - (248.0)
Other comprehensive income/(loss)
Gains from cash flow hedges - - - (2.9) (2.9)
Transfer to asset carrying value from cash flow hedge reserve - - - (0.9) (0.9)
Revaluation of property, plant and equipment - - 13.5 - 13.5
Revaluation reserve of transferred / disposed property, plant and equipment - 32.1 (32.1) - -
Vested assets - 9.0 - - 9.0
Total comprehensive loss - (206.9) (18.6) (3.8) (229.3)
Transactions with owners
Capital Investment 118.8 - - - 118.8
As at 30 June 2014 205.8 235.4 37.6 (1.8) 477.0
Net loss for the period - (166.5) - - (166.5)
Other comprehensive income/(loss)
Gains/(losses) from cash flow hedges - - - 1.5 1.5
Transfer to asset carrying value from cash flow hedge reserve - - - 0.1 0.1
Buildings impairment charged to asset revaluation reserve - - (3.1) - (3.1)
Revaluation reserve of transferred property, plant and equipment - 11.9 (11.9) - -
Total comprehensive income/(loss) - (154.6) (15.0) 1.6 (168.0)
Transactions with owners
Capital Investment 198.0 - - - 198.0
Crown appropriation on land transactions (note 19) - 13.4 - - 13.4
As at 30 June 2015 403.8 94.2 22.6 (0.2) 520.4

KiwiRail Holdings Ltd
For the financial year ended 30 June 2015
The accompanying notes form part of these financial statements.
36 TRUSTED KIWI-OWNED LOGISTICS PARTNER GROWING NEW ZEALAND
Statement of Cash Flows
Note 2015 2014
$m $mCash flows from operating activitiesProceeds from:
Receipts from customers 726.6 741.7
Interest received 3.4 1.6
Proceeds utilised for:
Payments to suppliers and employees (642.7) (662.1)
Interest expense (15.5) (14.1)
Net cash from operating activities 21 71.8 67.1Cash flows from investing activitiesProceeds from:
Sale of property, plant and equipment 4.5 1.9
Capital grant receipts 44.6 93.4
Proceeds utilised for:
Purchase of property, plant and equipment and investment properties (280.5) (332.2)
Purchase of intangibles (13.2) (10.1)
Net cash used in investing activities (244.6) (247.0)Cash flows from financing activitiesProceeds from:
Crown capital investment 198.0 118.8
Increase in equity from NZRC land sales 19 13.4 -
Loans 1.6 -
Finance lease - 16.0
Proceeds utilised for:
Repayment of borrowings (4.0) (3.5)
Repayment of finance lease liability (1.6) (0.8)
Net cash from financing activities 207.4 130.5Net increase in cash and cash equivalents 34.6 (49.4)Cash and cash equivalents at the beginning of the year 15.4 64.8
Cash and cash equivalents at the end of the year 10 50.0 15.4
KiwiRail Holdings Ltd
For the financial year ended 30 June 2015
The numbers in the notes to the financial statements are expressed in millions unless otherwise stated.
37KIWIRAIL ANNUAL REPORT | 2015
Notes to the Financial Statements
1. GROUP INFORMATION(a) Reporting entity
KiwiRail Holdings Limited (“KHL”, “the Parent”) is a company domiciled in New Zealand, registered under the Companies Act 1993 and is included within the First Schedule of the State Owned Enterprises Act 1986. The Group comprises KiwiRail Holdings Limited and its subsidiaries.
The following activities are required to be carried out by the Group:• Own and operate a national rail network which meets the needs of our customers• Provide for the transport of bulk and consolidated freight• Provide ferry services (forming the ‘bridge’ between the North and South Islands) for rail and road freight and for passengers and
their vehicles• Provide and support rail passenger services in metropolitan areas and long distance services for both domestic and tourist
markets• Manage and develop property holdings for rail operations and appropriate third-party land use
The financial statements of the Group are for the year ended 30 June 2015 and were authorised for issue by the Board of Directors on 28 August 2015.
(b) Basis of preparation
The financial statements have been prepared in accordance with New Zealand Generally Accepted Accounting Practice (“NZ GAAP”). They comply with New Zealand equivalents to International Financial Reporting Standards (“NZ IFRS”) as appropriate for for-profit entities and other applicable Financial Reporting Standards. They comply with the State Owned Enterprises Act of 1986, the requirements of the Companies Act 1993 and the Financial Reporting Act 2013. The financial statements have been prepared on the basis of historical cost, except for certain non-financial assets and derivative financial instruments, which have been valued at fair value.
Accounting policies are selected and applied in a manner which ensures that the resulting financial information satisfies the concepts of relevance and reliability, thereby ensuring that the substance of the underlying transactions or other events is reported.
Unless otherwise specified, all dollar amounts in these financial statements and accompanying notes are stated in New Zealand dollars and all values are expressed in millions of dollars ($m). The functional and presentation currency is New Zealand dollars.
(c) Consolidated financial statements
The consolidated financial statements of the Parent and its subsidiaries include the financial statements of subsidiary companies using the acquisition method of consolidation. The acquisition method of consolidation involves recognising at acquisition date, separately from goodwill, the identifiable assets acquired, the liabilities assumed and any non-controlling interest in the acquiree.
The Parent values subsidiary companies at the time of acquisition as the identifiable assets and liabilities acquired measured at the aggregate of fair values at the date of acquisition. The difference between the cost of acquisition over the fair values of the identifiable net assets acquired is recognised as goodwill or a discount on acquisition.
Subsidiary companies are those entities that are controlled directly or indirectly by the Parent.
(d) New accounting standards and interpretations
Issued and effective as at 1 July 2014The Group has adopted the requirements of NZ IAS 36 Impairment of Assets as at 1 July 2014:
• Additional information about the fair value measurement of impaired assets when the recoverable amount is based on fair value less costs of disposal.
• Information about the discount rates that have been used when the recoverable amount is based on fair value less costs of disposal using a present value technique.
The impact is disclosed in note 24 where applicable.
KiwiRail Holdings Ltd
For the financial year ended 30 June 2015
The numbers in the notes to the financial statements are expressed in millions unless otherwise stated.
38 TRUSTED KIWI-OWNED LOGISTICS PARTNER GROWING NEW ZEALAND
Notes to the Financial Statements
Issued but not yet effective as at 30 June 2014NZ IFRS Standards and Interpretations that have recently been issued or amended but are not yet effective and have not been adopted by the Group for the annual reporting period ending 30 June 2015 are outlined in the table below:
• The core principle of NZ IFRS 15 is that an entity recognises revenue to depict the transfer of promised goods or services to customers in an amount that reflects the consideration to which the entity expects to be entitled in exchange for those goods and services. This change is effective from 1 July 2017 and is not expected to have a material impact on the Group.
• NZ IFRS 9 is the standard issued as part of IASB’s project to replace NZ IAS 39. Key changes applicable to the Group are: 1) simplify the approach for classification and measurement of financial assets; 2) the change attributable to changes in credit risk are accounted for in other comprehensive income where the fair value option is used for financial liabilities; 3) new hedge accounting requirements including changes to hedge effectiveness testing, treatment of hedging costs, risk components that can be hedged and disclosures. These changes are effective from 1 July 2018 and are not expected to have material impact on the Group.
(e) Comparatives
The presentation of some information has changed from the previous period with prior period balances re-classified to be comparable with current year figures.
(f) Significant accounting judgements, estimates and assumptions
The preparation of financial statements requires management to make judgements, estimates and assumptions that affect the application of policies and reported amounts of assets, liabilities, revenues and expenses. These estimates and associated assumptions are based on historical experience and various other factors that are believed to be reasonable under the circumstances, the results of which form the basis of making the judgments about carrying values of assets and liabilities that are not readily apparent from other sources. Actual results may differ from those estimates.
Management’s significant judgements, estimates and assumptions are outlined in the relevant notes to the financial statements.
(g) Going concern
KiwiRail continues to operate on a commercial basis. Shareholder support to date has been provided in line with KiwiRail’s business plans, with $210m of equity funding confirmed for proposed investments in the 2015/16 financial year and a further $190m pre-commitment against Budget 2016. The latest business plan assumes additional equity funding for a number of years and future equity funding will be confirmed on a year by year basis. We have completed these financial statements on a going concern basis on the assumption that shareholder support will continue, largely in line with business plans.
KiwiRail Holdings Ltd
For the financial year ended 30 June 2015
The numbers in the notes to the financial statements are expressed in millions unless otherwise stated.
39KIWIRAIL ANNUAL REPORT | 2015
Notes to the Financial Statements
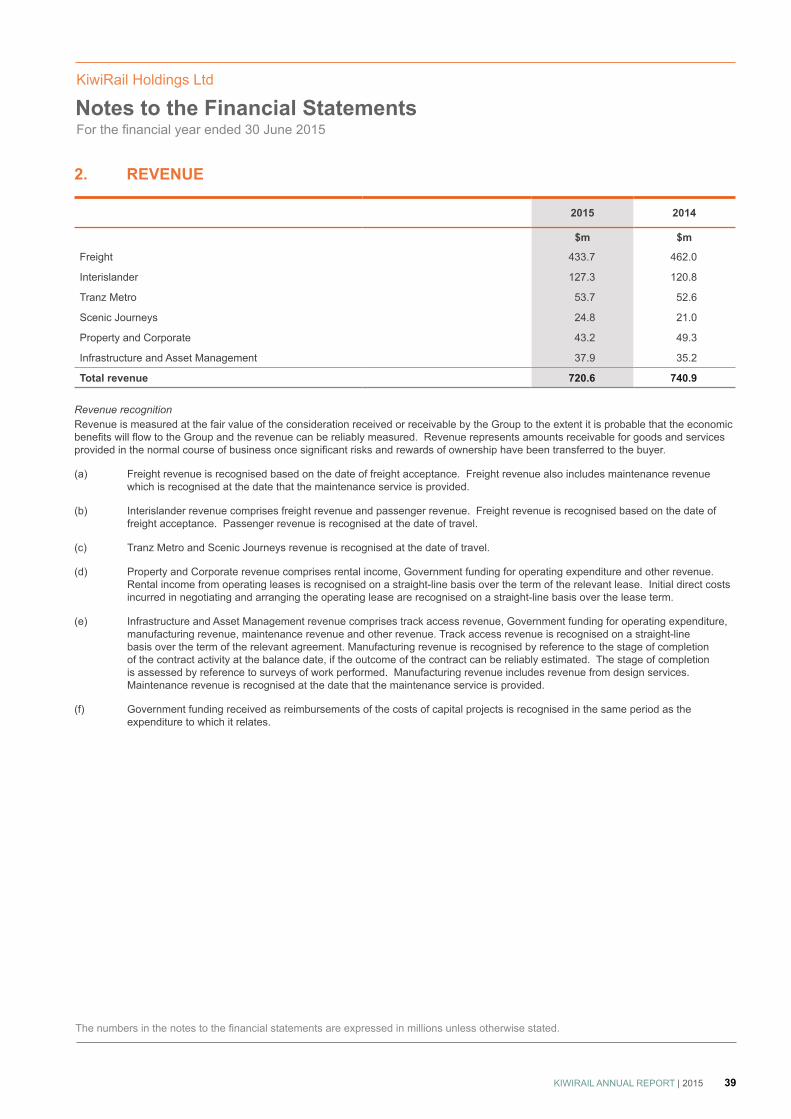
2. REVENUE
2015 2014
$m $m
Freight 433.7 462.0
Interislander 127.3 120.8
Tranz Metro 53.7 52.6
Scenic Journeys 24.8 21.0
Property and Corporate 43.2 49.3
Infrastructure and Asset Management 37.9 35.2
Total revenue 720.6 740.9
Revenue recognitionRevenue is measured at the fair value of the consideration received or receivable by the Group to the extent it is probable that the economic benefits will flow to the Group and the revenue can be reliably measured. Revenue represents amounts receivable for goods and services provided in the normal course of business once significant risks and rewards of ownership have been transferred to the buyer.
(a) Freight revenue is recognised based on the date of freight acceptance. Freight revenue also includes maintenance revenue which is recognised at the date that the maintenance service is provided.
(b) Interislander revenue comprises freight revenue and passenger revenue. Freight revenue is recognised based on the date of freight acceptance. Passenger revenue is recognised at the date of travel.
(c) Tranz Metro and Scenic Journeys revenue is recognised at the date of travel.
(d) Property and Corporate revenue comprises rental income, Government funding for operating expenditure and other revenue. Rental income from operating leases is recognised on a straight-line basis over the term of the relevant lease. Initial direct costs incurred in negotiating and arranging the operating lease are recognised on a straight-line basis over the lease term.
(e) Infrastructure and Asset Management revenue comprises track access revenue, Government funding for operating expenditure, manufacturing revenue, maintenance revenue and other revenue. Track access revenue is recognised on a straight-line basis over the term of the relevant agreement. Manufacturing revenue is recognised by reference to the stage of completion of the contract activity at the balance date, if the outcome of the contract can be reliably estimated. The stage of completion is assessed by reference to surveys of work performed. Manufacturing revenue includes revenue from design services. Maintenance revenue is recognised at the date that the maintenance service is provided.
(f) Government funding received as reimbursements of the costs of capital projects is recognised in the same period as the expenditure to which it relates.

KiwiRail Holdings Ltd
For the financial year ended 30 June 2015
The numbers in the notes to the financial statements are expressed in millions unless otherwise stated.
40 TRUSTED KIWI-OWNED LOGISTICS PARTNER GROWING NEW ZEALAND
Notes to the Financial Statements
3. OPERATING EXPENSES
2015 2014
$m $mSalaries and wages 342.8 333.5
Defined contribution plan employer contributions 11.7 11.4
Other employee expenses 3.6 3.3
Total staff costs 358.1 348.2
Amounts capitalised (51.3) (52.6)
Net staff costs 306.8 295.6
Materials and supplies 112.2 118.3
Fuel and traction electricity 92.9 114.9
Lease and rental costs 42.8 50.9
Incidents, casualties and insurance 13.1 19.6
Contractors expenses 12.7 16.3
Fees paid to auditors:
Audit fees 0.4 0.5
Recovery from impairment of receivables (2.2) (0.1)
Directors’ fees 0.3 0.3
Gain on disposal of property, plant and equipment (1.7) (0.5)
Other expenses 52.8 47.6
Total operating expenses 630.1 663.4
4. GRANT INCOME
2015 2014
$m $mCapital grants (Ministry of Transport funded) 31.2 82.0
Other capital grants 13.4 11.4
Total grant income 44.6 93.4
Where the asset being funded is depreciated over its useful life, the funding is recognised as income on a straight line basis over the same life. Where the asset funded is impaired to residual value the funding is recognised as income in the same period as the impairment expense.
Grants received in respect of services provided are recognised when the requirements of the relevant grant agreement are met. The Group receives grants from the Crown for the purpose of maintaining the railway networks and infrastructure. There are no unfulfilled conditions or other contingencies attached.
5. DEPRECIATION AND AMORTISATION EXPENSES
Note 2015 2014
$m $m
Depreciation expense 9(a) 68.4 67.9
Amortisation expense 9(c) 0.4 1.8
Total depreciation and amortisation expenses 68.8 69.7
KiwiRail Holdings Ltd
For the financial year ended 30 June 2015
The numbers in the notes to the financial statements are expressed in millions unless otherwise stated.
41KIWIRAIL ANNUAL REPORT | 2015
Notes to the Financial Statements
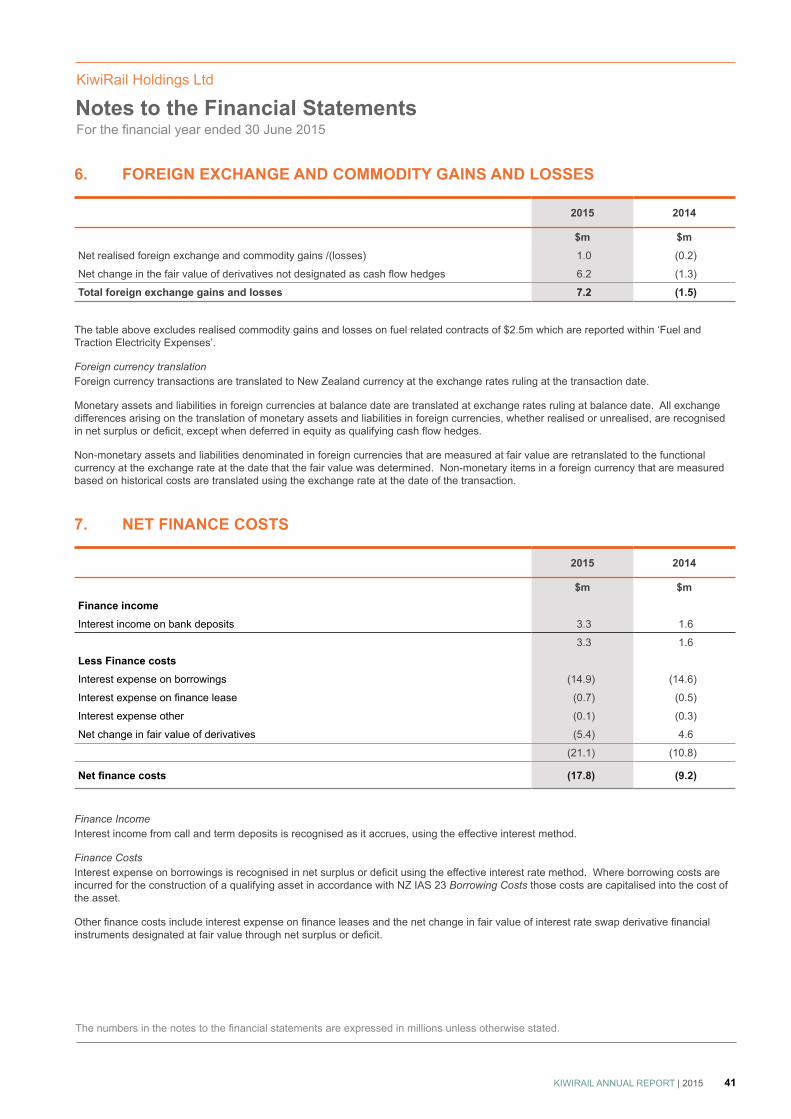
6. FOREIGN EXCHANGE AND COMMODITY GAINS AND LOSSES
2015 2014
$m $mNet realised foreign exchange and commodity gains /(losses) 1.0 (0.2)
Net change in the fair value of derivatives not designated as cash flow hedges 6.2 (1.3)
Total foreign exchange gains and losses 7.2 (1.5)
The table above excludes realised commodity gains and losses on fuel related contracts of $2.5m which are reported within ‘Fuel and Traction Electricity Expenses’.
Foreign currency translationForeign currency transactions are translated to New Zealand currency at the exchange rates ruling at the transaction date.
Monetary assets and liabilities in foreign currencies at balance date are translated at exchange rates ruling at balance date. All exchange differences arising on the translation of monetary assets and liabilities in foreign currencies, whether realised or unrealised, are recognised in net surplus or deficit, except when deferred in equity as qualifying cash flow hedges.
Non-monetary assets and liabilities denominated in foreign currencies that are measured at fair value are retranslated to the functional currency at the exchange rate at the date that the fair value was determined. Non-monetary items in a foreign currency that are measured based on historical costs are translated using the exchange rate at the date of the transaction.
7. NET FINANCE COSTS
2015 2014
$m $mFinance incomeInterest income on bank deposits 3.3 1.6
3.3 1.6
Less Finance costsInterest expense on borrowings (14.9) (14.6)
Interest expense on finance lease (0.7) (0.5)
Interest expense other (0.1) (0.3)
Net change in fair value of derivatives (5.4) 4.6
(21.1) (10.8)
Net finance costs (17.8) (9.2)
Finance IncomeInterest income from call and term deposits is recognised as it accrues, using the effective interest method.
Finance CostsInterest expense on borrowings is recognised in net surplus or deficit using the effective interest rate method. Where borrowing costs are incurred for the construction of a qualifying asset in accordance with NZ IAS 23 Borrowing Costs those costs are capitalised into the cost of the asset.
Other finance costs include interest expense on finance leases and the net change in fair value of interest rate swap derivative financial instruments designated at fair value through net surplus or deficit.
KiwiRail Holdings Ltd
For the financial year ended 30 June 2015
The numbers in the notes to the financial statements are expressed in millions unless otherwise stated.
42 TRUSTED KIWI-OWNED LOGISTICS PARTNER GROWING NEW ZEALAND
Notes to the Financial Statements
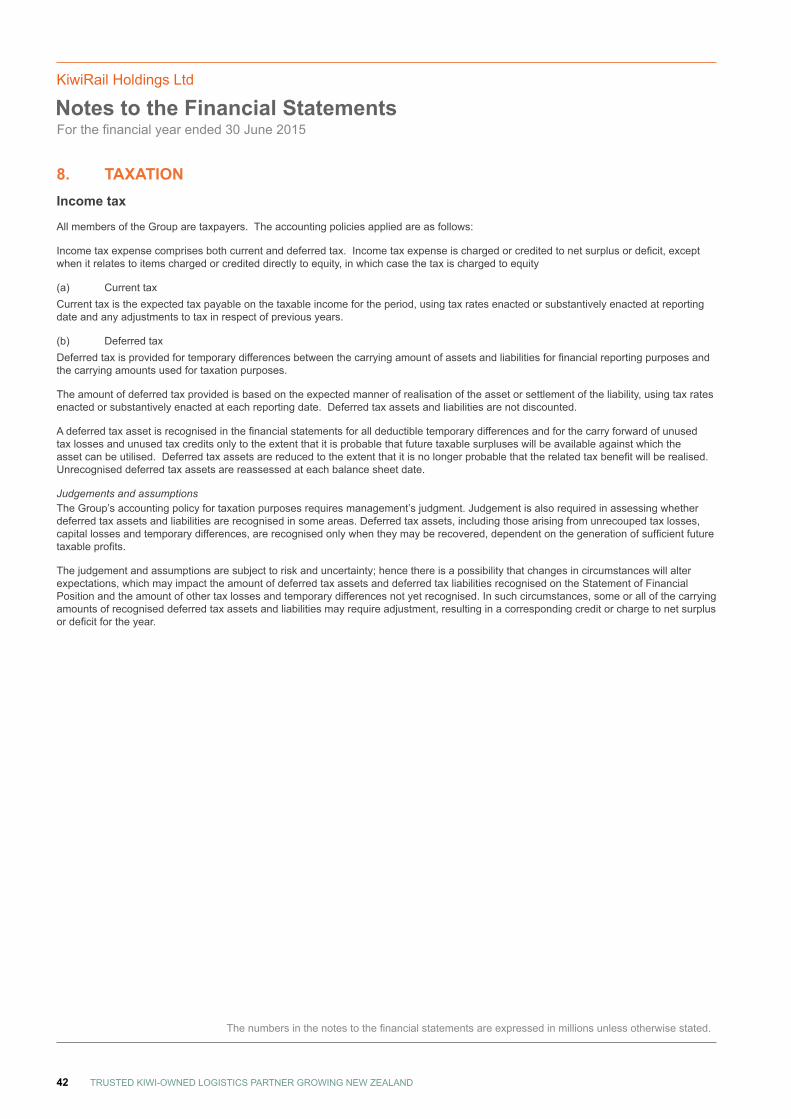
8. TAXATIONIncome tax
All members of the Group are taxpayers. The accounting policies applied are as follows:
Income tax expense comprises both current and deferred tax. Income tax expense is charged or credited to net surplus or deficit, except when it relates to items charged or credited directly to equity, in which case the tax is charged to equity
(a) Current taxCurrent tax is the expected tax payable on the taxable income for the period, using tax rates enacted or substantively enacted at reporting date and any adjustments to tax in respect of previous years.
(b) Deferred tax Deferred tax is provided for temporary differences between the carrying amount of assets and liabilities for financial reporting purposes and the carrying amounts used for taxation purposes.
The amount of deferred tax provided is based on the expected manner of realisation of the asset or settlement of the liability, using tax rates enacted or substantively enacted at each reporting date. Deferred tax assets and liabilities are not discounted.
A deferred tax asset is recognised in the financial statements for all deductible temporary differences and for the carry forward of unused tax losses and unused tax credits only to the extent that it is probable that future taxable surpluses will be available against which the asset can be utilised. Deferred tax assets are reduced to the extent that it is no longer probable that the related tax benefit will be realised. Unrecognised deferred tax assets are reassessed at each balance sheet date.
Judgements and assumptionsThe Group’s accounting policy for taxation purposes requires management’s judgment. Judgement is also required in assessing whether deferred tax assets and liabilities are recognised in some areas. Deferred tax assets, including those arising from unrecouped tax losses, capital losses and temporary differences, are recognised only when they may be recovered, dependent on the generation of sufficient future taxable profits.
The judgement and assumptions are subject to risk and uncertainty; hence there is a possibility that changes in circumstances will alter expectations, which may impact the amount of deferred tax assets and deferred tax liabilities recognised on the Statement of Financial Position and the amount of other tax losses and temporary differences not yet recognised. In such circumstances, some or all of the carrying amounts of recognised deferred tax assets and liabilities may require adjustment, resulting in a corresponding credit or charge to net surplus or deficit for the year.

KiwiRail Holdings Ltd
For the financial year ended 30 June 2015
The numbers in the notes to the financial statements are expressed in millions unless otherwise stated.
43KIWIRAIL ANNUAL REPORT | 2015
Notes to the Financial Statements
8. TAXATION (CONTINUED)(c) Tax benefit/ (expense)
2015 2014
$m $mComponents of tax expenseCurrent tax expense - -
Deferred tax expense - -
Tax benefit/(expense) - -
Reconciliation between tax expense and accounting surplusLoss before tax (166.5) (248.0)
Tax at 28% (46.6) (69.4)
Tax effect of:
Non-deductible expenditure 0.2 0.3
Other temporary differences 46.4 69.1
Tax benefit/(expense) - -
The Group has an unrecognised deferred tax asset of $787.4m (2014: $726.9m) arising from deductible temporary differences of $2,304.7m (2014: $2,308.0m) and unused tax losses of $507.4m (2014: $288.1m).
Imputation credits
The Group has formed an imputation Group. The Group has access to $1,192,277 imputation credits (2014: $1,183,851 imputation credits). These imputation credit figures are in NZ dollars and not expressed in millions.

The
num
bers
in th
e no
tes
to th
e fin
anci
al s
tate
men
ts a
re e
xpre
ssed
in m
illio
ns u
nles
s ot
herw
ise
stat
ed.
44 TRUSTED KIWI-OWNED LOGISTICS PARTNER GROWING NEW ZEALAND
Kiw
iRai
l Hol
ding
s Lt
d
For t
he fi
nanc
ial y
ear e
nded
30
June
201
5N
otes
to th
e Fi
nanc
ial S
tate
men
ts
9.
NO
N-F
INA
NC
IAL
ASS
ETS
(a)
Prop
erty
, pla
nt a
nd e
quip
men
t
2015
Not
eLa
nd (J
oint
op
erat
ion)
Bui
ldin
gsR
ailw
ay
Infr
astr
uctu
reR
ollin
g St
ock
Ship
sPl
ant a
nd
Equi
pmen
tA
sset
s U
nder
C
onst
ruct
ion
Tota
l
$m$m
$m$m
$m$m
$m$m
Cos
t
Bal
ance
at 1
Jul
y 20
14-
78.9
117.
729
4.1
126.
418
9.3
34.6
841.
0
Add
ition
s0.
12.
811
6.7
41.8
1.7
10.3
98.7
272.
1
Dis
posa
ls-
(0.2
)-
(1.8
)-
(0.5
)-
(2.5
)
Cat
egor
y tra
nsfe
rs3.
0(2
6.9)
0.3
-(2
.0)
-2.
7(2
2.9)
Impa
irmen
t9(
d)-
(5.9
)(1
23.0
)(1
7.5)
(12.
0)*
-(8
4.0)
(242
.4)
Bal
ance
at 3
0 Ju
ne 2
015
3.1
48.7
111.
731
6.6
114.
119
9.1
52.0
845.
3
Acc
umul
ated
dep
reci
atio
n
Bal
ance
at 1
Jul
y 20
14-
0.6
-29
.933
.566
.6-
130.
6
Dep
reci
atio
n ex
pens
e 5
-4.
69.
031
.09.
314
.5-
68.4
Dis
posa
ls-
--
(1.1
)-
(0.4
)-
(1.5
)
Cat
egor
y tra
nsfe
rs-
(1.6
)-
--
--
(1.6
)
Impa
irmen
t9(
d)-
(0.5
)(9
.0)
(7.0
)(1
0.0)
*-
-(2
6.5)
Bal
ance
at 3
0 Ju
ne 2
015
-3.
1-
52.8
32.8
80.7
-16
9.4
Net
boo
k va
lue
At 1
Jul
y 20
14-
78.3
117.
726
4.2
92.9
122.
734
.671
0.4
At 3
0 Ju
ne 2
015
3.1
45.6
111.
726
3.8
81.3
118.
452
.067
5.9
*The
ass
et im
paire
d at
$2.
0m w
as re
clas
sifie
d to
ass
et h
eld
for s
ale
as a
t 30
June
201
5.

The
num
bers
in th
e no
tes
to th
e fin
anci
al s
tate
men
ts a
re e
xpre
ssed
in m
illio
ns u
nles
s ot
herw
ise
stat
ed.
45KIWIRAIL ANNUAL REPORT | 2015
Kiw
iRai
l Hol
ding
s Lt
d
For t
he fi
nanc
ial y
ear e
nded
30
June
201
5N
otes
to th
e Fi
nanc
ial S
tate
men
ts
9.
NO
N-F
INA
NC
IAL
ASS
ETS
(CO
NTI
NU
ED)
(a)
Prop
erty
, pla
nt a
nd e
quip
men
t (co
ntin
ued)
2014
Not
eLa
ndB
uild
ings
Rai
lway
Infr
astr
uctu
reR
ollin
g St
ock
Ship
sPl
ant a
nd
Equi
pmen
tA
sset
s U
nder
C
onst
ruct
ion
Tota
l
$m$m
$m$m
$m$m
$m$m
Cos
tB
alan
ce a
t 1 J
uly
2013
1.6
127.
812
9.0
238.
211
4.0
147.
015
1.3
908.
9A
dditi
ons
-3.
689
.914
1.7
12.4
40.9
42.7
331.
2
Dis
posa
ls-
--
(2.3
)-
(0.4
)-
(2.7
)
Cat
egor
y tra
nsfe
rs(1
.6)
(48.
8)15
.30.
4-
1.8
(10.
4)(4
3.3)
Rev
alua
tion
9(d)
-(4
.8)
--
--
-(4
.8)
Impa
irmen
t9(
d)-
(7.9
)(1
16.5
)(8
3.9)
--
(149
.0)
(357
.3)
Vest
ed a
sset
s-
9.0
--
--
-9.
0
Bal
ance
at 3
0 Ju
ne 2
014
-78
.911
7.7
294.
112
6.4
189.
334
.684
1.0
Acc
umul
ated
dep
reci
atio
nB
alan
ce a
t 1 J
uly
2013
-12
.3-
25.5
24.9
53.6
-11
6.3
Dep
reci
atio
n ex
pens
e5
-7.
83.
834
.18.
613
.6-
67.9
Dis
posa
ls-
--
(0.5
)-
(0.4
)-
(0.9
)
Cat
egor
y tra
nsfe
rs-
(1.2
)1.
4-
-(0
.2)
--
Rev
alua
tion
9(d)
-(1
8.3)
--
--
-(1
8.3)
Impa
irmen
t9(
d)-
-(5
.2)
(29.
2)-
--
(34.
4)
Bal
ance
at 3
0 Ju
ne 2
014
-0.
6-
29.9
33.5
66.6
-13
0.6
Net
boo
k va
lue
At 1
Jul
y 20
131.
611
5.5
129.
021
2.7
89.1
93.4
151.
379
2.6
At 3
0 Ju
ne 2
014
-78
.311
7.7
264.
292
.912
2.7
34.6
710.
4

KiwiRail Holdings Ltd
For the financial year ended 30 June 2015
The numbers in the notes to the financial statements are expressed in millions unless otherwise stated.
46 TRUSTED KIWI-OWNED LOGISTICS PARTNER GROWING NEW ZEALAND
Notes to the Financial Statements
9. NON-FINANCIAL ASSETS (continued)(a) Property, plant and equipment (continued)
(i) Recognition and MeasurementProperty, plant and equipment are shown at cost or valuation, less any accumulated depreciation and accumulated impairment losses. Items of property, plant and equipment in the course of construction are classified as capital work in progress. Cost includes expenditure that is directly attributable to the acquisition of the asset.
Where an asset is acquired for nil or nominal consideration the asset is recognised initially at fair value, where fair value can be reliably determined; and the fair value of the asset received less costs incurred to acquire the asset is also recognised as income in net surplus or deficit.
(ii) RevaluationBuildings are revalued every three years which is considered sufficient regularity to ensure that the carrying amount does not differ materially from fair value. Fair value is determined from market-based evidence by an external, independent valuer taking into account a market participant’s ability to generate economic benefits by using the asset in its highest and best use or by selling to another market participant that would use the asset in its highest and best use. Valuations are undertaken in accordance with the standards issued by the New Zealand Property Institute, NZ IAS 16 Property, Plant and Equipment and NZ IFRS 13 Fair Value Measurement with the following bases of valuation adopted:
• Specialised buildings which are those assets identified as having no readily available market and exist strictly to carry out KiwiRail’s unique operations are valued using optimised depreciated replacement cost.
• Non-specialised buildings which could be sold with relative ease are valued at market value.Any revaluation increase arising on the revaluation of buildings is credited to the asset revaluation reserve, except to the extent that it reverses a revaluation decrease for the same asset previously recognised as an expense in net surplus or deficit, in which case the increase is credited to net surplus or deficit to the extent of the decrease previously charged. A decrease in carrying amount arising on the revaluation of land or buildings is charged as an expense to net surplus or deficit to the extent that it exceeds the balance, if any, held in the asset revaluation reserve relating to a previous revaluation of that asset.
Other additions between revaluations are recorded at cost.
In June 2014, the buildings were revalued by independent valuers who hold a recognised relevant qualification.
(iii) DerecognitionRealised gains and losses arising from the derecognition of property, plant and equipment are recognised in net surplus or deficit in the period in which the transaction occurs. The gain or loss is calculated as the difference between the carrying amount of the asset and the net disposal proceeds received (if any). Any credit balance attributable to the disposed asset in the asset revaluation reserve is transferred to retained earnings.
(iv) RenewalsExpenditure that is eligible for capitalisation as property, plant and equipment relating to track renewals, ballast formation upgrading, and major overhauls of rolling stock is capitalised at cost as property, plant and equipment. Repairs and maintenance costs are expensed through net surplus or deficit as incurred.

KiwiRail Holdings Ltd
For the financial year ended 30 June 2015
The numbers in the notes to the financial statements are expressed in millions unless otherwise stated.
47KIWIRAIL ANNUAL REPORT | 2015
Notes to the Financial Statements
9. NON-FINANCIAL ASSETS (CONTINUED)(a) Property, plant and equipment (continued)
(v) DepreciationDepreciation is charged on a straight line basis at rates that will allocate the cost or valuation of the asset over its expected useful life to its estimated residual value. Leasehold improvements are depreciated over the period of the lease or estimated useful life, whichever is the shorter. In determining an asset’s useful life, consideration is given to its expected usage, its expected wear and tear, technical or commercial obsolescence, and legal or similar limits on its use.
The average depreciable lives for major categories of property, plant and equipment are as follows:
Category Useful life
Railway InfrastructureTunnels and bridges 75 - 200 yearsTrack and ballast 40 – 50 yearsOverhead traction 20 – 80 yearsSignals and communications 15 – 50 yearsBuildings 35 – 80 years
Rolling Stock and ShipsWagons and carriages 5 - 30 yearsLocomotives 5 - 25 yearsShips 20 yearsContainers 10 years
Plant and EquipmentPlant and equipment 5 – 35 yearsMotor vehicles 5 – 12 yearsFurniture and fittings 5 – 12 yearsOffice equipment 3 – 5 years
Land is not depreciated.
Estimation of useful lives of assetsThe remaining useful lives of property, plant and equipment represents management’s best estimates of the useful lives of individual asset classes. When assets are revalued the valuers provide updated expected remaining useful lives for the assets that have been revalued. The remaining useful lives adopted in the valuation are a reflection of indicative useful lives adjusted for factors such as upgrading, level of maintenance, standard of construction and use.
The Group reviews the useful lives and residual values of its property, plant and equipment annually. Assessing the appropriateness of useful life and residual value estimates of property, plant and equipment requires the Group to consider a number of factors such as the physical condition of the asset, expected period of use and expected disposal proceeds from the future sale of the asset.
If buildings were stated on the historical cost basis, the amounts would be as follows:
2015 2014
$m $mCost 123.2 188.4
Accumulated depreciation (32.4) (47.2)
Net carrying value 90.8 141.2

KiwiRail Holdings Ltd
For the financial year ended 30 June 2015
The numbers in the notes to the financial statements are expressed in millions unless otherwise stated.
48 TRUSTED KIWI-OWNED LOGISTICS PARTNER GROWING NEW ZEALAND
Notes to the Financial Statements
9. NON-FINANCIAL ASSETS (CONTINUED)(a) Property, plant and equipment (continued)
(vi) Property, plant and equipment pledged to secure borrowingThe MV Aratere is pledged as security for a loan from Commonwealth Bank of Australia. There are no restrictions on title and the balance of the loan at 30 June 2015 is $26.5m (2014: $28.7m).
(vii) Finance leasesLeases in which the Group assumes substantially all the risks and rewards of ownership are classified as finance leases. Assets acquired by way of a finance lease are included in property, plant and equipment. Finance charges are recognised as finance costs in net surplus or deficit.
Assets held under finance leases are stated at cost less accumulated depreciation and impairment.
Included within the plant and equipment asset class are Hi-Rail vehicles and Tampers with a net book value of $16.0m (2014: $18.1m) which are held under finance lease and loan arrangements with Westpac Banking Corporation. Further details of the lease term are provided in note 20(a).
(viii) Borrowing costsDuring the period the Group has not capitalised any direct borrowing costs on qualifying assets.
(b) Assets held for sale
2015 2014
$m $mAssets held for sale 2.1 1.6
The Group classifies a non-current asset as held for sale in accordance with NZ IFRS 5 Assets Held for Sale and Discontinued Operations if its carrying amount will be recovered principally through a sale transaction rather than through continuing use. For an asset to be classified as held for sale it must be available for immediate sale in its present condition subject only to terms that are usual and customary for sales of such assets and its sale must be highly probable.
An asset held for sale is measured at the lower of its carrying amount and its fair value less cost to sell.
(c) Intangible assets
Note 2015 2014
$m $mOpening balance 0.3 0.4Additions 13.2 10.1
Amortisation 5 (0.4) (1.8)
Impairment 9(d) (12.5) (8.4)
Balance at 30 June 0.6 0.3
Intangible assets comprise software applications which have a finite useful life and are recorded at cost less accumulated amortisation and impairment losses. Intangible assets with a finite useful life are amortised on a straight-line basis over their estimated useful lives of 3 to 5 years.

KiwiRail Holdings Ltd
For the financial year ended 30 June 2015
The numbers in the notes to the financial statements are expressed in millions unless otherwise stated.
49KIWIRAIL ANNUAL REPORT | 2015
Notes to the Financial Statements
9. NON-FINANCIAL ASSETS (CONTINUED)(d) Impairment of non-financial assets
Reconciliation of Impairment Movements to Net Surplus or Deficit
2015 2014
$m $mImpairment of Cash Generating Units (below) 223.2 331.3
Impairment of assets transferred to asset held for sale 2.0 -
Recovery of impairment from investment in joint venture (0.5) -
Impairment in net surplus or deficit 224.7 331.3
(i) Impairment of Cash Generating Units
The carrying amounts of the Group’s non-financial assets are reviewed at each reporting date to determine if there is any indication of impairment. External factors such as changes in expected future processes, technology and economic conditions are also monitored to assess for indicators of impairment. If any such indication exists, the asset or its related cash-generating unit (“CGU”) will be tested for impairment by comparing its recoverable amount to its carrying amount. The recoverable amount of an asset or CGU is the higher of its value in use and its fair value less costs to sell. If no impairment is stated then management does not consider that the triggers for impairment testing have been significant.
The value in use for cash-generating assets and CGUs is the present value of expected future cash flows.
If an asset’s carrying amount exceeds its recoverable amount the asset is impaired and the carrying amount is written down to the recoverable amount. For revalued assets the impairment is treated as a revaluation decrease (see note 9(a)(ii) above).
For assets not carried at a revalued amount, the total impairment is recognised in net surplus or deficit.
Rail CGUBuildings, railway infrastructure, rolling stock, plant and equipment and intangible assets are considered by management to form one CGU (“the Rail CGU”) and was tested for impairment. The recoverable amount of the CGU was determined as the higher of the value in use and the fair value less costs to sell. In determining value in use for the CGU management discounted estimated future cash flows expected to be derived from the assets. In determining the fair value less cost to sell of the railway infrastructure assets and rolling stock, the Group adopted a market approach assuming an orderly liquidation of the assets to arrive at a net realisable or scrap value. The higher of the scrap value or the net realisable value is adopted to determine the individual asset’s fair value less cost to sell. Market values such as steel prices and scrap metal rates are taken into account in determining the asset’s fair value. For assets in which scrap value is lower than the cost of removal such as culverts, bridges, tunnels, lighting towers, signals and telecommunications and level crossings, the assigned fair value less cost to sell was set to nil. The impairment for the Rail CGU is $226.3m (2014: $331.3m). The impairment is allocated across each asset class within the CGU, including intangible assets.
Where assets have a readily determinable market value they have been impaired to this value. Where a market value is not able to be determined the assets have been impaired to their share of the calculated value in use for the CGU. Market values have been provided by independent valuers for buildings as at 30 June 2014 and for all railway infrastructure and rolling stock as at 30 June 2015.

KiwiRail Holdings Ltd
For the financial year ended 30 June 2015
The numbers in the notes to the financial statements are expressed in millions unless otherwise stated.
50 TRUSTED KIWI-OWNED LOGISTICS PARTNER GROWING NEW ZEALAND
Notes to the Financial Statements
9. NON-FINANCIAL ASSETS (CONTINUED)(d) Impairment of non-financial assets (continued)
Interislander CGUThe ships and related plant and equipment and intangible assets that relate to the Interislander business unit are considered by management to form a separate cash generating unit (the Interislander CGU). The recoverable amount of these assets is the higher of the value in use and fair value less costs to sell. The value in use for the CGU is the discounted estimated future cash flows that will be derived from the assets.
Management performed an impairment test of the Interislander CGU and determined that its recoverable amount exceeded its carrying value.
The following impairments and revaluation movements have been recorded in relation to the Rail CGU:
2015Carrying amount
before revaluation and impairment
Impairment recognised in net surplus or deficit
Impairment recognised in Asset Revaluation Reserve
Carrying amount after impairment
$m $m $m $mRail CGUBuildings 50.9 (2.2) (3.1) 45.6
Railway infrastructure 225.7 (114.0) - 111.7
Rolling stock 274.3 (10.5) - 263.8
Plant and equipment 112.0 - - 112.0
Assets under construction 129.8 (84.0) - 45.8
Total property, plant and equipment 792.7 (210.7) (3.1) 578.9
Software 12.5 (12.5) - -
Total Rail CGU 805.2 (223.2) (3.1) 578.9Total Interislander CGU 94.5 - - 94.5Asset held for sale 4.1 (2.0) - 2.1Total 903.8 (225.2) (3.1) 675.5

KiwiRail Holdings Ltd
For the financial year ended 30 June 2015
The numbers in the notes to the financial statements are expressed in millions unless otherwise stated.
51KIWIRAIL ANNUAL REPORT | 2015
Notes to the Financial Statements
9. NON-FINANCIAL ASSETS (CONTINUED)(d) Impairment of non-financial assets
2014Carrying amount
before revaluation and impairment
Impairment recognised in net surplus or deficit
Movement recognised in Asset Revaluation
Reserve
Carrying amount after impairment
$m $m $m $mRail CGUBuildings 72.7 (7.9) 13.5 78.3
Railway infrastructure 229.0 (111.3) - 117.7
Rolling stock 318.9 (54.7) - 264.2
Plant and equipment 116.2 - - 116.2
Assets under construction 182.6 (149.0) - 33.6
Total property, plant and equipment 919.4 (322.9) 13.5 610.0
Software 8.4 (8.4) - -
Total Rail CGU 927.8 (331.3) 13.5 610.0Total Interislander CGU 100.7 - - 100.7Asset held for sale 1.6 - - 1.6Total 1,030.1 (331.3) 13.5 712.3
10. CASH AND CASH EQUIVALENTS
2015 2014
$m $mCash on hand 0.1 0.1
Current accounts 10.5 10.2
Call deposits 39.4 5.1
50.0 15.4
Cash and cash equivalents comprises cash on hand, call deposits and other investments with an initial term of three months or less that are readily convertible to known amounts of cash and which are subject to an insignificant risk of changes in value.
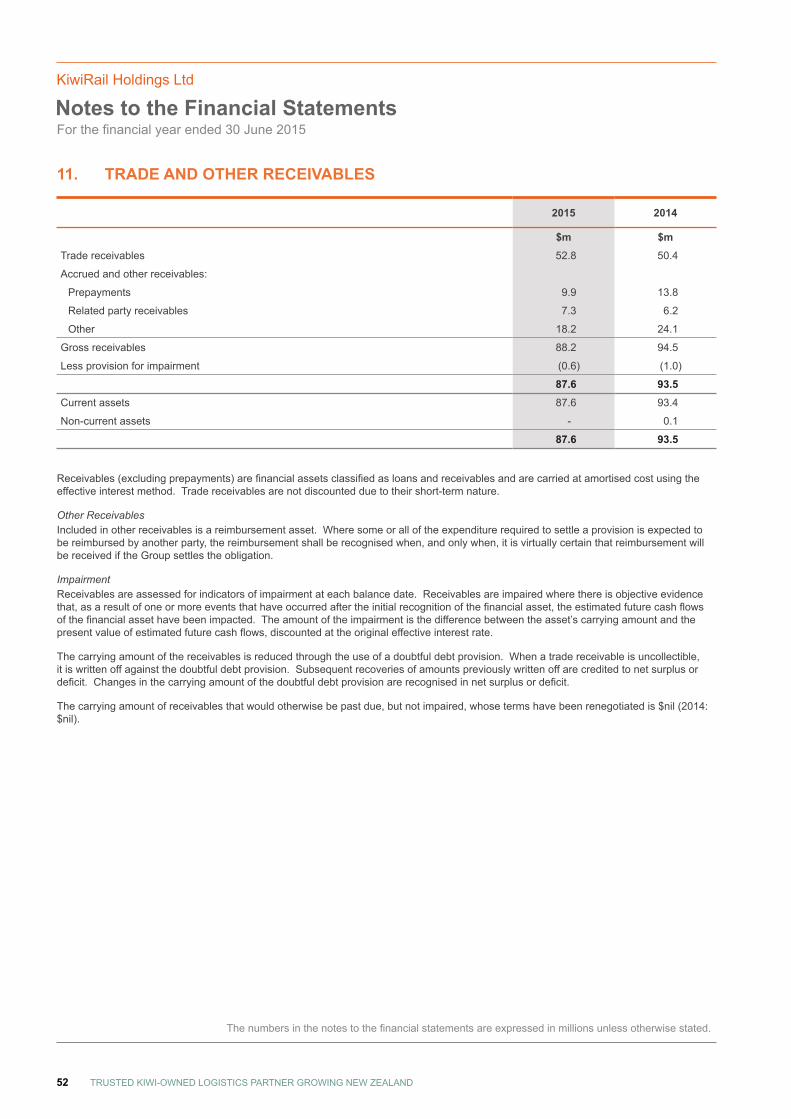
KiwiRail Holdings Ltd
For the financial year ended 30 June 2015
The numbers in the notes to the financial statements are expressed in millions unless otherwise stated.
52 TRUSTED KIWI-OWNED LOGISTICS PARTNER GROWING NEW ZEALAND
Notes to the Financial Statements
11. TRADE AND OTHER RECEIVABLES
2015 2014
$m $mTrade receivables 52.8 50.4
Accrued and other receivables:
Prepayments 9.9 13.8
Related party receivables 7.3 6.2
Other 18.2 24.1
Gross receivables 88.2 94.5
Less provision for impairment (0.6) (1.0)
87.6 93.5Current assets 87.6 93.4
Non-current assets - 0.1
87.6 93.5
Receivables (excluding prepayments) are financial assets classified as loans and receivables and are carried at amortised cost using the effective interest method. Trade receivables are not discounted due to their short-term nature.
Other ReceivablesIncluded in other receivables is a reimbursement asset. Where some or all of the expenditure required to settle a provision is expected to be reimbursed by another party, the reimbursement shall be recognised when, and only when, it is virtually certain that reimbursement will be received if the Group settles the obligation.
Impairment Receivables are assessed for indicators of impairment at each balance date. Receivables are impaired where there is objective evidence that, as a result of one or more events that have occurred after the initial recognition of the financial asset, the estimated future cash flows of the financial asset have been impacted. The amount of the impairment is the difference between the asset’s carrying amount and the present value of estimated future cash flows, discounted at the original effective interest rate.
The carrying amount of the receivables is reduced through the use of a doubtful debt provision. When a trade receivable is uncollectible, it is written off against the doubtful debt provision. Subsequent recoveries of amounts previously written off are credited to net surplus or deficit. Changes in the carrying amount of the doubtful debt provision are recognised in net surplus or deficit.
The carrying amount of receivables that would otherwise be past due, but not impaired, whose terms have been renegotiated is $nil (2014: $nil).

KiwiRail Holdings Ltd
For the financial year ended 30 June 2015
The numbers in the notes to the financial statements are expressed in millions unless otherwise stated.
53KIWIRAIL ANNUAL REPORT | 2015
Notes to the Financial Statements
11. TRADE AND OTHER RECEIVABLES (CONTINUED)All overdue receivables have been assessed for impairment at balance date and appropriate provisions applied, as detailed below:
2015 2014
Gross Impairment Net Gross Impairment Net
$m $m $m $m $m $mNot past due 45.0 - 45.0 43.9 (0.4) 43.5
Past due 1 – 30 days 2.2 - 2.2 5.0 (0.1) 4.9
Past due 31 – 60 days 1.4 (0.1) 1.3 0.4 - 0.4
Past due 61 - 90 days 0.8 (0.2) 0.6 0.5 (0.2) 0.3
Past due > 91 days 3.4 (0.3) 3.1 0.6 (0.3) 0.3
Total 52.8 (0.6) 52.2 50.4 (1.0) 49.4
The provision for impairment has been determined based on a review of specific debtors.
Movements in the provision for impairment of receivables are as follows:
2015 2014
$m $mOpening balance 1.0 1.1Amounts written off during the period (0.8) -
Additional provisions made/(reversed) during the period 0.4 (0.1)
Balance at 30 June 0.6 1.0
Changes in the provision for impairment of receivables are charged to operating expenses in net surplus or deficit (see note 3).
The Group holds no collateral as security or other credit enhancements over receivables that are either past due or impaired.
The average credit period on sales of goods and services is 25.0 days (2014: 22.1 days).
12. INVENTORIES
2015 2014
$m $mOperational Activities
- Fuel 1.5 1.7
- Inventory held to maintain railway 27.0 25.6
- Inventory held to maintain rolling stock and vessels 26.9 28.6
Inventory held for resale 0.7 0.7
Contracting Activities – work in progress 0.4 2.1
Net inventory 56.5 58.7
Inventories comprise items that are used in the maintenance and operation of the rail network, maintenance of rolling stock and ships, fuel, passenger consumable items, and items used in the manufacture of assets for sale to external parties. Inventories are not held for trading purposes with the exception of consumable cafeteria supplies held on the rail and ferry passenger services.

KiwiRail Holdings Ltd
For the financial year ended 30 June 2015
The numbers in the notes to the financial statements are expressed in millions unless otherwise stated.
54 TRUSTED KIWI-OWNED LOGISTICS PARTNER GROWING NEW ZEALAND
Notes to the Financial Statements
12. INVENTORIES (CONTINUED)Inventory is recorded at the lower of cost and net realisable value. Costs comprise direct materials and, where applicable, direct labour costs and those overheads that have been incurred in bringing the inventory to its present condition and location. Cost is calculated using the weighted average method.
Inventory obsolescenceManagement relies on its knowledge of the business to calculate inventory obsolescence provisions. The bulk of inventory held is spare parts for rolling stock and the network. Due to the age of these assets the parts held are many years old and management relies on its knowledge of the business to identify items of inventory that are truly obsolete.
The following inventories have either declined in value or provided for obsolescence. As at 30 June 2015, these inventories are reflected at net realisable value:
• Inventory held to maintain railway• Inventory held to maintain rolling stock and vessels
A provision for stock obsolescence of $12.3m (2014: $13.2m) is included within each inventory item’s carrying amount.
Write-downs or reversals of write-downs of inventories are recognised in operating expenses in net surplus or deficit, in the period the loss or reversal occurs. During the year, the Group has recognised net additional write-downs in inventory of $0.3m (2014: reversal of write-down of $0.9m).
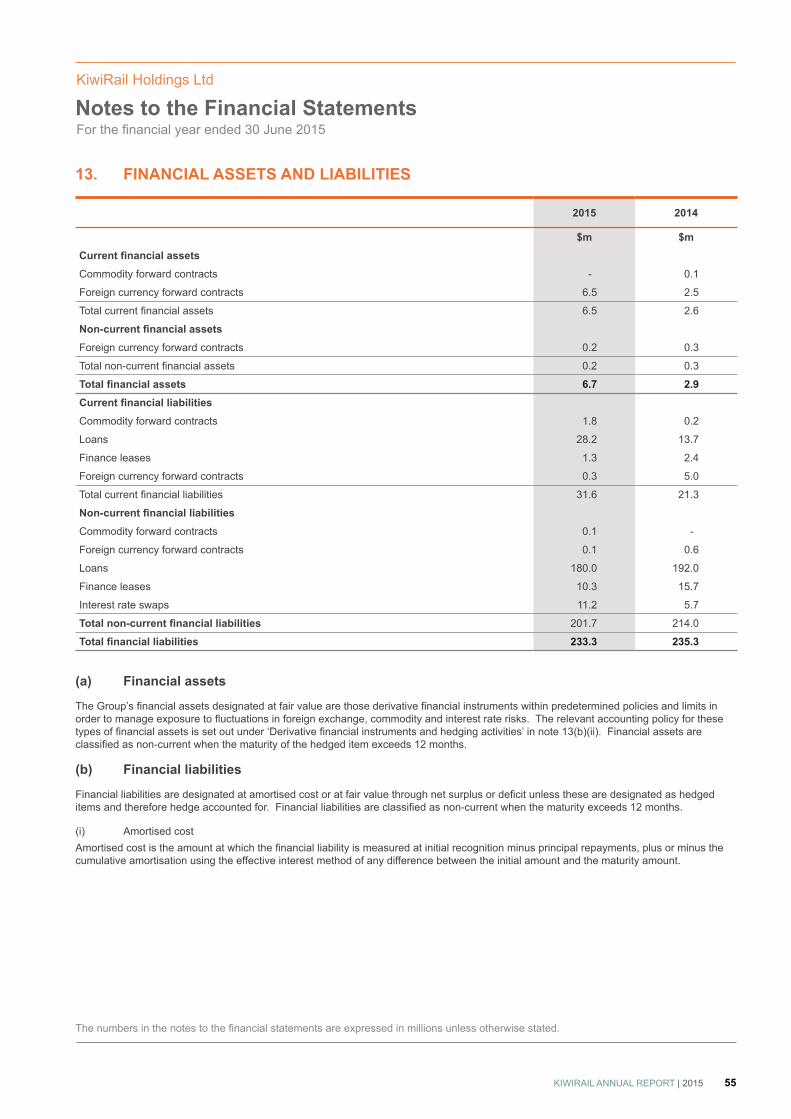
KiwiRail Holdings Ltd
For the financial year ended 30 June 2015
The numbers in the notes to the financial statements are expressed in millions unless otherwise stated.
55KIWIRAIL ANNUAL REPORT | 2015
Notes to the Financial Statements
13. FINANCIAL ASSETS AND LIABILITIES
2015 2014
$m $mCurrent financial assetsCommodity forward contracts - 0.1
Foreign currency forward contracts 6.5 2.5
Total current financial assets 6.5 2.6
Non-current financial assetsForeign currency forward contracts 0.2 0.3
Total non-current financial assets 0.2 0.3
Total financial assets 6.7 2.9Current financial liabilitiesCommodity forward contracts 1.8 0.2
Loans 28.2 13.7
Finance leases 1.3 2.4
Foreign currency forward contracts 0.3 5.0
Total current financial liabilities 31.6 21.3
Non-current financial liabilitiesCommodity forward contracts 0.1 -
Foreign currency forward contracts 0.1 0.6
Loans 180.0 192.0
Finance leases 10.3 15.7
Interest rate swaps 11.2 5.7
Total non-current financial liabilities 201.7 214.0
Total financial liabilities 233.3 235.3
(a) Financial assets
The Group’s financial assets designated at fair value are those derivative financial instruments within predetermined policies and limits in order to manage exposure to fluctuations in foreign exchange, commodity and interest rate risks. The relevant accounting policy for these types of financial assets is set out under ‘Derivative financial instruments and hedging activities’ in note 13(b)(ii). Financial assets are classified as non-current when the maturity of the hedged item exceeds 12 months.
(b) Financial liabilities
Financial liabilities are designated at amortised cost or at fair value through net surplus or deficit unless these are designated as hedged items and therefore hedge accounted for. Financial liabilities are classified as non-current when the maturity exceeds 12 months.
(i) Amortised costAmortised cost is the amount at which the financial liability is measured at initial recognition minus principal repayments, plus or minus the cumulative amortisation using the effective interest method of any difference between the initial amount and the maturity amount.

KiwiRail Holdings Ltd
For the financial year ended 30 June 2015
The numbers in the notes to the financial statements are expressed in millions unless otherwise stated.
56 TRUSTED KIWI-OWNED LOGISTICS PARTNER GROWING NEW ZEALAND
Notes to the Financial Statements
13. FINANCIAL ASSETS AND LIABILITIES (CONTINUED)Interest-bearing liabilitiesInterest-bearing liabilities comprise of loans and finance leases. They are initially measured at fair value, plus directly attributable transaction costs. Interest-bearing liabilities are subsequently measured at amortised cost using the effective interest method.
Liabilities with settlement greater than 12 months are classified as non-current.
Unsecured loansThe notional principal amounts of the outstanding loans for the Group were $181.8m (2014: $177.1m).
Secured loansA loan from Commonwealth Bank of Australia is secured against MV Aratere. The amount outstanding as at the reporting date is $26.5m (2014: $28.7m).
The average term to maturity and weighted average interest rates for external unsecured and secured loans and finance leases are shown in the table below:
Unit 2015 2014
Notional principal $ m 219.9 223.9
Average interest rate % 5.82 6.06
Average term to maturity years 2.67 3.4
Committed standby facility The Group has a committed standby facility with Bank of New Zealand for $15.0m as at 30 June 2015 (2014: nil) with an expiry date of 1 July 2016. As at 30 June 2015, the facility is undrawn.
Letter of credit facilitiesThe Group had one outstanding Import Letter of Credit at 30 June 2015 relating to a rail purchase. The outstanding balance was USD4.5m (2014: nil).
Standby letter of creditThe Group had one outstanding standby letter of credit at 30 June 2015 issued as credit support for fuel hedges. The outstanding balance was USD1.3m (2014: nil).
(ii) Fair value Derivative financial instruments and hedging activitiesDerivative financial instruments are initially recognised at fair value on the date a derivative contract is entered into (the trade date). Any transaction costs are expensed immediately. The derivative financial instruments are subsequently re-measured to fair value. The method of recognising the resulting gain or loss depends on whether the derivative financial instrument is designated as a hedging instrument, and, the nature of the item being hedged.
The Group uses derivative financial instruments within predetermined policies and limits in order to manage its exposure to fluctuations in foreign exchange, commodity and interest rate risks. The Group does not engage in speculative transactions or hold derivative financial instruments for trading purposes.
To manage this exposure the Group uses the following derivative financial instruments:• Foreign exchange forward contracts and options• Interest rate swaps• Fuel commodity hedges

KiwiRail Holdings Ltd
For the financial year ended 30 June 2015
The numbers in the notes to the financial statements are expressed in millions unless otherwise stated.
57KIWIRAIL ANNUAL REPORT | 2015
Notes to the Financial Statements
13. FINANCIAL ASSETS AND LIABILITIES (CONTINUED)Gains and losses, and movements in fair values of derivative financial instruments not in hedging relationships are recognised in net surplus or deficit as follows:
• Foreign exchange forward contracts and options excluding contracts relating to fuel purchases– as part of ‘Foreign exchange and commodity net gains and losses’
• Interest rate swaps – as part of ‘Net finance costs’• Realised gains/(losses) from fuel commodity hedges – as part of ‘Operating expenses’
The risk management objectives and strategy for undertaking various hedge transactions is covered by the Group Treasury Policy. The Group documents, at the inception of the transaction, the hedging relationship between hedging financial instruments and the hedged items. The Group also documents its assessment, both at hedge inception and on an on-going basis, of whether the derivatives used in the hedging transaction are highly effective in offsetting changes in fair values or cash flows of hedged items.
Cash flow hedgesChanges in the fair value of derivative financial instruments designated as cash flow hedges are recognised in other comprehensive income and the cash flow hedge reserve within other comprehensive income to the extent that the hedges are deemed effective. To the extent that the hedges are ineffective for accounting, changes in fair value are recognised in net surplus or deficit in Foreign exchange and commodity net gains and losses.
In any of the following circumstances, the Group shall discontinue hedge accounting:• If a derivative financial instrument expires or is sold, terminated or exercised• It no longer meets the criteria for hedge accounting• The forecast transaction is no longer expected to occur• The designation of the hedge relationship is revoked or changed
In cases where hedge accounting is discontinued as per the circumstance outlined above, the cumulative, unrealised gain or loss recognised in the cash flow hedge reserve in other comprehensive income with respect to the derivative instrument is recognised immediately in net surplus or deficit.
Where the hedge relationship continues throughout its designated term, the amount in the cash flow hedge reserve is transferred to the carrying value of the asset when it is recognised.
14. INVESTMENT PROPERTY
2015 2014
$m $mOpening balance 39.9 5.0
Additions 3.9 -
Disposals (0.1) -
Transfers and reclassifications 22.2 42.1
Fair value gains / (losses) on valuation 1.7 (7.2)
Balance at 30 June 67.6 39.9
Investment properties are measured initially at cost, including transaction costs. The carrying amount includes the cost of replacing part of an existing investment property at the time that cost is incurred if the recognition criteria are met, and excludes the costs of day-to-day servicing of an investment property.
Subsequent to initial recognition, investment properties are measured at fair value, which is based on active market prices, adjusted if necessary, for any difference in the nature, location or condition of the specific asset at the reporting date. Gains or losses from changes in the fair values of investment properties are recognised in net surplus or deficit in the year in which they arise.

KiwiRail Holdings Ltd
For the financial year ended 30 June 2015
The numbers in the notes to the financial statements are expressed in millions unless otherwise stated.
58 TRUSTED KIWI-OWNED LOGISTICS PARTNER GROWING NEW ZEALAND
Notes to the Financial Statements
14. INVESTMENT PROPERTY (CONTINUED)Investment properties are derecognised either when they have been disposed of or when the investment property is permanently withdrawn from use and no future economic benefit is expected from its disposal. Any gains or losses on the retirement or disposal of an investment property are recognised in net surplus or deficit in the year of retirement or disposal.
Leased buildings held by KiwiRailA valuation of leased buildings was undertaken at the end of the current financial year. The valuation was carried out by independent valuers who hold a recognised and relevant professional qualification. See note 24(ii) for the methodology used in the determination of fair value.
Investment property from joint arrangementThe investment property comprises land (excluding the rail corridor) acquired as part of the joint arrangement with Northland Regional Council. The total carrying amount of investment properties relating to this joint arrangement is $2.5m (2014: $5.2m). See note 15 for further information on this joint arrangement.
The valuation has been undertaken by independent valuers who hold a recognised and relevant professional qualification.
The total rental income generated from investment properties for the year ended 30 June 2015 was $5.1m (2014: $4.2m). The direct operating expenses (including maintenance) arising from the use of investment properties during the year was $1.8m (2014: $1.3m).
15. JOINT ARRANGEMENT WITH NORTHLAND REGIONAL COUNCILIn January 2009 NZRC entered into an agreement with Northland Regional Council to create a joint arrangement in order to advance the proposed Oakleigh to Marsden Point rail link. This arrangement is considered as a joint operation under NZ IFRS 11 Joint Arrangements. A joint operation is a joint arrangement whereby the parties that have joint control of the arrangement have rights to the assets, and obligations for the liabilities, relating to the arrangement. As a party to a joint operation, the Group has recognised the related assets and liabilities in relation to its interest in the proposed Oakleigh to Marsden Point rail link.
The Council entered into voluntary negotiations with landowners who owned land along the existing corridor and to date have acquired nine properties with a total acquisition cost of $11.5m (the Group’s share is $5.8m).
The Joint Arrangement was vested from NZRC to KHL on 31 December 2012. Both the non-designated land and the designated land and associated costs are accounted for based on the economic substance of the joint arrangement.
At 30 June 2015 the Group has a liability of $5.1m (2014: $5.4m) to the Council for its share of the cost of land purchased by the Council as well as other Council expenditure relating to the joint operation. This is included in Trade and Other liabilities in note 17.

KiwiRail Holdings Ltd
For the financial year ended 30 June 2015
The numbers in the notes to the financial statements are expressed in millions unless otherwise stated.
59KIWIRAIL ANNUAL REPORT | 2015
Notes to the Financial Statements
16. INVESTMENT IN JOINT VENTUREThe Group is a party to a joint venture arrangement with the Port of Tauranga and Specialised Container Services (Auckland) Limited. The Group has 25% (2014: 50%) interest in MetroBox Limited, a joint venture involved in container repair and storage operating from a facility at Southdown, Auckland.
The Group has joint control over the net assets of the joint venture. Joint control is contractually agreed sharing of control of an arrangement, which exists only when decisions about the relevant activities require unanimous consent of the parties sharing control.
The Group’s investment in the joint venture is accounted for using the equity method. Investment in the joint venture is initially recognised at cost and the carrying amount of the investment is adjusted to recognise the changes in the Group’s net share of assets of the joint venture since the acquisition date. Goodwill relating to the joint venture is included in the carrying amount of the investment and the testing for impairment is carried out at the joint venture entity level.
After application of the equity method, the Group determines whether there is objective evidence that the investment is impaired. If there is, the Group calculates the amount of impairment as the difference between the recoverable amount of the joint venture and its carrying value, and then recognises the loss in net surplus or deficit. In a previous financial year, the Group’s share in this joint venture was impaired down to nil due to unprofitable operations.
A review of the financial statements of the joint arrangement was carried out leading to an assessment of the business’ fair value. The investment in joint venture has recovered in value therefore the Group has reversed the impairment charged previously in net surplus or deficit.
Summarised financial statements of the joint venture based on its NZ IFRS financial statements, and reconciliation with the carrying amount of the investment in consolidated financial statements are set out below:
2015 2014
$m $mNet assets 6.3 -Interest 25% 50%
Carrying amount of the investment 1.6 -Profit/(loss) for the year (0.1) -
Total comprehensive income (0.1) -
Group’s share of profit/(loss) for the year - -

KiwiRail Holdings Ltd
For the financial year ended 30 June 2015
The numbers in the notes to the financial statements are expressed in millions unless otherwise stated.
60 TRUSTED KIWI-OWNED LOGISTICS PARTNER GROWING NEW ZEALAND
Notes to the Financial Statements
17. TRADE AND OTHER LIABILITIES
Note 2015 2014
$m $mTrade payables 25.3 36.5
GST payable 17(a) 1.1 0.8
Employee entitlements 17(b) 97.9 96.5
Unearned revenue 11.3 8.7
Accrued interest 1.7 1.9
Payable to joint operator 15 5.1 5.4
Other payables and accruals 43.1 39.7
Total payables 185.5 189.5Current liabilities 150.5 152.2
Non-current liabilities 35.0 37.3
185.5 189.5
Payables are recognised when the Group becomes obliged to make future payments resulting from the purchase of goods and services. Payables are initially measured at fair value and subsequently measured at amortised cost using the effective interest rate method.
Trade payables are settled on normal commercial terms and the carrying value approximates fair value. No interest is incurred on trade payables unless the amounts fall overdue. Interest is charged at the discretion of the vendor.
Trade and other liabilities (excluding GST) are financial liabilities categorised at amortised cost.
(a) Goods and services tax (GST)
All items in the financial statements are presented exclusive of GST, except for receivables and payables, which are presented on a GST inclusive basis. Where GST is not recoverable as an input tax it is recognised as part of the related asset or expense.
The net amount of GST recoverable from, or payable to, Inland Revenue (‘IR’) is included as part of trade and other liabilities in the Statement of Financial Position.
(b) Employee entitlements
2015 2014
$m $mCurrent portion Accrued salaries and wages 8.8 8.2
Annual leave entitlement accruals 46.2 44.8
Retirement and long service leave liability 7.9 6.2
Total current portion 62.9 59.2
Non-Current portion
Retirement and long service leave 35.0 37.3
Total non-current portion 35.0 37.3
Total employee entitlements 97.9 96.5

KiwiRail Holdings Ltd
For the financial year ended 30 June 2015
The numbers in the notes to the financial statements are expressed in millions unless otherwise stated.
61KIWIRAIL ANNUAL REPORT | 2015
Notes to the Financial Statements
17. TRADE AND OTHER LIABILITIES (CONTINUED)(b) Employee entitlements (continued)
Provision is made for benefits accruing to employees in respect of annual leave, retiring leave (including involuntary retirement as medically unfit) and long service leave when it is probable that settlement will be required and they are capable of being measured reliably. Employee entitlements are accounted for based on NZ IAS 19 Employee Benefits.
Provisions made in respect of employee benefits expected to be settled within twelve months, are measured at their nominal values using the remuneration rate expected to apply at the time of settlement.
Provisions made in respect of employee benefits which are not expected to be settled within twelve months are measured on an actuarial basis at the present value of the estimated future cash outflows to be made by the Group in respect of services provided by employees up to the reporting date.
Independent actuaries are engaged on an annual basis to provide the valuation of employee entitlements such as long service leave and other similar benefits.
The present value of the retirement and long service leave obligations depend on a number of factors that are determined on an actuarial basis using a number of assumptions. Two key assumptions used in calculating this liability include the discount rate and the salary inflation factor. The assumptions used by the actuaries in arriving at the retirement and long service leave liabilities were a salary increase rate from 2.13% to 3.0% per annum (2014: 3.0% per annum) and a term specific risk-free discount rate of between 3.18% and 5.5% per annum (2014: between 3.7% and 5.5% per annum). The discount rate is derived from the yields on Government bonds as at the respective reporting dates, which have terms to maturity that match, as closely as possible, the estimated future cash outflows. The salary inflation factor has been determined after considering historical salary inflation patterns.
Contributions to superannuation plansCertain employees are members of defined contribution schemes and the Group contributes to those schemes. A defined contribution scheme is a plan under which the employee and the Group pay fixed contributions into a separate entity. The Group has no legal or constructive obligation to pay further contributions if the fund does not hold sufficient assets to pay all employee benefits in relation to employee service in the current and prior periods. The contributions are recognised as labour and related costs in net surplus or deficit when they are due.

KiwiRail Holdings Ltd
For the financial year ended 30 June 2015
The numbers in the notes to the financial statements are expressed in millions unless otherwise stated.
62 TRUSTED KIWI-OWNED LOGISTICS PARTNER GROWING NEW ZEALAND
Notes to the Financial Statements
18. PROVISIONSProvisions are recognised when the Group has a present obligation (legal or constructive) as a result of past events, it is probable that an outflow of resources embodying economic benefits will be required to settle the obligation and the amount can be reliably estimated.
2015 2014
$m $mACC accredited employer programme 3.2 3.0
Leased vessel costs 4.7 4.2
Reorganisation costs 1.0 3.8
Other provisions 0.5 9.9
9.4 20.9Represented by:Current 4.7 15.3
Non-current 4.7 5.6
9.4 20.9
ACC Accredited Employer Programme
KiwiRail Holdings Limited and its subsidiary KiwiRail Limited belong to the ACC Accredited Employer Programme (formerly ACC Partnership Programme) whereby each company accepts the management and financial responsibility for employee work-related accidents. Under the programme the employer is liable for all its claims costs for a period of four years up to a specified maximum. At the end of the four-year period a premium is paid to ACC for the value of residual claims, and from that point the liability for on-going claims passes to ACC.
The liability for the ACC Accredited Employer Programme (ACC AEP) is measured annually by Melville Jessup Weaver, an external independent actuarial valuer, using actuarial techniques at the present value of expected future payments to be made in respect of the employee injuries and claims up to the reporting date.
The actuaries have attested that they are satisfied as to the nature, sufficiency and accuracy of the data used to determine the outstanding claims liability. The actuary’s report is without qualifications.
The value of the liability is not material in the Group’s financial statements. Any changes in assumptions will not have a material impact on the financial statements.
Leased vessel cost
Redelivery costs: The Group has a charter agreement with Irish Continental Line Limited for the Kaitaki roll-on-roll-off ferry (effective from 1 July 2013) until 30 June 2017, which replaced a previous charter agreement for the same ship with Stena Finance B.V. The ship commenced in service under the original charter agreement on 22 August 2005. Redelivery costs are accrued during the period of the lease. At balance date the provision totalled $4.7m (2014: $4.2m).
Reorganisation costs
The restructuring provision is $1.0m (2014:$3.8m). There are restructuring plans across the Group and provisions have been established for expected costs including employee termination benefits. These restructuring activities are expected to be complete during the next financial year.

KiwiRail Holdings Ltd
For the financial year ended 30 June 2015
The numbers in the notes to the financial statements are expressed in millions unless otherwise stated.
63KIWIRAIL ANNUAL REPORT | 2015
Notes to the Financial Statements
18. PROVISIONS (CONTINUED)Movements in each class of provision are as follows:
2015 Balance at 30 June 2014
Provisions made during
the year
Provisions utilised or
released during the year
Balance at 30 June 2015 Current Non-Current
$m $m $m $m $m $mACC AEP 3.0 0.2 - 3.2 3.2 -
Leased vessel costs 4.2 0.5 - 4.7 - 4.7
Reorganisation costs 3.8 0.8 (3.6) 1.0 1.0 -
Other provisions 9.9 0.3 (9.7) 0.5 0.5 -
20.9 1.8 (13.3) 9.4 4.7 4.7
2014 Balance at 30 June 2013
Provisions made during
the year
Provisions utilised or
released during the year
Balance at 30 June 2014 Current Non-Current
$m $m $m $m $m $mACC AEP 2.8 0.2 - 3.0 3.0 -
Leased vessel costs 3.7 0.5 - 4.2 - 4.2
Transition costs 0.1 - (0.1) - - -
Reorganisation costs 4.3 1.2 (1.7) 3.8 3.8 -
Other provisions 5.3 8.7 (4.1) 9.9 8.5 1.4
16.2 10.6 (5.9) 20.9 15.3 5.6
19. SALE AND PURCHASE OF LANDOn 31 December 2012 there was a restructure of the Crown’s investment in rail operations. In accordance with the KiwiRail Holdings Vesting Order 2012 which took effect from 31 December 2012, the KiwiRail business was transferred from the New Zealand Railways Corporation (NZRC) into KiwiRail Holdings Limited. All land previously held by KiwiRail together with the Wellington Railway Station and Social Hall buildings were retained by NZRC.
From time to time NZRC may sell parcels of railway land. Under the Group’s lease agreement with NZRC entered into on 31 December 2012, the Group may identify railway land that should be sold and request NZRC to sell it or surrender it from the lease. The sale proceeds are provided to the Group to support its business as the State Owned Enterprise responsible for the financial performance of the Crown’s investment in rail operations.
Similarly, the Group can identify new parcels of land that are required for rail purposes. The Group will fund the acquisition of the land and can transfer it to NZRC to be included within the lease.
The sale and purchase of land are treated as common control transactions as the Crown is their ultimate parent. The sale of NZRC’s land is regarded as an increase in equity of the Crown to the Group whilst the Group’s acquisition of land for NZRC is treated as a reduction from Crown’s equity to the Group.
The total net proceeds from land sold during the year was $13.5m whilst the total land acquisition was less than $0.1m. The net amount was treated as transactions with owners in the Statement of Movements in Equity.

KiwiRail Holdings Ltd
For the financial year ended 30 June 2015
The numbers in the notes to the financial statements are expressed in millions unless otherwise stated.
64 TRUSTED KIWI-OWNED LOGISTICS PARTNER GROWING NEW ZEALAND
Notes to the Financial Statements
20. COMMITMENTS(a) Finance lease commitments
The Group has a lease agreement with Westpac Banking Corporation to lease Hi-Rail enabled vehicles and Tampers. The lease terms range between five to seven years. There are no terms of renewal, escalation clauses or purchase options contained within the agreement. The approved limit of this facility is $13.0m (2014: $20.6m). The discount rates used range from 5.29% to 5.64%.
At 30 June 2015 the Group had the following commitments under this lease agreement:
2015 2014
Total minimum lease payments due $m $mNot later than one year 1.9 3.3
Later than one year but not later than five years 6.8 11.8
Later than five years 6.0 7.5
Total minimum lease payments 14.7 22.6
Future lease finance charges (3.1) (4.5)
Present value of minimum lease payments 11.6 18.1
Represented by:Current 1.3 2.4
Non-current 10.3 15.7
Total finance leases 11.6 18.1
(b) Operating lease commitments as lessee
NZRC has, along with the Crown, granted a long-term lease to KRL for nominal consideration, under which KRL can enjoy the commercial benefit of the rail corridor land. KRL has primary responsibility for administering the land. Under the lease it can undertake many activities in relation to the land without requiring the consent or involvement of NZRC. It is also able to sub-lease railway land for periods of time within the term of the lease. The total minimum future sublease payments expected to be received under non-cancellable subleases at balance date is $nil.
Expenses incurred that qualify for recognition as an asset under an operating lease is recognised as property, plant and equipment. Capitalised assets are depreciated over the shorter of the estimated useful life of the asset and the lease term if there is no reasonable certainty that the Group will obtain ownership by the end of the lease term.
Operating lease payments are recognised as an operating expense in net surplus or deficit on a straight-line basis over the lease term. Operating lease incentives are recognised as a liability when received and subsequently reduced by allocating lease payments between rental expense and reduction of the liability.
The Group leases vessels and plant and equipment in the normal course of its business. Included in these lease commitments is the Group’s charter for the Kaitaki and Kaiarahi ships. The lease for Kaitaki has a non-cancellable term of four years expiring on 30 June 2017 whilst the lease for Kaiarahi is non-cancellable for five years expiring on 17 July 2020.
Motor vehicle leases generally have a non-cancellable term of three years.
Where lease payments are denominated in foreign currencies, they have been converted to New Zealand currency at the exchange rate ruling at balance date. Exposure to currency risks are included in the currency exposures in note 25.

KiwiRail Holdings Ltd
For the financial year ended 30 June 2015
The numbers in the notes to the financial statements are expressed in millions unless otherwise stated.
65KIWIRAIL ANNUAL REPORT | 2015
Notes to the Financial Statements
20. COMMITMENTS (CONTINUED)(b) Operating lease commitments as lessee (continued)
The future aggregate minimum lease payments payable under non-cancellable operating leases are as follows:
2015 2014
$m $mTotal minimum lease payments due:Not later than one year 22.8 16.6
Later than one year but not later than five years 58.4 31.1
Later than five years 14.4 10.7
95.6 58.4
(c) Operating lease commitments as lessor
The Group has certain non-cancellable property leases. The property lease portfolio is made up of a large number of leases with varying terms.
The future aggregate minimum lease payments to be collected under non-cancellable operating leases are as follows:
2015 2014
$m $mTotal minimum lease payments receivable:Not later than one year 25.5 17.5
Later than one year but not later than five years 72.3 43.3
Later than five years 82.5 77.7
180.3 138.5
For the year ended 30 June 2015, $31.3m was recognised as revenue in net surplus or deficit (2014: $28.2m).
(d) Capital and other commitments
The Group has capital commitments for network upgrades, infrastructure renewal materials, manufacturing of new rolling stock, refurbishment costs relating to rolling stock and purchases of plant and equipment.
2015 2014
$m $mCapital expenditure commitments:Not later than one year 88.6 73.3
Later than one year but not later than five years 13.8 4.8
102.4 78.1

KiwiRail Holdings Ltd
For the financial year ended 30 June 2015
The numbers in the notes to the financial statements are expressed in millions unless otherwise stated.
66 TRUSTED KIWI-OWNED LOGISTICS PARTNER GROWING NEW ZEALAND
Notes to the Financial Statements
21. RECONCILIATION OF NET SURPLUS / (DEFICIT) TO NET CASH FLOWS FROM OPERATING ACTIVITIES
2015 2014
$m $mNet loss after taxation (166.5) (248.0)
Add / (deduct) items classified as investing or financing activitiesGain on sale of assets 1.7 0.5
Fair value movement in derivatives (0.3) (3.2)
Capital grant receipts (44.6) (93.4)
Capitalised interest on loans - 0.4
(209.7) (343.7)
Add non-cash flow itemsDepreciation and amortisation expense 68.7 69.7
Movements in deferred tax and provisions (11.6) 4.7
Impairment of non-financial assets 224.7 331.3
Write back of receivable from joint venture (1.7) -
Movement in fair value of investment properties (1.7) 7.2
68.7 69.2
Add / (deduct) movements in working capital(Increase)/decrease in trade receivables (2.4) 3.6
(Increase)/decrease in other receivables 9.0 (8.5)
(Increase)/decrease in inventories 2.2 (4.7)
Increase/(decrease) in trade payables (11.0) 5.6
Increase/(decrease) in other payables 5.3 1.9
Net cash flows from operating activities 71.8 67.1
22. RELATED PARTY TRANSACTIONSThe beneficial shareholder of the Parent is the Crown. The Parent controls one subsidiary, KiwiRail Limited (“KL”). KL has one subsidiary, Clifford Bay Limited.
% holding 2015 Parent Incorporation Balance date Nature of activities
KiwiRail Limited 100 % KHL New Zealand 30 June Operates and maintains a nationwide rail and ferry transportation business
Clifford Bay Limited 100 % KL New Zealand 30 June Non-trading
The Group enters into transactions with related parties all of which are carried out on normal commercial terms. Transactions that occur within a normal supplier or client / recipient relationship, on terms and conditions no more or less favourable than those which it is reasonable to expect the Parent or its subsidiaries and associates would have adopted if dealing with that entity at arm’s length in the same circumstance, are not disclosed.
Significant transactions with Government-related entitiesThe Group has been provided with equity from the Crown and capital grant funding from Government entities. Equity funding of $198.0m (2014: $118.8m) has been received together with capital grant funding of $31.2m (2014:$82.0m).
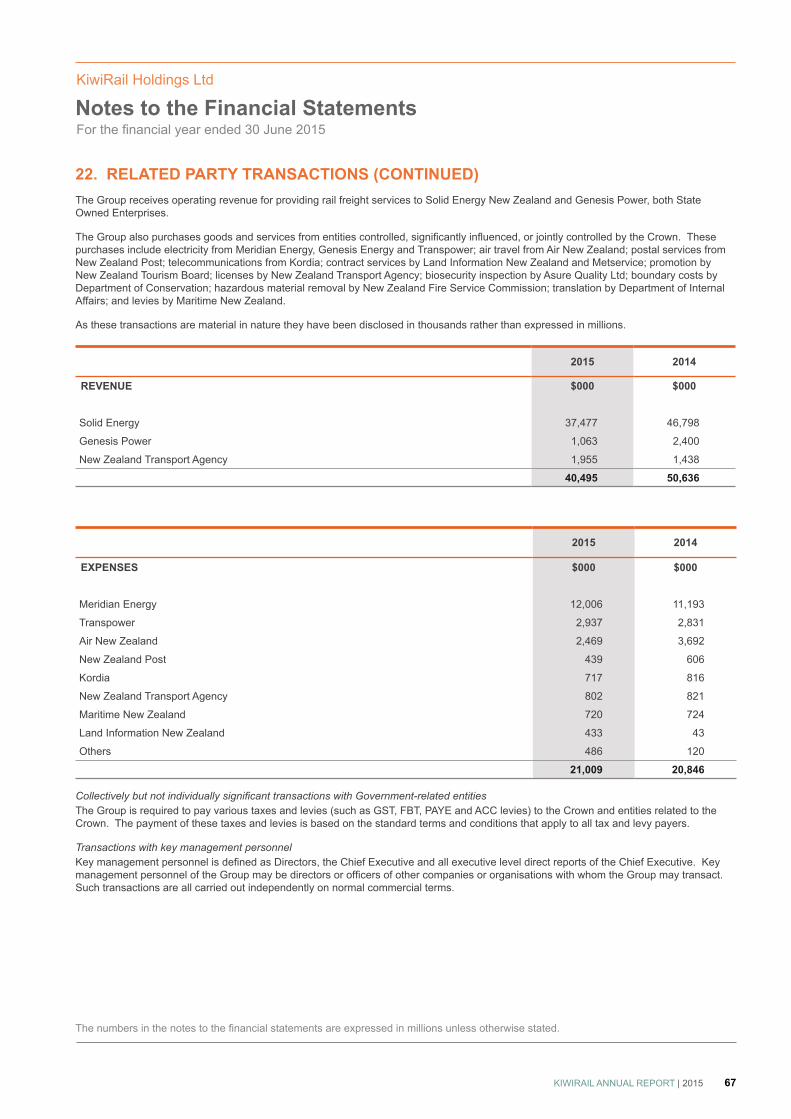
KiwiRail Holdings Ltd
For the financial year ended 30 June 2015
The numbers in the notes to the financial statements are expressed in millions unless otherwise stated.
67KIWIRAIL ANNUAL REPORT | 2015
Notes to the Financial Statements
22. RELATED PARTY TRANSACTIONS (CONTINUED)The Group receives operating revenue for providing rail freight services to Solid Energy New Zealand and Genesis Power, both State Owned Enterprises.
The Group also purchases goods and services from entities controlled, significantly influenced, or jointly controlled by the Crown. These purchases include electricity from Meridian Energy, Genesis Energy and Transpower; air travel from Air New Zealand; postal services from New Zealand Post; telecommunications from Kordia; contract services by Land Information New Zealand and Metservice; promotion by New Zealand Tourism Board; licenses by New Zealand Transport Agency; biosecurity inspection by Asure Quality Ltd; boundary costs by Department of Conservation; hazardous material removal by New Zealand Fire Service Commission; translation by Department of Internal Affairs; and levies by Maritime New Zealand.
As these transactions are material in nature they have been disclosed in thousands rather than expressed in millions.
2015 2014
REVENUE $000 $000
Solid Energy 37,477 46,798
Genesis Power 1,063 2,400
New Zealand Transport Agency 1,955 1,438
40,495 50,636
2015 2014
EXPENSES $000 $000
Meridian Energy 12,006 11,193
Transpower 2,937 2,831
Air New Zealand 2,469 3,692
New Zealand Post 439 606
Kordia 717 816
New Zealand Transport Agency 802 821
Maritime New Zealand 720 724
Land Information New Zealand 433 43
Others 486 120
21,009 20,846
Collectively but not individually significant transactions with Government-related entitiesThe Group is required to pay various taxes and levies (such as GST, FBT, PAYE and ACC levies) to the Crown and entities related to the Crown. The payment of these taxes and levies is based on the standard terms and conditions that apply to all tax and levy payers.
Transactions with key management personnelKey management personnel is defined as Directors, the Chief Executive and all executive level direct reports of the Chief Executive. Key management personnel of the Group may be directors or officers of other companies or organisations with whom the Group may transact. Such transactions are all carried out independently on normal commercial terms.

KiwiRail Holdings Ltd
For the financial year ended 30 June 2015
The numbers in the notes to the financial statements are expressed in millions unless otherwise stated.
68 TRUSTED KIWI-OWNED LOGISTICS PARTNER GROWING NEW ZEALAND
Notes to the Financial Statements
22. RELATED PARTY TRANSACTIONS (CONTINUED)The compensation of the key management personnel of the Group was as follows:
2015 2014
$000 $000Key Management Personnel CompensationShort-term employee benefits 4,778 4,190
Termination benefits 537 -
Balance at end of period 5,315 4,190
The Directors earned the following fees during the period:
2015 2014
$000 $000KHL DirectorsJohn Spencer 80 80
Paula Rebstock 50 50
Robert Field 40 40
John Leuchars 40 40
Rebecca Thomas 40 40
Kevin Thompson 40 40
Guy Royal 40 40
330 330
All Directors were appointed on 6 November 2012 at the incorporation of the Company and were previously Directors of NZRC.

KiwiRail Holdings Ltd
For the financial year ended 30 June 2015
The numbers in the notes to the financial statements are expressed in millions unless otherwise stated.
69KIWIRAIL ANNUAL REPORT | 2015
Notes to the Financial Statements
22. RELATED PARTY TRANSACTIONS (CONTINUED)
Employees’ remunerationTotal remuneration and benefits in $000 2015 2014
100 – 110 306 251
110 – 120 180 166
120 – 130 108 93
130 – 140 65 47
140 – 150 41 41
150 – 160 33 24
160 – 170 19 19
170 – 180 22 25
180 – 190 14 11
190 – 200 14 12
200 – 210 4 10
210 – 220 4 4
220 – 230 6 5
230 – 240 7 3
240 – 250 2 1
250 – 260 2 -
270 – 280 1 1
280 – 290 2 2
290 – 300 1 1
300 – 310 1 3
310 – 320 - 2
320 – 330 - 1
330 – 340 1 1
340 – 350 1 -
350 – 360 - 1
370 – 380 2 -
390 – 400 1 2
400 – 410 1 -
420 – 430 2 -
460 – 470 - 1
490 – 500 1 -
520 – 530 - 3
560 – 570 1 -
580 – 590 1 -
640 – 650 1 -
890 – 900* - 1
960 – 970* 1 -
845 731
*The remuneration of the Chief Executive is included in this band. The values for remuneration include redundancy/severance payments.

KiwiRail Holdings Ltd
For the financial year ended 30 June 2015
The numbers in the notes to the financial statements are expressed in millions unless otherwise stated.
70 TRUSTED KIWI-OWNED LOGISTICS PARTNER GROWING NEW ZEALAND
Notes to the Financial Statements
23. SHARE CAPITALAt 30 June 2015, the Group had issued 403,800,200 ordinary shares with no par value (2014: 205,800,200), each fully paid. The following rights attach to the ordinary shares issued by the Group:
• the right to one vote on a poll at a meeting of the Group on any resolution, including any resolution to appoint or remove a Director or auditor, alter the Group’s constitution, approve a major transaction, approve an amalgamation, and put the Group into liquidation
• the right to an equal share of dividends approved by the Board• the right to an equal share in the distribution of the surplus assets of the Group
Reconciliation of number of shares 2015 2014
(m) (m)Opening balance 205.8 87.0
Shares issued 198.0 118.8
Balance at 30 June 403.8 205.8
24. FAIR VALUE(a) Classification of Financial Instruments
The classification of each category of financial instruments is set out below:
In NZ $m 2015 2014
FINANCIAL ASSETSLoans and receivablesCash and cash equivalents 50.0 15.4
Trade and other receivables (excluding prepayments) 77.7 79.7
127.7 95.1Fair value through net surplus or deficit (Derivatives non-hedge accounted for)Derivative financial assets 6.7 2.8Fair value through other comprehensive income (Derivatives hedge accounted for)Derivative financial assets - 0.1FINANCIAL LIABILITIESAmortised costTrade and other liabilities 184.4 188.7
Interest-bearing liabilities 219.8 223.8
404.2 412.5Fair value through net surplus or deficit (Derivatives non-hedge accounted for)Derivative financial liabilities 13.3 9.6Fair value through other comprehensive income (Derivatives hedge accounted for)Derivative financial liabilities 0.2 1.9
The carrying amounts of the financial assets and financial liabilities approximate their fair value.

KiwiRail Holdings Ltd
For the financial year ended 30 June 2015
The numbers in the notes to the financial statements are expressed in millions unless otherwise stated.
71KIWIRAIL ANNUAL REPORT | 2015
Notes to the Financial Statements
24. FAIR VALUE (CONTINUED)(b) Fair Value Hierarchy
Fair values are allocated to a fair value hierarchy based on the following:• Level 1 – Quoted prices (unadjusted) in active markets for identical assets or liabilities• Level 2- Inputs other than quoted prices included within Level 1 that are observable for the asset or liability either directly (i.e. as
prices) or indirectly (i.e. derived from prices)• Level 3 – Inputs for the asset or liability that are not based on observable market data (unobservable inputs)
The Group does not have any Level 1 and/or Level 3 financial instruments (2014: nil).
Quoted market price represents the fair value determined based on quoted prices on active markets as at the reporting date without any deduction for transaction costs.
For financial assets not quoted in active markets, the Group uses valuation techniques such as present value techniques, comparison to similar instruments for which market observable prices exist and other relevant models used by market participants.
(i) Financial assets and financial liabilitiesThe fair value of the financial assets and financial liabilities as well as the methods used to estimate the fair value is summarised below:
In NZ $m Level 2
Financial instruments Net Asset/(Net Liability)* 2015 2014
Commodity forward contracts (1.9) (0.1)
Foreign currency forward contracts 6.3 (2.8)
Interest rate swaps (11.2) (5.7)
(6.8) (8.6)
*- The purpose of this disclosure is to evaluate the valuation techniques used on financial instruments designated at fair value. It does not represent whether netting arrangements are in place. For relevant disclosures other than fair value, see notes 25 and 13.
Derivative financial instruments are designated at fair value through net surplus or deficit and, if they are in a hedge relationship, at fair value through other comprehensive income. The Group uses discounted cash flow techniques. In estimating the fair value of an asset or liability, the Group uses market-observable data to the extent it is available. Where observable inputs are not available, the Group engages banking counterparties to support the establishment of appropriate valuation inputs. A Credit Value Adjustment is made to the underlying interest rate swap curve to adjust for counterparty credit risk.

KiwiRail Holdings Ltd
For the financial year ended 30 June 2015
The numbers in the notes to the financial statements are expressed in millions unless otherwise stated.
72 TRUSTED KIWI-OWNED LOGISTICS PARTNER GROWING NEW ZEALAND
Notes to the Financial Statements
24. FAIR VALUE (CONTINUED)(ii) Non-financial assetsThe fair value of the non-financial assets at the end of the year was:
In NZ $m Level 2
Non-financial assets 2015 2014
Assets held for sale 2.3 1.6
Buildings 45.6 78.3
Investment property 67.6 39.9
115.5 119.8
NZ IFRS 13 requires that the fair value measurement of non-financial assets take into account a market participant’s ability to generate economic benefits by using the asset in its highest and best use or by selling it to another market participant that would use the asset in its highest and best use.
Highest and best use of a non-financial asset takes into account the use of the asset that is physically possible, legally permissible and financially feasible. It is determined from the perspective of market participants, even if the Group intends a different use.
The valuation techniques used in determining the fair value of non-financial assets are as follows:
• Assets held for sale A number of assets held by the Group were identified to be sold as at 30 June 2015. A valuation has been performed to determine its fair value. An asset held for sale is required to be measured at the lower of the carrying value and the fair value less cost to sell. Fair value is determined by reference to the highest and best use for the asset. We have adopted the ‘market approach’ to determine the asset’s fair value by using market multiples derived from a set of comparables. For assets which are actively marketed, the source of fair value was based on the expressions of interest received carried out on an open market basis.
• Buildings Buildings are properties held to carry-out the Group’s entity-specific operations. They are revalued every three years. As at 30 June 2014, the valuation for buildings that form part of the rail CGU is carried out by an independent valuer who has recognised and relevant qualifications. In carrying out the valuation, the valuers take into account the likely sale price of the property but also assumed that the highest and best use is the properties’ current use.
• Investment property Each property is treated as an individual CGU. Investment properties are valued accounting for market derived assumptions. When the fair value is determined, the independent valuers have utilised valuers located nationwide that are familiar with the local property market in which the property is situated. They have factored local inputs into the valuation such as rentals, capitalisation rates and land values. The market valuation methodology used for investment properties was the income approach. The capitalisation rates used in the valuation range from 8% to 11%.
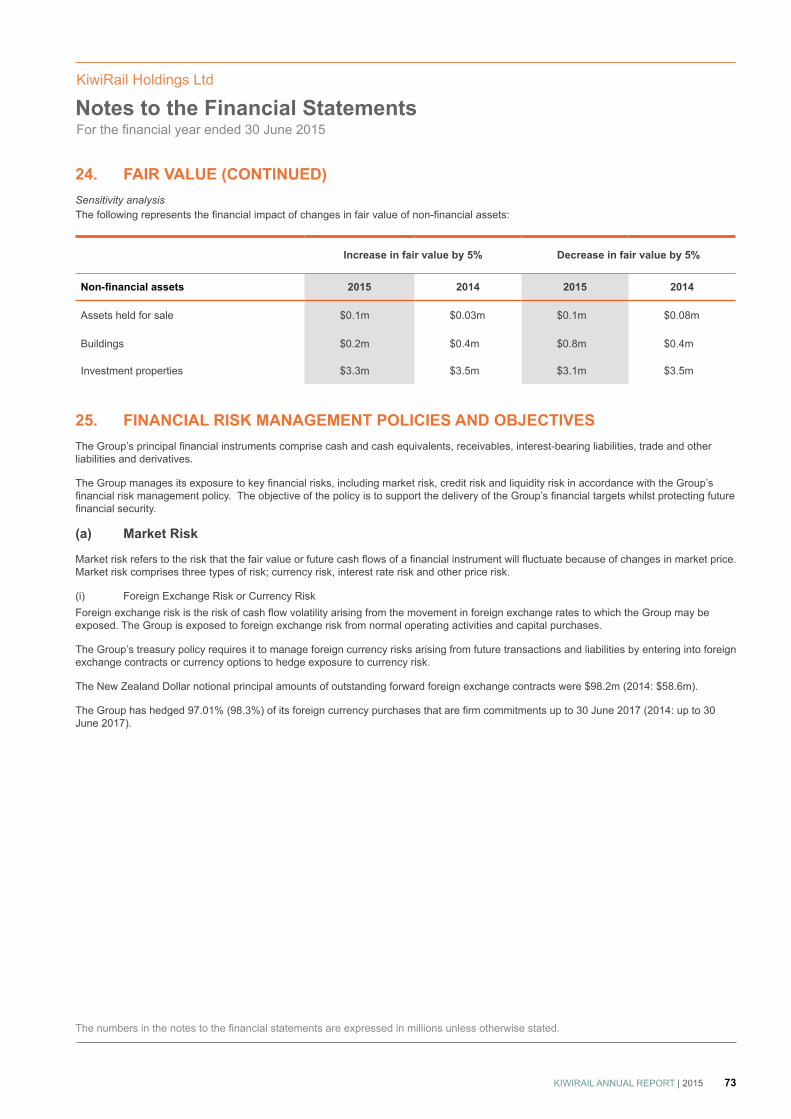
KiwiRail Holdings Ltd
For the financial year ended 30 June 2015
The numbers in the notes to the financial statements are expressed in millions unless otherwise stated.
73KIWIRAIL ANNUAL REPORT | 2015
Notes to the Financial Statements
24. FAIR VALUE (CONTINUED)Sensitivity analysisThe following represents the financial impact of changes in fair value of non-financial assets:
Increase in fair value by 5% Decrease in fair value by 5%
Non-financial assets 2015 2014 2015 2014
Assets held for sale $0.1m $0.03m $0.1m $0.08m
Buildings $0.2m $0.4m $0.8m $0.4m
Investment properties $3.3m $3.5m $3.1m $3.5m
25. FINANCIAL RISK MANAGEMENT POLICIES AND OBJECTIVESThe Group’s principal financial instruments comprise cash and cash equivalents, receivables, interest-bearing liabilities, trade and other liabilities and derivatives.
The Group manages its exposure to key financial risks, including market risk, credit risk and liquidity risk in accordance with the Group’s financial risk management policy. The objective of the policy is to support the delivery of the Group’s financial targets whilst protecting future financial security.
(a) Market Risk
Market risk refers to the risk that the fair value or future cash flows of a financial instrument will fluctuate because of changes in market price. Market risk comprises three types of risk; currency risk, interest rate risk and other price risk.
(i) Foreign Exchange Risk or Currency RiskForeign exchange risk is the risk of cash flow volatility arising from the movement in foreign exchange rates to which the Group may be exposed. The Group is exposed to foreign exchange risk from normal operating activities and capital purchases.
The Group’s treasury policy requires it to manage foreign currency risks arising from future transactions and liabilities by entering into foreign exchange contracts or currency options to hedge exposure to currency risk.
The New Zealand Dollar notional principal amounts of outstanding forward foreign exchange contracts were $98.2m (2014: $58.6m).
The Group has hedged 97.01% (98.3%) of its foreign currency purchases that are firm commitments up to 30 June 2017 (2014: up to 30 June 2017).
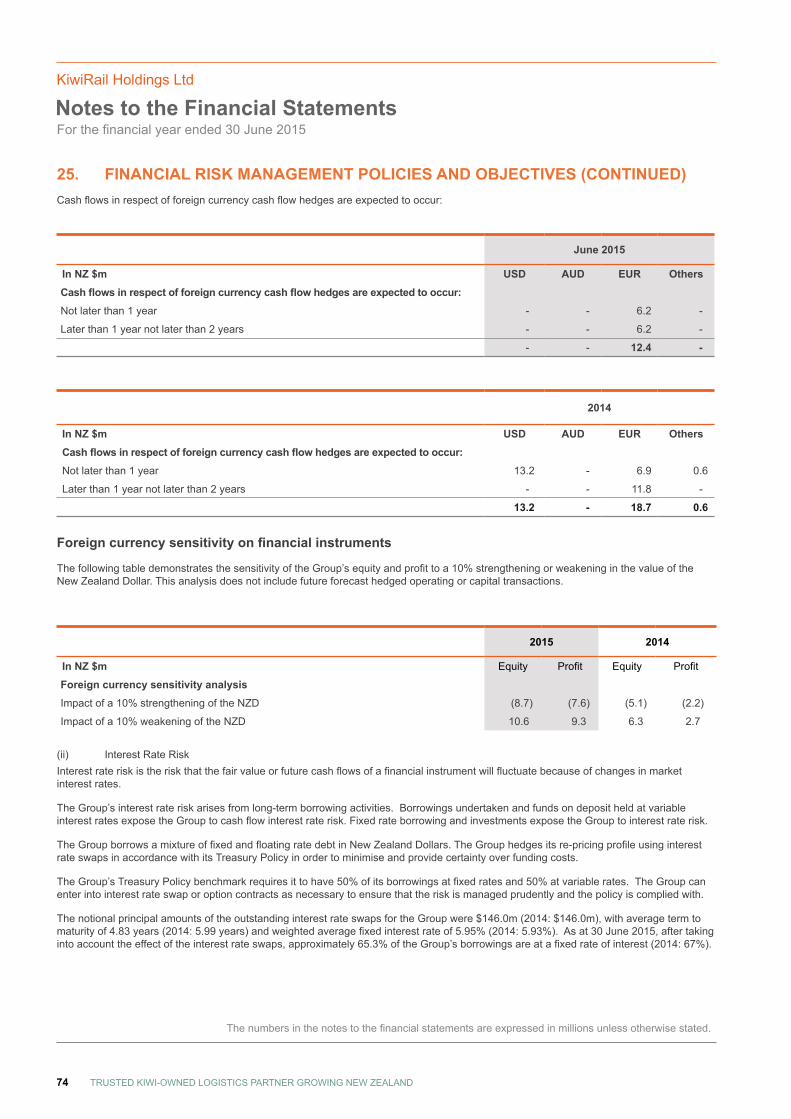
KiwiRail Holdings Ltd
For the financial year ended 30 June 2015
The numbers in the notes to the financial statements are expressed in millions unless otherwise stated.
74 TRUSTED KIWI-OWNED LOGISTICS PARTNER GROWING NEW ZEALAND
Notes to the Financial Statements
25. FINANCIAL RISK MANAGEMENT POLICIES AND OBJECTIVES (CONTINUED)Cash flows in respect of foreign currency cash flow hedges are expected to occur:
June 2015
In NZ $m USD AUD EUR OthersCash flows in respect of foreign currency cash flow hedges are expected to occur:Not later than 1 year - - 6.2 -
Later than 1 year not later than 2 years - - 6.2 -
- - 12.4 -
2014
In NZ $m USD AUD EUR OthersCash flows in respect of foreign currency cash flow hedges are expected to occur:Not later than 1 year 13.2 - 6.9 0.6
Later than 1 year not later than 2 years - - 11.8 -
13.2 - 18.7 0.6
Foreign currency sensitivity on financial instruments
The following table demonstrates the sensitivity of the Group’s equity and profit to a 10% strengthening or weakening in the value of the New Zealand Dollar. This analysis does not include future forecast hedged operating or capital transactions.
2015 2014
In NZ $m Equity Profit Equity Profit
Foreign currency sensitivity analysisImpact of a 10% strengthening of the NZD (8.7) (7.6) (5.1) (2.2)
Impact of a 10% weakening of the NZD 10.6 9.3 6.3 2.7
(ii) Interest Rate RiskInterest rate risk is the risk that the fair value or future cash flows of a financial instrument will fluctuate because of changes in market interest rates.
The Group’s interest rate risk arises from long-term borrowing activities. Borrowings undertaken and funds on deposit held at variable interest rates expose the Group to cash flow interest rate risk. Fixed rate borrowing and investments expose the Group to interest rate risk.
The Group borrows a mixture of fixed and floating rate debt in New Zealand Dollars. The Group hedges its re-pricing profile using interest rate swaps in accordance with its Treasury Policy in order to minimise and provide certainty over funding costs.
The Group’s Treasury Policy benchmark requires it to have 50% of its borrowings at fixed rates and 50% at variable rates. The Group can enter into interest rate swap or option contracts as necessary to ensure that the risk is managed prudently and the policy is complied with.
The notional principal amounts of the outstanding interest rate swaps for the Group were $146.0m (2014: $146.0m), with average term to maturity of 4.83 years (2014: 5.99 years) and weighted average fixed interest rate of 5.95% (2014: 5.93%). As at 30 June 2015, after taking into account the effect of the interest rate swaps, approximately 65.3% of the Group’s borrowings are at a fixed rate of interest (2014: 67%).
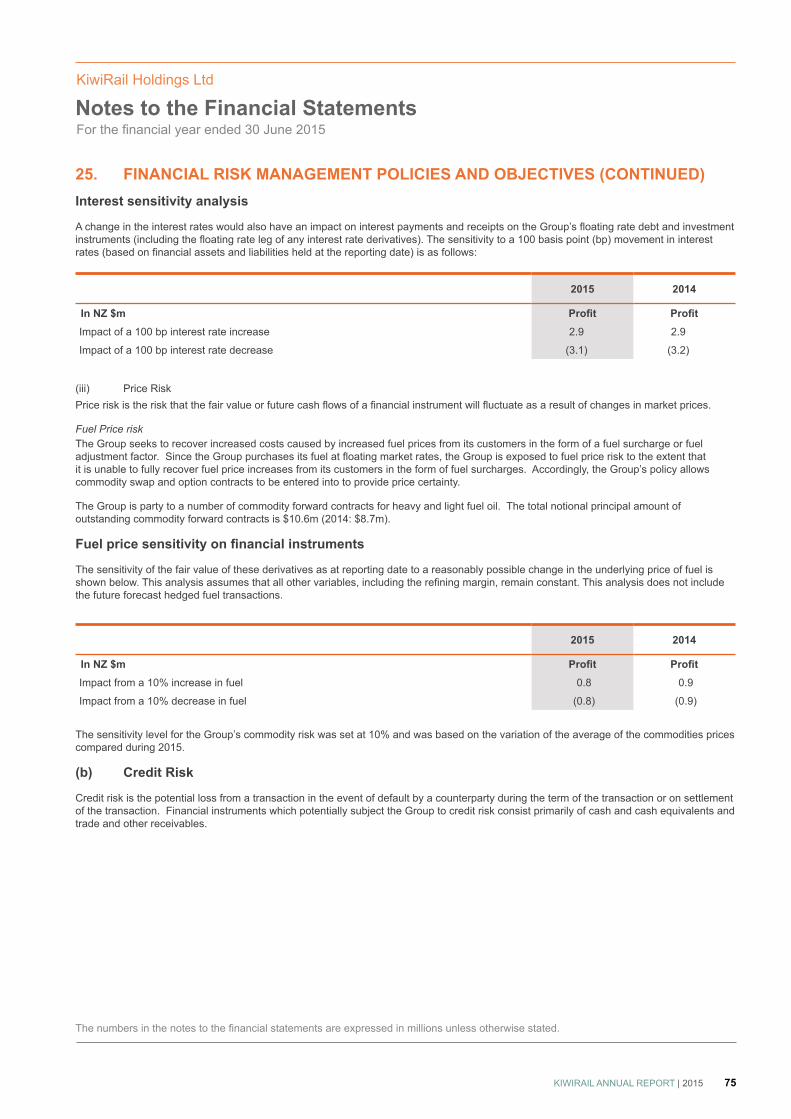
KiwiRail Holdings Ltd
For the financial year ended 30 June 2015
The numbers in the notes to the financial statements are expressed in millions unless otherwise stated.
75KIWIRAIL ANNUAL REPORT | 2015
Notes to the Financial Statements
25. FINANCIAL RISK MANAGEMENT POLICIES AND OBJECTIVES (CONTINUED)Interest sensitivity analysis
A change in the interest rates would also have an impact on interest payments and receipts on the Group’s floating rate debt and investment instruments (including the floating rate leg of any interest rate derivatives). The sensitivity to a 100 basis point (bp) movement in interest rates (based on financial assets and liabilities held at the reporting date) is as follows:
2015 2014
In NZ $m Profit ProfitImpact of a 100 bp interest rate increase 2.9 2.9
Impact of a 100 bp interest rate decrease (3.1) (3.2)
(iii) Price RiskPrice risk is the risk that the fair value or future cash flows of a financial instrument will fluctuate as a result of changes in market prices.
Fuel Price riskThe Group seeks to recover increased costs caused by increased fuel prices from its customers in the form of a fuel surcharge or fuel adjustment factor. Since the Group purchases its fuel at floating market rates, the Group is exposed to fuel price risk to the extent that it is unable to fully recover fuel price increases from its customers in the form of fuel surcharges. Accordingly, the Group’s policy allows commodity swap and option contracts to be entered into to provide price certainty.
The Group is party to a number of commodity forward contracts for heavy and light fuel oil. The total notional principal amount of outstanding commodity forward contracts is $10.6m (2014: $8.7m).
Fuel price sensitivity on financial instruments
The sensitivity of the fair value of these derivatives as at reporting date to a reasonably possible change in the underlying price of fuel is shown below. This analysis assumes that all other variables, including the refining margin, remain constant. This analysis does not include the future forecast hedged fuel transactions.
2015 2014
In NZ $m Profit ProfitImpact from a 10% increase in fuel 0.8 0.9
Impact from a 10% decrease in fuel (0.8) (0.9)
The sensitivity level for the Group’s commodity risk was set at 10% and was based on the variation of the average of the commodities prices compared during 2015.
(b) Credit Risk
Credit risk is the potential loss from a transaction in the event of default by a counterparty during the term of the transaction or on settlement of the transaction. Financial instruments which potentially subject the Group to credit risk consist primarily of cash and cash equivalents and trade and other receivables.

KiwiRail Holdings Ltd
For the financial year ended 30 June 2015
The numbers in the notes to the financial statements are expressed in millions unless otherwise stated.
76 TRUSTED KIWI-OWNED LOGISTICS PARTNER GROWING NEW ZEALAND
Notes to the Financial Statements
25. FINANCIAL RISK MANAGEMENT POLICIES AND OBJECTIVES (CONTINUED)Whilst the Group may be subjected to losses up to the contract value of the instruments in the event of default by its counterparties, it does not expect such losses to occur. On-going credit evaluation is performed on the financial condition of accounts receivable and customers’ compliance with credit terms. The Group’s policy does not require collateral support for financial instruments subject to credit risk, although personal guarantees may be obtained in support of the financial performance of certain customers.
Concentration of credit riskThe Group does not have any significant credit risk exposure to a single counterparty or any group of counterparties having similar characteristics due to the large number of customers included in the Group’s customer base. The credit risk on cash and cash equivalents and foreign exchange dealings is limited as the Group spreads its business amongst a number of Standard & Poors AA rated counterparties.
Credit quality of assets not impaired or not yet dueThe Group does not rate its individual debtors as it has a large number of customers. The incident of default on financial assets not impaired or not yet due is minimal. The Group has no other significant exposure to credit risk from financial assets not impaired or not yet due, nor has there been any renegotiation of terms on any of these assets.
Exposure to credit riskThe carrying amount of financial assets represents the maximum credit exposure.
(c) Liquidity Risk
Liquidity risk is the risk that the Group will not be able to meet financial commitments as they fall due. The Group manages liquidity risk by continuously monitoring forecast and actual cash flows and matching the maturity profiles of financial assets and financial liabilities.
The Group accesses funds via Crown appropriations for specified capital projects.
Exposure to liquidity riskThe table below analyses the Group’s financial liabilities into relevant maturity groupings based on the remaining period at the balance date to the contractual maturity date. Future interest payments on floating rate debt are based on the floating rate on the instrument at the balance date. The amounts disclosed are the contractual undiscounted cash flows.
2015 Carrying amount
Contractual cash flows
Less than 1 year 1 – 2 years 2 – 5 years More than 5
years$m $m $m $m $m $m
Financial LiabilitiesTrade and other payables 184.4 184.4 149.4 35.0 - -
Net settled derivative liabilities 13.5 13.5 2.0 0.3 5.0 6.2
Finance Leases 11.6 14.7 1.9 1.8 5.0 6.0
Borrowings 208.2 235.3 40.1 12.2 183.0 -
Total 417.7 447.9 193.4 49.3 193.0 12.2

KiwiRail Holdings Ltd
For the financial year ended 30 June 2015
The numbers in the notes to the financial statements are expressed in millions unless otherwise stated.
77KIWIRAIL ANNUAL REPORT | 2015
Notes to the Financial Statements
25. FINANCIAL RISK MANAGEMENT POLICIES AND OBJECTIVES (CONTINUED)
2014 Carrying amount
Contractual cash flows
Less than 1 year 1 – 2 years 2 – 5 years More than 5
years$m $m $m $m $m $m
Financial LiabilitiesTrade and other payables 188.7 188.7 151.4 37.3 - -
Net settled derivative liabilities 11.5 11.5 5.2 0.5 2.3 3.5
Finance Leases 18.1 22.7 3.3 3.2 8.7 7.5
Borrowings 205.7 243.7 26.3 38.5 178.9 -
Total 424.0 466.6 186.2 79.5 189.9 11.0
(d) Capital Risk Management
The Group manages its capital structure to ensure it is able to continue as a going concern whilst maximising its investment into rail infrastructure and rolling stock assets. The State Owned Enterprises Act 1986 requires the Board to manage the Group as a profitable and efficient organisation that is comparable to businesses that are not owned by the Crown.
The capital structure of the Group consists of borrowings, cash and cash equivalents and equity. Equity comprises a capital contribution from the Crown, retained earnings and reserves.
The Board reviews the capital structure of the Group as part of the Group’s planning cycle and regular on-going reviews. As part of this review, the Board considers the level of capital invested in the business and the amounts retained to ensure it effectively achieves its objectives and purpose.
26. CONTINGENT LIABILITIES(a) Marsden Point rail corridor designation
The Group has confirmed its designation of the rail corridor from the North Auckland Line to Marsden Point. The Northland Regional Council will purchase any land that may be required. The Group has an agreement with the Northland Regional Council that it will have a half share in the acquisition and holding costs of land purchases with the Council.
(b) Incidents at the Group’s worksite
The Group is a party to charges in relation to two unrelated workplace incidents at the Group’s worksite. The Group expects to be liable for fines and reparations but the total liability is uncertain at this stage.
27. EVENTS SUBSEQUENT TO BALANCE DATEOn 13 August 2015, the Board of Solid Energy New Zealand Limited placed the company and all associated companies into voluntary administration. This process allows the company to continue trading while creditors consider the best way forward. It is intended that Solid Energy will engage an investment bank and undertake an orderly, managed sale of its assets over the next two-and-a-half years.
As Solid Energy is a key customer of KiwiRail, we have assessed the impact of this announcement for these financial statements, and determined that based on current information, no adjustment is required.

78 TRUSTED KIWI-OWNED LOGISTICS PARTNER GROWING NEW ZEALAND
Independent Auditor’s Report
To the readers ofthe KiwiRail Holdings Limited group’s
financial statements for the year ended 30 June 2015
The Auditor-General is the auditor of KiwiRail Holdings Limited and its subsidiaries and other controlled entities. The Auditor-General has appointed me, Stephen Lucy, using the staff and resources of Audit New Zealand, to carry out the audit of the financial statements of the group, consisting of KiwiRail Holdings Limited and its subsidiaries and other controlled entities (collectively referred to as ‘the Group’), on her behalf.
OpinionWe have audited the financial statements of the Group on pages 33 to 77, that comprise the statement of financial position as at 30 June 2015, the statement of comprehensive income, statement of movements in equity and statement of cash flows for the year ended on that date and the notes to the financial statements that include accounting policies and other explanatory information.
In our opinion the financial statements of the Group:
• Present fairly, in all material respects:
• its financial position as at 30 June 2015; and
• its financial performance and cash flows for the year then ended.
• Comply with generally accepted accounting practice in New Zealand and have been prepared in accordance with New Zealand equivalents to International Financial Reporting Standards and International Financial Reporting Standards.
Validity of the going concern basis on which the financial statements have been prepared
Without modifying our opinion, we draw your attention to the disclosure made on page 38 that the Board of Directors’ assessment of the group’s ability to continue as a going concern is dependent on continuing support from the shareholder. We consider the disclosures to be adequate.
Our audit was completed on 28 August 2015. This is the date at which our opinion is expressed.
The basis of our opinion is explained below. In addition, we outline the responsibilities of the Board of Directors and our responsibilities, and explain our independence.
Basis of opinionWe carried out our audit in accordance with the Auditor-General’s Auditing Standards, which incorporate the International Standards on Auditing (New Zealand). Those standards require that we comply with ethical requirements and plan and carry out our audit to obtain reasonable assurance about whether the financial statements are free from material misstatement.
Material misstatements are differences or omissions of amounts and disclosures that, in our judgement, are likely to influence readers’ overall understanding of the financial statements. If we had found material misstatements that were not corrected, we would have referred to them in our opinion.
An audit involves carrying out procedures to obtain audit evidence about the amounts and disclosures in the financial statements. The procedures selected depend on our judgement, including our assessment of risks of material misstatement of the financial statements, whether due to fraud or error. In making those risk

79KIWIRAIL ANNUAL REPORT | 2015
assessments, we consider internal control relevant to the preparation of the Group’s financial statements in order to design audit procedures that are appropriate in the circumstances but not for the purpose of expressing an opinion on the effectiveness of the Group’s internal control.
An audit also involves evaluating:
• the appropriateness of accounting policies used and whether they have been consistently applied;
• the reasonableness of the significant accounting estimates and judgements made by the Board of Directors;
• the adequacy of the disclosures in the financial statements; and
• the overall presentation of the financial statements.
We did not examine every transaction, nor do we guarantee complete accuracy of the financial statements. Also we did not evaluate the security and controls over the electronic publication of the financial statements.
We believe we have obtained sufficient and appropriate audit evidence to provide a basis for our audit opinion.
Responsibilities of the Board of DirectorsThe Board of Directors is responsible for the preparation and fair presentation of financial statements for the Group that comply with generally accepted accounting practice in New Zealand and New Zealand equivalents to International Financial Reporting Standards and International Financial Reporting Standards.
The Board of Directors’ responsibilities arise from the StateOwned Enterprises Act 1986.
The Board of Directors is also responsible for such internal control as it determines is necessary to enable the preparation of financial statements that are free from material misstatement, whether due to fraud or error. The Board of Directors is also responsible for the publication of the financial statements, whether in printed or electronic form.
Responsibilities of the AuditorWe are responsible for expressing an independent opinion on the financial statements and reporting that opinion to you based on our audit. Our responsibility arises from section 15 of the Public Audit Act 2001.
IndependenceWhen carrying out the audit, we followed the independence requirements of the Auditor-General, which incorporate the independence requirements of the External Reporting Board.
In addition to the audit we have carried out a special purpose audit relating to the Funding Agreement for Suburban Rail Services between one of the subsidiaries of the group, KiwiRail Limited, and the Greater Wellington Regional Council. The special purpose audit is compatible with those independence requirements. Other than the audit and the special purpose audit, we have no relationship with or interests in the Group.
S B Lucy
Audit New Zealand
On behalf of the Auditor-General
Wellington, New Zealand
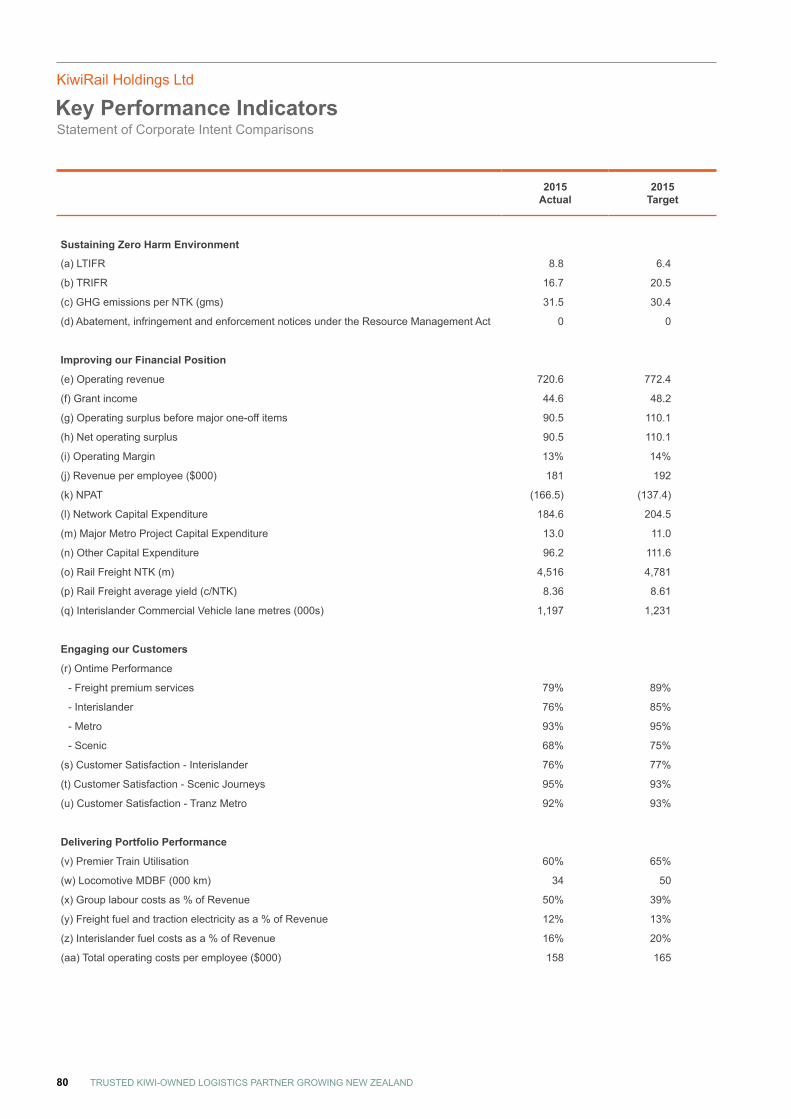
KiwiRail Holdings Ltd
Statement of Corporate Intent ComparisonsKey Performance Indicators
80 TRUSTED KIWI-OWNED LOGISTICS PARTNER GROWING NEW ZEALAND
2015 Actual
2015 Target
Sustaining Zero Harm Environment
(a) LTIFR 8.8 6.4
(b) TRIFR 16.7 20.5
(c) GHG emissions per NTK (gms) 31.5 30.4
(d) Abatement, infringement and enforcement notices under the Resource Management Act 0 0
Improving our Financial Position
(e) Operating revenue 720.6 772.4
(f) Grant income 44.6 48.2
(g) Operating surplus before major one-off items 90.5 110.1
(h) Net operating surplus 90.5 110.1
(i) Operating Margin 13% 14%
(j) Revenue per employee ($000) 181 192
(k) NPAT (166.5) (137.4)
(l) Network Capital Expenditure 184.6 204.5
(m) Major Metro Project Capital Expenditure 13.0 11.0
(n) Other Capital Expenditure 96.2 111.6
(o) Rail Freight NTK (m) 4,516 4,781
(p) Rail Freight average yield (c/NTK) 8.36 8.61
(q) Interislander Commercial Vehicle lane metres (000s) 1,197 1,231
Engaging our Customers
(r) Ontime Performance
- Freight premium services 79% 89%
- Interislander 76% 85%
- Metro 93% 95%
- Scenic 68% 75%
(s) Customer Satisfaction - Interislander 76% 77%
(t) Customer Satisfaction - Scenic Journeys 95% 93%
(u) Customer Satisfaction - Tranz Metro 92% 93%
Delivering Portfolio Performance
(v) Premier Train Utilisation 60% 65%
(w) Locomotive MDBF (000 km) 34 50
(x) Group labour costs as % of Revenue 50% 39%
(y) Freight fuel and traction electricity as a % of Revenue 12% 13%
(z) Interislander fuel costs as a % of Revenue 16% 20%
(aa) Total operating costs per employee ($000) 158 165

KiwiRail Holdings Ltd
Statement of Corporate Intent ComparisonsKey Performance Indicators
81KIWIRAIL ANNUAL REPORT | 2015
2015 Actual
2015 Target
Empowering our People
(ab) Staff Engagement * 76%
Key Investment Outcomes
(ac) Rolling stock replacements
- Wagons (no. of new units) 120 150
- Locomotives (no. of new units) 0 0
(ad) Network Renewals
- New Sleepers Laid (000) 82 104
- New Rail Laid (km) 20 17
- Lines Destressed (km) 126 157
- Span Metres Replaced 333 490
- Timber Piers Replaced 41 55
- Culverts Replaced 41 26
- Level Crossing Upgrades 6 10
Shareholder Return Measures
Total Shareholder Return N/A N/A
Dividend Yield 0 0
Dividend Payout 0 0
Return on Average Equity (33%) (29%)
Profitability/Efficiency Measures
Return on Average Capital Employed (22%) (19%)
Operating Margin 13% 14%
Leverage/Solvency Measures
Shareholder's Funds to Total Assets 55% 55%
Gearing Ratio (net) 33% 45%
Interest Cover 7.3 7.0
Solvency (current assets/current liabilities) 1.09 1.27
* No engagement survey was completed for 2015 as KiwiRail has moved to a new method of measuring.

82 TRUSTED KIWI-OWNED LOGISTICS PARTNER GROWING NEW ZEALAND
83KIWIRAIL ANNUAL REPORT | 2015
Bankers Bank of New Zealand North End Branch, 100 Lambton Quay, Wellington P.O. Box 1596, Wellington 6140
Auditors Stephen Lucy, Audit New Zealand On behalf of the Auditor-General Level 2, 100 Molesworth Street, Wellington Private Bag 99, Wellington 6140
Registered office Level 3, 8-14 Stanley Street, Auckland 1010
Directory
Further informationFor assistance, publications or information concerning KiwiRail please visit our website at www.kiwirail.co.nz or contact:KiwiRail Communications PO Box 593, Wellington, 6140 Telephone: 0800 801 070 | Email: [email protected]
Photo credits:Lindsay Keats Cover, 2, 5, 8, 12, 21, 22, 24, 29Mark Coote 6, 10, 23Marcus Adams 15, 26Brendon O’Hagan 16, 17, 18, 19, 20, 27, 31 Dave Lintott 25
Front cover photo: Hamesh Patel, Locomotive Maintainer CT Site Wellington