Embed Size (px)
Citation preview

W W W. H E A LT H L E A D E R S M E D I A . C O M / I N T E L L I G E N C E
C uncilHEALTHLEADERS MEDIA
Access. Insight. Analysis.
Powered by
INDUSTRY SURVEYH E A L T H L E A D E R S M E D I A 2 0 1 4
F R E E R E P O R T
Forging Healthcare’s New Financial Foundation
An independent HealthLeaders Media
Survey supported by

Industry Survey 2014: Forging Healthcare’s New Financial Foundation
Intelligence Report Premium from HealthLeaders Media
CLICK HERE TO puRCHasE OuR pREMIuM EdITIOn
This report shows how organizations are managing the shift from volume to value, including new and proven tactics to support collaborative care.
• Learn how top organizations are preparing for bundled payments, risk sharing, and the development of new analytics skills needed to drive population health management.
• Discover which specific clinical and financial strategies today’s leaders are pursuing to pave the way to collaborative care.
• Benchmark your organization’s progress in the volume-to-value transition compared to other leading providers.
• Deep-dive into over 400 charts with segmented peer data.
• Get proven strategies and actionable recommendations from the HealthLeaders Media research team, and a discussion guide for your organization.
For more information or to purchase this report, go to HealthLeadersMedia.com/Intelligence or call 800-753-0131.
January 2014 | Industry Survey 2014: Forging Healthcare’s New Financial Foundation page 22TOC
This documenT is proTecTed. do noT copy, share, forward, or reproduce.
FIGURE 8 | Top Three Focus areas Next Year to Control Cost
Q | What are the top three areas you will focus on next year to control costs?
Click on these icons to dig deeper.
>><<
takeaways
• Registering the importance of producing sustainable results
and taking the long view, process improvement is named
among the top three cost-control focus areas by 81% of
respondents.
• Health systems (89%), which have the resources and
personnel to commit to process improvement, are more
likely than hospitals (77%) and physician organizations
(78%) to identify process improvement, but it is the top cost-
control choice across all three settings.
• Across all settings, labor efficiencies (67%) is the second
cost-control choice. The emphasis on process improvement,
including analytics, will help in identifying opportunities
to use labor more effectively and efficiently. Despite the
dominance of leaders’ reliance on efficiencies, one in five
hospitals (20%) will look to labor reductions to control
costs, which is somewhat greater than health systems and
physician organizations (16% each).
what does it mean?
To be successful and produce returns year after year, expense
reduction must be sustainable. Process improvement
provides the structure for an organization to assess and
reassess how it controls costs. When implemented correctly
across an organization, the process becomes part of the
culture and is hardwired for daily practice, which often
reduces the need for more severe steps such as labor
reductions (17%) or employee benefit reductions (16%).
16%
17%
41%
53%
67%
81%
Employee benefit reductions
Labor reductions
Capacity management
Expense reduction via supply-chain efficiencies
Labor efficiencies
Expense reduction via process improvement
Base = 792 , Multi-response
total responses
view by Number of sites
view by region
view by Net
patieNt ReveNueview by number of beds
main chart and takeaways
view by Setting
view by CeO
VIEW BY NUMBER OF SITES
VIEW BY REGION
New Data Segmentation Tool Find out what organizations just like yours are doing.
VIEW BY SETTING
$ VIEW BY NET PATIENT REVENUE
VIEW BY NUMBER OF BEDS
TAKEAWAYS
INDUSTRY SURVEYH E A L T H L E A D E R S M E D I A 2 0 1 4

January 2014 | Industry Survey 2014: Forging Healthcare’s New Financial Foundation page 3TOC
Click here to learn more and order the pReMIUM eDITION with actionable strategies and further segmentation
Finally, in 2013, we were assured that the major provisions of the Patient Protection
and Affordable Care Act would be implemented, even as enrollment in the
healthcare insurance exchanges was slow to take off due to significant technical
issues. With most of the uncertainty of the previous year behind us, we spent 2013
resolved to prepare our organizations and our teams for the shift from volume- to
value-based care.
The results of the 2014 HealthLeaders Media Industry Survey confirm this resolve,
and it is clear that industry leaders have a firm grasp of how healthcare reform
will impact their organizations. Fully 91% of survey respondents cite reduced
reimbursements as the No. 1 threat to their organizations, far outpacing concerns
about industry consolidation (37%) or healthcare reform overall (36%).
As ever, survey respondents are focused on expense reductions, operational
improvements, and greater efficiency to counteract reimbursement reductions.
However, what is perhaps more telling are the types of investments healthcare
executives are prepared to make to support new care models and to fuel
financial growth.
Patient satisfaction figures prominently in this year’s results. Even as organizations
work to identify the best tools to engage patients, healthcare leaders are ready to
place more emphasis on consumer-centric programs designed to improve patient-
provider interactions. And as healthcare reform places significant weight on patient
satisfaction in overall reimbursement, the majority of survey respondents (62%)
confirm that they are preparing to make or increase investments to improve the
patient experience over the next three years, topping a list of 10 initiatives.
Moreover, as accountable care organizations and patient-centered medical homes
become the norm as models to measure quality and report outcomes, 54% of
respondents say they will begin or increase investments in data analytics over this
same time period. Clearly healthcare executives understand how data drives the
new emphasis on wellness (rather than expensive, acute episodes) and population
health management.
This year’s survey will give you a sense of the innovation our industry is
contemplating to achieve the full promise of an outcomes-based care delivery
system while managing costs and meeting the increased demand for healthcare
services from newly empowered patients.
There is no question that our industry will experience significant changes over the
next three to five years, and these survey results offer valuable insight into how
leaders like you are effectively addressing the opportunities and challenges on our
collective journey to a value-based healthcare system that works for all Americans.
Stephen Mooney
President & CEO
Conifer Health Solutions
Frisco, Texas
perspective
HealtHcare leaders continue to innovate tHrougH uncertainty

January 2014 | Industry Survey 2014: Forging Healthcare’s New Financial Foundation page 4TOC
Click here to learn more and order the pReMIUM eDITION with actionable strategies and further segmentation
Table of Contents
Perspective 3
Methodology 5
Respondent Profile 6
Analysis 8
Survey Results 16
Figure 1: Current State of the Healthcare Industry . . . . . . . . . . . . . . . . 16
Figure 2: Current State of Organization. . . . . . . . . . . . . . . . . . . . . . . . . . . 17
Figure 3: Top Three Improvement Areas to Reach Financial
Targets in Three Years . . . . . . . . . . . . . . . . . . . . . . . . . . . . . . . . . 18
Figure 4: Threats . . . . . . . . . . . . . . . . . . . . . . . . . . . . . . . . . . . . . . . . . . . . . . . 19
Figure 5: Opportunities . . . . . . . . . . . . . . . . . . . . . . . . . . . . . . . . . . . . . . . . .20
Figure 6: Switch From Volume to Value. . . . . . . . . . . . . . . . . . . . . . . . . . . 21
This document contains privileged, copyrighted information. If you have not purchased it or are not otherwise entitled to it by agreement with HealthLeaders Media, any use, disclosure, forwarding, copying, or other communication of the contents is prohibited without permission.
Figure 7: Greatest Clinical Quality Improvement Challenge. . . . . . . . . . 22
Figure 8: Top Three Focus Areas Next Year to Control Cost . . . . . . . . . 23
Figure 9: Job Satisfaction . . . . . . . . . . . . . . . . . . . . . . . . . . . . . . . . . . . . . . . 24
Figure 10: Overall Performance for Various Groups . . . . . . . . . . . . . . . . . 25
Figure 11: Overall Performance for Various Functions . . . . . . . . . . . . . . . 26
Figure 12: Performance for Various Areas . . . . . . . . . . . . . . . . . . . . . . . . . 27
Figure 13: 2014 Financial Forecast . . . . . . . . . . . . . . . . . . . . . . . . . . . . . . . .28
Figure 14: Fueling Financial Growth Over the Next Five Years . . . . . . . . 30
Figure 15: Investments Over Next Three Years . . . . . . . . . . . . . . . . . . . . . 31
Figure 16: Investments That Wasted Money Over Past Few Years . . . . 32
Figure 17: Performance on Cost Reduction Initiatives . . . . . . . . . . . . . . . 33
January 2014 | Industry Survey 2014: Forging Healthcare’s New Financial Foundation page 5TOC
Click here to learn more and order the pReMIUM eDITION with actionable strategies and further segmentation
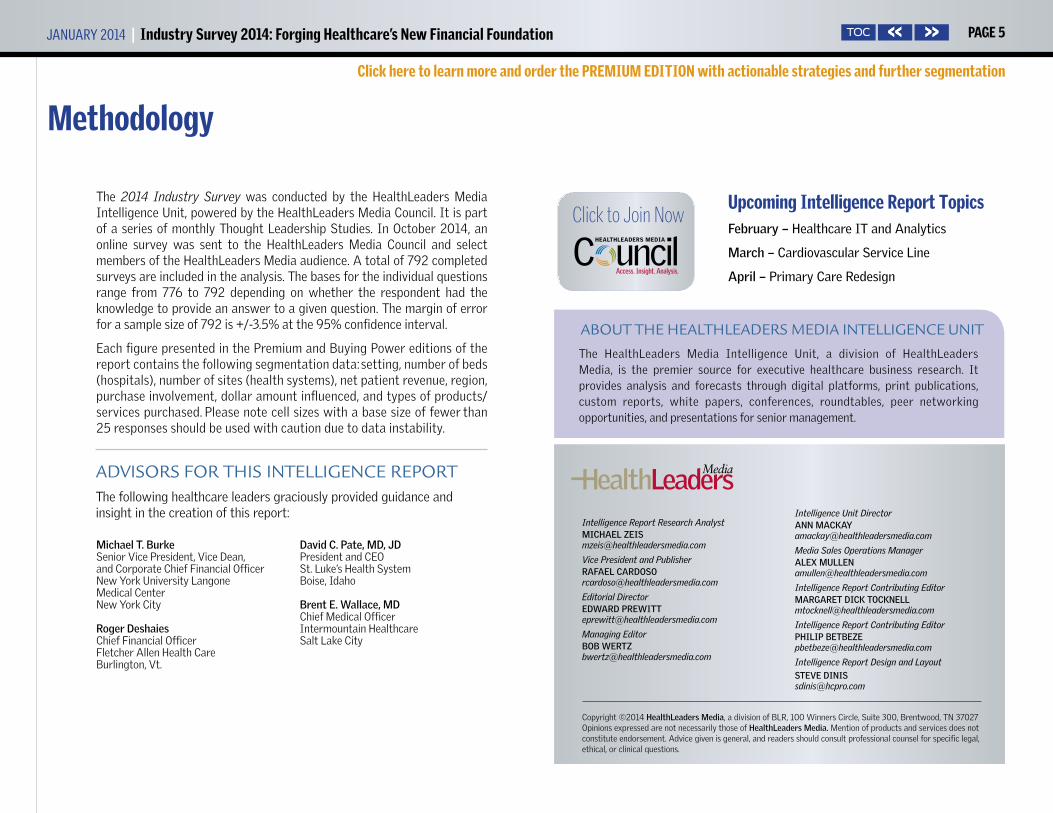
Methodology
The 2014 Industry Survey was conducted by the HealthLeaders Media Intelligence Unit, powered by the HealthLeaders Media Council. It is part of a series of monthly Thought Leadership Studies. In October 2014, an online survey was sent to the HealthLeaders Media Council and select members of the HealthLeaders Media audience. A total of 792 completed surveys are included in the analysis. The bases for the individual questions range from 776 to 792 depending on whether the respondent had the knowledge to provide an answer to a given question. The margin of error for a sample size of 792 is +/-3.5% at the 95% confidence interval.
Each figure presented in the Premium and Buying Power editions of the report contains the following segmentation data: setting, number of beds (hospitals), number of sites (health systems), net patient revenue, region, purchase involvement, dollar amount influenced, and types of products/services purchased. Please note cell sizes with a base size of fewer than 25 responses should be used with caution due to data instability.
Upcoming Intelligence Report TopicsFebruary – HealthcareITandAnalytics
March – CardiovascularServiceLine
April – PrimaryCareRedesign
advisors for tHis intelligence reportThe following healthcare leaders graciously provided guidance and insight in the creation of this report:
C uncilHEALTHLEADERS MEDIA
Access. Insight. Analysis.
Click to Join Now
Michael T. Burke Senior Vice President, Vice Dean, and Corporate Chief Financial OfficerNew York University Langone Medical CenterNew York City
Roger DeshaiesChief Financial OfficerFletcher Allen Health CareBurlington, Vt.
David C. Pate, MD, JDPresident and CEO St. Luke’s Health System Boise, Idaho
Brent E. Wallace, MDChief Medical OfficerIntermountain HealthcareSalt Lake City
about tHe HealtHleaders Media intelligence unit
The HealthLeaders Media Intelligence Unit, a division of HealthLeaders Media, is the premier source for executive healthcare business research. It provides analysis and forecasts through digital platforms, print publications, custom reports, white papers, conferences, roundtables, peer networking opportunities, and presentations for senior management.
Intelligence Report Research Analyst MICHAEL ZEIS [email protected]
Vice President and PublisherRAFAEL [email protected]
Editorial Director EDWARD PREWITT [email protected]
Managing Editor BOB WERTZ [email protected]
Intelligence Unit Director ANN MACKAY [email protected]
Media Sales Operations Manager ALEX MULLEN [email protected]
Intelligence Report Contributing Editor MARgARET DICK [email protected]
Intelligence Report Contributing Editor PHILIP [email protected]
Intelligence Report Design and Layout STEvE [email protected]
Copyright ©2014 HealthLeaders Media, a division of BLR, 100 Winners Circle, Suite 300, Brentwood, TN 37027 Opinions expressed are not necessarily those of HealthLeaders Media. Mention of products and services does not constitute endorsement. Advice given is general, and readers should consult professional counsel for specific legal, ethical, or clinical questions.

January 2014 | Industry Survey 2014: Forging Healthcare’s New Financial Foundation page 6TOC
Click here to learn more and order the pReMIUM eDITION with actionable strategies and further segmentation
Respondent profileRespondents represent titles from across the various functional areas, including senior leaders, clinical
leaders, operations leaders, finance leaders, marketing leaders, and information leaders. They are from a
variety of healthcare provider organizations.
Title
0
10
20
30
40
50
2% Information leaders
21% Operations leaders
21% Clinical leaders
43%Senior leaders
Senior leaders | CEO, Administrator, Chief Operations Officer, Chief Medical Officer, Chief Financial Officer, Executive Dir., Partner, Board Member, Principal Owner, President, Chief of Staff, Chief Information Officer
Clinical leaders | Chief of Orthopedics, Chief of Radiology, Chief Nursing Officer, Dir. of Ambulatory Services, Dir. of Clinical Services, Dir. of Emergency Services, Dir. of Nursing, Dir. of Rehabilitation Services, Service Line Director, Dir. of Surgical/Perioperative Services, Medical Director, VP Clinical Informatics, VP Clinical Quality, VP Clinical Services, VP Medical Affairs (Physician Mgmt/MD)
Operations leaders | Chief Compliance Officer, Asst. Administrator, Dir. of Patient Safety, Dir. of Quality, Dir. of Safety, VP/Dir. Compliance, VP/Dir. Human Resources, VP/Dir. Operations/Administration, Other VP
Finance leaders | VP/Dir. Finance, HIM Director, Director of Case Management, Director of Revenue Cycle
Marketing leaders | VP/Dir. Marketing/Sales, VP/Dir. Media Relations
Information leaders | Chief Medical Information Officer, Chief Technology Officer, VP/Dir. Technology/MIS/IT
Base = 792
Base = 792
Type of organization
Hospital 39%
Health system 26%
Physician org. 13%
Long-term care/SNF 10%
Ancillary, allied provider 6%
Health plan/insurer 4%
Government, education/academic 3%
Base = 305 (Hospitals)
Number of beds
1–199 48%
200–499 33%
500+ 18%
Number of sites
Base = 203 (Health systems)
1–5 20%
6–20 29%
21+ 51%
8% Finance leaders
6% Marketing leaders
Number of physicians
Base = 101 (Physician orgs)
1–5 18%
6–20 31%
21+ 51%
January 2014 | Industry Survey 2014: Forging Healthcare’s New Financial Foundation page 7TOC
Click here to learn more and order the pReMIUM eDITION with actionable strategies and further segmentation
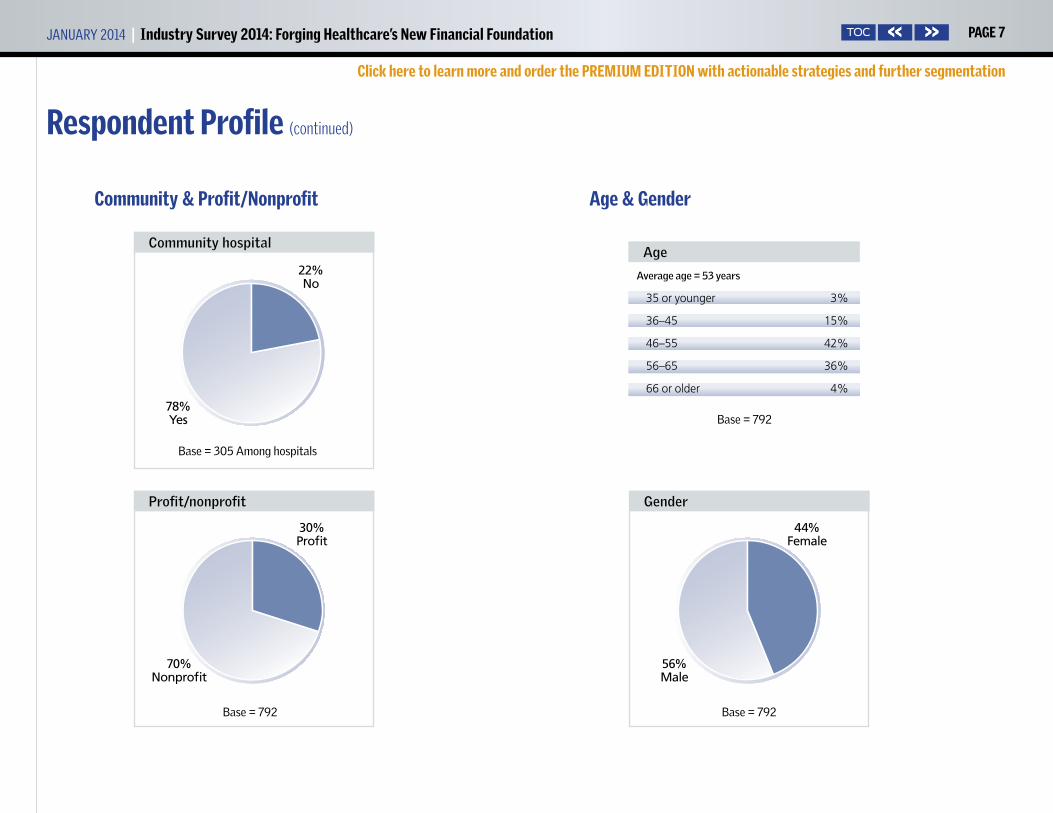
Respondent profile (continued)
Community & profit/Nonprofit age & gender
Average age = 53 years
Age
35 or younger 3%
36–45 15%
46–55 42%
56–65 36%
66 or older 4%
30%Profit
70% Nonprofit
Profit/nonprofit
Base=792
22%No
78% Yes
Community hospital
Base=305Amonghospitals
44%Female
56% Male
gender
Base=792
Base=792
January 2014 | Industry Survey 2014: Forging Healthcare’s New Financial Foundation page 8TOC
Click here to learn more and order the pReMIUM eDITION with actionable strategies and further segmentation
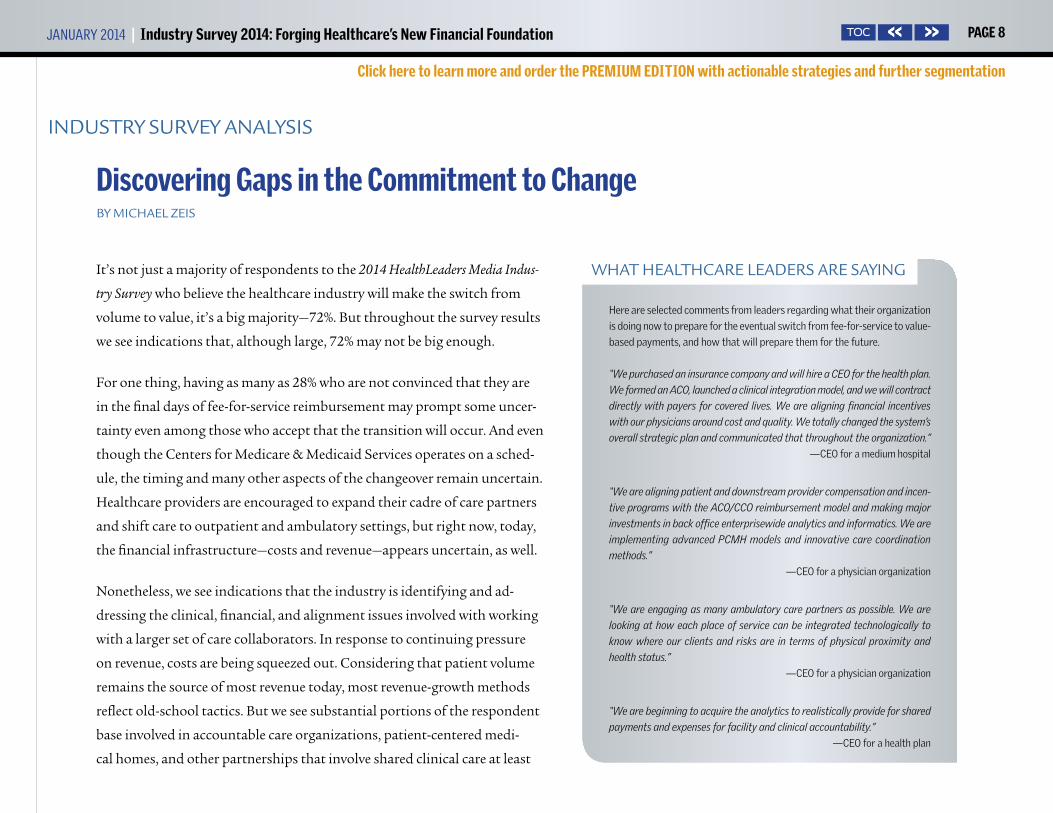
It’s not just a majority of respondents to the 2014 HealthLeaders Media Indus-
try Survey who believe the healthcare industry will make the switch from
volume to value, it’s a big majority—72%. But throughout the survey results
we see indications that, although large, 72% may not be big enough.
For one thing, having as many as 28% who are not convinced that they are
in the final days of fee-for-service reimbursement may prompt some uncer-
tainty even among those who accept that the transition will occur. And even
though the Centers for Medicare & Medicaid Services operates on a sched-
ule, the timing and many other aspects of the changeover remain uncertain.
Healthcare providers are encouraged to expand their cadre of care partners
and shift care to outpatient and ambulatory settings, but right now, today,
the financial infrastructure—costs and revenue—appears uncertain, as well.
Nonetheless, we see indications that the industry is identifying and ad-
dressing the clinical, financial, and alignment issues involved with working
with a larger set of care collaborators. In response to continuing pressure
on revenue, costs are being squeezed out. Considering that patient volume
remains the source of most revenue today, most revenue-growth methods
reflect old-school tactics. But we see substantial portions of the respondent
base involved in accountable care organizations, patient-centered medi-
cal homes, and other partnerships that involve shared clinical care at least
Here are selected comments from leaders regarding what their organization
is doing now to prepare for the eventual switch from fee-for-service to value-
based payments, and how that will prepare them for the future.
“We purchased an insurance company and will hire a CEO for the health plan.
We formed an ACO, launched a clinical integration model, and we will contract
directly with payers for covered lives. We are aligning financial incentives
with our physicians around cost and quality. We totally changed the system’s
overall strategic plan and communicated that throughout the organization.”
—CEO for a medium hospital
“We are aligning patient and downstream provider compensation and incen-
tive programs with the ACO/CCO reimbursement model and making major
investments in back office enterprisewide analytics and informatics. We are
implementing advanced PCMH models and innovative care coordination
methods.”
—CEO for a physician organization
“We are engaging as many ambulatory care partners as possible. We are
looking at how each place of service can be integrated technologically to
know where our clients and risks are in terms of physical proximity and
health status.”
—CEO for a physician organization
“We are beginning to acquire the analytics to realistically provide for shared
payments and expenses for facility and clinical accountability.”
—CEO for a health plan
WHat HealtHcare leaders are saying
industry survey analysis
Discovering gaps in the Commitment to Change by MicHael Zeis
January 2014 | Industry Survey 2014: Forging Healthcare’s New Financial Foundation page 9TOC
Click here to learn more and order the pReMIUM eDITION with actionable strategies and further segmentation
and, for some, shared cost or revenue as well. Despite this uncertainty, the
healthcare industry is moving toward a new financial foundation.
Quality monitoring along the care continuum. A principal mechanism
for changing the economics of delivering healthcare is to shift care from
the hospital environment to outpatient and ambulatory settings. For
many, expanding the continuum of care brings concern about monitor-
ing quality. More than one-quarter (27%) say that monitoring quality
along the care continuum is their single greatest clinical quality improve-
ment challenge. With more care providers involved, there are more hand-
offs, which may be one reason that monitoring is becoming more impor-
tant. Says advisor Roger Deshaies, chief financial officer for Fletcher Allen
Health Care, a 562-licensed-bed academic and university medical center
with 30 care sites and 100 outreach clinics and programs in Vermont and
upstate New York, “As you refer patients down the line, there are a lot of
reasons for those handoffs not to work well. It’s only recently that we’ve
had access to clinical information outside of our own four walls. Before
that, it was almost as if patients entered a black box, unless they were
referred for treatment within your health system.”
David C. Pate, MD, JD, president and CEO of St. Luke’s Health System, a
not-for-profit health system operating seven hospitals and more than 100
clinics in Idaho, notes that the industry appears to show a degree of comfort
with monitoring quality internally, but not necessarily externally. Some of
the tools that support quality monitoring and quality improvement appear
farther down on the list of qual-
ity improvement challenges—15%
call clinical analytics their single
greatest challenge, while 13% are
challenged by EHRs and 8% by
clinical decision support. Says
Pate, “You would think that if you
had electronic health records that
were integrated along the care
continuum … you would be pretty
well prepared to monitor quality.
The higher percentage for care-
continuum monitoring suggests to
me that providers still see the care
continuum as very fragmented. I think they’re right.”
Physicians needed to drive transformation. Survey results show that
leaders understand the relationship between providing coordinated care
and earning positive financial performance. Care models, including popu-
lation health, are included by 40% among the areas that need improvement
in order to reach financial targets, and are positioned near the top of the
chart with more traditional areas such as physician-hospital alignment
(44%), cost reduction (41%), and reimbursement (39%).
Survey results point to possible sources of friction as new work methods
analysis (continued)
“As you refer patients down the line, there are a lot of reasons for those handoffs not to work well. It’s only recently that we’ve had access to clinical information outside of our own four walls.”
—Roger Deshaies, chief financial officer for Fletcher Allen Health
Care in Burlington, Vt.

January 2014 | Industry Survey 2014: Forging Healthcare’s New Financial Foundation page 10TOC
Click here to learn more and order the pReMIUM eDITION with actionable strategies and further segmentation
propagate. Nearly two-thirds of respondents (63%) characterize their nurs-
ing staff as very strong or strong, while only 54% say their physician staff
is very strong or strong. Brent E. Wallace, MD, chief medical officer for
Intermountain Healthcare, a Salt Lake City–based network that includes
22 hospitals, a medical group with more than 185 physician clinics, an
affiliated health insurance company, and more than 33,000 employees,
suggests that physician autonomy might be contributing to the difference
in readings.
“As physicians, we have been taught in our training that we should be
independent and make all the right decisions,” Wallace says. “Nurses may
have more of the perspective that they need to provide care the way the
system says they should. Considering that cultural difference, we have to
ask whether physicians are really aligned with what the hospital needs
to accomplish.” In addition to being asked to support the organization’s
approach to healthcare, physicians must abide by dictates from various
regulatory bodies, decrees that often are communicated through the same
channels as hospital strategies are. “There are so many regulations that
come at us,” Wallace notes. “Even though we may intellectually under-
stand that the directives are from the CMS or The Joint Commission, the
perception may be that the hospital is making us do it.”
Attack waste. While organizations are positioning themselves to take on
risk and manage populations in the future, the need to respond to cur-
rent and compelling revenue pressures requires that leaders approach cost
containment today with renewed
vigor, and in new ways. “Attack-
ing waste is the best advice for
cost control, and process variation
is probably the largest source of
waste within any given hospital,”
says Wallace.
Four-fifths (81%) include expense
reduction via process improve-
ment among the top three meth-
ods for cost control over the next
year. Michael T. Burke, senior vice president, vice dean, and corporate
CFO of the New York University Langone Medical Center, a 1,069-bed
health system with four hospitals in New York City and ambulatory
services in New York City, Long Island, New Jersey, and Westchester, Put-
nam, and Dutchess counties, cautions that efficiencies gained through
continuous improvement techniques such as Lean can be lost if leaders
don’t follow through.
“Six months from now you have to spend less than you are spending today,
and Lean doesn’t help you do that,” Burke says. “Lean eliminates the unnec-
essary and eliminates variation. Then you as management have to adjust to
the new lower level of activity and reduce the level of resources. If you don’t
have a variable staffing model that does that, it will never happen.”
analysis (continued)
“Providers still see the care continuum as very fragmented. I think they’re right.”
—David C. Pate, MD, JD, president and CEO of St. Luke’s Health
System in Boise, Idaho

January 2014 | Industry Survey 2014: Forging Healthcare’s New Financial Foundation page 11TOC
Click here to learn more and order the pReMIUM eDITION with actionable strategies and further segmentation
For some of our respondents, sufficient savings never materialized: one-
fifth (21%) said that continuous improvement techniques such as Lean
have largely been a waste of money.
EHR: Friend or foe? Topping the list of investments that healthcare lead-
ers describe as largely a waste of money is the electronic health record, with
27% overall saying their investment was largely a waste. How can this be, in
light of the efficiencies the EHR was supposed to foster? Burke, an advisor
for this intelligence report, suggests that the need to integrate data may be
the culprit, causing many to have to start over.
“A lot of people have put in an electronic medical record only to find they
have to replace it with something that really works,” Burke says. NYU
replaced an early EHR with a robust system that includes an integrated
clinical and billing system that covers inpatient and outpatient services
and provides an ambulatory record as well. “It’s everything all together, all
in one,” Burke says.
At NYU, Burke says, the comprehensive EHR gave them command over
the services the organization delivers and is saving money. “We have lower
malpractice premiums, we have fewer missing and lost charges, and we
have more robust clinical activity tracking. We have improved our coding
so we are more completely documenting our cases, which results in more
complete billing for our services.
So we’ve been able to improve our
reimbursements. It’s a huge im-
provement, way more than what I
originally thought it would be.”
Care collaboration: patient care
today, finances tomorrow. Al-
though care collaboration is hardly
a new concept, survey results show
that not all are ready to take on
the emerging requirement to share
data and share risk. With 89% say-
ing they see opportunity in the clinical aspects of care continuum relation-
ships, leaders show that they are reasonably comfortable providing care
through care partners. However, only 66% say they see opportunity in the
financial aspects of the care continuum, and 13% say they view the finan-
cial aspects of the care continuum as an outright threat.
Wallace, who served as lead advisor for the 2014 HealthLeaders Media Indus-
try Survey, helps us understand that organizations that find opportunity
in the clinical aspects of coordinated care are probably obtaining benefits
from such relationships here and now. “People may be saying, ‘If I have a
analysis (continued)
“Attacking waste is the best advice for cost control, and process variation is probably the largest source of waste within any given hospital.”
—Brent E. Wallace, MD, chief medical officer for Intermountain
Healthcare in Salt Lake City
January 2014 | Industry Survey 2014: Forging Healthcare’s New Financial Foundation page 12TOC
Click here to learn more and order the pReMIUM eDITION with actionable strategies and further segmentation
clinical relationship, that’s helping me today with readmission penalties
and so forth.’ ”
The financial aspects of care collaboration involve sharing revenue, sharing
expenses, or both. Bundled payments of one kind or another are likely to
be part of collaborative relationships in the future. Our survey results re-
veal that those who consider themselves strong at payment bundling are in
the minority—only 21%. Slightly more say they are weak (23%), while most
(38%) report they are neutral. The tally seems to indicate a lack of readiness
to, indeed, break from fee-for-service, take on risk, and enter results-based
financial arrangements with care partners.
Wallace looks at the tactics leaders expect to use to foster financial growth
over the next five years and sees an industry steeped in conventional
practices. “We have a significant portion of leaders [72%] who say, yes, the
industry will make the switch to value-based payment. Then when they
are asked how they are going to grow financially, look at what they’re do-
ing. They’re expanding outpatient services [60%], marketing to existing
markets [59%], and directing marketing campaigns at new markets [41%].
Everything that’s listed on top of the chart is in the old paradigm, at the
time we’re moving toward a new paradigm.” By comparison, only 38% say
they expect to develop or join an ACO or PCMH, which are seen by many
to be early steps toward population
health management. Says Wallace,
“That’s a dichotomy that leader-
ship across healthcare is caught in.
It appears that leadership doesn’t
know how to deal with it.”
Strive for scale, but pay close
attention to alignment. The
direction of the industry is to
emphasize keeping people healthy
rather than caring for them when
they are ill, and that basic but
important change in perspective
drives many healthcare business decisions. As an early strategy, healthcare
organizations recognize the need to expand their reach beyond the acute
care setting. There are many ways to accomplish this, and virtually all of
them lead organizations to recognize the need to adopt a risk-based pay-
ment model as a component of a broader strategy of leading to population
health management.
Fletcher Allen’s Deshaies, an advisor for this report, explains how scale is
analysis (continued)
“Six months from now you have to spend less than you are spending today, and Lean doesn’t help you do that.”
—Michael T. Burke, senior vice president,
vice dean, and corporate CFO of the New York University
Langone Medical Center

January 2014 | Industry Survey 2014: Forging Healthcare’s New Financial Foundation page 13TOC
Click here to learn more and order the pReMIUM eDITION with actionable strategies and further segmentation
an asset when approaching population health management. “We’re going
to be looking at an industry that’s going to consolidate much more than
we ever expected. That’s going to be driven by the scale you have to bring to
the table to be successful in managing populations.”
While mergers, acquisitions, and partnerships increase the number of
covered lives and provide scale, they also can present challenges in physi-
cian alignment, clinical integration, and care coordination. As important
as it is, care coordination is not seen to be a particular strength by survey
respondents, with only 10% saying they are very strong. Burke observes
that the nature of new work arrangements can either foster or thwart coor-
dinated care.
“Care coordination is really about standardization of care, using standard-
ized quality indicators, and using standard protocols. Some health sys-
tems have not done well because they’ve come together as loosely affiliated
networks as opposed to in a clinically integrated delivery system,” Burke
says. “The more autonomy you allow and the more that you allow people
to deviate from best practices, the more difficult it will be to have consis-
tent results.”
Regardless of the contractual arrangement, leaders should establish strate-
gies and tactics that align new team members and integrate new organiza-
tions in ways that support providing standardized care and fence in care
providers’ innate desire for autonomy.
Burke also suggests that au-
tonomy might be complicating
the pursuit of population health
management—one-third of re-
spondents (32%) say they are weak
or very weak at population health
management, and 25% say they
are weak or very weak at clinical
analytics.
“It’s going to be hard for you to
manage populations if you don’t
have an academic bent toward
the analytics required and if you don’t have access to bioinformatics and
other data that allows you to look at outcomes in a robust way with a very
robust database,” Burke says. “It is also difficult if you’re a disparate pro-
vider with disparate hospitals joining your network, all maintaining some
level of autonomy on clinical practice because of the independent nature
of the physicians.”
So scale may be a requirement for participation in healthcare in the future.
But the work is not over when the papers are signed, because an environ-
ment must be fostered to ensure that clinical integration, physician align-
ment, and care coordination help the enterprise rather than hurt it.
“A lot of people have put in an electronic medical record only to find they have to replace it with something that really works.”
—Michael T. Burke, senior vice president, vice dean, and corporate
CFO of the New York University Langone Medical Center
analysis (continued)

January 2014 | Industry Survey 2014: Forging Healthcare’s New Financial Foundation page 14TOC
Click here to learn more and order the pReMIUM eDITION with actionable strategies and further segmentation
There are indications in the survey results that some organizations should
begin their examination of alignment with the board and top leaders. Pate,
of St. Luke’s Health System and an advisor for this intelligence report, gets
little reassurance by observing that 72% of respondents say the perfor-
mance of their leadership team is strong or very strong.
“At a time of transformation, we’ve got to have really strong leaders,” he
says. “When we see 72% of leaders described as strong or very strong, that
basically says that one in four leadership teams are merely okay or they’re
not particularly strong. How are you going to make the transition from
volume to value if you don’t have strong leadership?”
Noting that only 59% say the performance of their boards is strong or very
strong, Pate adds, “How many of these are situations where you have both a
weak board and a weak leadership team? That is just a recipe for disaster.”
In a similar vein, Pate sees a problem with the percentage of respondents
who say they are dissatisfied with their jobs (8%) or are neutral about job
satisfaction (14%). “This is an incredibly exciting time to be leading health-
care,” Pate says, “because we can actually make a lot of changes right now
that could affect the future for the better. But 22% of people are either kind
of ‘meh,’ or they’re not happy. If you’ve got some leaders in organizations
who aren’t happy or aren’t very satisfied, what’s that doing to the teams
that they lead?”
Only 72% expect the shift from
volume to value. Nearly three-
quarters of respondents (72%) say
the industry will make the shift
from volume to value, clearly a ma-
jority, but nonetheless a percent-
age that leaves advisors perplexed
because 72% may be too small. St.
Luke’s Pate notes that today, an
organization’s strategic direction
pivots on its perspective on the
viability or lack of viability of the
current fee-for-service model.
“An important driver of what orga-
nizations are doing is whether they
think the current model is sustainable,” Pate says. “Transformation is just
too hard, so why do it if you don’t need to?”
Intermountain’s Wallace reminds us that survival is part of the motivation
behind the industry’s current focus on cost containment and establishing
partnerships.
“If you’re going to take significant cost out of the system,” he says, “some-
body’s income has got to go. As an industry, we’re looking at how all of the
“We’re going to be looking at an industry that’s going to consolidate much more than we ever expected. That’s going to be driven by the scale you have to bring to the table to be successful in managing populations.”
—Roger Deshaies, chief financial officer for Fletcher Allen Health
Care in Burlington, Vt.
analysis (continued)
January 2014 | Industry Survey 2014: Forging Healthcare’s New Financial Foundation page 15TOC
Click here to learn more and order the pReMIUM eDITION with actionable strategies and further segmentation
pieces fit together. As we move into the future, what are the roles of insur-
ers? What are the roles of hospitals? What are the roles of physicians? What
are the roles of nurse practitioners, physician assistants? We’re not going
to all fit in the same place on the puzzle as we have in the past.”
“I can’t read the tea leaves,” says Wallace about how most accept that the
healthcare industry is shifting away from volume-based reimbursements,
but few are comfortable predicting when and at what scale. So the industry
continues to have, as they say, one foot on the boat and one foot on the dock.
Our research underscores the industry’s dilemma. Strategies, tactics, and
skills that address the new emphasis on collaborative care and population
health show up near the top of charts having to do with future investment
areas, for instance, but appear near the middle or the bottom on charts
covering areas of strength.
Take data analytics, for example, a set of tools that can support the com-
plicated decisions that must be made to support delivering collaborative
care and addressing population health management. The 2014 HealthLead-
ers Media Industry Survey found that more than half (54%) include data
analytics among the areas they expect to invest in over the next three years,
second only to patient experience on the list of future investments. Yet
fully 25% characterize their data analytics staff as weak or very weak, plac-
ing data analytics at the bottom of the chart, with the largest “weakness”
score by far.
While our reading of the pulse of the industry may suggest a degree of
reluctance to leave the old and embrace the new, it also is clear that the
lack of a clear schedule should not prevent us from taking steps that will
provide exposure to the tools and tactics needed to thrive in the new envi-
ronment.
Michael Zeis is research analyst for HealthLeaders Media. He may
be contacted at [email protected].
analysis (continued)

January 2014 | Industry Survey 2014: Forging Healthcare’s New Financial Foundation page 16TOC
FIGURE 1 | Current State of the Healthcare Industry
Q | Overall, how do you assess the current state of the healthcare industry?
PREMIUM REPORT SAMPLE CHART Click here to order!
DATA SEGMENTATION TOOL. CLICk ON THESE ICONS TO DIG DEEPER

January 2014 | Industry Survey 2014: Forging Healthcare’s New Financial Foundation page 17TOC
Click here to learn more and order the pReMIUM eDITION with actionable strategies and further segmentation
FIGURE 2 | Current State of Organization
Q | Overall, how do you assess the current state of your own organization?

January 2014 | Industry Survey 2014: Forging Healthcare’s New Financial Foundation page 18TOC
Click here to learn more and order the pReMIUM eDITION with actionable strategies and further segmentation
FIGURE 3 | Top Three Improvement areas to Reach Financial Targets in Three Years
Q | Which are the top three areas your organization must improve or address in order to reach your financial targets in the three-year time frame?
January 2014 | Industry Survey 2014: Forging Healthcare’s New Financial Foundation page 19TOC
Click here to learn more and order the pReMIUM eDITION with actionable strategies and further segmentation
FIGURE 4 | Threats
Q | Does your organization consider each of the following to be a threat?

January 2014 | Industry Survey 2014: Forging Healthcare’s New Financial Foundation page 20TOC
Click here to learn more and order the pReMIUM eDITION with actionable strategies and further segmentation
FIGURE 5 | Opportunities
Q | Does your organization consider each of the following to be an opportunity?
January 2014 | Industry Survey 2014: Forging Healthcare’s New Financial Foundation page 21TOC
Click here to learn more and order the pReMIUM eDITION with actionable strategies and further segmentation
FIGURE 6 | Switch From Volume to Value
Q | Do you believe the healthcare industry will make the switch from volume to value?

January 2014 | Industry Survey 2014: Forging Healthcare’s New Financial Foundation page 22TOC
Click here to learn more and order the pReMIUM eDITION with actionable strategies and further segmentation
FIGURE 7 | greatest Clinical Quality Improvement Challenge
Q | Regarding clinical quality improvement, which of the following areas represents the single greatest challenge for your organization?

January 2014 | Industry Survey 2014: Forging Healthcare’s New Financial Foundation page 23TOC
Click here to learn more and order the pReMIUM eDITION with actionable strategies and further segmentation
FIGURE 8 | Top Three Focus areas Next Year to Control Cost
Q | What are the top three areas you will focus on next year to control costs?

January 2014 | Industry Survey 2014: Forging Healthcare’s New Financial Foundation page 24TOC
Click here to learn more and order the pReMIUM eDITION with actionable strategies and further segmentation
FIGURE 9 | Job Satisfaction
Q | Describe your overall job satisfaction.

January 2014 | Industry Survey 2014: Forging Healthcare’s New Financial Foundation page 25TOC
Click here to learn more and order the pReMIUM eDITION with actionable strategies and further segmentation
FIGURE 10 | Overall performance for Various groups
Q | How would you rate the current overall performance of the following groups in your organization?

January 2014 | Industry Survey 2014: Forging Healthcare’s New Financial Foundation page 26TOC
Click here to learn more and order the pReMIUM eDITION with actionable strategies and further segmentation
FIGURE 11 | Overall performance for Various Functions
Q | How would you rate your organization’s current performance of the following functions?

January 2014 | Industry Survey 2014: Forging Healthcare’s New Financial Foundation page 27TOC
Click here to learn more and order the pReMIUM eDITION with actionable strategies and further segmentation
FIGURE 12 | performance for Various areas
Q | How would you rate your organization’s current performance in the following areas?

January 2014 | Industry Survey 2014: Forging Healthcare’s New Financial Foundation page 28TOC
FIGURE 13 | 2014 Financial Forecast
Q | What is your organization’s financial forecast for the 2014 fiscal year?
DATA SEGMENTATION TOOL. CLICk ON THESE ICONS TO DIG DEEPER
BUYING POWER REPORT SAMPLE CHARTS Click here to order!

January 2014 | Industry Survey 2014: Forging Healthcare’s New Financial Foundation page 29TOC
Indicates the type of goods or services the respondent is involved in purchasing
Indicates the role of the respondent in making purchasing decisions
Indicates the total dollar amount the respondent influences
FIGURE 13 (continued) | 2014 Financial Forecast
Q | What is your organization’s financial forecast for the 2014 fiscal year?
BUYING POWER REPORT SAMPLE CHARTS Click here to order!
Click on these icons to dig deeper
January 2014 | Industry Survey 2014: Forging Healthcare’s New Financial Foundation page 30TOC
Click here to learn more and order the pReMIUM eDITION with actionable strategies and further segmentation
FIGURE 14 | Fueling Financial growth Over the Next Five Years
Q | How will your organization fuel financial growth over the next five years?

January 2014 | Industry Survey 2014: Forging Healthcare’s New Financial Foundation page 31TOC
Click here to learn more and order the pReMIUM eDITION with actionable strategies and further segmentation
FIGURE 15 | Investments Over Next Three Years
Q | In which of the following areas does your organization expect to begin or increase investment over the next three years?

January 2014 | Industry Survey 2014: Forging Healthcare’s New Financial Foundation page 32TOC
Click here to learn more and order the pReMIUM eDITION with actionable strategies and further segmentation
FIGURE 16 | Investments That Wasted Money Over past Few Years
Q | When you reflect on your organization’s investment in the following over the past few years, which would you describe as largely a waste of money? Among those reporting waste

January 2014 | Industry Survey 2014: Forging Healthcare’s New Financial Foundation page 33TOC
Click here to learn more and order the pReMIUM eDITION with actionable strategies and further segmentation
FIGURE 17 | performance on Cost Reduction Initiatives
Q | How is your organization performing on each of the following?
➔
Join today at www.healthleadersmediacouncil.com
Be a voiceGain insight from your peersShape the direction of the industry
lC unci The nation’s most exclusive
healthcare intelligence community