Embed Size (px)
Citation preview
DIO Reference Aid 14−004
DEFENCE ECONOMIC TRENDSIN THE ASIA-PACIFIC
2014
D
EFENCE INTELLIGENCE ORGANISATION
DEFENCE INTELLIGENCE ORG
ANISATION

1
1
DEFENCE
ECONOMIC TRENDS
IN THE ASIA-PACIFIC
2014
DIO Reference Aid 14–004, April 2014
2
3
PREFACE ........................................................................................................................................ 5
SOUTH-EAST ASIA—REGIONAL OVERVIEW .................................................................................. 6
BRUNEI .......................................................................................................................................... 8
BURMA ........................................................................................................................................ 10
CAMBODIA .................................................................................................................................. 12
INDONESIA .................................................................................................................................. 14
LAOS ............................................................................................................................................ 16
MALAYSIA .................................................................................................................................... 18
PHILIPPINES ................................................................................................................................. 20
SINGAPORE ................................................................................................................................. 22
THAILAND .................................................................................................................................... 24
TIMOR-LESTE ............................................................................................................................... 26
VIETNAM ..................................................................................................................................... 28
SOUTH PACIFIC – REGIONAL OVERVIEW .................................................................................... 30
FIJI ............................................................................................................................................... 32
PAPUA NEW GUINEA .................................................................................................................. 34
TONGA ........................................................................................................................................ 36
NORTH ASIA – REGIONAL OVERVIEW ......................................................................................... 38
CHINA .......................................................................................................................................... 40
JAPAN .......................................................................................................................................... 42
NORTH KOREA ............................................................................................................................. 44
RUSSIA ......................................................................................................................................... 46
SOUTH KOREA ............................................................................................................................. 48
TAIWAN ....................................................................................................................................... 50
SOUTH ASIA – REGIONAL OVERVIEW ......................................................................................... 52
BANGLADESH .............................................................................................................................. 54
INDIA ........................................................................................................................................... 56
PAKISTAN .................................................................................................................................... 58
SRI LANKA.................................................................................................................................... 60
OTHER COUNTRIES – OVERVIEW ................................................................................................ 62
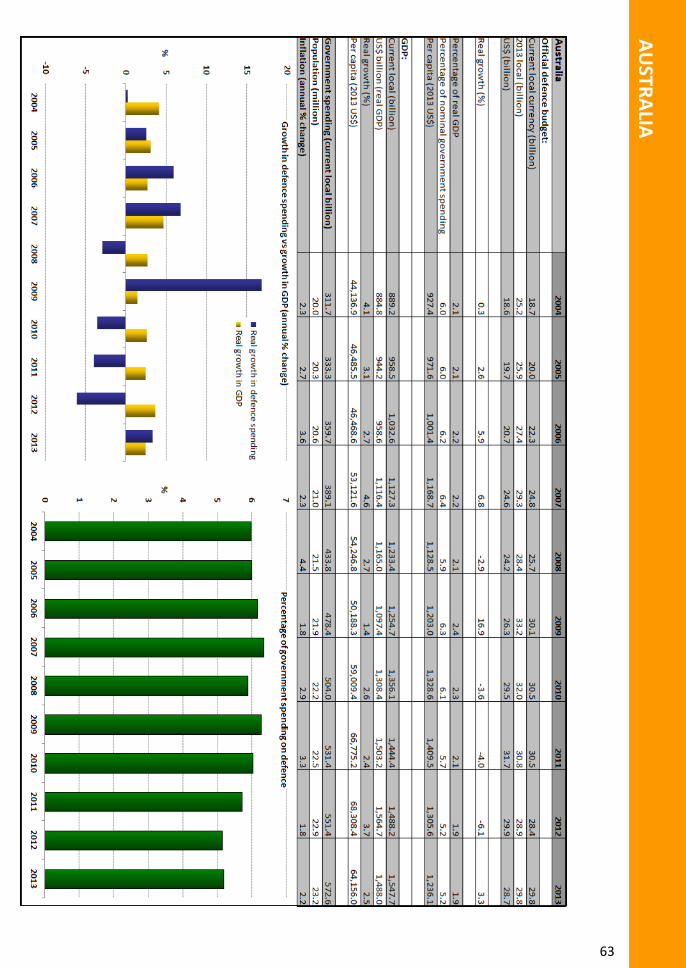
AUSTRALIA .................................................................................................................................. 63
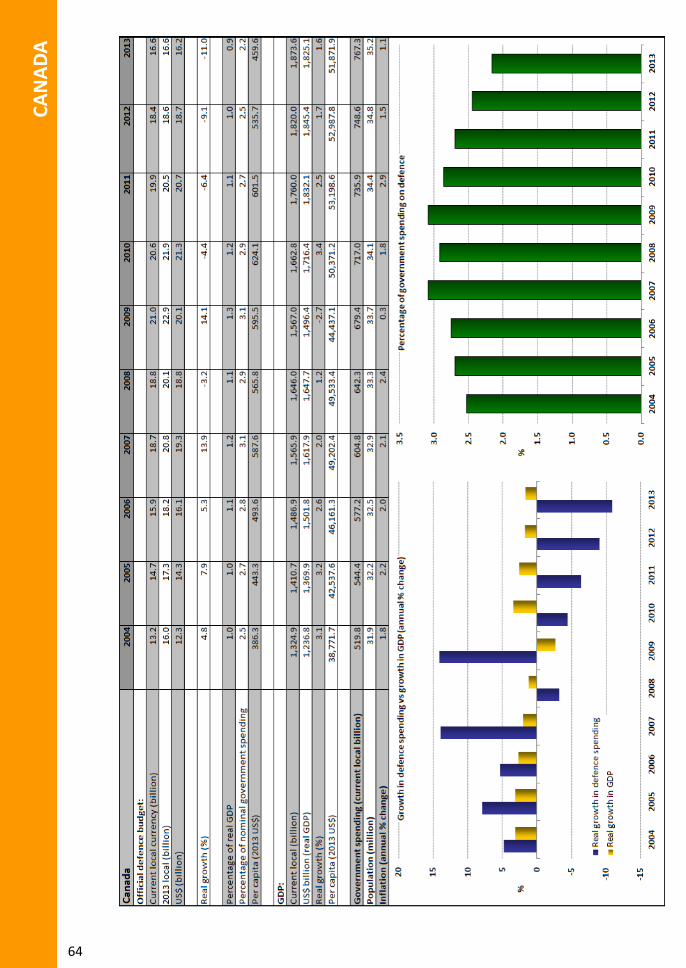
CANADA ...................................................................................................................................... 64
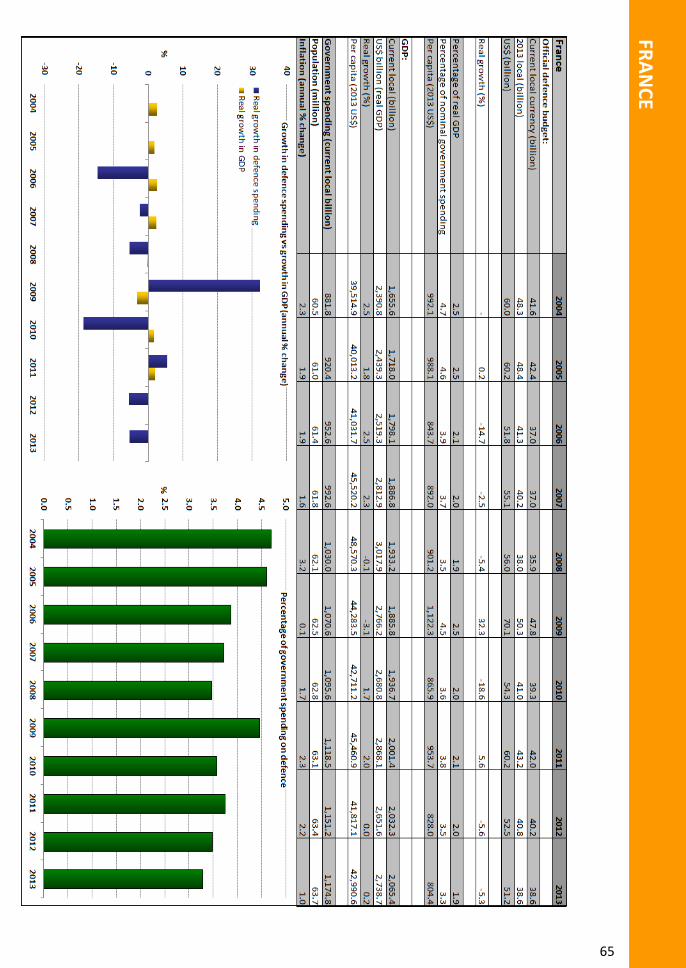
FRANCE ....................................................................................................................................... 65
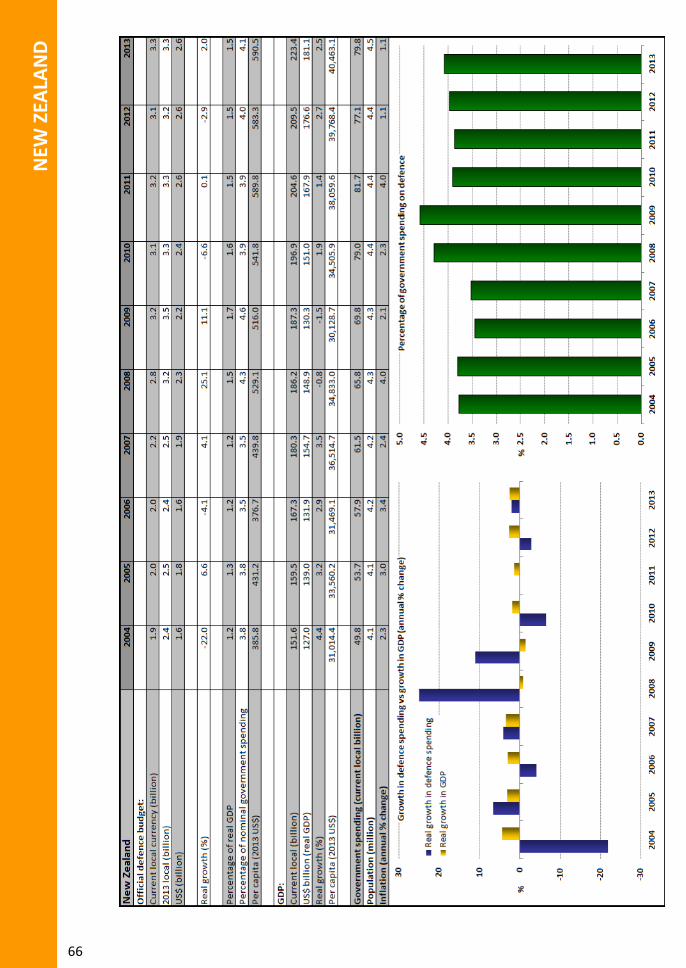
NEW ZEALAND ............................................................................................................................ 66
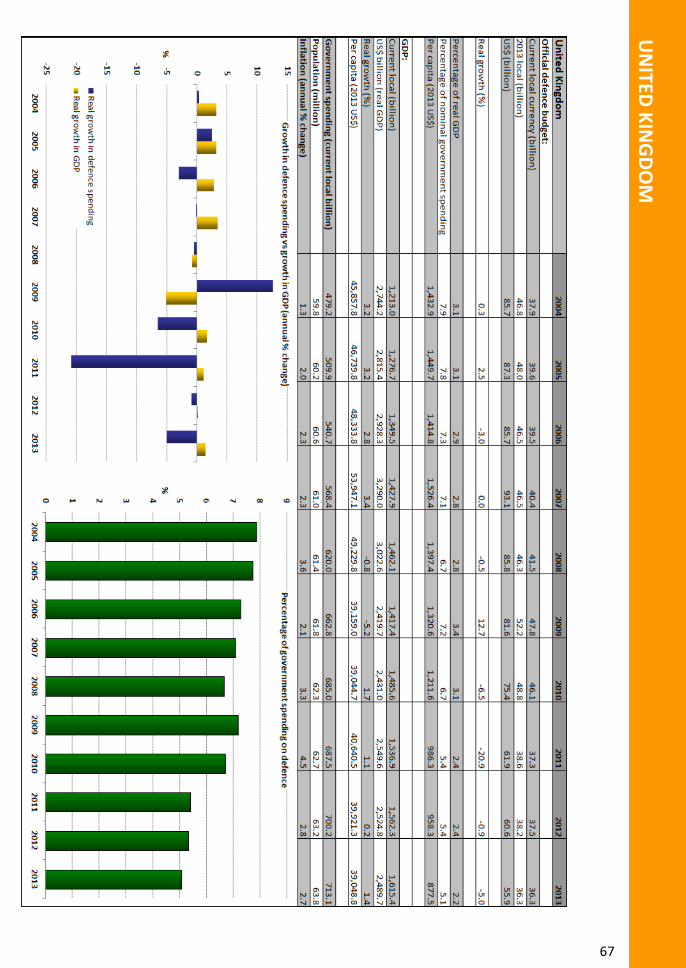
UNITED KINGDOM ...................................................................................................................... 67
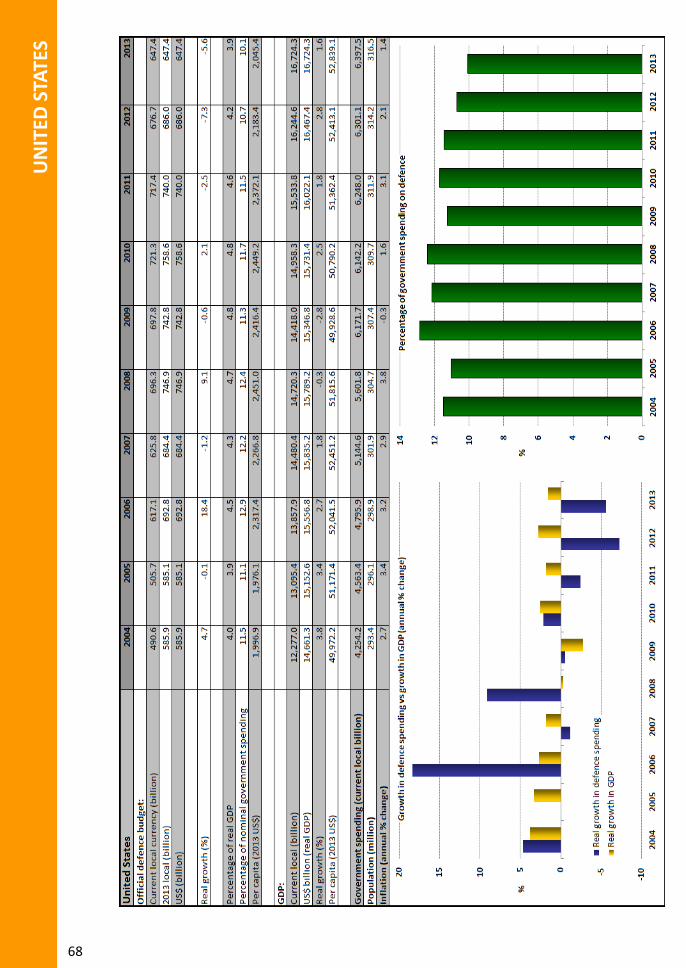
UNITED STATES ........................................................................................................................... 68
APPENDIX A: METHODOLOGY ..................................................................................................... 69
APPENDIX B: NOTES ON SOURCES .............................................................................................. 70
CONTENTS
4
PR
EFA
CE
INTENTIONALLY BLANK
5
PR
EFAC
E Purpose
The Defence Economic Trends analyses significant trends in defence funding in the Asia-Pacific region. It draws together official defence budgets and national economic data to illustrate trends over time. It also enables comparisons between individual countries or regions.
Abbreviations
bn billion
GDP gross domestic product
GEC global economic crisis
IMF International Monetary Fund
m million
tr trillion
UN United Nations
US United States
SOE state-owned enterprise
Online version
This publication is available online at the Department of Defence’s website: www.defence.gov.au/dio/publications.shtml
Feedback
We encourage readers to comment on this publication. Please email [email protected] with your comments, so we can improve subsequent editions.
If you have any questions in relation to Defence Economic Trends 2014 please contact us directly by phone or fax at:
Defence Intelligence Organisation
Telephone: +61 2 6127 5292
Facsimile: +61 2 6127 5086
6
SOU
TH-E
AST
ASI
A –
REG
ION
AL
OV
ERV
IEW
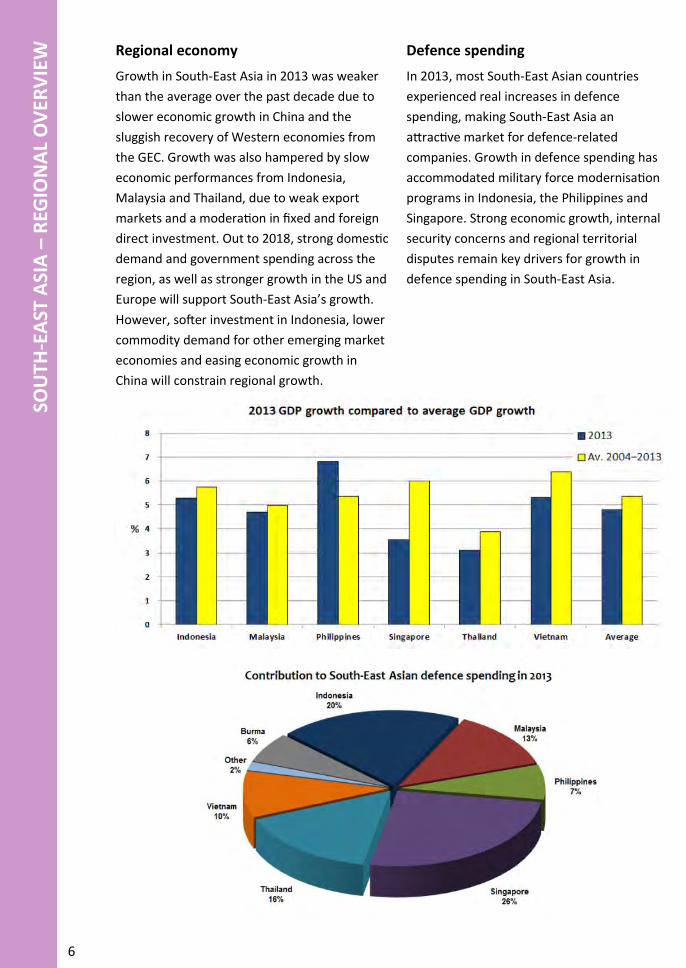
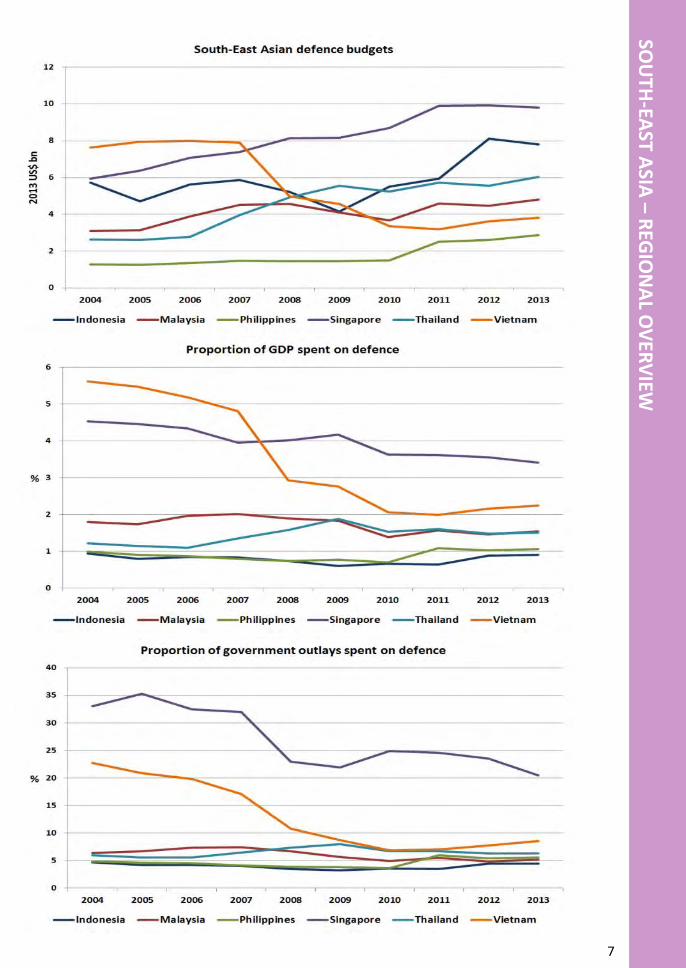
Regional economy
Growth in South-East Asia in 2013 was weaker
than the average over the past decade due to
slower economic growth in China and the
sluggish recovery of Western economies from
the GEC. Growth was also hampered by slow
economic performances from Indonesia,
Malaysia and Thailand, due to weak export
markets and a moderation in fixed and foreign
direct investment. Out to 2018, strong domestic
demand and government spending across the
region, as well as stronger growth in the US and
Europe will support South-East Asia’s growth.
However, softer investment in Indonesia, lower
commodity demand for other emerging market
economies and easing economic growth in
China will constrain regional growth.
Defence spending
In 2013, most South-East Asian countries
experienced real increases in defence
spending, making South-East Asia an
attractive market for defence-related
companies. Growth in defence spending has
accommodated military force modernisation
programs in Indonesia, the Philippines and
Singapore. Strong economic growth, internal
security concerns and regional territorial
disputes remain key drivers for growth in
defence spending in South-East Asia.
7
SOU
TH-EA
ST ASIA
– R
EGIO
NA
L OV
ERV
IEW
8
BR
UN
EI
9
BR
UN
EI
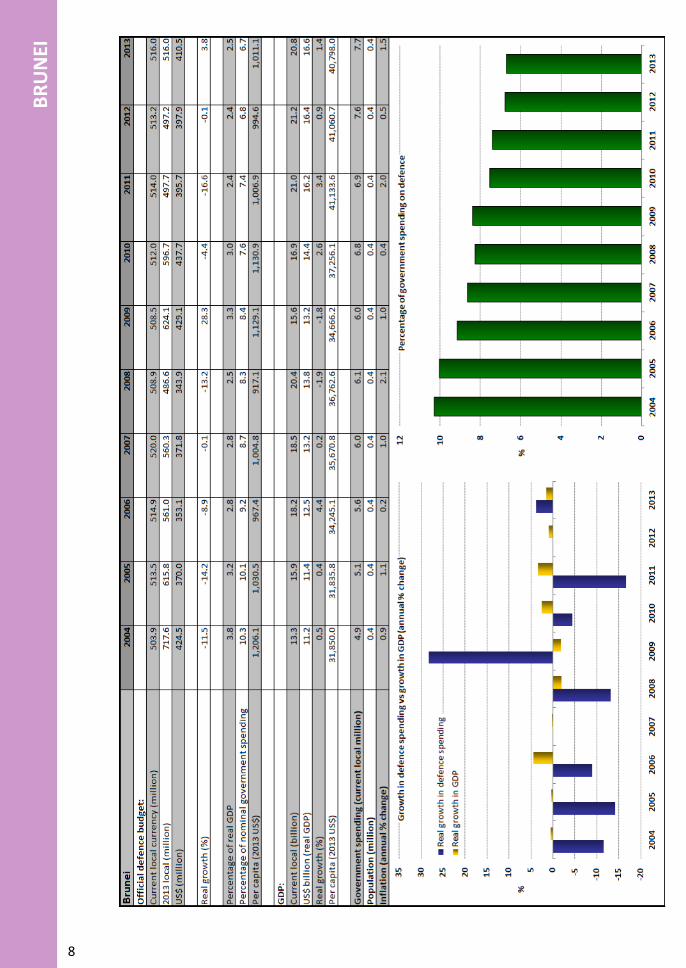
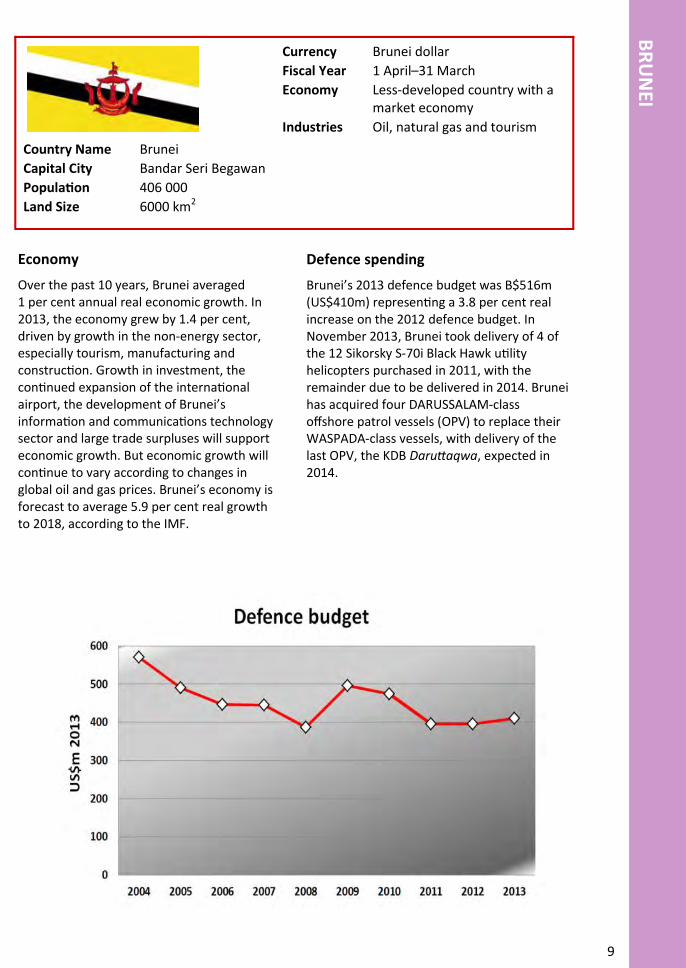
Economy
Over the past 10 years, Brunei averaged 1 per cent annual real economic growth. In 2013, the economy grew by 1.4 per cent, driven by growth in the non-energy sector, especially tourism, manufacturing and construction. Growth in investment, the continued expansion of the international airport, the development of Brunei’s information and communications technology sector and large trade surpluses will support economic growth. But economic growth will continue to vary according to changes in global oil and gas prices. Brunei’s economy is forecast to average 5.9 per cent real growth to 2018, according to the IMF.
Defence spending
Brunei’s 2013 defence budget was B$516m (US$410m) representing a 3.8 per cent real increase on the 2012 defence budget. In November 2013, Brunei took delivery of 4 of the 12 Sikorsky S-70i Black Hawk utility helicopters purchased in 2011, with the remainder due to be delivered in 2014. Brunei has acquired four DARUSSALAM-class offshore patrol vessels (OPV) to replace their WASPADA-class vessels, with delivery of the last OPV, the KDB Daruttaqwa, expected in 2014.
Country Name Brunei
Capital City Bandar Seri Begawan
Population 406 000
Land Size 6000 km2
Currency Brunei dollar
Fiscal Year 1 April–31 March
Economy Less-developed country with a market economy
Industries Oil, natural gas and tourism
10
BU
RM
A
INSUFFICIENT RELIABLE DATA AVAILABLE
11
BU
RM
A
Economy
Over the past 10 years, Burma averaged 8.5 per cent annual real economic growth. In 2013, the economy grew by 6.8 per cent, driven by strong growth in foreign direct investment, infrastructure investment, government expenditure and increased tourism from hosting the South-East Asian Games in December 2013. Increased investment in infrastructure, increased foreign direct investment and growth in the telecommunications sector will support economic growth over the next five years. But high inflation in conjunction with infrastructure and capacity constraints – including electricity shortages – will limit Burma’s growth potential. Burma’s economy is forecast to average 7 per cent real growth to 2018, according to the IMF.
Defence spending
Burma’s 2013 defence budget was K2.2tr (US$2.5bn), reported as a five per cent decrease on the 2012 defence budget. In 2009, Burma signed a contract for 20 MiG-29s with Rosoboronexport. At least four were due to be delivered by 2013. Under the same contract, Mi-35 HIND-E helicopters have been supplied to Burma and were in service by January 2013. Burma’s frigate construction program continues at the naval dockyard in Yangon. The frigate UMS Kyansittha was launched in September 2012, with plans to build additional vessels. Burma is also producing corvettes based on Chinese-supplied hulls.
Country Name Burma
Capital City Nay Pyi Taw
Population 65 million
Land Size 677 000 km2
Currency Kyat
Fiscal Year 1 April–31 March
Economy Less-developed country with a market economy
Industries Timber, gems, oil, natural gas, tourism and rice
12
CA
MB
OD
IA
13
CA
MB
OD
IA
Economy
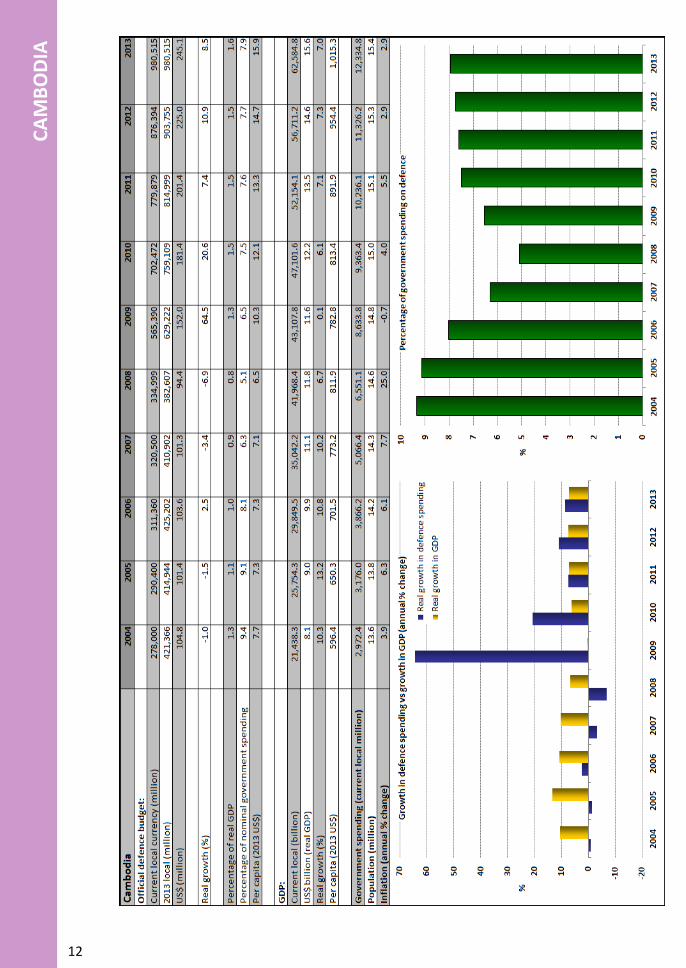
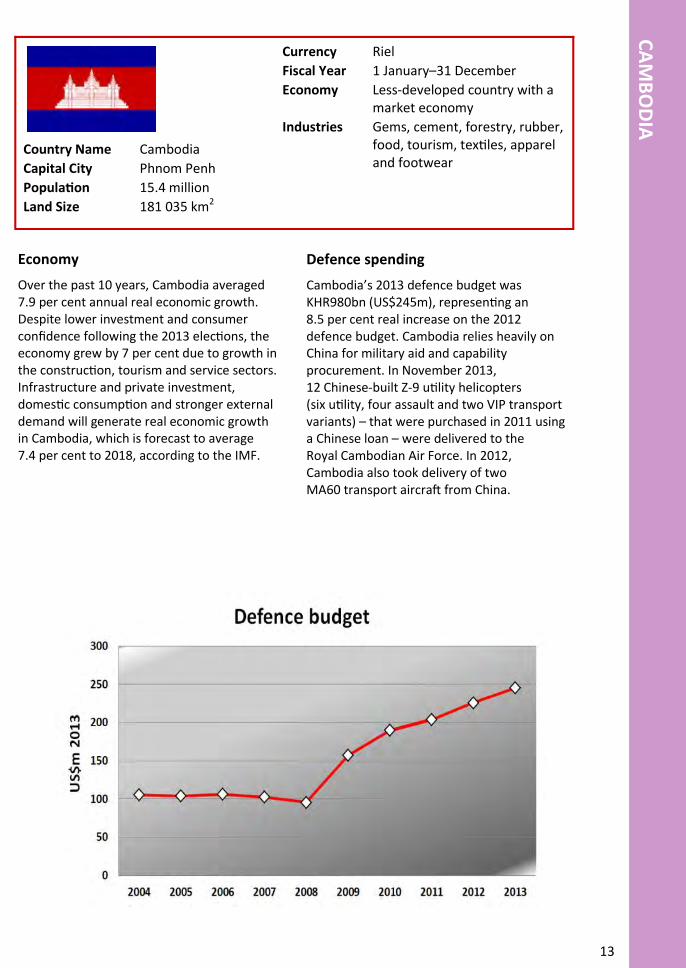
Over the past 10 years, Cambodia averaged 7.9 per cent annual real economic growth. Despite lower investment and consumer confidence following the 2013 elections, the economy grew by 7 per cent due to growth in the construction, tourism and service sectors. Infrastructure and private investment, domestic consumption and stronger external demand will generate real economic growth in Cambodia, which is forecast to average 7.4 per cent to 2018, according to the IMF.
Defence spending
Cambodia’s 2013 defence budget was KHR980bn (US$245m), representing an 8.5 per cent real increase on the 2012 defence budget. Cambodia relies heavily on China for military aid and capability procurement. In November 2013, 12 Chinese-built Z-9 utility helicopters (six utility, four assault and two VIP transport variants) – that were purchased in 2011 using a Chinese loan – were delivered to the Royal Cambodian Air Force. In 2012, Cambodia also took delivery of two MA60 transport aircraft from China.
Country Name Cambodia
Capital City Phnom Penh
Population 15.4 million
Land Size 181 035 km2
Currency Riel
Fiscal Year 1 January–31 December
Economy Less-developed country with a market economy
Industries Gems, cement, forestry, rubber, food, tourism, textiles, apparel and footwear
14
IND
ON
ESIA
15
IND
ON
ESIA
Economy
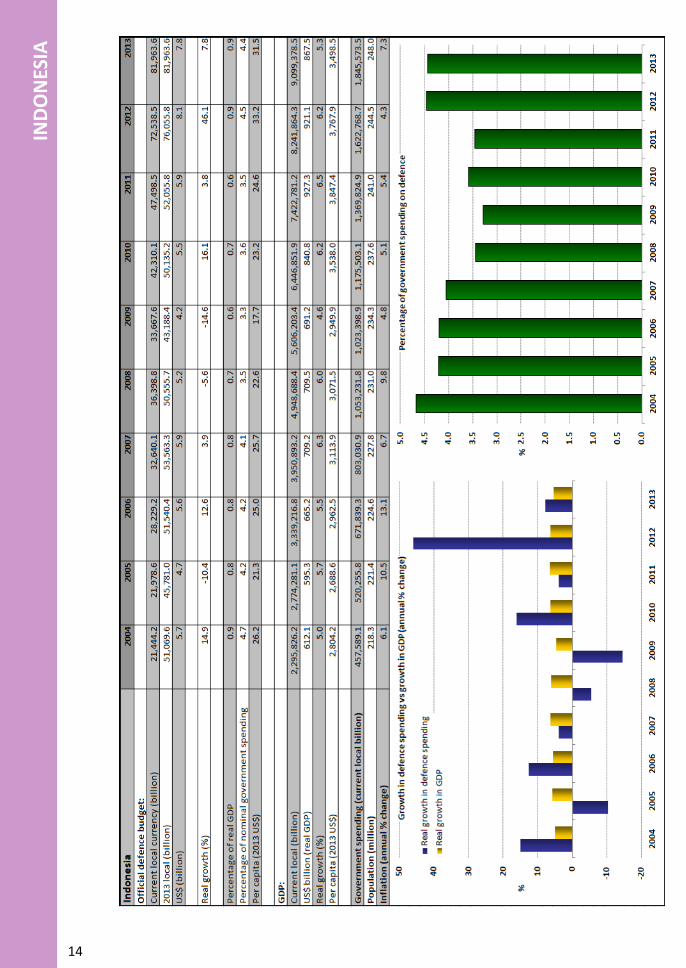
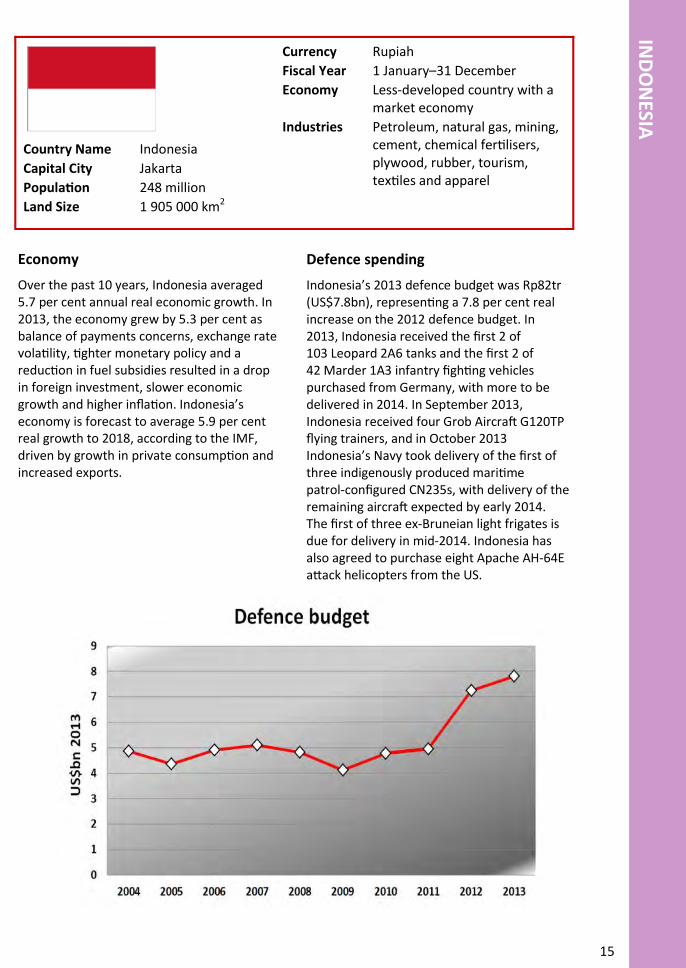
Over the past 10 years, Indonesia averaged 5.7 per cent annual real economic growth. In 2013, the economy grew by 5.3 per cent as balance of payments concerns, exchange rate volatility, tighter monetary policy and a reduction in fuel subsidies resulted in a drop in foreign investment, slower economic growth and higher inflation. Indonesia’s economy is forecast to average 5.9 per cent real growth to 2018, according to the IMF, driven by growth in private consumption and increased exports.
Defence spending
Indonesia’s 2013 defence budget was Rp82tr (US$7.8bn), representing a 7.8 per cent real increase on the 2012 defence budget. In 2013, Indonesia received the first 2 of 103 Leopard 2A6 tanks and the first 2 of 42 Marder 1A3 infantry fighting vehicles purchased from Germany, with more to be delivered in 2014. In September 2013, Indonesia received four Grob Aircraft G120TP flying trainers, and in October 2013 Indonesia’s Navy took delivery of the first of three indigenously produced maritime patrol-configured CN235s, with delivery of the remaining aircraft expected by early 2014. The first of three ex-Bruneian light frigates is due for delivery in mid-2014. Indonesia has also agreed to purchase eight Apache AH-64E attack helicopters from the US.
Country Name Indonesia
Capital City Jakarta
Population 248 million
Land Size 1 905 000 km2
Currency Rupiah
Fiscal Year 1 January–31 December
Economy Less-developed country with a market economy
Industries Petroleum, natural gas, mining, cement, chemical fertilisers, plywood, rubber, tourism, textiles and apparel
16
LAO
S
17
LAO
S
Economy
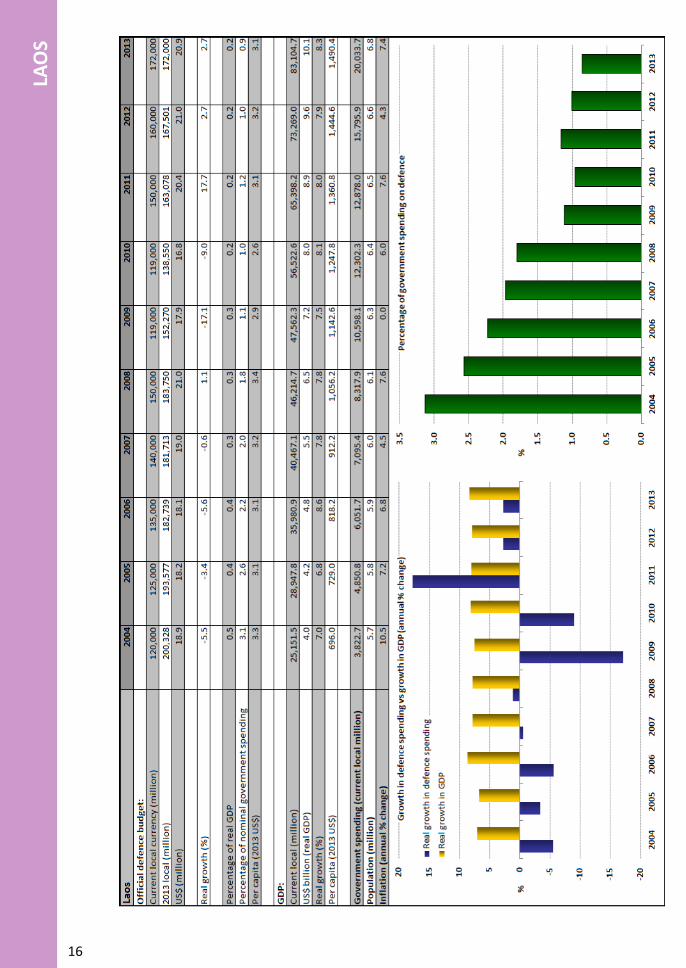
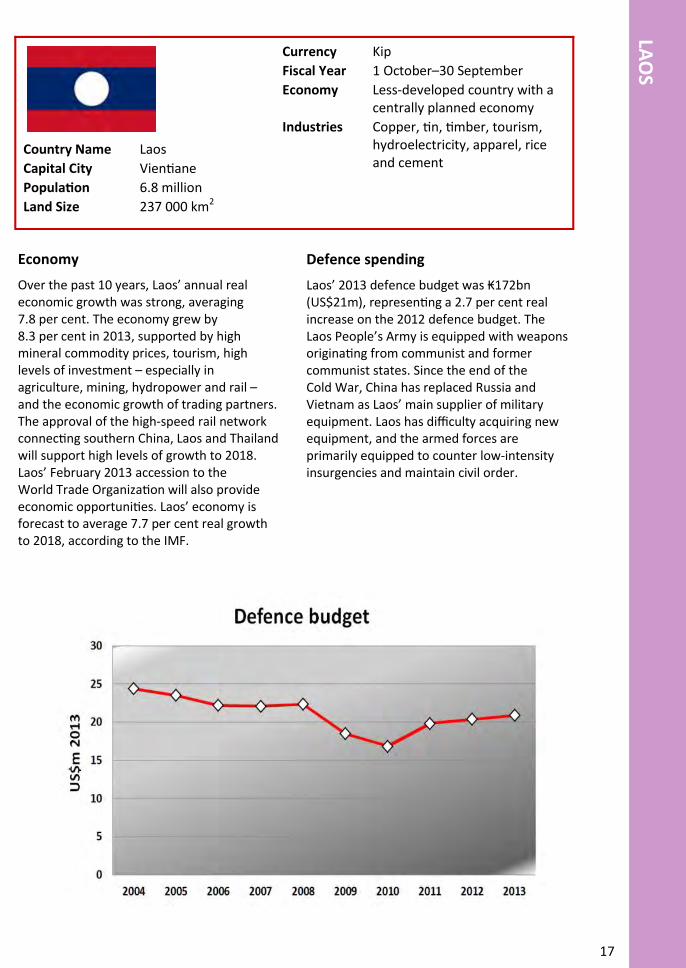
Over the past 10 years, Laos’ annual real economic growth was strong, averaging 7.8 per cent. The economy grew by 8.3 per cent in 2013, supported by high mineral commodity prices, tourism, high levels of investment – especially in agriculture, mining, hydropower and rail – and the economic growth of trading partners. The approval of the high-speed rail network connecting southern China, Laos and Thailand will support high levels of growth to 2018. Laos’ February 2013 accession to the World Trade Organization will also provide economic opportunities. Laos’ economy is forecast to average 7.7 per cent real growth to 2018, according to the IMF.
Defence spending
Laos’ 2013 defence budget was ₭172bn (US$21m), representing a 2.7 per cent real increase on the 2012 defence budget. The Laos People’s Army is equipped with weapons originating from communist and former communist states. Since the end of the Cold War, China has replaced Russia and Vietnam as Laos’ main supplier of military equipment. Laos has difficulty acquiring new equipment, and the armed forces are primarily equipped to counter low-intensity insurgencies and maintain civil order.
Country Name Laos
Capital City Vientiane
Population 6.8 million
Land Size 237 000 km2
Currency Kip
Fiscal Year 1 October–30 September
Economy Less-developed country with a centrally planned economy
Industries Copper, tin, timber, tourism, hydroelectricity, apparel, rice and cement
18
MA
LAY
SIA
19
MA
LAY
SIA
Economy
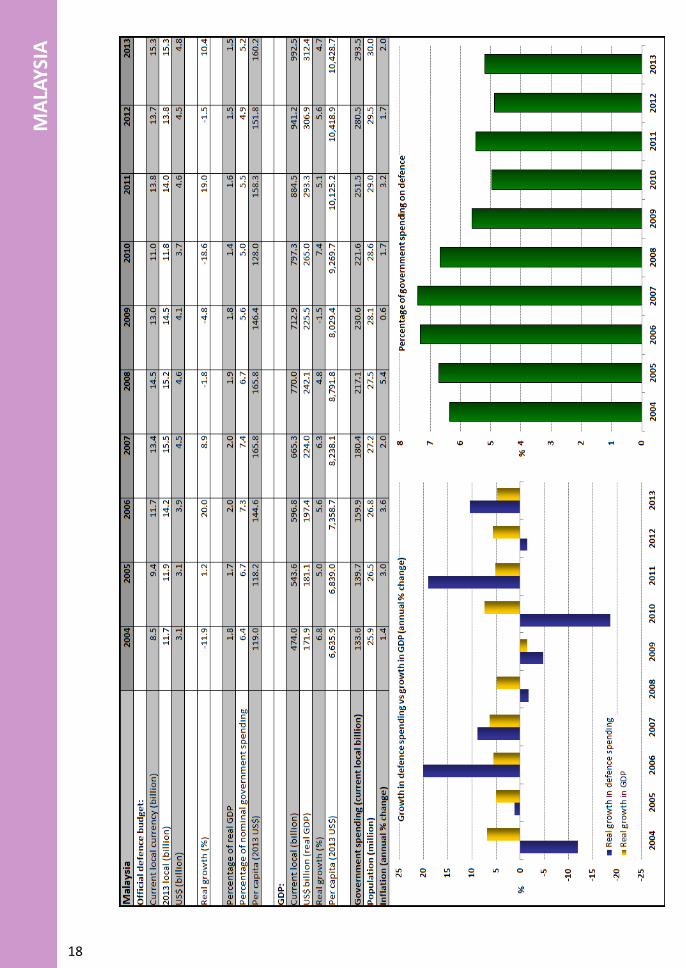
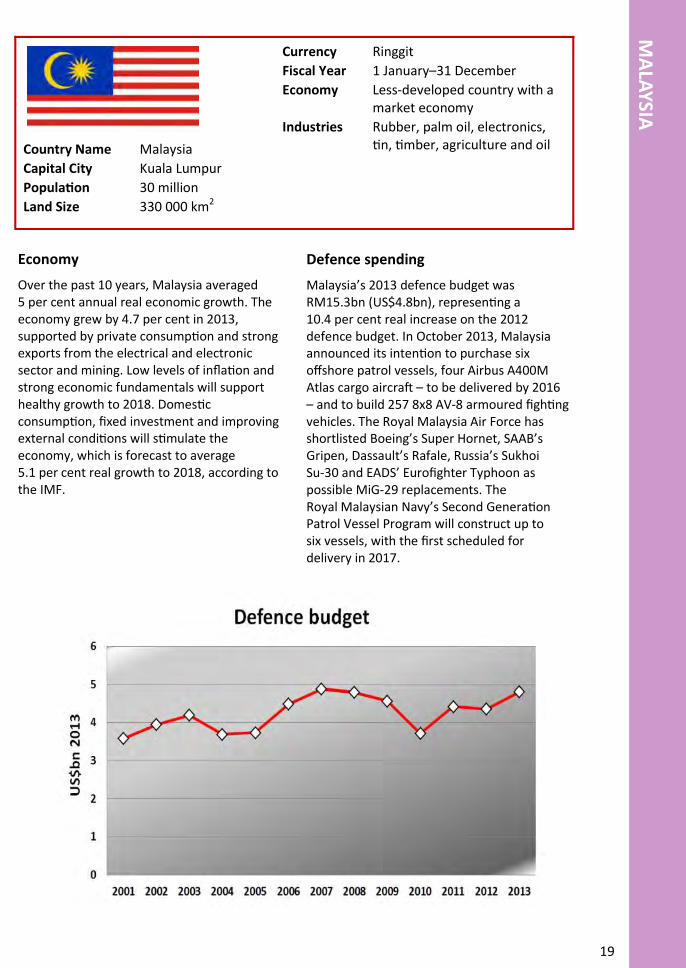
Over the past 10 years, Malaysia averaged 5 per cent annual real economic growth. The economy grew by 4.7 per cent in 2013, supported by private consumption and strong exports from the electrical and electronic sector and mining. Low levels of inflation and strong economic fundamentals will support healthy growth to 2018. Domestic consumption, fixed investment and improving external conditions will stimulate the economy, which is forecast to average 5.1 per cent real growth to 2018, according to the IMF.
Defence spending
Malaysia’s 2013 defence budget was RM15.3bn (US$4.8bn), representing a 10.4 per cent real increase on the 2012 defence budget. In October 2013, Malaysia announced its intention to purchase six offshore patrol vessels, four Airbus A400M Atlas cargo aircraft – to be delivered by 2016 – and to build 257 8x8 AV-8 armoured fighting vehicles. The Royal Malaysia Air Force has shortlisted Boeing’s Super Hornet, SAAB’s Gripen, Dassault’s Rafale, Russia’s Sukhoi Su-30 and EADS’ Eurofighter Typhoon as possible MiG-29 replacements. The Royal Malaysian Navy’s Second Generation Patrol Vessel Program will construct up to six vessels, with the first scheduled for delivery in 2017.
Country Name Malaysia
Capital City Kuala Lumpur
Population 30 million
Land Size 330 000 km2
Currency Ringgit
Fiscal Year 1 January–31 December
Economy Less-developed country with a market economy
Industries Rubber, palm oil, electronics, tin, timber, agriculture and oil
20
PH
ILIP
PIN
ES
21
PH
ILIPP
INES
Economy
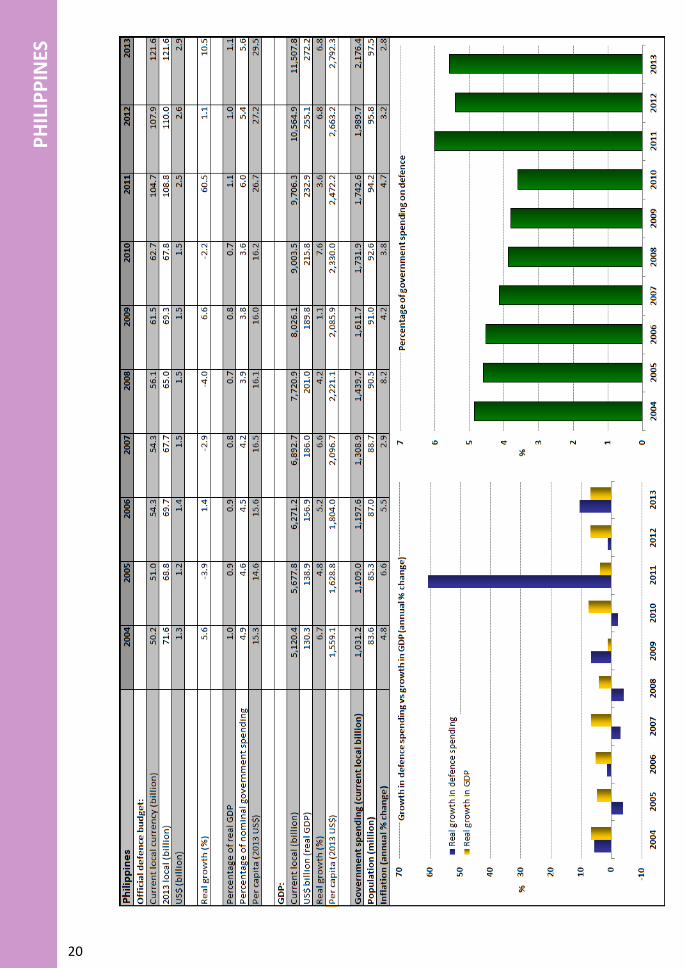
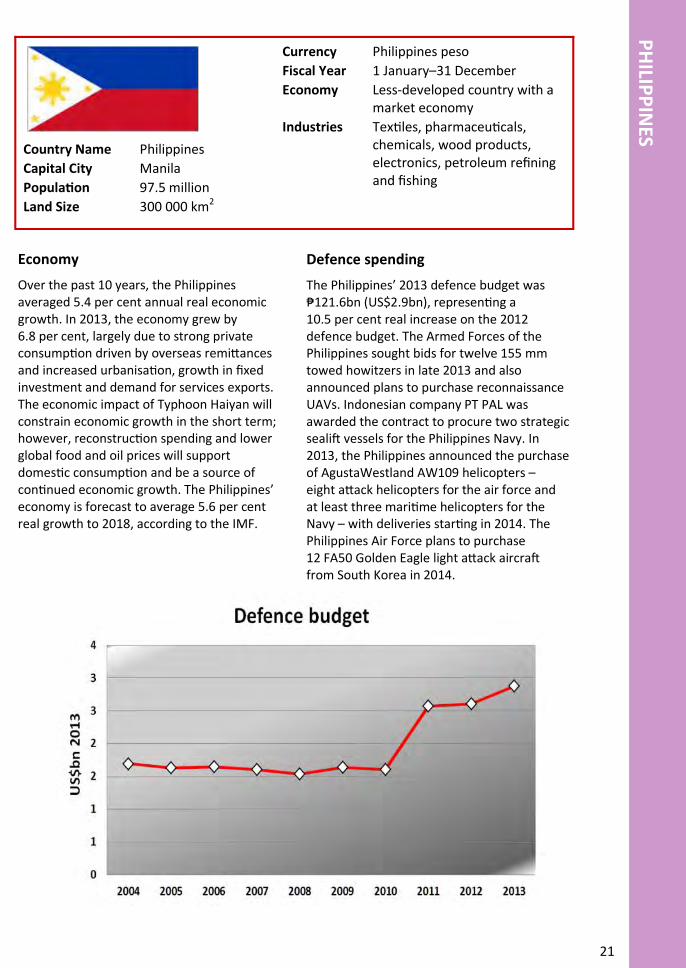
Over the past 10 years, the Philippines averaged 5.4 per cent annual real economic growth. In 2013, the economy grew by 6.8 per cent, largely due to strong private consumption driven by overseas remittances and increased urbanisation, growth in fixed investment and demand for services exports. The economic impact of Typhoon Haiyan will constrain economic growth in the short term; however, reconstruction spending and lower global food and oil prices will support domestic consumption and be a source of continued economic growth. The Philippines’ economy is forecast to average 5.6 per cent real growth to 2018, according to the IMF.
Defence spending
The Philippines’ 2013 defence budget was ₱121.6bn (US$2.9bn), representing a 10.5 per cent real increase on the 2012 defence budget. The Armed Forces of the Philippines sought bids for twelve 155 mm towed howitzers in late 2013 and also announced plans to purchase reconnaissance UAVs. Indonesian company PT PAL was awarded the contract to procure two strategic sealift vessels for the Philippines Navy. In 2013, the Philippines announced the purchase of AgustaWestland AW109 helicopters – eight attack helicopters for the air force and at least three maritime helicopters for the Navy – with deliveries starting in 2014. The Philippines Air Force plans to purchase 12 FA50 Golden Eagle light attack aircraft from South Korea in 2014.
Country Name Philippines
Capital City Manila
Population 97.5 million
Land Size 300 000 km2
Currency Philippines peso
Fiscal Year 1 January–31 December
Economy Less-developed country with a market economy
Industries Textiles, pharmaceuticals, chemicals, wood products, electronics, petroleum refining and fishing
22
SIN
GA
PO
RE
23
SING
AP
OR
E
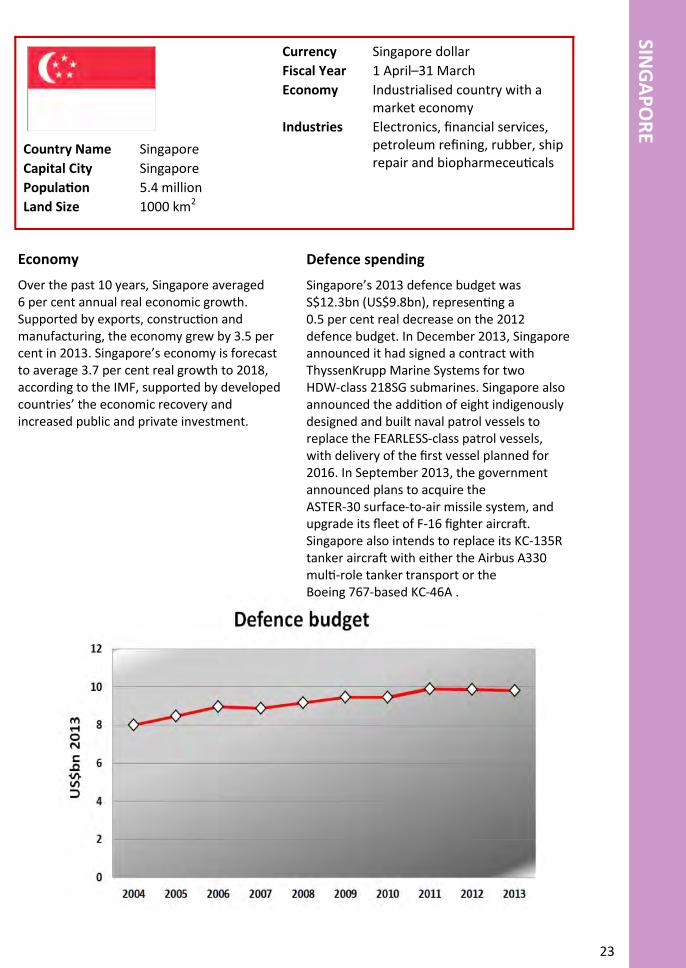
Economy
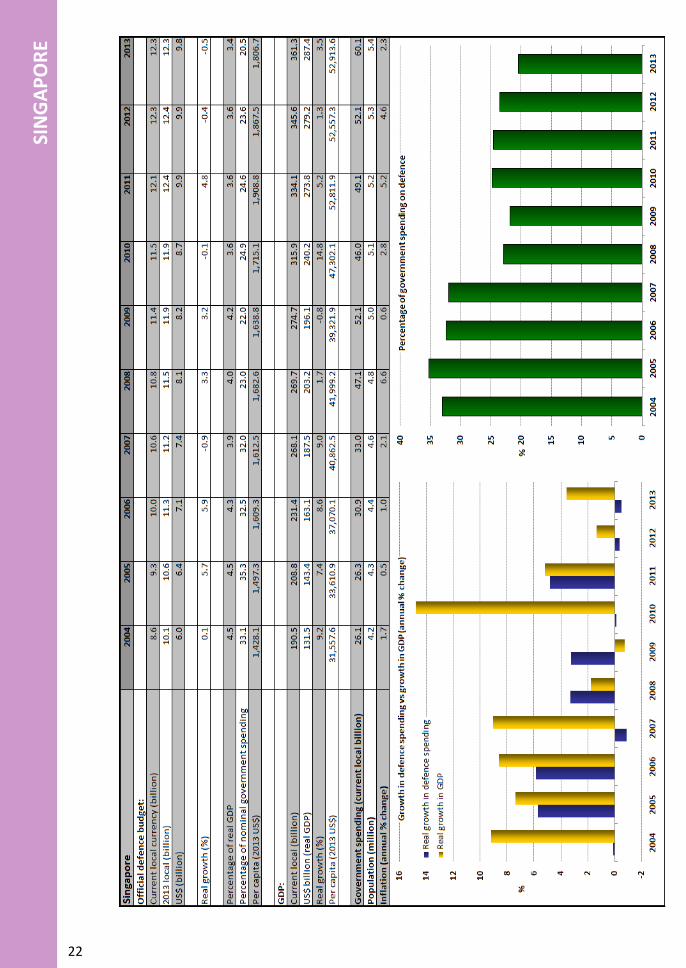
Over the past 10 years, Singapore averaged 6 per cent annual real economic growth. Supported by exports, construction and manufacturing, the economy grew by 3.5 per cent in 2013. Singapore’s economy is forecast to average 3.7 per cent real growth to 2018, according to the IMF, supported by developed countries’ the economic recovery and increased public and private investment.
Defence spending
Singapore’s 2013 defence budget was S$12.3bn (US$9.8bn), representing a 0.5 per cent real decrease on the 2012 defence budget. In December 2013, Singapore announced it had signed a contract with ThyssenKrupp Marine Systems for two HDW-class 218SG submarines. Singapore also announced the addition of eight indigenously designed and built naval patrol vessels to replace the FEARLESS-class patrol vessels, with delivery of the first vessel planned for 2016. In September 2013, the government announced plans to acquire the ASTER-30 surface-to-air missile system, and upgrade its fleet of F-16 fighter aircraft. Singapore also intends to replace its KC-135R tanker aircraft with either the Airbus A330 multi-role tanker transport or the Boeing 767-based KC-46A .
Country Name Singapore
Capital City Singapore
Population 5.4 million
Land Size 1000 km2
Currency Singapore dollar
Fiscal Year 1 April–31 March
Economy Industrialised country with a market economy
Industries Electronics, financial services, petroleum refining, rubber, ship repair and biopharmeceuticals
24
THA
ILA
ND
25
THA
ILAN
D
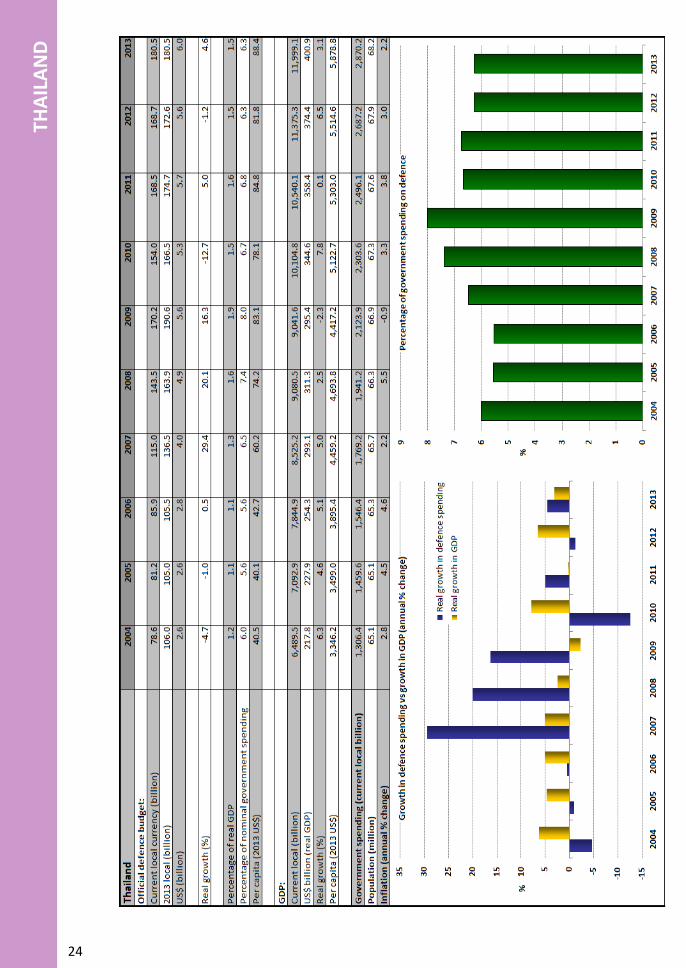
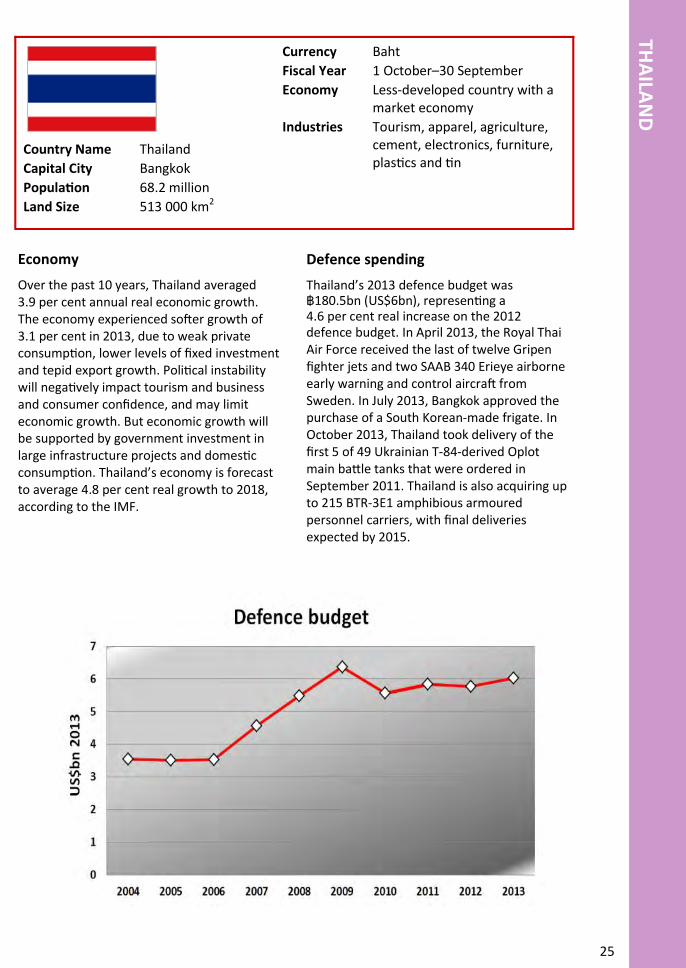
Economy
Over the past 10 years, Thailand averaged 3.9 per cent annual real economic growth. The economy experienced softer growth of 3.1 per cent in 2013, due to weak private consumption, lower levels of fixed investment and tepid export growth. Political instability will negatively impact tourism and business and consumer confidence, and may limit economic growth. But economic growth will be supported by government investment in large infrastructure projects and domestic consumption. Thailand’s economy is forecast to average 4.8 per cent real growth to 2018, according to the IMF.
Defence spending
Thailand’s 2013 defence budget was ฿180.5bn (US$6bn), representing a 4.6 per cent real increase on the 2012 defence budget. In April 2013, the Royal Thai Air Force received the last of twelve Gripen fighter jets and two SAAB 340 Erieye airborne early warning and control aircraft from Sweden. In July 2013, Bangkok approved the purchase of a South Korean-made frigate. In October 2013, Thailand took delivery of the first 5 of 49 Ukrainian T-84-derived Oplot main battle tanks that were ordered in September 2011. Thailand is also acquiring up to 215 BTR-3E1 amphibious armoured personnel carriers, with final deliveries expected by 2015.
Country Name Thailand
Capital City Bangkok
Population 68.2 million
Land Size 513 000 km2
Currency Baht
Fiscal Year 1 October–30 September
Economy Less-developed country with a market economy
Industries Tourism, apparel, agriculture, cement, electronics, furniture, plastics and tin
26
TIM
OR
-LES
TE
27
TIMO
R-LESTE
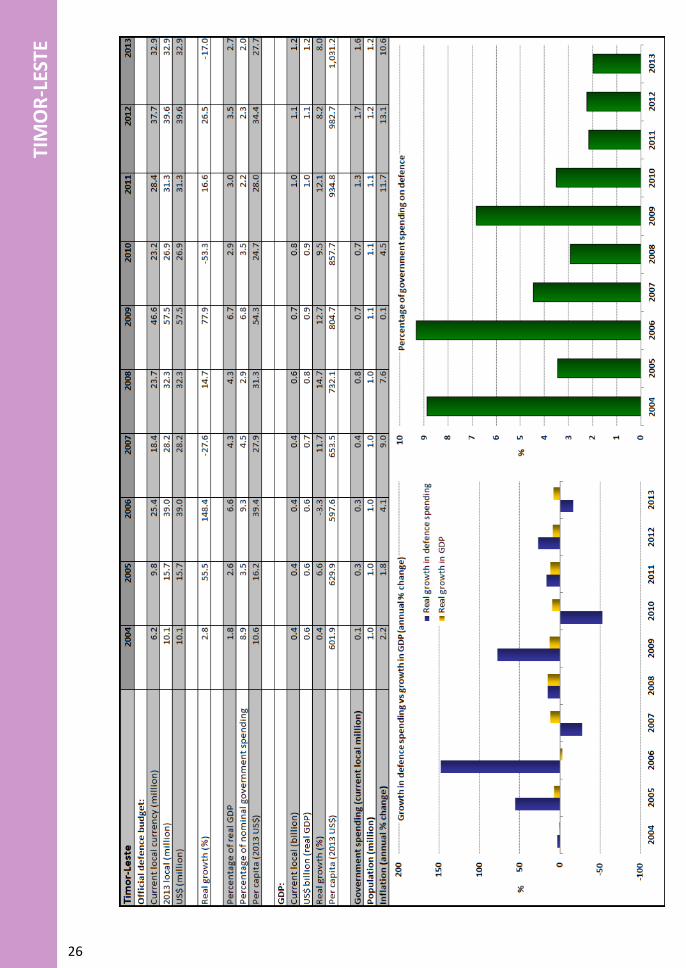
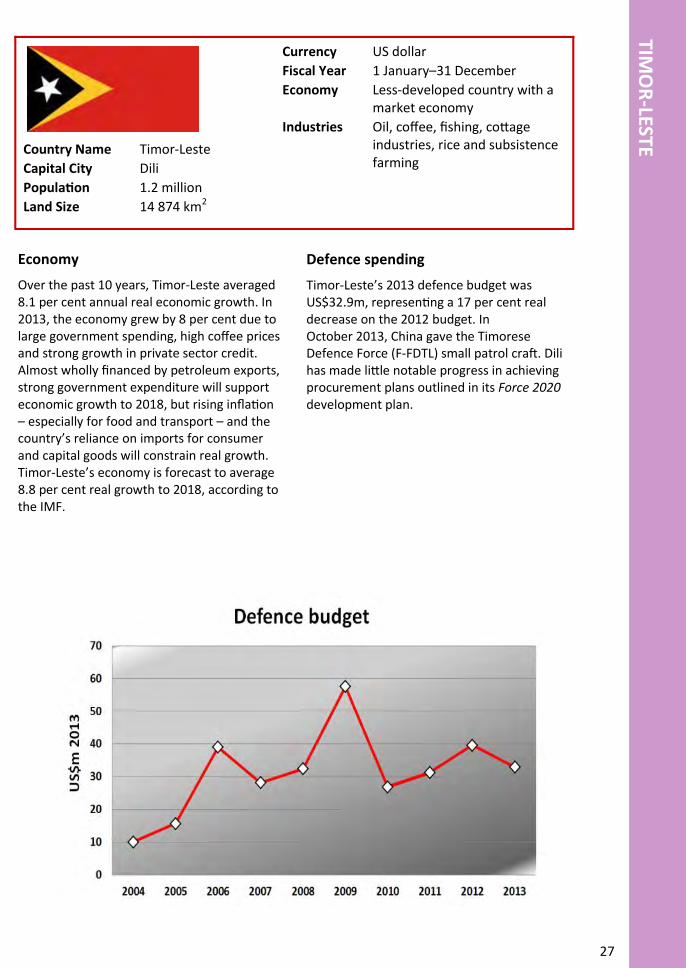
Economy
Over the past 10 years, Timor-Leste averaged 8.1 per cent annual real economic growth. In 2013, the economy grew by 8 per cent due to large government spending, high coffee prices and strong growth in private sector credit. Almost wholly financed by petroleum exports, strong government expenditure will support economic growth to 2018, but rising inflation – especially for food and transport – and the country’s reliance on imports for consumer and capital goods will constrain real growth. Timor-Leste’s economy is forecast to average 8.8 per cent real growth to 2018, according to the IMF.
Defence spending
Timor-Leste’s 2013 defence budget was US$32.9m, representing a 17 per cent real decrease on the 2012 budget. In October 2013, China gave the Timorese Defence Force (F-FDTL) small patrol craft. Dili has made little notable progress in achieving procurement plans outlined in its Force 2020 development plan.
Country Name Timor-Leste
Capital City Dili
Population 1.2 million
Land Size 14 874 km2
Currency US dollar
Fiscal Year 1 January–31 December
Economy Less-developed country with a market economy
Industries Oil, coffee, fishing, cottage industries, rice and subsistence farming
28
VIE
TNA
M
29
VIETN
AM
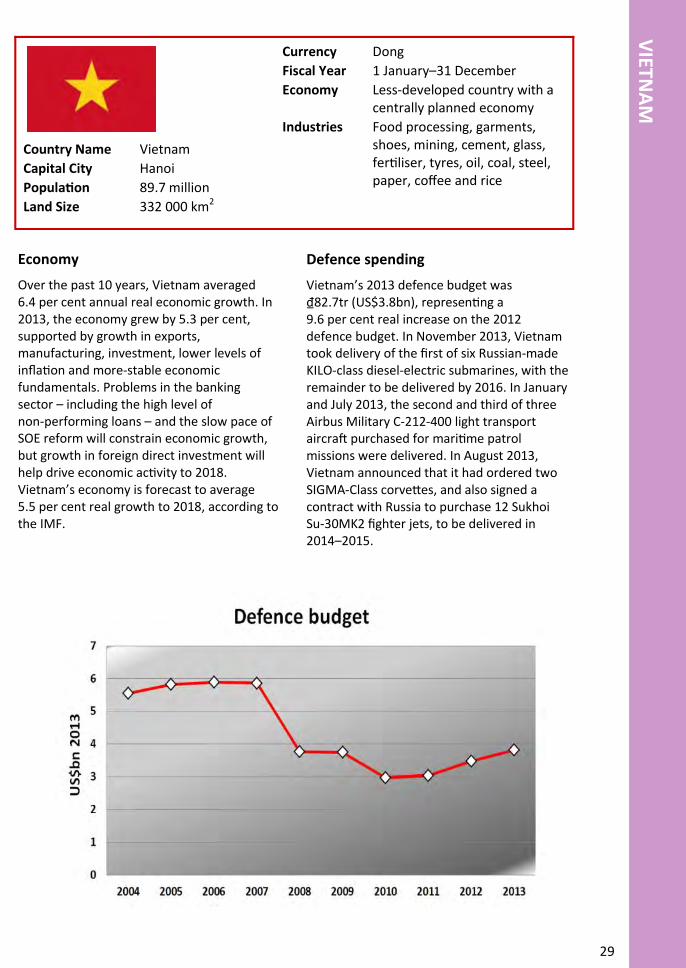
Economy
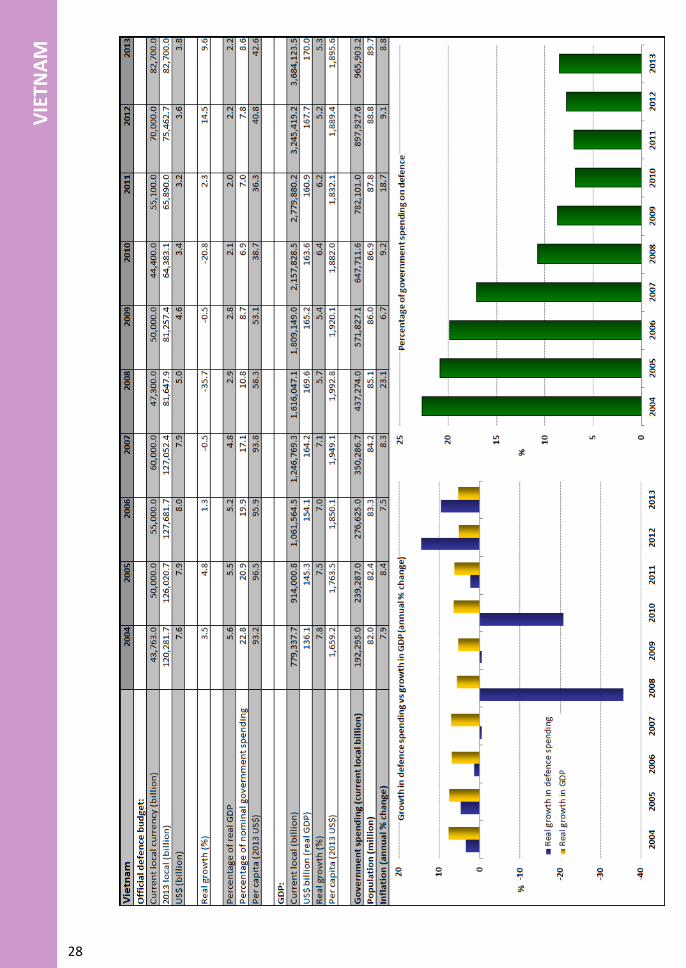
Over the past 10 years, Vietnam averaged 6.4 per cent annual real economic growth. In 2013, the economy grew by 5.3 per cent, supported by growth in exports, manufacturing, investment, lower levels of inflation and more-stable economic fundamentals. Problems in the banking sector – including the high level of non-performing loans – and the slow pace of SOE reform will constrain economic growth, but growth in foreign direct investment will help drive economic activity to 2018. Vietnam’s economy is forecast to average 5.5 per cent real growth to 2018, according to the IMF.
Defence spending
Vietnam’s 2013 defence budget was ₫82.7tr (US$3.8bn), representing a 9.6 per cent real increase on the 2012 defence budget. In November 2013, Vietnam took delivery of the first of six Russian-made KILO-class diesel-electric submarines, with the remainder to be delivered by 2016. In January and July 2013, the second and third of three Airbus Military C-212-400 light transport aircraft purchased for maritime patrol missions were delivered. In August 2013, Vietnam announced that it had ordered two SIGMA-Class corvettes, and also signed a contract with Russia to purchase 12 Sukhoi Su-30MK2 fighter jets, to be delivered in 2014–2015.
Country Name Vietnam
Capital City Hanoi
Population 89.7 million
Land Size 332 000 km2
Currency Dong
Fiscal Year 1 January–31 December
Economy Less-developed country with a centrally planned economy
Industries Food processing, garments, shoes, mining, cement, glass, fertiliser, tyres, oil, coal, steel, paper, coffee and rice
30
SOU
TH P
AC
IFIC
– R
EGIO
NA
L O
VER
VIE
W
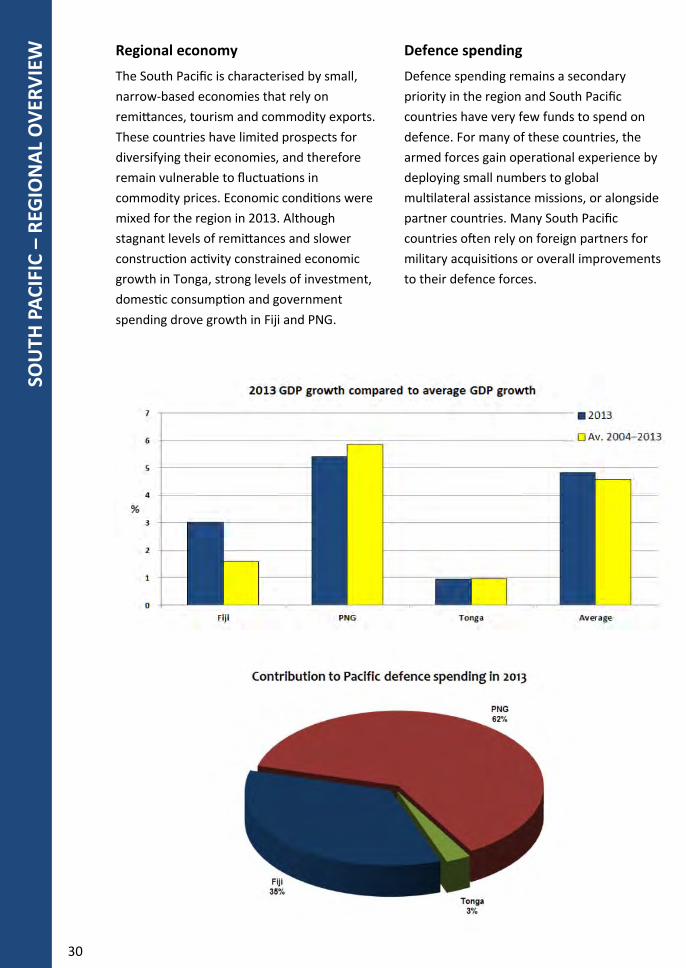
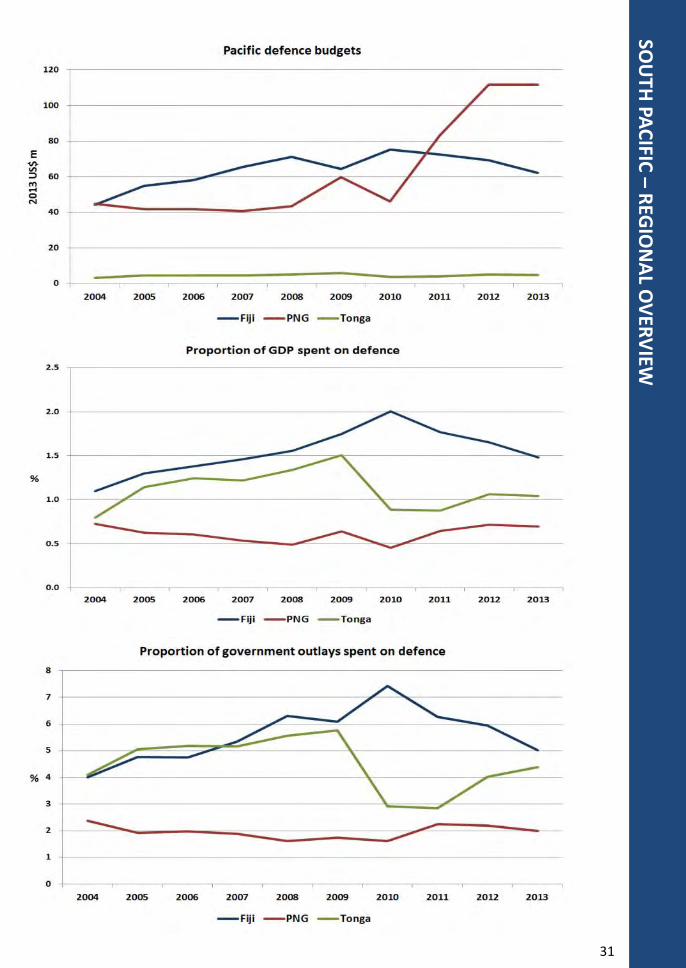
Regional economy
The South Pacific is characterised by small,
narrow-based economies that rely on
remittances, tourism and commodity exports.
These countries have limited prospects for
diversifying their economies, and therefore
remain vulnerable to fluctuations in
commodity prices. Economic conditions were
mixed for the region in 2013. Although
stagnant levels of remittances and slower
construction activity constrained economic
growth in Tonga, strong levels of investment,
domestic consumption and government
spending drove growth in Fiji and PNG.
Defence spending
Defence spending remains a secondary
priority in the region and South Pacific
countries have very few funds to spend on
defence. For many of these countries, the
armed forces gain operational experience by
deploying small numbers to global
multilateral assistance missions, or alongside
partner countries. Many South Pacific
countries often rely on foreign partners for
military acquisitions or overall improvements
to their defence forces.
31
SOU
TH PA
CIFIC
– R
EGIO
NA
L OV
ERV
IEW
32
FIJI
33
FIJI
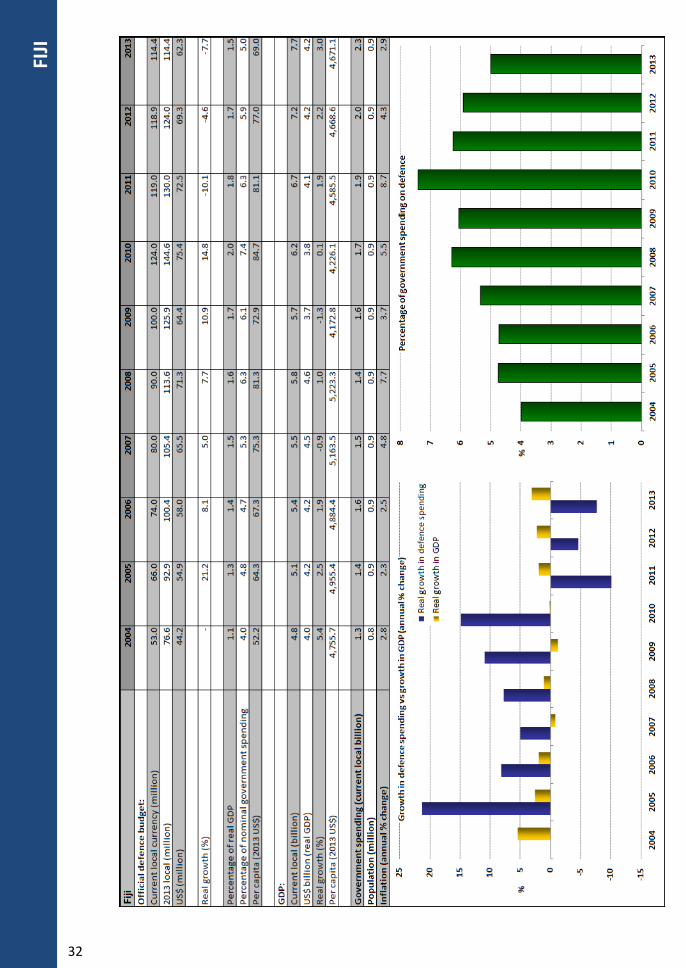
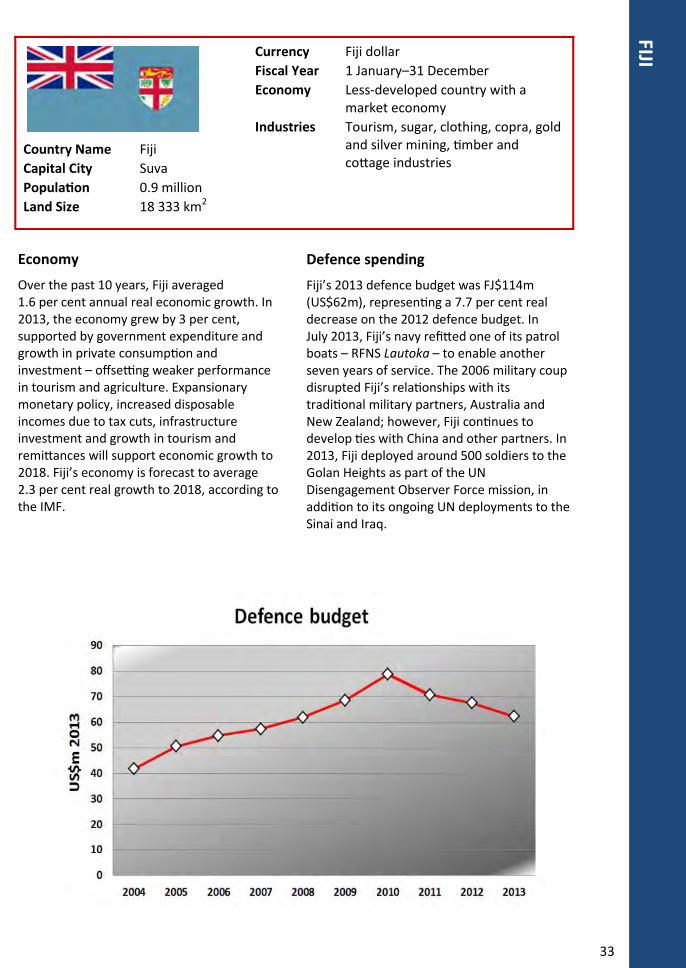
Economy
Over the past 10 years, Fiji averaged 1.6 per cent annual real economic growth. In 2013, the economy grew by 3 per cent, supported by government expenditure and growth in private consumption and investment – offsetting weaker performance in tourism and agriculture. Expansionary monetary policy, increased disposable incomes due to tax cuts, infrastructure investment and growth in tourism and remittances will support economic growth to 2018. Fiji’s economy is forecast to average 2.3 per cent real growth to 2018, according to the IMF.
Defence spending
Fiji’s 2013 defence budget was FJ$114m (US$62m), representing a 7.7 per cent real decrease on the 2012 defence budget. In July 2013, Fiji’s navy refitted one of its patrol boats – RFNS Lautoka – to enable another seven years of service. The 2006 military coup disrupted Fiji’s relationships with its traditional military partners, Australia and New Zealand; however, Fiji continues to develop ties with China and other partners. In 2013, Fiji deployed around 500 soldiers to the Golan Heights as part of the UN Disengagement Observer Force mission, in addition to its ongoing UN deployments to the Sinai and Iraq.
Country Name Fiji
Capital City Suva
Population 0.9 million
Land Size 18 333 km2
Currency Fiji dollar
Fiscal Year 1 January–31 December
Economy Less-developed country with a market economy
Industries Tourism, sugar, clothing, copra, gold and silver mining, timber and cottage industries
34
PAP
UA
NEW
GU
INEA
35
PAP
UA
NEW
GU
INEA
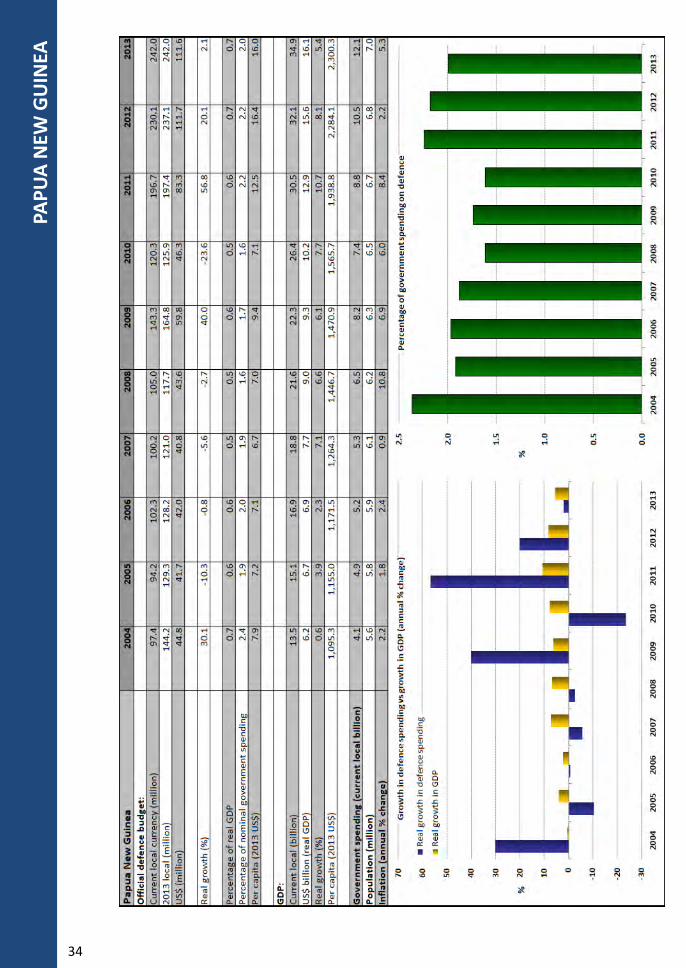
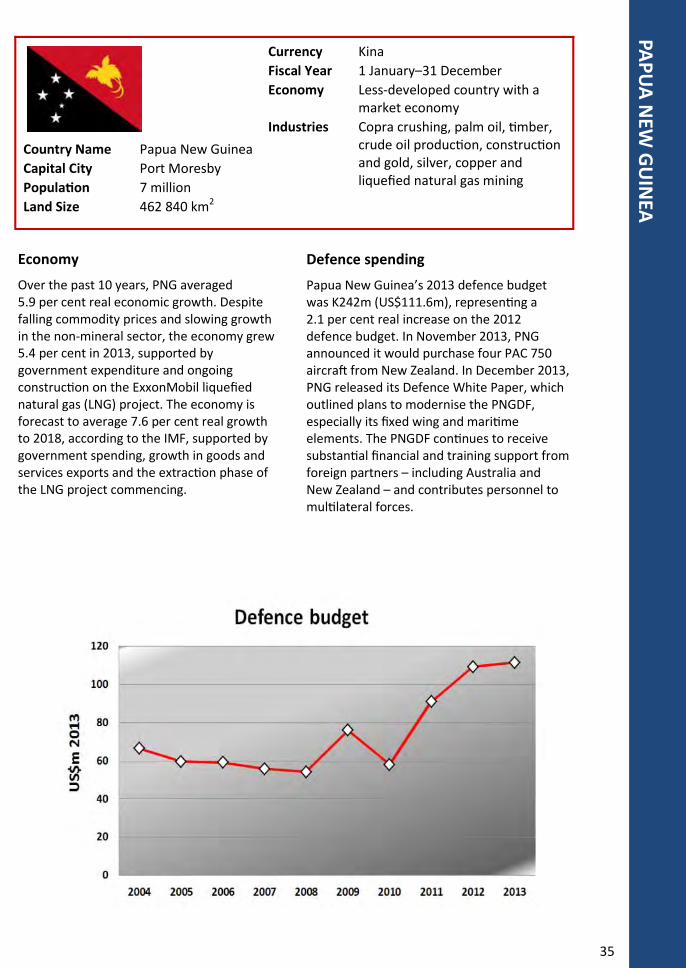
Economy
Over the past 10 years, PNG averaged 5.9 per cent real economic growth. Despite falling commodity prices and slowing growth in the non-mineral sector, the economy grew 5.4 per cent in 2013, supported by government expenditure and ongoing construction on the ExxonMobil liquefied natural gas (LNG) project. The economy is forecast to average 7.6 per cent real growth to 2018, according to the IMF, supported by government spending, growth in goods and services exports and the extraction phase of the LNG project commencing.
Defence spending
Papua New Guinea’s 2013 defence budget was K242m (US$111.6m), representing a 2.1 per cent real increase on the 2012 defence budget. In November 2013, PNG announced it would purchase four PAC 750 aircraft from New Zealand. In December 2013, PNG released its Defence White Paper, which outlined plans to modernise the PNGDF, especially its fixed wing and maritime elements. The PNGDF continues to receive substantial financial and training support from foreign partners – including Australia and New Zealand – and contributes personnel to multilateral forces.
Country Name Papua New Guinea
Capital City Port Moresby
Population 7 million
Land Size 462 840 km2
Currency Kina
Fiscal Year 1 January–31 December
Economy Less-developed country with a market economy
Industries Copra crushing, palm oil, timber, crude oil production, construction and gold, silver, copper and liquefied natural gas mining
36
TON
GA
37
TON
GA
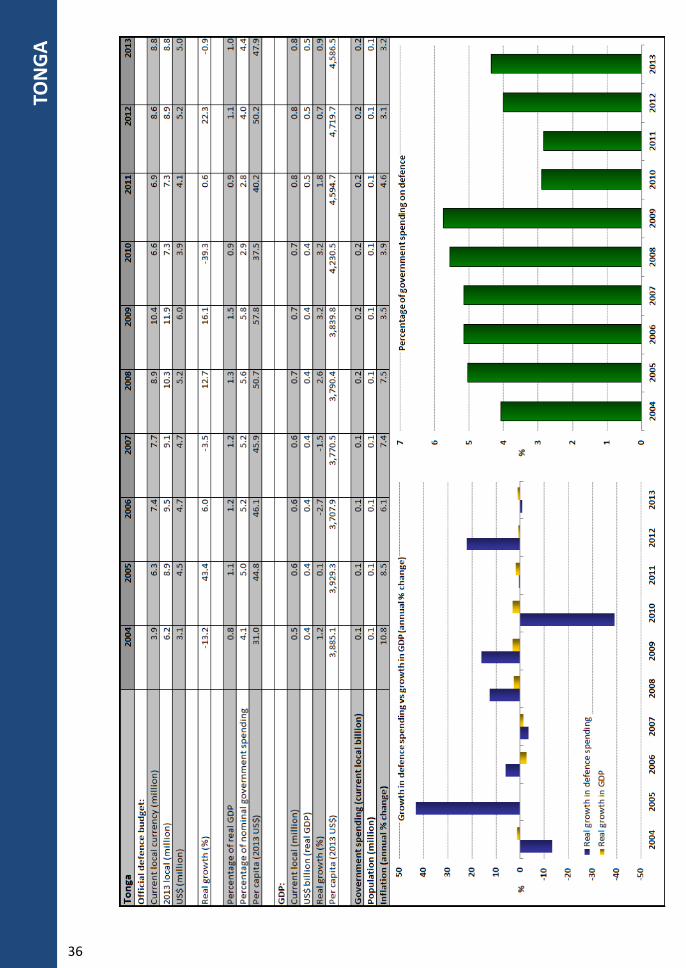
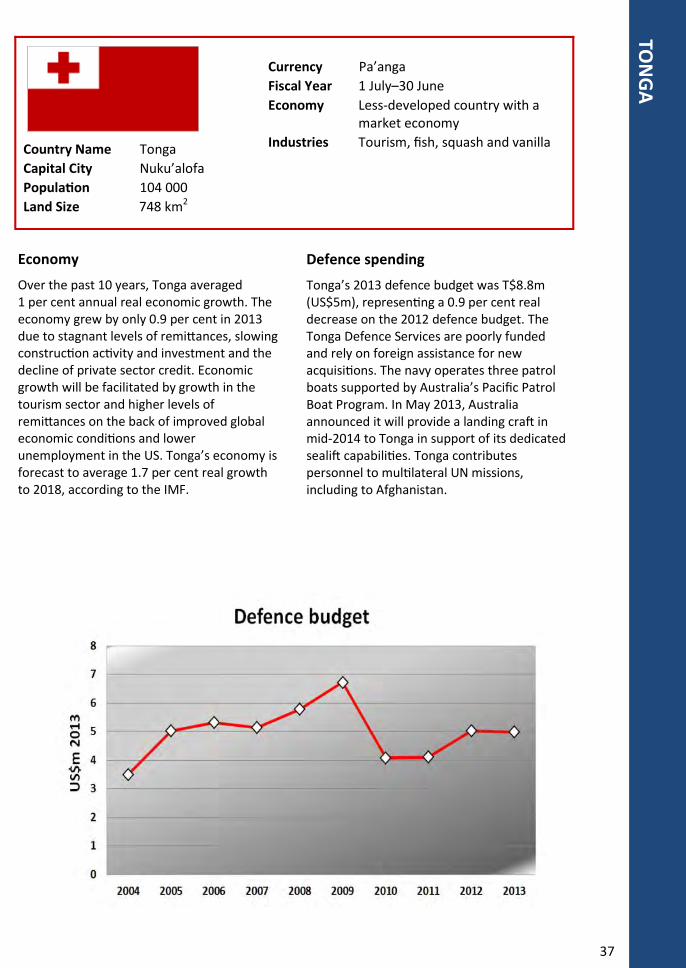
Economy
Over the past 10 years, Tonga averaged 1 per cent annual real economic growth. The economy grew by only 0.9 per cent in 2013 due to stagnant levels of remittances, slowing construction activity and investment and the decline of private sector credit. Economic growth will be facilitated by growth in the tourism sector and higher levels of remittances on the back of improved global economic conditions and lower unemployment in the US. Tonga’s economy is forecast to average 1.7 per cent real growth to 2018, according to the IMF.
Defence spending
Tonga’s 2013 defence budget was T$8.8m (US$5m), representing a 0.9 per cent real decrease on the 2012 defence budget. The Tonga Defence Services are poorly funded and rely on foreign assistance for new acquisitions. The navy operates three patrol boats supported by Australia’s Pacific Patrol Boat Program. In May 2013, Australia announced it will provide a landing craft in mid-2014 to Tonga in support of its dedicated sealift capabilities. Tonga contributes personnel to multilateral UN missions, including to Afghanistan.
Country Name Tonga
Capital City Nuku’alofa
Population 104 000
Land Size 748 km2
Currency Pa’anga
Fiscal Year 1 July–30 June
Economy Less-developed country with a market economy
Industries Tourism, fish, squash and vanilla
38
NO
RTH
ASI
A –
REG
ION
AL
OV
ERV
IEW
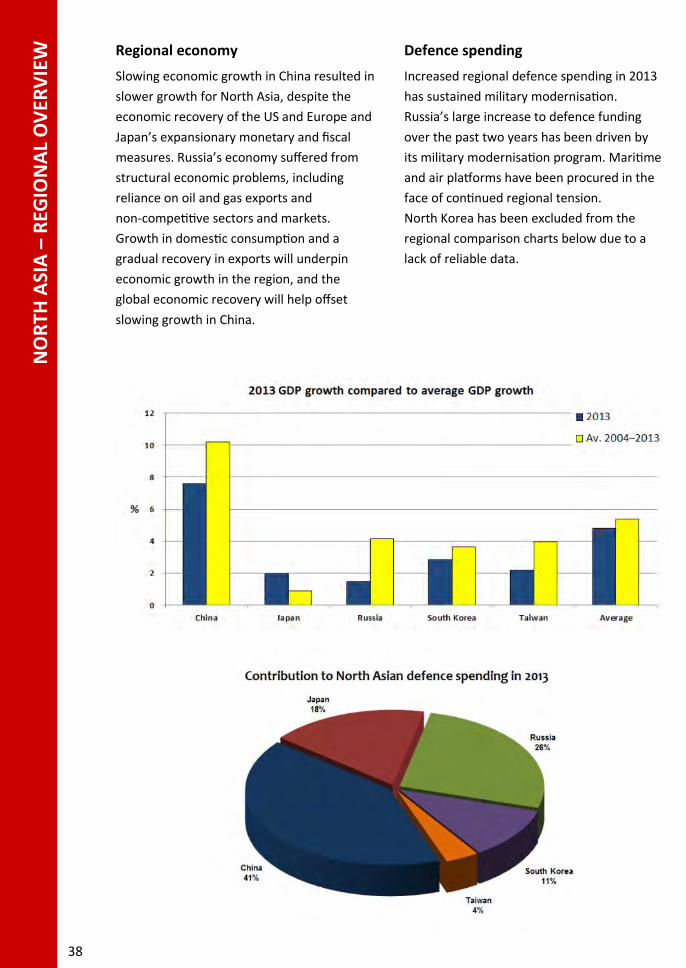
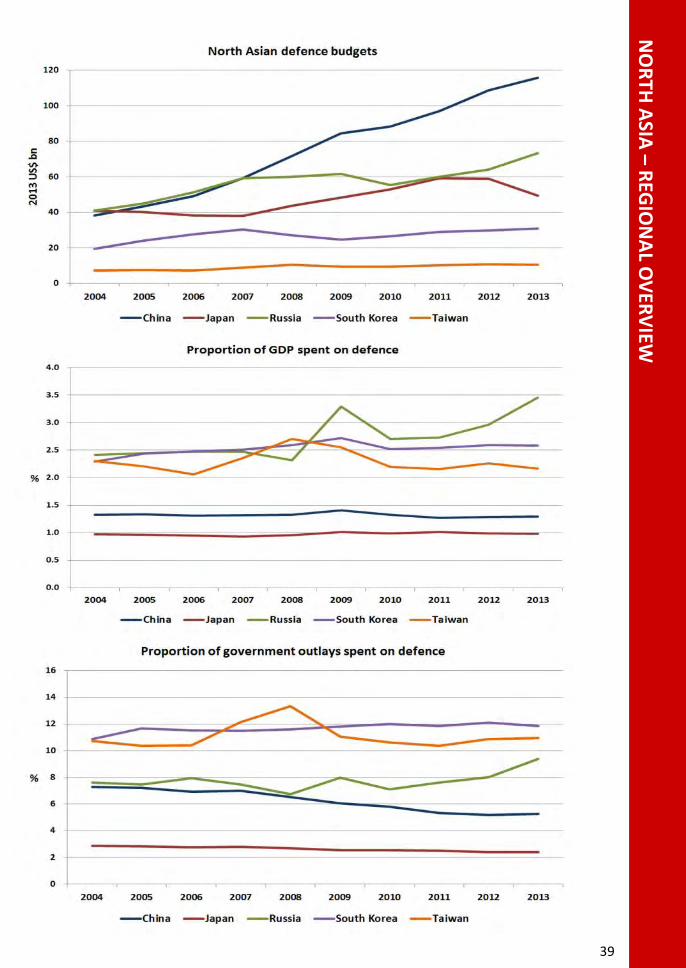
Regional economy
Slowing economic growth in China resulted in
slower growth for North Asia, despite the
economic recovery of the US and Europe and
Japan’s expansionary monetary and fiscal
measures. Russia’s economy suffered from
structural economic problems, including
reliance on oil and gas exports and
non-competitive sectors and markets.
Growth in domestic consumption and a
gradual recovery in exports will underpin
economic growth in the region, and the
global economic recovery will help offset
slowing growth in China.
Defence spending
Increased regional defence spending in 2013
has sustained military modernisation.
Russia’s large increase to defence funding
over the past two years has been driven by
its military modernisation program. Maritime
and air platforms have been procured in the
face of continued regional tension.
North Korea has been excluded from the
regional comparison charts below due to a
lack of reliable data.
39
NO
RTH
ASIA
– R
EGIO
NA
L OV
ERV
IEW
40
CH
INA
41
CH
INA
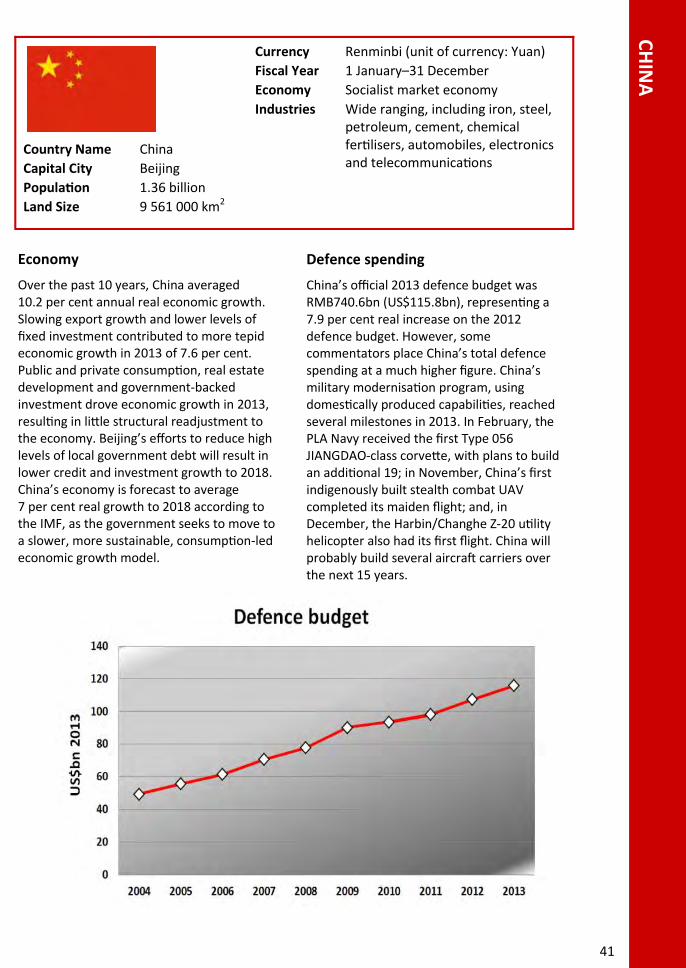
Economy
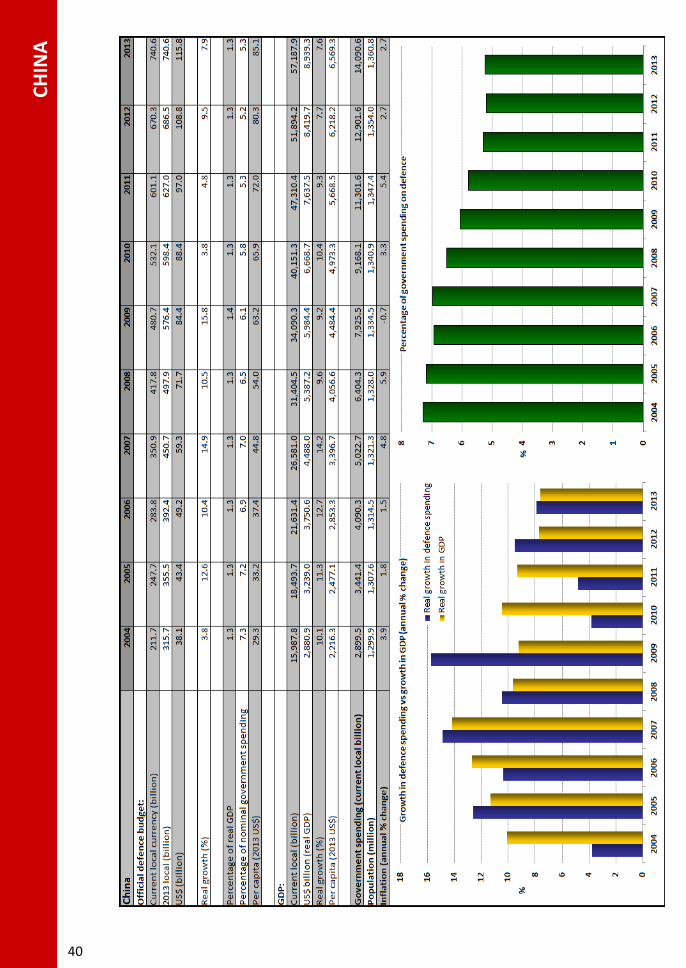
Over the past 10 years, China averaged 10.2 per cent annual real economic growth. Slowing export growth and lower levels of fixed investment contributed to more tepid economic growth in 2013 of 7.6 per cent. Public and private consumption, real estate development and government-backed investment drove economic growth in 2013, resulting in little structural readjustment to the economy. Beijing’s efforts to reduce high levels of local government debt will result in lower credit and investment growth to 2018. China’s economy is forecast to average 7 per cent real growth to 2018 according to the IMF, as the government seeks to move to a slower, more sustainable, consumption-led economic growth model.
Defence spending
China’s official 2013 defence budget was RMB740.6bn (US$115.8bn), representing a 7.9 per cent real increase on the 2012 defence budget. However, some commentators place China’s total defence spending at a much higher figure. China’s military modernisation program, using domestically produced capabilities, reached several milestones in 2013. In February, the PLA Navy received the first Type 056 JIANGDAO-class corvette, with plans to build an additional 19; in November, China’s first indigenously built stealth combat UAV completed its maiden flight; and, in December, the Harbin/Changhe Z-20 utility helicopter also had its first flight. China will probably build several aircraft carriers over the next 15 years.
Country Name China
Capital City Beijing
Population 1.36 billion
Land Size 9 561 000 km2
Currency Renminbi (unit of currency: Yuan)
Fiscal Year 1 January–31 December
Economy Socialist market economy
Industries Wide ranging, including iron, steel, petroleum, cement, chemical fertilisers, automobiles, electronics and telecommunications
42
JAPA
N
43
JAPA
N
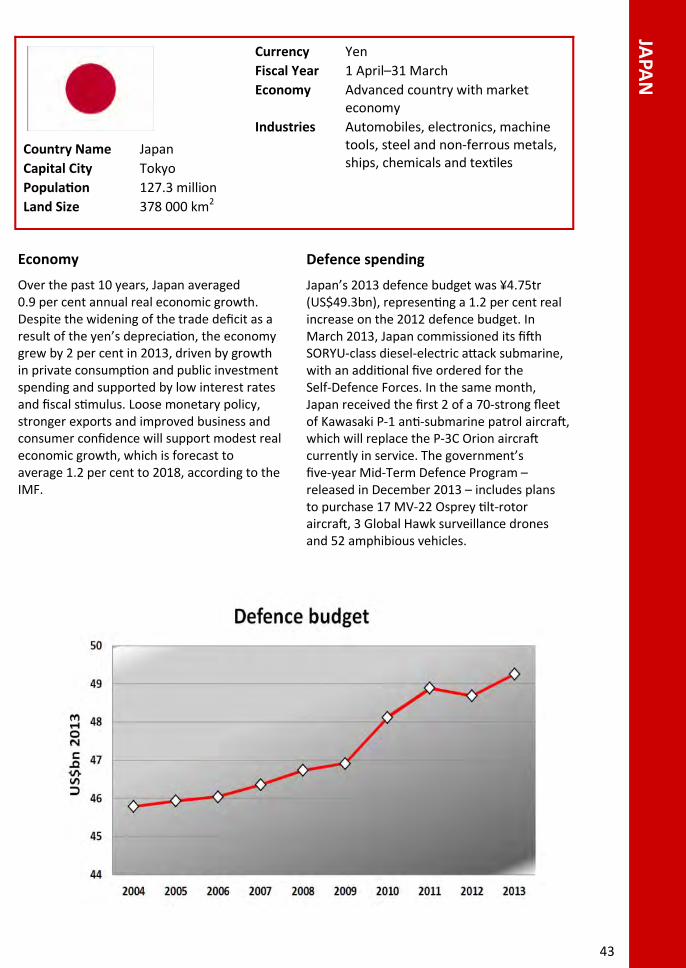
Economy
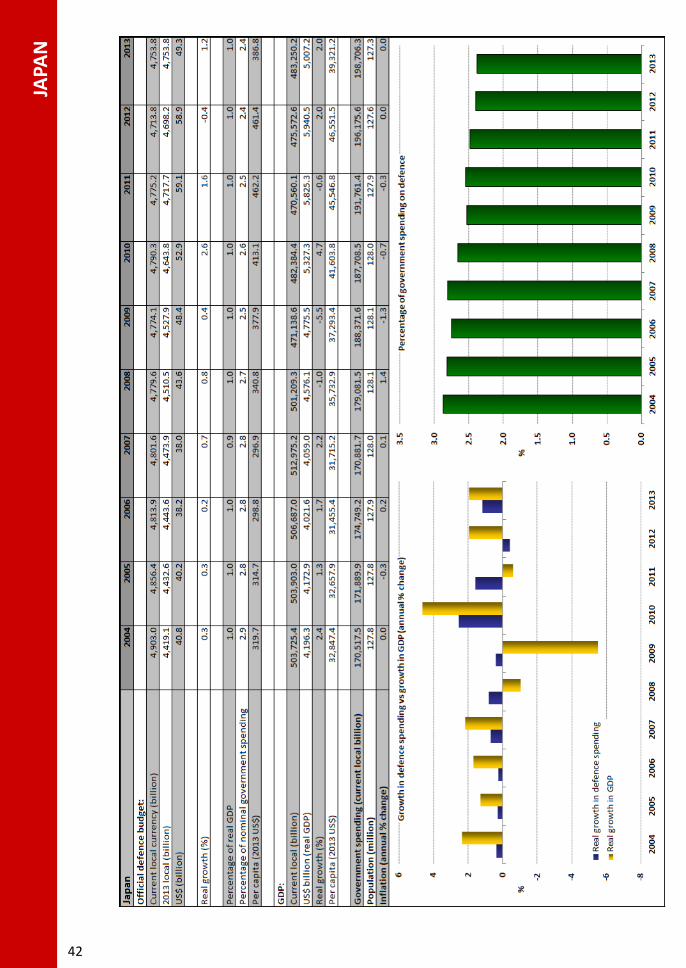
Over the past 10 years, Japan averaged 0.9 per cent annual real economic growth. Despite the widening of the trade deficit as a result of the yen’s depreciation, the economy grew by 2 per cent in 2013, driven by growth in private consumption and public investment spending and supported by low interest rates and fiscal stimulus. Loose monetary policy, stronger exports and improved business and consumer confidence will support modest real economic growth, which is forecast to average 1.2 per cent to 2018, according to the IMF.
Defence spending
Japan’s 2013 defence budget was ¥4.75tr (US$49.3bn), representing a 1.2 per cent real increase on the 2012 defence budget. In March 2013, Japan commissioned its fifth SORYU-class diesel-electric attack submarine, with an additional five ordered for the Self-Defence Forces. In the same month, Japan received the first 2 of a 70-strong fleet of Kawasaki P-1 anti-submarine patrol aircraft, which will replace the P-3C Orion aircraft currently in service. The government’s five-year Mid-Term Defence Program – released in December 2013 – includes plans to purchase 17 MV-22 Osprey tilt-rotor aircraft, 3 Global Hawk surveillance drones and 52 amphibious vehicles.
Country Name Japan
Capital City Tokyo
Population 127.3 million
Land Size 378 000 km2
Currency Yen
Fiscal Year 1 April–31 March
Economy Advanced country with market economy
Industries Automobiles, electronics, machine tools, steel and non-ferrous metals, ships, chemicals and textiles
44
NO
RTH
KO
REA
INSUFFICIENT RELIABLE DATA AVAILABLE
45
NO
RTH
KO
REA
Economy
No official information is published for North Korea. North Korea’s output is estimated to be lower than it was in the late 1980s, but the economy has shown some improvement since the 1990s famine crisis. North Korea will continue to rely on international food aid and its trade and aid relationship with China.
Defence spending
Reliable data on North Korea’s defence spending is not available. Pyongyang follows a ‘military first’ policy that ensures priority is given to defence of the nation. Therefore, a large portion of government spending is directed towards military expenditure.
Country Name North Korea
Capital City Pyongyang
Population 24.7 million
Land Size 121 000 km2
Currency North Korean won
Fiscal Year 1 January–31 December
Economy Less-developed country with centrally planned economy
Industries Military products, machine building, chemicals, mining, metallurgy and apparel
46
RU
SSIA
47
RU
SSIA
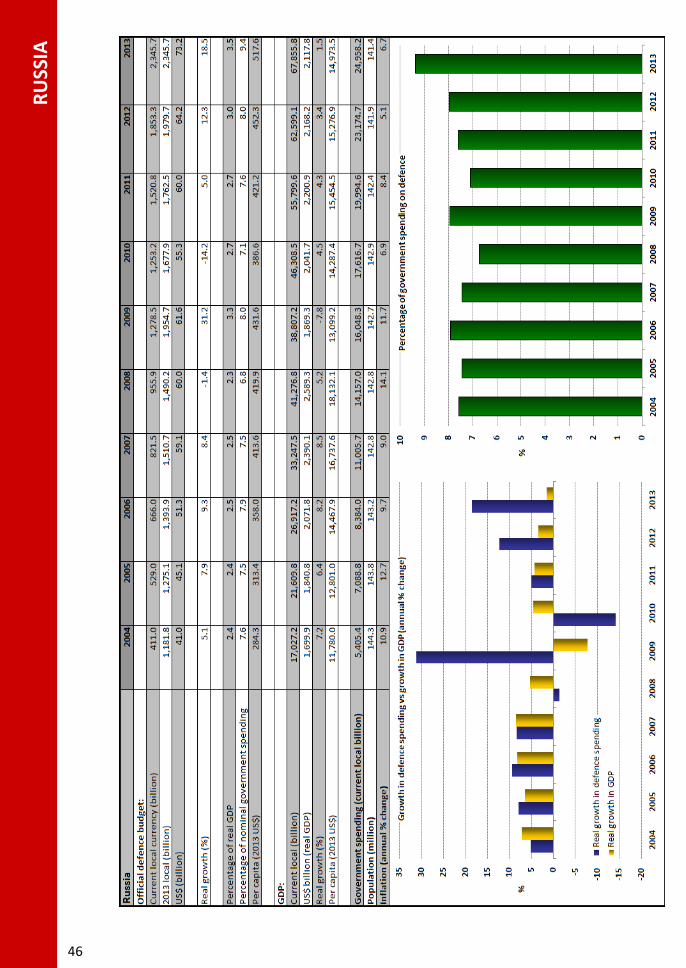
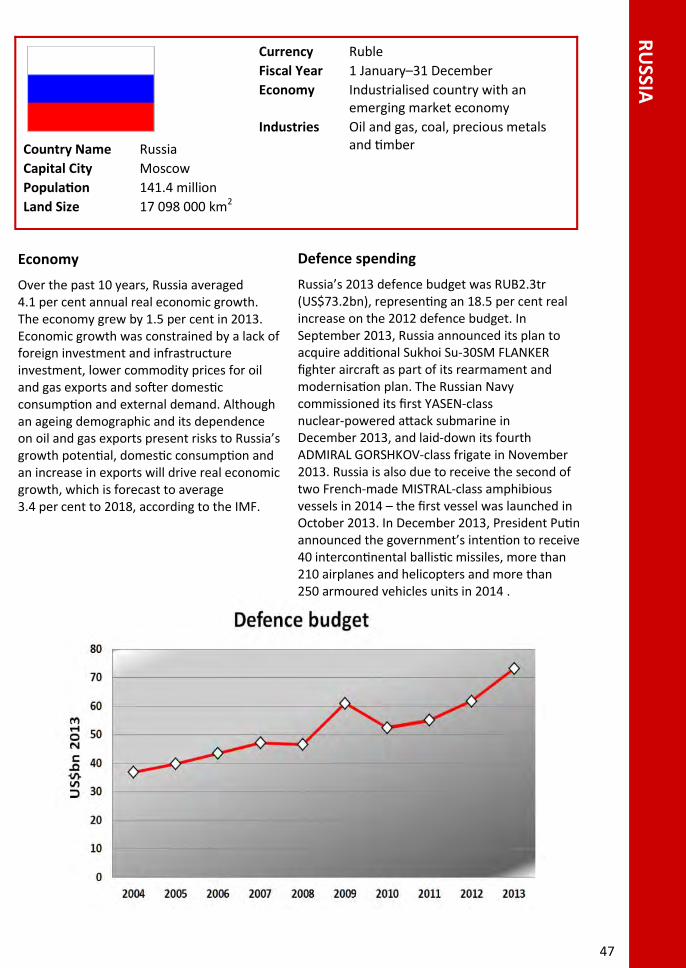
Economy
Over the past 10 years, Russia averaged 4.1 per cent annual real economic growth. The economy grew by 1.5 per cent in 2013. Economic growth was constrained by a lack of foreign investment and infrastructure investment, lower commodity prices for oil and gas exports and softer domestic consumption and external demand. Although an ageing demographic and its dependence on oil and gas exports present risks to Russia’s growth potential, domestic consumption and an increase in exports will drive real economic growth, which is forecast to average 3.4 per cent to 2018, according to the IMF.
Defence spending
Russia’s 2013 defence budget was RUB2.3tr (US$73.2bn), representing an 18.5 per cent real increase on the 2012 defence budget. In September 2013, Russia announced its plan to acquire additional Sukhoi Su-30SM FLANKER fighter aircraft as part of its rearmament and modernisation plan. The Russian Navy commissioned its first YASEN-class nuclear-powered attack submarine in December 2013, and laid-down its fourth ADMIRAL GORSHKOV-class frigate in November 2013. Russia is also due to receive the second of two French-made MISTRAL-class amphibious vessels in 2014 – the first vessel was launched in October 2013. In December 2013, President Putin announced the government’s intention to receive 40 intercontinental ballistic missiles, more than 210 airplanes and helicopters and more than 250 armoured vehicles units in 2014 .
Country Name Russia
Capital City Moscow
Population 141.4 million
Land Size 17 098 000 km2
Currency Ruble
Fiscal Year 1 January–31 December
Economy Industrialised country with an emerging market economy
Industries Oil and gas, coal, precious metals and timber
48
SOU
TH K
OR
EA
49
SOU
TH K
OR
EA
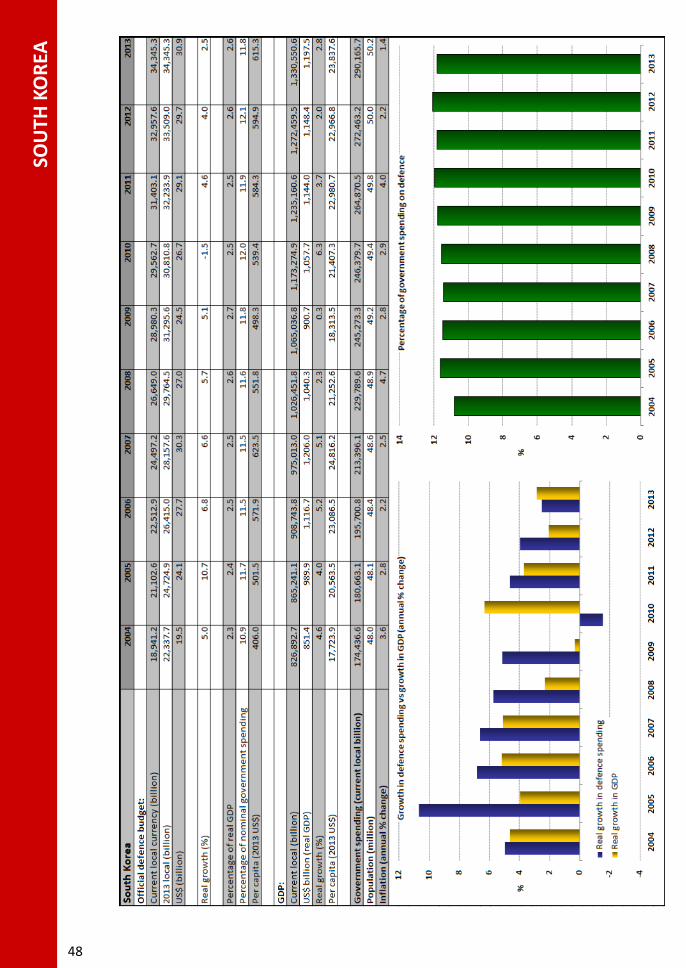
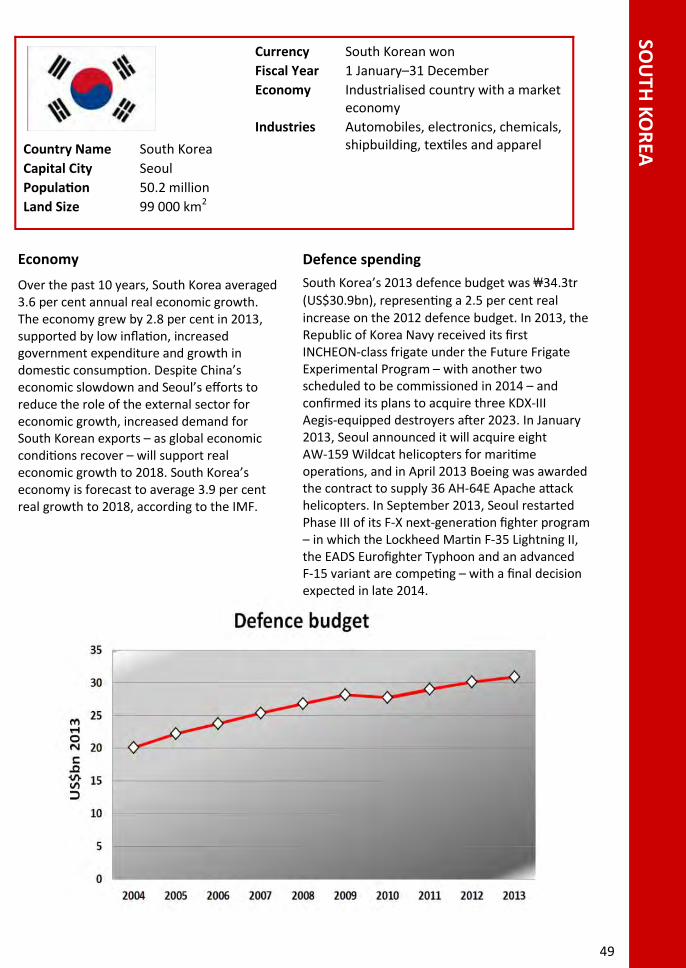
Economy
Over the past 10 years, South Korea averaged 3.6 per cent annual real economic growth. The economy grew by 2.8 per cent in 2013, supported by low inflation, increased government expenditure and growth in domestic consumption. Despite China’s economic slowdown and Seoul’s efforts to reduce the role of the external sector for economic growth, increased demand for South Korean exports – as global economic conditions recover – will support real economic growth to 2018. South Korea’s economy is forecast to average 3.9 per cent real growth to 2018, according to the IMF.
Defence spending
South Korea’s 2013 defence budget was ₩34.3tr
(US$30.9bn), representing a 2.5 per cent real increase on the 2012 defence budget. In 2013, the Republic of Korea Navy received its first INCHEON-class frigate under the Future Frigate Experimental Program – with another two scheduled to be commissioned in 2014 – and confirmed its plans to acquire three KDX-III Aegis-equipped destroyers after 2023. In January 2013, Seoul announced it will acquire eight AW-159 Wildcat helicopters for maritime operations, and in April 2013 Boeing was awarded the contract to supply 36 AH-64E Apache attack helicopters. In September 2013, Seoul restarted Phase III of its F-X next-generation fighter program – in which the Lockheed Martin F-35 Lightning II, the EADS Eurofighter Typhoon and an advanced F-15 variant are competing – with a final decision expected in late 2014.
Country Name South Korea
Capital City Seoul
Population 50.2 million
Land Size 99 000 km2
Currency South Korean won
Fiscal Year 1 January–31 December
Economy Industrialised country with a market economy
Industries Automobiles, electronics, chemicals, shipbuilding, textiles and apparel
50
TAIW
AN
51
TAIW
AN
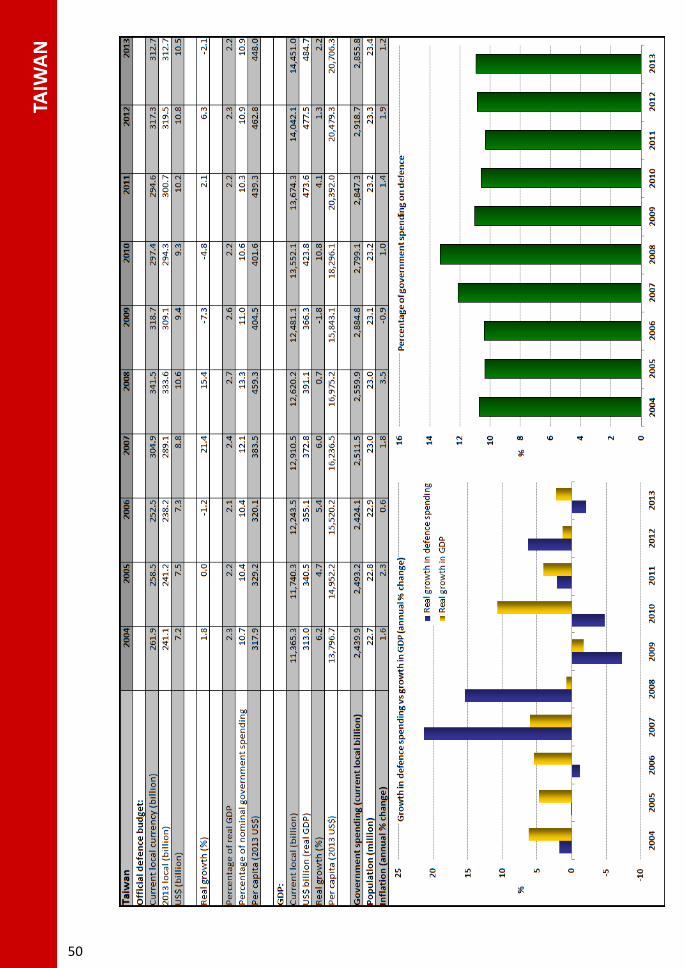
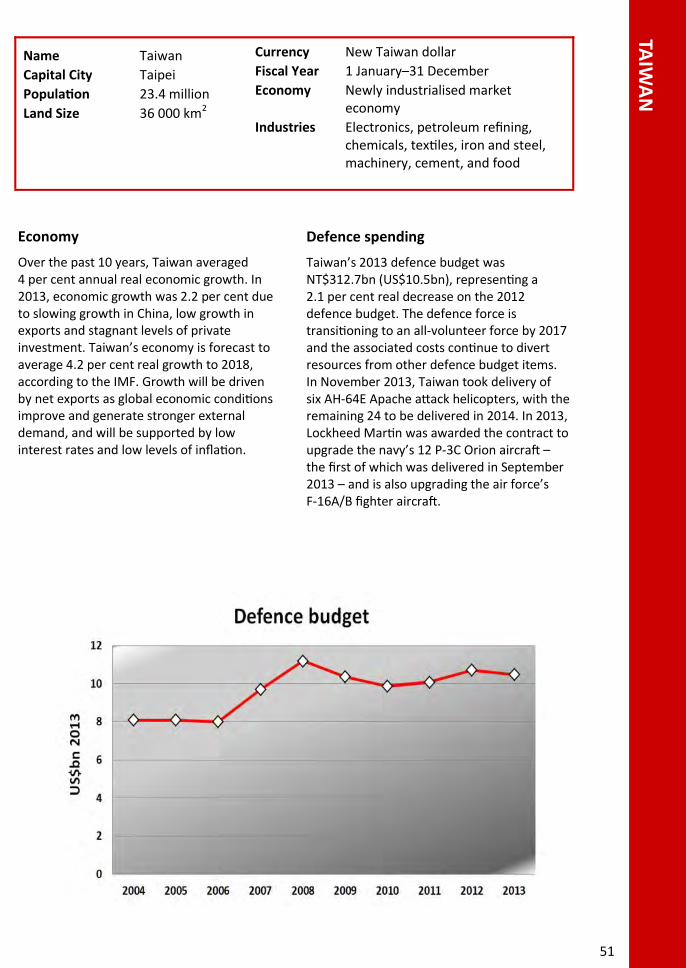
Economy
Over the past 10 years, Taiwan averaged 4 per cent annual real economic growth. In 2013, economic growth was 2.2 per cent due to slowing growth in China, low growth in exports and stagnant levels of private investment. Taiwan’s economy is forecast to average 4.2 per cent real growth to 2018, according to the IMF. Growth will be driven by net exports as global economic conditions improve and generate stronger external demand, and will be supported by low interest rates and low levels of inflation.
Defence spending
Taiwan’s 2013 defence budget was NT$312.7bn (US$10.5bn), representing a 2.1 per cent real decrease on the 2012 defence budget. The defence force is transitioning to an all-volunteer force by 2017 and the associated costs continue to divert resources from other defence budget items. In November 2013, Taiwan took delivery of six AH-64E Apache attack helicopters, with the remaining 24 to be delivered in 2014. In 2013, Lockheed Martin was awarded the contract to upgrade the navy’s 12 P-3C Orion aircraft – the first of which was delivered in September 2013 – and is also upgrading the air force’s F-16A/B fighter aircraft.
Name Taiwan
Capital City Taipei
Population 23.4 million
Land Size 36 000 km2
Currency New Taiwan dollar
Fiscal Year 1 January–31 December
Economy Newly industrialised market economy
Industries Electronics, petroleum refining, chemicals, textiles, iron and steel, machinery, cement, and food
52
SOU
TH A
SIA
– R
EGIO
NA
L O
VER
VIE
W
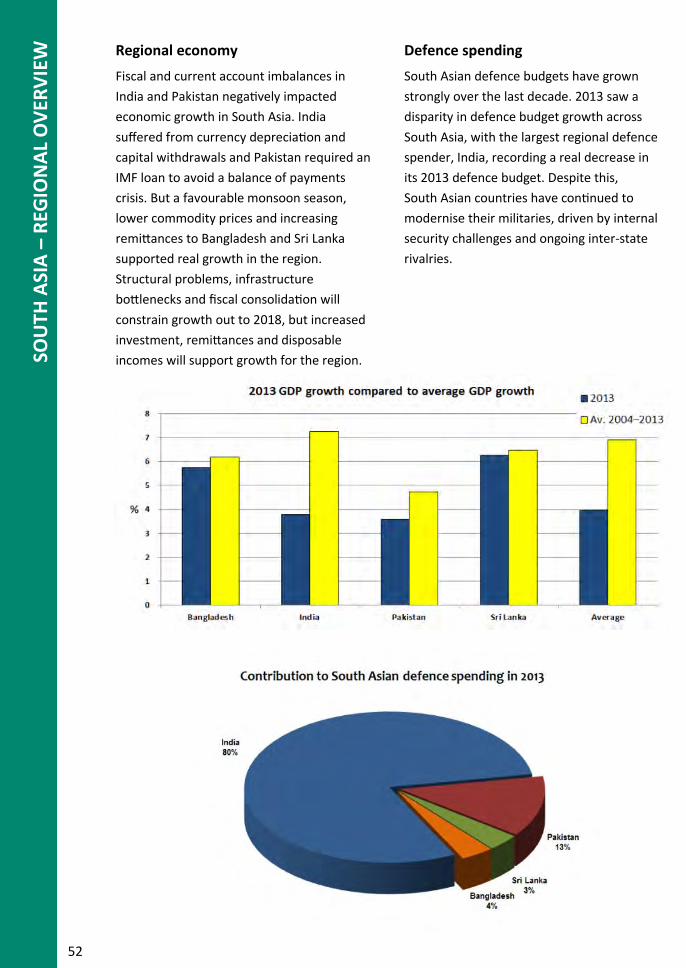
Regional economy
Fiscal and current account imbalances in
India and Pakistan negatively impacted
economic growth in South Asia. India
suffered from currency depreciation and
capital withdrawals and Pakistan required an
IMF loan to avoid a balance of payments
crisis. But a favourable monsoon season,
lower commodity prices and increasing
remittances to Bangladesh and Sri Lanka
supported real growth in the region.
Structural problems, infrastructure
bottlenecks and fiscal consolidation will
constrain growth out to 2018, but increased
investment, remittances and disposable
incomes will support growth for the region.
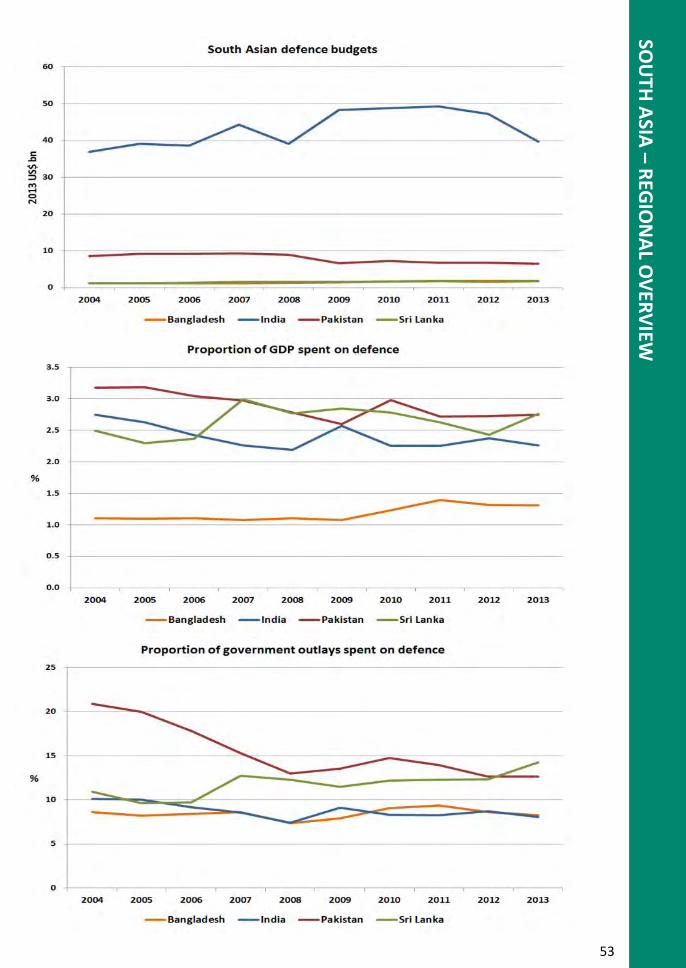
Defence spending
South Asian defence budgets have grown
strongly over the last decade. 2013 saw a
disparity in defence budget growth across
South Asia, with the largest regional defence
spender, India, recording a real decrease in
its 2013 defence budget. Despite this,
South Asian countries have continued to
modernise their militaries, driven by internal
security challenges and ongoing inter-state
rivalries.
53
SOU
TH A
SIA – R
EGIO
NA
L OV
ERV
IEW
54
BA
NG
LAD
ESH
55
BA
NG
LAD
ESH
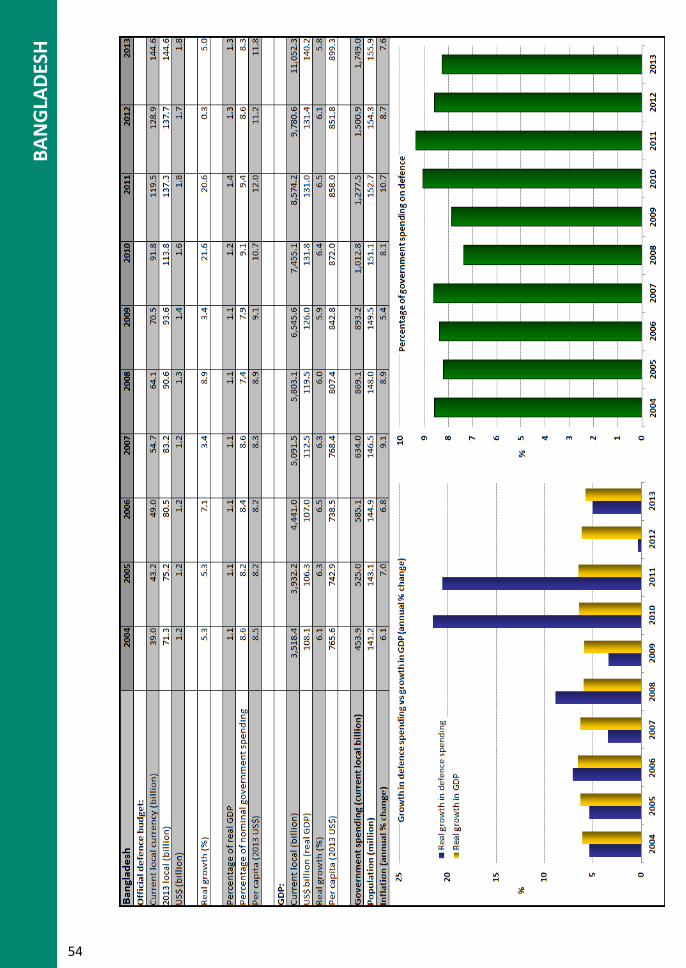
Economy
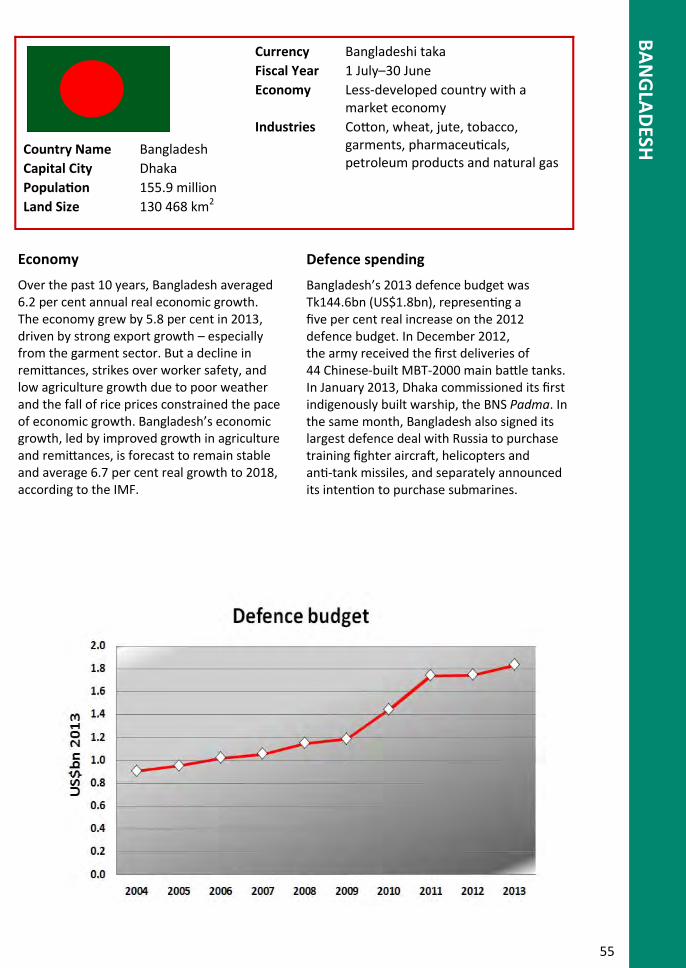
Over the past 10 years, Bangladesh averaged 6.2 per cent annual real economic growth. The economy grew by 5.8 per cent in 2013, driven by strong export growth – especially from the garment sector. But a decline in remittances, strikes over worker safety, and low agriculture growth due to poor weather and the fall of rice prices constrained the pace of economic growth. Bangladesh’s economic growth, led by improved growth in agriculture and remittances, is forecast to remain stable and average 6.7 per cent real growth to 2018, according to the IMF.
Defence spending
Bangladesh’s 2013 defence budget was Tk144.6bn (US$1.8bn), representing a five per cent real increase on the 2012 defence budget. In December 2012, the army received the first deliveries of 44 Chinese-built MBT-2000 main battle tanks. In January 2013, Dhaka commissioned its first indigenously built warship, the BNS Padma. In the same month, Bangladesh also signed its largest defence deal with Russia to purchase training fighter aircraft, helicopters and anti-tank missiles, and separately announced its intention to purchase submarines.
Country Name Bangladesh
Capital City Dhaka
Population 155.9 million
Land Size 130 468 km2
Currency Bangladeshi taka
Fiscal Year 1 July–30 June
Economy Less-developed country with a market economy
Industries Cotton, wheat, jute, tobacco, garments, pharmaceuticals, petroleum products and natural gas
56
IND
IA
57
IND
IA
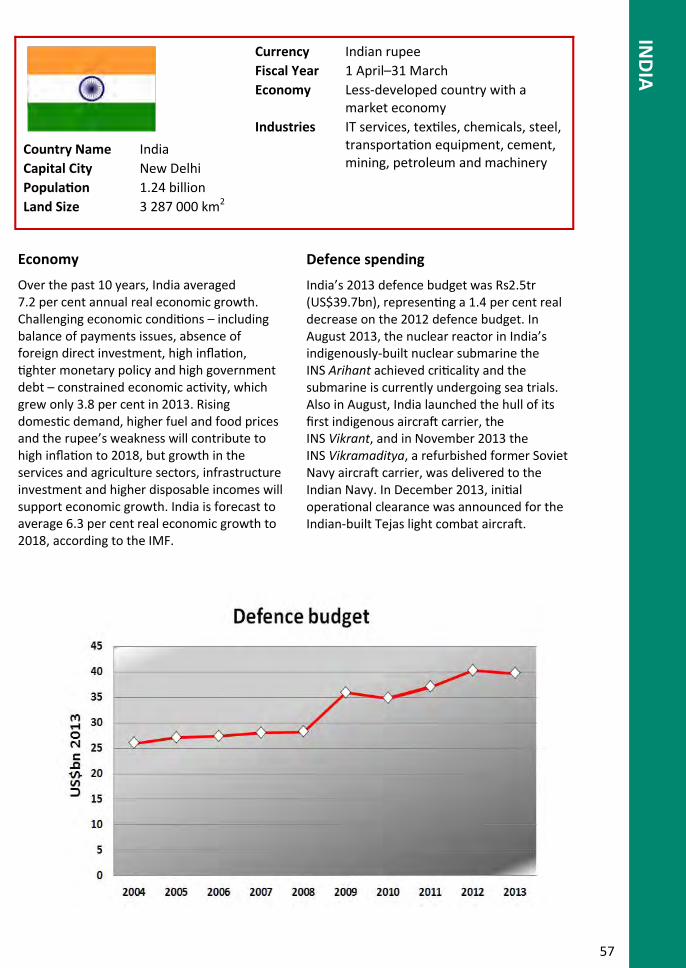
Economy
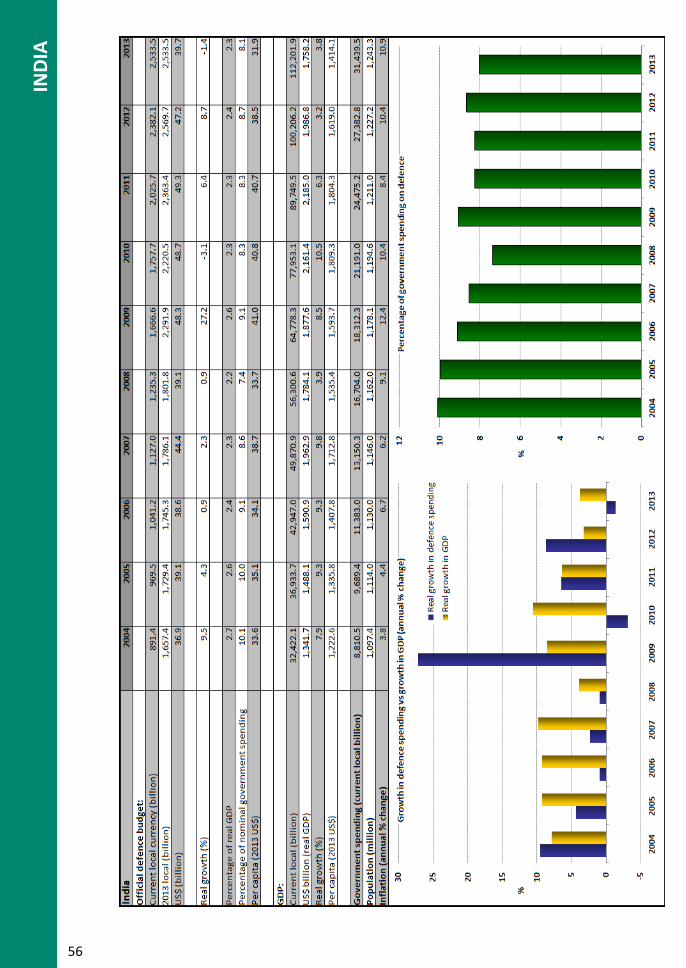
Over the past 10 years, India averaged 7.2 per cent annual real economic growth. Challenging economic conditions – including balance of payments issues, absence of foreign direct investment, high inflation, tighter monetary policy and high government debt – constrained economic activity, which grew only 3.8 per cent in 2013. Rising domestic demand, higher fuel and food prices and the rupee’s weakness will contribute to high inflation to 2018, but growth in the services and agriculture sectors, infrastructure investment and higher disposable incomes will support economic growth. India is forecast to average 6.3 per cent real economic growth to 2018, according to the IMF.
Defence spending
India’s 2013 defence budget was Rs2.5tr (US$39.7bn), representing a 1.4 per cent real decrease on the 2012 defence budget. In August 2013, the nuclear reactor in India’s indigenously-built nuclear submarine the INS Arihant achieved criticality and the submarine is currently undergoing sea trials. Also in August, India launched the hull of its first indigenous aircraft carrier, the INS Vikrant, and in November 2013 the INS Vikramaditya, a refurbished former Soviet Navy aircraft carrier, was delivered to the Indian Navy. In December 2013, initial operational clearance was announced for the Indian-built Tejas light combat aircraft.
Country Name India
Capital City New Delhi
Population 1.24 billion
Land Size 3 287 000 km2
Currency Indian rupee
Fiscal Year 1 April–31 March
Economy Less-developed country with a market economy
Industries IT services, textiles, chemicals, steel, transportation equipment, cement, mining, petroleum and machinery
58
PAK
ISTA
N
59
PAK
ISTAN
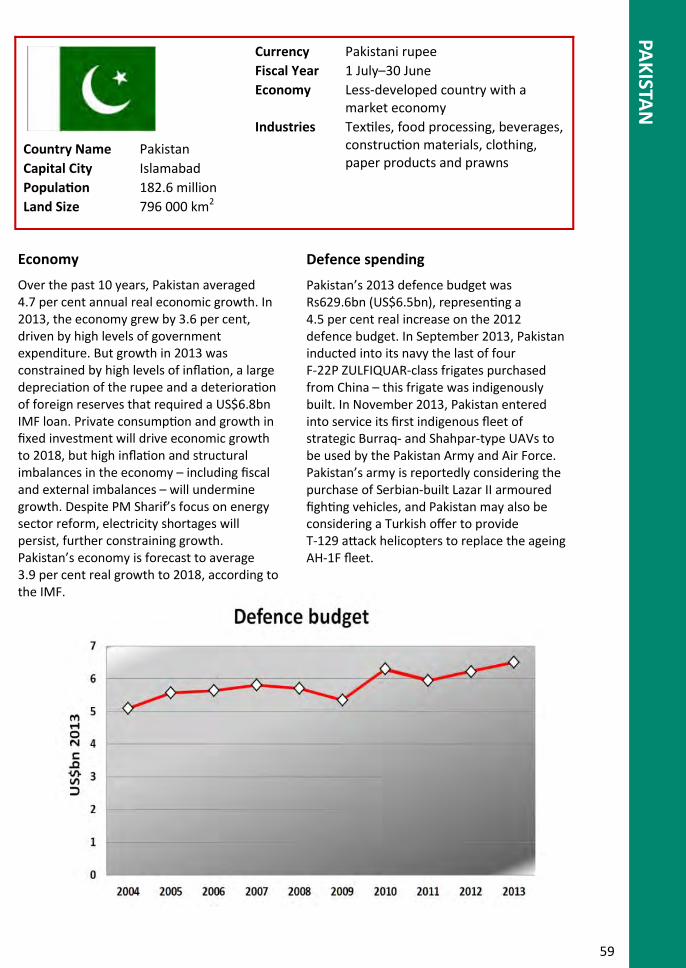
Economy
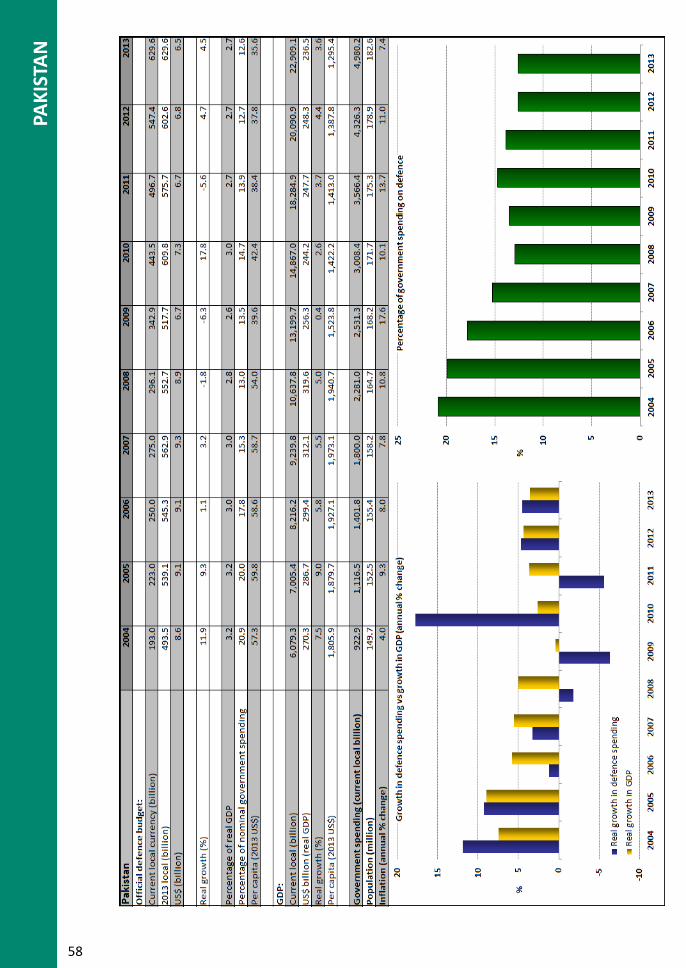
Over the past 10 years, Pakistan averaged 4.7 per cent annual real economic growth. In 2013, the economy grew by 3.6 per cent, driven by high levels of government expenditure. But growth in 2013 was constrained by high levels of inflation, a large depreciation of the rupee and a deterioration of foreign reserves that required a US$6.8bn IMF loan. Private consumption and growth in fixed investment will drive economic growth to 2018, but high inflation and structural imbalances in the economy – including fiscal and external imbalances – will undermine growth. Despite PM Sharif’s focus on energy sector reform, electricity shortages will persist, further constraining growth. Pakistan’s economy is forecast to average 3.9 per cent real growth to 2018, according to the IMF.
Defence spending
Pakistan’s 2013 defence budget was Rs629.6bn (US$6.5bn), representing a 4.5 per cent real increase on the 2012 defence budget. In September 2013, Pakistan inducted into its navy the last of four F-22P ZULFIQUAR-class frigates purchased from China – this frigate was indigenously built. In November 2013, Pakistan entered into service its first indigenous fleet of strategic Burraq- and Shahpar-type UAVs to be used by the Pakistan Army and Air Force. Pakistan’s army is reportedly considering the purchase of Serbian-built Lazar II armoured fighting vehicles, and Pakistan may also be considering a Turkish offer to provide T-129 attack helicopters to replace the ageing AH-1F fleet.
Country Name Pakistan
Capital City Islamabad
Population 182.6 million
Land Size 796 000 km2
Currency Pakistani rupee
Fiscal Year 1 July–30 June
Economy Less-developed country with a market economy
Industries Textiles, food processing, beverages, construction materials, clothing, paper products and prawns
60
SRI L
AN
KA
61
SRI LA
NK
A
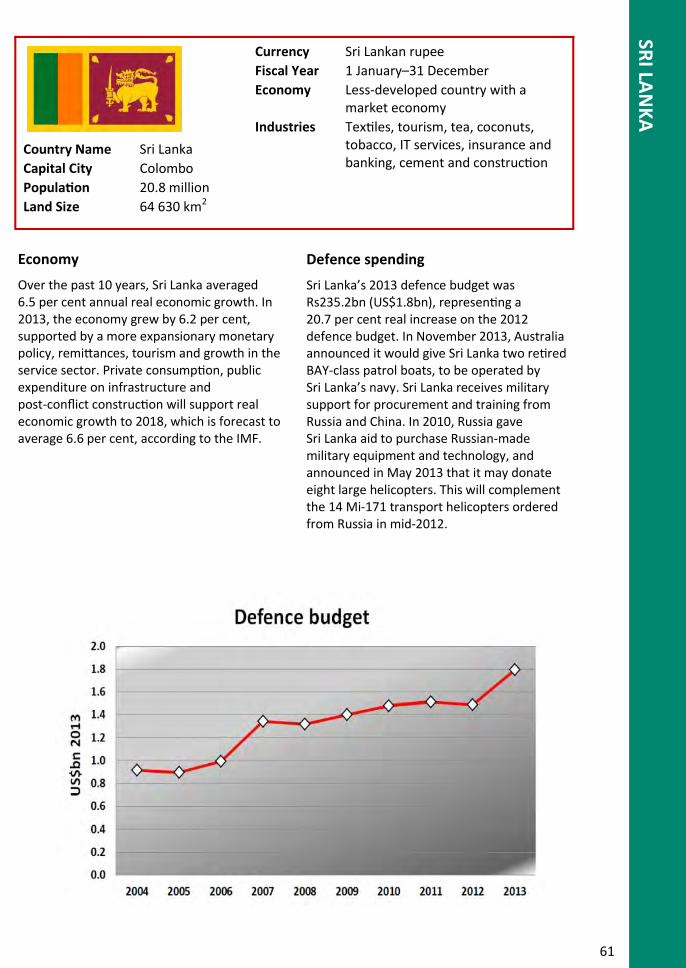
Economy
Over the past 10 years, Sri Lanka averaged 6.5 per cent annual real economic growth. In 2013, the economy grew by 6.2 per cent, supported by a more expansionary monetary policy, remittances, tourism and growth in the service sector. Private consumption, public expenditure on infrastructure and post-conflict construction will support real economic growth to 2018, which is forecast to average 6.6 per cent, according to the IMF.
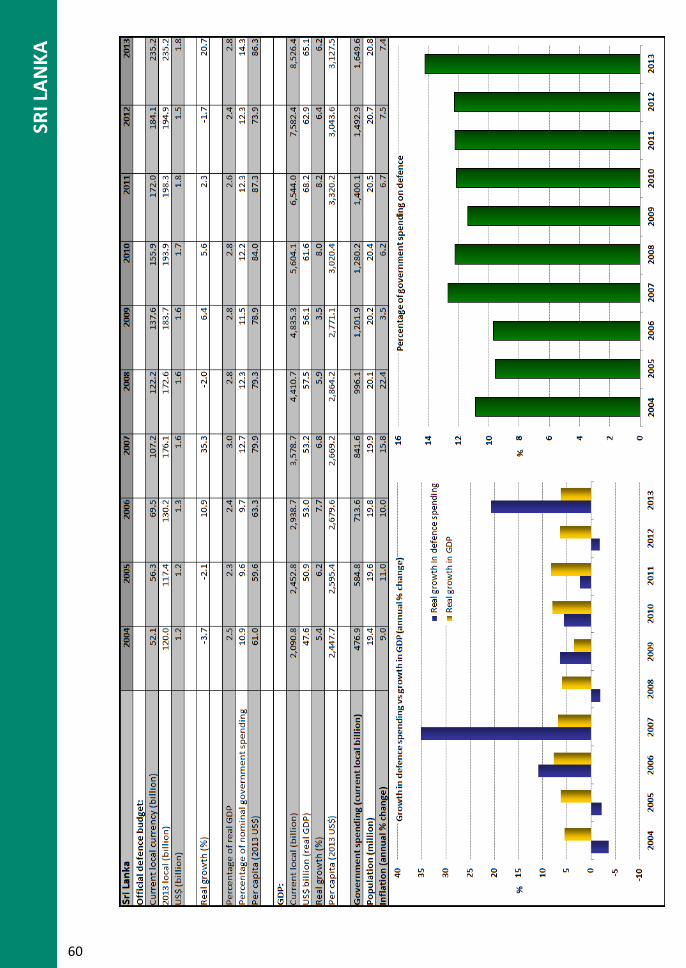
Defence spending
Sri Lanka’s 2013 defence budget was Rs235.2bn (US$1.8bn), representing a 20.7 per cent real increase on the 2012 defence budget. In November 2013, Australia announced it would give Sri Lanka two retired BAY-class patrol boats, to be operated by Sri Lanka’s navy. Sri Lanka receives military support for procurement and training from Russia and China. In 2010, Russia gave Sri Lanka aid to purchase Russian-made military equipment and technology, and announced in May 2013 that it may donate eight large helicopters. This will complement the 14 Mi-171 transport helicopters ordered from Russia in mid-2012.
Country Name Sri Lanka
Capital City Colombo
Population 20.8 million
Land Size 64 630 km2
Currency Sri Lankan rupee
Fiscal Year 1 January–31 December
Economy Less-developed country with a market economy
Industries Textiles, tourism, tea, coconuts, tobacco, IT services, insurance and banking, cement and construction
62
OTH
ER C
OU
NTR
IES
– O
VER
VIE
W
63
AU
STRA
LIA
64
CA
NA
DA
65
FRA
NC
E
66
NEW
ZEA
LAN
D
67
UN
ITED K
ING
DO
M
68
UN
ITED
STA
TES
69
AP
PEN
DIX
A – M
ETHO
DO
LOG
Y
Methodology
The Defence Economic Trends series is titled and numbered according to the year in which the report is published. Defence Economic Trends 2013 was the first year this method was implemented. Previous editions have been titled for the calendar year of the budgets being reviewed. The last of the series to use the old convention was Defence Economic Trends 2011, which was published in 2012.
Defence Economic Trends 2014 employs a different methodology to calculate historical defence spending in US dollars. A GDP price deflator is used to deflate historic defence budgets expressed in local currency into 2013 constant terms. The new method employs year-specific (current) exchange rates, instead of constant 2013 exchange rates, to translate historical defence expenditure to a US dollar base. This provides a more accurate view of the buying power displayed by defence budgets at any point in time. To create simple visual comparisons of defence spending trends, graphical representations of defence budgets use constant 2013 exchange rates. Part of the annual changes in defence expenditure illustrated in these graphs is attributable to the appreciation or depreciation of the local currency with respect to the US dollar.
Although new economic forecasts were released during the development of this publication, not all data can be updated to the latest predictions. For Defence Economic Trends 2014, the information is sourced from the International Monetary Fund’s World Economic Outlook, released in October 2013.
Historical methodology
Before Defence Economic Trends 2013, a proxy defence deflator was used to calculate nominal defence budget figures into constant US dollars. The model used 2005 as a base year for comparison, using a proxy deflator based on three key defence expenditure factors: capital procurement; personnel; and operating costs. In previous publications, defence budget calculations used constant exchange rates to convert historical defence spending (expressed in local currency) into constant US dollar terms.
70
AP
PEN
DIX
B –
NO
TES
ON
SO
UR
CES
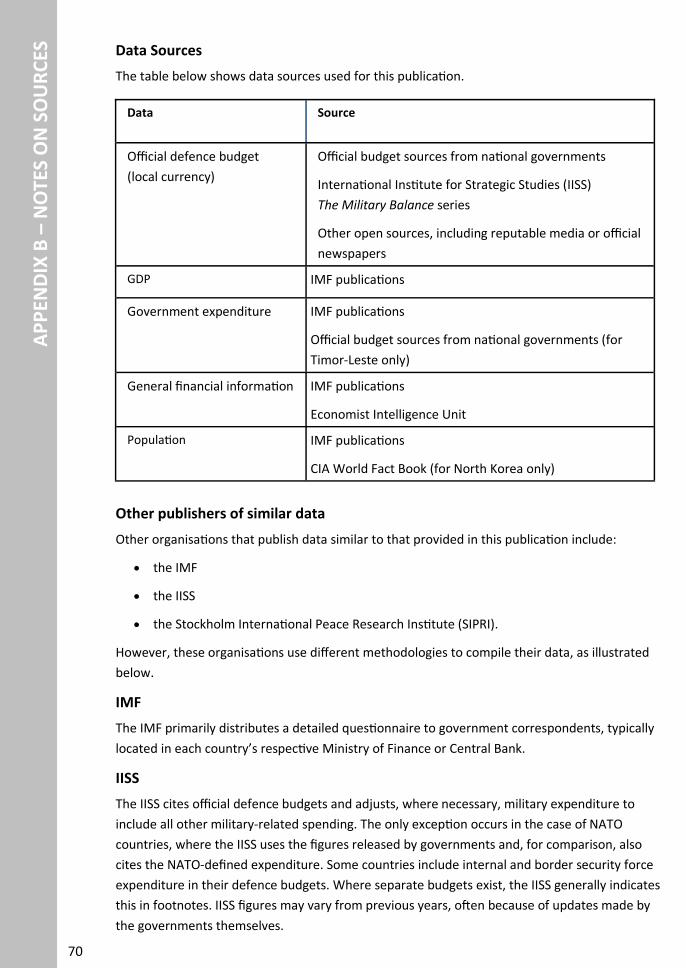
Data Sources
The table below shows data sources used for this publication.
Other publishers of similar data
Other organisations that publish data similar to that provided in this publication include:
the IMF
the IISS
the Stockholm International Peace Research Institute (SIPRI).
However, these organisations use different methodologies to compile their data, as illustrated
below.
IMF
The IMF primarily distributes a detailed questionnaire to government correspondents, typically
located in each country’s respective Ministry of Finance or Central Bank.
IISS
The IISS cites official defence budgets and adjusts, where necessary, military expenditure to
include all other military-related spending. The only exception occurs in the case of NATO
countries, where the IISS uses the figures released by governments and, for comparison, also
cites the NATO-defined expenditure. Some countries include internal and border security force
expenditure in their defence budgets. Where separate budgets exist, the IISS generally indicates
this in footnotes. IISS figures may vary from previous years, often because of updates made by
the governments themselves.
Data Source
Official defence budget
(local currency)
Official budget sources from national governments
International Institute for Strategic Studies (IISS)
The Military Balance series
Other open sources, including reputable media or official
newspapers
GDP IMF publications
Government expenditure IMF publications
Official budget sources from national governments (for
Timor-Leste only)
General financial information IMF publications
Economist Intelligence Unit
Population IMF publications
CIA World Fact Book (for North Korea only)
71
AP
PEN
DIX
B – N
OTES O
N SO
UR
CES
Wherever possible, the IISS uses exchange rates taken from IMF publications – although these may not be applicable to commercial transactions. In some cases, in an effort to make US Dollar figures more relevant for international comparisons, the IISS uses a different set of exchange rates to calculate defence spending, which reflects the differences in purchasing power parity terms between the civilian and military sectors.
SIPRI
Where possible, SIPRI includes the following items in its definition of military expenditure:
all current and capital expenditure on the armed forces and the running of defence
departments and other government agencies engaged in defence projects and space
activities
the cost of paramilitary forces, border guards and police (when judged to be trained and
equipped for military operations)
military research and development, testing and evaluation costs and
costs of retirement pensions of defence personnel and civilian employees.
72
AP
PEN
DIX
B –
NO
TES
ON
SO
UR
CES
© Commonwealth of Australia 2014
ISSN 1835-386X (Print)
ISSN 1835-3878 (Online)
This work is copyright. Apart from any use as permitted under the Copyright Act 1968, no part
may be reproduced by any process without prior written permission from the Commonwealth.
Requests and inquiries concerning reproduction and rights should be addressed to:
Commonwealth Copyright Administration
Attorney General’s Department
Robert Garran Offices
National Circuit
Barton ACT 2600
or posted at http://www.ag.gov.au/cca
Cover photographs courtesy of Lockheed Martin, used with permission from
Air Force Headquarters.