Embed Size (px)
Citation preview
Program & Abstracts of the 5th Meeting of AIG Collaborative Research Institute for International Study on Eruptive History and Informatics, Fukuoka University and
9th Meeting of of West Japan Volcanism Research Group
7-8th February, 2015; 18th Building, Nanakuma Campus, Fukuoka University
2015 2 7 8
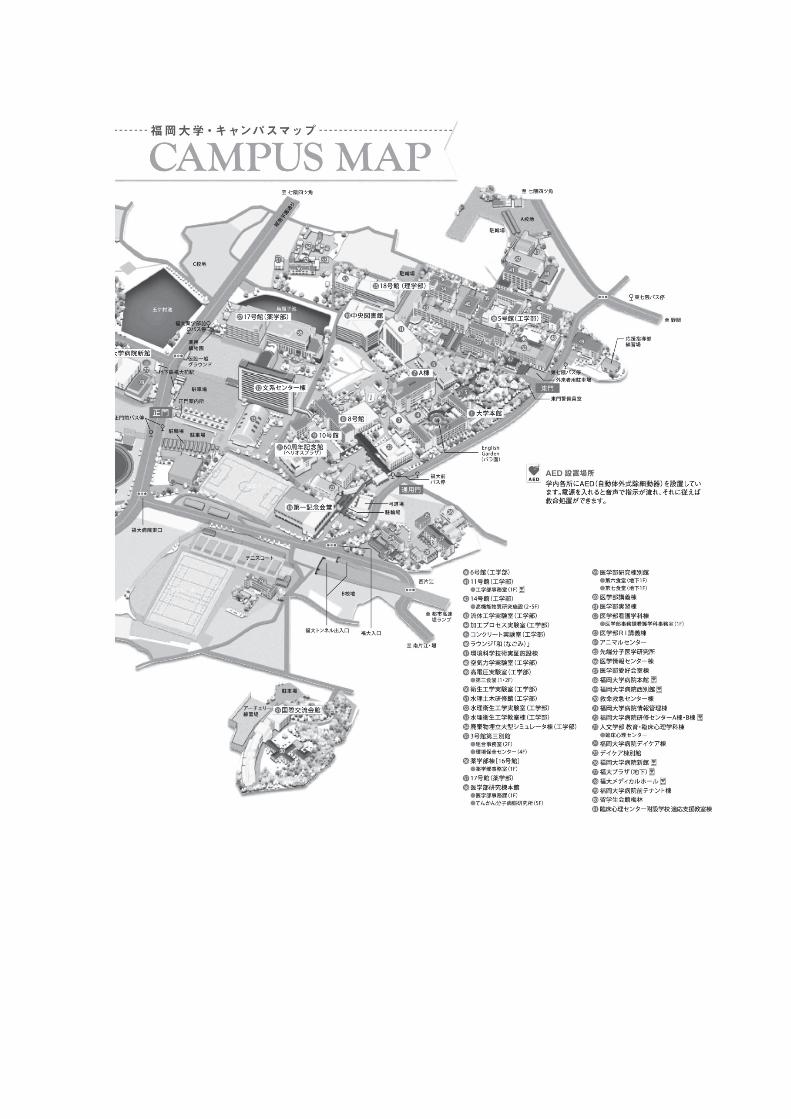
18 1824 2 7
(13:00 – 15:30)
1-01
1-02 Paul Wallace
1-03
14:10 – 14:20 1-04
1-05
1-06
TL
(15:40 – 17:10)
2-01 (2)
2-02
2-03
2-04
2 8 (9:00 – 14:00)
3-01
3-02
3-03
11:00 – 11:10 3-04
3-05
-4
12:10 – 13:00 3-06
3-07
3-08
3-09
1980
(14:10 – 15:30)
4-01
4-02
4-03 Agung Harijoko and Wayan Warmada
Volcanic history and geothermal activity in Dieng geothermal field, central Java, Indonesia
(15:40 – 17:20)
5-01 Chris Newhall Geology and crisis management of Pinatubo volcano, central Luzon,
Philippines 5-02 E. Bariso M.T. Quilalang
A. Daag (PHIVOLCS)
TL 5-03 E. Bariso M.T.
Quilalang A. Daag (PHIVOLCS) Radiocarbon dating of wood trunks from crater wall of Pinatubo
volcano, Luzon Island, Philippines 5-04 E. Bariso D.J. Rivera R. Lim C. Pogay
A. Daag PHIVOLCS
Program of 5th Meeting of AIG Collaborative Research Institute for International Study on Eruptive History and Informatics, Fukuoka University and 9th Meeting of West Japan Volcanism Research Group Date 7-8th February, 2015 Venue Room 1824 in 18th Building, Nanakuma Campus, Fukuoka University Day 1 (7th February, 2015) Session 1: Volcanic Geology in Kyushu Island (13:00 – 15:30) 1-01 M. Okuno: Radiocarbon dating of paleosol: case study on Onidake
scoria falls, Fukue Island 1-02 T. Tamura et al.: Magma generation process beneath volcanic front
of Kyushu arc, Japan - Approach from melt inclusion – 1-03 Y. Tajima: Eruptive history of Koshikidake volcano in the
Kirishima volcanic group - A study of the type for compound or composite volcanoes-
(Break) 14:10 – 14:20 1-04 M. Tsutsui and T. Kobayashi: Agglutinate and pyroclastic flow
deposit at the Ohachi volcano, Kirishima volcanic group, southern Kyushu, Japan
1-05 H. Naruo: Overturned strata caused by Koya ignimbrite from Kikai caldera
1-06 T. Sakaguchi et al.: Source of Matsunodai debris avalanche deposit inferred from thermoluminesence age and chemical composition, Kuju volcanic group, central Kyushu, Japan
Session 2: Informatics for Outcrop Database (15:40 – 17:10) 2-01 S. Yokota: Difficulties in construction of geological exposures
database (2) 2-02 M. Okumura et al.: Preparation of outcrop information site and
supporting tools for collecting and sharing geological data
2-03 S. Takahashi et al.: Development of Geo-Information Database Service for Data Sharing
2-04 N. Tsuruta: About secondary use of eruptive history and informatics database
Day 2 (8th February, 2015) Session 3: Caldera Volcanoes and Caldera-forming Eruptions (9:00
– 14:00) 3-01 H. Inakura et al.: Eruptive history of Ikeda caldera, southern
Kyushu, Japan 3-02 N. Geshi: Precursory eruptive process for the Ito ignimbrite
eruption of Aira caldera: Decompression process of the magma chamber
3-03 D. Miura: The volume and periodicity of magma discharge at the caldera-forming eruption: A review
(Break) 11:00 – 11:10 3-04 D. Zhao: Tomographic imaging of the deep structure of active
volcanoes 3-05 H. Yamasaki et al.: Temporal variation of magma composition as
observed by plagioclase and melt inclusions in Aso-4 pyroclastic flow deposit
(Lunch) 12:10 – 13:00 3-06 T. Kobayashi and H. Naruo: Akahoya eruption of Kikai caldera 3-07 M. Okuno: Possibility of biggest eruption of Sakurajima volcano,
viewed from eruptive history 3-08 S. Taguchi: Remnant of volcanic fluid in geothermal
manifestations such as steaming ground and hot springs --- a good monitoring point for big eruptions? ---
3-09 K. Watanabe: Petrological monitoring using early tephra for volcanic activity - Case study of Mt. St. Helense 1980 eruption-S.
Session 4: Volcanology in Indonesia (14:10 – 15:30) 4-01 S. Nakada et al.: Eruptions at Sinabung and Kelud in Indonesia 4-02 I. Moriya: Volcanic geomorphology of Indonesia 4-03 A. Harijoko and I W. Warmada: Volcanic history and geothermal
activity in Dieng geothermal field, central Java, Indonesia
Session 5: Volcanology in Philippines (15:40 – 17:20) 5-01 C. Newhall: Geology and crisis management of Pinatubo volcano,
central Luzon, Philippines 5-02 I. Takashima et al.: Thermoluminescence (TL) age of rocks from
summit crater lake at Pinatubo volcano, Luzon Island, Philippines
5-03 M. Okuno et al.: Radiocarbon dating of wood trunks from crater wall of Pinatubo volcano, Luzon Island, Philippines
5-04 M. Torii et al.: Boring cored sediments from Paitan Lake, central Luzon, Philippines
- 1 -
1-01
Radiocarbon dating of paleosol: case study on Onidake scoria falls, Fukue Island
M. Okuno (Fac. Sci., Fukuoka Univ.)
315m Fig. 1
1977 11 2004
18,090±100 BP GX-25301-AMS 14C
2004 Tn AT
1976 K-Ah 1978
2004 AT K-Ah 29 cal kBP 7.3 cal kBP 2002 14C
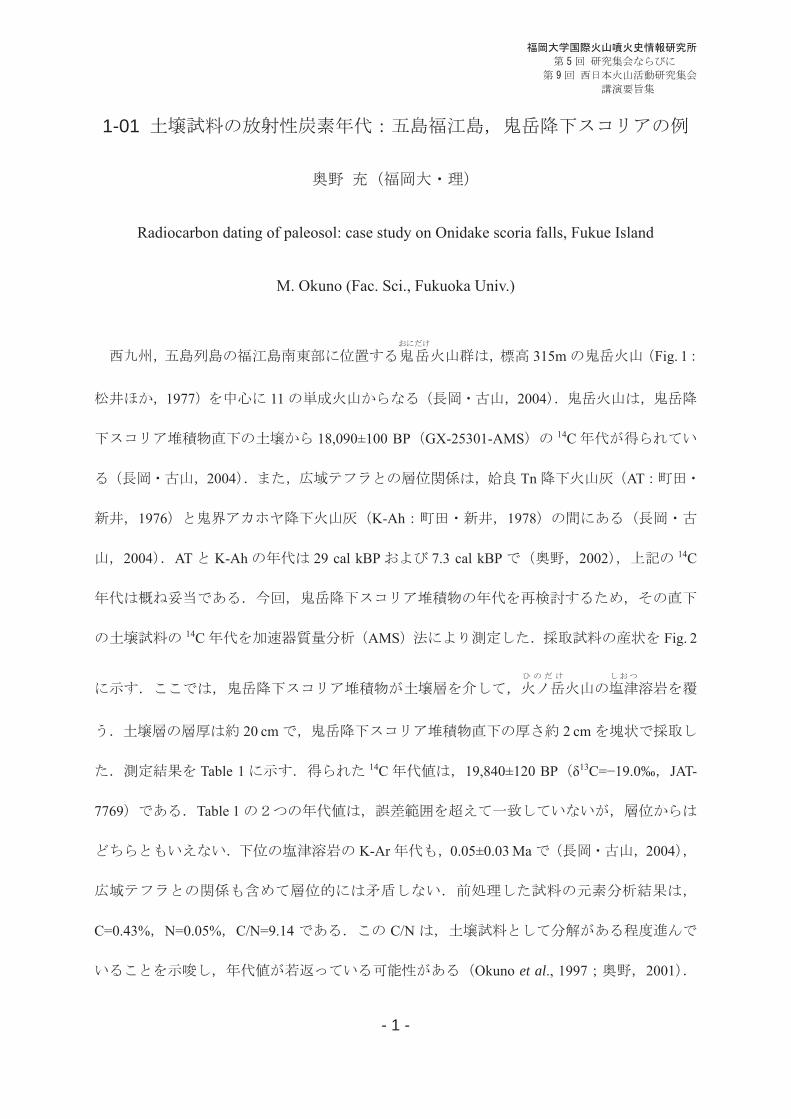
14C AMS Fig. 2
20 cm 2 cm
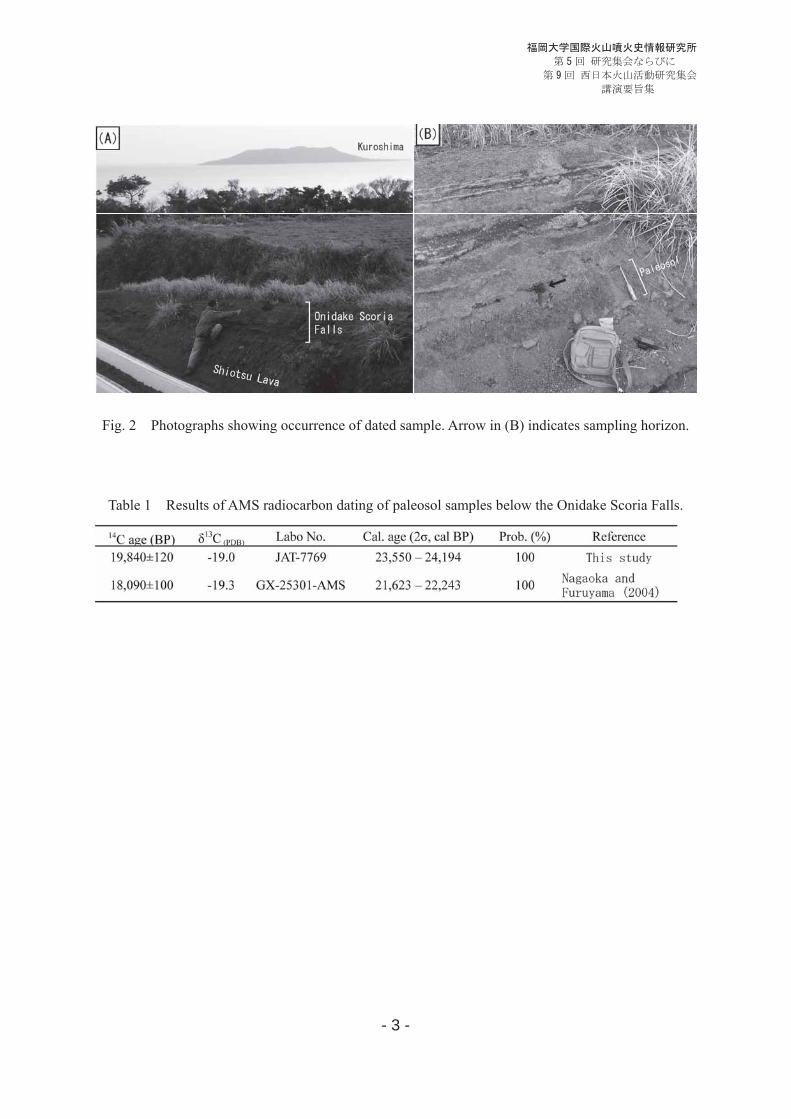
Table 1 14C 19,840±120 BP 13C= 19.0‰ JAT-
7769 Table 1
K-Ar 0.05±0.03 Ma 2004
C=0.43% N=0.05% C/N=9.14 C/N
Okuno et al., 1997 2001

- 2 -
18,090±100 BP Table 1 2000 14C yr
14C Okuno et al., 1997 Okuno and Nakamura, 2003
2 23,550 – 24,194 cal BP probability=100% 24 cal kBP
14C
C/N 20
Fig. 1 Isopach map of the Onidake Scoria Falls (after, Nagaoka and Furuyama, 2004). A star
indicates sampling site.
- 3 -
Fig. 2 Photographs showing occurrence of dated sample. Arrow in (B) indicates sampling horizon.
Table 1 Results of AMS radiocarbon dating of paleosol samples below the Onidake Scoria Falls.
- 4 -
1-02
Paul Wallace
Magma generation process beneath volcanic front of Kyushu arc, Japan
- Approach from melt inclusion -
T. Tamura (West JEC), T. Hasenaka (Kumamoto Univ.),
P. Wallace (Oregon Univ.), A. Yasuda (Tokyo Univ.),
Y. Mori (Kitakyushu Museum of Natural History & Human History)
4
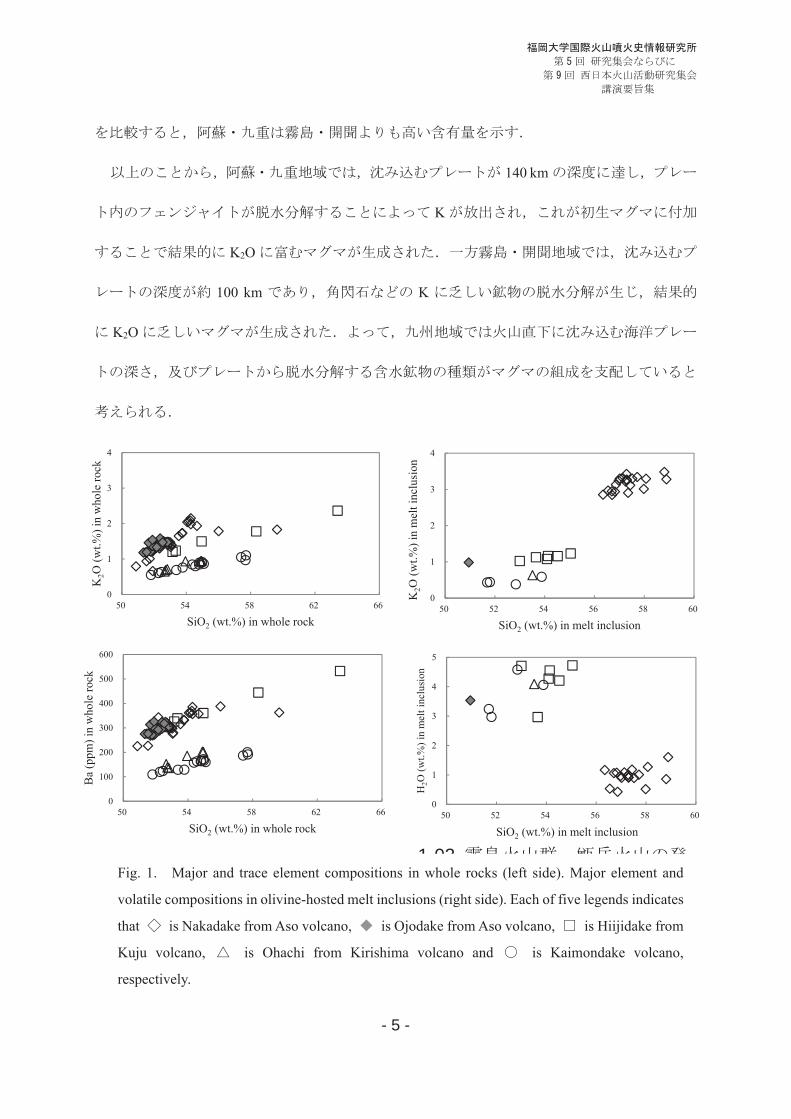
K2O K2O
2
Shiono, 1974; Nakada and Kamata,
1991; Wang and Zhao, 2006 140 km
100 km 110 km
K2O Schmidt, 1996
Ba Ba Zack et al., 2001
- 5 -
140 km
K
K2O
100 km K
K2O
1-03
Eruptive history of Koshikidake volcano in the Kirishima volcanic group
0
1
2
3
4
5
50 52 54 56 58 60
H2O
(wt.%
) in
mel
t inc
lusi
on
SiO2 (wt.%) in melt inclusion
0
100
200
300
400
500
600
50 54 58 62 66
Ba
(ppm
) in
who
le ro
ck
SiO2 (wt.%) in whole rock
Fig. 1. Major and trace element compositions in whole rocks (left side). Major element and
volatile compositions in olivine-hosted melt inclusions (right side). Each of five legends indicates
that is Nakadake from Aso volcano, is Ojodake from Aso volcano, is Hiijidake from
Kuju volcano, is Ohachi from Kirishima volcano and is Kaimondake volcano,
respectively.
0
1
2
3
4
50 52 54 56 58 60
K2O
(wt.%
) in
mel
t inc
lusi
on
SiO2 (wt.%) in melt inclusion
0
1
2
3
4
50 54 58 62 66
K2O
(wt.%
) in
who
le ro
ck
SiO2 (wt.%) in whole rock
- 6 -
- A study of the type for compound or composite volcanoes-
Y. Tajima (Nippon Koei Co., Ltd.)
1988 2007
Kr-Kb
, 1969 Imura 1992
2011
1: , 1957;
, 2001 7 km 30 km2
2011 11
Ks-1 Ks-5
Ks-6
Ks-1 Ks-6 Ks-1
Ks-6 Ks-7a
Ks-8
Ks-8 Ks-9 Ks-10
1300 500
2007
1000
, 1988

- 7 -
. E3 E5 E7 E9 (2014)
Ks- .
.
- 8 -
1-04
Agglutinate and pyroclastic flow deposit at the Ohachi Volcano, Kirishima Volcanic Group,
Southern Kyushu, Japan
M. Tsutui (DIA Consultant Co., Ltd.) and T. Kobayasho (Kagoshima Univ.)
1
1425 m
2
ThT 3 ThT-a
ThT-b ThT-c 106 107 m3 DRE
1-6
ThT-c 7
8
3
1100 1050 m
- 9 -
-3 5 1 9
Walker 1971 Fall
Walker 1971 Flow
Flow Fall Fall
4
106 107 m3 ThT-c
106 107 m3
- 10 -
106 107 m3
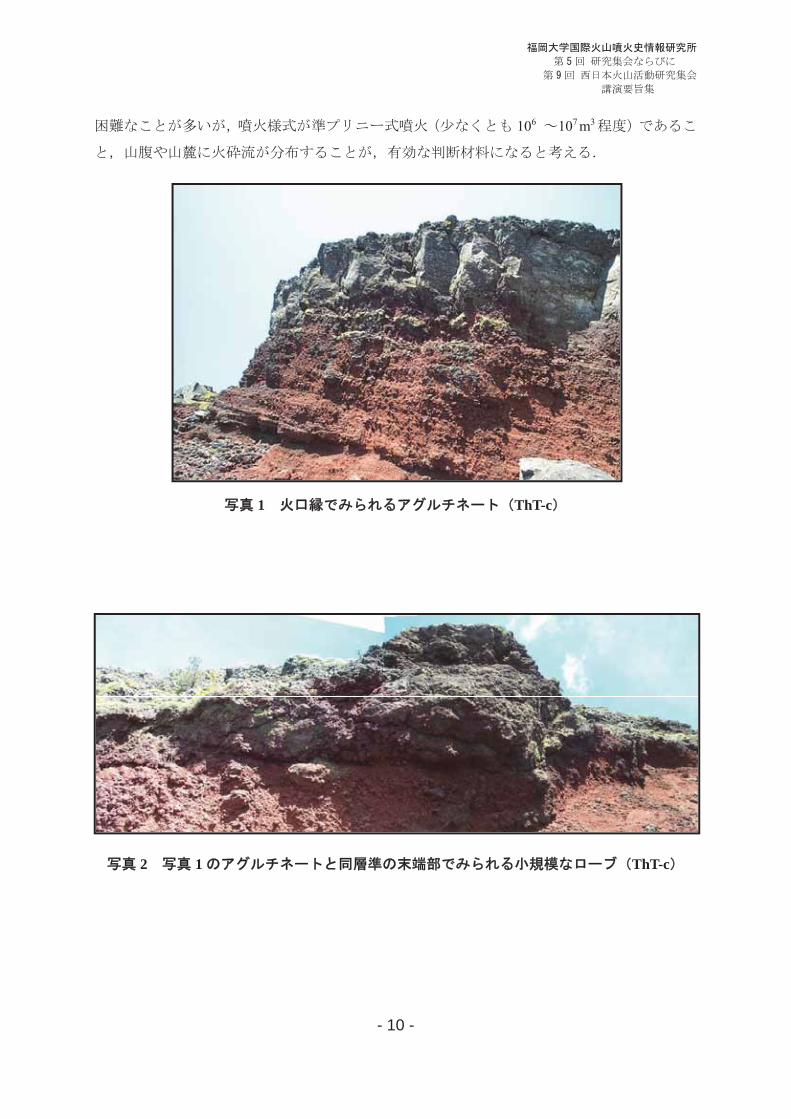
1 ThT-c
2 1 ThT-c
- 11 -
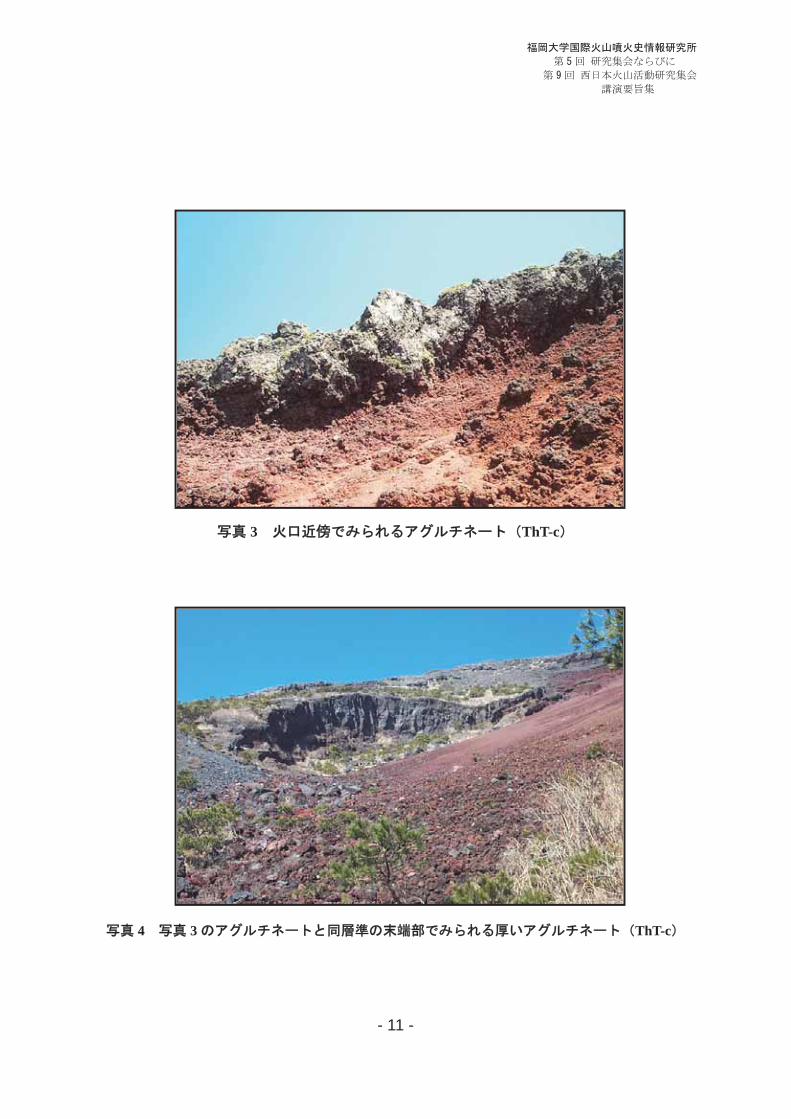
3 ThT-c
4 3 ThT-c
- 12 -
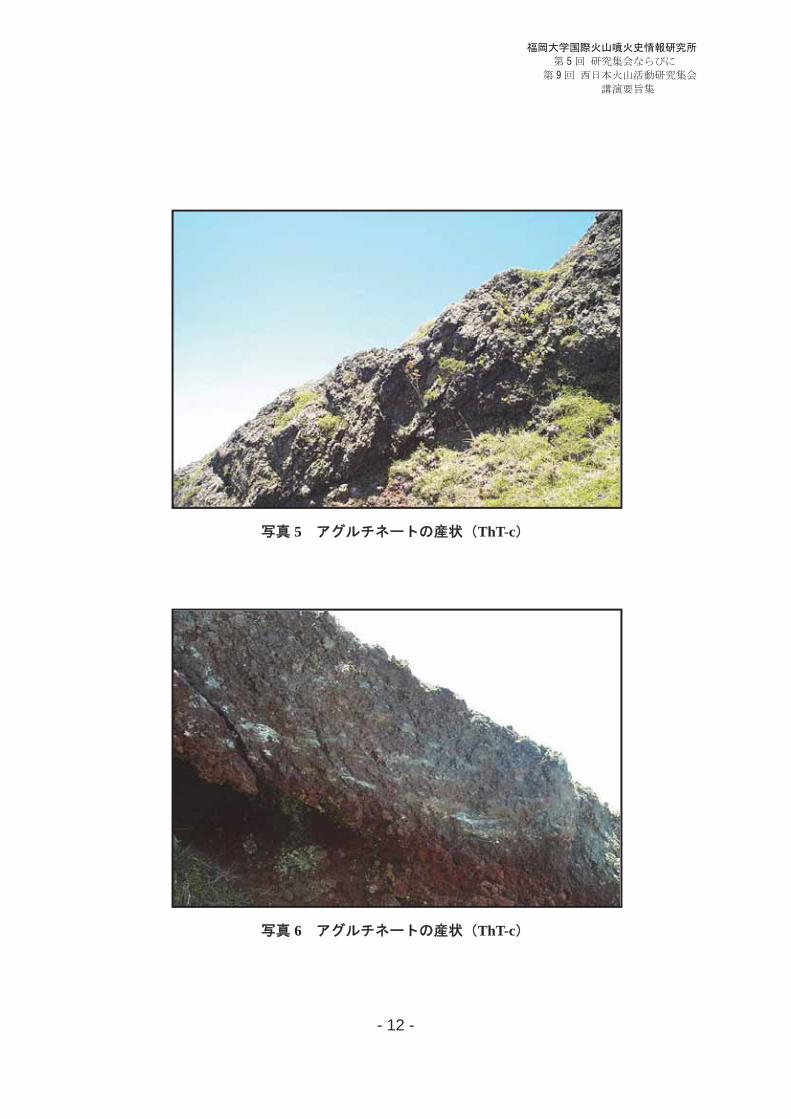
5 ThT-c
6 ThT-c
- 13 -
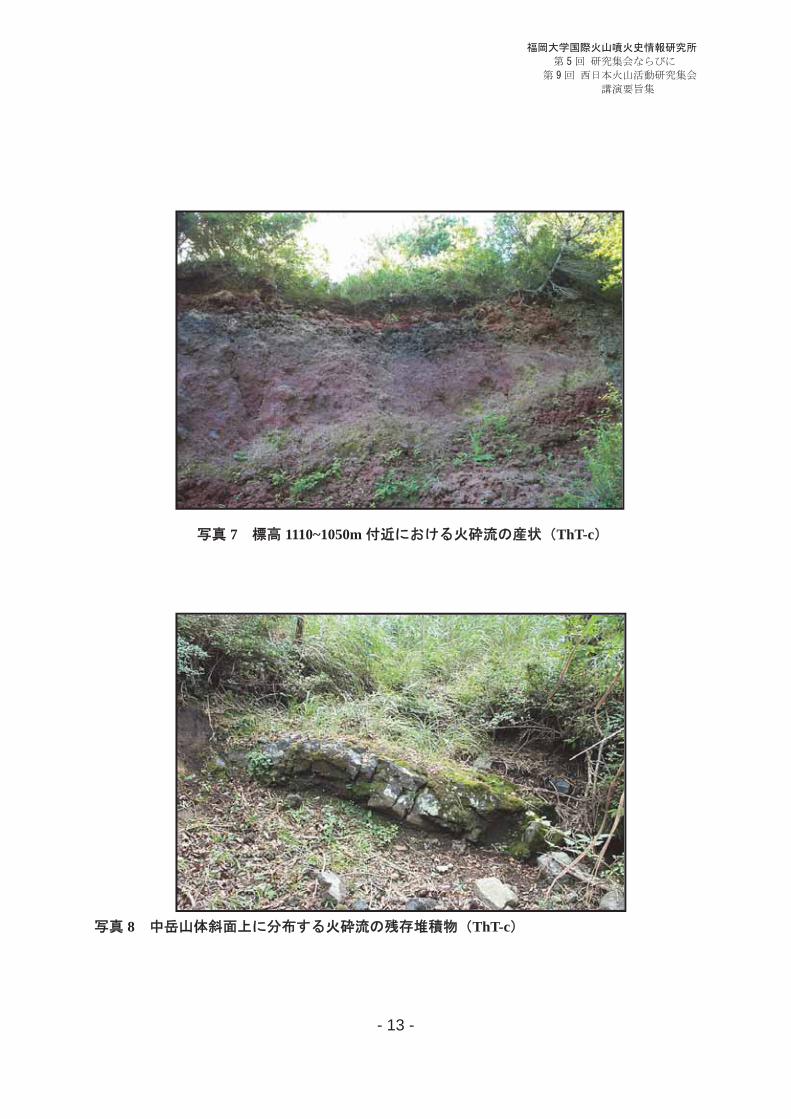
7 1110~1050m ThT-c
8 ThT-c
- 14 -
1-05
Overturned strata caused by Koya ignimbrite from Kika caldera
H. Naruo (Takeokadai Senior High School)
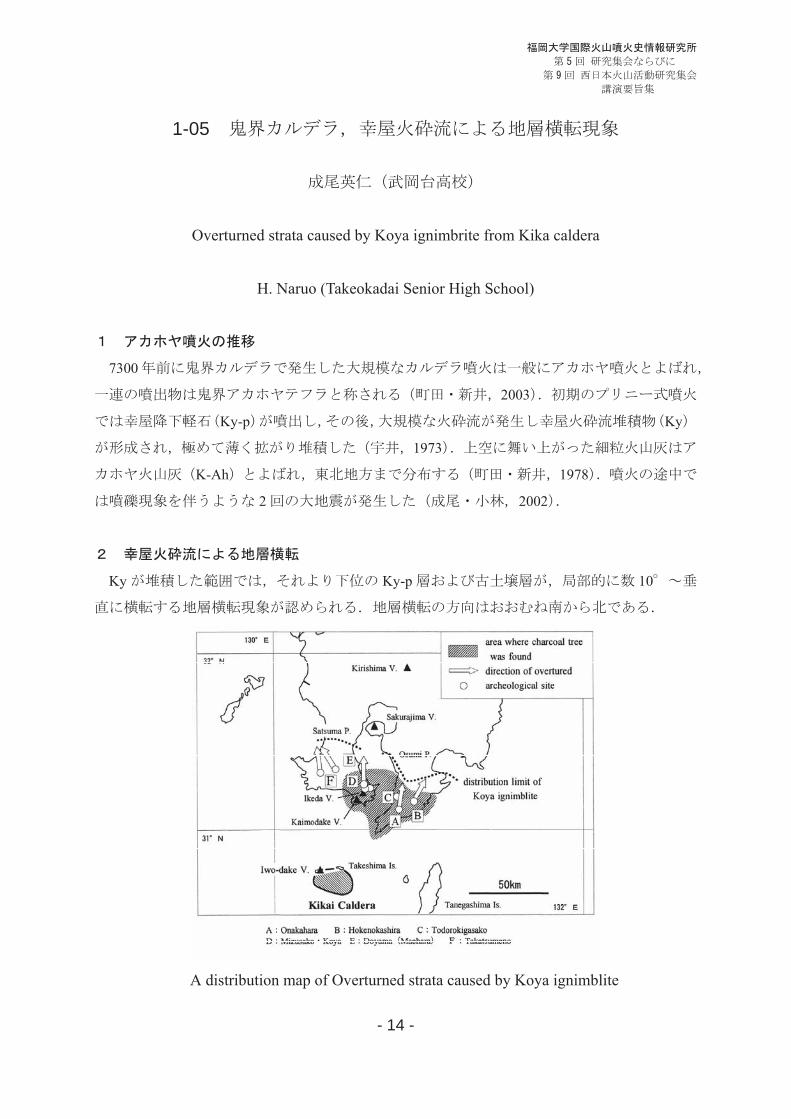
7300
2003
Ky-p Ky
1973
K-Ah 1978
2 2002
Ky Ky-p 10
A distribution map of Overturned strata caused by Koya ignimblite
- 15 -
Ky
2003
Ky
(Sz-S)
2000
SZ-S
45
30cm Ky-p
Ky K-Ah
50
Ky-p
Ky Ky-p
Ky Ky
Ky
Ky-p Ky 50
Ky
- 16 -
1-06 TL
Source of Matsunodai debris avalanches deposit inferred from thermoluminescence age and
chemical composition, Kuju volcanic group, central Kyushu, Japan
T. Sakaguchi, M. Yuhara, K. Yamasaki and M. Okuno (Fukuoka Univ.)
MDA
MDA
MDA
TL MDA
2
1963 1991
MDA
TL
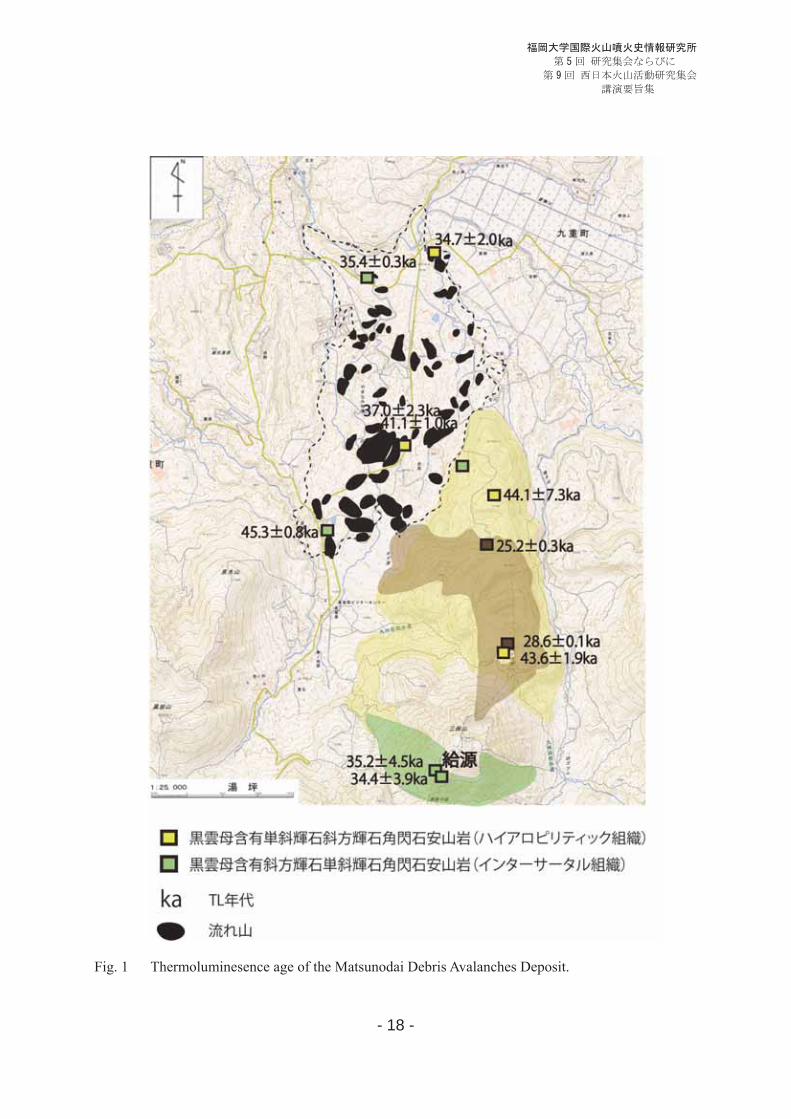
43 44ka, 34 35ka 25 28ka
MDA � �
� 3 MDA 3
/L 0.10
- 17 -
MDA
5
MDA
A
B A
B A B SiO2
59.8 61.5wt.% 58.6 59.2wt.% A 34 37ka,B 41
45ka TL
2014 MDA
MDA
1988
MDA
MDA B
MDA
MDA
2 3
-
- 18 -
Fig. 1 Thermoluminesence age of the Matsunodai Debris Avalanches Deposit.

- 19 -
2-01 2
Difficulties in construction of geological exposures database (2)
S. Yokota (Shimane Univ.)
1
1990 1996
1997 1997
1996
-1
20
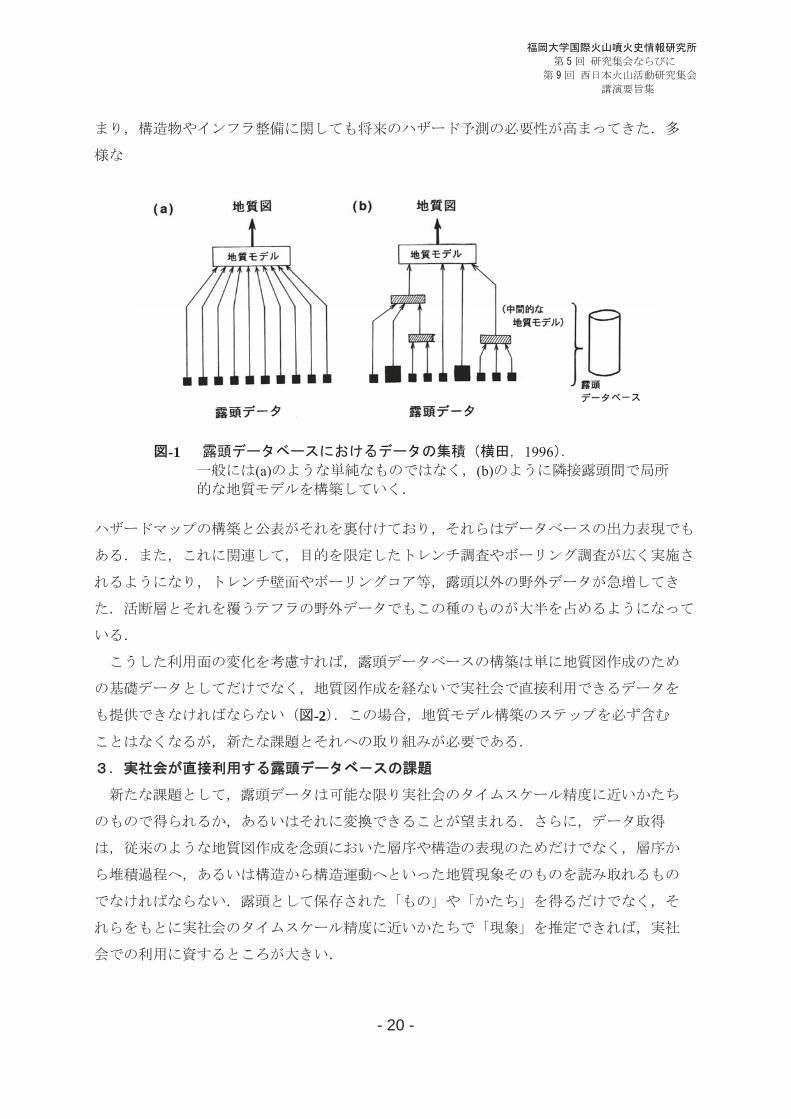
- 20 -
-1 1996 (a) (b)
-2
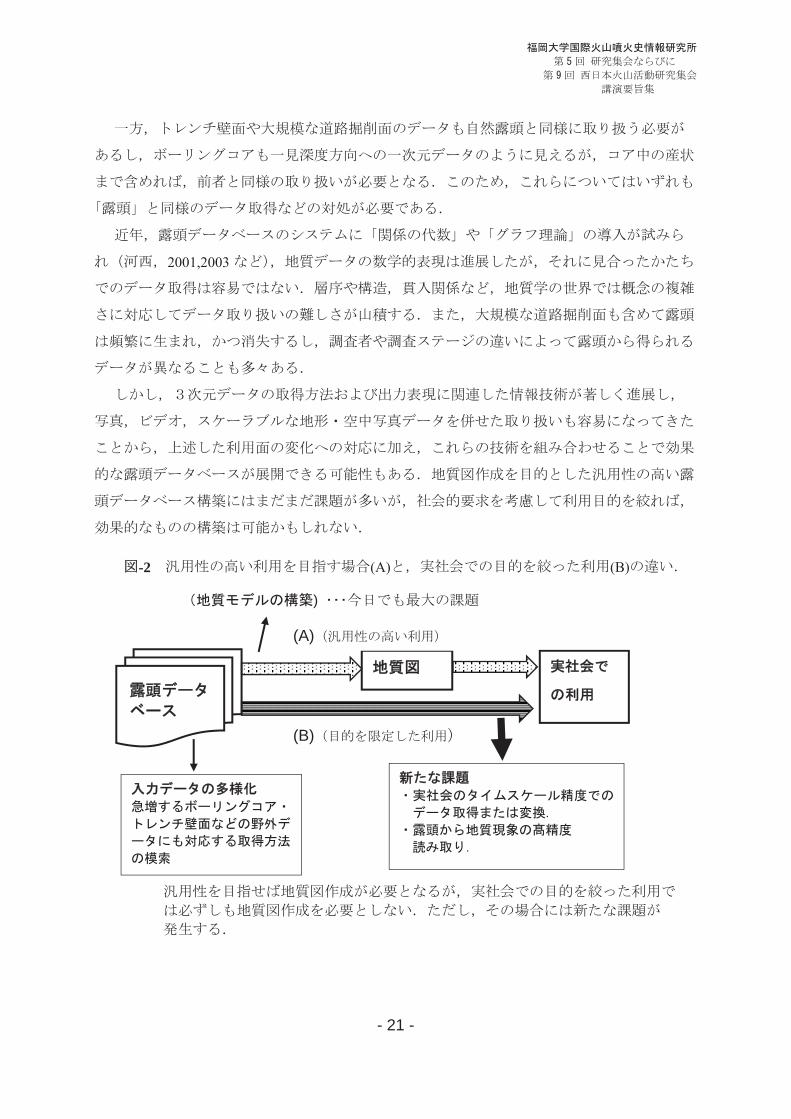
- 21 -
2001,2003
-2 (A) (B)
)
(A)
(B)
- 22 -
2001
11, 235-240
2003 (2)
14, 249-258.
1997 ’97
27-32.
1996, ? 7, 297-301.
1997, 38, 153-158.
- 23 -
2-02
Preparation of outcrop information site and supporting tools for collecting and sharing
M. Okumura (Info. Tech. Center, Fukuoka Univ.), Y. Yahata (Fac. Eng., Fukuoka Univ.),
S. Takahashi (Fac. Eng., Fukuoka Univ.), N. Tsuruta (Fac. Eng., Fukuoka Univ.)
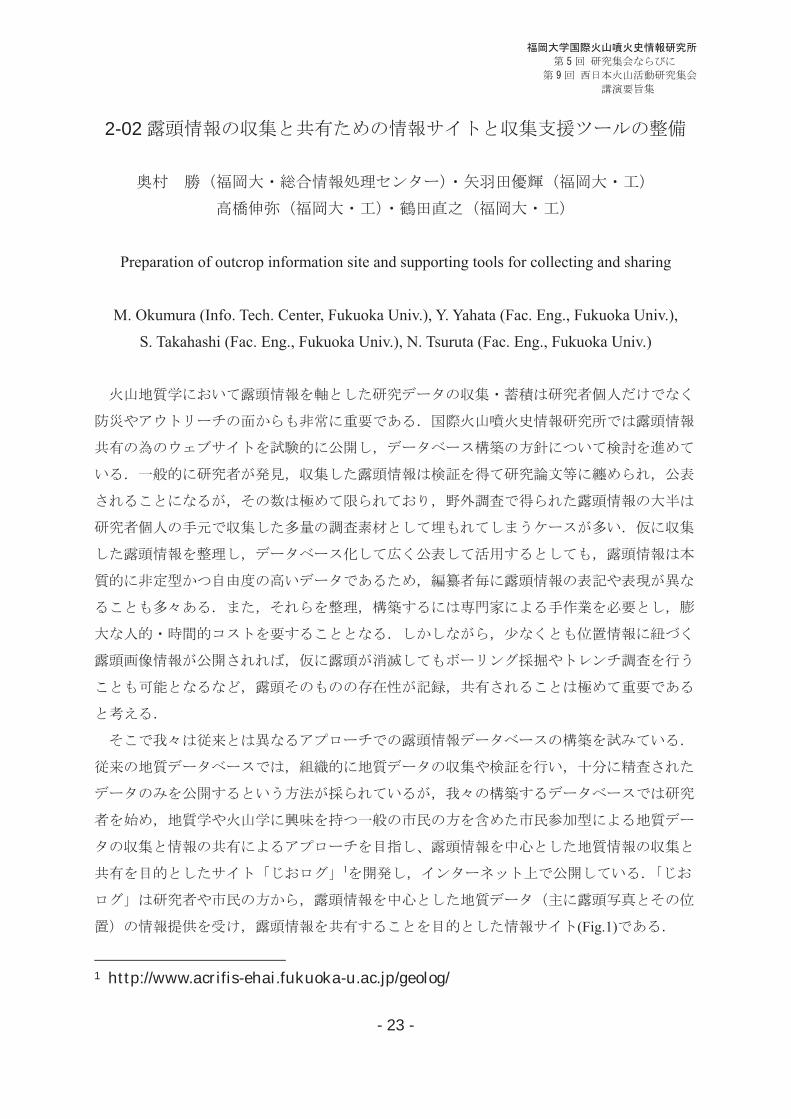
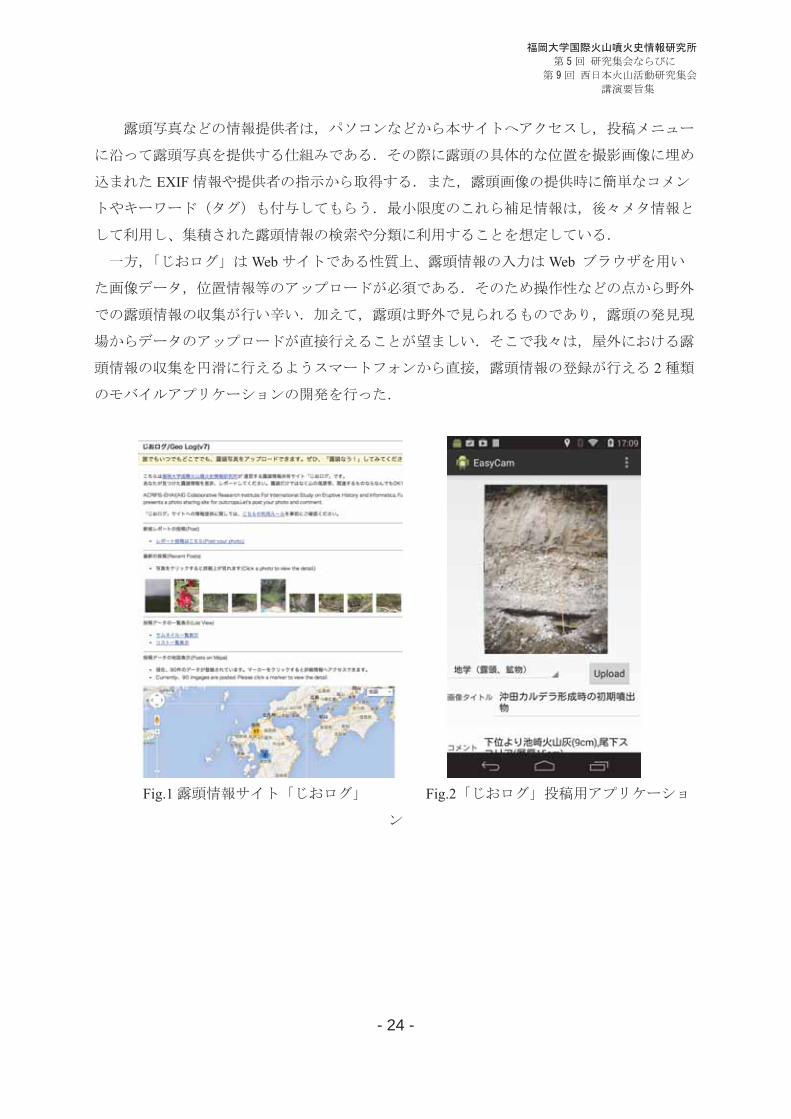
1
(Fig.1)
1 http://www.acrifis-ehai.fukuoka-u.ac.jp/geolog/
- 24 -
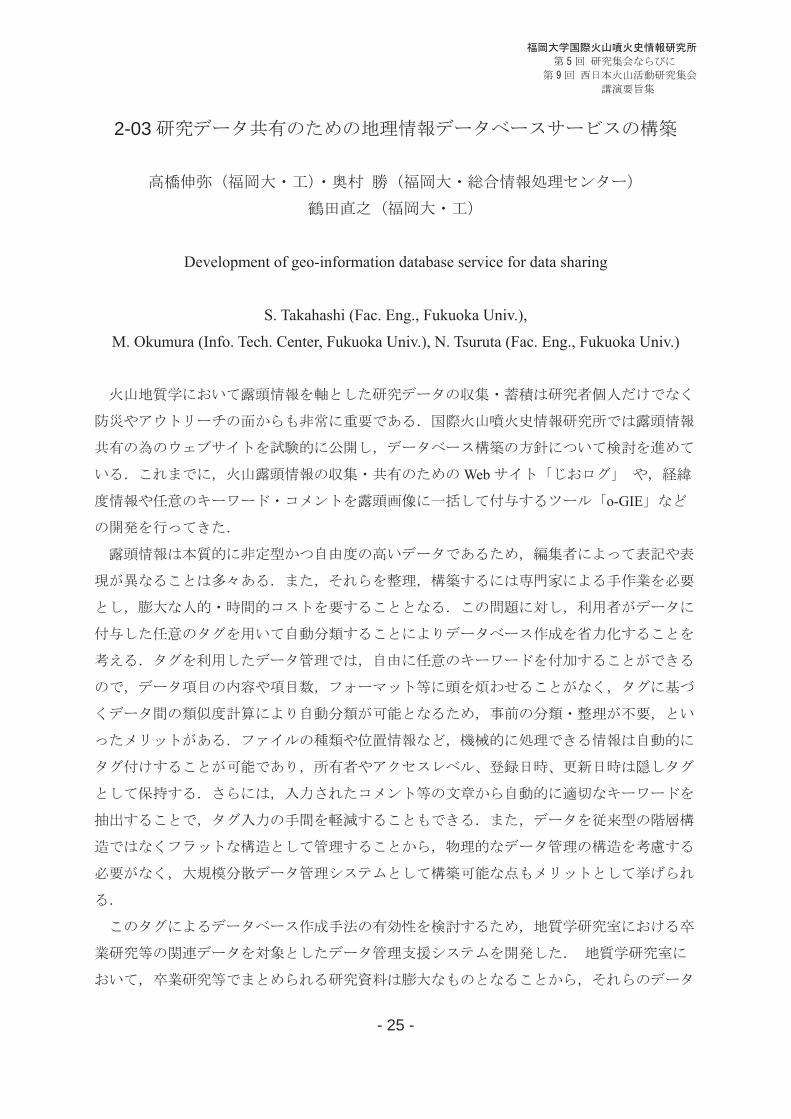
EXIF
Web Web
2
Fig.1 Fig.2
- 25 -
2-03
Development of geo-information database service for data sharing
S. Takahashi (Fac. Eng., Fukuoka Univ.),
M. Okumura (Info. Tech. Center, Fukuoka Univ.), N. Tsuruta (Fac. Eng., Fukuoka Univ.)
Web
o-GIE
- 26 -
2014 9
�
� Word/Excel/PowerPoint/PDF
� �
892 630
docx/xlsx 262 95
9.4 138
90 10 18
3 13
- 27 -
2-04 2
About secondary use of eruptive history and informatics database
N. Tsuruta (Fac. Eng., Fukuoka Univ.), S. Takahashi (Fac. Eng., Fukuoka Univ.),
M. Okumura (Info. Tech. Center, Fukuoka Univ.)
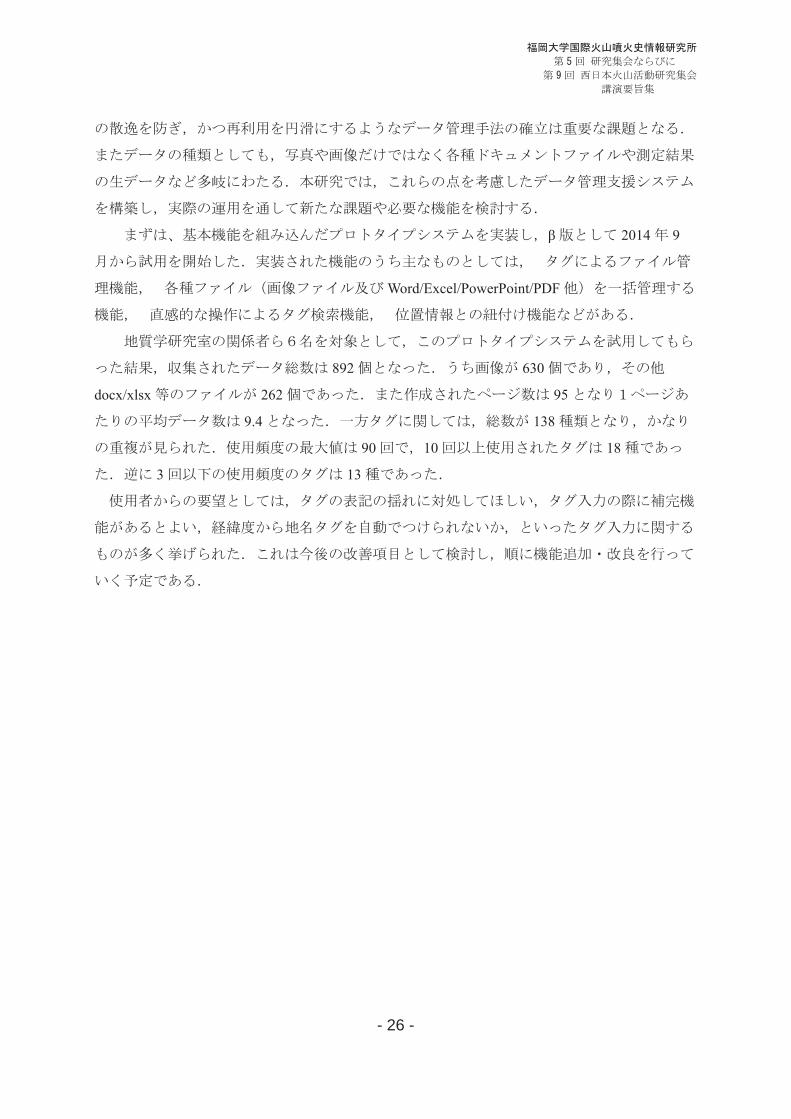
1 1
1
2 2
2 1 2
1 2
ID
URI Uniform
Resource Identifier
PC
ID
ID
or
- 28 -
ID
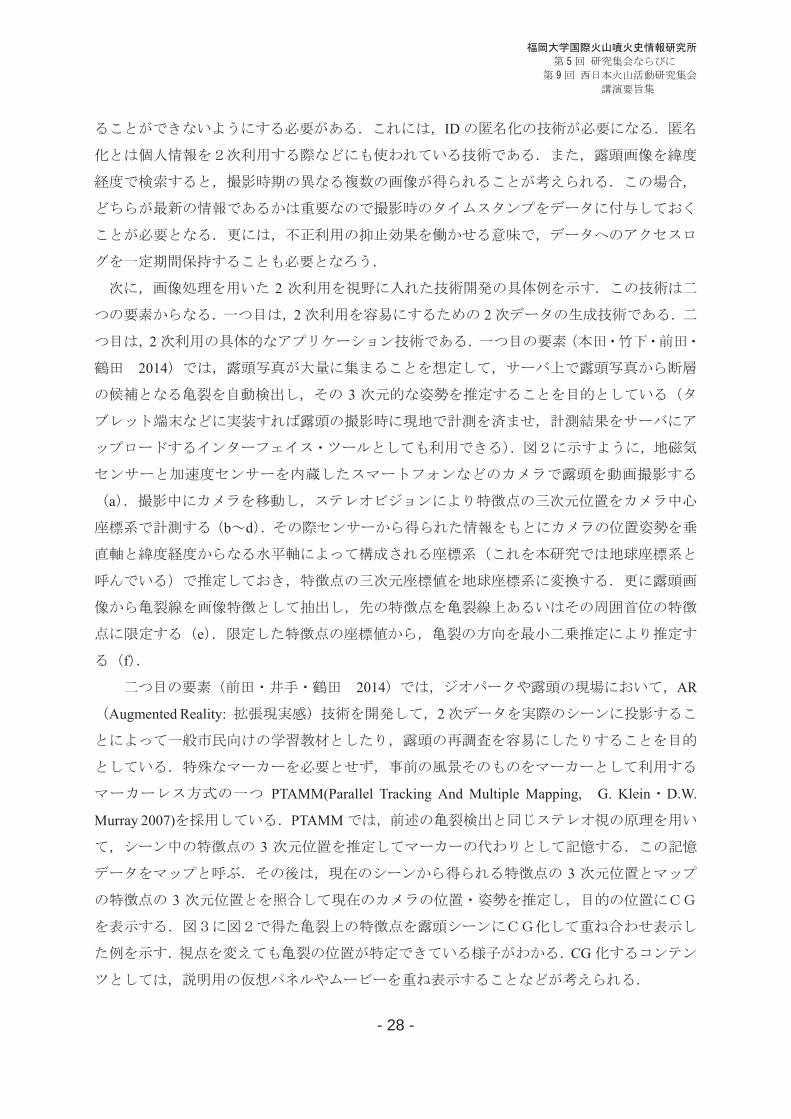
2
2 2
2
2014
3
a
b d
e
f
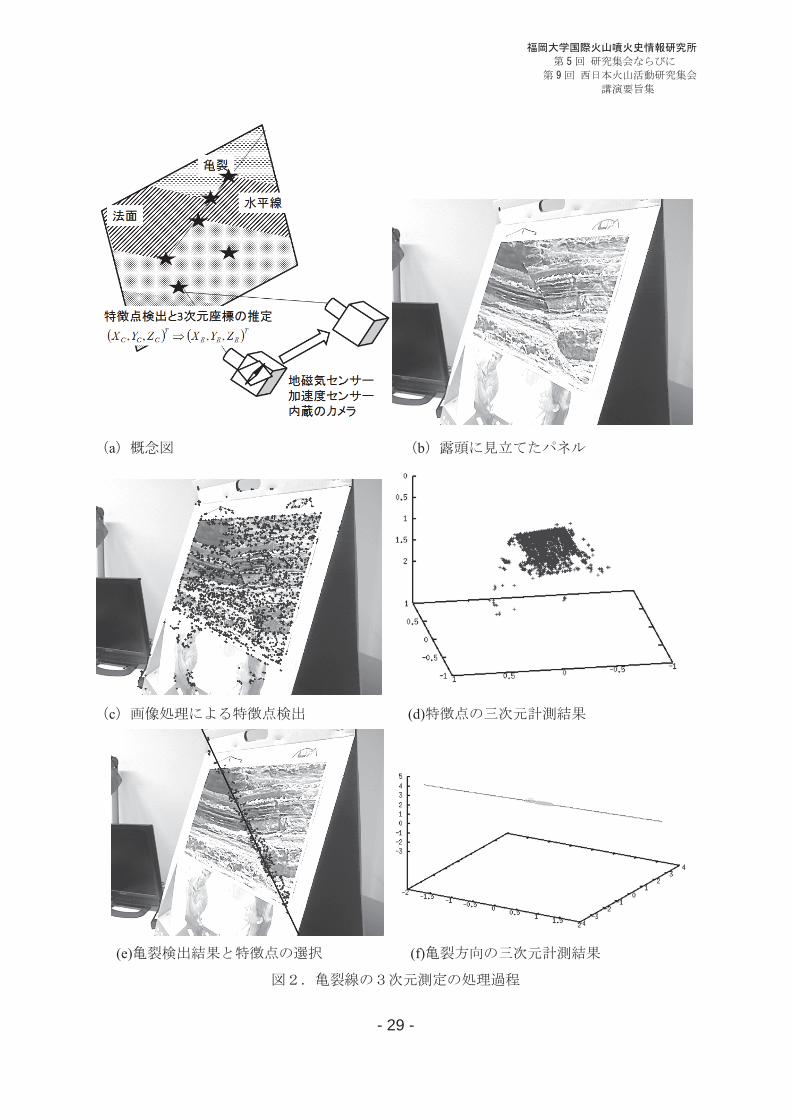
2014 AR
Augmented Reality: 2
PTAMM(Parallel Tracking And Multiple Mapping, G. Klein D.W.
Murray 2007) PTAMM
3
3
3
CG
- 29 -
a b
c (d)
(e) (f)
- 30 -
PTAMM AR
G. Klein and D.W. Murray(2007): Parallel Tracking and Mapping for Small AR Workspaces, Proc
International Symposium on Mixed and Augmented Reality (ISMAR) 2007,
http://www.robots.ox.ac.uk/ActiveVision/Publications/klein_murray_ismar2007/klein_murray_is
mar2007.html
2014
, vol. 113, no. 431, PRMU2013-125, pp. 25-30
2014
PTAMM , vol. 113, no. 431, PRMU2013-134, pp. 73-76

- 31 -
3-01
Eruptive history of Ikeda caldera, southern Kyushu, Japan
H. Inakura (WEST JEC), H. Naruo (Takeokadai High School)
M. Okuno (Fukuoka Univ.) and T. Kobayashi (Kagoshima Univ.)
Ikeda caldera is a small-scale caldera (about 4 km in diameter), located in the southern tip of the
Satsuma Peninsula, southern Kyushu, Japan. We made a detailed geological study to understand the
eruptive history of Ikeda caldera (Fig. 1), including a study of the processes leading to the catastrophic
eruption. The pre-caldera activity began at about 20 cal kBP with the Iwamoto ash fall deposit. The
Senta lava was also effused before the Kikai-Akahoya tephra (7.3 cal kBP). The caldera-forming
eruption began at 6.4 cal kBP with a phreatic explosion that produced the Ikezaki ash fall and surge
deposits. This was soon followed by the magmatic eruptions that produced the Osagari and Mizusako
scoria fall deposits and the Ikeda pumice fall deposit. During the climactic stage, the Ikeda ignimbrite
was erupted and covered portions of the coastal area. Immediately after the caldera-forming event, four
maars were formed along the fissure vent southeast of the caldera. The Yamagawa maar, which is the
largest and is located at the southeastern end of the fissure vent, erupted a pumiceous base surge (the
Yamagawa base surge), while the other maars ejected small amounts of accessory or accidental materials.
During the late stage of the Ikeda eruption, a phreatomagmatic eruption occurred at the bottom of the
caldera floor, which formed the widespread Ikedako ash fall deposit. The central lava dome was formed
during the late stage of this eruption. After the Ikedako ash fall, secondary explosions of the Ikeda
ignimbrite occurred mainly along the coastal area, generating small base surge deposits.
4 km
2
7.3 cal kBP 6.4 cal kBP

- 32 -
Fig. 1
Fig. 1 Type columnar section of Ikeda caldera products (after, Inakura et al., 2014).
3-02
- 33 -
Precursory eruptive process for the Ito ignimbrite eruption of Aira caldera:
Decompression process of the magma chamber
N. Geshi (Inst. Earthquake Volcano Geology, AIST)
“ ”
29,000 AT
350 km
2001
100 km
Kobayashi et al. 1983
AT
( )
1
1 15km 1m
1m 4m 0.2m
Kobayashi et al., 1983
1/4 ref
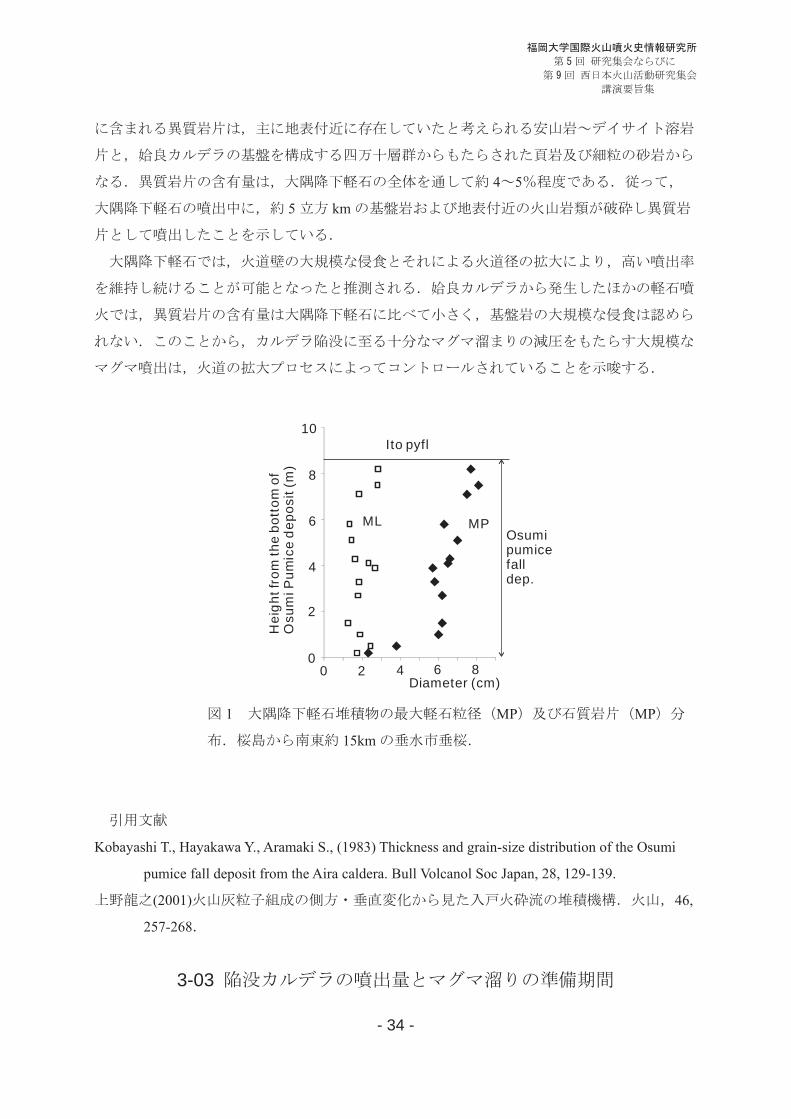
- 34 -
4 5
5 km
1 MP MP
15km
Kobayashi T., Hayakawa Y., Aramaki S., (1983) Thickness and grain-size distribution of the Osumi
pumice fall deposit from the Aira caldera. Bull Volcanol Soc Japan, 28, 129-139.
(2001) 46,
257-268
3-03
00 2 4
Diameter (cm)
Osumipumicefalldep.
6 8
2
4
6
8
10
Hei
ght f
rom
the
bott
om o
f O
sum
i Pum
ice
depo
sit (
m)
ML MP
Ito pyfl
- 35 -
The volume and periodicity of magma discharge at the caldera-forming eruption: A review
D. Miura (CRIEPI)
(e.g.,
Gayer and Martí, 2008; Sobradelo et al., 2010)
(Sc) (A) (e.g., Spera and
Crisp, 1986; Sato and Taniguchi, 1997; Fig. 1) (Sc) (A)
3
(Sc)
(D) Roof aspect ratio (RAR = D/Sc: Roche et al., 2000) 1
RAR (e.g., Roche et al., 2000; Acocella et al.,
2000)
—
RAR
( )
(Scandone, 1990)
- 36 -
( , 2007)
(Spera and Crisp, 1986; White et al., 2006)
(Deligne
et al., 2010)
(Salisbury et al., 2011)
(Miura et al., 2013: Fig. 2)
(e.g.,
Jellinek and DePaolo, 2003; Gregg et al., 2012: Fig. 1)
(e.g., Annen, 2009) LA-ICP-MS U-Pb
(Ito et al., 2013)
: Acocella et al., 2000: 10.1016/S0377-0273(00)00201-8; Annen, 2009: 10.1016/j.epsl.2009.05.006; Deligne et al., 2010:
10.1029/2009JB006554; Gayer and Martí, 2008: 10.1016/j.jvolgeores.2008.03.017; Gregg et al., 2012:
10.1016/j.jvolgeores.2012.06.009; Ito et al., 2013: 10.1038/srep01306; Jellinek and DePaolo, 2003: 10.1007/ s00445-003-
0277-y; , 2007: 10.5575/geosoc.113.283; Miura et al., 2013: 10.1130/B30732.1; Roche et al., 2000:
10.1029/1999JB900298; Sato and Taniguchi, 1997: 10.1029/96GL04004; Scandone, 1990: 10.1016/0377-0273(90)90005-Z;
Sobradelo et al., 2010: 10.1016/j.jvolgeores.2010.09.003; Spera and Crisp, 1981: 10.1016/0377-0273(81)90021-4; White et al.,
2006: 10.1029/2005GC001002.
- 37 -
3-04
Tomographic imaging of the deep structure of active volcanoes
D. Zhao (Dep. Geophys., Tohoku Univ.)
E-mail: [email protected]
We determined detailed three-dimensional (3-D) images of P and S wave velocity and Poisson’s
ratio in the crust and upper mantle beneath NE Japan and SW Japan using a great number of high-
quality arrival-time data from local crustal earthquakes and intermediate-depth events in the subducting
Pacific slab. Then we examined the images beneath the active volcanic areas as well as the source areas
of large crustal earthquakes (M 6.0-7.2) which occurred in Tohoku during 1894 to 2014. Among the 26
earthquakes in NE Japan, 10 events occurred in the Tohoku forearc, 10 in the back-arc, and 6 events
are located along the volcanic front. Main findings of this work are summarized as follows.
(1) Prominent low-velocity (low-V) and high Poisson’s ratio (high- ) anomalies are revealed in the
crust and upper-mantle wedge beneath the active arc volcanoes and the source zones of the large crustal
earthquakes.
(2) Beneath the volcanic front and back-arc areas, the low-V zones reflect arc-magma related high-
temperature anomalies which are produced by joint effects of corner flow in the mantle wedge and
fluids from dehydration of the subducting slab. The hot low-V anomalies can cause locally thinning
and weakening of the brittle seismogenic crust above them. In addition, low-frequency micro-
earthquakes are observed in the lower crust and uppermost mantle in and around the low-V zones,
which reflect ascending of magma and fluids from the mantle wedge to the crust, inducing large crustal
earthquakes.
(3) No volcano and magma exist in the fore-arc area duo to the low temperature there, hence the low-
V zones in the forearc may reflect fluids from the subducting slab dehydration, which may have formed
a water wall in the mantle wedge and lower crust. When the fluids enter active faults in the upper crust,
the fault-zone friction is reduced and so large earthquakes can be triggered.
- 38 -
(4) Our present results as well as some previous studies indicate that the nucleation of a large earthquake
is not entirely a mechanical process, but is closely associated with the subduction dynamics and physical
and chemical properties of rocks in the crust and upper mantle. In particular, the arc magma and fluids
play an important role in the earthquake nucleation. These results have important implications for the
reduction of seismic hazards.
References
Zhao, D., W. Wei, Y. Nishizono, H. Inakura (2011) Low-frequency earthquakes and tomography in
western Japan: Insight into fluid and magmatic activity. J. Asian Earth Sci. 42, 1381-1393.
Zhao, D., T. Yanada, A. Hasegawa, N. Umino, W. Wei (2012) Imaging the subducting slabs and mantle
upwelling under the Japan Islands. Geophys. J. Int. 190, 816-828.
Zhao, D., H. Kitagawa, G. Toyokuni (2015) A water wall in the Tohoku forearc causing large crustal
earthquakes. Geophys. J. Int. 200, 149-172.
Zhao, D. (2015) The 2011 Tohoku earthquake (Mw 9.0) sequence and subduction dynamics in Western
Pacific and East Asia. J. Asian Earth Sci. 98, 26-49.
- 39 -
3-05 -4
Temporal variation of magma composition as observed by
plagioclase and melt inclusions in Aso-4 pyroclastic flow deposit
H. Yamasaki, T. Hasenaka (GSST, Kumamoto Univ.) and
A. Yasuda (Earthquake Res. Inst., Univ. of Tokyo)
9 -4
-4
-4
EPMA
FT-IR
An 35%
An40% An45%
An
SiO2=68~70%
SiO2=73~74%
SiO2=71~74% 2014 Aso-4A
2
2014
- 40 -
4%
2~4%
1 2

- 41 -
3-06
The 7.3 cal kBP Kika Akahoya eruption of Kikai caldera
T. Kobayashi (Kagoshima Univ.) and H. Naruo (Takeokadai Senior High School)
50 km
7.3 cal kBP 2002
1982 Maeno and Taniguchi,
2007
Ky-p Ky
1973 K-Ah
1978 20km
50km 100km
2003
Ky
Ky-p K-Ah Ky
1000m Ky Ky
cm Ky Ky
Ky
K-Ah Ky 500m
- 42 -
100
2006 2010
2002
Ky Ky Ky-p Ky-p
Ky Ky-p
Ky
K-Ah K-Ah
1/ K-Ah
K-Ah K-Ah
K-Ah
K-Ah
K-Ah K-Ah
Ky
90
Ky
30m
2010 2008 Maeno and Imamura, 2007
Ky
Ky
Ky Ky
- 43 -
3-07
Possibility of the biggest eruption of Sakurajima volcano, viewed from eruptive history
M. Okuno (Fukuoka Univ.)
2013 29 kcal BP
2002 A-Tn 2000
P17 Okuno et al., 1997
2013 764 766 1471
1476 1779 1914
2015
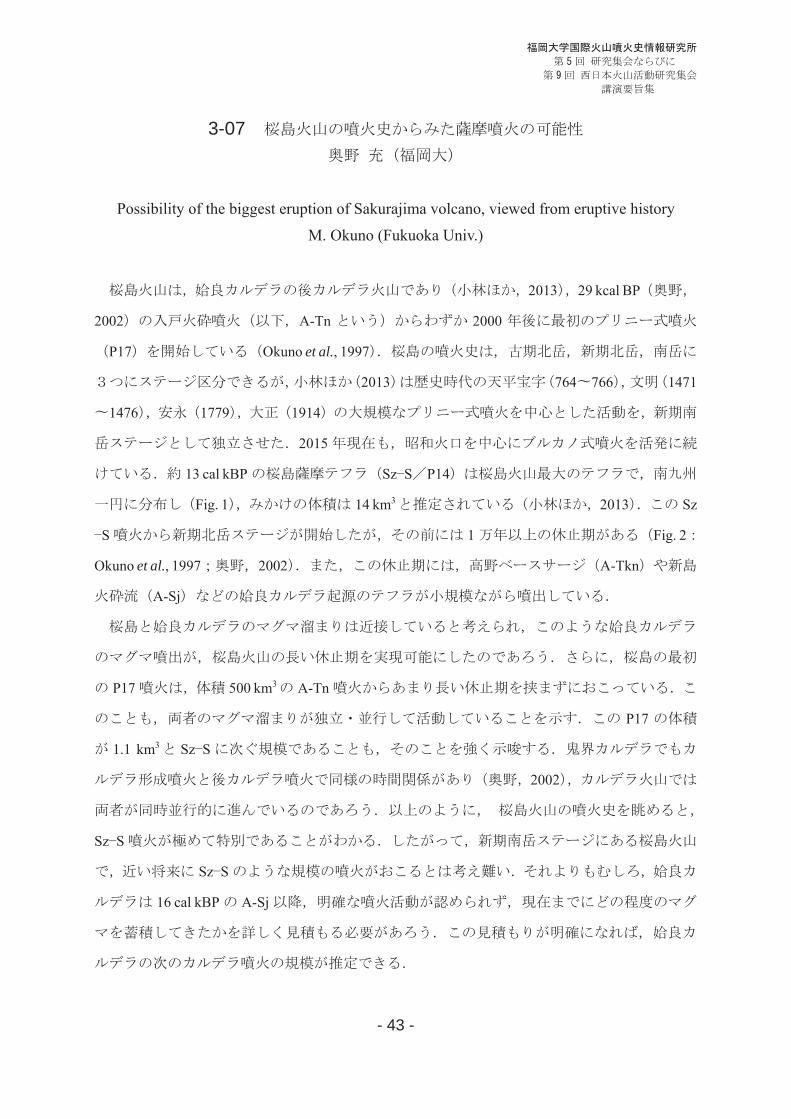
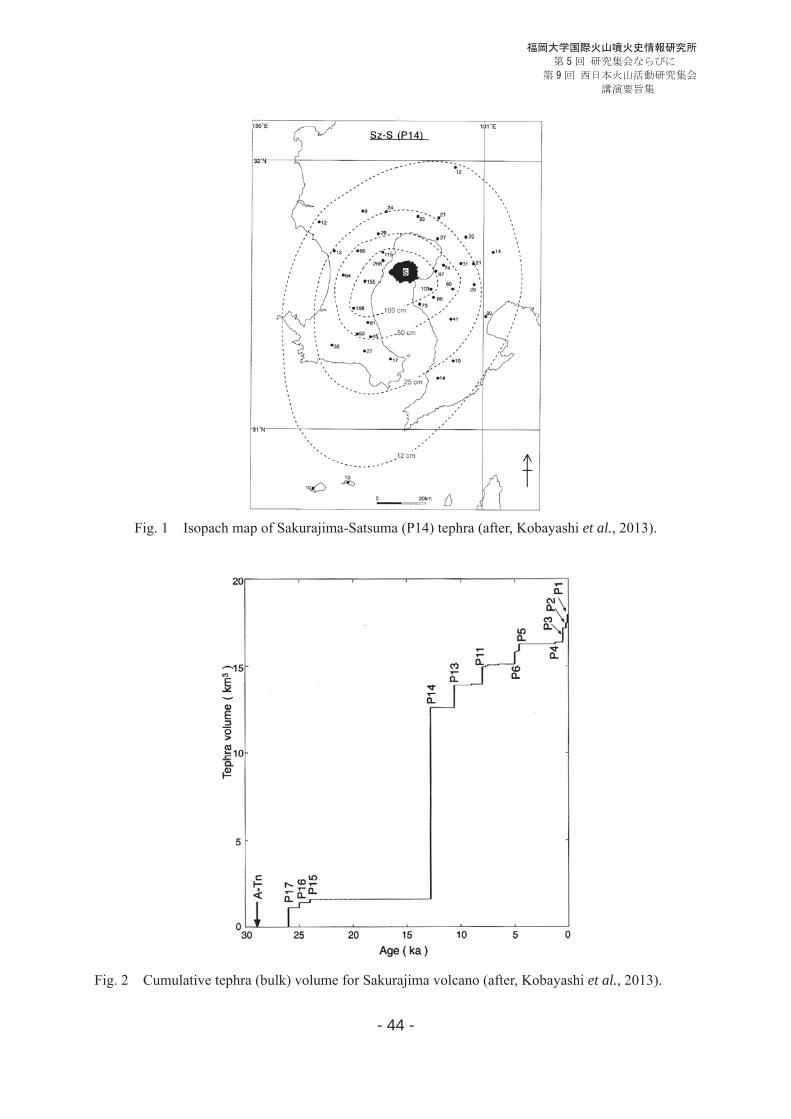
13 cal kBP Sz S P14
Fig. 1 14 km3 2013 Sz
S 1 Fig. 2
Okuno et al., 1997 2002 A-Tkn
A-Sj
P17 500 km3 A-Tn
P17
1.1 km3 Sz S
2002
Sz S
Sz S
16 cal kBP A-Sj
- 44 -
Fig. 1 Isopach map of Sakurajima-Satsuma (P14) tephra (after, Kobayashi et al., 2013).
Fig. 2 Cumulative tephra (bulk) volume for Sakurajima volcano (after, Kobayashi et al., 2013).
- 45 -
3-08
Remnan of volcanic fluid in geothermal manifestations such as steaming ground and hot
springs a good monitoring point for big eruptions?
S. Taguchi (Fukuoka Univ.)
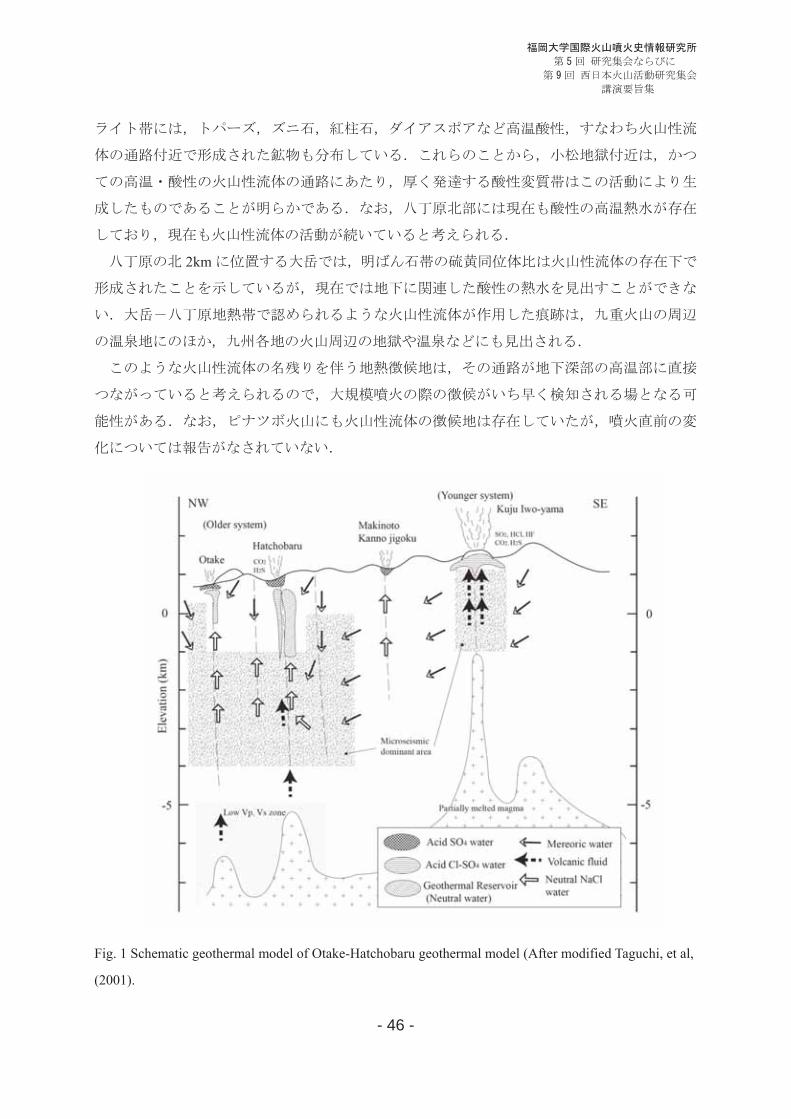
Fig. 1
1000
(Hayashi, 1973
SO4 pH 2-4
+
pH<2 Cl-SO4
350m
1000m 100
0.5
10 23
APS
-
- 46 -
2km
Fig. 1 Schematic geothermal model of Otake-Hatchobaru geothermal model (After modified Taguchi, et al,
(2001).
- 47 -
3-09 1980
Petrological monitoring using early tephra for volcanic activity
- Case study of Mt. St. Helense 1980 eruption-
K. Watanabe (Kyushu Univ.)
- 48 -
4-01 Eruptions at Sinabung and Kelud in Indonesia
S. Nakada (ERI, Univ. Tokyo), M. Yoshimoto (Mt. Fuji Res. Inst.), F. Maeno (ERI, Univ. Tokyo), M. Iguchi (DPRI, Kyoto Univ.),
A. Zaennudin (CVGHM) and M. Hendrasto (CVGHM)
( ) ( ) ( ) ( ) A. ( ) M. ( )
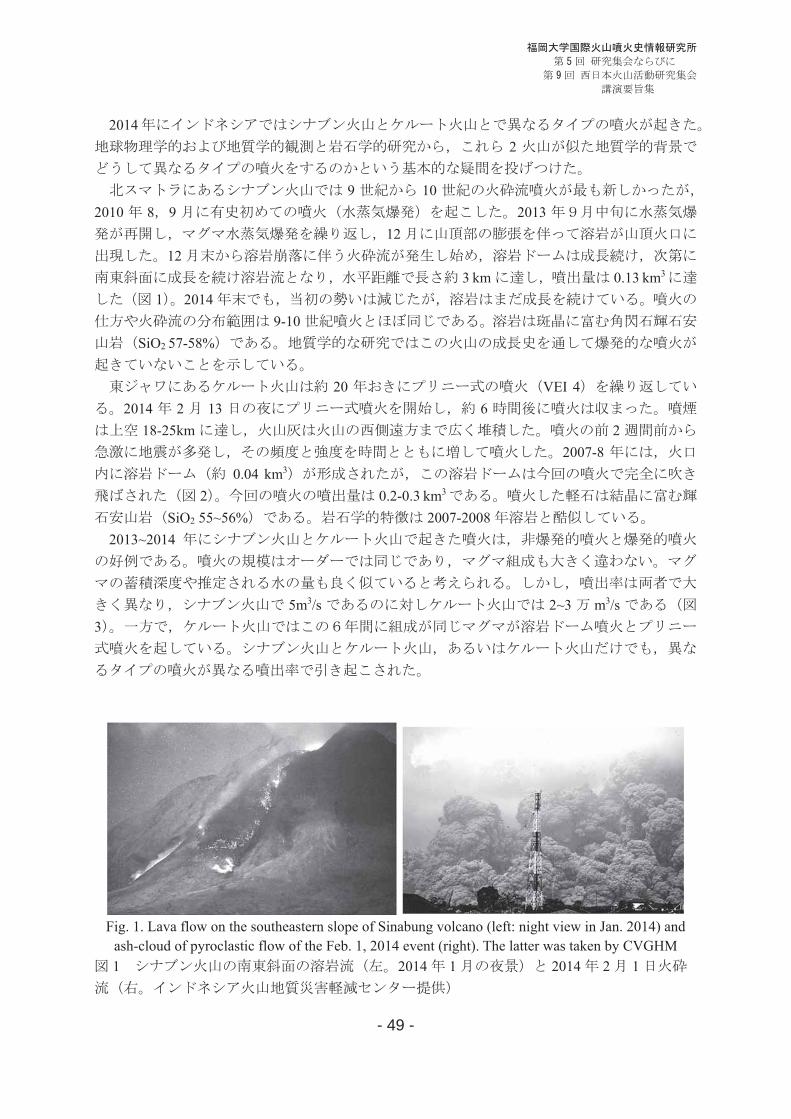
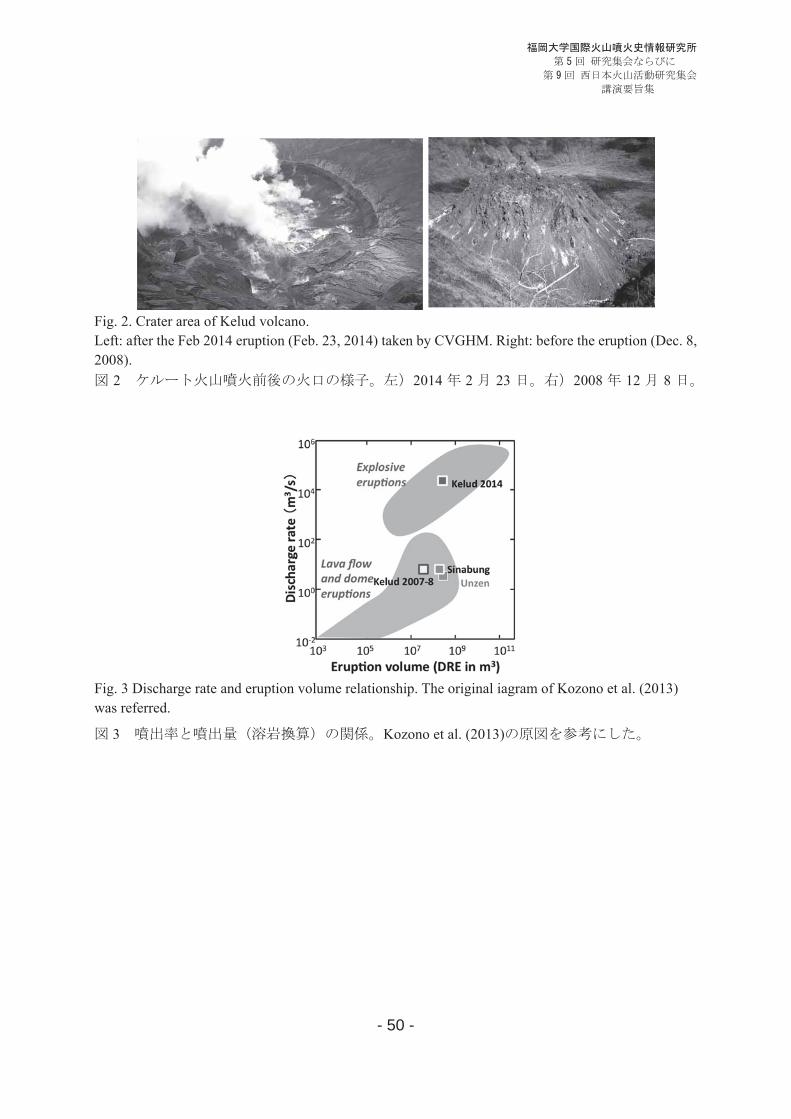
In Indonesia, two distinct eruptions occurred at Sinabung and Kelud in 2014. The geophysical and geological observation and petrological research on these eruptions provide us an important key question; why two different modes of eruption occurred under a similar volcanological background. Lava dome-forming eruption started at Sinabung volcano, Northern Sumatra, in the end of 2013, which was preceded by the phreatic eruption period since 2010. The eruption had continued in a nearly constant rate of magma effusion as of the summer of 2014. The 2010 eruption was the first historic eruption, and the latest eruption geologically recorded occurred in the 9-10th Century. This time eruption was very similar to the 9-10th Century eruption in terms of style, scale, position and magma chemistry; that is the growth of a lava flow/dome complex in the summit area and generation of collapsed-type block-and-ash flows. This time, the lava complex extended on the southeastern volcano slope, frequently generating pyroclastic density currents, and became horizontally about 3 km long from the source (Fig. 1). The volume of erupted magma reached about 0.13 km3. The lava is porphyritic hornblende-bearing two pyroxene andesite (SiO2 57-58%) and high-Si rhyolite melt (SiO2 ~75%). The geological study showed the absence of explosive eruption in this volcano through its growth history. On the other hand, the Plinian eruption began at Kelud volcano, east Java on the evening of February 13, 2014, which had declined almost within about 6 hours. The eruption cloud rose to 18-25 km above the crater, and tephra deposited on extensive areas. The precursory seismic activity started two weeks before the eruption and the intensity increased with time. This short but explosive eruption was one of recent large eruptions (VEI 4) typical at Kelud, which repeated every about 20 years. Before this eruption, a lava dome complex of about 0.04 km3 had been formed within the crater in 2007-2008 (Fig.2). The total volume of tephra of the 2014 eruption is 0.2 to 0.3 km3 in DRE. The magma is crystal-rich (about 60 vol.%), porphyritic pyroxene andesite (SiO2 55-56%) with rhyolite melt (SiO2 ~70%). The petrological characteristics of the magma are similar to the 2007-2008 lava dome, except the foam glassy groundmass in the former. The 2013-2014 eruption at Sinabung and the February 2014 eruption at Kelud are good examples of less-explosive and explosive eruptions in Indonesia, respectively. The magnitudes of eruption are similar in orders between the two volcanoes, and the magma compositions are basaltic andesite to andesite. Magma storage depths and the resultant estimated water contents were similar to each other. However, the eruption rates were different; ~5 m3/s and 20,000 to 40,000 m3/s for Sinabung and Kelud, respectively (Fig. 3). At Kelud, the compositionally identical magma erupted both explosive and non-explosive for these 6 years. A critical difference of eruptions between two volcanoes and in a single volcano is the eruption rate.
(Modified from the abstract read in the 2014 AGU Fall Meeting)
- 49 -
20142
9 10
2010 8 9 201312
123 km 0.13 km3
1 20149-10
SiO2 57-58%
20 VEI 42014 2 13 6
18-25km 22007-8
0.04 km3
2 0.2-0.3 km3
SiO2 55~56% 2007-2008 2013~2014
5m3/s 2~3 m3/s3
Fig. 1. Lava flow on the southeastern slope of Sinabung volcano (left: night view in Jan. 2014) and
ash-cloud of pyroclastic flow of the Feb. 1, 2014 event (right). The latter was taken by CVGHM 1 2014 1 2014 2 1
- 50 -
Fig. 2. Crater area of Kelud volcano. Left: after the Feb 2014 eruption (Feb. 23, 2014) taken by CVGHM. Right: before the eruption (Dec. 8, 2008).
2 2014 2 23 2008 12 8
Fig. 3 Discharge rate and eruption volume relationship. The original iagram of Kozono et al. (2013) was referred.
3 Kozono et al. (2013)
- 51 -
4-02
Volcanic geomorphology of Indonesia
I. Moriya (Honorary Prof., Kanazawa Univ.)
Sumatra, Java, Bali, Lombok, Sumbawa, Lomblen, Marisa, Banda 1600
km Google Earth 3D
1979, 1983, 2012
236 180 76 %
20 (8 %) 2 (0.8 %) 34 14 %
12 22
940
676 72 % 76 %
2
9 %
14 % 8 % 7 %
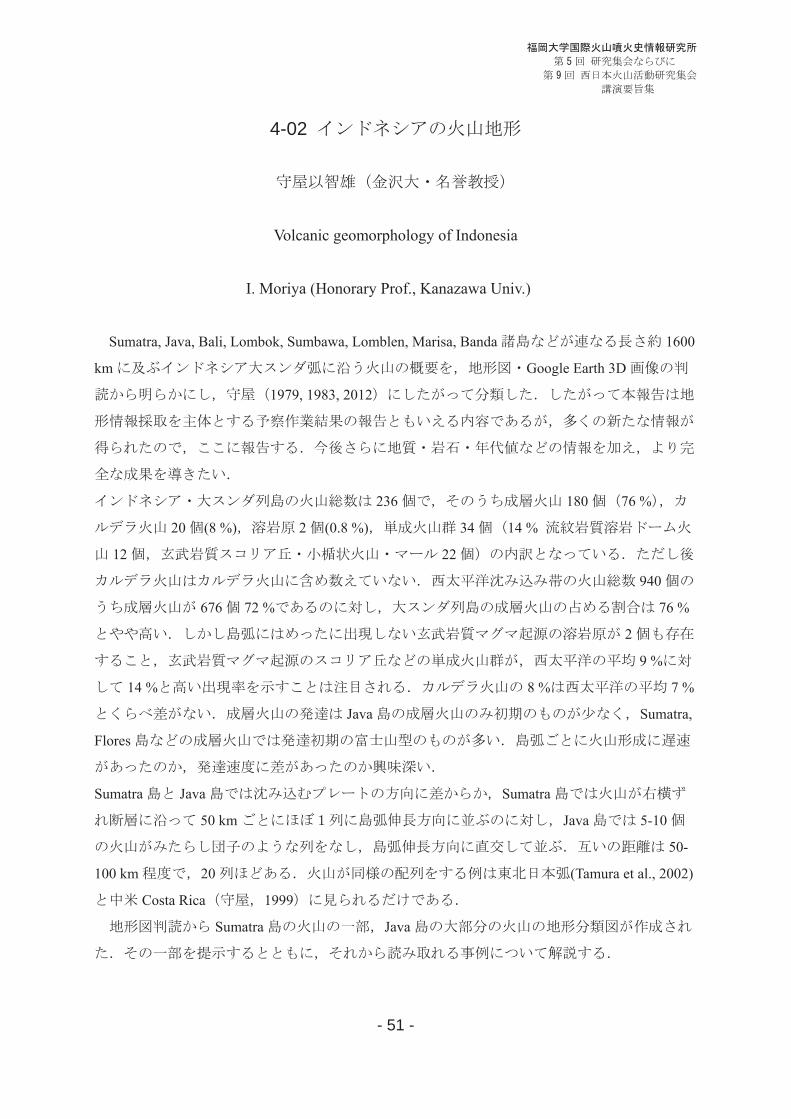
Java Sumatra,
Flores
Sumatra Java Sumatra
50 km Java 5-10
50-
100 km 20 (Tamura et al., 2002)
Costa Rica 1999
Sumatra Java
- 52 -
Fig.1 Distribution of the volcanoes in Java Is. Note the chains of the volcanoes!
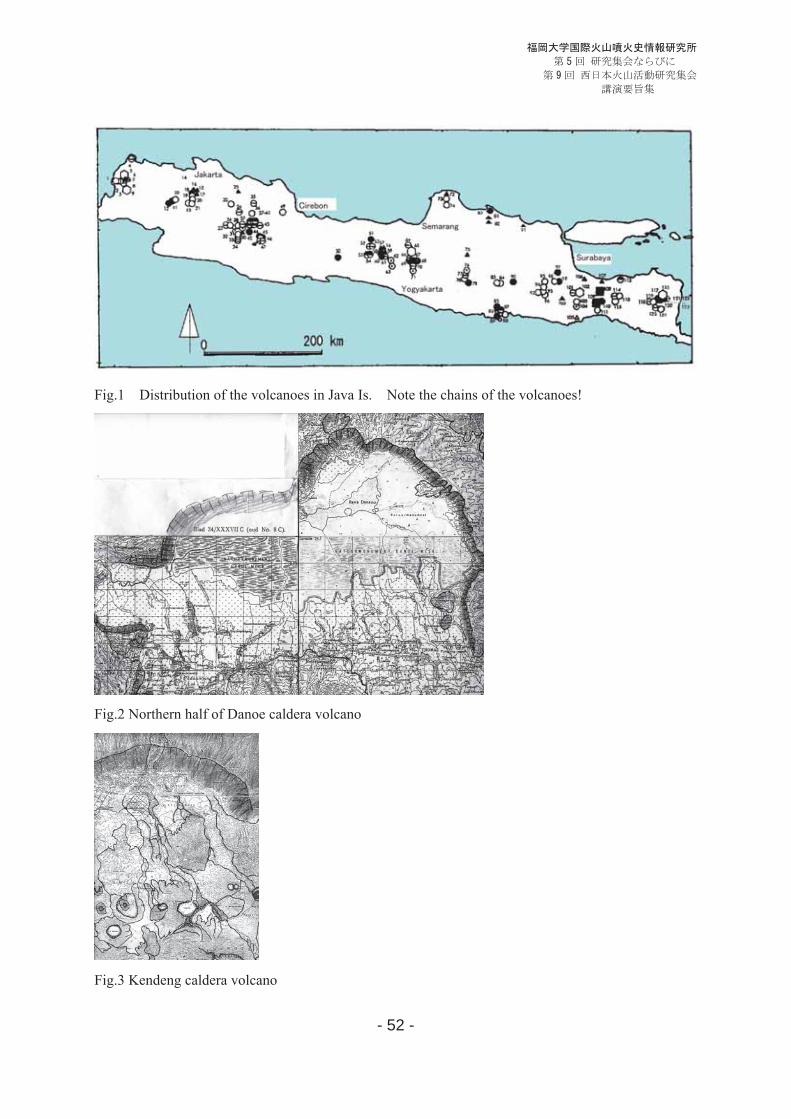
Fig.2 Northern half of Danoe caldera volcano
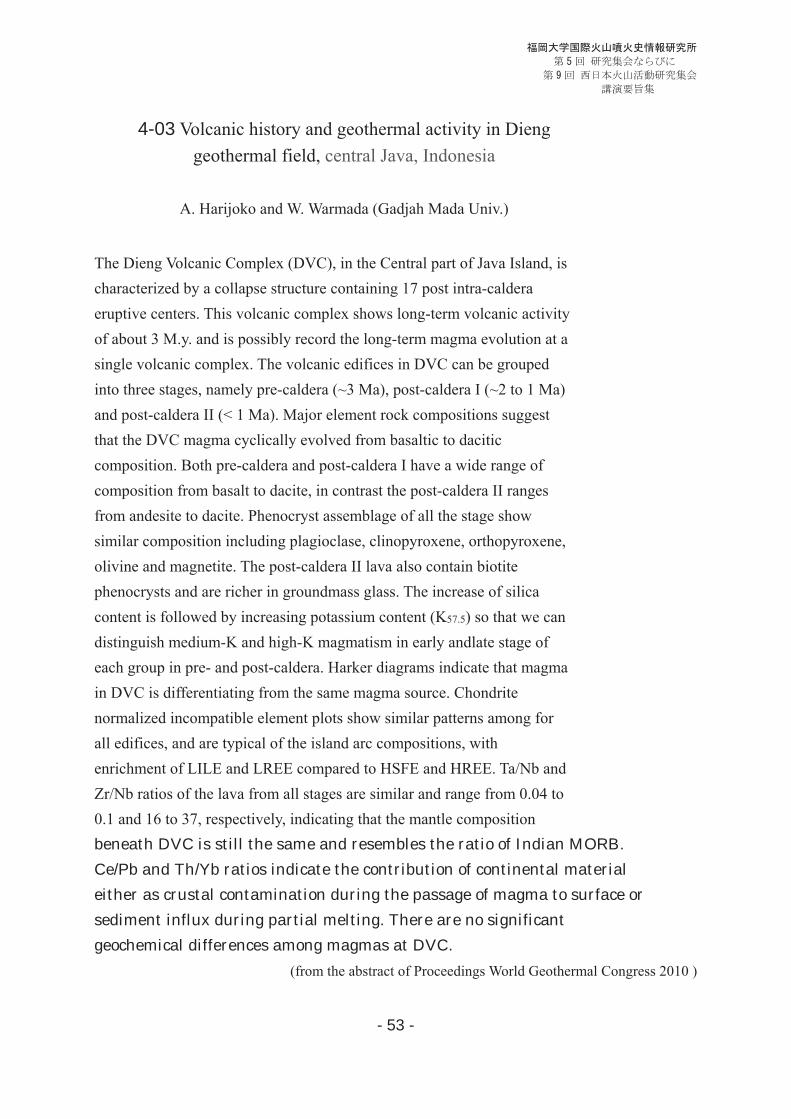
Fig.3 Kendeng caldera volcano
- 53 -
4-03 Volcanic history and geothermal activity in Dieng geothermal field, central Java, Indonesia
A. Harijoko and W. Warmada (Gadjah Mada Univ.)
The Dieng Volcanic Complex (DVC), in the Central part of Java Island, is characterized by a collapse structure containing 17 post intra-caldera eruptive centers. This volcanic complex shows long-term volcanic activity of about 3 M.y. and is possibly record the long-term magma evolution at a single volcanic complex. The volcanic edifices in DVC can be grouped into three stages, namely pre-caldera (~3 Ma), post-caldera I (~2 to 1 Ma) and post-caldera II (< 1 Ma). Major element rock compositions suggest that the DVC magma cyclically evolved from basaltic to dacitic composition. Both pre-caldera and post-caldera I have a wide range of composition from basalt to dacite, in contrast the post-caldera II ranges from andesite to dacite. Phenocryst assemblage of all the stage show similar composition including plagioclase, clinopyroxene, orthopyroxene, olivine and magnetite. The post-caldera II lava also contain biotite phenocrysts and are richer in groundmass glass. The increase of silica content is followed by increasing potassium content (K57.5) so that we can distinguish medium-K and high-K magmatism in early andlate stage of each group in pre- and post-caldera. Harker diagrams indicate that magma in DVC is differentiating from the same magma source. Chondrite normalized incompatible element plots show similar patterns among for all edifices, and are typical of the island arc compositions, with enrichment of LILE and LREE compared to HSFE and HREE. Ta/Nb and Zr/Nb ratios of the lava from all stages are similar and range from 0.04 to 0.1 and 16 to 37, respectively, indicating that the mantle composition beneath DVC is still the same and resembles the ratio of Indian MORB. Ce/Pb and Th/Yb ratios indicate the contribution of continental material either as crustal contamination during the passage of magma to surface or sediment influx during partial melting. There are no significant geochemical differences among magmas at DVC.
(from the abstract of Proceedings World Geothermal Congress 2010 )
- 54 -
5-01 Geology and crisis management of Pinatubo volcano, central Luzon, Philippines
C. Newhall (Mirisbiris Garden and Nature Center, formerly with USGS, NTU/EOS)
Pinatubo Volcano produced a low-end VEI 6 eruption (~5 km3 DRE of dacitic magma) on June 15, 1991,
and developed a 2.5 km diameter caldera the same day. These events were the climax after precursory
intrusion of basaltic magma into the dacite reservoir, small phreatic explosions on April 2, magma
mixing and eruption days thereafter of a hybrid andesite lava dome on June 7, and three days of conduit-
clearing VEI 3 eruptions from June 12-14. As seen from the Total Ozone Mapping Spectrometer
(TOMS), the eruption injected a very large amount of SO2 (17 Mt) that had accumulated as a discrete
bubble phase in the reservoir over preceding centuries – probably a prerequisite for such large eruptions.
Modern Pinatubo had a long history of similar or larger dacitic eruptions, and associated hybrid andesite
domes. The largest of these – the Inararo eruption – was also the first (originally found to be >35 ka,
later determined to be 81 ka from deep sea cores). An Ancestral andesitic Pinatubo had been active
over ~ 1 ma prior to that time, and its remaining deposits are much more indurated than those of the
Modern Pinatubo. Based on hasty reconnaissance stratigraphy (from air photos and on the ground)
and gas-line radiocarbon dates that hadn’t even stabilized, we judged that Pinatubo had repose periods
in the order of 1000 years, some longer, some shorter, and that the unrest of 1991 might lead to an
eruption similar to those which occurred previously, especially the latest, 400 y BP Buag eruption. On
that basis, we forecast that IF Pinatubo would erupt, the eruption would likely be large (e.g., VEI 6),
and hazard zones were drawn accordingly.
The scientific response to the crisis was managed by the Philippine Institute of Volcanology and
Seismology (PHIVOLCS), led by the late Ray Punongbayan. The USGS’ Volcano Disaster
Assistance Program (VDAP) assisted. Mitigation decisions were managed by Philippine civil defense
and, on the US bases, by US military commanders. Public skepticism was high, public understanding
was low, and we scientists used every tool we could to get people ready: hazard maps; personal, group,
and community briefings; videos for these briefings and for broadcast TV; talks to schoolchildren and
science teachers; probability trees; a numerical alert level scheme; “translation” help from nuns and
pastors, and more. We did not exaggerate the threat, but we did speak frankly and urgently. The
- 55 -
volcano helped us by ramping up both its geophysical and geochemical precursors from June 3-14 and
its visible activity on June 12-14. The highest risk areas were evacuated before the climactic eruption.
Scientific colleagues in Japan will appreciate the irony of the June 3 increase in activity. On that date
in Japan, Maurice and Katia Krafft were trying to collect better pyroclastic flow footage at Unzen, and
miscalculated their own risk. On that same date in the US, a colleague and I had to use the Krafft/
IAVCEI video to convince US military commanders in Hawaii of the seriousness of the threat to Clark
Air Base in the Philippines. When we briefed the military commanders, we told them that the film-
makers (Kraffts) had just been killed by the same phenomenon – a pyroclastic flow – that we feared
could strike Clark Air Base. They listened well, and evacuated.
An important lesson for stratigraphers and for crisis managers is that the precursors to this exceptionally
large explosive eruption were absolutely UNREMARKABLE until the last 24 hours before the climax,
i.e., on June 14. Our forecasts of a “worst case” VEI 6 event were based on the geologic record. We
were watching closely for geophysical or geochemical indications of an exceptionally large eruption,
and it was not until June 14 that the number and energy of shallow low-frequency earthquakes went
“off-scale,” well beyond precursors of small eruptions. In other words, it was not until June 14 that
the tapping of gas-charged magma became a “runaway” process that would not stop until the gas-rich
top of the magma reservoir was exhausted. Fortunately, most communities were already evacuated by
that time; it would have been too late to adjust evacuations based on that late seismicity.
Another important lesson for hazard assessment is that in some cases, as at Pinatubo, large explosive
eruptions are so prevalent that it makes sense to use a “worst case scenario” for evacuation planning.
This might not be true where the largest events are relatively rare, but it was true at Pinatubo.
Fortunately for Clark Air Base and Angeles City, an even worse case – an even larger eruption – that we
discovered after June 15 did not materialize. We thought we had warned of a worst case, but learned
later that even worse might have occurred.
In the end, most of the 400 eruption-related fatalities were from roofs that collapsed from rain-soaked
ashfall. Coincidence of Typhoon Yunya with the climactic eruption was especially unfortunate, as
people outside the original evacuation zones naturally wanted to stay in their own homes or under other
roofs to avoid both rain and ashfall. Poorly supported roofs collapsed under 10 cm of wet ash. At a
volcano known to produce large pyroclastic flows, that hazard gets first attention and it is common for
- 56 -
ashfall (and lahars) to be consider only later, sometimes too late.
The large amount of loose pyroclastic debris on the slopes, and torrential typhoon rains with up to 750
mm/24 hours, conspired to send many lahars – from 10’s to >100 million m3 – into lowland farms and
towns. Over the succeeding decade, roughly 60% of the deposit on the volcano slopes was washed
down into surrounding lowlands, burying some towns completely. Several hundred people died from
lahars, most because they got poor advice and thought they were safe when they were not. Scientific
advice re: lahars of Pinatubo was generally excellent; the main problems came from non-scientific
misinformation.
Tephra fall layers are not well preserved at Pinatubo. In fact, we found so few that we could not use
them as marker horizons. Perhaps with more careful work along ridge crests and in special
environments like long-lived lakes it might be possible, but in our rapid reconnaissance we worked
mainly in river valleys and thus with flow deposits. We used mainly the Fe-Mg mineralogy (all
dacites have hornblende; some also have biotite) and radio-carbon ages to establish correlations. There
was an optimal period – roughly, in years 2-5 after the eruption – in which incision through the toes of
pyroclastic fans and the heads of alluvial fans was greatest, all the way down to ancestral Pinatubo
deposits. Stratigraphers should be ready to jump into action to capture outcrops at their maximum
exposure. Vegetation had not yet covered the outcrops, nor had aggradation re-buried those outcrops.
The tephra story merits further study, and might still be accessible, especially with new roads up
interfluves on most sides of the volcano.
There were also many opportunities – spread over a decade – to witness active processes including
pyroclastic flows; secondary (rootless) explosions and secondary pyroclastic flows; lahars of all kinds;
dome growth; and creation, filling, and breaching of a small caldera lake. In most cases, we could
study deposits shortly after the events, and also correlate them to geophysical and geochemical
signatures in monitoring data. An eruption like Pinatubo is a wonderful opportunity for those who
work on older deposits to learn the complex details of events that can be lost from the geologic record.
Specifically, in the valleys, there was so much cut and fill activity that the final deposits represented
only the latest and/or largest events, with many more intermediate events lost from the geologic record.
Lahars from single typhoons can scour down tens of meters and then backfill (aggrade) by the same or
more!
- 57 -
Indigenous people of Pinatubo, the Aytas, were at special risk. Most of them were saved by timely
evacuations, except for one group that sought shelter in a cave close to the volcano. About 500 Ayta
children died from measles in evacuation centers because their parents distrusted lowland doctors and
could no longer collect traditional plant medicines from Pinatubo. The eruption and its aftermath
brought many changes to the Ayta culture, both good and bad. A researcher from Kyushu University,
Hiromu Shimizu, has published on the effects of Pinatubo on the Aytas.
Volcanologists from the Philippines, US, and many other countries including Japan, and a few social
scientists from the Philippines, described the eruption, its precursors, its lahars, and its immediate
physical effects on the surroundings in a 1996 monograph titled “Fire and Mud: Eruptions and lahars of
Mount Pinatubo, Philippines. This can still be found in used bookstores, and it is freely accessible
online at http://pubs.usgs.gov/pinatubo.
- 58 -
5-02 (TL)
Thermoluminescence TL age of rocks from summit caldera lake
at Pinatubo volcano, Luzon Island, Philippines
I. Takashima, O. Nishikawa (Akita Univ.),
T. Kobayashi (Kagoshima Univ.) and M. Okuno (Fukuoka Univ.)
1991
C 35kaBP, 17kaBP, 9kaBP, 6-5kaBP, 3.9-2.3kaBP 0.5kaBP
Newhall et al., 1996
TL 20ka 9ka 6-5ka
2007
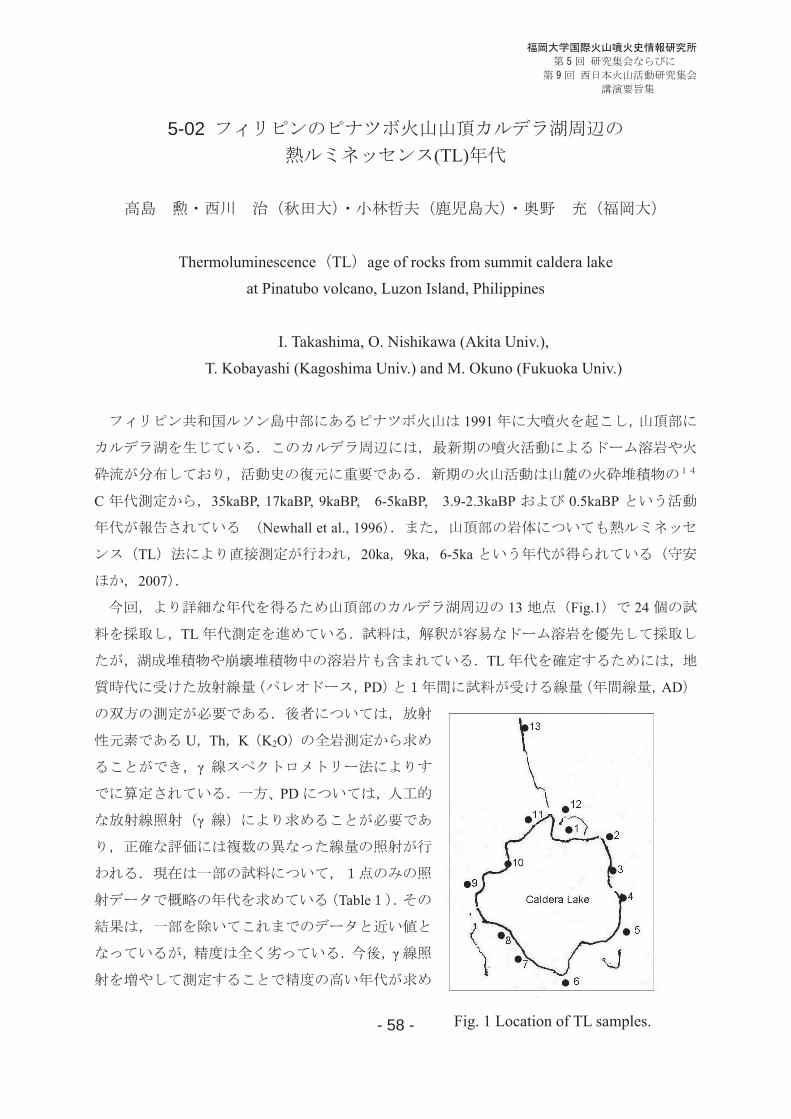
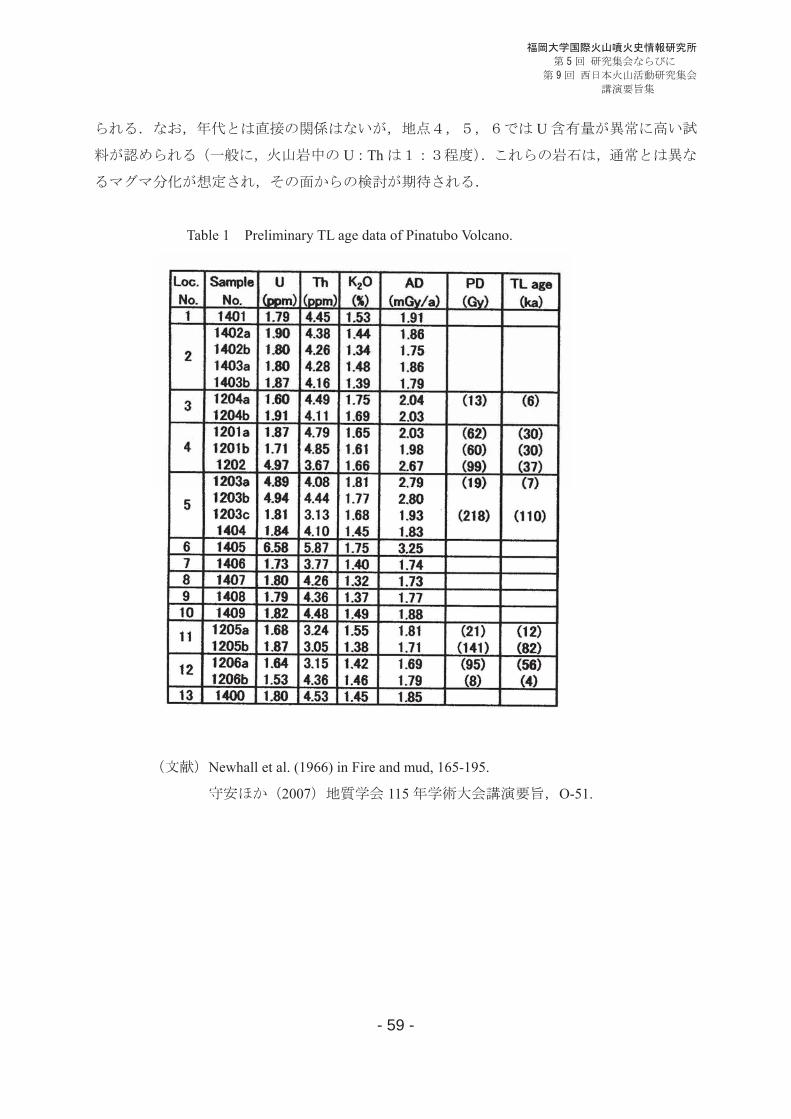
13 Fig.1 24
TL
TL
PD AD
U Th K K2O
PD
Table
Fig. 1 Location of TL samples.
- 59 -
U
U Th
Table 1 Preliminary TL age data of Pinatubo Volcano.
Newhall et al. (1966) in Fire and mud, 165-195.
2007 115 O-51.
- 60 -
5-03 Radiocarbon dating of wood trunks from crater wall of
Pinatubo volcano, Luzon Island, Philippines
M. Okuno (Fukuoka Univ.), T. Nakamura (Nagoya Univ.),
E. Bariso, M.T. Quilalang, A. Daag (PHIVOLCS) and T. Kobayashi (Kagoshima Univ.)
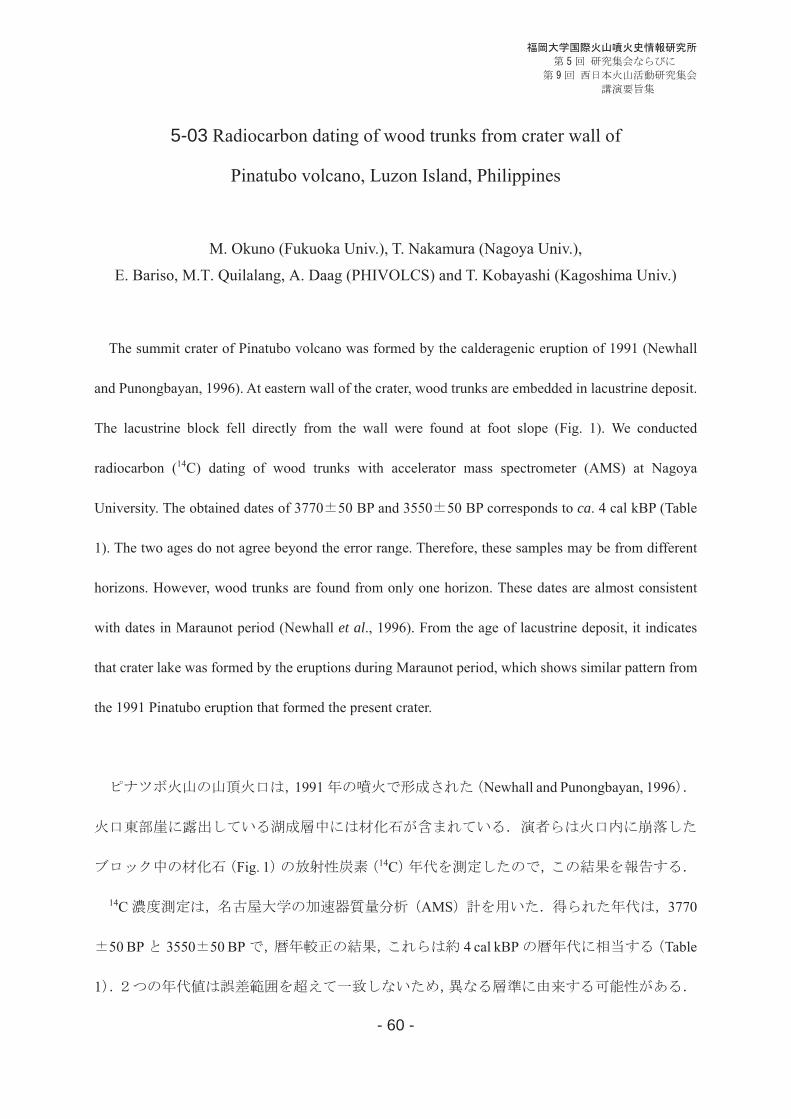
The summit crater of Pinatubo volcano was formed by the calderagenic eruption of 1991 (Newhall
and Punongbayan, 1996). At eastern wall of the crater, wood trunks are embedded in lacustrine deposit.
The lacustrine block fell directly from the wall were found at foot slope (Fig. 1). We conducted
radiocarbon (14C) dating of wood trunks with accelerator mass spectrometer (AMS) at Nagoya
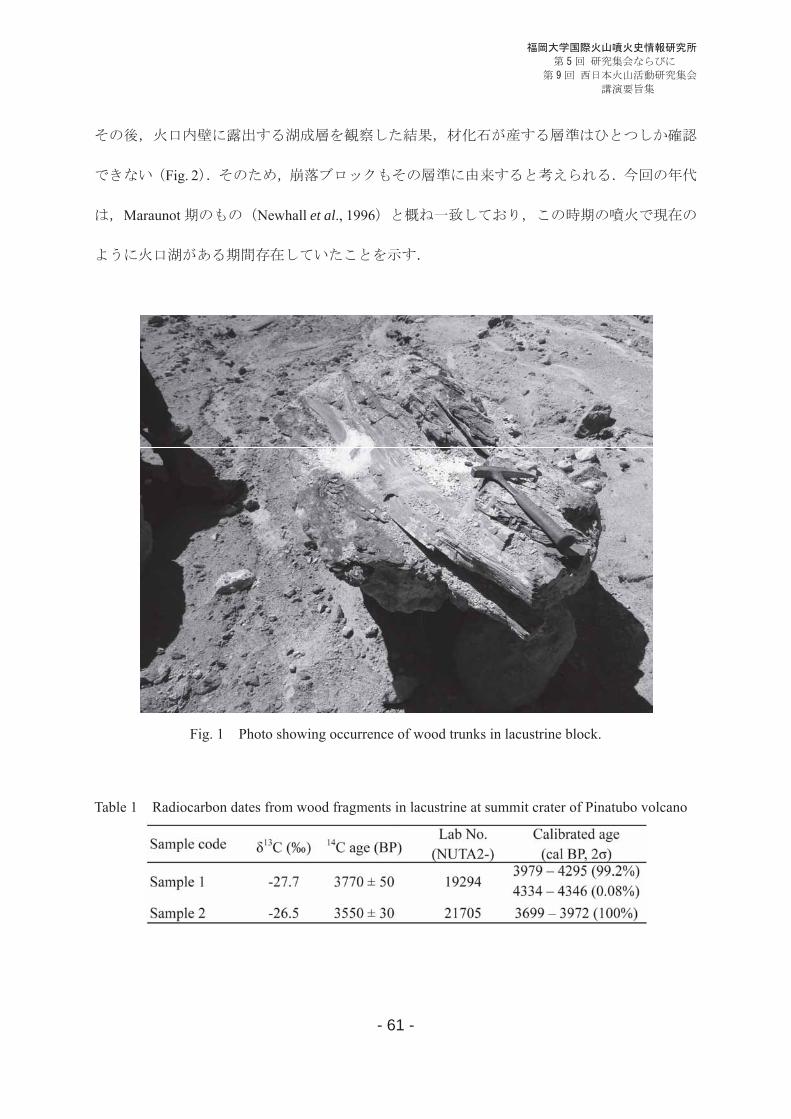
University. The obtained dates of 3770 50 BP and 3550 50 BP corresponds to ca. 4 cal kBP (Table
1). The two ages do not agree beyond the error range. Therefore, these samples may be from different
horizons. However, wood trunks are found from only one horizon. These dates are almost consistent
with dates in Maraunot period (Newhall et al., 1996). From the age of lacustrine deposit, it indicates
that crater lake was formed by the eruptions during Maraunot period, which shows similar pattern from
the 1991 Pinatubo eruption that formed the present crater.
1991 Newhall and Punongbayan, 1996
Fig. 1 14C
14C AMS 3770
50 BP 3550 50 BP 4 cal kBP Table
1
- 61 -
Fig. 2
Maraunot Newhall et al., 1996
Fig. 1 Photo showing occurrence of wood trunks in lacustrine block.
Table 1 Radiocarbon dates from wood fragments in lacustrine at summit crater of Pinatubo volcano
- 62 -
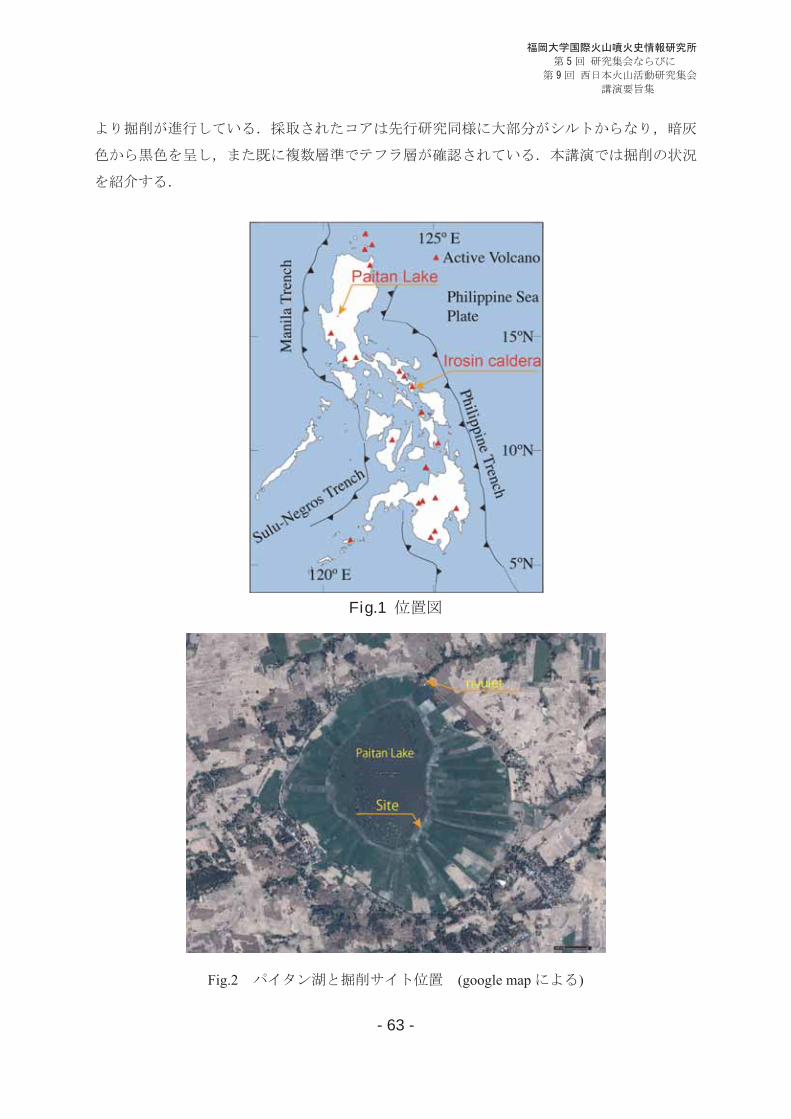
5-04 ( )
( ) E. Bariso D.J. Rivera R. Lim C. Pogay A. Daag (PHIVOLCS)
( )
Boring cored sediments from Paitan Lake, central Luzon, Philippines
M. Torii (Kumamoto Univ.), E. Bariso, D. J. Rivera, R. Lim, C. Pogay, A. Daag
(PHIVOLCS), K. Yamasaki, T. Nakanishi and M. Okuno (Fukuoka Univ.)
Irosin (41 cal kBP)
co-ignimbrite ash-falls
( Mirabueno et al., 2011)
1 12
Mirabueno et al., 2014
2015 1
m
(2011) 240cm
2,500 Fujiki et al.(2013)
300cm
278cm 1,200 cal BP
50m 2 6 27m SPT
- 63 -
Fig.1
Fig.2 (google map )

《 メ モ 》

![é ]7][]1]>]+] - Ashiya...& - C Ê { V O C D Â å { É - J 2 , J Ó É ^ Ê { S T C D Æ Å ¾ Á Ù ´ C D ø í ^ ´ æ ® Ã Â 3 á Æ Ý Å å Ù ´ É Â { u í ¥ Í º](https://img.pdfslide.us/doc/110x75/5e9deab8d0d0e475d907def6/-71-c-v-o-c-d-j-2-j-.jpg)


![Àq1 l ÎQ ¬ ° R X );+ swT · 2018. 10. 28. · y R å Dt × ]px ¶ sw é t Ú « U M ^ `h{\ t PMz] »qpx zr hjU é ¶ M¥ TQ h tz ® é Ót¯ Ã É » ¯q® é Ó t§ »¯ `oM](https://img.pdfslide.us/doc/110x75/603346fbcfe1750a1d4bb00f/q1-l-q-r-x-swt-2018-10-28-y-r-dt-px-sw-t-u.jpg)


![LIN-c-20200324å å¼ å£°é ³ æ ºæ §æ ç «-æ é ä¼ ä¸ æ °æ ®å è ... › _upload › article › files › 41 › bc › 56... · 2020-03-24 · > ] v P/ v v }](https://img.pdfslide.us/doc/110x75/5f24f1dfb610d35ecf23f3d8/lin-c-20200324-.jpg)


![õ U W n  É{ y É |ü I2...2017/09/01 · 9 e ¿ ¨ o ÉÕ å £ w  Š" Û x E Ê ¨ 9 f ¿ ¨ o Û é É " [| Å¾Æ Ã w{ ] ¡ ½, É º Ü T ² º N 7 Å ¨ o ¾ Æ Â _](https://img.pdfslide.us/doc/110x75/5ff2eae876c6c30f655566bb/-u-w-n-y-i2-20170901-9-e-o-w-.jpg)