Embed Size (px)
Citation preview
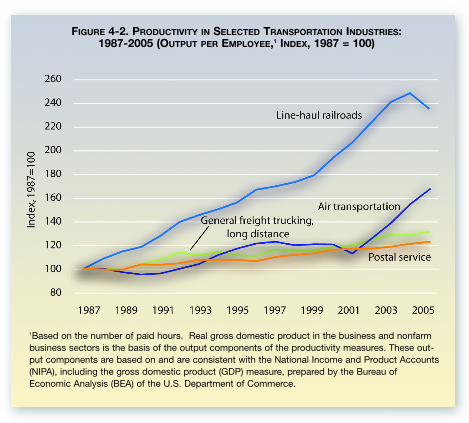
In general, moving goods
is cheaper now than in
the past. Productivity has
improved in both long-
distance railroading and
long-distance trucking
over the past decade but
much more quickly in rail
than road transportation.
Between 1987 and 2005,
output-per-hour worked
more than doubled in
line-haul railroading but
grew only 37 percent in
long- distance, general-
freight trucking. Line-
haul railroads primarily
engage in operating railroads for the transport of passengers and/or cargo over a long
distance within a rail network. These establishments do not include switching and ter-
minal operations or short-distance (or local) railroads. Long-distance, general-freight
trucking establishments are operations other than those primarily engaged in local
trucking and specialized trucking. Specialized trucking establishments are engaged in
the transportation of freight that, because of size, weight, shape, or other inherent char-
acteristics, requires specialized equipment, such as flatbeds, tankers, or refrigerated trailers.
45
FIGURE 4-2. PRODUCTIVITY IN SELECTED TRANSPORTATION INDUSTRIES: 1987-2005 (OUTPUT PER EMPLOYEE,1 INDEX, 1987 = 100)Source: U.S. Department of Labor, Bureau of Labor Statistics, Industry Productivity, available at http://www.bls.gov/ asof June 12, 2007.
FIGURE 4-2. PRODUCTIVITY IN SELECTED TRANSPORTATION INDUSTRIES: 1987-2005 (OUTPUT PER EMPLOYEE,1 INDEX, 1987 = 100)
1Based on the number of paid hours. Real gross domestic product in the business and nonfarmbusiness sectors is the basis of the output components of the productivity measures. These out-put components are based on and are consistent with the National Income and Product Accounts(NIPA), including the gross domestic product (GDP) measure, prepared by the Bureau ofEconomic Analysis (BEA) of the U.S. Department of Commerce.


![Cheaper Medicines Act [Revised]](https://img.pdfslide.us/doc/110x75/577d267e1a28ab4e1ea15ff4/cheaper-medicines-act-revised.jpg)