Embed Size (px)
Citation preview

5.06
June 22, 2021
G
am
ing
Mala
ysi
a
THIS REPORT HAS BEEN PREPARED BY MAYBANK INVESTMENT BANK BERHAD
SEE PAGE 9 FOR IMPORTANT DISCLOSURES AND ANALYST CERTIFICATIONS
PP16832/01/2013 (031128)
Tear Sheet Insert
Yin Shao Yang [email protected] (603) 2297 8916
Genting Bhd (GENT MK)
Cheaper exposure to GENS’ Yokohama IR bid
Maintain BUY call with higher TP of MYR6.26 (+10%)
We now expect GENT to generate a mild FY21E net loss. That said, we
raise our SOP-based TP by 10% to MYR6.26 on our belief that GENS and its
JV partner will win the Yokohama IR RFP process. By our estimation, a
Yokohama IR may double GENT earnings in the long run. If GENS and its
JV partner win the Yokohama IR RFP process and GENT’s share price
reacts the same way as when GENS won the Sentosa IR RFP process, we
do not discount the possibility that GENT’s share price may hit MYR10.
Expect FY21E loss but raise TP to MYR6.26 …
As we widened GENM FY21E net loss by 76% (link), we now forecast GENT
FY21E to go from MYR113m net profit to MYR99m net loss. Yet, our GENT
FY22E and FY23E net profit are maintained as the ramped up COVID-19
vaccination rate in Malaysia will hopefully preclude RWG from shutting
again. Utilising new TPs for GENM (MYR3.38 vs. MYR3.45 previously) and
GENS (SGD1.16 vs. SGD0.86 previously) while ascribing an unchanged 50%
discount to SOP/shr, we raise our TP to MYR6.26 from MYR5.68 (Fig. 1).
… on earnings potentially doubling on a Yokohama IR
We believe that GENS and Sega Sammy (6460 JP, Not Rated) will win
the Yokohama IR RFP process in Jun to Aug 2021 (link). If GENS’
shareholding in the JV is 50%, we estimate that the earnings accretion
from a Yokohama IR in its first full year of operations (FY28E in our view)
to GENT (owns 53% of GENS) will be a whopping MYR2.9b which is more
than its FY19A core net profit of MYR2.2b. In its first full year of
operations (FY11A), GENS via RWS doubled GENT core net profit (Fig. 2)
Will GENT’s share price blast past MYR10 again?
From Jan 1998 to Dec 2006, GENT traded at an average discount to
SOP/shr of 20%. When GENS won the Sentosa IR RFP process in Dec 2006,
GENT even traded at 20% premium to SOP/shr in Apr 2007. We estimate
that GENT is currently trading at 55% discount to SOP/shr (Fig. 3). If
GENS-Sega Sammy JV wins the Yokohama IR RFP process and GENT’s
discount to SOP/shr narrows by a similar 40ppts to 15%, we gather that
GENT’s share price may hit as high as MYR10.63 (Fig. 4).
Company Description
Statistics
52w high/low (MYR)
3m avg turnover (USDm)
Free float (%)
Issued shares (m)
Market capitalisation
Major shareholders:
42.7%
3.2%
2.8%
3,877
9.0
Genting Bhd. engages in the leisure and hospitality,
oil palm plantations, property development,
biotechnology, and oil and gas businesses.
LIM FAMILY
Great Eastern Life Assurance Co. Ltd.
Orbis Investment Management Ltd.
5.53/2.95
54.1
MYR19.6B
USD4.7B
Price Performance
40
50
60
70
80
90
100
110
120
130
140
2.50
3.00
3.50
4.00
4.50
5.00
5.50
6.00
6.50
7.00
7.50
Jun-19 Sep-19 Dec-19 Mar-20 Jun-20 Sep-20 Dec-20 Mar-21
Genting Bhd - (LHS, MYR)
Genting Bhd / Kuala Lumpur Composite Index - (RHS, %)
-1M -3M -12M
Absolute (%) 6 (8) 17
Relative to index (%) 4 (6) 11
Source: FactSet
FYE Dec (MYR m) FY19A FY20A FY21E FY22E FY23E
Revenue 21,617 11,564 15,182 24,528 26,905
EBITDA 7,851 2,903 4,243 8,150 9,506
Core net profit 2,157 (365) (99) 1,218 1,974
Core EPS (sen) 56.0 (9.5) (2.6) 31.6 51.3
Core EPS growth (%) (19.7) nm nm nm 62.2
Net DPS (sen) 22.0 15.0 15.0 20.0 20.0
Core P/E (x) 10.8 nm nm 16.0 9.9
P/BV (x) 0.7 0.5 0.6 0.6 0.6
Net dividend yield (%) 3.6 3.4 3.0 4.0 4.0
ROAE (%) 5.7 (3.0) (0.3) 3.7 5.9
ROAA (%) 2.2 (0.4) (0.1) 1.2 2.0
EV/EBITDA (x) 6.3 17.2 13.5 6.6 5.4
Net gearing (%) (incl perps) 3.6 18.6 29.1 21.7 14.7
Consensus net profit - - 326 1,464 1,924
MKE vs. Consensus (%) - - (130.2) (16.9) 2.6
Share Price MYR 5.06 12m Price Target MYR 6.26 (+10%) Previous Price Target MYR 5.68
BUY
June 22, 2021 2
Genting Bhd
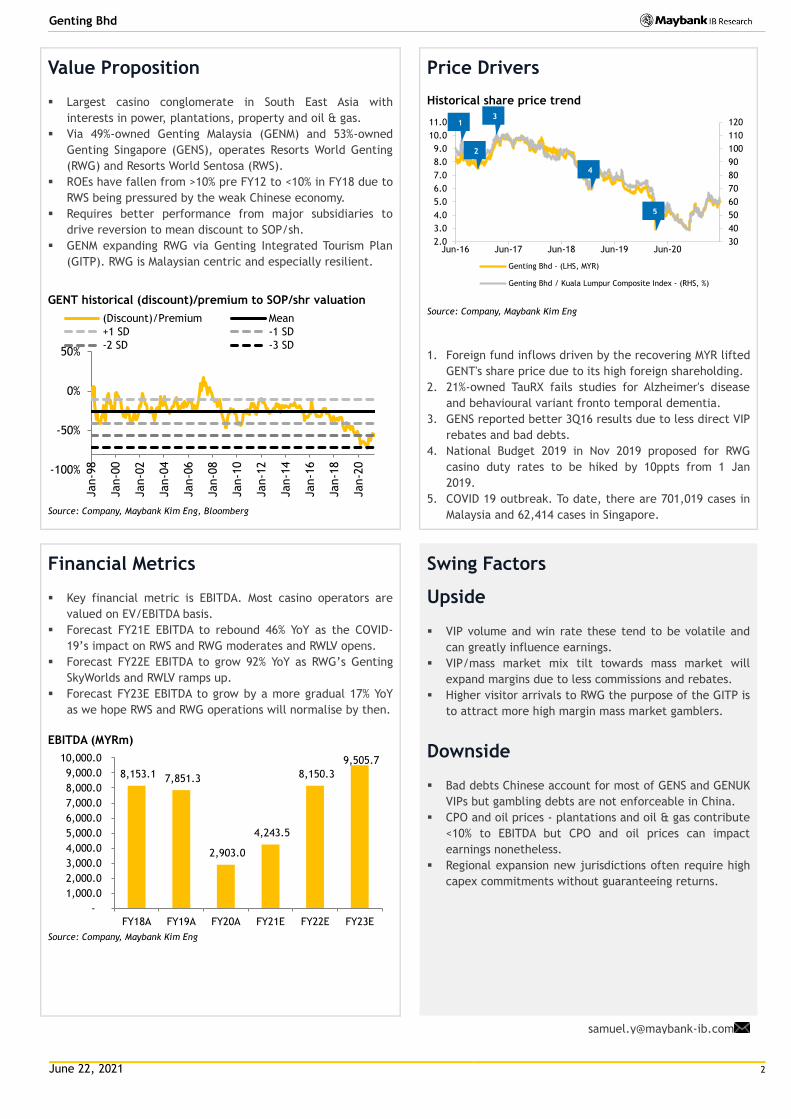
Value Proposition
▪ Largest casino conglomerate in South East Asia with
interests in power, plantations, property and oil & gas.
▪ Via 49%-owned Genting Malaysia (GENM) and 53%-owned
Genting Singapore (GENS), operates Resorts World Genting
(RWG) and Resorts World Sentosa (RWS).
▪ ROEs have fallen from >10% pre FY12 to <10% in FY18 due to
RWS being pressured by the weak Chinese economy.
▪ Requires better performance from major subsidiaries to
drive reversion to mean discount to SOP/sh.
▪ GENM expanding RWG via Genting Integrated Tourism Plan
(GITP). RWG is Malaysian centric and especially resilient.
GENT historical (discount)/premium to SOP/shr valuation
Source: Company, Maybank Kim Eng, Bloomberg
Price Drivers
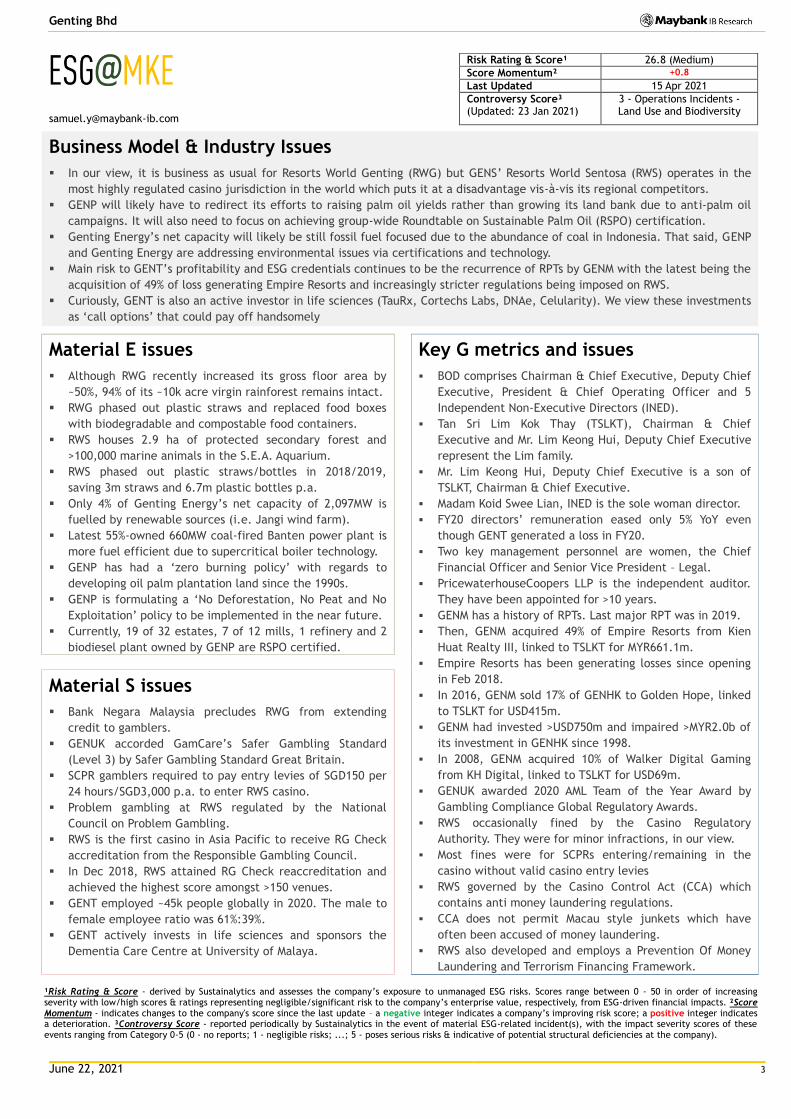
Historical share price trend
Source: Company, Maybank Kim Eng
1. Foreign fund inflows driven by the recovering MYR lifted
GENT's share price due to its high foreign shareholding.
2. 21%-owned TauRX fails studies for Alzheimer's disease
and behavioural variant fronto temporal dementia.
3. GENS reported better 3Q16 results due to less direct VIP
rebates and bad debts.
4. National Budget 2019 in Nov 2019 proposed for RWG
casino duty rates to be hiked by 10ppts from 1 Jan
2019.
5. COVID 19 outbreak. To date, there are 701,019 cases in
Malaysia and 62,414 cases in Singapore.
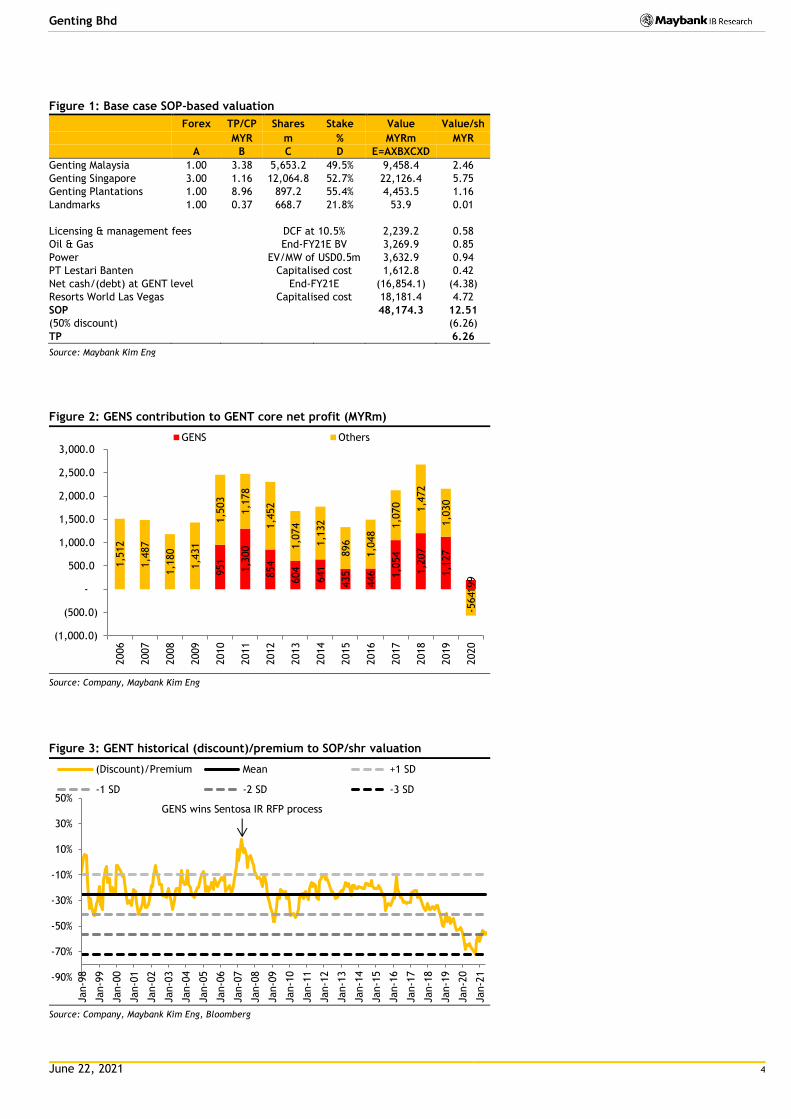
Financial Metrics
▪ Key financial metric is EBITDA. Most casino operators are
valued on EV/EBITDA basis.
▪ Forecast FY21E EBITDA to rebound 46% YoY as the COVID-
19’s impact on RWS and RWG moderates and RWLV opens.
▪ Forecast FY22E EBITDA to grow 92% YoY as RWG’s Genting
SkyWorlds and RWLV ramps up.
▪ Forecast FY23E EBITDA to grow by a more gradual 17% YoY
as we hope RWS and RWG operations will normalise by then.
EBITDA (MYRm)
Source: Company, Maybank Kim Eng
Swing Factors
Upside
▪ VIP volume and win rate these tend to be volatile and
can greatly influence earnings.
▪ VIP/mass market mix tilt towards mass market will
expand margins due to less commissions and rebates.
▪ Higher visitor arrivals to RWG the purpose of the GITP is
to attract more high margin mass market gamblers.
Downside
▪ Bad debts Chinese account for most of GENS and GENUK
VIPs but gambling debts are not enforceable in China.
▪ CPO and oil prices - plantations and oil & gas contribute
<10% to EBITDA but CPO and oil prices can impact
earnings nonetheless.
▪ Regional expansion new jurisdictions often require high
capex commitments without guaranteeing returns.
-100%
-50%
0%
50%
Jan-9
8
Jan-0
0
Jan-0
2
Jan-0
4
Jan-0
6
Jan-0
8
Jan-1
0
Jan-1
2
Jan-1
4
Jan-1
6
Jan-1
8
Jan-2
0
(Discount)/Premium Mean
+1 SD -1 SD
-2 SD -3 SD
30
40
50
60
70
80
90
100
110
120
2.0
3.0
4.0
5.0
6.0
7.0
8.0
9.0
10.0
11.0
Jun-16 Jun-17 Jun-18 Jun-19 Jun-20
Genting Bhd - (LHS, MYR)
Genting Bhd / Kuala Lumpur Composite Index - (RHS, %)
8,153.1 7,851.3
2,903.0
4,243.5
8,150.3
9,505.7
-
1,000.0
2,000.0
3,000.0
4,000.0
5,000.0
6,000.0
7,000.0
8,000.0
9,000.0
10,000.0
FY18A FY19A FY20A FY21E FY22E FY23E
1
2
3
5
4
June 22, 2021 3
Genting Bhd
Risk Rating & Score¹ 26.8 (Medium)
Score Momentum² +0.8
Last Updated 15 Apr 2021
Controversy Score³ (Updated: 23 Jan 2021)
3 - Operations Incidents - Land Use and Biodiversity
Business Model & Industry Issues
▪ In our view, it is business as usual for Resorts World Genting (RWG) but GENS’ Resorts World Sentosa (RWS) operates in the
most highly regulated casino jurisdiction in the world which puts it at a disadvantage vis-à-vis its regional competitors.
▪ GENP will likely have to redirect its efforts to raising palm oil yields rather than growing its land bank due to anti-palm oil
campaigns. It will also need to focus on achieving group-wide Roundtable on Sustainable Palm Oil (RSPO) certification.
▪ Genting Energy’s net capacity will likely be still fossil fuel focused due to the abundance of coal in Indonesia. That said, GENP
and Genting Energy are addressing environmental issues via certifications and technology.
▪ Main risk to GENT’s profitability and ESG credentials continues to be the recurrence of RPTs by GENM with the latest being the
acquisition of 49% of loss generating Empire Resorts and increasingly stricter regulations being imposed on RWS.
▪ Curiously, GENT is also an active investor in life sciences (TauRx, Cortechs Labs, DNAe, Celularity). We view these investments
as ‘call options’ that could pay off handsomely
Material E issues
▪ Although RWG recently increased its gross floor area by
~50%, 94% of its ~10k acre virgin rainforest remains intact.
▪ RWG phased out plastic straws and replaced food boxes
with biodegradable and compostable food containers.
▪ RWS houses 2.9 ha of protected secondary forest and
>100,000 marine animals in the S.E.A. Aquarium.
▪ RWS phased out plastic straws/bottles in 2018/2019,
saving 3m straws and 6.7m plastic bottles p.a.
▪ Only 4% of Genting Energy’s net capacity of 2,097MW is
fuelled by renewable sources (i.e. Jangi wind farm).
▪ Latest 55%-owned 660MW coal-fired Banten power plant is
more fuel efficient due to supercritical boiler technology.
▪ GENP has had a ‘zero burning policy’ with regards to
developing oil palm plantation land since the 1990s.
▪ GENP is formulating a ‘No Deforestation, No Peat and No
Exploitation’ policy to be implemented in the near future.
▪ Currently, 19 of 32 estates, 7 of 12 mills, 1 refinery and 2
biodiesel plant owned by GENP are RSPO certified.
Key G metrics and issues
▪ BOD comprises Chairman & Chief Executive, Deputy Chief
Executive, President & Chief Operating Officer and 5
Independent Non-Executive Directors (INED).
▪ Tan Sri Lim Kok Thay (TSLKT), Chairman & Chief
Executive and Mr. Lim Keong Hui, Deputy Chief Executive
represent the Lim family.
▪ Mr. Lim Keong Hui, Deputy Chief Executive is a son of
TSLKT, Chairman & Chief Executive.
▪ Madam Koid Swee Lian, INED is the sole woman director.
▪ FY20 directors’ remuneration eased only 5% YoY even
though GENT generated a loss in FY20.
▪ Two key management personnel are women, the Chief
Financial Officer and Senior Vice President – Legal.
▪ PricewaterhouseCoopers LLP is the independent auditor.
They have been appointed for >10 years.
▪ GENM has a history of RPTs. Last major RPT was in 2019.
▪ Then, GENM acquired 49% of Empire Resorts from Kien
Huat Realty III, linked to TSLKT for MYR661.1m.
▪ Empire Resorts has been generating losses since opening
in Feb 2018.
▪ In 2016, GENM sold 17% of GENHK to Golden Hope, linked
to TSLKT for USD415m.
▪ GENM had invested >USD750m and impaired >MYR2.0b of
its investment in GENHK since 1998.
▪ In 2008, GENM acquired 10% of Walker Digital Gaming
from KH Digital, linked to TSLKT for USD69m.
▪ GENUK awarded 2020 AML Team of the Year Award by
Gambling Compliance Global Regulatory Awards.
▪ RWS occasionally fined by the Casino Regulatory
Authority. They were for minor infractions, in our view.
▪ Most fines were for SCPRs entering/remaining in the
casino without valid casino entry levies
▪ RWS governed by the Casino Control Act (CCA) which
contains anti money laundering regulations.
▪ CCA does not permit Macau style junkets which have
often been accused of money laundering.
▪ RWS also developed and employs a Prevention Of Money
Laundering and Terrorism Financing Framework.
Material S issues
▪ Bank Negara Malaysia precludes RWG from extending
credit to gamblers.
▪ GENUK accorded GamCare’s Safer Gambling Standard
(Level 3) by Safer Gambling Standard Great Britain.
▪ SCPR gamblers required to pay entry levies of SGD150 per
24 hours/SGD3,000 p.a. to enter RWS casino.
▪ Problem gambling at RWS regulated by the National
Council on Problem Gambling.
▪ RWS is the first casino in Asia Pacific to receive RG Check
accreditation from the Responsible Gambling Council.
▪ In Dec 2018, RWS attained RG Check reaccreditation and
achieved the highest score amongst >150 venues.
▪ GENT employed ~45k people globally in 2020. The male to
female employee ratio was 61%:39%.
▪ GENT actively invests in life sciences and sponsors the
Dementia Care Centre at University of Malaya.
¹Risk Rating & Score - derived by Sustainalytics and assesses the company’s exposure to unmanaged ESG risks. Scores range between 0 - 50 in order of increasing severity with low/high scores & ratings representing negligible/significant risk to the company’s enterprise value, respectively, from ESG-driven financial impacts. ²Score Momentum - indicates changes to the company's score since the last update – a negative integer indicates a company’s improving risk score; a positive integer indicates a deterioration. ³Controversy Score - reported periodically by Sustainalytics in the event of material ESG-related incident(s), with the impact severity scores of these events ranging from Category 0-5 (0 - no reports; 1 - negligible risks; ...; 5 - poses serious risks & indicative of potential structural deficiencies at the company).
June 22, 2021 4
Genting Bhd
Figure 1: Base case SOP-based valuation Forex TP/CP Shares Stake Value Value/sh MYR m % MYRm MYR A B C D E=AXBXCXD
Genting Malaysia 1.00 3.38 5,653.2 49.5% 9,458.4 2.46
Genting Singapore 3.00 1.16 12,064.8 52.7% 22,126.4 5.75
Genting Plantations 1.00 8.96 897.2 55.4% 4,453.5 1.16
Landmarks 1.00 0.37 668.7 21.8% 53.9 0.01
Licensing & management fees DCF at 10.5% 2,239.2 0.58
Oil & Gas End-FY21E BV 3,269.9 0.85
Power EV/MW of USD0.5m 3,632.9 0.94
PT Lestari Banten Capitalised cost 1,612.8 0.42
Net cash/(debt) at GENT level End-FY21E (16,854.1) (4.38)
Resorts World Las Vegas Capitalised cost 18,181.4 4.72
SOP 48,174.3 12.51
(50% discount) (6.26)
TP 6.26
Source: Maybank Kim Eng
Figure 2: GENS contribution to GENT core net profit (MYRm)
Source: Company, Maybank Kim Eng
Figure 3: GENT historical (discount)/premium to SOP/shr valuation
Source: Company, Maybank Kim Eng, Bloomberg
951
1,3
00
854
604
641
435
446 1,0
54
1,2
07
1,1
27
199
1,5
12
1,4
87
1,1
80
1,4
31
1,5
03
1,1
78
1,4
52
1,0
74
1,1
32
896
1,0
48
1,0
70 1,4
72
1,0
30
-564
(1,000.0)
(500.0)
-
500.0
1,000.0
1,500.0
2,000.0
2,500.0
3,000.0
2006
2007
2008
2009
2010
2011
2012
2013
2014
2015
2016
2017
2018
2019
2020
GENS Others
-90%
-70%
-50%
-30%
-10%
10%
30%
50%
Jan-9
8
Jan-9
9
Jan-0
0
Jan-0
1
Jan-0
2
Jan-0
3
Jan-0
4
Jan-0
5
Jan-0
6
Jan-0
7
Jan-0
8
Jan-0
9
Jan-1
0
Jan-1
1
Jan-1
2
Jan-1
3
Jan-1
4
Jan-1
5
Jan-1
6
Jan-1
7
Jan-1
8
Jan-1
9
Jan-2
0
Jan-2
1
(Discount)/Premium Mean +1 SD
-1 SD -2 SD -3 SD
GENS wins Sentosa IR RFP process
June 22, 2021 5
Genting Bhd
Figure 4: SOP-based valuation assuming 15% discount to SOP/shr Forex TP/CP Shares Stake Value Value/sh MYR m % MYRm MYR A B C D E=AXBXCXD
Genting Malaysia 1.00 3.38 5,653.2 49.5% 9,458.4 2.46
Genting Singapore 3.00 1.16 12,064.8 52.7% 22,126.4 5.75
Genting Plantations 1.00 8.96 897.2 55.4% 4,453.5 1.16
Landmarks 1.00 0.37 668.7 21.8% 53.9 0.01
Licensing & management fees DCF at 10.5% 2,239.2 0.58
Oil & Gas End-FY21E BV 3,269.9 0.85
Power EV/MW of USD0.5m 3,632.9 0.94
PT Lestari Banten Capitalised cost 1,612.8 0.42
Net cash/(debt) at GENT level End-FY21E (16,854.1) (4.38)
Resorts World Las Vegas Capitalised cost 18,181.4 4.72
SOP 48,174.3 12.51
(15% discount) (1.88)
TP 10.63
Source: Maybank Kim Eng

June 22, 2021 6
Genting Bhd
FYE 31 Dec FY19A FY20A FY21E FY22E FY23E
Key Metrics
P/E (reported) (x) 12.4 nm nm 16.0 9.9
Core P/E (x) 10.8 nm nm 16.0 9.9
P/BV (x) 0.7 0.5 0.6 0.6 0.6
P/NTA (x) 0.8 0.6 0.7 0.7 0.7
Net dividend yield (%) 3.6 3.4 3.0 4.0 4.0
FCF yield (%) nm nm nm 37.2 37.4
EV/EBITDA (x) 6.3 17.2 13.5 6.6 5.4
EV/EBIT (x) 9.5 104.5 40.3 11.4 8.3
INCOME STATEMENT (MYR m)
Revenue 21,616.5 11,564.1 15,181.9 24,528.0 26,904.6
EBITDA 7,851.3 2,903.0 4,243.5 8,150.3 9,505.7
Depreciation (2,631.9) (2,426.1) (2,820.4) (3,396.9) (3,403.9)
EBIT 5,219.4 476.9 1,423.1 4,753.4 6,101.9
Net interest income /(exp) (376.5) (680.3) (1,085.1) (1,387.3) (1,204.9)
Associates & JV 89.3 (89.3) (62.0) (46.5) 3.9
Exceptionals (349.6) (1,233.8) 0.0 0.0 0.0
Pretax profit 4,582.6 (1,526.5) 276.0 3,319.6 4,900.8
Income tax (901.5) (547.5) (308.7) (866.2) (1,118.0)
Minorities (1,685.3) 1,049.8 (65.7) (1,235.8) (1,808.3)
Discontinued operations 0.0 0.0 0.0 0.0 0.0
Reported net profit 1,995.8 (1,024.2) (98.5) 1,217.6 1,974.5
Core net profit 2,156.6 (365.0) (98.5) 1,217.6 1,974.5
BALANCE SHEET (MYR m)
Cash & Short Term Investments 30,944.8 26,619.9 25,310.5 25,634.0 24,498.4
Accounts receivable 2,313.8 2,014.3 2,134.8 2,625.4 2,879.8
Inventory 675.6 580.5 618.7 767.1 840.6
Property, Plant & Equip (net) 41,303.9 45,084.3 49,141.6 47,044.5 45,050.2
Intangible assets 5,739.6 5,188.6 5,188.6 5,188.6 5,188.6
Investment in Associates & JVs 2,657.4 3,365.3 3,933.4 4,412.0 4,835.9
Other assets 18,381.3 16,788.1 16,381.4 16,381.4 16,381.4
Total assets 102,016.4 99,641.0 102,709.1 102,053.1 99,675.0
ST interest bearing debt 2,851.2 1,624.3 3,412.3 4,695.8 4,695.8
Accounts payable 5,747.3 4,952.0 5,410.6 6,838.1 7,264.4
LT interest bearing debt 30,208.2 35,143.1 37,401.6 32,705.8 28,010.1
Other liabilities 3,936.0 3,395.0 3,225.0 3,699.0 3,908.0
Total Liabilities 42,742.4 45,114.6 49,449.7 47,938.5 43,877.9
Shareholders Equity 35,332.2 32,965.4 32,289.3 32,736.8 33,941.2
Minority Interest 23,941.8 21,561.0 20,970.1 21,377.8 21,856.0
Total shareholder equity 59,274.0 54,526.4 53,259.4 54,114.6 55,797.2
Total liabilities and equity 102,016.4 99,641.0 102,709.1 102,053.1 99,675.0
CASH FLOW (MYR m)
Pretax profit 4,582.6 (1,526.5) 276.0 3,319.6 4,900.8
Depreciation & amortisation 2,631.9 2,426.1 2,820.4 3,396.9 3,403.9
Adj net interest (income)/exp 376.5 680.3 1,085.1 1,387.3 1,204.9
Change in working capital (42.6) (562.8) 299.9 788.5 98.5
Cash taxes paid (1,123.8) (779.4) (477.5) (392.6) (909.2)
Other operating cash flow 367.8 823.1 62.0 46.5 (3.9)
Cash flow from operations 6,792.4 1,060.8 4,065.8 8,546.3 8,695.0
Capex (7,330.1) (7,084.9) (6,877.7) (1,299.8) (1,409.5)
Free cash flow (537.7) (6,024.1) (2,811.9) 7,246.4 7,285.4
Dividends paid (750.8) (847.1) (577.6) (770.1) (770.1)
Equity raised / (purchased) 0.0 0.0 0.0 0.0 0.0
Change in Debt 2,905.8 4,396.3 4,046.5 (3,412.3) (4,695.8)
Other invest/financing cash flow (2,300.8) (1,127.9) (1,966.4) (2,740.5) (2,955.1)
Effect of exch rate changes (22.2) (705.1) 0.0 0.0 0.0
Net cash flow (705.7) (4,307.9) (1,309.4) 323.5 (1,135.6)
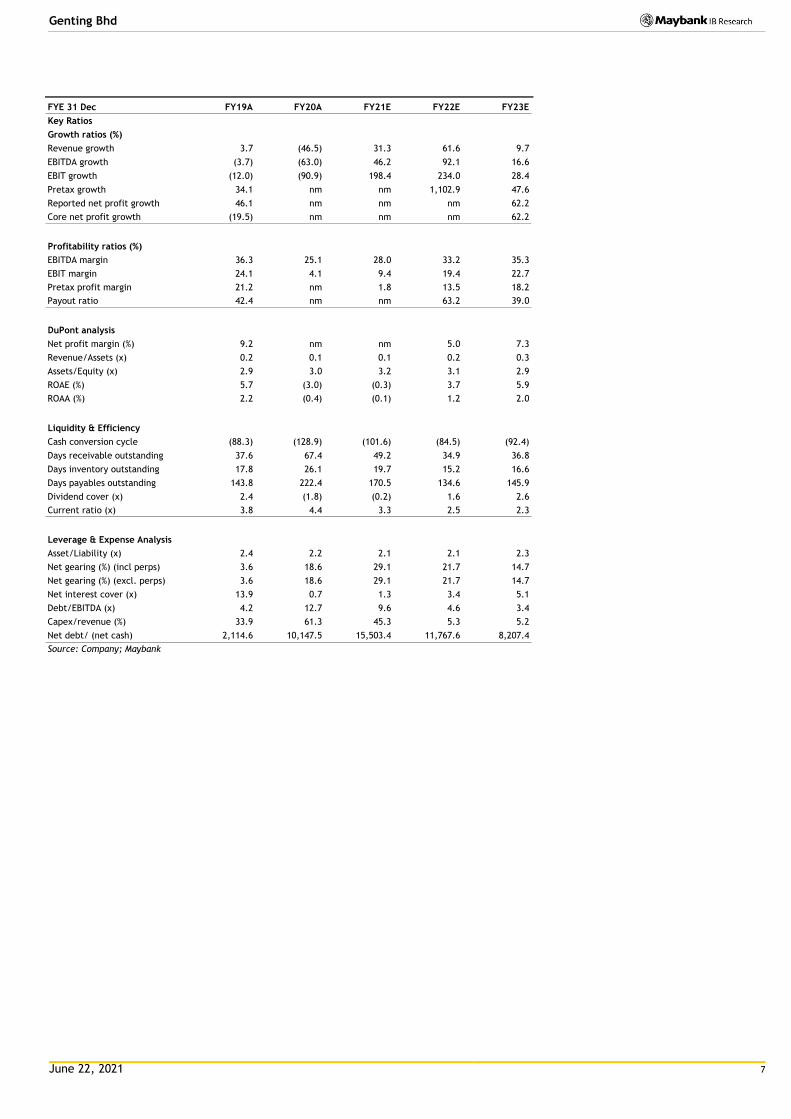
June 22, 2021 7
Genting Bhd
FYE 31 Dec FY19A FY20A FY21E FY22E FY23E
Key Ratios
Growth ratios (%)
Revenue growth 3.7 (46.5) 31.3 61.6 9.7
EBITDA growth (3.7) (63.0) 46.2 92.1 16.6
EBIT growth (12.0) (90.9) 198.4 234.0 28.4
Pretax growth 34.1 nm nm 1,102.9 47.6
Reported net profit growth 46.1 nm nm nm 62.2
Core net profit growth (19.5) nm nm nm 62.2
Profitability ratios (%)
EBITDA margin 36.3 25.1 28.0 33.2 35.3
EBIT margin 24.1 4.1 9.4 19.4 22.7
Pretax profit margin 21.2 nm 1.8 13.5 18.2
Payout ratio 42.4 nm nm 63.2 39.0
DuPont analysis
Net profit margin (%) 9.2 nm nm 5.0 7.3
Revenue/Assets (x) 0.2 0.1 0.1 0.2 0.3
Assets/Equity (x) 2.9 3.0 3.2 3.1 2.9
ROAE (%) 5.7 (3.0) (0.3) 3.7 5.9
ROAA (%) 2.2 (0.4) (0.1) 1.2 2.0
Liquidity & Efficiency
Cash conversion cycle (88.3) (128.9) (101.6) (84.5) (92.4)
Days receivable outstanding 37.6 67.4 49.2 34.9 36.8
Days inventory outstanding 17.8 26.1 19.7 15.2 16.6
Days payables outstanding 143.8 222.4 170.5 134.6 145.9
Dividend cover (x) 2.4 (1.8) (0.2) 1.6 2.6
Current ratio (x) 3.8 4.4 3.3 2.5 2.3
Leverage & Expense Analysis
Asset/Liability (x) 2.4 2.2 2.1 2.1 2.3
Net gearing (%) (incl perps) 3.6 18.6 29.1 21.7 14.7
Net gearing (%) (excl. perps) 3.6 18.6 29.1 21.7 14.7
Net interest cover (x) 13.9 0.7 1.3 3.4 5.1
Debt/EBITDA (x) 4.2 12.7 9.6 4.6 3.4
Capex/revenue (%) 33.9 61.3 45.3 5.3 5.2
Net debt/ (net cash) 2,114.6 10,147.5 15,503.4 11,767.6 8,207.4
Source: Company; Maybank
June 22, 2021 8
Genting Bhd
Research Offices
ECONOMICS
Suhaimi ILIAS Chief Economist Malaysia | Philippines | Global (603) 2297 8682 [email protected]
CHUA Hak Bin Regional Thematic Macroeconomist (65) 6231 5830 [email protected]
LEE Ju Ye Singapore | Thailand | Indonesia (65) 6231 5844 [email protected]
Linda LIU Singapore | Vietnam | Cambodia | Myanmar | Laos (65) 6231 5847 [email protected]
Dr Zamros DZULKAFLI (603) 2082 6818 [email protected]
Ramesh LANKANATHAN (603) 2297 8685 [email protected]
FX
Saktiandi SUPAAT Head of FX Research (65) 6320 1379 [email protected]
Christopher WONG (65) 6320 1347 [email protected]
TAN Yanxi (65) 6320 1378 [email protected]
Fiona LIM (65) 6320 1374 [email protected]
STRATEGY
Anand PATHMAKANTHAN
ASEAN (603) 2297 8783 [email protected]
FIXED INCOME
Winson PHOON, ACA (65) 6340 1079 [email protected]
SE THO Mun Yi (603) 2074 7606 [email protected]
REGIONAL EQUITIES
Anand PATHMAKANTHAN Head of Regional Equity Research (603) 2297 8783 [email protected]
WONG Chew Hann, CA Head of ASEAN Equity Research (603) 2297 8686 [email protected]
ONG Seng Yeow Research, Technology & Innovation (65) 6231 5839 [email protected]
MALAYSIA
Anand PATHMAKANTHAN Head of Research (603) 2297 8783 [email protected] • Strategy
WONG Chew Hann (603) 2297 8686 [email protected] • Non-Bank Financials (stock exchange) • Construction & Infrastructure
Desmond CH’NG, BFP, FCA (603) 2297 8680 [email protected] • Banking & Finance
LIAW Thong Jung (603) 2297 8688 [email protected] • Oil & Gas Services- Regional • Automotive
ONG Chee Ting, CA (603) 2297 8678 [email protected] • Plantations - Regional
YIN Shao Yang, CPA (603) 2297 8916 [email protected] • Gaming – Regional • Media • Aviation • Non-Bank Financials
TAN Chi Wei, CFA (603) 2297 8690 [email protected] • Power • Telcos
WONG Wei Sum, CFA (603) 2297 8679 [email protected] • Property
Kevin WONG (603) 2082 6824 [email protected] • REITs • Technology
Jade TAM (603) 2297 8687 [email protected] • Consumer Staples & Discretionary
Fahmi FARID (603) 2297 8676 [email protected] • Software
TEE Sze Chiah Head of Retail Research (603) 2082 6858 [email protected]
Nik Ihsan RAJA ABDULLAH, MSTA, CFTe (603) 2297 8694 [email protected] • Chartist
Amirah AZMI (603) 2082 8769 [email protected] • Retail Research
INDIA
Jigar SHAH Head of Research (91) 22 4223 2632 [email protected] • Strategy • Oil & Gas • Automobile • Cement
Neerav DALAL (91) 22 4223 2606 [email protected] • Software Technology • Telcos
Vikram RAMALINGAM (91) 22 4223 2607 [email protected] • Automobile • Media
SINGAPORE
Thilan WICKRAMASINGHE Head of Research (65) 6231 5840 [email protected] • Banking & Finance - Regional • Consumer
CHUA Su Tye (65) 6231 5842 [email protected] • REITs - Regional
LAI Gene Lih, CFA (65) 6231 5832 [email protected] • Technology • Healthcare
Kareen CHAN (65) 6231 5926 [email protected] • Transport • Telcos • Consumer
Eric ONG (65) 6231 5924 [email protected] • SMIDs
Matthew SHIM (65) 6231 5929 [email protected] • Retail Research
PHILIPPINES
Jacqui de JESUS Head of Research (63) 2 8849 8844 [email protected] • Strategy • Conglomerates
Romel LIBO-ON (63) 2 8849 8844 [email protected] • Property • REITs • Telcos
Rachelleen RODRIGUEZ, CFA (63) 2 8849 8843 [email protected] • Banking & Finance • Transport
Benedict CLEMENTE (63) 2 8849 8846 [email protected] • Utilities
VIETNAM
Quan Trong Thanh Head of Research (84 28) 44 555 888 ext 8184 [email protected] • Banks
Hoang Huy, CFA (84 28) 44 555 888 ext 8181 [email protected] • Strategy • Technology
Le Nguyen Nhat Chuyen (84 28) 44 555 888 ext 8082 [email protected] • Oil & Gas
Nguyen Thi Sony Tra Mi (84 28) 44 555 888 ext 8084 [email protected] • Consumer
Tyler Manh Dung Nguyen (84 28) 44 555 888 ext 8085 [email protected] • Utilities • Property
Tran Thi Thu Thao (84 28) 44 555 888 ext 8180 [email protected] • Industrials
Nguyen Thi Ngan Tuyen Head of Retail Research (84 28) 44 555 888 ext 8081 [email protected] • Retail Research
Nguyen Thanh Lam (84 28) 44 555 888 ext 8086 [email protected] • Technical Analysis
INDONESIA
Isnaputra ISKANDAR Head of Research (62) 21 8066 8680 [email protected] • Strategy • Metals & Mining • Cement • Autos • Consumer • Utility
Rahmi MARINA (62) 21 8066 8689 [email protected] • Banking & Finance
Willy GOUTAMA (62) 21 8066 8500 [email protected] • Consumer
THAILAND
Maria LAPIZ Head of Institutional Research Dir (66) 2257 0250 | (66) 2658 6300 ext 1399 [email protected] • Strategy • Consumer • Materials • Services
Jesada TECHAHUSDIN, CFA (66) 2658 6300 ext 1395 [email protected] • Banking & Finance
Kaushal LADHA, CFA (66) 2658 6300 ext 1392 [email protected] • Oil & Gas – Regional • Petrochemicals - Regional • Utilities
Vanida GEISLER, CPA (66) 2658 6300 ext 1394 [email protected] • Property • REITs
Yuwanee PROMMAPORN (66) 2658 6300 ext 1393 Yuwanee.P @maybank-ke.co.th • Services • Healthcare
Ekachai TARAPORNTIP Head of Retail Research (66) 2658 5000 ext 1530 [email protected]
Surachai PRAMUALCHAROENKIT (66) 2658 5000 ext 1470 [email protected] • Auto • Conmat • Contractor • Steel
Suttatip PEERASUB (66) 2658 5000 ext 1430 [email protected] • Food & Beverage • Commerce
Jaroonpan WATTANAWONG (66) 2658 5000 ext 1404 [email protected] • Transportation • Small cap
Thanatphat SUKSRICHAVALIT (66) 2658 5000 ext 1401 [email protected] • Media • Electronics
Wijit ARAYAPISIT (66) 2658 5000 ext 1450 [email protected] • Strategist
Theerasate PROMPONG (66) 2658 5000 ext 1400 [email protected] • Equity Portfolio Strategist
Apiwat TAVESIRIVATE (66) 2658 5000 ext 1310 [email protected] • Chartist and TFEX
June 22, 2021 9
Genting Bhd
APPENDIX I: TERMS FOR PROVISION OF REPORT, DISCLAIMERS AND DISCLOSURES
DISCLAIMERS This research report is prepared for general circulation and for information purposes only and under no circumstances should it be considered or intended as an offer to sell or a solicitation of an offer to buy the securities referred to herein. Investors should note that values of such securities, if any, may fluctuate and that each security’s price or value may rise or fall. Opinions or recommendations contained herein are in form of technical ratings and fundamental ratings. Technical ratings may differ from fundamental ratings as technical valuations apply different methodologies and are purely based on price and volume-related information extracted from the relevant jurisdiction’s stock exchange in the equity analysis. Accordingly, investors’ returns may be less than the original sum invested. Past performance is not necessarily a guide to future performance. This report is not intended to provide personal investment advice and does not take into account the specific investment objectives, the financial situation and the particular needs of persons who may receive or read this report. Investors should therefore seek financial, legal and other advice regarding the appropriateness of investing in any securities or the investment strategies discussed or recommended in this report.
The information contained herein has been obtained from sources believed to be reliable but such sources have not been independently verified by Maybank Investment Bank Berhad, its subsidiary and affiliates (collectively, “MKE”) and consequently no representation is made as to the accuracy or completeness of this report by MKE and it should not be relied upon as such. Accordingly, MKE and its officers, directors, associates, connected parties and/or employees (collectively, “Representatives”) shall not be liable for any direct, indirect or consequential losses or damages that may arise from the use or reliance of this report. Any information, opinions or recommendations contained herein are subject to change at any time, without prior notice.
This report may contain forward looking statements which are often but not always identified by the use of words such as “anticipate”, “believe”, “estimate”, “intend”, “plan”, “expect”, “forecast”, “predict” and “project” and statements that an event or result “may”, “will”, “can”, “should”, “could” or “might” occur or be achieved and other similar expressions. Such forward looking statements are based on assumptions made and information currently available to us and are subject to certain risks and uncertainties that could cause the actual results to differ materially from those expressed in any forward looking statements. Readers are cautioned not to place undue relevance on these forward-looking statements. MKE expressly disclaims any obligation to update or revise any such forward looking statements to reflect new information, events or circumstances af ter the date of this publication or to reflect the occurrence of unanticipated events.
MKE and its officers, directors and employees, including persons involved in the preparation or issuance of this report, may, to the extent permitted by law, from time to time participate or invest in financing transactions with the issuer(s) of the securities mentioned in this report, perform services for or solicit business from such issuers, and/or have a position or hold ing, or other material interest, or effect transactions, in such securities or options thereon, or other investments related thereto. In addition, it may make markets in the securities mentioned in the material presented in this report. One or more directors, officers and/or employees of MKE may be a director of the issue rs of the securities mentioned in this report to the extent permitted by law.
This report is prepared for the use of MKE’s clients and may not be reproduced, altered in any way, transmitted to, copied or distributed to any other party in whole or in part in any form or manner without the prior express written consent of MKE and MKE and its Representatives accepts no liability whatsoever for the actions of third parties in this respect.
This report is not directed to or intended for distribution to or use by any person or entity who is a citizen or resident of or located in any locality, state, country or other jurisdiction where such distribution, publication, availability or use would be contrary to law or regulation. This report is for distribution only under such circumstances as may be permitted by applicable law. The securities described herein may not be eligible for sale in all jurisdictions or to certain categories of investors. Without prejudice to the foregoing, the reader is to note that additional disclaimers, warnings or qualifications may apply based on geographical location of the person or entity receiving this report.
Malaysia Opinions or recommendations contained herein are in the form of technical ratings and fundamental ratings. Technical ratings may differ from fundamental ratings as technical valuations apply different methodologies and are purely based on price and volume-related information extracted from Bursa Malaysia Securities Berhad in the equity analysis.
Singapore This report has been produced as of the date hereof and the information herein may be subject to change. Maybank Kim Eng Research Pte. Ltd. (“Maybank KERPL”) in Singapore has no obligation to update such information for any recipient. For distribution in Singapore, recipients of this report are to contact Maybank KERPL in Singapore in respect of any matters arising from, or in connection with, this report. If the recipient of this report is not an accredited investor, expert investor or institutional investor (as defined under Section 4A of the Singapore Securities and Futures Act), Maybank KERPL shall be legally liable for the contents of this report, with such liability being limited to the extent (if any) as permitted by law.
Thailand Except as specifically permitted, no part of this presentation may be reproduced or distributed in any manner without the prior written permission of Maybank Kim Eng Securities (Thailand) Public Company Limited. Maybank Kim Eng Securities (Thailand) Public Company Limited (“MBKET”) accepts no liability whatsoever for the actions of third parties in this respect.
Due to different characteristics, objectives and strategies of institutional and retail investors, the research products of MBKET Institutional and Retail Research departments may differ in either recommendation or target price, or both. MBKET reserves the rights to disseminate MBKET Retail Research reports to institutional investors who have requested to receive it. If you are an authorised recipient, you hereby tacitly acknowledge that the research reports from MBKET Retail Research are first produced in Thai and there is a time lag in the release of the translated English version.
The disclosure of the survey result of the Thai Institute of Directors Association (“IOD”) regarding corporate governance is made pursuant to the policy of the Office of the Securities and Exchange Commission. The survey of the IOD is based on the information of a company listed on the Stock Exchange of Thailand and the market for Alternative Investment disclosed to the public and able to be accessed by a general public investor. The result, therefore, is from the perspective of a third party. It is not an evaluation of operation and is not based on inside information. The survey result is as of the date appearing in the Corporate Governance Report of Thai Listed Companies. As a result, the survey may be changed after that date. MBKET does not confirm nor certify the accuracy of such survey result.
The disclosure of the Anti-Corruption Progress Indicators of a listed company on the Stock Exchange of Thailand, which is assessed by Thaipat Institute, is made in order to comply with the policy and sustainable development plan for the listed companies of the Office of the Securities and Exchange Commission. Tha ipat Institute made this assessment based on the information received from the listed company, as stipulated in the form for the assessment of Anti-corruption which refers to the Annual Registration Statement (Form 56-1), Annual Report (Form 56-2), or other relevant documents or reports of such listed company. The assessment result is therefore made from the perspective of Thaipat Institute that is a third party. It is not an assessment of operation and is not based on any inside information. Since this assessment is only the assessment result as of the date appearing in the assessment result, it may be changed after that date or when there is any change to the relevant information. Nevertheless, MBKET does not confirm, verify, or certify the accuracy and completeness of the assessment result.
US This third-party research report is distributed in the United States (“US”) to Major US Institutional Investors (as defined in Rule 15a-6 under the Securities Exchange Act of 1934, as amended) only by Maybank Kim Eng Securities USA Inc (“Maybank KESUSA”), a broker-dealer registered in the US (registered under Section 15 of the Securities Exchange Act of 1934, as amended). All responsibility for the distribution of this report by Maybank KESUSA in the US shall be borne by Maybank KESUSA. This report is not directed at you if MKE is prohibited or restricted by any legislation or regulation in any jurisdiction from making it available to you. You should satisfy yourself before reading it that Maybank KESUSA is permitted to provide research material concerning investments to you under relevant legislation and regulations. All U.S. persons receiving and/or accessing this report and wishing to effect transactions in any security mentioned within must do so with: Maybank Kim Eng Securities USA Inc. 400 Park Avenue, 11th Floor, New York, New York 10022, 1-(212) 688-8886 and not with, the issuer of this report.
June 22, 2021 10
Genting Bhd
Disclosure of Interest
Malaysia: MKE and its Representatives may from time to time have positions or be materially interested in the securities referred to he rein and may further act as market maker or may have assumed an underwriting commitment or deal with such securities and may also perform or seek to perform investment banking services, advisory and other services for or relating to those companies. Singapore: As of 22 June 2021, Maybank KERPL and the covering analyst do not have any interest in any companies recommended in this research repor t. Thailand: MBKET may have a business relationship with or may possibly be an issuer of derivative warrants on the securities /companies mentioned in the research report. Therefore, Investors should exercise their own judgment before making any investment decisions. MBKET, its associates, directors, connected parties and/or employees may from time to time have interests and/or underwriting commitments in the securities mentioned in this report. Hong Kong: As of 22 June 2021, KESHK and the authoring analyst do not have any interest in any companies recommended in this research report. India: As of 22 June 2021, and at the end of the month immediately preceding the date of publication of the research report, KESI, authoring analyst or their associate / relative does not hold any financial interest or any actual or beneficial ownership in any shares or having any conflict of interest in the subject companies except as otherwise disclosed in the research report.
In the past twelve months KESI and authoring analyst or their associate did not receive any compensation or other benefits fr om the subject companies or third party in connection with the research report on any account what so ever except as otherwise disclosed in the research report.
MKE may have, within the last three years, served as manager or co-manager of a public offering of securities for, or currently may make a primary market in issues of, any or all of the entities mentioned in this report or may be providing, or have provided within the previous 12 months, significant advice or investment services in relation to the investment concerned or a related investment and may receive compensation for the services provided from the companies covered in this report.
OTHERS
Analyst Certification of Independence
The views expressed in this research report accurately reflect the analyst’s personal views about any and all of the subject securities or issuers; and no part of the research analyst’s compensation was, is or will be, directly or indirectly, related to the specific recommendations or views expressed in the report.
Reminder
Structured securities are complex instruments, typically involve a high degree of risk and are intended for sale only to sophisticated investors who are capable of understanding and assuming the risks involved. The market value of any structured security may be affected by changes in economic, financial and political factors (including, but not limited to, spot and forward interest and exchange rates), time to maturity, market conditions and volatility and the credit quality of any issuer or reference issuer. Any investor interested in purchasing a structured product should conduct its own analysis of the product and consult with its own professional advisers as to the risks involved in making such a purchase.
No part of this material may be copied, photocopied or duplicated in any form by any means or redistributed without the prior consent of MKE.
UK This document is being distributed by Maybank Kim Eng Securities (London) Ltd (“Maybank KESL”) which is authorized and regulated, by the Financial Conduct Authority and is for Informational Purposes only. This document is not intended for distribution to anyone defined as a Retail Client under the Financial Services and Markets Act 2000 within the UK. Any inclusion of a third party link is for the recipients convenience only, and that the firm does not take any responsibility for its comments or accuracy, and that access to such links is at the individuals own risk. Nothing in this report should be considered as constituting legal, accounting or tax advice, and that f or accurate guidance recipients should consult with their own independent tax advisers.
DISCLOSURES Legal Entities Disclosures Malaysia: This report is issued and distributed in Malaysia by Maybank Investment Bank Berhad (15938- H) which is a Participating Organization of Bursa Malaysia Berhad and a holder of Capital Markets and Services License issued by the Securities Commission in Malaysia. Singapore: This report is distributed in Singapore by Maybank KERPL (Co. Reg No 198700034E) which is regulated by the Monetary Authority of Singapore. Indonesia: PT Maybank Kim Eng Securities (“PTMKES”) (Reg. No. KEP-251/PM/1992) is a member of the Indonesia Stock Exchange and is regulated by the Financial Services Authority (Indonesia). Thailand: MBKET (Reg. No.0107545000314) is a member of the Stock Exchange of Thailand and is regulated by the Ministry of Finance and the Securities and Exchange Commission. Philippines: Maybank ATRKES (Reg. No.01-2004-00019) is a member of the Philippines Stock Exchange and is regulated by the Securities and Exchange Commission. Vietnam: Maybank Kim Eng Securities Limited (License Number: 117/GP-UBCK) is licensed under the State Securities Commission of Vietnam. Hong Kong: KESHK (Central Entity No AAD284) is regulated by the Securities and Futures Commission. India: Kim Eng Securities India Private Limited (“KESI”) is a participant of the National Stock Exchange of India Limited and the Bombay Stock Exchange and is regulated by Securities and Exchange Board of India (“SEBI”) (Reg. No. INZ000010538). KESI is also registered with SEBI as Category 1 Merchant Banker (Reg. No. INM 000011708) and as Research Analyst (Reg No: INH000000057) US: Maybank KESUSA is a member of/ and is authorized and regulated by the FINRA – Broker ID 27861. UK: Maybank KESL (Reg No 2377538) is authorized and regulated by the Financial Conduct Authority.
June 22, 2021 11
Genting Bhd
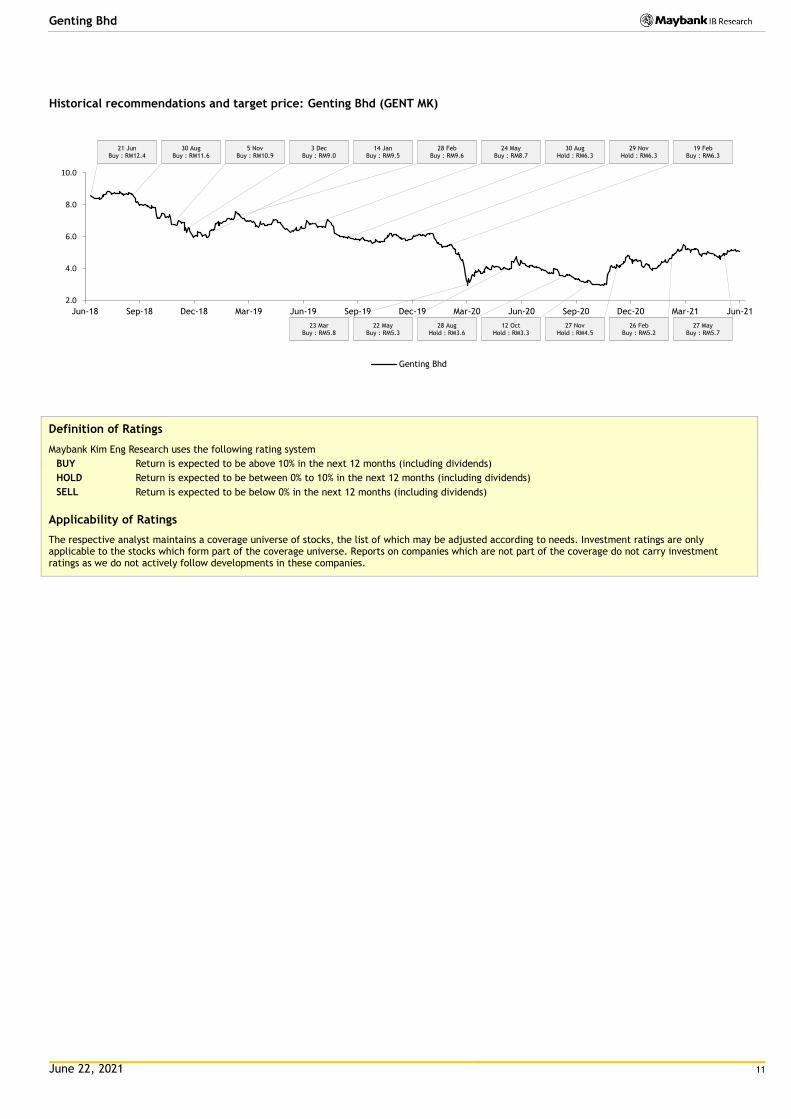
Historical recommendations and target price: Genting Bhd (GENT MK)
Definition of Ratings
Maybank Kim Eng Research uses the following rating system
BUY Return is expected to be above 10% in the next 12 months (including dividends)
HOLD Return is expected to be between 0% to 10% in the next 12 months (including dividends)
SELL Return is expected to be below 0% in the next 12 months (including dividends)
Applicability of Ratings
The respective analyst maintains a coverage universe of stocks, the list of which may be adjusted according to needs. Investment ratings are only applicable to the stocks which form part of the coverage universe. Reports on companies which are not part of the coverage do not carry investment ratings as we do not actively follow developments in these companies.
2.0
4.0
6.0
8.0
10.0
Jun-18 Sep-18 Dec-18 Mar-19 Jun-19 Sep-19 Dec-19 Mar-20 Jun-20 Sep-20 Dec-20 Mar-21 Jun-21
Genting Bhd
21 Jun Buy : RM12.4
30 Aug Buy : RM11.6
5 Nov Buy : RM10.9
3 Dec Buy : RM9.0
14 Jan Buy : RM9.5
28 Feb Buy : RM9.6
24 May Buy : RM8.7
30 Aug Hold : RM6.3
29 Nov Hold : RM6.3
19 Feb Buy : RM6.3
23 Mar Buy : RM5.8
22 May Buy : RM5.3
28 Aug Hold : RM3.6
12 Oct Hold : RM3.3
27 Nov Hold : RM4.5
26 Feb Buy : RM5.2
27 May Buy : RM5.7

June 22, 2021 12
Genting Bhd
Malaysia Maybank Investment Bank Berhad
(A Participating Organisation of
Bursa Malaysia Securities Berhad)
33rd Floor, Menara Maybank,
100 Jalan Tun Perak,
50050 Kuala Lumpur
Tel: (603) 2059 1888;
Fax: (603) 2078 4194
Singapore Maybank Kim Eng Securities Pte Ltd
Maybank Kim Eng Research Pte Ltd
50 North Canal Road
Singapore 059304
Tel: (65) 6336 9090
London Maybank Kim Eng Securities
(London) Ltd
PNB House
77 Queen Victoria Street
London EC4V 4AY, UK
Tel: (44) 20 7332 0221
Fax: (44) 20 7332 0302
New York Maybank Kim Eng Securities USA
Inc
400 Park Avenue, 11th Floor
New York, New York 10022,
U.S.A.
Tel: (212) 688 8886
Fax: (212) 688 3500
Stockbroking Business:
Level 8, Tower C, Dataran Maybank,
No.1, Jalan Maarof
59000 Kuala Lumpur
Tel: (603) 2297 8888
Fax: (603) 2282 5136
Hong Kong Kim Eng Securities (HK) Ltd
28/F, Lee Garden Three,
1 Sunning Road, Causeway Bay,
Hong Kong
Tel: (852) 2268 0800
Fax: (852) 2877 0104
Indonesia PT Maybank Kim Eng Securities
Sentral Senayan III, 22nd Floor
Jl. Asia Afrika No. 8
Gelora Bung Karno, Senayan
Jakarta 10270, Indonesia
Tel: (62) 21 2557 1188
Fax: (62) 21 2557 1189
India Kim Eng Securities India Pvt Ltd
1101, 11th floor, A Wing, Kanakia
Wall Street, Chakala, Andheri -
Kurla Road, Andheri East,
Mumbai City - 400 093, India
Tel: (91) 22 6623 2600
Fax: (91) 22 6623 2604
Philippines Maybank ATR Kim Eng Securities Inc.
17/F, Tower One & Exchange Plaza
Ayala Triangle, Ayala Avenue
Makati City, Philippines 1200
Tel: (63) 2 8849 8888
Fax: (63) 2 8848 5738
Thailand Maybank Kim Eng Securities
(Thailand) Public Company Limited
999/9 The Offices at Central World,
20th - 21st Floor,
Rama 1 Road Pathumwan,
Bangkok 10330, Thailand
Tel: (66) 2 658 6817 (sales)
Tel: (66) 2 658 6801 (research)
Vietnam Maybank Kim Eng Securities Limited
4A-15+16 Floor Vincom Center Dong
Khoi, 72 Le Thanh Ton St. District 1
Ho Chi Minh City, Vietnam
Tel : (84) 844 555 888
Fax : (84) 8 38 271 030
Saudi Arabia In association with
Anfaal Capital
Ground Floor, KANOO Building
No.1 - Al-Faisaliyah,Madina Road,
P.O.Box 126575 Jeddah 21352
Kingdom of Saudi Arabia
Tel: (966) 920023423
South Asia Sales Trading Kevin Foy
Regional Head Sales Trading
Tel: (65) 6636-3620
US Toll Free: 1-866-406-7447
North Asia Sales Trading Andrew Lee
Tel: (852) 2268 0283
US Toll Free: 1 877 837 7635
Indonesia Iwan Atmadjaja [email protected] (62) 21 8066 8555
London Greg Smith [email protected] Tel: (44) 207-332-0221
New York James Lynch [email protected] Tel: (212) 688 8886
India Sanjay Makhija [email protected] Tel: (91)-22-6623-2629
Philippines Keith Roy [email protected] Tel: (63) 2 848-5288
www.maybank-ke.com | www.maybank-keresearch.com