Embed Size (px)
Citation preview

EyeforTravel Half-Year Round-Up and Forecast: 2015 January – July Edition
Market-by-market analysisUnderstand the outlook for travel with analysis of the world’s major economies and their tourism markets
Industry and company outlooksConcise round-ups of all the major verticals, as well as overviews of the established players and the companies disrupting the travel industry
Technology trends The most important facts and figures covering the rapidly changing face of distribution and ecommerce

ind
ustr
y o
ver
view
Industry Overview
Travel looks set for a strong year all-round, as most of the major economies continue to post solid results. Consumers in major developed economies are finally seeing increases to their wage packets after several lean years and intra-Asian travel continues to increase exponentially. However, travel executives can’t afford to sit back and enjoy this relatively healthy short-term outlook. The travel market remains a volatile one, as travel flows can rapidly change, such as in Greece and South Korea thus far this year, and the penetration of the online market creates cut-throat competition. This latter factor is squeezing margins across the board, even for the largest OTAs, and means that almost every company looking for market share must be both global and local at the same time. Even the poster-boys for change, Uber and Airbnb, are not free from troubles despite their meteoric growth patterns. Questions are being raised about their business models and a profusion of lawsuits have been raised by individuals and public bodies across many of their key markets. Therefore, business leaders need to get the bigger picture and this report aims to be a one-stop shop that looks across sectors and continents for the key data that shows how our industry is being transformed.
Alex Hadwick, EyeforTravel Head of Research
Leading Research from EyeforTravel
■ Market-by-market analysis of the world’s major economies, covering:
■ The overall economic outlook
■ Headline risks
■ Forecasts and key trends
■ Inbound and outbound travel numbers
■ Industry outlooks and investment round-ups
■ The growth and changing faces of ecommerce and mobile
■ Overviews of the most important and disruptive companies that are changing and controlling the travel industry
For more information visit www.eyefortravel.com/reports Half-year round-up and forecast: 2015 | 2

key
qu
estion
s ad
dr
essed
Key Questions Addressed
■ How are the major world economies performing?
■ How will this affect domestic, inbound and outbound travel markets?
■ How have airline, hotel and online travel sectors fared and what is their outlook?
■ How is mobile usage changing globally and in various countries?
■ What are the major trends in e- and mcommerce?
■ How are the most disruptive companies to the travel industry expanding?
■ What have been the biggest mergers and acquisitions this year and what can be expected in the near-future?
■ What are investors looking at in travel and where is the money going?
■ How have some of the biggest players in travel performed over 2015 and what is their outlook?
Who Needs to Buy This Report?
This report is perfect for investors, executives, managers, analysts and researchers working in and around travel. It is a concise guide to the factors currently affecting the travel industry and forecasts for how it will develop in the medium-term. It is therefore ideal for any time-pressed executive who needs market- and sector-specific data to guide their business decisions.
For more information visit www.eyefortravel.com/reports Half-year round-up and forecast: 2015 | 3

aB
ou
t tHe a
utH
or
About the Author
Sally White is a journalist, investor and consultant has been writing about economics and business for more than 40 years. Previously she has contributed to The Times, the Independ-ent, the BBC, the Telegraph, the Evening Standard and Daily Mail, amongst numerous others, both as a freelancer, writer and editor. She currently writes on a variety of topics including mining, energy, finance, investment and, of course, travel.
As well as her work as a writer Sally has also worked for numerous leading financial and investment institutions both directly and as an advisor or consultant. These have included major international banks, brokerages, forecasting companies, stock exchanges and hedge and investment funds.
For more information visit www.eyefortravel.com/reports Half-year round-up and forecast: 2015 | 4

REP
OR
T EXTR
AC
Tc
on
tents
For more information visit www.eyefortravel.com/reports Half-year round-up and forecast: 2015 | 5
co
nten
ts
Contents
Welcome . . . . . . . . . . . . . . . . . . . . . . . . . . . . . . . . . . . . . . 3
About EyeforTravel . . . . . . . . . . . . . . . . . . . . . . . . . . . . . . . . . . . . 4
List of Figures . . . . . . . . . . . . . . . . . . . . . . . . . . . . . . . . . . . . . . 8
List of Tables . . . . . . . . . . . . . . . . . . . . . . . . . . . . . . . . . . . . . . 10
1 The Numbers You Need to Know . . . . . . . . . . . . . . . . . . . . . . . . . . . . 12
2 Market Trends . . . . . . . . . . . . . . . . . . . . . . . . . . . . . . . . . . . 14
3 Key Major Economies. . . . . . . . . . . . . . . . . . . . . . . . . . . . . . . . . 15
3.1 Americas . . . . . . . . . . . . . . . . . . . . . . . . . . . . . . . . . . . . 15
3.1.1 US . . . . . . . . . . . . . . . . . . . . . . . . . . . . . . . . . . . 15
3.1.2 Brazil . . . . . . . . . . . . . . . . . . . . . . . . . . . . . . . . . . 17
3.1.3 Mexico . . . . . . . . . . . . . . . . . . . . . . . . . . . . . . . . . . 19
3.2 Europe . . . . . . . . . . . . . . . . . . . . . . . . . . . . . . . . . . . . . 21
3.2.1France . . . . . . . . . . . . . . . . . . . . . . . . . . . . . . . . . . 21
3.2.2 Germany . . . . . . . . . . . . . . . . . . . . . . . . . . . . . . . . . 23
3.2.3 Russia . . . . . . . . . . . . . . . . . . . . . . . . . . . . . . . . . . 25
3.2.4 UK . . . . . . . . . . . . . . . . . . . . . . . . . . . . . . . . . . . 27
3.3 Asia . . . . . . . . . . . . . . . . . . . . . . . . . . . . . . . . . . . . . . 29
3.3.1 China . . . . . . . . . . . . . . . . . . . . . . . . . . . . . . . . . . 29
3.3.2 Australia . . . . . . . . . . . . . . . . . . . . . . . . . . . . . . . . . 31
3.3.3 India. . . . . . . . . . . . . . . . . . . . . . . . . . . . . . . . . . . 33
3.3.4 Japan . . . . . . . . . . . . . . . . . . . . . . . . . . . . . . . . . . 35
3.3.5 South Korea . . . . . . . . . . . . . . . . . . . . . . . . . . . . . . . . 39
4 Industry trends . . . . . . . . . . . . . . . . . . . . . . . . . . . . . . . . . . . 41
4.1 Airlines. . . . . . . . . . . . . . . . . . . . . . . . . . . . . . . . . . . . . 41
4.2 Hotels . . . . . . . . . . . . . . . . . . . . . . . . . . . . . . . . . . . . . 43
4.2.1 Outlook . . . . . . . . . . . . . . . . . . . . . . . . . . . . . . . . . 43
4.2.2 Europe . . . . . . . . . . . . . . . . . . . . . . . . . . . . . . . . . . 44
4.2.3 Americas . . . . . . . . . . . . . . . . . . . . . . . . . . . . . . . . . 44
4.2.4 Asia-Pacifi c . . . . . . . . . . . . . . . . . . . . . . . . . . . . . . . . 45
4.2.5 Middle East and Africa . . . . . . . . . . . . . . . . . . . . . . . . . . . . 45
4.2.6 Hotel Investment . . . . . . . . . . . . . . . . . . . . . . . . . . . . . . 45
4.3 Online Travel . . . . . . . . . . . . . . . . . . . . . . . . . . . . . . . . . . 46
4.4 Business travel . . . . . . . . . . . . . . . . . . . . . . . . . . . . . . . . . . 47
5 Technology and distribution . . . . . . . . . . . . . . . . . . . . . . . . . . . . . . 48
www.eyefortravel.com Half-year round-up and forecast: 2015 | 5

REP
OR
T EXTR
AC
Tc
on
tents
For more information visit www.eyefortravel.com/reports Half-year round-up and forecast: 2015 | 6
co
nten
ts
www.eyefortravel.com Half-year round-up and forecast: 2015 | 6
5.1 Mobile Milestones . . . . . . . . . . . . . . . . . . . . . . . . . . . . . . . . 48
5.2 Mobile Ownership – the Global Picture . . . . . . . . . . . . . . . . . . . . . . . . . 49
5.3 Explosive Growth in Smartphone Usage and Data . . . . . . . . . . . . . . . . . . . . . 49
5.4 Video Will Drive Data Growth . . . . . . . . . . . . . . . . . . . . . . . . . . . . 50
5.5 The Age of the App . . . . . . . . . . . . . . . . . . . . . . . . . . . . . . . . 50
5.6 E-commerce in Asia-Pacifi c and the West . . . . . . . . . . . . . . . . . . . . . . . . 52
5.7 Spending by Device in the US . . . . . . . . . . . . . . . . . . . . . . . . . . . . 54
5.8 The Mobile Economy in 2020 – Getting Paid . . . . . . . . . . . . . . . . . . . . . . . 56
6 Ones to Watch . . . . . . . . . . . . . . . . . . . . . . . . . . . . . . . . . . . 58
6.1 “Disruptors” Are Bringing Revolution to the Travel Industry . . . . . . . . . . . . . . . . . . 58
6.2 Transportation Apps . . . . . . . . . . . . . . . . . . . . . . . . . . . . . . . . 58
6.2.1 Uber. . . . . . . . . . . . . . . . . . . . . . . . . . . . . . . . . . . 58
6.2.2 Lyft . . . . . . . . . . . . . . . . . . . . . . . . . . . . . . . . . . . 59
6.2.3 Didi Kuaidi . . . . . . . . . . . . . . . . . . . . . . . . . . . . . . . . 59
6.3 Accommodation . . . . . . . . . . . . . . . . . . . . . . . . . . . . . . . . . 60
6.3.1 Airbnb . . . . . . . . . . . . . . . . . . . . . . . . . . . . . . . . . . 60
6.3.2 HomeAway . . . . . . . . . . . . . . . . . . . . . . . . . . . . . . . . 60
7 Mergers, Acquisitions and Investments . . . . . . . . . . . . . . . . . . . . . . . . . . 61
7.1 M&A. . . . . . . . . . . . . . . . . . . . . . . . . . . . . . . . . . . . . . 61
7.1.1 Airlines . . . . . . . . . . . . . . . . . . . . . . . . . . . . . . . . . . 61
7.1.2 OTAs. . . . . . . . . . . . . . . . . . . . . . . . . . . . . . . . . . . 61
7.1.3 Cruise . . . . . . . . . . . . . . . . . . . . . . . . . . . . . . . . . . 61
7.1.4 Road Transport . . . . . . . . . . . . . . . . . . . . . . . . . . . . . . . 61
7.1.5 Accommodation . . . . . . . . . . . . . . . . . . . . . . . . . . . . . . 61
7.2 Investment Climate . . . . . . . . . . . . . . . . . . . . . . . . . . . . . . . . 62
7.2.1 UK . . . . . . . . . . . . . . . . . . . . . . . . . . . . . . . . . . . 63
7.2.2 China . . . . . . . . . . . . . . . . . . . . . . . . . . . . . . . . . . 63
7.2.3 Africa . . . . . . . . . . . . . . . . . . . . . . . . . . . . . . . . . . 63
7.2.4 Russia . . . . . . . . . . . . . . . . . . . . . . . . . . . . . . . . . . 63
7.2.5 India. . . . . . . . . . . . . . . . . . . . . . . . . . . . . . . . . . . 63
8 Company Profi les . . . . . . . . . . . . . . . . . . . . . . . . . . . . . . . . . . 64
8.1 Hospitality . . . . . . . . . . . . . . . . . . . . . . . . . . . . . . . . . . . 64
8.1.1 Hilton Worldwide . . . . . . . . . . . . . . . . . . . . . . . . . . . . . . 64
8.1.2 International Hotels Group . . . . . . . . . . . . . . . . . . . . . . . . . . 66
8.2 Airlines and Aerospace . . . . . . . . . . . . . . . . . . . . . . . . . . . . . . . 68
8.2.1 Boeing . . . . . . . . . . . . . . . . . . . . . . . . . . . . . . . . . . 68
8.2.2 Emirates . . . . . . . . . . . . . . . . . . . . . . . . . . . . . . . . . 70
8.2.3 Ryanair . . . . . . . . . . . . . . . . . . . . . . . . . . . . . . . . . . 72
REP
OR
T EXTR
AC
Tc
on
tents
For more information visit www.eyefortravel.com/reports Half-year round-up and forecast: 2015 | 7
co
nten
ts
www.eyefortravel.com Half-year round-up and forecast: 2015 | 7
8.3 Online Travel Agencies . . . . . . . . . . . . . . . . . . . . . . . . . . . . . . . 73
8.3.1 Ctrip . . . . . . . . . . . . . . . . . . . . . . . . . . . . . . . . . . . 73
8.3.2 Expedia . . . . . . . . . . . . . . . . . . . . . . . . . . . . . . . . . 74
8.3.3 HomeAway . . . . . . . . . . . . . . . . . . . . . . . . . . . . . . . . 75
8.3.4 Priceline . . . . . . . . . . . . . . . . . . . . . . . . . . . . . . . . . 77
8.4 Travel Groups . . . . . . . . . . . . . . . . . . . . . . . . . . . . . . . . . . 78
8.4.1 Thomas Cook . . . . . . . . . . . . . . . . . . . . . . . . . . . . . . . 78
8.4.2 TUI Group . . . . . . . . . . . . . . . . . . . . . . . . . . . . . . . . . 79
9 Bibliography . . . . . . . . . . . . . . . . . . . . . . . . . . . . . . . . . . . . 80

REP
OR
T EXTR
AC
Tlist o
f fiGu
res
For more information visit www.eyefortravel.com/reports Half-year round-up and forecast: 2015 | 8
list of fiG
ur
es
www.eyefortravel.com Half-year round-up and forecast: 2015 | 8
List of Figures
Figure 1: US Real GDP Growth (May 2015) . . . . . . . . . . . . . . . . . . . . . . . . . . . 15
Figure 2: Brazil Real GDP Growth (May 2015) . . . . . . . . . . . . . . . . . . . . . . . . . . 17
Figure 3: Mexico Real GDP Growth (May 2015) . . . . . . . . . . . . . . . . . . . . . . . . . . 19
Figure 4: France Real GDP Growth (May 2015) . . . . . . . . . . . . . . . . . . . . . . . . . . 21
Figure 5: Germany Real GDP Growth (May 2015) . . . . . . . . . . . . . . . . . . . . . . . . . 23
Figure 6: Russia Real GDP Growth (May 2015) . . . . . . . . . . . . . . . . . . . . . . . . . . 25
Figure 7: UK Real GDP Growth (May 2015) . . . . . . . . . . . . . . . . . . . . . . . . . . . 27
Figure 8 : China Real GDP Growth (May 2015) . . . . . . . . . . . . . . . . . . . . . . . . . . 29
Figure 9: Australia Real GDP Growth (May 2015) . . . . . . . . . . . . . . . . . . . . . . . . . 31
Figure 10: India Real GDP Growth (May 2015) . . . . . . . . . . . . . . . . . . . . . . . . . . 33
Figure 11: Japan Real GDP Growth (May 2015) . . . . . . . . . . . . . . . . . . . . . . . . . . 35
Figure 12: Year-on-Year change in foreign visitors to Japan over fi rst fi ve months of 2015 . . . . . . . . . . 36
Figure 13: Percentage Change in Chinese Visitors to Japan – 2014 to 2015 . . . . . . . . . . . . . . . 37
Figure 14: South Korea Real GDP Growth (May 2015) . . . . . . . . . . . . . . . . . . . . . . . 39
Figure 15: IATA 2015 Regional Profi tability Forecasts . . . . . . . . . . . . . . . . . . . . . . . . 41
Figure 16: GBTA BTI™ Business Travel Forecast . . . . . . . . . . . . . . . . . . . . . . . . . . 47
Figure 17: US Platform Usage by Demographic Group . . . . . . . . . . . . . . . . . . . . . . . 50
Figure 18: Average Number of Apps Used and Time Per Person, Per Month (US) . . . . . . . . . . . . . 51
Figure 19: Country Comparison of Mobile’s Share of Ecommerce Transactions . . . . . . . . . . . . . . 52
Figure 20: Growth in Chinese M-Commerce. . . . . . . . . . . . . . . . . . . . . . . . . . . 53
Figure 21: Average US Order Value for Year Ending Q1 2015 by Device . . . . . . . . . . . . . . . . . 54
Figure 22: Average US Order Value for Year Ending Q1 2015 by Operating System. . . . . . . . . . . . . 55
Figure 23: Total Global Financial Capital Growth – 1990 to 2020 . . . . . . . . . . . . . . . . . . . 62
Figure 24: Hilton’s Financial Performance (USD millions) . . . . . . . . . . . . . . . . . . . . . . 64
Figure 25: IHG Financial Performance (USD millions). . . . . . . . . . . . . . . . . . . . . . . . 66
Figure 26: Boeing Financial Performance (USD millions) . . . . . . . . . . . . . . . . . . . . . . 68
Figure 27: Emirates Financial Performance (AED billions) . . . . . . . . . . . . . . . . . . . . . . 70
Figure 28: Emirates Passenger Number Growth . . . . . . . . . . . . . . . . . . . . . . . . . 70
Figure 29: Emirates Revenue 2014-15 by Region . . . . . . . . . . . . . . . . . . . . . . . . . 71
Figure 30: Ryanair Financial Performance (EUR millions) . . . . . . . . . . . . . . . . . . . . . . 72
Figure 31: Ctrip Financial Performance (CNY millions) . . . . . . . . . . . . . . . . . . . . . . . 73
Figure 32: Expedia Financial Performance (USD millions) . . . . . . . . . . . . . . . . . . . . . . 74

REP
OR
T EXTR
AC
Tlist o
f fiGu
res
For more information visit www.eyefortravel.com/reports Half-year round-up and forecast: 2015 | 9
list of fiG
ur
es
www.eyefortravel.com Half-year round-up and forecast: 2015 | 9
Figure 33: HomeAway Financial Performance (USD millions) . . . . . . . . . . . . . . . . . . . . 75
Figure 34: Priceline Financial Performance (USD millions) . . . . . . . . . . . . . . . . . . . . . . 77
Figure 35: Thomas Cook Financial Performance (USD millions) . . . . . . . . . . . . . . . . . . . . 78
Figure 36: TUI Financial Performance (USD millions) . . . . . . . . . . . . . . . . . . . . . . . . 79

REP
OR
T EXTR
AC
Tlist o
f taB
les
For more information visit www.eyefortravel.com/reports Half-year round-up and forecast: 2015 | 10
List of Tables
Table 1: US Real GDP Growth (May 2015) . . . . . . . . . . . . . . . . . . . . . . . . . . . . 15
Table 2: US International Tourism – Arrivals and Receipts . . . . . . . . . . . . . . . . . . . . . . 16
Table 3: Brazil Real GDP Growth (May 2015) . . . . . . . . . . . . . . . . . . . . . . . . . . . 17
Table 4: Brazil International Tourism – Arrivals and Receipts . . . . . . . . . . . . . . . . . . . . . 18
Table 5: Mexico Real GDP Growth (May 2015) . . . . . . . . . . . . . . . . . . . . . . . . . . 19
Table 6: Mexico International Tourism – Arrivals and Receipts . . . . . . . . . . . . . . . . . . . . 20
Table 7: France Real GDP Growth (May 2015) . . . . . . . . . . . . . . . . . . . . . . . . . . 21
Table 8: France International Tourism – Arrivals and Receipts . . . . . . . . . . . . . . . . . . . . 22
Table 9: Germany Real GDP Growth (May 2015) . . . . . . . . . . . . . . . . . . . . . . . . . 23
Table 10: Germany International Tourism – Arrivals and Receipts . . . . . . . . . . . . . . . . . . . 24
Table 11: Russia Real GDP Growth (May 2015) . . . . . . . . . . . . . . . . . . . . . . . . . . 25
Table 12: Russia International tourism – Arrivals and Receipts . . . . . . . . . . . . . . . . . . . . 26
Table 13: UK Real GDP Growth (May 2015) . . . . . . . . . . . . . . . . . . . . . . . . . . . 27
Table 14: UK International Tourism – Arrivals and Receipts . . . . . . . . . . . . . . . . . . . . . 28
Table 15: China Real GDP Growth (May 2015) . . . . . . . . . . . . . . . . . . . . . . . . . . 29
Table 16: China International Tourism – Arrivals and Receipts . . . . . . . . . . . . . . . . . . . . .30
Table 17: Australia Real GDP Growth (May 2015) . . . . . . . . . . . . . . . . . . . . . . . . . 31
Table 18: Australia International Tourism – Arrivals and Receipts . . . . . . . . . . . . . . . . . . . 32
Table 19: India Real GDP Growth (May 2015) . . . . . . . . . . . . . . . . . . . . . . . . . . 33
Table 20: India International Tourism – Arrivals and Receipts. . . . . . . . . . . . . . . . . . . . . 34
Table 21: Japan Real GDP Growth (May 2015) . . . . . . . . . . . . . . . . . . . . . . . . . . 35
Table 22: Year-on-Year Change in Foreign Visitors to Japan Over First Five Months of 2015. . . . . . . . . . 37
Table 23: Percentage Change in Chinese Visitors to Japan – 2014 to 2015 . . . . . . . . . . . . . . . . 38
Table 24: South Korea Real GDP Growth (May 2015) . . . . . . . . . . . . . . . . . . . . . . . . 39
Table 25: Korea International Tourism – Arrivals and Receipts . . . . . . . . . . . . . . . . . . . . 40
Table 26: IATA Forecast for Airline Profi tability in 2015 and the Latest Traffi c Reports . . . . . . . . . . . . 42
Table 27: European Key Economies – Hotel Performance Year-on-Year to May 2015 . . . . . . . . . . . . 44
Table 28: Americas Key Economies – Hotel Performance Year-on-Year to May 2015 . . . . . . . . . . . . 44
Table 29: Asia-Pacifi c Key Economies – Hotel Performance Year-on-Year to May 2015 . . . . . . . . . . . 45
Table 30: MEA Key Economies – Hotel Performance Year-on-Year to May 2015 . . . . . . . . . . . . . . 45
list of ta
Bles
www.eyefortravel.com Half-year round-up and forecast: 2015 | 10

REP
OR
T EXTR
AC
Tlist o
f taB
les
For more information visit www.eyefortravel.com/reports Half-year round-up and forecast: 2015 | 11
Table 31: OTA Sales Growth 2015-16 . . . . . . . . . . . . . . . . . . . . . . . . . . . . . 46
Table 32: Top Apps by Time Spent Per Active User . . . . . . . . . . . . . . . . . . . . . . . . 51
Table 33: Year-on-Year Growth in Mobile Shopping Value . . . . . . . . . . . . . . . . . . . . . . 54
Table 34: Average US Order Value for Year Ending Q1 2015 . . . . . . . . . . . . . . . . . . . . . 55
Table 35: Average US Order Value for Year Ending Q1 2015 by Operating System . . . . . . . . . . . . . 56
Table 36: Hilton’s Financial Performance (USD millions). . . . . . . . . . . . . . . . . . . . . . . 64
Table 37: IHG Financial Performance (USD millions) . . . . . . . . . . . . . . . . . . . . . . . . 66
Table 38: IHG Q1 2015 Percentage Changes to RevPAR and Occupancy . . . . . . . . . . . . . . . . 66
Table 39: IHG Q1 2015 Number of Rooms and Construction Pipeline . . . . . . . . . . . . . . . . . 67
Table 40: Boeing Financial Performance (USD millions) . . . . . . . . . . . . . . . . . . . . . . . 68
Table 41: Q1 2015 Major Program Deliveries. . . . . . . . . . . . . . . . . . . . . . . . . . . 68
Table 42: Emirates Financial Performance (AED billions) . . . . . . . . . . . . . . . . . . . . . . 70
Table 43: Ryanair Financial Performance (EUR millions) . . . . . . . . . . . . . . . . . . . . . . . 72
Table 44: Ctrip Financial Performance (CNY millions) . . . . . . . . . . . . . . . . . . . . . . . 73
Table 45: Expedia Financial Performance (USD millions) . . . . . . . . . . . . . . . . . . . . . . 74
Table 46: HomeAway Financial Performance (USD millions) . . . . . . . . . . . . . . . . . . . . . 75
Table 47: HomeAway Key Business Metrics Q1 2015 . . . . . . . . . . . . . . . . . . . . . . . . 76
Table 48: Priceline Financial Performance (USD millions) . . . . . . . . . . . . . . . . . . . . . . 77
Table 49: Thomas Cook Financial Performance (USD millions) . . . . . . . . . . . . . . . . . . . . 78
Table 50: TUI Financial Performance (USD millions) . . . . . . . . . . . . . . . . . . . . . . . . 79
list of ta
Bles
www.eyefortravel.com Half-year round-up and forecast: 2015 | 11

REP
OR
T EXTR
AC
Tk
ey M
aJo
r ec
on
oM
ies
For more information visit www.eyefortravel.com/reports Half-year round-up and forecast: 2015 | 12www.eyefortravel.com Half-year round-up and forecast: 2015 | 35
3.3.4 Japan
Figure 11: Japan Real GDP Growth (May 2015)
Sources: IMF, 2015; World Bank, 2015
Table 21: Japan Real GDP Growth (May 2015)
2012 2013 2014 2015 2016 2017
IMF 1.8% 1.6% -0.1% 1.0% 1.2% 0.4%
World Bank 1.7% 1.6% 0% 1.1% 1.7% 1.2%
Sources: IMF, 2015; World Bank, 2015
2012
0.0%
-0.2%
0.2%
0.4%
0.6%
0.8%
1.0%
1.2%
1.4%
2013 2014F 2015F 2016F 2017F
IMF World Bank
1.6%
1.8%
2.0%
key
Ma
Jor
eco
no
Mies
Below is an excerpt of our country analysis, in this case Japan. In these, we breakdown what the prevailing economic conditions mean for the travel industry in the world’s most important markets.

REP
OR
T EXTR
AC
Tk
ey M
aJo
r ec
on
oM
ies
For more information visit www.eyefortravel.com/reports Half-year round-up and forecast: 2015 | 13www.eyefortravel.com Half-year round-up and forecast: 2015 | 36
assessment: Japan can expect a record-breaking 2015 from inbound travel, driven primarily by its Northeast Asian neighbors. Domestically, however, it will continue to post relatively sluggish growth and face a declining workforce, leading to a continuation in many Japanese favoring domestic holidays and the trend of steady or declining numbers in outbound travel.
economy: Activity in Japan started picking up in late 2014 and was robust in the fi rst quarter of 2015. Growth is predicted to average around 1% this year, before accel-erating slightly to 1.4% in 2016 (IMF, 2015; World Bank, 2015), supported by expansionary policies (see Figure 11). A shrinking working-age population and structural issues mean growth will remain unspectacular, however.
A disappointing economic performance in 2014 led to a general election in December 2014. The incumbent LDP party won and implemented a series of fi scal stimulus measures, and postponed a second sales tax increase originally scheduled for October 2015 to April 2017. This stimulus, combined with policy accommodation by the Bank of Japan, low energy prices, announced product and labor market reforms, and the prospect of higher earnings following spring wage negotiations, should boost activity and confi dence throughout 2015. Infl ation is likely to remain below the target 2% through 2017 (World Bank, 2015).
risks:
■ Japan’s population continues to fall rapidly hitting demand
■ Growing reliance on China
■ Foreign relations with China and South Korea can deteriorate rapidly
tourism trends
inbound: Figures reported by the Japan National Tourism Organization paint a rosy picture for the Japanese tourism industry. Building on an excellent year in 2014, where overall numbers increased by 29.4%, the growth in arrivals has accelerated over the previous year. In the fi rst fi ve months of the 2015, provisional numbers show that, compared with 2014, there were 44.9% more foreign arrivals (Japan National Tourism Organization, 2015).
This has been almost entirely driven by regional traffi c, or more specifi cally, Chinese tourists. As noted in EyeforTravel’s The Big Picture in Travel: Six Things to Look out for in 2015 Japan was likely to be one of the big winners over 2015 from the growth in Chinese outbound travel. This has exceeded expectations as Japan has benefi ted from the MERS crisis in South Korea and internal dynamics aff ecting China and its semi-autonomous regions. Increased restrictions on travel to Macau and Hong Kong, combined with the political tensions in the latter, have hit mainland tourist numbers.
Japan has also taken logical and well-implemented steps, including a new visa regime, increased airport capacity and strong marketing campaigns.
January
10%
0%
20%
30%
40%
50%
60%
70%
February March April May Total
Figure 12: Year-on-Year change in foreign visitors to Japan over fi rst fi ve months of 2015
key
Ma
Jor
eco
no
Mies
Below is an excerpt of our country analysis, in this case Japan. In these, we breakdown what the prevailing economic conditions mean for the travel industry in the world’s most important markets.

REP
OR
T EXTR
AC
Ttec
Hn
olo
Gy
an
d d
istriB
utio
n
For more information visit www.eyefortravel.com/reports Half-year round-up and forecast: 2015 | 14www.eyefortravel.com Half-year round-up and forecast: 2015 | 48
5.1 Mobile Milestones
5
Technology and distribution
tecH
no
loG
y a
nd
distr
iBu
tion
77%
26 million
from 2010 to 2014, the time spent on smartphones increased by 394% in the us
there was a 66.7% increase in the time spent on apps
from end-2012 to end-2014
Year-on-year growth was recorded in the number of app sessions In
Asia to April 2015 39.3% q1 2015 year-on-year growth in e-commerce in china, with 168.3% growth in m-commerce over the same period
In Q1 2015, Ericsson estimates that 26 million new mobile subscriptions
were added in India
in 2020, data consumption from smartphones will be 10 times the level of 2014
34% of e-commerce transactions, globally, are estimated to go through mobile
This is an excerpt from our chapter on the main technology trends that are changing the travel industry, in particular mobile.
REP
OR
T EXTR
AC
Ttec
Hn
olo
Gy
an
d d
istriB
utio
n
For more information visit www.eyefortravel.com/reports Half-year round-up and forecast: 2015 | 15www.eyefortravel.com Half-year round-up and forecast: 2015 | 49
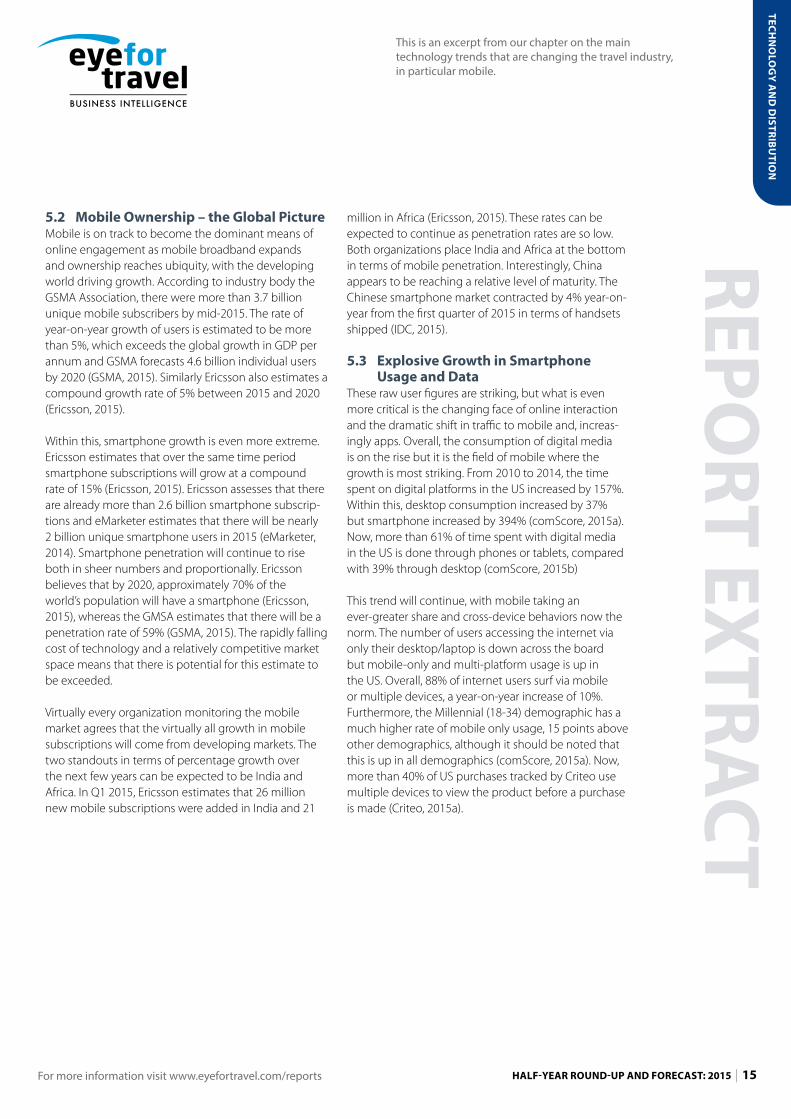
5.2 Mobile ownership – the Global pictureMobile is on track to become the dominant means of online engagement as mobile broadband expands and ownership reaches ubiquity, with the developing world driving growth. According to industry body the GSMA Association, there were more than 3.7 billion unique mobile subscribers by mid-2015. The rate of year-on-year growth of users is estimated to be more than 5%, which exceeds the global growth in GDP per annum and GSMA forecasts 4.6 billion individual users by 2020 (GSMA, 2015). Similarly Ericsson also estimates a compound growth rate of 5% between 2015 and 2020 (Ericsson, 2015).
Within this, smartphone growth is even more extreme. Ericsson estimates that over the same time period smartphone subscriptions will grow at a compound rate of 15% (Ericsson, 2015). Ericsson assesses that there are already more than 2.6 billion smartphone subscrip-tions and eMarketer estimates that there will be nearly 2 billion unique smartphone users in 2015 (eMarketer, 2014). Smartphone penetration will continue to rise both in sheer numbers and proportionally. Ericsson believes that by 2020, approximately 70% of the world’s population will have a smartphone (Ericsson, 2015), whereas the GMSA estimates that there will be a penetration rate of 59% (GSMA, 2015). The rapidly falling cost of technology and a relatively competitive market space means that there is potential for this estimate to be exceeded.
Virtually every organization monitoring the mobile market agrees that the virtually all growth in mobile subscriptions will come from developing markets. The two standouts in terms of percentage growth over the next few years can be expected to be India and Africa. In Q1 2015, Ericsson estimates that 26 million new mobile subscriptions were added in India and 21
million in Africa (Ericsson, 2015). These rates can be expected to continue as penetration rates are so low. Both organizations place India and Africa at the bottom in terms of mobile penetration. Interestingly, China appears to be reaching a relative level of maturity. The Chinese smartphone market contracted by 4% year-on-year from the fi rst quarter of 2015 in terms of handsets shipped (IDC, 2015).
5.3 explosive Growth in smartphone usage and data
These raw user fi gures are striking, but what is even more critical is the changing face of online interaction and the dramatic shift in traffi c to mobile and, increas-ingly apps. Overall, the consumption of digital media is on the rise but it is the fi eld of mobile where the growth is most striking. From 2010 to 2014, the time spent on digital platforms in the US increased by 157%. Within this, desktop consumption increased by 37% but smartphone increased by 394% (comScore, 2015a). Now, more than 61% of time spent with digital media in the US is done through phones or tablets, compared with 39% through desktop (comScore, 2015b)
This trend will continue, with mobile taking an ever-greater share and cross-device behaviors now the norm. The number of users accessing the internet via only their desktop/laptop is down across the board but mobile-only and multi-platform usage is up in the US. Overall, 88% of internet users surf via mobile or multiple devices, a year-on-year increase of 10%. Furthermore, the Millennial (18-34) demographic has a much higher rate of mobile only usage, 15 points above other demographics, although it should be noted that this is up in all demographics (comScore, 2015a). Now, more than 40% of US purchases tracked by Criteo use multiple devices to view the product before a purchase is made (Criteo, 2015a).
tecH
no
loG
y a
nd
distr
iBu
tion
This is an excerpt from our chapter on the main technology trends that are changing the travel industry, in particular mobile.

aB
ou
t eyefo
rtr
av
el
About EyeforTravel
EyeforTravel is a community where the world’s online travel brands – from hotels to airlines, online travel agents, cruise, car hire firms and more – come to meet.
Established in 1997, by Tim Gunstone, we offer a diverse product portfolio including industry analysis, insights, research, webinars, reports and conferences to suit the needs of our clients.
No other online travel intelligence provider has been around for as long as us. We were here at the inception of online travel and we know the industry inside out. What’s more, we’re a small, friendly team. Forget impersonal hierarchies, we like to get to know our customers and work towards their exact needs.
For more information visit www.eyefortravel.com/reports Half-year round-up and forecast: 2015 | 16
■ Pages: 62 ■ Premium license - 95€/month (1,140€/year, access for up
to 3 people) ■ Educational institution’s premium license - 45€/month
(540€/year, access for up to 3 people) Need access for more than 3 people? No problem! “custom licenses” can be put together so please get in touch directly with Simi at [email protected]
Four ways to order:
www.eyefortravel.com/reports
Scan and email this form back to: [email protected]
Or fax: +44 (0)20 1234 5678
Simi Ramabhadran, Global Account Manager- Eye For Travel Research Library Subscription +44 (0) 207 422 4338 us toll free: 1800 814 3459 ex: 4338
Payment details:
Name (as it appears on card):
Card Number:
Type of card:
Expiry date: Security Code:
First name:
Last name:
Company:
Telephone:
Email:
Address:
City:
Zip/Postcode:
Report Name:
Quantity:
order your report in less tHan 60 secondsfind out More aBout tHe reports and our suBscription services
order your copy today at: www.eyefortravel.coM/reports

tra
vel r
esear
cH
liBr
ar
y
For more information visit www.eyefortravel.com/reports Half-year round-up and forecast: 2015 | 17
Travel Research Library
recent reports by eyefortravel:
Making Brand.com a Success
Ancillary Revenues in the Hospitality Industry
Smart Analytics: Identify, Track and Target the
Modern Digital Consumer Effectively 2015
The Future of Metasearch 2015
Download the samplepages here
Download the samplepages here
Download the samplepages here
Download the samplepages here
The Implications of the UK’s EU Membership Referendum for the
Travel Industry
Mobile in Hospitality Industry 2014
Mobile in the Online Travel Agent and Travel
Metasearch Industry 2014
Mobile in the Airtravel Industry Report 2014
Download the samplepages here
Download the samplepages here
Download the samplepages here
Download the samplepages here
Making Brand.com a SuccessIncrease direct bookings with this guide on how to build, grow and optimize your brand’s digital presence
BuildBest practice in designing, pricing and structuring a website to create an exceptional customer experience
GrowDiscover how to exploit and coordinate social media, content marketing, SEO and CRM to build a brand identity
OptimizeUnderstand the consumer and their motivations to win them back from the OTAs and gain their loyalty
Join the conversation!
facebook.com/eyefortravel linkedin/eyefortravel @EyeforTravel