Embed Size (px)
Citation preview
Loughborough UniversityInstitutional Repository
Eye-tracking experiment totest key emerging principlesof the visual communication
of technology
This item was submitted to Loughborough University's Institutional Repositoryby the/an author.
Citation: BEH, C., BADNI, K. and NORMAN, E.W.L., 2011. Eye-trackingexperiment to test key emerging principles of the visual communication of tech-nology. IN: Norman, E.W.L. and Seery, N, (eds). IDATER online conference:graphicacy and modelling 2010. Loughborough: Design Education ResearchGroup, Loughborough Design School, pp. 179-208.
Additional Information:
• This book chapter was published in the book, IDATER online conference:graphicacy and modelling 2010 [ c© Design Education Research Group,Loughborough Design School]. The book was produced by IDATER, theInternational Conference on Design and Technology Educational Researchand Curriculum Development in association with Loughborough DesignSchool, Design Education Research Group and University of Limerick, toaccompany the online conference Graphicacy & Modelling held at Univer-sity of Limerick, December 14th 2010.
Metadata Record: https://dspace.lboro.ac.uk/2134/9073
Version: Published
Publisher: c©Design Education Research Group, Loughborough Design School
Please cite the published version.
This item was submitted to Loughborough’s Institutional Repository (https://dspace.lboro.ac.uk/) by the author and is made available under the
following Creative Commons Licence conditions.
For the full text of this licence, please go to: http://creativecommons.org/licenses/by-nc-nd/2.5/
IDATER Online Conference:
Graphicacy and Modelling
Edited by
Professor Eddie Norman
Loughborough University
Dr Niall Seery University of Limerick

2011 Design Education Research Group, Loughborough Design School Produced by IDATER, the International Conference on Design and Technology Educational Research and Curriculum Development in association with Loughborough Design School, Design Education Research Group and University of Limerick, to accompany the online conference Graphicacy & Modelling held at University of Limerick, December 14th 2010. ISBN 978-1-907382-51-2
Contents
Acknowledgements Understanding graphicacy Professor Steve Garner Online conferencing: designing and innovation Professor Eddie Norman & Dr Niall Seery Vision, modelling and design Professor Ken Baynes Purposes of drawings in design sketchbooks Dr Owain Pedgley
A review of the nature, provision, and progression of graphical education in Ireland Dr Niall Seery, Raymond Lynch, & Rónán Dunbar 'Blurring the boundaries': a metaphor to guide the development of specialist learning spaces as part of an academy design development project Dr Donna Trebell Continuity and progression in graphicacy Xenia Danos & Eddie Norman The elephant in the room: the influence of prevailing pedagogical practice on the integration of Design and Communication Graphics in the post-primary classroom Oliver McGarr What is the role of observational drawing in contemporary art & design curricula? Michelle Fava Examining sketching ability within initial technology teacher education Diarmaid Lane, Dr Niall Seery & Dr Seamus Gordon Defining the variables that contribute to developing 3D CAD modelling expertise Anthony Rynne, William F Gaughran & Dr Niall Seery Eye-tracking experiment to test key emerging principles of the visual communication of technology Cheng-Siew Beh & Kevin Badni Differences in the epistemological beliefs of postgraduate pre-service teachers Dr Raymond Lynch Authors’ Pages
1 3 5 17 27 51 69 103 121 129 143 161 179 209 221
Foreword
Editorial
1
2
3
4
5
6
7
8
9
10
11
Abstract The aim of this paper is to examine people’s eye reading patterns on technological information presented in 2 dimensional visual forms. This is in relation to testing the principles of visual communication (VC) applied on those visual representations and whether they obtained a similar (if not the same) patterns of recognition as suggested by the key emerging principles (KEP) of visual communication of technology (VCT) that had been derived from a literature review (Beh & Norman, 2010). An eye-tracking experiment was designed with an evaluation strategy targeted at gathering qualitative and quantitative data of reading patterns. The visuals selected for the experiment represented a comparison of three prepared in the 21st Century where there was evidence of their effectiveness in communicating technological information with visual representations with similar purposes and of acknowledged quality from the 16th Century. Five participants took part in the study and verbal protocols were recorded alongside the eye-tracking experiments. The quantitative results concerning eye movements and the qualitative indications of associated understanding were consistent with the KEP derived from the literature review.
Introduction A literature survey was conducted which explored the visual communication of technology (VCT) in designing, and thereby links to creativity and innovation (Beh & Norman, 2009, 2010). In addition, claims of visual communication (VC) as a tool to facilitate creative thoughts for cognitive modelling, and then resolving or obtaining design outcomes were found. This complex chain of events has been asserted throughout many decades within the development of design, technology and education (Ashby & Johnson, 2004; Baynes, 2009; Carlson & Gorman, 1992; Codone, 2005; Curtiss, 1987; Ferguson, 1993; Finke et al., 1988, 1989, 1992; Middleton, 2005; Norman, 1998; Weber et al., 1989, 1990, 1992). However, there is little empirical research evidence to support these assertions (Beh & Norman, 2010). Within the literature search, key emerging principles (KEP) of the VCT were developed (Beh & Norman, 2009, 2010; Beh et al., 2010). The practice of VCT, in fact, has been significant since the Renaissance, and particularly during the industrial revolution. It has been a key communication and concept development tool for designers/inventors, engineers, clients, manufacturers and others (Baynes, 2009; Ferguson, 1993; Baynes & Pugh, 1978).
10
Eye-tracking experiment to test key emerging principles of visual communication of technology Cheng-Siew Beh, Kevin Badni & Eddie Norman
179
This paper reports empirical evidence, which was being sought to validate the KEP of VCT from the readers’ perspectives using the eye-tracking method. The eye-tracking experiment involved comparisons between visual representations created in the 21st Century with those with similar purposes from the 16th Century. All the visuals used in the experiment either represented acknowledged good practice, or there was independent evidence of their effectiveness. Background literature This section reports two areas of literature foci: 1) emergent principles of visual communication of technology; and 2) eye-tracking and its application. Emergent principles of visual communication of technology The key emerging principles of VCT were derived from Tufte (1990, 1997, 2006) who provided a range of comprehensive principles and techniques to develop effective quantitative and statistical graphical visual information; Rand (1971, 1985) who gave perspectives on graphic design for persuasive visual communication; Ferguson (1993) who presented the history of engineering design and visualisation tools; and Thomson (1979) who offered graphic principles for engineers.
The emergent VCT principles were based on common elements identified from these authors. Namely, the representation’s capability in facilitating comparison to reveal connections and relationships; unity of form to accentuate function; precision of data to communicate accuracy or truth; and all graphical structures should be simple in design form, but complex in carrying data, in short, the emergent VCT principles are:
1. COMPARE > RELATIONSHIP 2. FORM > FUNCTION 3. PRECISE > ACCURACY/TRUTH 4. SIMPLE IN DESIGN; COMPLEX IN
DATA
Each of these VCT principles can be elaborated in relation to two different concerns of: 1) technical and technological matters; and 2) graphic arts. The detailed elaboration and articulation of the established key emerging principles of VCT is as illustrated in (Beh et al., 2010). Eye-tracking and its application Many research studies in the advertising and design fields have used eye-tracker devices to gather extensive data and have provided important findings for the improvement of the presentation of consumer goods. The eye-tracking device allows a large amount of statistical data concerning eye movements to be obtained. However, Jacob and Karn (2003) emphasised that some common details e.g. scanning path, number of gazes, percentage of participants fixating an area of interest, and time to first fixation on target area of interest were interesting measures for research, but that they have often been overlooked during analysis in many studies.
The uses of eye-tracking methods have made possible the close examination of the conscious and unconscious gaze movement of a respondent in visual system research (eyetracker.co.uk; system-concepts.com). The human visual system starts with eye movements, which are linked to perceptual systems; it is the close relation of these movements to attentional mechanisms, saccades that can provide insight into cognitive processes, e.g. language comprehension, memory, mental imagery and decision making (Richardson & Spivey 2004: 2).
180
Beh, Badni & Norman
Visual systems research in the areas of advertising and design commonly focus on the consumers’ behaviour, particularly on commercial messages for products. This is supported by Richardson and Spivey (2004: 17) as they suggested that eye-movement behaviour of consumers can determine immediate perceptual factors and decision-making processes. Richardson and Spivey (2004: 15) cited early empirical findings from Perky (1910), Clark (1916), Stoy (1930), Goldthwait (1933) and Totten (1935) that the frequency of eye movements increases during mental imagery. In addition, their recent work suggests that eye movements were related to both memory of specific perceptual experience and cognitive acts of imagination (Richardson & Spivey 2004:15). Levy-Schoen (1983: 66) emphasised, ‘to the extent that eye movements are reliable correlates of the sequential centring of attention, we can observe and analyse them in order to understand how thinking goes on.’ The use of eye-tracking for design-based research by Fischer et al. (1989), Pieters
et al. (1999), Russo and Leclerc (1994), Malach et al. (2005), and many other works reported in Jacob and Karn (2003: 582-584) were founded on similar grounds; namely the correlation of eye movements and visual perceptual systems.
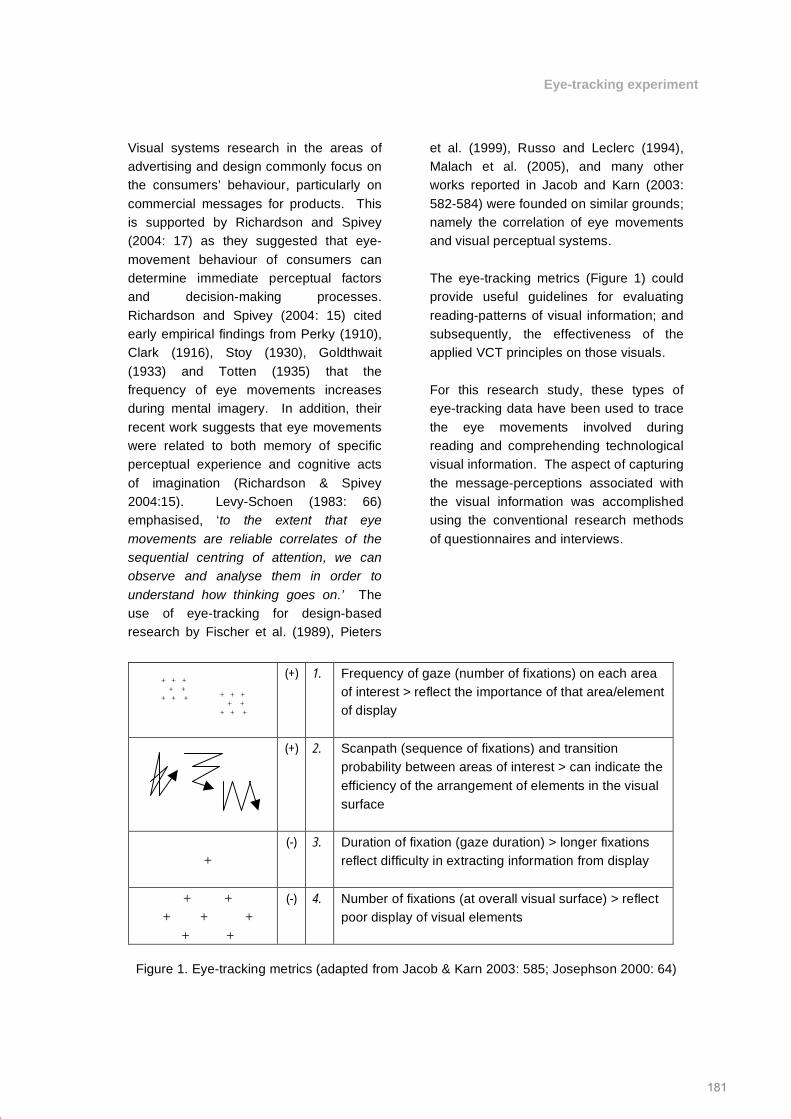
The eye-tracking metrics (Figure 1) could provide useful guidelines for evaluating reading-patterns of visual information; and subsequently, the effectiveness of the applied VCT principles on those visuals. For this research study, these types of eye-tracking data have been used to trace the eye movements involved during reading and comprehending technological visual information. The aspect of capturing the message-perceptions associated with the visual information was accomplished using the conventional research methods of questionnaires and interviews.
(+) 1. Frequency of gaze (number of fixations) on each area of interest > reflect the importance of that area/element of display
(+) 2. Scanpath (sequence of fixations) and transition probability between areas of interest > can indicate the efficiency of the arrangement of elements in the visual surface
+
(-) 3. Duration of fixation (gaze duration) > longer fixations reflect difficulty in extracting information from display
+ + + + +
+ +
(-) 4. Number of fixations (at overall visual surface) > reflect poor display of visual elements
Figure 1. Eye-tracking metrics (adapted from Jacob & Karn 2003: 585; Josephson 2000: 64)
+ + + + + + + +
+ + + + + + + +
181
Eye-tracking experiment
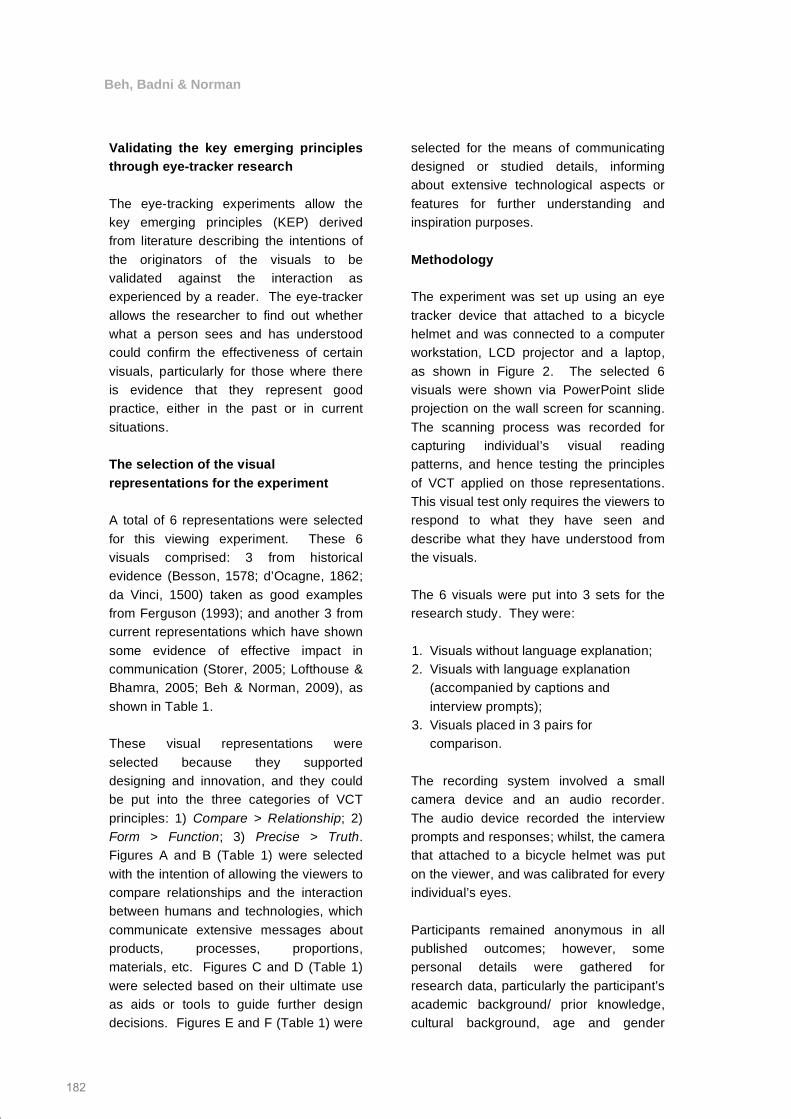
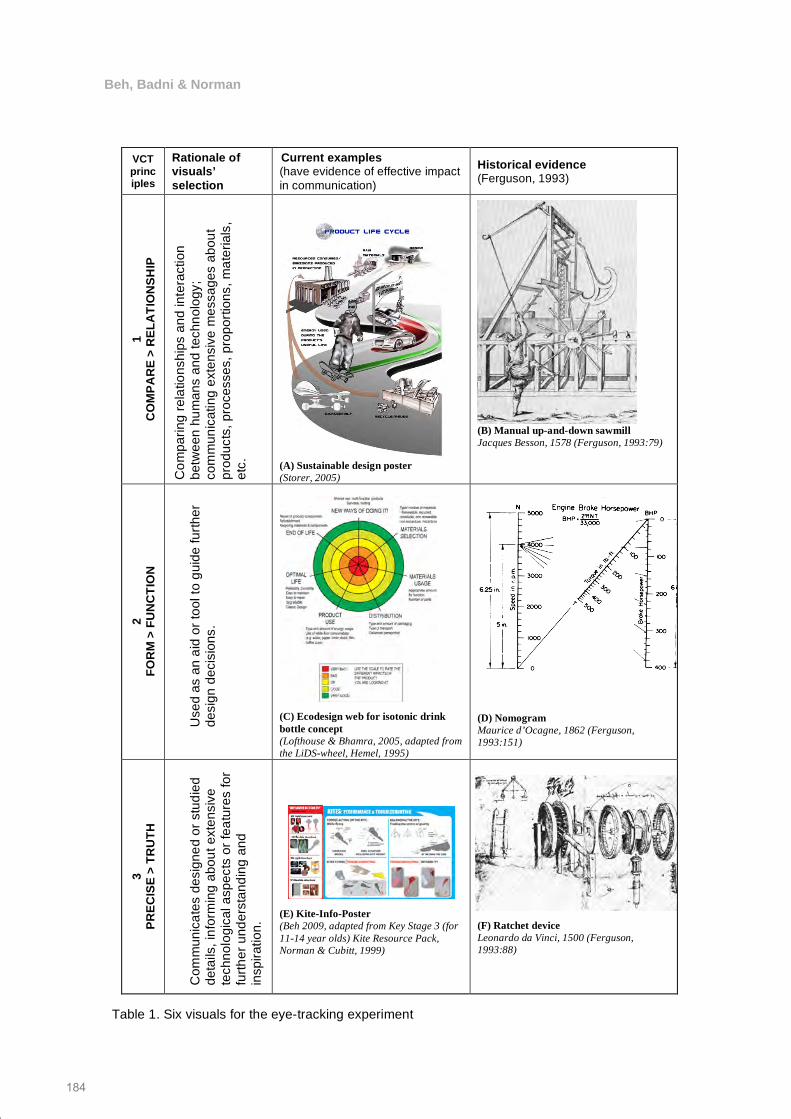
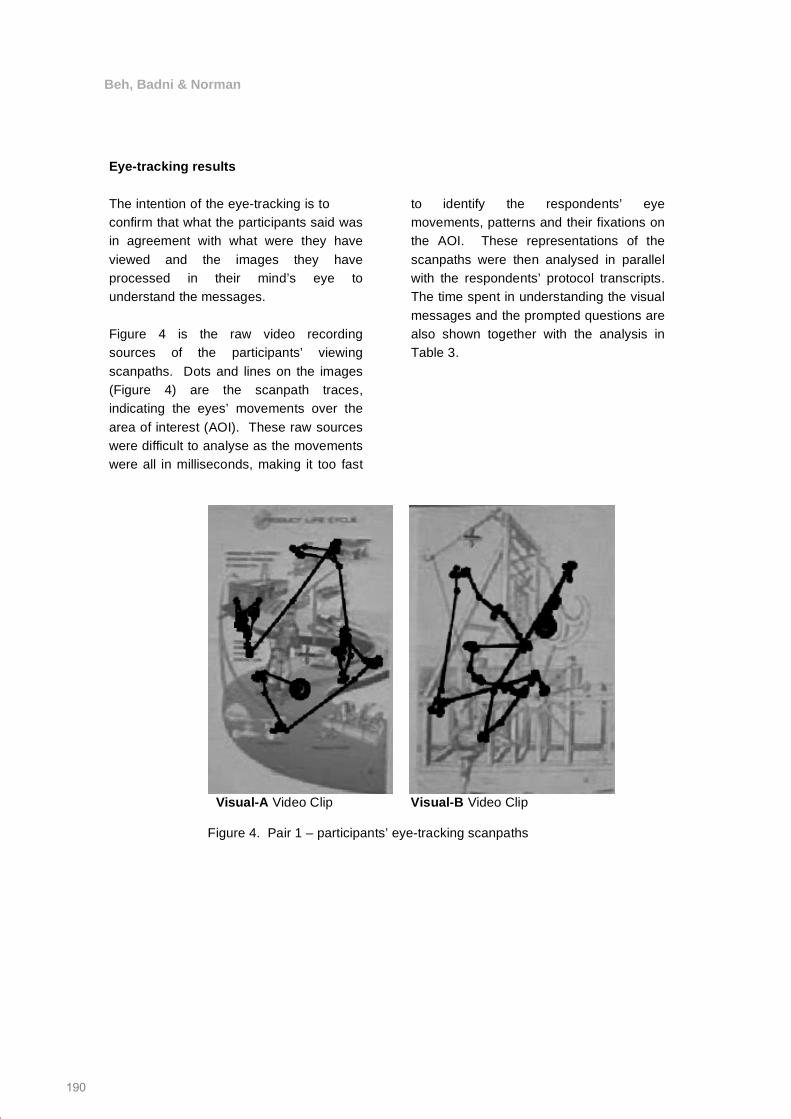
Validating the key emerging principles through eye-tracker research The eye-tracking experiments allow the key emerging principles (KEP) derived from literature describing the intentions of the originators of the visuals to be validated against the interaction as experienced by a reader. The eye-tracker allows the researcher to find out whether what a person sees and has understood could confirm the effectiveness of certain visuals, particularly for those where there is evidence that they represent good practice, either in the past or in current situations. The selection of the visual representations for the experiment A total of 6 representations were selected for this viewing experiment. These 6 visuals comprised: 3 from historical evidence (Besson, 1578; d’Ocagne, 1862; da Vinci, 1500) taken as good examples from Ferguson (1993); and another 3 from current representations which have shown some evidence of effective impact in communication (Storer, 2005; Lofthouse & Bhamra, 2005; Beh & Norman, 2009), as shown in Table 1.
These visual representations were selected because they supported designing and innovation, and they could be put into the three categories of VCT principles: 1) Compare > Relationship; 2) Form > Function; 3) Precise > Truth. Figures A and B (Table 1) were selected with the intention of allowing the viewers to compare relationships and the interaction between humans and technologies, which communicate extensive messages about products, processes, proportions, materials, etc. Figures C and D (Table 1) were selected based on their ultimate use as aids or tools to guide further design decisions. Figures E and F (Table 1) were
selected for the means of communicating designed or studied details, informing about extensive technological aspects or features for further understanding and inspiration purposes.
Methodology The experiment was set up using an eye tracker device that attached to a bicycle helmet and was connected to a computer workstation, LCD projector and a laptop, as shown in Figure 2. The selected 6 visuals were shown via PowerPoint slide projection on the wall screen for scanning. The scanning process was recorded for capturing individual’s visual reading patterns, and hence testing the principles of VCT applied on those representations. This visual test only requires the viewers to respond to what they have seen and describe what they have understood from the visuals. The 6 visuals were put into 3 sets for the research study. They were: 1. Visuals without language explanation; 2. Visuals with language explanation
(accompanied by captions and interview prompts);
3. Visuals placed in 3 pairs for comparison.
The recording system involved a small camera device and an audio recorder. The audio device recorded the interview prompts and responses; whilst, the camera that attached to a bicycle helmet was put on the viewer, and was calibrated for every individual’s eyes.
Participants remained anonymous in all published outcomes; however, some personal details were gathered for research data, particularly the participant’s academic background/ prior knowledge, cultural background, age and gender
182
Beh, Badni & Norman
groups, as these factors may or may not influence the research outcomes. Loughborough University’s ‘Ethical Clearance Checklist, Briefing and Consent for Participants’ procedures were followed. First set of experiments – visuals without language explanation Participants were asked to describe what they “see” in each of the 6 visuals projected. Some guiding questions (Figure 3) were drafted to use as prompts during this set of tests, in case, for example, the researcher needed to determine or clarify why viewers were looking at some spots but not others, or have a particular pattern of descriptive results. However, these questions were not used as the participants’ responses seemed quite sufficient and clear for the analysis of this aspect of the study. They are included here in order to clarify its scope. Second set of experiments – visuals with language explanation (accompanied by captions and interview prompts) Participants were asked to describe what they “understood” in each of the same 6 visuals projected, only this time captions were added to the visuals. Additionally, some semi-structured questions (Table 2) were used as prompts during the scanning. This was to help those participants who needed some hints to help them describe what they have seen and understood, what they were not so clear about, or what they have not yet stated in the first set of experiments. The semi-structured questions were based on four focus areas: 1) Obvious message; 2) Obvious details; 3) Hidden or interpreted details; and 4) Interpreted or inspiration message. The questions correspond to the visuals as illustrated in Table 2.
Third set of experiments – visuals placed in 3 pairs for comparison After viewing the individual images, the same 6 visuals from the second set of experiment were placed in 3 pairs for comparison. This was intended to allow the participants to have another chance to compare the similar relationships or intentions of each set of representations, if they had not seen the relationship in the first place. The participants were asked to describe any similarities in the ways these pairs of images communicated. Samples and recordings Five participants (P) completed the piloted eye-tracking experiment. Their academic backgrounds were: Design and Technology (P1); Materials Sciences and Engineering (P2); Art and Design/Fine Art (P3); Industrial Engineering (P4); Industrial Design (P5). They were a purposive sample in that they represent particular academic categories of students. They were also selected for their different cultural backgrounds in terms of where they grew up: two from the UK; one from Cyprus; one from Singapore; one from Mexico; and they were asked for their learning preferences for an initial comparative study.
During the experiment, 2 of the respondents’ recordings were captured with some missing eye-scanning statistical data. Therefore, it was not possible to generate the scanning path patterns. However, the raw sources of eye-tracking video (with eyes fixations), and the descriptions of what they have seen and perceived were safely recorded and these data can still be used for further analysis. The other 3 respondents’ recordings were successfully and fully captured, and were able to be used for the full scanpaths analysis.
183
Eye-tracking experiment
VCT principles
Rationale of visuals’ selection
Current examples (have evidence of effective impact in communication)
Historical evidence (Ferguson, 1993)
1 C
OM
PAR
E >
REL
ATI
ON
SHIP
Com
parin
g re
latio
nshi
ps a
nd in
tera
ctio
n
bet
wee
n hu
man
s an
d te
chno
logy
; c
omm
unic
atin
g ex
tens
ive
mes
sage
s ab
out
pro
duct
s, p
roce
sses
, pro
porti
ons,
mat
eria
ls,
etc
.
(A) Sustainable design poster (Storer, 2005)
(B) Manual up-and-down sawmill Jacques Besson, 1578 (Ferguson, 1993:79)
2 FO
RM
> F
UN
CTI
ON
Use
d as
an
aid
or to
ol to
gui
de fu
rther
de
sign
dec
isio
ns.
(C) Ecodesign web for isotonic drink bottle concept (Lofthouse & Bhamra, 2005, adapted from the LiDS-wheel, Hemel, 1995)
(D) Nomogram Maurice d’Ocagne, 1862 (Ferguson, 1993:151)
3 PR
ECIS
E >
TRU
TH
Com
mun
icat
es d
esig
ned
or s
tudi
ed
deta
ils, i
nfor
min
g ab
out e
xten
sive
te
chno
logi
cal a
spec
ts o
r fea
ture
s fo
r fu
rther
und
erst
andi
ng a
nd
insp
iratio
n.
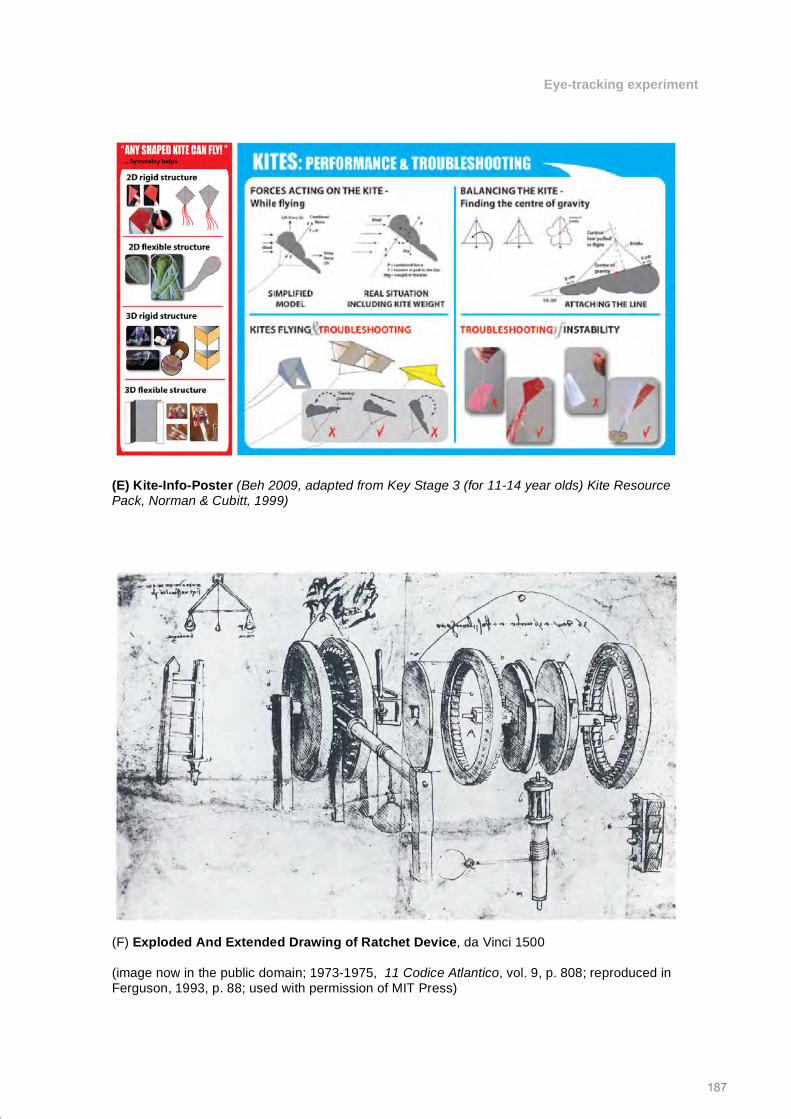
(E) Kite-Info-Poster (Beh 2009, adapted from Key Stage 3 (for 11-14 year olds) Kite Resource Pack, Norman & Cubitt, 1999)
(F) Ratchet device Leonardo da Vinci, 1500 (Ferguson, 1993:88)
Table 1. Six visuals for the eye-tracking experiment
184
Beh, Badni & Norman
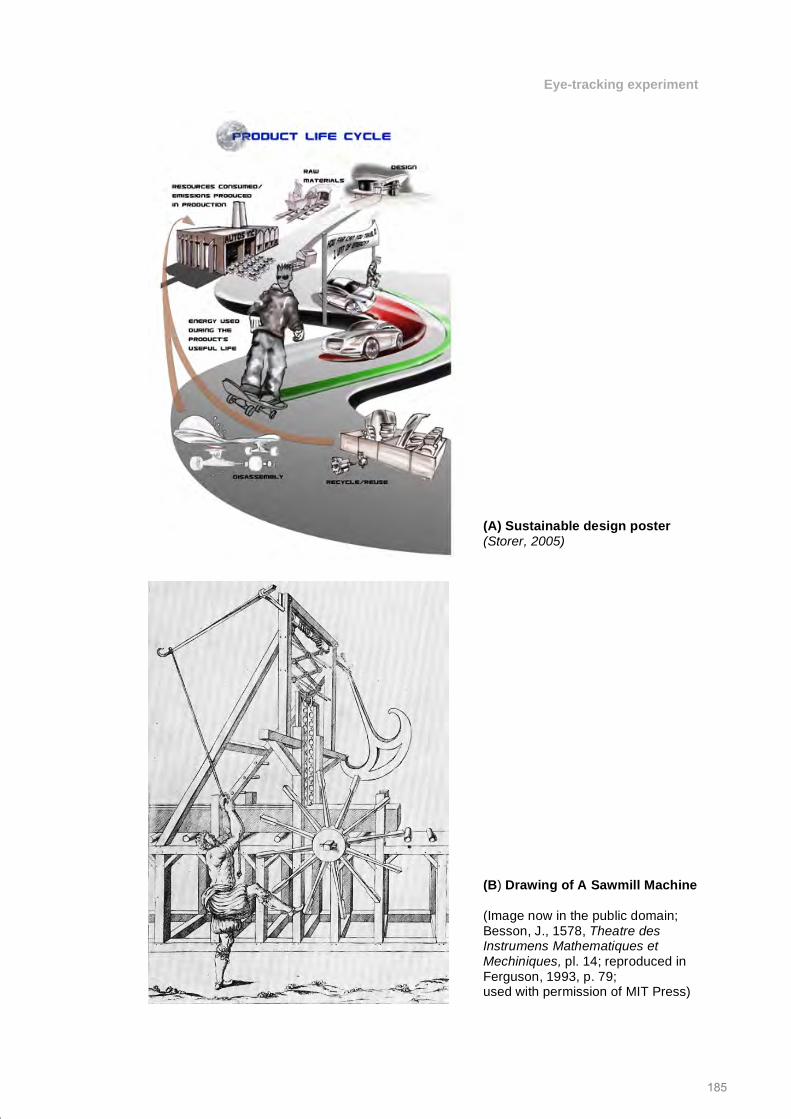
(A) Sustainable design poster (Storer, 2005)
(B) Drawing of A Sawmill Machine (Image now in the public domain; Besson, J., 1578, Theatre des Instrumens Mathematiques et Mechiniques, pl. 14; reproduced in Ferguson, 1993, p. 79; used with permission of MIT Press)
185
Eye-tracking experiment
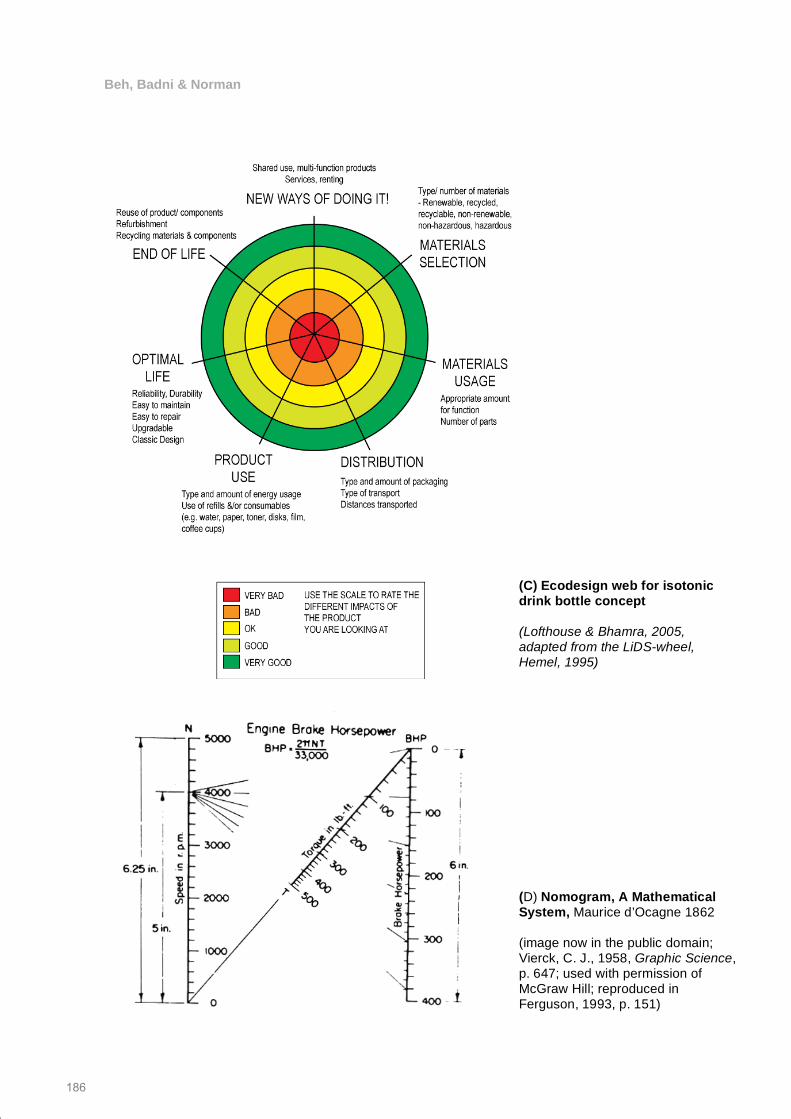
(C) Ecodesign web for isotonic drink bottle concept (Lofthouse & Bhamra, 2005, adapted from the LiDS-wheel, Hemel, 1995)
(D) Nomogram, A Mathematical System, Maurice d’Ocagne 1862 (image now in the public domain; Vierck, C. J., 1958, Graphic Science, p. 647; used with permission of McGraw Hill; reproduced in Ferguson, 1993, p. 151)
186
Beh, Badni & Norman
(E) Kite-Info-Poster (Beh 2009, adapted from Key Stage 3 (for 11-14 year olds) Kite Resource Pack, Norman & Cubitt, 1999)
(F) Exploded And Extended Drawing of Ratchet Device, da Vinci 1500 (image now in the public domain; 1973-1975, 11 Codice Atlantico, vol. 9, p. 808; reproduced in Ferguson, 1993, p. 88; used with permission of MIT Press)
187
Eye-tracking experiment
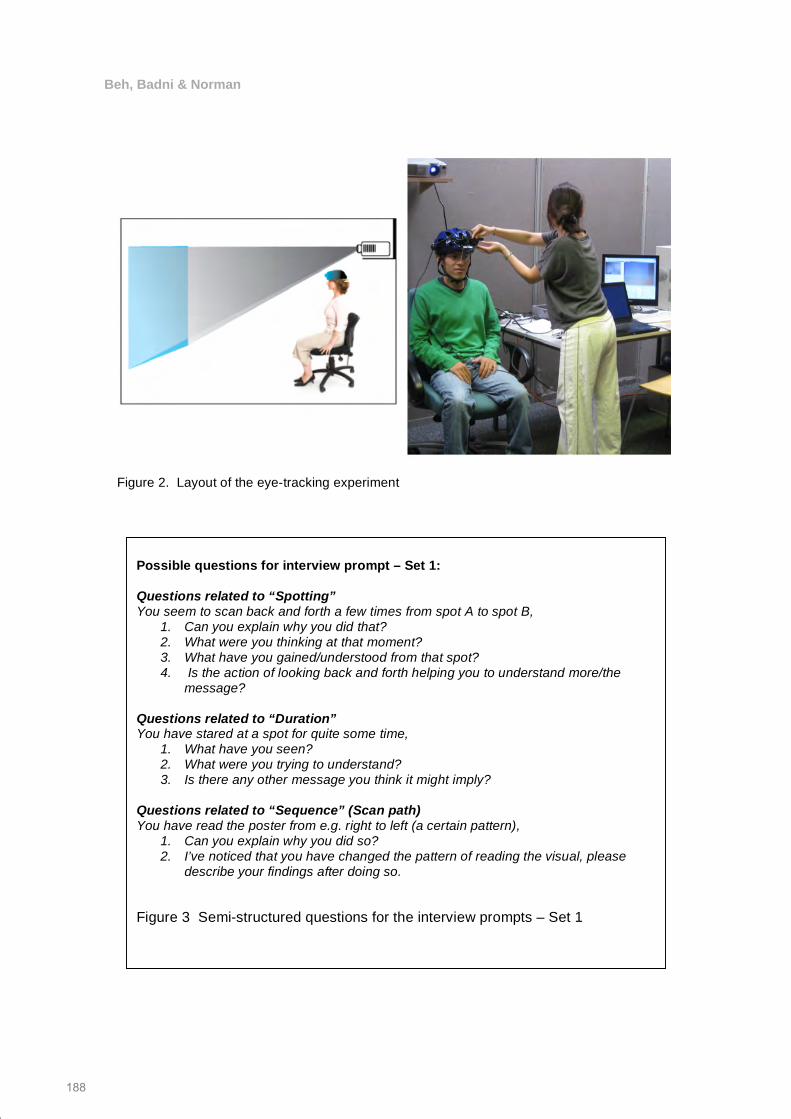
Figure 2. Layout of the eye-tracking experiment
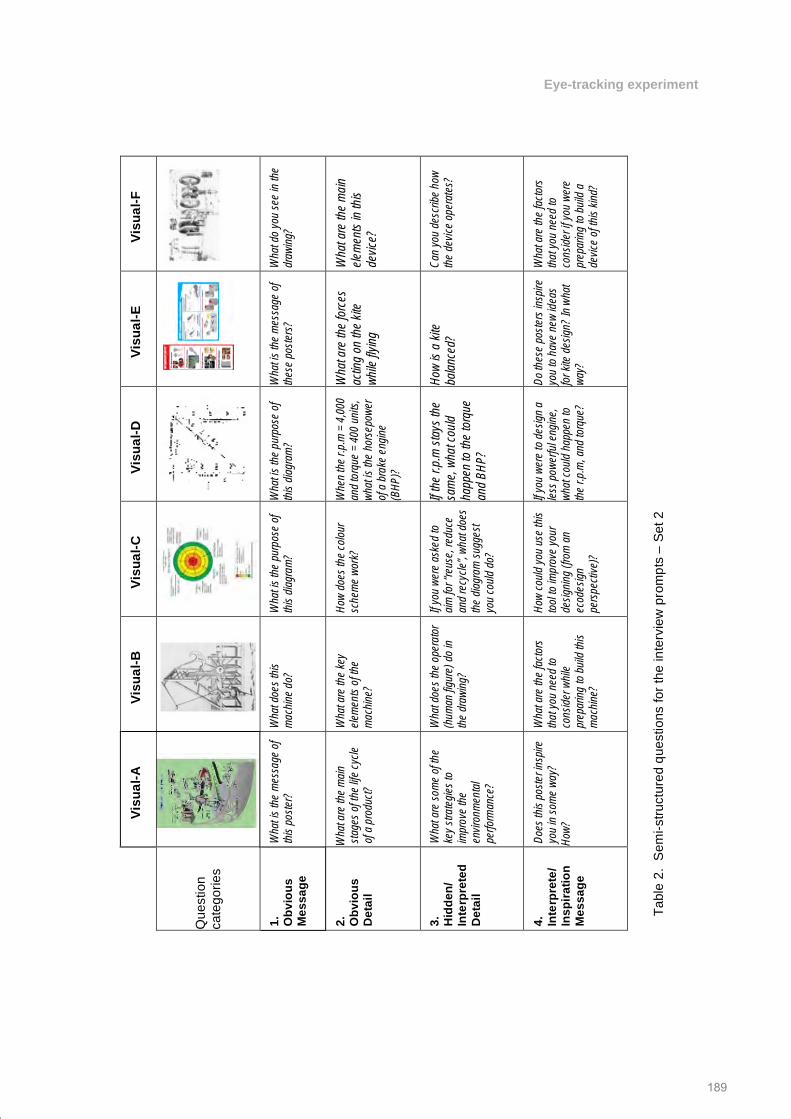
Possible questions for interview prompt – Set 1: Questions related to “Spotting” You seem to scan back and forth a few times from spot A to spot B,
1. Can you explain why you did that? 2. What were you thinking at that moment? 3. What have you gained/understood from that spot? 4. Is the action of looking back and forth helping you to understand more/the
message? Questions related to “Duration” You have stared at a spot for quite some time,
1. What have you seen? 2. What were you trying to understand? 3. Is there any other message you think it might imply?
Questions related to “Sequence” (Scan path) You have read the poster from e.g. right to left (a certain pattern),
1. Can you explain why you did so? 2. I’ve noticed that you have changed the pattern of reading the visual, please
describe your findings after doing so. Figure 3 Semi-structured questions for the interview prompts – Set 1
188
Beh, Badni & Norman
Vi
sual
-F
Wha
t do
you
see
in th
e
dra
win
g?
Wha
t are
the
mai
n
ele
men
ts in
this
d
evic
e?
Can
you
des
crib
e ho
w
the
devi
ce o
pera
tes?
Wha
t are
the
fact
ors
th
at y
ou n
eed
to
con
side
r if y
ou w
ere
p
repa
ring
to b
uild
a
dev
ice
of th
is k
ind?
Visu
al-E
Wha
t is
the
mes
sage
of
thes
e po
ster
s?
Wha
t are
the
forc
es
actin
g on
the
kite
w
hile
flyi
ng
How
is a
kite
ba
lanc
ed?
Do
thes
e po
ster
s in
spire
yo
u to
hav
e ne
w id
eas
for k
ite d
esig
n? In
wha
t w
ay?
Visu
al-D
Wha
t is
the
purp
ose
of
this
dia
gram
?
Whe
n th
e r.p
.m =
4,0
00
and
torq
ue =
400
uni
ts,
wha
t is
the
hors
epow
er
of a
bra
ke e
ngin
e (B
HP
)?
If th
e r.p
.m s
tays
the
sam
e, w
hat c
ould
ha
ppen
to th
e to
rque
an
d BH
P?
If yo
u w
ere
to d
esig
n a
less
pow
erfu
l eng
ine,
w
hat c
ould
hap
pen
to
the
r.p.m
, and
torq
ue?
Visu
al-C
Wha
t is
the
purp
ose
of
this
dia
gram
?
How
doe
s th
e co
lour
s
chem
e w
ork?
If y
ou w
ere
aske
d to
a
im fo
r “re
use,
redu
ce
and
recy
cle”
, wha
t doe
s
the
diag
ram
sug
gest
y
ou c
ould
do?
How
cou
ld y
ou u
se th
is
tool
to im
prov
e yo
ur
des
igni
ng (f
rom
an
e
code
sign
p
ersp
ectiv
e)?
Visu
al-B
W
hat d
oes
this
m
achi
ne d
o?
Wha
t are
the
key
e
lem
ents
of t
he
mac
hine
?
Wha
t doe
s th
e op
erat
or
(hum
an fi
gure
) do
in
the
draw
ing?
Wha
t are
the
fact
ors
th
at y
ou n
eed
to
con
side
r whi
le
pre
parin
g to
bui
ld th
is
mac
hine
?
Visu
al-A
W
hat i
s th
e m
essa
ge o
f
this
pos
ter?
Wha
t are
the
mai
n
sta
ges
of th
e lif
e cy
cle
o
f a p
rodu
ct?
Wha
t are
som
e of
the
k
ey s
trate
gies
to
impr
ove
the
e
nviro
nmen
tal
per
form
ance
?
Doe
s th
is p
oste
r ins
pire
y
ou in
som
e w
ay?
How
?
Que
stio
n ca
tego
ries
1.
Obv
ious
M
essa
ge
2.
Obv
ious
D
etai
l
3.
Hid
den/
In
terp
rete
d
Det
ail
4.
In
terp
rete
/
Insp
iratio
n M
essa
ge
Tabl
e 2.
Sem
i-stru
ctur
ed q
uest
ions
for t
he in
terv
iew
pro
mpt
s –
Set 2
189
Eye-tracking experiment
Eye-tracking results The intention of the eye-tracking is to confirm that what the participants said was in agreement with what were they have viewed and the images they have processed in their mind’s eye to understand the messages.
Figure 4 is the raw video recording sources of the participants’ viewing scanpaths. Dots and lines on the images (Figure 4) are the scanpath traces, indicating the eyes’ movements over the area of interest (AOI). These raw sources were difficult to analyse as the movements were all in milliseconds, making it too fast to simply observe the differences while viewing. Thus, the video sources were transferred into snapshots and captured in a frame-by-frame format (Table 3), in order
to identify the respondents’ eye movements, patterns and their fixations on the AOI. These representations of the scanpaths were then analysed in parallel with the respondents’ protocol transcripts. The time spent in understanding the visual messages and the prompted questions are also shown together with the analysis in Table 3.
Visual-A Video Clip Visual-B Video Clip Figure 4. Pair 1 – participants’ eye-tracking scanpaths
190
Beh, Badni & Norman
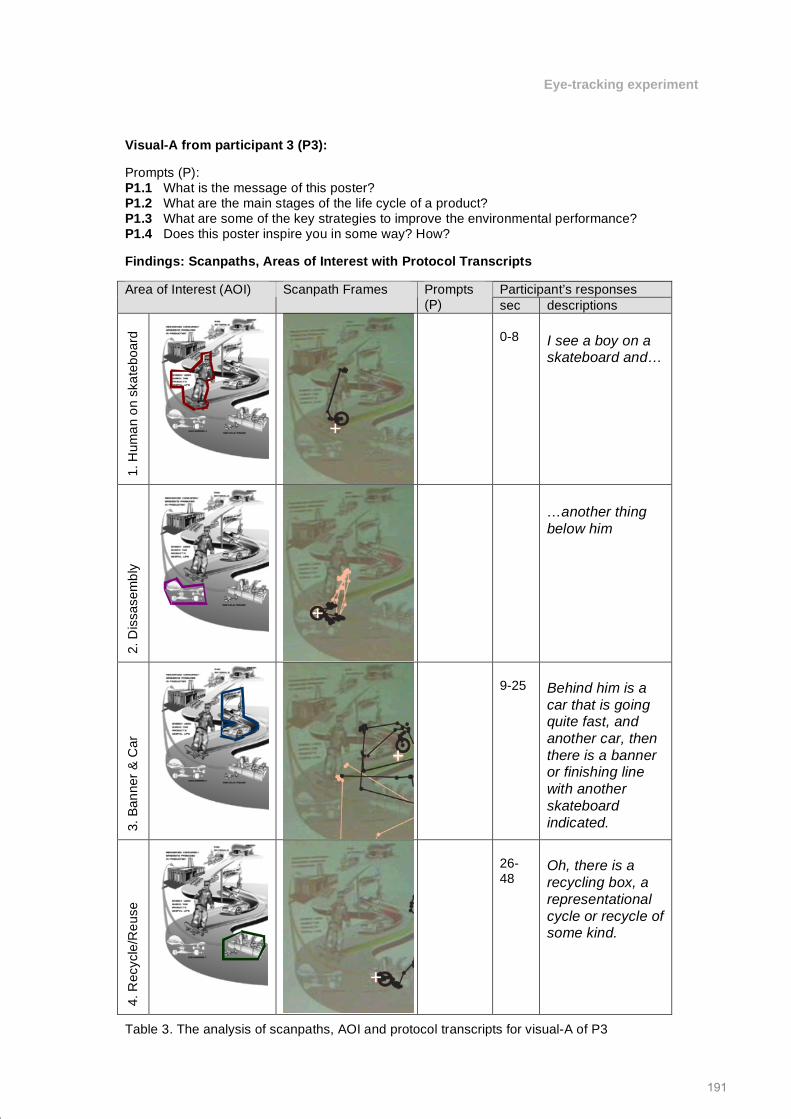
Visual-A from participant 3 (P3): Prompts (P): P1.1 What is the message of this poster? P1.2 What are the main stages of the life cycle of a product? P1.3 What are some of the key strategies to improve the environmental performance? P1.4 Does this poster inspire you in some way? How? Findings: Scanpaths, Areas of Interest with Protocol Transcripts
Participant’s responses Area of Interest (AOI) Scanpath Frames Prompts (P) sec descriptions
1. H
uman
on
skat
eboa
rd
0-8
I see a boy on a skateboard and…
2. D
issa
sem
bly
…another thing below him
3. B
anne
r & C
ar
9-25
Behind him is a car that is going quite fast, and another car, then there is a banner or finishing line with another skateboard indicated.
4. R
ecyc
le/R
euse
26-48
Oh, there is a recycling box, a representational cycle or recycle of some kind.
Table 3. The analysis of scanpaths, AOI and protocol transcripts for visual-A of P3
191
Eye-tracking experiment
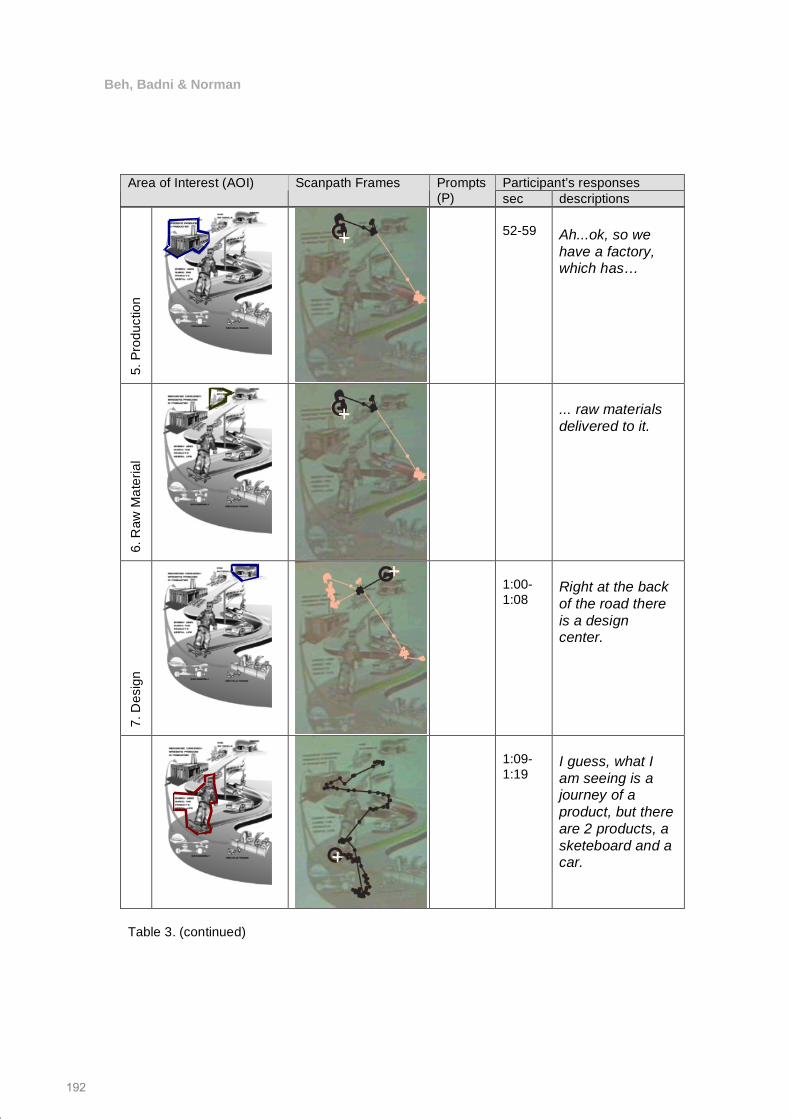
Participant’s responses Area of Interest (AOI) Scanpath Frames Prompts (P) sec descriptions
5. P
rodu
ctio
n
52-59
Ah...ok, so we have a factory, which has…
6. R
aw M
ater
ial
... raw materials delivered to it.
7. D
esig
n
1:00-1:08
Right at the back of the road there is a design center.
1:09-1:19
I guess, what I am seeing is a journey of a product, but there are 2 products, a sketeboard and a car.
Table 3. (continued)
192
Beh, Badni & Norman
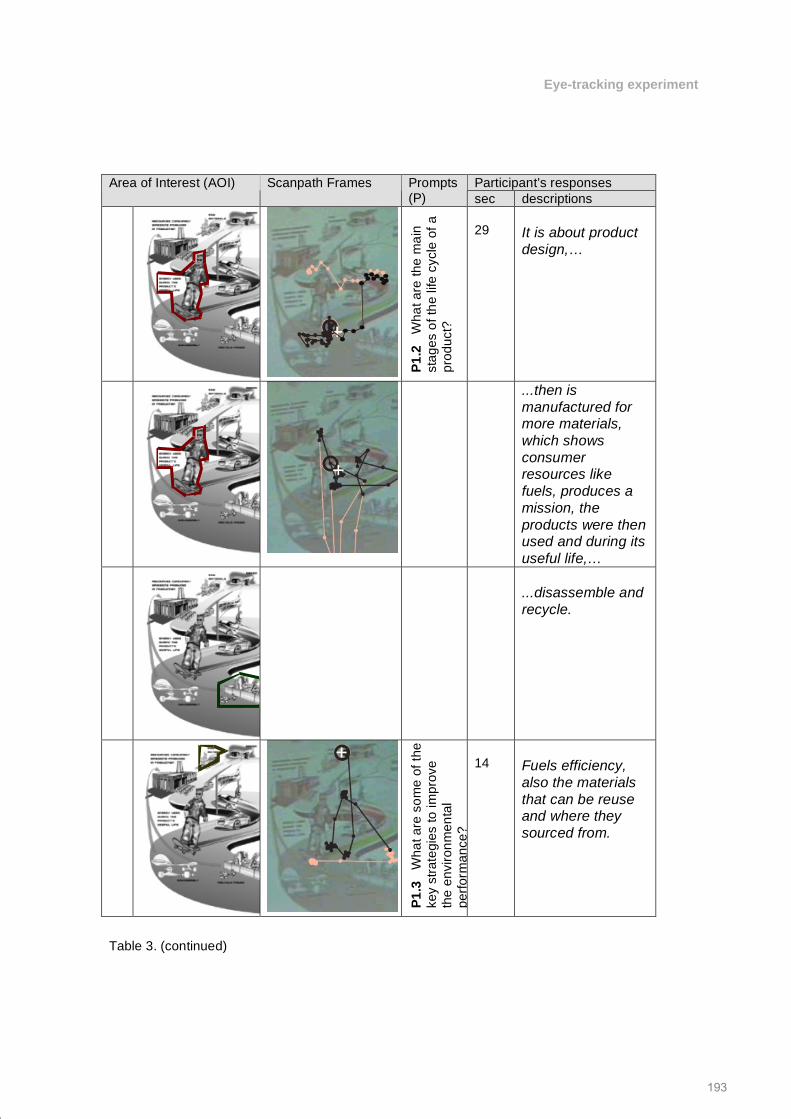
Participant’s responses Area of Interest (AOI) Scanpath Frames Prompts (P) sec descriptions
P1.2
W
hat a
re th
e m
ain
stag
es o
f the
life
cyc
le o
f a
prod
uct?
29
It is about product design,…
...then is manufactured for more materials, which shows consumer resources like fuels, produces a mission, the products were then used and during its useful life,…
...disassemble and recycle.
P1.3
W
hat a
re s
ome
of th
e ke
y st
rate
gies
to im
prov
e th
e en
viro
nmen
tal
perfo
rman
ce?
14
Fuels efficiency, also the materials that can be reuse and where they sourced from.
Table 3. (continued)
193
Eye-tracking experiment
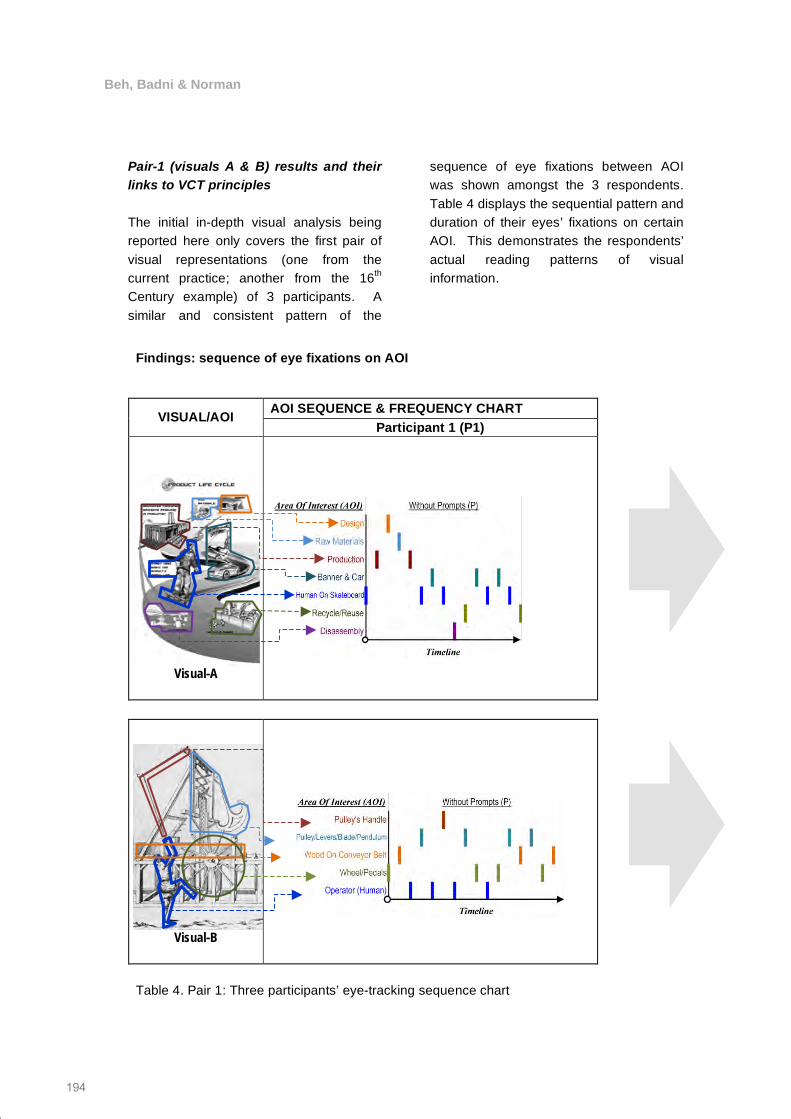
Pair-1 (visuals A & B) results and their links to VCT principles The initial in-depth visual analysis being reported here only covers the first pair of visual representations (one from the current practice; another from the 16th Century example) of 3 participants. A similar and consistent pattern of the
sequence of eye fixations between AOI was shown amongst the 3 respondents. Table 4 displays the sequential pattern and duration of their eyes’ fixations on certain AOI. This demonstrates the respondents’ actual reading patterns of visual information.
Findings: sequence of eye fixations on AOI
AOI SEQUENCE & FREQUENCY CHART VISUAL/AOI Participant 1 (P1)
Visual-A
Visual-B
Table 4. Pair 1: Three participants’ eye-tracking sequence chart
Findings: sequence of eye fixations on AOI
194
Beh, Badni & Norman
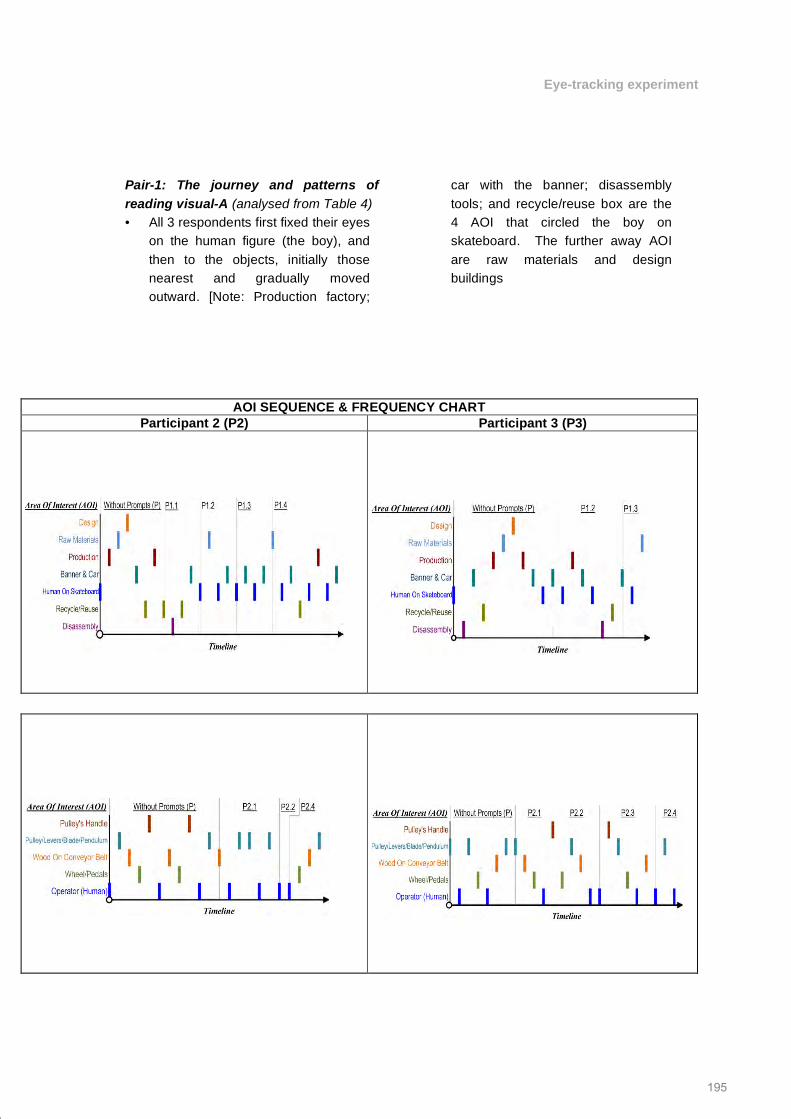
Pair-1: The journey and patterns of reading visual-A (analysed from Table 4) • All 3 respondents first fixed their eyes
on the human figure (the boy), and then to the objects, initially those nearest and gradually moved outward. [Note: Production factory;
car with the banner; disassembly tools; and recycle/reuse box are the 4 AOI that circled the boy on skateboard. The further away AOI are raw materials and design buildings
AOI SEQUENCE & FREQUENCY CHART Participant 2 (P2) Participant 3 (P3)
195
Eye-tracking experiment
• Two of them (P1 & P2) looked at the production factory right after fixing their eyes on the boy with the skateboard, following by scanning through the raw material and design buildings.
• One of them (P3) scanned through
the disassembly tools and recycle/reuse box right after fixing their eyes on the boy with the skateboard, and then briefly fixed her eye on the car and production factory, and later scanned through the raw material and design buildings.
• All 3 respondents showed significant
patterns of repeatedly looking back at the boy on the skateboard and the car with a banner when they recognised that the poster is about the life cycle of two products (referring to the respondents’ protocol transcripts, and the analysis shown in Tables 3 & 4). [Note: They were able to identify that the poster is about two products: the boy’s skateboard and the car behind the boy.]
• The scanpaths sequence chart (Table
4) depicts that the ‘Human on Skateboard’ and ‘Banner & Car’ are the most frequent AOI that all participants looked back and made reference to. [Note: This pattern suggests that the viewers were trying to make connections between the two main characters of the poster, and subsequently they were referring to other AOI/objects around these two in order to find further obvious or hidden messages.]
Pair-1: The journey and patterns of reading for Visual-B (analysed from Table 4)
• The starting point of fixations on the AOI for all 3 participants was slightly differing in Visual-2. However, all 3 of them recognised that the key visual elements of this illustration (Visual-B) are about the machine and its operation. Thus, they either looked first at the machine or the human figure (the operator). [Note: The main visual elements of this illustration are the machine and the operator; however, the researcher divided the AOI based on several key devices of the machine for tracking details of the studied visual.]
• P1 began the eye fixation on the AOI
of ‘Wheel & Pedal’ (the operator’s foot is on the pedal of the machine’s wheel); P2 started with the AOI of ‘Operator/Human’; and P3 looked at the ‘Pulley/Levers/ Blade/Pendulum’ as the first AOI (the operator’s hand is pulling the handle that links to the pulley which operates the levers, blade and pendulum). [Note: Although the participants did not start at the same point of the detailed AOI, they did show similar patterns of making comparison and connections to those shown for Visual-A. The scanpaths showed them looking for links between the human and objects (parts of the machine in Visual-B). Initially those AOI nearest to the human were scanned and then the participants gradually moved outwards, as the device parts they looked at first were those connected to either the operator’s hand or foot.]
196
Beh, Badni & Norman
• The AOI of ‘Operator’ and ‘Pulley/Levers/Blade/Pendulum’ were the most frequent AOI that all participants looked back and made reference to (sequence chart of Visual-B, Table 4), second frequent AOI was ‘Wheel & Pedal’. [Note: These AOI are immediately linked to the operator.]
The comparison of the similarities for pair-1 (visuals A & B) The interpretation at this section is based on Tables 5, 6 and 7. Tables 5 and 6 illustrate the messages perceived by the 3 participants, either from what they have understood or interpreted, in relation to the AOI from their scanpaths. Table 7 shows the 5 participants’ understanding/ interpretation of the messages with the time of the descriptions within the protocol. The data were drawn from the protocol transcripts.
All 5 respondents (3 with full records of visual recordings and analyses, and protocol transcripts; 2 with only raw visual sources and protocol transcripts) agreed that both visuals tell the story of product(s) and their associated technologies or processes (Table 7). Three of them (non-engineering background) emphasised that both visuals use human depictions as a reference to provide messages about the
product(s) depicted, e.g. reference to some sort of dimensions, processes involved and/or functions of the products in relation to the environment o r technology around them (Tables 5 – 7). Overall, the representations were reported as providing perspectives of messages or stories relating to the content of the visual information; where the human becomes the centre point for the readers to connect and explore relationships to the surrounding AOI. Thus, the human figure provides a starting or reference point for the readers. Pair-2 (visuals C & D) results and their links to VCT principles An in-depth visual analysis (as of what the viewers actually ‘see’) for 3 respondents as in pair-1 analysis has not yet been completed. However, this section will report the findings of 5 participants, based on their protocol transcripts (as of what they ‘said’ and ‘understood’) of visuals C and D (refer to Tables 1 or 2), and simple observation from the raw data of eye-tracking. Similar and consistent patterns of searching for a form of matrix were demonstrated amongst the 5 respondents.
197
Eye-tracking experiment
Understood/interpreted message No. AOI
Participant 1 (P1) P2 P3 All 3 participants pointed out that they were 1st looking at the person/boy and recognised that he was on a skateboard.
1.
Participants 1 and 3 recognised the skateboard as one of the product designs described; linked its longer life cycle compared to the car (when linked to AOI ‘Car’); and it is better for the environment during use and later for recycling (linked to AOI ‘Recycle/Reuse’).
Participant 2 compared the skateboard and the car in term of the distance and energy used to travel.
Participants 1 and 3 recognised the skateboard as one of the product designs described; linked its longer life cycle compared to the car (when linked to AOI ‘Car’); and it is better for the environment during use and later for recycling (linked to AOI ‘Recycle/Reuse’).
2.
All 3 participants recognised this AOI as a production place; where all the raw materials, disassembly and recycle/reuse of the materials took place (when linked to AOI ‘Raw Materials’; ‘Disassembly’; ‘Recycle/Reuse’).
All 3 participants linked these AOIs to the design and production of better resources for the products’ useful lives or their life cycles.
3.
Participants 1 and 3 recognised this AOI as a design centre/school.
Participant 2 recognised this AOI as a modern building and implying future direction/strategy for renewable materials or energy.
Participants 1 and 3 recognised the AOI as a design centre/school.
4.
All 3 participants recognised that the 2 main AOIs provide the message about the life cycle of the 2 products; and renewable/reusable materials (when linked to the AOI ‘Raw Materials’).
5.
Participants 2 and 3 linked these AOIs as a message concerning the source of reusable materials, fuels or energy efficiency.
Table 5. Sequence of key connections in the scanpaths for visual-A (3 participants) Table 5. Sequence of key connections in the scanpaths for visual-A (3 participants)
198
Beh, Badni & Norman
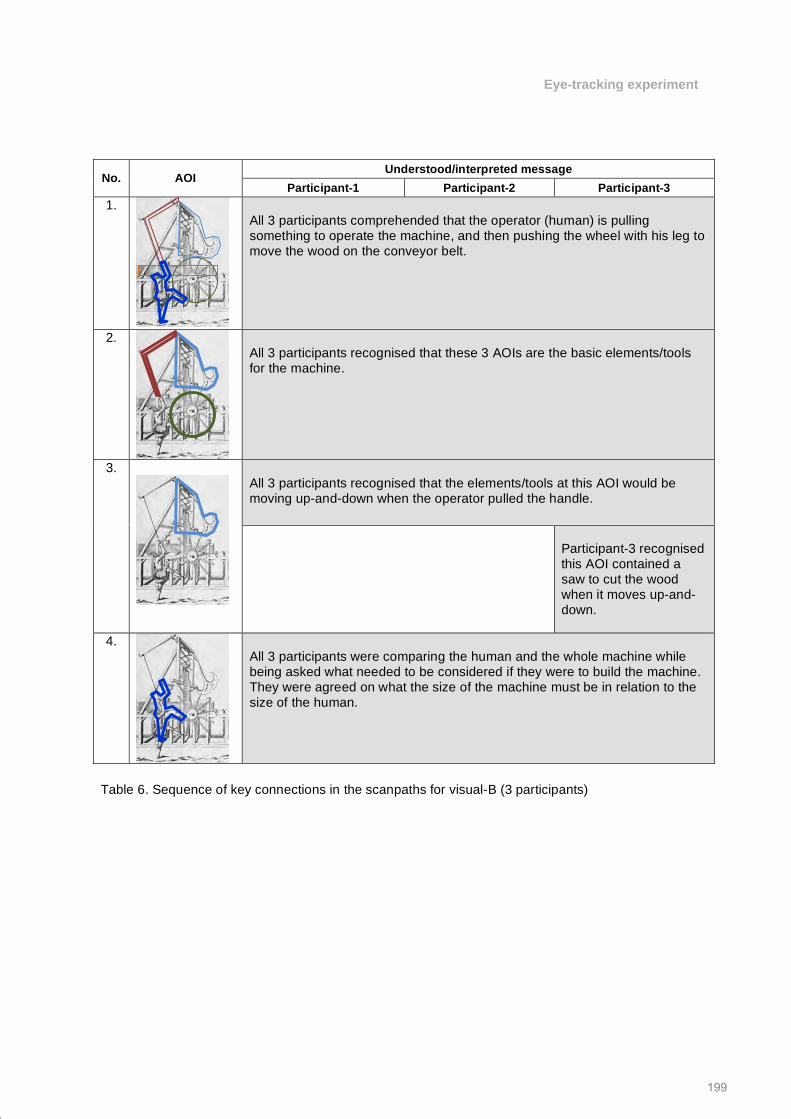
Understood/interpreted message No. AOI
Participant-1 Participant-2 Participant-3 1.
All 3 participants comprehended that the operator (human) is pulling something to operate the machine, and then pushing the wheel with his leg to move the wood on the conveyor belt.
2.
All 3 participants recognised that these 3 AOIs are the basic elements/tools for the machine.
All 3 participants recognised that the elements/tools at this AOI would be moving up-and-down when the operator pulled the handle.
3.
Participant-3 recognised this AOI contained a saw to cut the wood when it moves up-and-down.
4.
All 3 participants were comparing the human and the whole machine while being asked what needed to be considered if they were to build the machine. They were agreed on what the size of the machine must be in relation to the size of the human.
Table 6. Sequence of key connections in the scanpaths for visual-B (3 participants)
199
Eye-tracking experiment
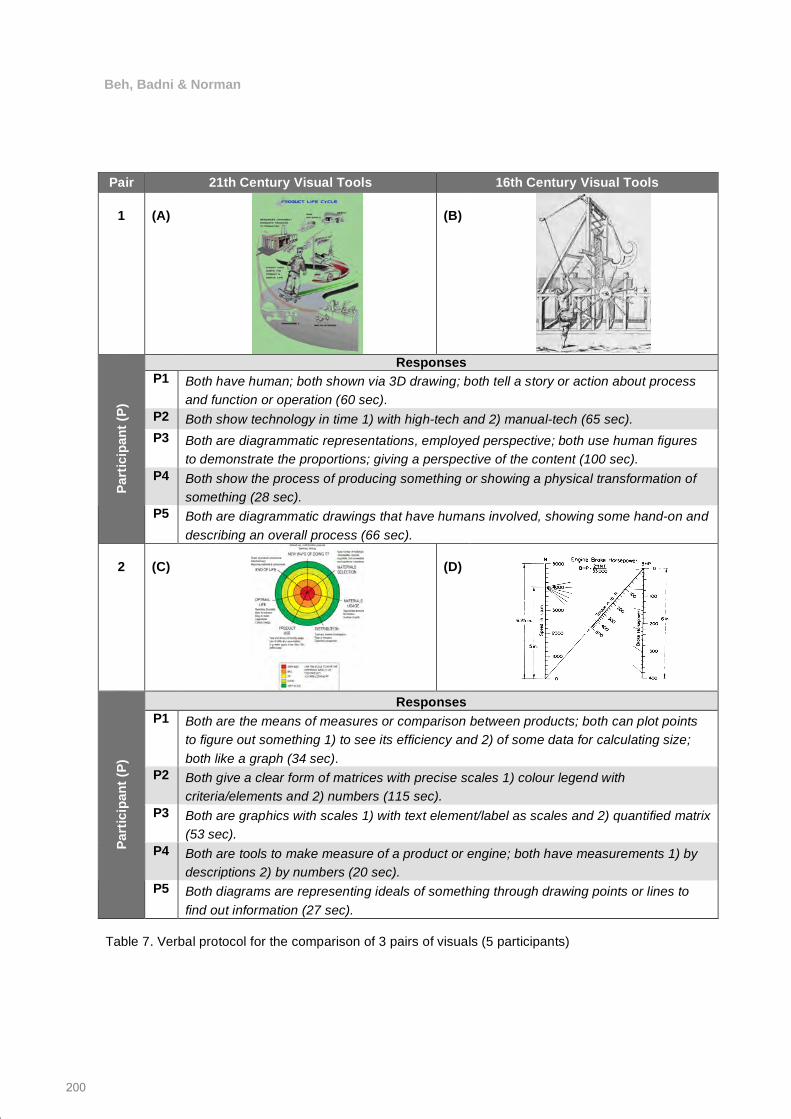
Pair 21th Century Visual Tools 16th Century Visual Tools
1
(A)
(B)
Responses
P1 Both have human; both shown via 3D drawing; both tell a story or action about process and function or operation (60 sec).
P2 Both show technology in time 1) with high-tech and 2) manual-tech (65 sec). P3 Both are diagrammatic representations, employed perspective; both use human figures
to demonstrate the proportions; giving a perspective of the content (100 sec). P4 Both show the process of producing something or showing a physical transformation of
something (28 sec). Part
icip
ant (
P)
P5 Both are diagrammatic drawings that have humans involved, showing some hand-on and describing an overall process (66 sec).
2
(C)
(D)
Responses P1 Both are the means of measures or comparison between products; both can plot points
to figure out something 1) to see its efficiency and 2) of some data for calculating size; both like a graph (34 sec).
P2 Both give a clear form of matrices with precise scales 1) colour legend with criteria/elements and 2) numbers (115 sec).
P3 Both are graphics with scales 1) with text element/label as scales and 2) quantified matrix (53 sec).
P4 Both are tools to make measure of a product or engine; both have measurements 1) by descriptions 2) by numbers (20 sec).
Part
icip
ant (
P)
P5 Both diagrams are representing ideals of something through drawing points or lines to find out information (27 sec).
Table 7. Verbal protocol for the comparison of 3 pairs of visuals (5 participants)
200
Beh, Badni & Norman
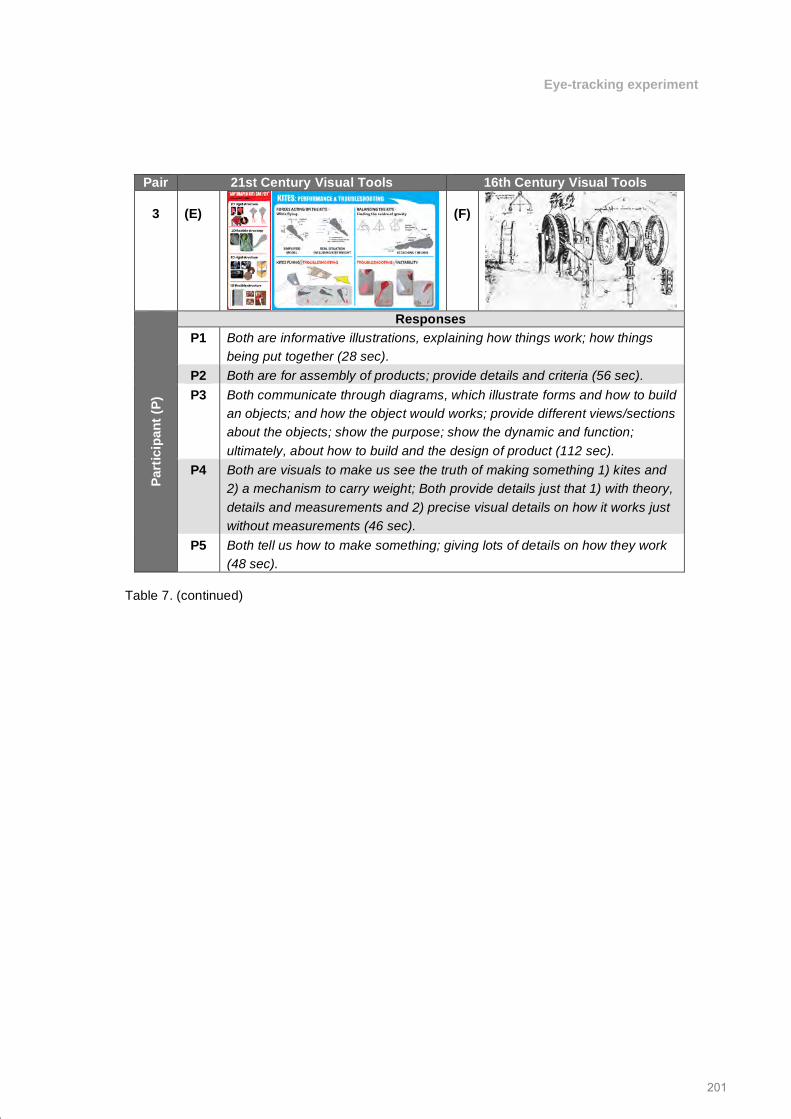
Pair 21st Century Visual Tools 16th Century Visual Tools 3
(E)
(F)
Responses
P1 Both are informative illustrations, explaining how things work; how things being put together (28 sec).
P2 Both are for assembly of products; provide details and criteria (56 sec). P3 Both communicate through diagrams, which illustrate forms and how to build
an objects; and how the object would works; provide different views/sections about the objects; show the purpose; show the dynamic and function; ultimately, about how to build and the design of product (112 sec).
P4 Both are visuals to make us see the truth of making something 1) kites and 2) a mechanism to carry weight; Both provide details just that 1) with theory, details and measurements and 2) precise visual details on how it works just without measurements (46 sec).
Part
icip
ant (
P)
P5 Both tell us how to make something; giving lots of details on how they work (48 sec).
Table 7. (continued)
201
Eye-tracking experiment
The comparison of the similarities for pair-1 (visuals A & B) The interpretation at this section is based on Tables 5, 6 and 7. Tables 5 and 6 illustrate the messages perceived by the 3 participants, either from what they have understood or interpreted, in relation to the AOI from their scanpaths. Table 7 shows the 5 participants’ understanding/ interpretation of the messages with the time of the descriptions within the protocol. The data were drawn from the protocol transcripts.
All 5 respondents (3 with full records of visual recordings and analyses, and protocol transcripts; 2 with only raw visual sources and protocol transcripts) agreed that both visuals tell the story of product(s) and their associated technologies or processes (Table 7). Three of them (non-engineering background) emphasised that both visuals use human depictions as a reference to provide messages about the product(s) depicted, e.g. reference to some sort of dimensions, processes involved and/or functions of the products in relation to the environment or technology around them (Tables 5 – 7). Overall, the representations were reported as providing perspectives of messages or stories relating to the content of the visual information; where the human becomes the centre point for the readers to connect and explore relationships to the surrounding AOI. Thus, the human figure provides a starting or reference point for the readers. Pair-2 (visuals C & D) results and their links to VCT principles An in-depth visual analysis (as of what the viewers actually ‘see’) for 3 respondents as in pair-1 analysis has not yet been completed. However, this section will report the findings of 5 participants, based on their protocol transcripts (as of what they ‘said’ and ‘understood’) of visuals C
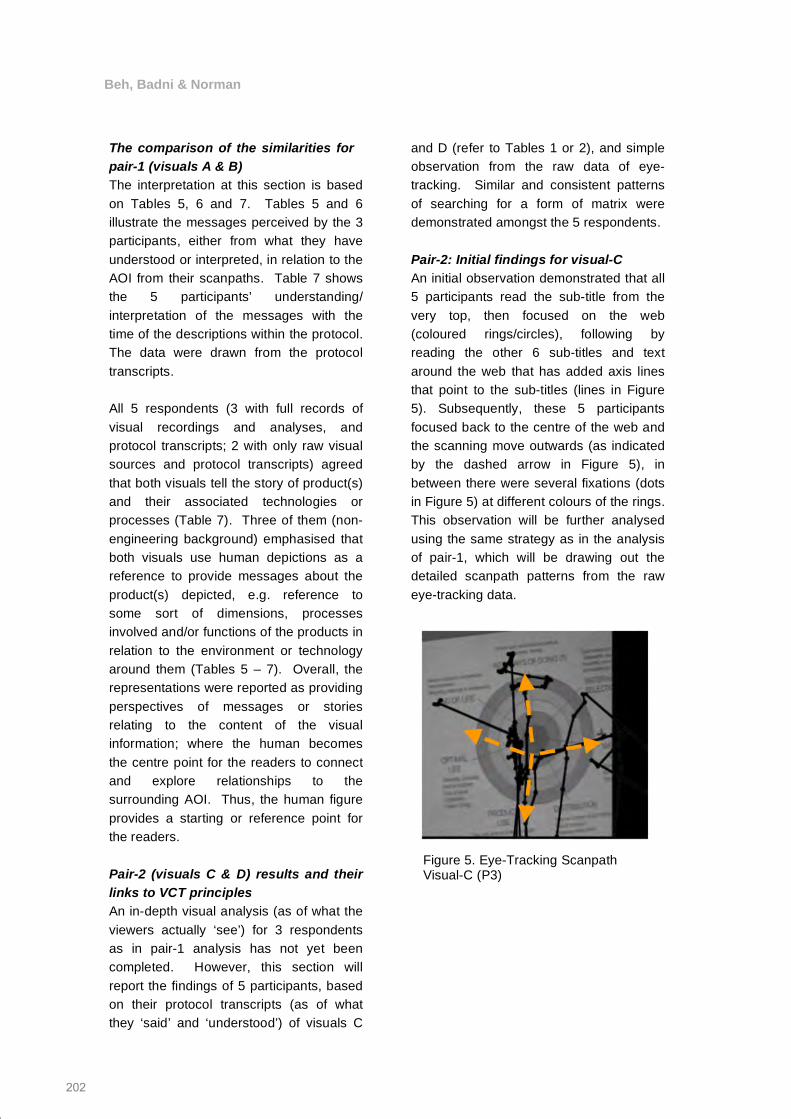
and D (refer to Tables 1 or 2), and simple observation from the raw data of eye-tracking. Similar and consistent patterns of searching for a form of matrix were demonstrated amongst the 5 respondents. Pair-2: Initial findings for visual-C An initial observation demonstrated that all 5 participants read the sub-title from the very top, then focused on the web (coloured rings/circles), following by reading the other 6 sub-titles and text around the web that has added axis lines that point to the sub-titles (lines in Figure 5). Subsequently, these 5 participants focused back to the centre of the web and the scanning move outwards (as indicated by the dashed arrow in Figure 5), in between there were several fixations (dots in Figure 5) at different colours of the rings. This observation will be further analysed using the same strategy as in the analysis of pair-1, which will be drawing out the detailed scanpath patterns from the raw eye-tracking data.
Figure 5. Eye-Tracking Scanpath Visual-C (P3)
202
Beh, Badni & Norman
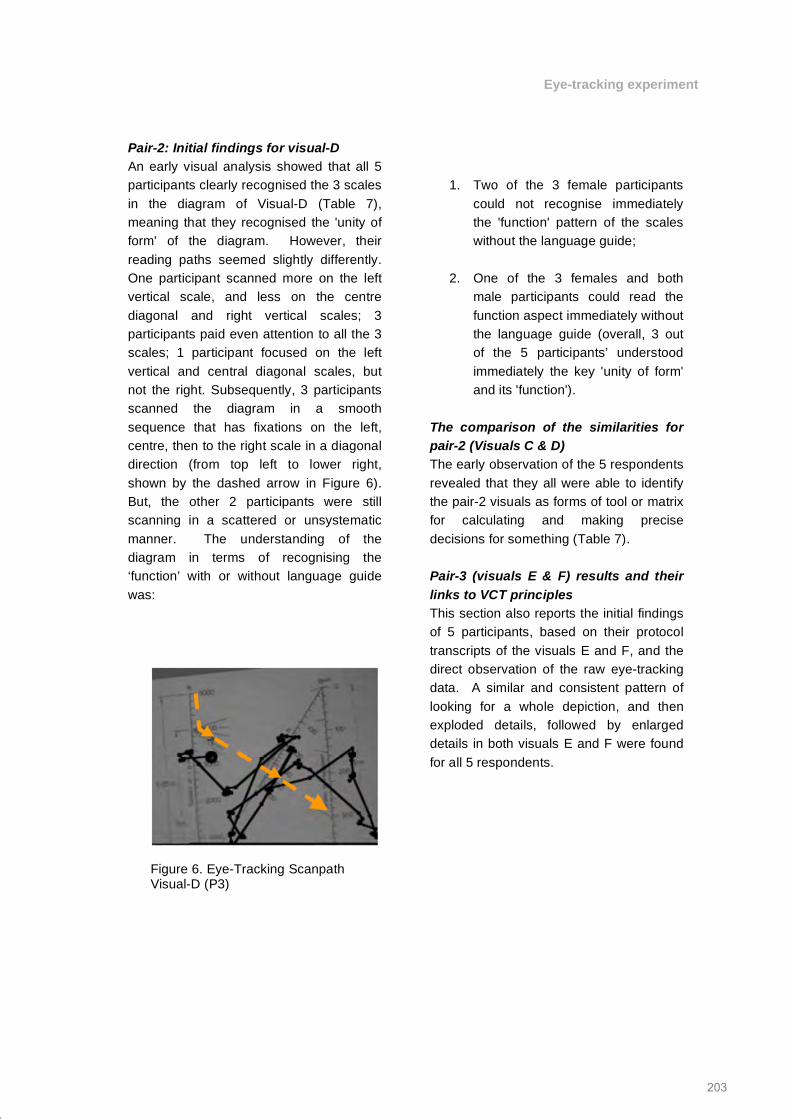
Pair-2: Initial findings for visual-D An early visual analysis showed that all 5 participants clearly recognised the 3 scales in the diagram of Visual-D (Table 7), meaning that they recognised the 'unity of form' of the diagram. However, their reading paths seemed slightly differently. One participant scanned more on the left vertical scale, and less on the centre diagonal and right vertical scales; 3 participants paid even attention to all the 3 scales; 1 participant focused on the left vertical and central diagonal scales, but not the right. Subsequently, 3 participants scanned the diagram in a smooth sequence that has fixations on the left, centre, then to the right scale in a diagonal direction (from top left to lower right, shown by the dashed arrow in Figure 6). But, the other 2 participants were still scanning in a scattered or unsystematic manner. The understanding of the diagram in terms of recognising the ‘function’ with or without language guide was:
1. Two of the 3 female participants could not recognise immediately the 'function' pattern of the scales without the language guide;
2. One of the 3 females and both
male participants could read the function aspect immediately without the language guide (overall, 3 out of the 5 participants’ understood immediately the key 'unity of form' and its 'function').
The comparison of the similarities for pair-2 (Visuals C & D) The early observation of the 5 respondents revealed that they all were able to identify the pair-2 visuals as forms of tool or matrix for calculating and making precise decisions for something (Table 7). Pair-3 (visuals E & F) results and their links to VCT principles This section also reports the initial findings of 5 participants, based on their protocol transcripts of the visuals E and F, and the direct observation of the raw eye-tracking data. A similar and consistent pattern of looking for a whole depiction, and then exploded details, followed by enlarged details in both visuals E and F were found for all 5 respondents.
Figure 6. Eye-Tracking Scanpath Visual-D (P3)
203
Eye-tracking experiment
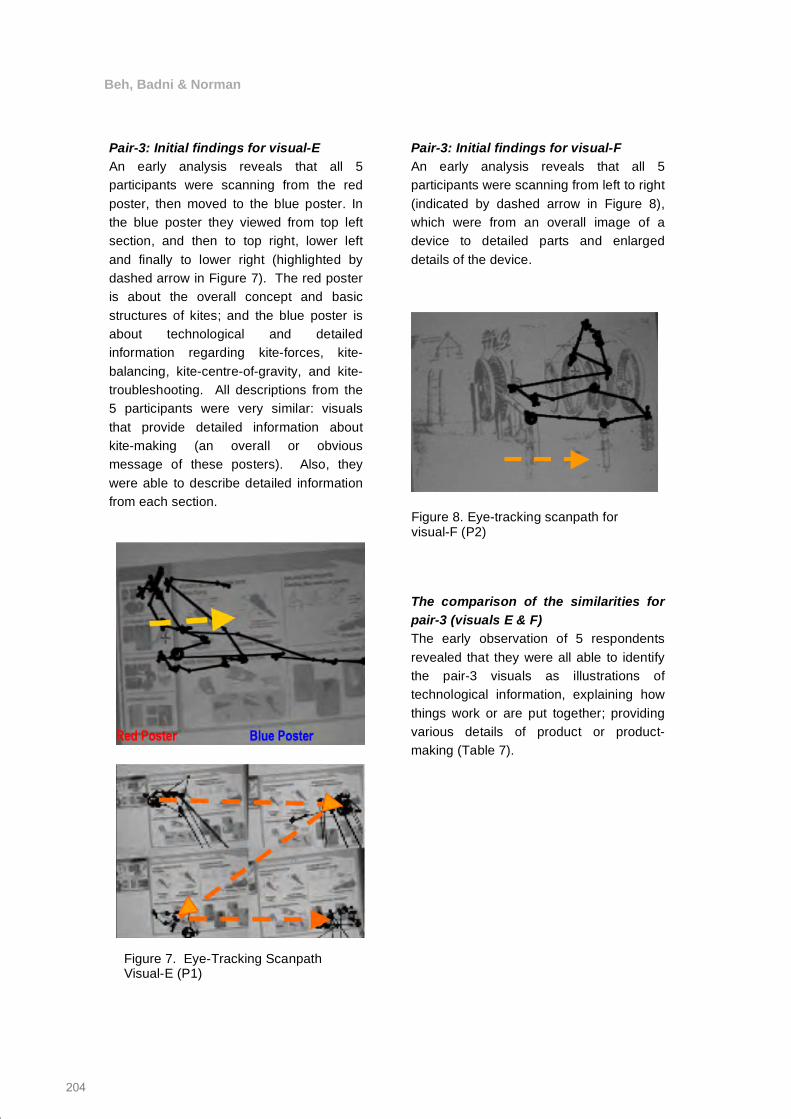
Pair-3: Initial findings for visual-E An early analysis reveals that all 5 participants were scanning from the red poster, then moved to the blue poster. In the blue poster they viewed from top left section, and then to top right, lower left and finally to lower right (highlighted by dashed arrow in Figure 7). The red poster is about the overall concept and basic structures of kites; and the blue poster is about technological and detailed information regarding kite-forces, kite-balancing, kite-centre-of-gravity, and kite-troubleshooting. All descriptions from the 5 participants were very similar: visuals that provide detailed information about kite-making (an overall or obvious message of these posters). Also, they were able to describe detailed information from each section.
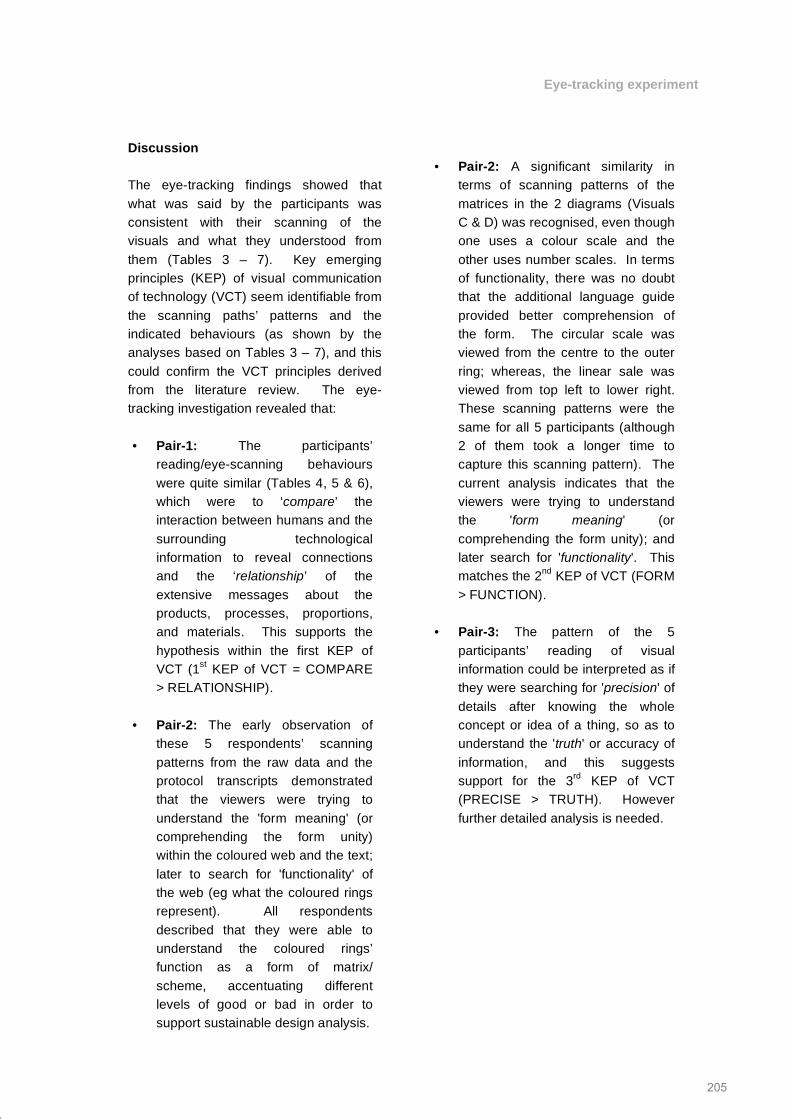
Pair-3: Initial findings for visual-F An early analysis reveals that all 5 participants were scanning from left to right (indicated by dashed arrow in Figure 8), which were from an overall image of a device to detailed parts and enlarged details of the device.
The comparison of the similarities for pair-3 (visuals E & F) The early observation of 5 respondents revealed that they were all able to identify the pair-3 visuals as illustrations of technological information, explaining how things work or are put together; providing various details of product or product-making (Table 7).
Figure 8. Eye-tracking scanpath for visual-F (P2)
Figure 7. Eye-Tracking Scanpath Visual-E (P1)
204
Beh, Badni & Norman
Discussion The eye-tracking findings showed that what was said by the participants was consistent with their scanning of the visuals and what they understood from them (Tables 3 – 7). Key emerging principles (KEP) of visual communication of technology (VCT) seem identifiable from the scanning paths’ patterns and the indicated behaviours (as shown by the analyses based on Tables 3 – 7), and this could confirm the VCT principles derived from the literature review. The eye-tracking investigation revealed that: • Pair-1: The participants’
reading/eye-scanning behaviours were quite similar (Tables 4, 5 & 6), which were to ‘compare’ the interaction between humans and the surrounding technological information to reveal connections and the ‘relationship’ of the extensive messages about the products, processes, proportions, and materials. This supports the hypothesis within the first KEP of VCT (1st KEP of VCT = COMPARE > RELATIONSHIP).
• Pair-2: The early observation of these 5 respondents’ scanning patterns from the raw data and the protocol transcripts demonstrated that the viewers were trying to understand the 'form meaning' (or comprehending the form unity) within the coloured web and the text; later to search for 'functionality' of the web (eg what the coloured rings represent). All respondents described that they were able to understand the coloured rings’ function as a form of matrix/ scheme, accentuating different levels of good or bad in order to support sustainable design analysis.
• Pair-2: A significant similarity in
terms of scanning patterns of the matrices in the 2 diagrams (Visuals C & D) was recognised, even though one uses a colour scale and the other uses number scales. In terms of functionality, there was no doubt that the additional language guide provided better comprehension of the form. The circular scale was viewed from the centre to the outer ring; whereas, the linear sale was viewed from top left to lower right. These scanning patterns were the same for all 5 participants (although 2 of them took a longer time to capture this scanning pattern). The current analysis indicates that the viewers were trying to understand the 'form meaning' (or comprehending the form unity); and later search for 'functionality'. This matches the 2nd KEP of VCT (FORM > FUNCTION).
• Pair-3: The pattern of the 5 participants’ reading of visual information could be interpreted as if they were searching for 'precision' of details after knowing the whole concept or idea of a thing, so as to understand the 'truth' or accuracy of information, and this suggests support for the 3rd KEP of VCT (PRECISE > TRUTH). However further detailed analysis is needed.
Eye-tracking experiment
205
Eye-tracking experiment
Conclusion • The eye-tracking pilot experiment
showed that the data collection methodology works, and provided intriguing quantitative and qualitative data for analysis.
• The initial eye-tracking results provided significant patterns that were relevant to the validation of the key emerging VCT principles established from the literature review.
• The experimental results also provided some further explanation concerning the evidence of some effective impacts of visual communication concluded in the earlier case studies (Storer, 2005; Beh & Norman, 2009) for the 3 current visual samples and the 3 historical examples of good practice in the VCT.
• The statistical data needs further analysis in order to establish whether it can fully support what has been asserted and found in literature, evidence obtained from the case studies, and the visual analysis from the eye-tracking experiment.
References Area of Design. (2002) (http://www.areaofdesign.com/americanicons/rand.htm, 12/08/10). Published in Areaofdesign.com Ashby, M. & Johnson, K. (2004) Materials and design: the art and science of material selection in product design. Oxford:Butterworth-Heinemann. Burlington, MA Ashby, M. (2005) Materials selection in mechanical design, 3rd ed. Oxford: Butterworth-Heinemann. Burlington, MA Baynes, K. (2009) ‘Models of change: The impact of designerly thinking on people’s lives and the environment’. Seminar 1: Modelling and intelligence. Design: Occasional Paper No 3. Loughborough, LE: Loughborough University Baynes, K., & Pugh, F. (1981) The art of the engineer. Guildford, UK: Lund Humphries Publishers Ltd
Beh, C. S. & Norman, E.W.L. (2010) ‘Visual communication of technology for designing and its links to creativity and innovation’, D&T Association Education and International Research Conference 2010: Ideas Worth Sharing, Keele University, July 2010 Beh, C. S., Badni, K. & Norman, E.W.L. (2010) ‘Key emerging principles of the visual communication of technology’, International Visual Literacy Association (IVLA) Conference: Visual Literacy in 21st Century: Trends, Demands and Capacities, Cyprus 2010, September-October 2010 Beh, C. S., & Norman, E.W.L. (2009) ’Visual communication of technology: Its impact on the teaching and learning, creativity and innovation in industrial and engineering design’. Proceedings from D&T - A Platform for Success: The Design and Technology Association Education and International Research Conference. In E.W.L. Norman & D. Spendlove (eds.). Wellesbourne, UK: The Design and Technology Association, 111
206
Beh, Badni & Norman
Carlson, W. B., & Gorman, M. E. (1992) ‘A cognitive framework to understand technological creativity: Bell, Edison, and the telephone’. In R. J. Weber & D. N. Perkin (eds.). Inventive Minds: Creativity in technology. New York, NY: Oxford University Press, 48-79 Clark, H. (1916) ‘Visual imagery and attention: an analytical study’. American Journal of Psychology, 27(4), 461-492 Codone, S. (2005) ‘A study of visual literacy in technical communication texbooks: A work in progress’. Proceedings from IEEE International Professional Communication Conference. GA: Mercer University, 759-763 Curtiss, D. (1987) Introduction to visual literacy. Englewood Cliffs, N.J: Prentice Hall Eyetracker. (2010) (http://www.eyetracker.co.uk/?gclid=CJ7pkteOkaUCFQ_-2AodgGrqOw, 08/11/10). Published by EyeTracker Ltd Ferguson, E. S. (1993). Engineering and the mind's eye. The MIT Press, Cambridge, Massachusetts/London, England Finke, R. A., Ward, T. B. & Smith, S. M. (1992). Creative cognition. MIT Press, MA Finke, R. A. (1989). Principles of mental imagery. MIT Press, Cambridge MA Finke, R. A. & Slyton, K. (1988) ‘Explorations of Creative Visual Synthesis in Mental Imegery’, Memory and Cognition 16, 252-257 Fischer, P. M., Richards, J. W., Berman, E. J., Krugman, M. Recall and eye tracking study of adolescents viewing tobacco advertisements. www.jama.com (24/05/2010) JAMA, Jan 1989; 261: 84 – 89 Goldthwait, C. (1933) ‘Relation of eye movements to visual imagery’. American Journal of Psychology
IQ²Global. (2010) (http://www.intelligencesquared.com/people/t/edward-tufte,12/08/10). Published in Intellingcesequared.com Jacob, J. K., Karn, K. S. (2003) ‘Eye tracking in human-computer interaction and usability research: ready to deliver the promises’. The Mind’s Eye: Cognitive and Applied Aspects of Eye Movement Research. Commentary on Section 4. Hyona, Radach & Deubel (eds.) Oxford, England. ISBN: 0–444–51020–6 Josephson, S. (2000) Eye tracking methodology and the internet. Handbook of visual communication: theory, methods, and media (Smith, K. L. 2005). Lawrence Erlbaum Associates, Inc., NJ, U.S.A Levy-Schoen, A. (1983) Central and Peripheral Processing. In R. Groner, C. Menz, D. F. Fisher, and R. A. Montry (eds.), Eye movements and psychological function: international views (pp. 65 – 71). Hillsdale, NJ: Lawrence Erlbaum Associates Malach, R., Hornik, J., Bakalash, T. & Hendler, T. (2005) Preliminary research proposal: advanced neuro-imaging of commercial messages. Working Paper No. 24/2005. Research No. 02350100. Weizmann Institute of Science. Faculty of Management, The Leon Recanati Graduate School of Business Administration, Tel Aviv University, Ramat Aviv, Tel Aviv 69978, Israel Middleton, H. (2005) ‘Creative thinking, values, and Design and Technology education’. International Journal of Technology and Design Education 15: 61-71 Norman, E. W. (1998). ‘The nature of technology for design’, International Journal of Technology and Design Education 8, 67-87. Kluwer Academic Publishers. Printed in the Netherlands Perky, C. W. (1910) ‘An experimental study of imagination’. American Journal of Psychology, 21, 422-452
Eye-tracking experiment
207
Eye-tracking experiment
Rand, P. (1971) (http://www.paul-rand.com/thoughts_ graphisIntro.shtml, 24/07/09). Published in the Graphis Annual, 1971 Rand, P. (1985) Paul Rand: A Designer’s Art. Yale University Press, New Haven and London Richardson, D. C. & Spivey, M. J. (2004) ‘Part 1: Eye-tracking: characteristics and methods; Part 2: Eye-tracking: research areas and applications’. Encyclopedia of Biomaterials and Biomedical Engineering. Wnek. G. & Bowlin, G. (eds.) Russo, J. E.& Leclerc, F. ‘An eye-fixation analysis of choice processes for consumer nondurables’. Journal of Consumer Research. Sep 1994; 21, 2; ABI/INFORM Global. p. 274 Storer, I. J., Badni, K.S., Bhamra, T. and Farmer, S., ''Communicating Sustainable Design'', Design & Technology Education: An International Journal, 10(2), 2005, pp 44-57, ISSN 1360-1431
Stoy, E. G. (1930) ‘A preliminary study of ocular attitudes in thinking of spatial relations’. Journal of General Psychology
System-concept. (2010) (http://www.system-concepts.com/usability/usability-testing.html?gclid=CKCU26SOkaUCFWr92Aod1S2lMA, 08/11/10). Published in System-concepts.com
Thistlewood, D. (1990) ‘The essential disciplines of design education’. In Thistlewood (Ed), Issues in design education, Longman, Harlow, UK
Thomson, R. (1979) Principles of Graphic Communication for Engineers. Thomas Nelson and Sons Ltd
Totten, E. (1935) ‘Eye movement during visual imagery’. Comparative Psychology Monographs
Tufte, E. (1990) Envisioning information. Graphic Press, Cheshire, Connecticut, USA
Tufte, E. (1997) Visual Explanations: Images and Quantities, Evidence and Narrative. Graphic Press, Cheshire, Connecticut
Tufte, E. (2006). Beautiful Evidence. Graphic Press, Cheshire, Connecticut, USA
Weber, R. J. (1992) ‘Stone age knife to swiss army knife: An invention prototype’. In R. J. Weber & D. N. Perkin (eds.). Inventive Minds: Creativity in technology. New York, NY: Oxford University Press, 217-237
Weber, R. J., Moder, C. L. & Solie, J. B. (1990) ‘Invention Heuristics and Mental Processes Underlying the Development of a Patent for the Application of Herbicides’, New ideas in psychology 3, 321-336
Weber, R. J. & Perkins, D. N. (1989) ‘How to Invent Artefacts and Ideas’, New Ideas in Psychology 7, 49-72
208
Beh, Badni & Norman