Embed Size (px)
Citation preview

EY Health — StaT!M&A strategy and tactics
US Health Care Investment Banking team
Quarter ended December 2016

StaT! strategy observations
Health: undergoing a tectonic shift that will likely support robust M&A, both on Wall Street and Main Street
C-suite and boardroom strategic conversations continue to be robust: With a mandate to reduce costs, improve quality and coordinate care, providers and payors continue to turn to consolidation and vertical integration opportunities to build scale and control more of the care continuum. Mergers, acquisitions, joint ventures and other forms of af liation are enabling organi ations to transform care delivery systems and payment incentives while improving nancial viability and growth in the wa e of changing reimbursements. Assuming the level of boardroom and C-suite conversations is a leading indicator, strategic M A will li ely continue to be strong.
Tectonic shift caused by the Affordable Care Act, followed by a series of aftershocks: The health care landscape, having been impacted by the tectonic shift from volume to value-based payment for services inspired by the Affordable Care Act (ACA), continues to e perience aftershoc s, most recently signi ed by the Medicare Access and C eauthori ation Act and uality ayment rogram. This particular legislation, which will li ely move physicians over time to operate in a value-based reimbursement system, is another regulatory consolidation driver, motivating constituents on both sides of the provider and payor ecosystems to transact via M&A strategies.
Election 2016 — earthquake, aftershock or afterthought?: A new administration in Washington typically brings uncertainty, and certainly, calls for “repeal and replace” amplify that concern. While the policies advanced by the president-elect and Republican-controlled Congress remain to be seen, providers and payors will li ely continue to self-determine their roles in achieving the goals inspired by the ACA, and consumers will increasingly demand access to quality and cost-effective care. The speci cs of legislation aside, the reality of the current and trending macroeconomic and demographics pro les demands that the mar et deliver on value.
Recent M&A integration will likely create fallout (and opportunity): We anticipate an increase in corporate divestitures and carve-outs, driven by multiple factors, including post-M&A integration outcomes, strategy shifts, resource and capital reallocations and balance sheet needs. n today s mar et, what may be non-core for sellers often nds a broad audience of buyers.
care ecosystem: Private equity (PE) interest in health care continues to be robust, with PE often bringing signi cant strategic angles and relationships to bear in aligning with new portfolio companies. PE continues to be a robust and nimble competitor to strategic acquirers, bringing strategy, opportunity and value where others may not.
Global changes, local impact: We expect the mix of M&A activity to continue to move from Wall Street to Main Street as national M&A activity inspires local mar et changes. The imperative to drive clinical and cost ef ciencies in operations and expand one s service pro le is necessary for all constituents and can be more expediently addressed through strategic transactions. M&A deal ow will li ely continue to be strong across all mar ets as all companies see to more rapidly accomplish strategic imperatives driven by the march to value-based reimbursement.
2 EY Health — StaT! M&A strategy and tactics |
StaT! tactics observations
to be particularly diligent.
Tact
ics
Financial
Valuation
Commercial
Integration
Other
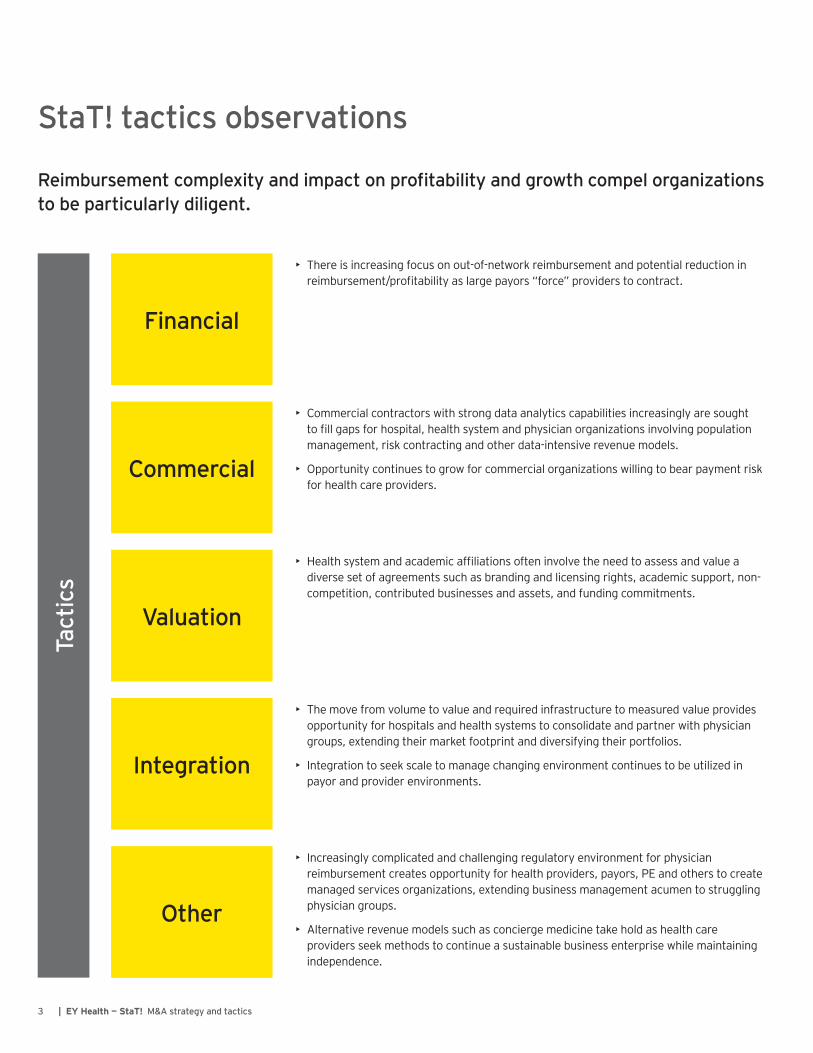
• There is increasing focus on out-of-networ reimbursement and potential reduction in reimbursement pro tability as large payors “force” providers to contract.
• Commercial contractors with strong data analytics capabilities increasingly are sought to ll gaps for hospital, health system and physician organi ations involving population management, ris contracting and other data-intensive revenue models.
• pportunity continues to grow for commercial organi ations willing to bear payment ris for health care providers.
• ealth system and academic af liations often involve the need to assess and value a diverse set of agreements such as branding and licensing rights, academic support, non-competition, contributed businesses and assets, and funding commitments.
• The move from volume to value and required infrastructure to measured value provides opportunity for hospitals and health systems to consolidate and partner with physician groups, extending their mar et footprint and diversifying their portfolios.
• ntegration to see scale to manage changing environment continues to be utili ed in payor and provider environments.
• Increasingly complicated and challenging regulatory environment for physician reimbursement creates opportunity for health providers, payors, PE and others to create managed services organi ations, extending business management acumen to struggling physician groups.
• Alternative revenue models such as concierge medicine ta e hold as health care providers see methods to continue a sustainable business enterprise while maintaining independence.
3 | EY Health — StaT! M&A strategy and tactics
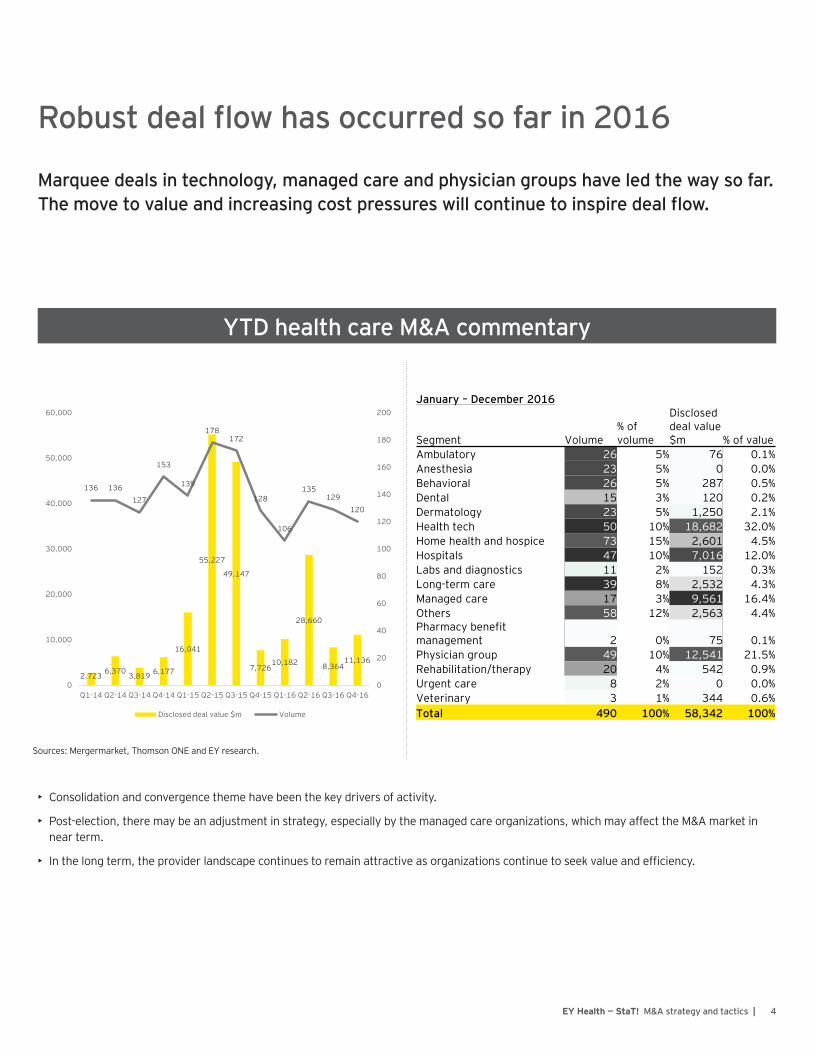
Marquee deals in technology, managed care and physician groups have led the way so far.
YTD health care M&A commentary
• Consolidation and convergence theme have been the ey drivers of activity.
• Post-election, there may be an adjustment in strategy, especially by the managed care organi ations, which may affect the M&A mar et in near term.
• In the long term, the provider landscape continues to remain attractive as organi ations continue to see value and ef ciency.
2,723 6,370 3,819 6,177
16,041
55,227
49,147
7,72610,182
28,660
8,36411,136
136 136127
153
139
178172
128
106
135129
120
0
20
40
60
80
100
120
140
160
180
200
0
10,000
20,000
30,000
40,000
50,000
60,000
1-14 2-14 3-14 4-14 1-15 2-15 3-15 4-15 1-16 2-16 3-16 4-16
Disclosed deal value $m Volume
January – December 2016
Segment Volume% of volume
Disclosed deal value $m % of value
Ambulatory 26 5% 76 0.1%Anesthesia 23 5% 0 0.0%Behavioral 26 5% 287 0.5%Dental 15 3% 120 0.2%Dermatology 23 5% 1,250 2.1%Health tech 50 10% 18,682 32.0%Home health and hospice 73 15% 2,601 4.5%Hospitals 47 10% 7,016 12.0%Labs and diagnostics 11 2% 152 0.3%Long-term care 39 8% 2,532 4.3%Managed care 17 3% 9,561 16.4%Others 58 12% 2,563 4.4%Pharmacy benefit management 2 0% 75 0.1%Physician group 49 10% 12,541 21.5%Rehabilitation/therapy 20 4% 542 0.9%Urgent care 8 2% 0 0.0%Veterinary 3 1% 344 0.6%Total 490 100% 58,342 100%
Sources Mergermar et, Thomson O E and E research.
4 EY Health — StaT! M&A strategy and tactics |
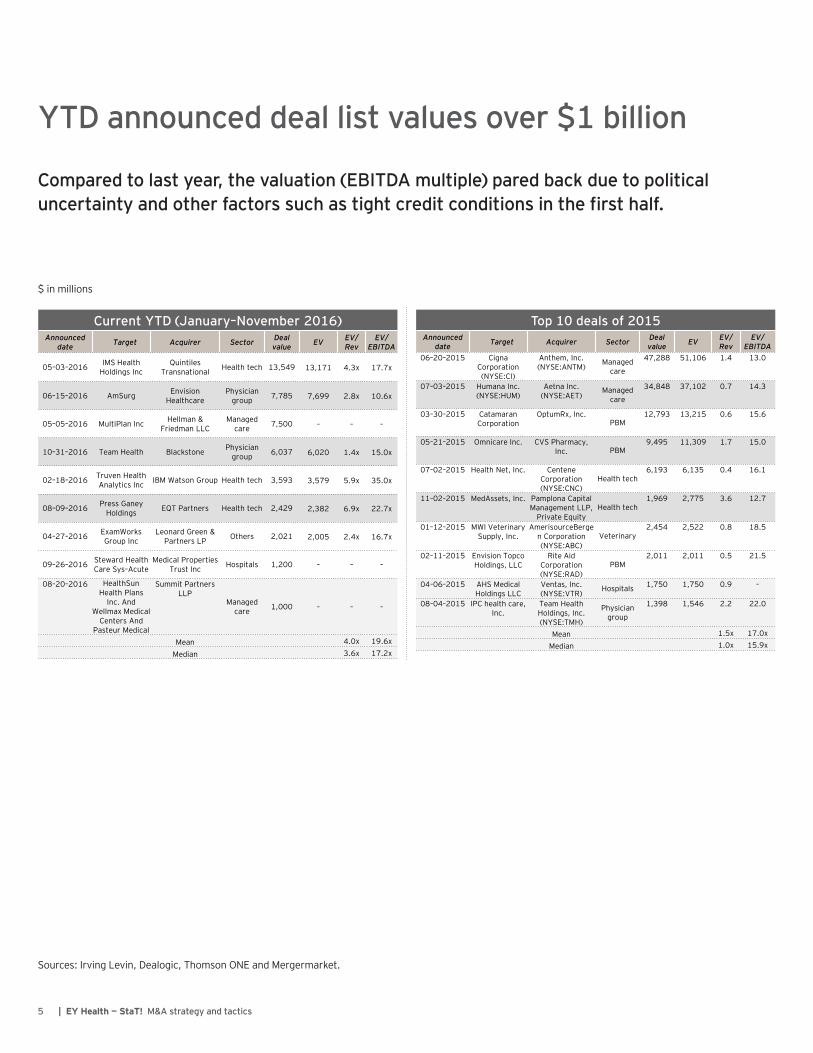
Compared to last year, the valuation (EBITDA multiple) pared back due to political
$ in millions
Sources Irving Levin, Dealogic, Thomson O E and Mergermar et.
Current YTD (January–November 2016)Announced
date Target Acquirer Sector Deal value EV EV/
RevEV/
EBITDA
05–03–2016 IMS Health Holdings Inc
uintiles Transnational Health tech 13,549 13,171 4.3x 17.7x
06–15–2016 AmSurg Envision Healthcare
Physician group 7,785 7,699 2.8x 10.6x
05–05–2016 MultiPlan Inc Hellman & Friedman LLC
Managedcare 7,500 – – –
10–31–2016 Team Health Blac stone Physician group 6,037 6,020 1.4x 15.0x
02–18–2016 Truven Health Analytics Inc IBM Watson Group Health tech 3,593 3,579 5.9x 35.0x
08–09–2016 Press Ganey Holdings E T Partners Health tech 2,429 2,382 6.9x 22.7x
04–27–2016 ExamWor s Group Inc
Leonard Green & Partners LP Others 2,021 2,005 2.4x 16.7x
09–26–2016 Steward Health Care Sys–Acute
Medical PropertiesTrust Inc Hospitals 1,200 – – –
08–20–2016 HealthSun Health Plans
Inc. And Wellmax Medical
Centers And Pasteur Medical
Summit Partners LLP
Managed care 1,000 – – –
Mean 4.0x 19.6x
Median 3.6x 17.2x
Top 10 deals of 2015Announced
date Target Acquirer Sector Deal value EV EV/
RevEV/
EBITDA06–20–2015 Cigna
Corporation ( SE CI)
Anthem, Inc. ( SE A TM)
Managed care
47,288 51,106 1.4 13.0
07–03–2015 Humana Inc. ( SE HUM)
Aetna Inc. ( SE AET)
Managed care
34,848 37,102 0.7 14.3
03–30–2015 Catamaran Corporation
OptumRx, Inc.PBM
12,793 13,215 0.6 15.6
05–21–2015 Omnicare Inc. CVS Pharmacy, Inc. PBM
9,495 11,309 1.7 15.0
07–02–2015 Health et, Inc. Centene Corporation ( SE C C)
Health tech6,193 6,135 0.4 16.1
11–02–2015 MedAssets, Inc. Pamplona Capital Management LLP,
Private EquityHealth tech
1,969 2,775 3.6 12.7
01–12–2015 MWI Veterinary Supply, Inc.
AmerisourceBergen Corporation ( SE ABC)
Veterinary2,454 2,522 0.8 18.5
02–11–2015 Envision Topco Holdings, LLC
Rite Aid Corporation ( SE RAD)
PBM2,011 2,011 0.5 21.5
04–06–2015 AHS Medical Holdings LLC
Ventas, Inc. ( SE VTR)
Hospitals 1,750 1,750 0.9 –
08–04–2015 IPC health care, Inc.
Team Health Holdings, Inc. ( SE TMH)
Physician group
1,398 1,546 2.2 22.0
Mean 1.5x 17.0x
Median 1.0x 15.9x
5 | EY Health — StaT! M&A strategy and tactics
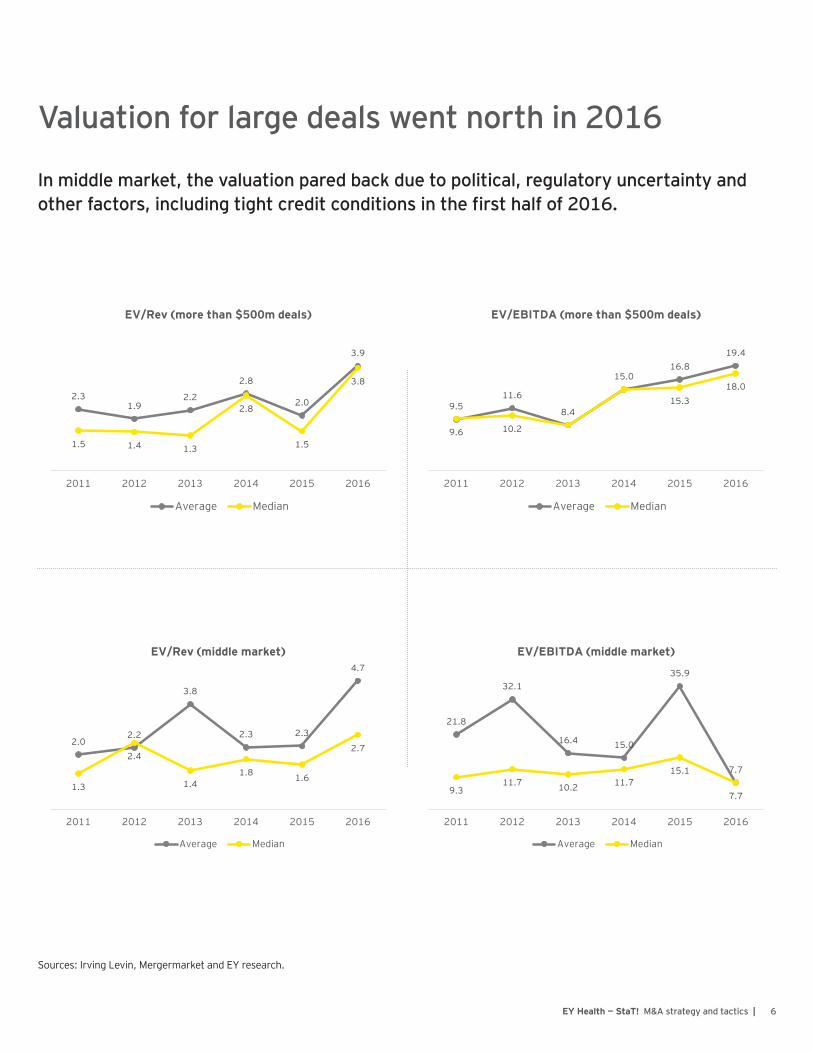
In middle market, the valuation pared back due to political, regulatory uncertainty and
2.31.9
2.2
2.8
2.0
3.9
1.5 1.4 1.3
2.8
1.5
3.8
2011 2012 2013 2014 2015 2016
EV/Rev (more than $500m deals)
Average Median
2.02.2
3.8
2.3 2.3
4.7
1.3
2.4
1.41.8 1.6
2.7
2011 2012 2013 2014 2015 2016
EV/Rev (middle market)
Average Median
9.511.6
8.4
15.016.8
19.4
9.6 10.2
15.318.0
2011 2012 2013 2014 2015 2016
EV/EBITDA (more than $500m deals)
Average Median
21.8
32.1
16.4 15.0
35.9
7.7
9.311.7 10.2 11.7
15.1
7.7
2011 2012 2013 2014 2015 2016
EV/EBITDA (middle market)
Average Median
Sources Irving Levin, Mergermar et and E research.
EY Health — StaT! M&A strategy and tactics |
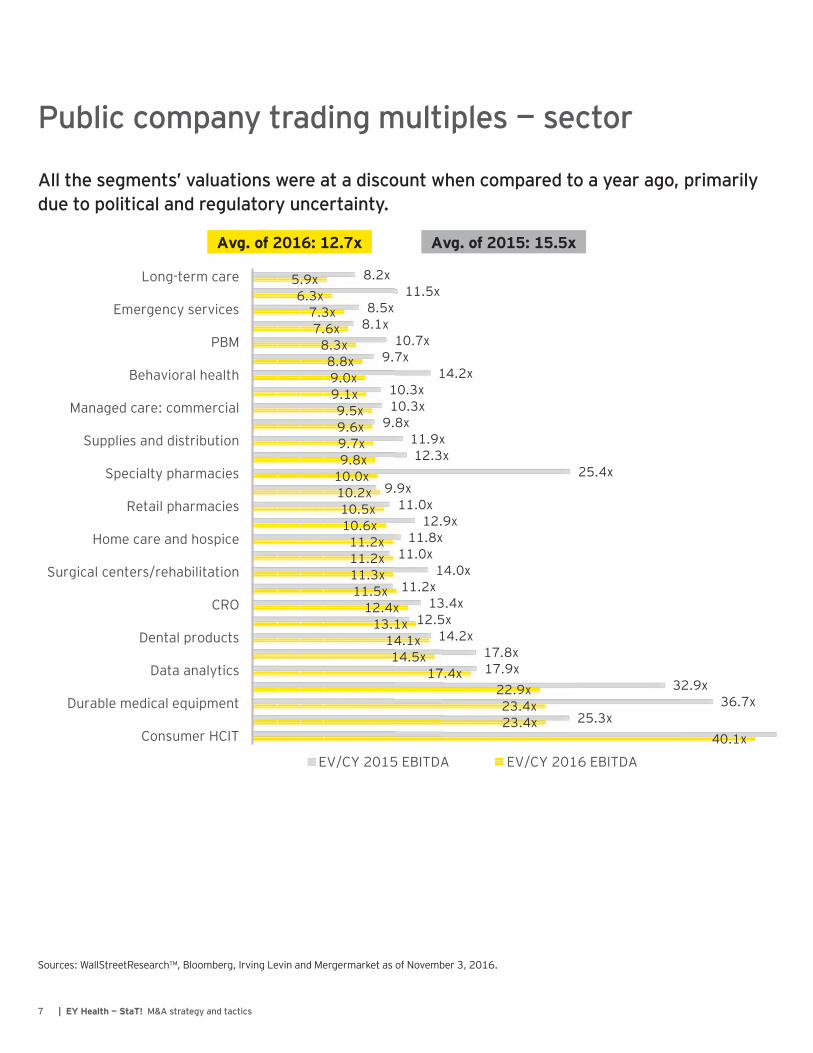
Public company trading multiples — sector
All the segments’ valuations were at a discount when compared to a year ago, primarily due to political and regulatory uncertainty.
Sources WallStreetResearch , Bloomberg, Irving Levin and Mergermar et as of ovember 3, 2016.
40.1x23.4x23.4x
22.9x17.4x
14.5x14.1x
13.1x12.4x
11.5x11.3x11.2x11.2x
10.6x10.5x
10.2x10.0x9.8x9.7x9.6x9.5x
9.1x9.0x8.8x
8.3x7.6x
7.3x6.3x
5.9x
25.3x36.7x
32.9x17.9x17.8x
14.2x12.5x
13.4x11.2x
14.0x11.0x
11.8x12.9x
11.0x9.9x
25.4x12.3x
11.9x9.8x
10.3x10.3x
14.2x9.7x
10.7x8.1x8.5x
11.5x8.2x
Consumer HCIT
Durable medical equipment
Data analytics
Dental products
CRO
Surgical centers/rehabilitation
Home care and hospice
Retail pharmacies
Specialty pharmacies
Supplies and distribution
Managed care: commercial
Behavioral health
PBM
Emergency services
Long-term care
EV/C 2015 EBITDA EV/C 2016 EBITDA
Avg. of 2016: 12.7x Avg. of 2015: 15.5x
7 | EY Health — StaT! M&A strategy and tactics
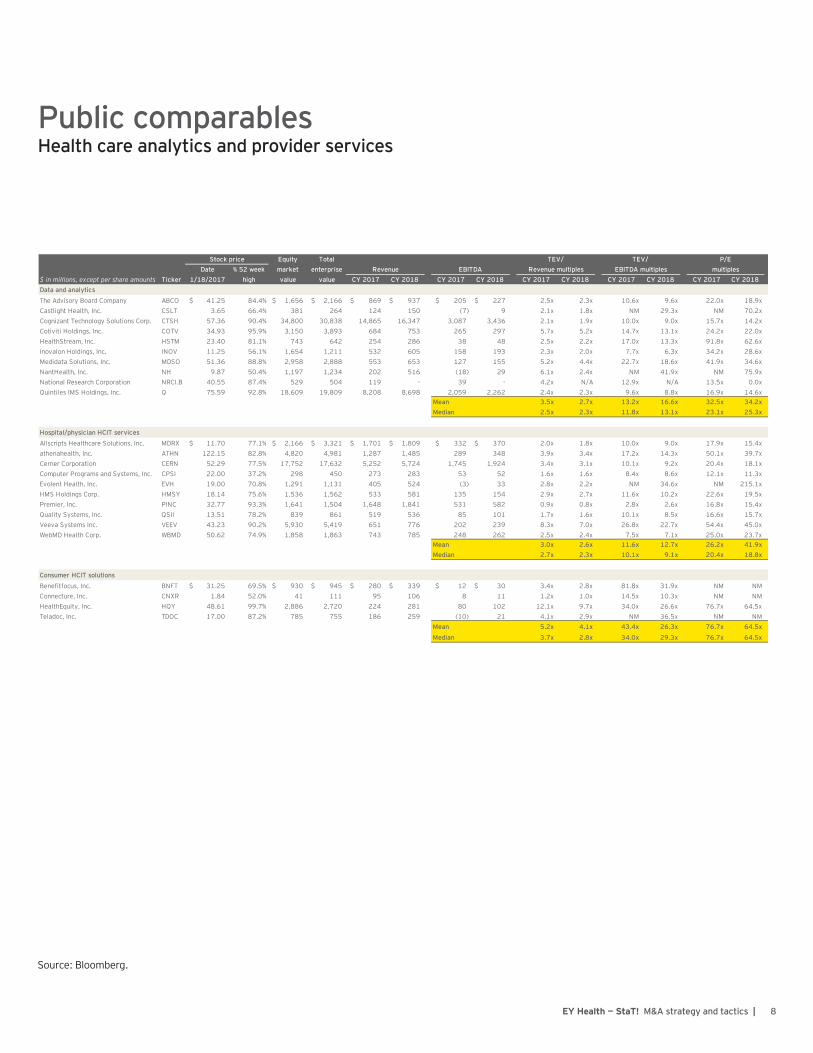
Public comparables Health care analytics and provider services
Stock price Equity Total TEV/ TEV/ P/EDate % 52 week market enterprise Revenue EBITDA Revenue multiples EBITDA multiples multiples
$ in millions, except per share amounts Ticker 1/18/2017 high value value CY 2017 CY 2018 CY 2017 CY 2018 CY 2017 CY 2018 CY 2017 CY 2018 CY 2017 CY 2018Data and analytics
The Advisory Board Company ABCO 41.25$ 84.4% 1,656$ 2,166$ 869$ 937$ 205$ 227$ 2.5x 2.3x 10.6x 9.6x 22.0x 18.9xCastlight Health, Inc. CSLT 3.65 66.4% 381 264 124 150 (7) 9 2.1x 1.8x M 29.3x M 70.2xCogni ant Technology Solutions Corp. CTSH 57.36 90.4% 34,800 30,838 14,865 16,347 3,087 3,436 2.1x 1.9x 10.0x 9.0x 15.7x 14.2xCotiviti Holdings, Inc. COTV 34.93 95.9% 3,150 3,893 684 753 265 297 5.7x 5.2x 14.7x 13.1x 24.2x 22.0xHealthStream, Inc. HSTM 23.40 81.1% 743 642 254 286 38 48 2.5x 2.2x 17.0x 13.3x 91.8x 62.6xInovalon Holdings, Inc. I OV 11.25 56.1% 1,654 1,211 532 605 158 193 2.3x 2.0x 7.7x 6.3x 34.2x 28.6xMedidata Solutions, Inc. MDSO 51.36 88.8% 2,958 2,888 553 653 127 155 5.2x 4.4x 22.7x 18.6x 41.9x 34.6x
antHealth, Inc. H 9.87 50.4% 1,197 1,234 202 516 (18) 29 6.1x 2.4x M 41.9x M 75.9xational Research Corporation RCI.B 40.55 87.4% 529 504 119 - 39 - 4.2x /A 12.9x /A 13.5x 0.0xuintiles IMS Holdings, Inc. 75.59 92.8% 18,609 19,809 8,208 8,698 2,059 2,262 2.4x 2.3x 9.6x 8.8x 16.9x 14.6x
Mean 3.5x 2.7x 13.2x 16.6x 32.5x 34.2xMedian 2.5x 2.3x 11.8x 13.1x 23.1x 25.3x
Hospital/physician HCIT services
Allscripts Healthcare Solutions, Inc. MDRX 11.70$ 77.1% 2,166$ 3,321$ 1,701$ 1,809$ 332$ 370$ 2.0x 1.8x 10.0x 9.0x 17.9x 15.4xathenahealth, Inc. ATH 122.15 82.8% 4,820 4,981 1,287 1,485 289 348 3.9x 3.4x 17.2x 14.3x 50.1x 39.7xCerner Corporation CER 52.29 77.5% 17,752 17,632 5,252 5,724 1,745 1,924 3.4x 3.1x 10.1x 9.2x 20.4x 18.1xComputer Programs and Systems, Inc. CPSI 22.00 37.2% 298 450 273 283 53 52 1.6x 1.6x 8.4x 8.6x 12.1x 11.3xEvolent Health, Inc. EVH 19.00 70.8% 1,291 1,131 405 524 (3) 33 2.8x 2.2x M 34.6x M 215.1xHMS Holdings Corp. HMS 18.14 75.6% 1,536 1,562 533 581 135 154 2.9x 2.7x 11.6x 10.2x 22.6x 19.5xPremier, Inc. PI C 32.77 93.3% 1,641 1,504 1,648 1,841 531 582 0.9x 0.8x 2.8x 2.6x 16.8x 15.4x
uality Systems, Inc. SII 13.51 78.2% 839 861 519 536 85 101 1.7x 1.6x 10.1x 8.5x 16.6x 15.7xVeeva Systems Inc. VEEV 43.23 90.2% 5,930 5,419 651 776 202 239 8.3x 7.0x 26.8x 22.7x 54.4x 45.0xWebMD Health Corp. WBMD 50.62 74.9% 1,858 1,863 743 785 248 262 2.5x 2.4x 7.5x 7.1x 25.0x 23.7x
Mean 3.0x 2.6x 11.6x 12.7x 26.2x 41.9xMedian 2.7x 2.3x 10.1x 9.1x 20.4x 18.8x
Consumer HCIT solutions
Benefitfocus, Inc. B FT 31.25$ 69.5% 930$ 945$ 280$ 339$ 12$ 30$ 3.4x 2.8x 81.8x 31.9x M MConnecture, Inc. C XR 1.84 52.0% 41 111 95 106 8 11 1.2x 1.0x 14.5x 10.3x M MHealthEquity, Inc. H 48.61 99.7% 2,886 2,720 224 281 80 102 12.1x 9.7x 34.0x 26.6x 76.7x 64.5xTeladoc, Inc. TDOC 17.00 87.2% 785 755 186 259 (10) 21 4.1x 2.9x M 36.5x M M
Mean 5.2x 4.1x 43.4x 26.3x 76.7x 64.5x
Median 3.7x 2.8x 34.0x 29.3x 76.7x 64.5x
Source: Bloomberg.
8 EY Health — StaT! M&A strategy and tactics |
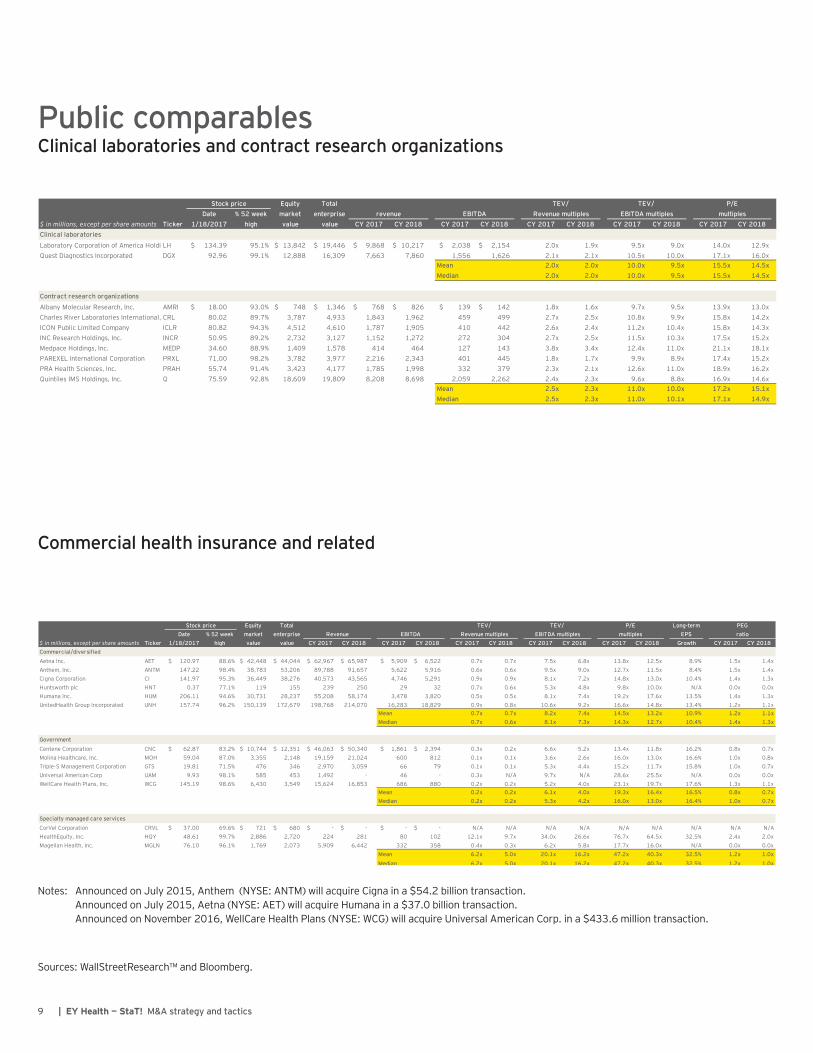
Public comparables
Commercial health insurance and related
Stock price Equity Total TEV/ TEV/ P/EDate % 52 week market enterprise revenue EBITDA Revenue multiples EBITDA multiples multiples
$ in millions, except per share amounts Ticker 1/18/2017 high value value CY 2017 CY 2018 CY 2017 CY 2018 CY 2017 CY 2018 CY 2017 CY 2018 CY 2017 CY 2018Clinical laboratories
Laboratory Corporation of America Holdi LH 134.39$ 95.1% 13,842$ 19,446$ 9,868$ 10,217$ 2,038$ 2,154$ 2.0x 1.9x 9.5x 9.0x 14.0x 12.9xuest Diagnostics Incorporated DGX 92.96 99.1% 12,888 16,309 7,663 7,860 1,556 1,626 2.1x 2.1x 10.5x 10.0x 17.1x 16.0x
Mean 2.0x 2.0x 10.0x 9.5x 15.5x 14.5xMedian 2.0x 2.0x 10.0x 9.5x 15.5x 14.5x
Contract research organizations
Albany Molecular Research, Inc. AMRI 18.00$ 93.0% 748$ 1,346$ 768$ 826$ 139$ 142$ 1.8x 1.6x 9.7x 9.5x 13.9x 13.0xCharles River Laboratories International, CRL 80.02 89.7% 3,787 4,933 1,843 1,962 459 499 2.7x 2.5x 10.8x 9.9x 15.8x 14.2xICO Public Limited Company ICLR 80.82 94.3% 4,512 4,610 1,787 1,905 410 442 2.6x 2.4x 11.2x 10.4x 15.8x 14.3xI C Research Holdings, Inc. I CR 50.95 89.2% 2,732 3,127 1,152 1,272 272 304 2.7x 2.5x 11.5x 10.3x 17.5x 15.2xMedpace Holdings, Inc. MEDP 34.60 88.9% 1,409 1,578 414 464 127 143 3.8x 3.4x 12.4x 11.0x 21.1x 18.1xPAREXEL International Corporation PRXL 71.00 98.2% 3,782 3,977 2,216 2,343 401 445 1.8x 1.7x 9.9x 8.9x 17.4x 15.2xPRA Health Sciences, Inc. PRAH 55.74 91.4% 3,423 4,177 1,785 1,998 332 379 2.3x 2.1x 12.6x 11.0x 18.9x 16.2x
uintiles IMS Holdings, Inc. 75.59 92.8% 18,609 19,809 8,208 8,698 2,059 2,262 2.4x 2.3x 9.6x 8.8x 16.9x 14.6xMean 2.5x 2.3x 11.0x 10.0x 17.2x 15.1xMedian 2.5x 2.3x 11.0x 10.1x 17.1x 14.9x
Stock price Equity Total TEV/ TEV/ P/E Long-term PEGDate % 52 week market enterprise Revenue EBITDA Revenue multiples EBITDA multiples multiples EPS ratio
$ in millions, except per share amounts Ticker 1/18/2017 high value value CY 2017 CY 2018 CY 2017 CY 2018 CY 2017 CY 2018 CY 2017 CY 2018 CY 2017 CY 2018 Growth CY 2017 CY 2018Commercial/diversified
Aetna Inc. AET 120.97$ 88.6% 42,448$ 44,044$ 62,967$ 65,987$ 5,909$ 6,522$ 0.7x 0.7x 7.5x 6.8x 13.8x 12.5x 8.9% 1.5x 1.4xAnthem, Inc. A TM 147.22 98.4% 38,783 53,206 89,788 91,657 5,622 5,916 0.6x 0.6x 9.5x 9.0x 12.7x 11.5x 8.4% 1.5x 1.4xCigna Corporation CI 141.97 95.3% 36,449 38,276 40,573 43,565 4,746 5,291 0.9x 0.9x 8.1x 7.2x 14.8x 13.0x 10.4% 1.4x 1.3xHuntsworth plc H T 0.37 77.1% 119 155 239 250 29 32 0.7x 0.6x 5.3x 4.8x 9.8x 10.0x /A 0.0x 0.0xHumana Inc. HUM 206.11 94.6% 30,731 28,237 55,208 58,174 3,478 3,820 0.5x 0.5x 8.1x 7.4x 19.2x 17.6x 13.5% 1.4x 1.3xUnitedHealth Group Incorporated U H 157.74 96.2% 150,139 172,679 198,768 214,070 16,283 18,829 0.9x 0.8x 10.6x 9.2x 16.6x 14.8x 13.4% 1.2x 1.1x
Mean 0.7x 0.7x 8.2x 7.4x 14.5x 13.2x 10.9% 1.2x 1.1xMedian 0.7x 0.6x 8.1x 7.3x 14.3x 12.7x 10.4% 1.4x 1.3x
Government
Centene Corporation C C 62.87$ 83.2% 10,744$ 12,351$ 46,063$ 50,340$ 1,861$ 2,394$ 0.3x 0.2x 6.6x 5.2x 13.4x 11.8x 16.2% 0.8x 0.7xMolina Healthcare, Inc. MOH 59.04 87.0% 3,355 2,148 19,159 21,024 600 812 0.1x 0.1x 3.6x 2.6x 16.0x 13.0x 16.6% 1.0x 0.8xTriple-S Management Corporation GTS 19.81 71.5% 476 346 2,970 3,059 66 79 0.1x 0.1x 5.3x 4.4x 15.2x 11.7x 15.8% 1.0x 0.7xUniversal American Corp UAM 9.93 98.1% 585 453 1,492 - 46 - 0.3x /A 9.7x /A 28.6x 25.5x /A 0.0x 0.0xWellCare Health Plans, Inc. WCG 145.19 98.6% 6,430 3,549 15,624 16,853 686 880 0.2x 0.2x 5.2x 4.0x 23.1x 19.7x 17.6% 1.3x 1.1x
Mean 0.2x 0.2x 6.1x 4.0x 19.3x 16.4x 16.5% 0.8x 0.7xMedian 0.2x 0.2x 5.3x 4.2x 16.0x 13.0x 16.4% 1.0x 0.7x
Specialty managed care services
CorVel Corporation CRVL 37.00$ 69.6% 721$ 680$ -$ -$ -$ -$ /A /A /A /A /A /A /A /A /AHealthEquity, Inc. H 48.61 99.7% 2,886 2,720 224 281 80 102 12.1x 9.7x 34.0x 26.6x 76.7x 64.5x 32.5% 2.4x 2.0xMagellan Health, Inc. MGL 76.10 96.1% 1,769 2,073 5,909 6,442 332 358 0.4x 0.3x 6.2x 5.8x 17.7x 16.0x /A 0.0x 0.0x
Mean 6.2x 5.0x 20.1x 16.2x 47.2x 40.3x 32.5% 1.2x 1.0x
Median 6.2x 5.0x 20.1x 16.2x 47.2x 40.3x 32.5% 1.2x 1.0x
Sources: WallStreetResearch™ and Bloomberg.
otes: Announced on uly 2015, Anthem ( SE: A TM) will acquire Cigna in a $54.2 billion transaction. Announced on uly 2015, Aetna ( SE: AET) will acquire Humana in a $37.0 billion transaction. Announced on ovember 2016, WellCare Health Plans ( SE: WCG) will acquire Universal American Corp. in a $433.6 million transaction.
9 | EY Health — StaT! M&A strategy and tactics
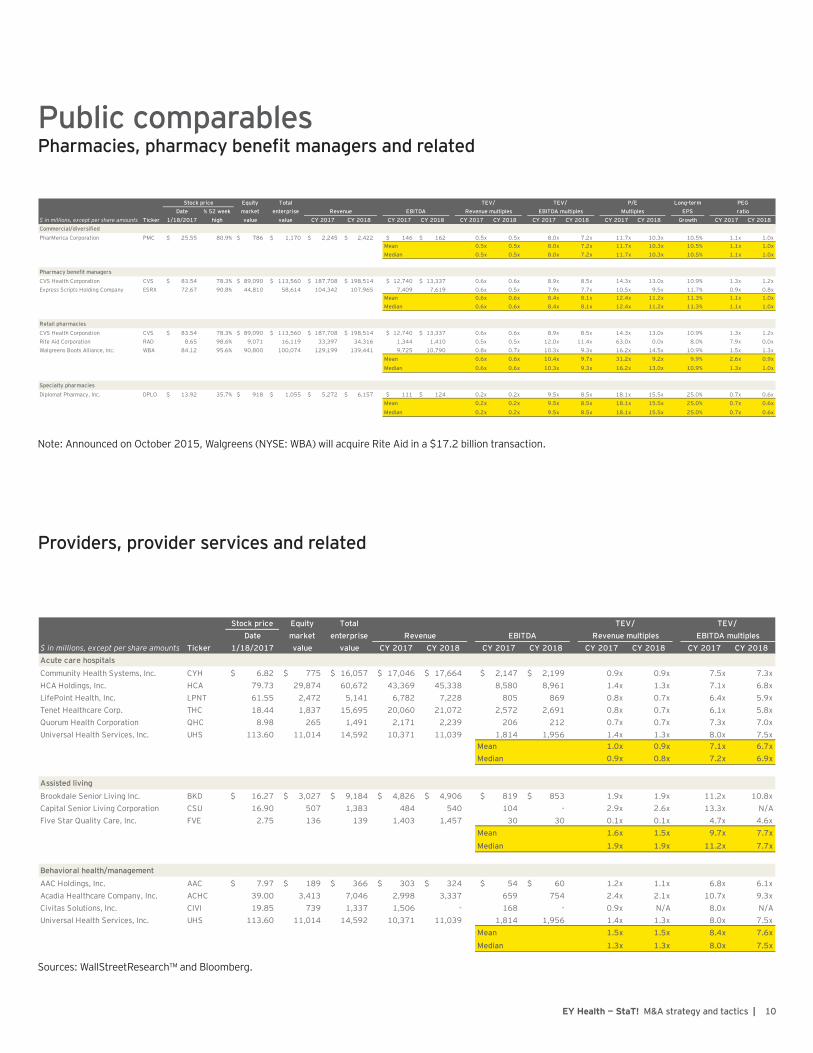
Providers, provider services and related
Sources: WallStreetResearch™ and Bloomberg.
ote: Announced on October 2015, Walgreens ( SE: WBA) will acquire Rite Aid in a $17.2 billion transaction.
Public comparables
Stock price Equity Total TEV/ TEV/ P/E Long-term PEGDate % 52 week market enterprise Revenue EBITDA Revenue multiples EBITDA multiples Multiples EPS ratio
$ in millions, except per share amounts Ticker 1/18/2017 high value value CY 2017 CY 2018 CY 2017 CY 2018 CY 2017 CY 2018 CY 2017 CY 2018 CY 2017 CY 2018 Growth CY 2017 CY 2018Commercial/diversified
PharMerica Corporation PMC 25.55$ 80.9% 786$ 1,170$ 2,245$ 2,422$ 146$ 162$ 0.5x 0.5x 8.0x 7.2x 11.7x 10.3x 10.5% 1.1x 1.0xMean 0.5x 0.5x 8.0x 7.2x 11.7x 10.3x 10.5% 1.1x 1.0xMedian 0.5x 0.5x 8.0x 7.2x 11.7x 10.3x 10.5% 1.1x 1.0x
Pharmacy benefit managers
CVS Health Corporation CVS 83.54$ 78.3% 89,090$ 113,560$ 187,708$ 198,514$ 12,740$ 13,337$ 0.6x 0.6x 8.9x 8.5x 14.3x 13.0x 10.9% 1.3x 1.2xExpress Scripts Holding Company ESRX 72.67 90.8% 44,810 58,614 104,342 107,965 7,409 7,619 0.6x 0.5x 7.9x 7.7x 10.5x 9.5x 11.7% 0.9x 0.8x
Mean 0.6x 0.6x 8.4x 8.1x 12.4x 11.2x 11.3% 1.1x 1.0xMedian 0.6x 0.6x 8.4x 8.1x 12.4x 11.2x 11.3% 1.1x 1.0x
Retail pharmacies
CVS Health Corporation CVS 83.54$ 78.3% 89,090$ 113,560$ 187,708$ 198,514$ 12,740$ 13,337$ 0.6x 0.6x 8.9x 8.5x 14.3x 13.0x 10.9% 1.3x 1.2xRite Aid Corporation RAD 8.65 98.6% 9,071 16,119 33,397 34,316 1,344 1,410 0.5x 0.5x 12.0x 11.4x 63.0x 0.0x 8.0% 7.9x 0.0xWalgreens Boots Alliance, Inc. WBA 84.12 95.6% 90,800 100,074 129,199 139,441 9,725 10,790 0.8x 0.7x 10.3x 9.3x 16.2x 14.5x 10.9% 1.5x 1.3x
Mean 0.6x 0.6x 10.4x 9.7x 31.2x 9.2x 9.9% 2.6x 0.9x
Median 0.6x 0.6x 10.3x 9.3x 16.2x 13.0x 10.9% 1.3x 1.0x
Specialty pharmacies
Diplomat Pharmacy, Inc. DPLO 13.92$ 35.7% 918$ 1,055$ 5,272$ 6,157$ 111$ 124$ 0.2x 0.2x 9.5x 8.5x 18.1x 15.5x 25.0% 0.7x 0.6xMean 0.2x 0.2x 9.5x 8.5x 18.1x 15.5x 25.0% 0.7x 0.6x
Median 0.2x 0.2x 9.5x 8.5x 18.1x 15.5x 25.0% 0.7x 0.6x
Stock price Equity Total TEV/ TEV/ Date market enterprise Revenue EBITDA Revenue multiples EBITDA multiples
$ in millions, except per share amounts Ticker 1/18/2017 value value CY 2017 CY 2018 CY 2017 CY 2018 CY 2017 CY 2018 CY 2017 CY 2018Acute care hospitals
Community Health Systems, Inc. C H 6.82$ 775$ 16,057$ 17,046$ 17,664$ 2,147$ 2,199$ 0.9x 0.9x 7.5x 7.3xHCA Holdings, Inc. HCA 79.73 29,874 60,672 43,369 45,338 8,580 8,961 1.4x 1.3x 7.1x 6.8xLifePoint Health, Inc. LP T 61.55 2,472 5,141 6,782 7,228 805 869 0.8x 0.7x 6.4x 5.9xTenet Healthcare Corp. THC 18.44 1,837 15,695 20,060 21,072 2,572 2,691 0.8x 0.7x 6.1x 5.8x
uorum Health Corporation HC 8.98 265 1,491 2,171 2,239 206 212 0.7x 0.7x 7.3x 7.0xUniversal Health Services, Inc. UHS 113.60 11,014 14,592 10,371 11,039 1,814 1,956 1.4x 1.3x 8.0x 7.5x
Mean 1.0x 0.9x 7.1x 6.7xMedian 0.9x 0.8x 7.2x 6.9x
Assisted living
Broo dale Senior Living Inc. BKD 16.27$ 3,027$ 9,184$ 4,826$ 4,906$ 819$ 853$ 1.9x 1.9x 11.2x 10.8xCapital Senior Living Corporation CSU 16.90 507 1,383 484 540 104 - 2.9x 2.6x 13.3x /AFive Star uality Care, Inc. FVE 2.75 136 139 1,403 1,457 30 30 0.1x 0.1x 4.7x 4.6x
Mean 1.6x 1.5x 9.7x 7.7x
Median 1.9x 1.9x 11.2x 7.7x
Behavioral health/management
AAC Holdings, Inc. AAC 7.97$ 189$ 366$ 303$ 324$ 54$ 60$ 1.2x 1.1x 6.8x 6.1xAcadia Healthcare Company, Inc. ACHC 39.00 3,413 7,046 2,998 3,337 659 754 2.4x 2.1x 10.7x 9.3xCivitas Solutions, Inc. CIVI 19.85 739 1,337 1,506 - 168 - 0.9x /A 8.0x /AUniversal Health Services, Inc. UHS 113.60 11,014 14,592 10,371 11,039 1,814 1,956 1.4x 1.3x 8.0x 7.5x
Mean 1.5x 1.5x 8.4x 7.6x
Median 1.3x 1.3x 8.0x 7.5x
EY Health — StaT! M&A strategy and tactics |
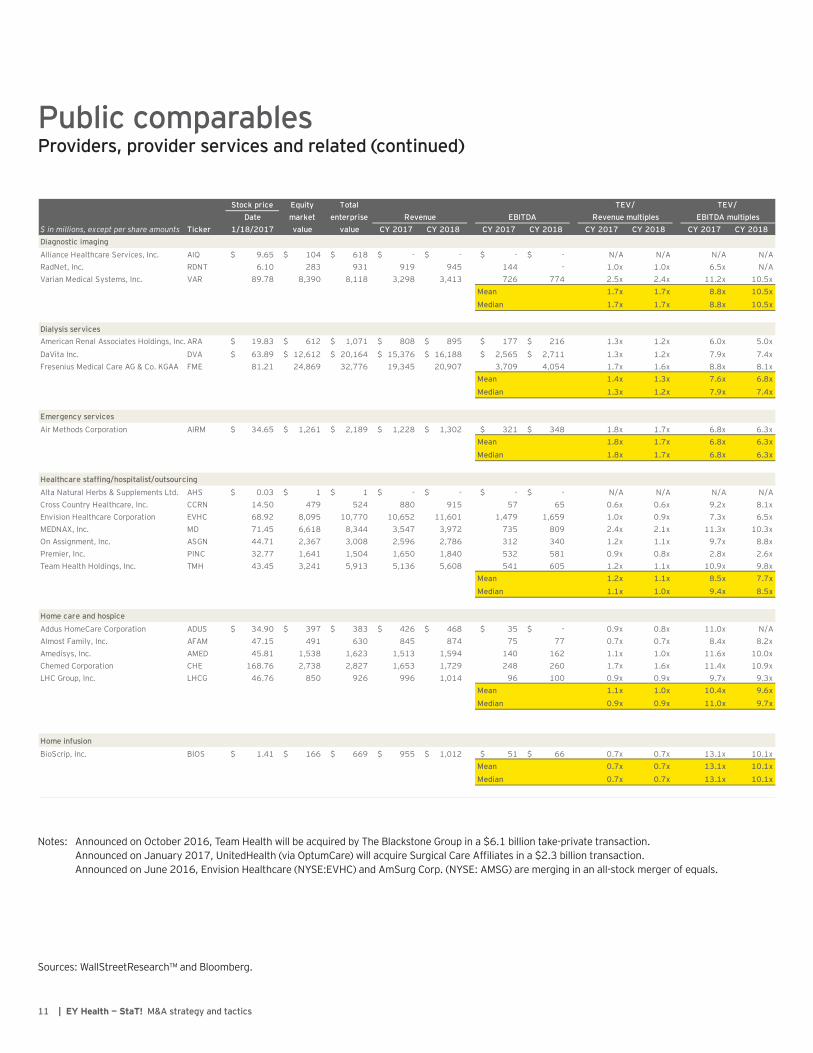
Public comparables Providers, provider services and related (continued)
Stock price Equity Total TEV/ TEV/ Date market enterprise Revenue EBITDA Revenue multiples EBITDA multiples
$ in millions, except per share amounts Ticker 1/18/2017 value value CY 2017 CY 2018 CY 2017 CY 2018 CY 2017 CY 2018 CY 2017 CY 2018Diagnostic imaging
Alliance Healthcare Services, Inc. AI 9.65$ 104$ 618$ -$ -$ -$ -$ /A /A /A /ARad et, Inc. RD T 6.10 283 931 919 945 144 - 1.0x 1.0x 6.5x /AVarian Medical Systems, Inc. VAR 89.78 8,390 8,118 3,298 3,413 726 774 2.5x 2.4x 11.2x 10.5x
Mean 1.7x 1.7x 8.8x 10.5x
Median 1.7x 1.7x 8.8x 10.5x
Dialysis servicesAmerican Renal Associates Holdings, Inc. ARA 19.83$ 612$ 1,071$ 808$ 895$ 177$ 216$ 1.3x 1.2x 6.0x 5.0x
DaVita Inc. DVA 63.89$ 12,612$ 20,164$ 15,376$ 16,188$ 2,565$ 2,711$ 1.3x 1.2x 7.9x 7.4xFresenius Medical Care AG & Co. KGAA FME 81.21 24,869 32,776 19,345 20,907 3,709 4,054 1.7x 1.6x 8.8x 8.1x
Mean 1.4x 1.3x 7.6x 6.8x
Median 1.3x 1.2x 7.9x 7.4x
Emergency services
Air Methods Corporation AIRM 34.65$ 1,261$ 2,189$ 1,228$ 1,302$ 321$ 348$ 1.8x 1.7x 6.8x 6.3xMean 1.8x 1.7x 6.8x 6.3x
Median 1.8x 1.7x 6.8x 6.3x
Healthcare staffing/hospitalist/outsourcing
Alta atural Herbs & Supplements Ltd. AHS 0.03$ 1$ 1$ -$ -$ -$ -$ /A /A /A /ACross Country Healthcare, Inc. CCR 14.50 479 524 880 915 57 65 0.6x 0.6x 9.2x 8.1xEnvision Healthcare Corporation EVHC 68.92 8,095 10,770 10,652 11,601 1,479 1,659 1.0x 0.9x 7.3x 6.5xMED AX, Inc. MD 71.45 6,618 8,344 3,547 3,972 735 809 2.4x 2.1x 11.3x 10.3xOn Assignment, Inc. ASG 44.71 2,367 3,008 2,596 2,786 312 340 1.2x 1.1x 9.7x 8.8xPremier, Inc. PI C 32.77 1,641 1,504 1,650 1,840 532 581 0.9x 0.8x 2.8x 2.6xTeam Health Holdings, Inc. TMH 43.45 3,241 5,913 5,136 5,608 541 605 1.2x 1.1x 10.9x 9.8x
Mean 1.2x 1.1x 8.5x 7.7x
Median 1.1x 1.0x 9.4x 8.5x
Home care and hospice
Addus HomeCare Corporation ADUS 34.90$ 397$ 383$ 426$ 468$ 35$ -$ 0.9x 0.8x 11.0x /AAlmost Family, Inc. AFAM 47.15 491 630 845 874 75 77 0.7x 0.7x 8.4x 8.2xAmedisys, Inc. AMED 45.81 1,538 1,623 1,513 1,594 140 162 1.1x 1.0x 11.6x 10.0xChemed Corporation CHE 168.76 2,738 2,827 1,653 1,729 248 260 1.7x 1.6x 11.4x 10.9xLHC Group, Inc. LHCG 46.76 850 926 996 1,014 96 100 0.9x 0.9x 9.7x 9.3x
Mean 1.1x 1.0x 10.4x 9.6x
Median 0.9x 0.9x 11.0x 9.7x
Home infusion
BioScrip, Inc. BIOS 1.41$ 166$ 669$ 955$ 1,012$ 51$ 66$ 0.7x 0.7x 13.1x 10.1xMean 0.7x 0.7x 13.1x 10.1x
Median 0.7x 0.7x 13.1x 10.1x
Sources: WallStreetResearch™ and Bloomberg.
otes: Announced on October 2016, Team Health will be acquired by The Blac stone Group in a $6.1 billion ta e-private transaction. Announced on anuary 2017, UnitedHealth (via OptumCare) will acquire Surgical Care Af liates in a $2.3 billion transaction.
Announced on une 2016, Envision Healthcare ( SE:EVHC) and AmSurg Corp. ( SE: AMSG) are merging in an all-stoc merger of equals.
| EY Health — StaT! M&A strategy and tactics
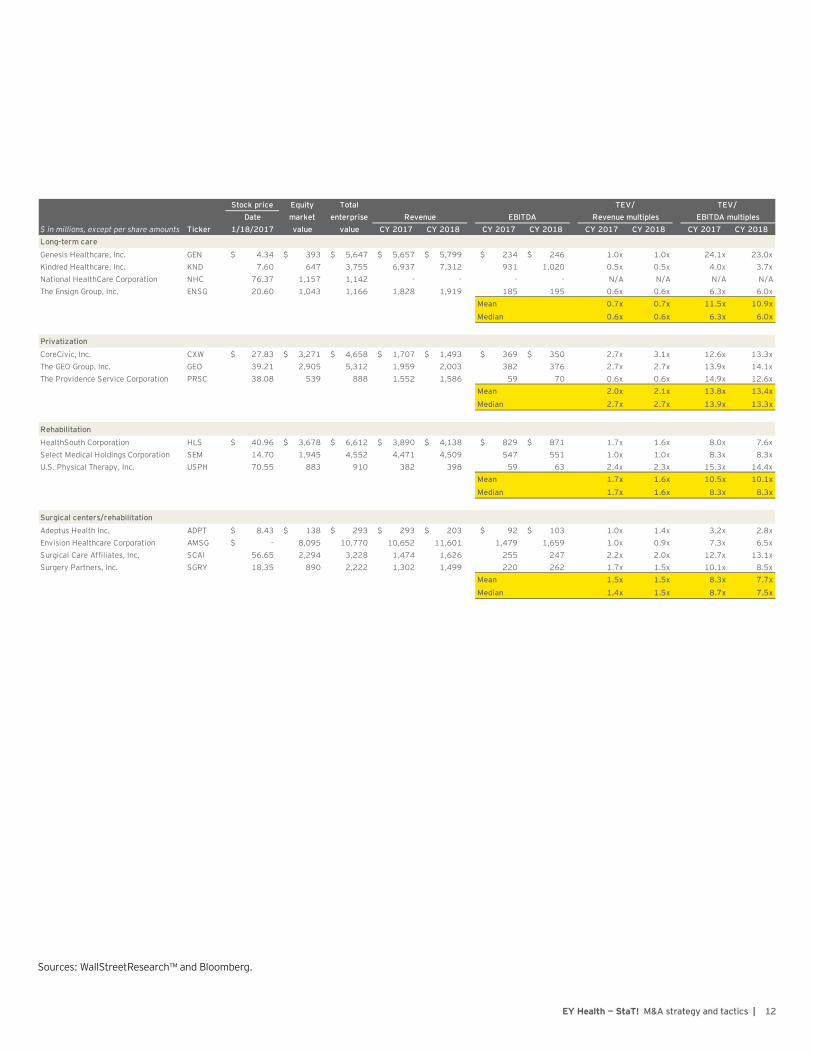
Stock price Equity Total TEV/ TEV/ Date market enterprise Revenue EBITDA Revenue multiples EBITDA multiples
$ in millions, except per share amounts Ticker 1/18/2017 value value CY 2017 CY 2018 CY 2017 CY 2018 CY 2017 CY 2018 CY 2017 CY 2018Long-term care
Genesis Healthcare, Inc. GE 4.34$ 393$ 5,647$ 5,657$ 5,799$ 234$ 246$ 1.0x 1.0x 24.1x 23.0xKindred Healthcare, Inc. K D 7.60 647 3,755 6,937 7,312 931 1,020 0.5x 0.5x 4.0x 3.7x
ational HealthCare Corporation HC 76.37 1,157 1,142 - - - - /A /A /A /AThe Ensign Group, Inc. E SG 20.60 1,043 1,166 1,828 1,919 185 195 0.6x 0.6x 6.3x 6.0x
Mean 0.7x 0.7x 11.5x 10.9x
Median 0.6x 0.6x 6.3x 6.0x
Privatization
CoreCivic, Inc. CXW 27.83$ 3,271$ 4,658$ 1,707$ 1,493$ 369$ 350$ 2.7x 3.1x 12.6x 13.3xThe GEO Group, Inc. GEO 39.21 2,905 5,312 1,959 2,003 382 376 2.7x 2.7x 13.9x 14.1xThe Providence Service Corporation PRSC 38.08 539 888 1,552 1,586 59 70 0.6x 0.6x 14.9x 12.6x
Mean 2.0x 2.1x 13.8x 13.4x
Median 2.7x 2.7x 13.9x 13.3x
Rehabilitation
HealthSouth Corporation HLS 40.96$ 3,678$ 6,612$ 3,890$ 4,138$ 829$ 871$ 1.7x 1.6x 8.0x 7.6xSelect Medical Holdings Corporation SEM 14.70 1,945 4,552 4,471 4,509 547 551 1.0x 1.0x 8.3x 8.3xU.S. Physical Therapy, Inc. USPH 70.55 883 910 382 398 59 63 2.4x 2.3x 15.3x 14.4x
Mean 1.7x 1.6x 10.5x 10.1x
Median 1.7x 1.6x 8.3x 8.3x
Surgical centers/rehabilitation
Adeptus Health Inc. ADPT 8.43$ 138$ 293$ 293$ 203$ 92$ 103$ 1.0x 1.4x 3.2x 2.8xEnvision Healthcare Corporation AMSG -$ 8,095 10,770 10,652 11,601 1,479 1,659 1.0x 0.9x 7.3x 6.5xSurgical Care Affiliates, Inc. SCAI 56.65 2,294 3,228 1,474 1,626 255 247 2.2x 2.0x 12.7x 13.1xSurgery Partners, Inc. SGR 18.35 890 2,222 1,302 1,499 220 262 1.7x 1.5x 10.1x 8.5x
Mean 1.5x 1.5x 8.3x 7.7x
Median 1.4x 1.5x 8.7x 7.5x
Sources: WallStreetResearch™ and Bloomberg.
EY Health — StaT! M&A strategy and tactics |
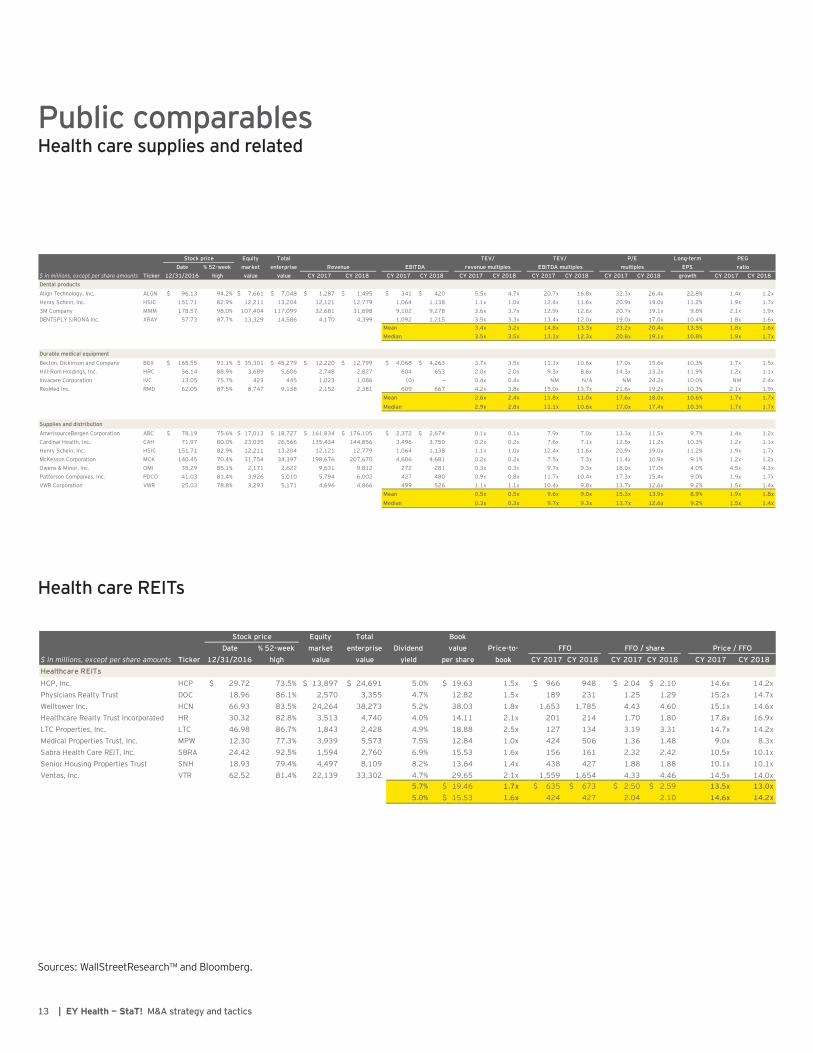
Stock price Equity Total BookDate % 52-week market enterprise Dividend value Price-to- FFO FFO / share Price / FFO
$ in millions, except per share amounts Ticker 12/31/2016 high value value yield per share book CY 2017 CY 2018 CY 2017 CY 2018 CY 2017 CY 2018Healthcare REITs
HCP, Inc. HCP 29.72$ 73.5% 13,897$ 24,691$ 5.0% 19.63$ 1.5x 966$ 948 2.04$ 2.10$ 14.6x 14.2xPhysicians Realty Trust DOC 18.96 86.1% 2,570 3,355 4.7% 12.82 1.5x 189 231 1.25 1.29 15.2x 14.7xWelltower Inc. HC 66.93 83.5% 24,264 38,273 5.2% 38.03 1.8x 1,653 1,785 4.43 4.60 15.1x 14.6xHealthcare Realty Trust Incorporated HR 30.32 82.8% 3,513 4,740 4.0% 14.11 2.1x 201 214 1.70 1.80 17.8x 16.9xLTC Properties, Inc. LTC 46.98 86.7% 1,843 2,428 4.9% 18.88 2.5x 127 134 3.19 3.31 14.7x 14.2xMedical Properties Trust, Inc. MPW 12.30 77.3% 3,939 5,573 7.5% 12.84 1.0x 424 506 1.36 1.48 9.0x 8.3xSabra Health Care REIT, Inc. SBRA 24.42 92.5% 1,594 2,760 6.9% 15.53 1.6x 156 161 2.32 2.42 10.5x 10.1xSenior Housing Properties Trust S H 18.93 79.4% 4,497 8,109 8.2% 13.64 1.4x 438 427 1.88 1.88 10.1x 10.1xVentas, Inc. VTR 62.52 81.4% 22,139 33,302 4.7% 29.65 2.1x 1,559 1,654 4.33 4.46 14.5x 14.0x
5.7% 19.46$ 1.7x 635$ 673$ 2.50$ 2.59$ 13.5x 13.0x5.0% 15.53$ 1.6x 424 427 2.04 2.10 14.6x 14.2x
Public comparables Health care supplies and related
Stock price Equity Total TEV/ TEV/ P/E Long-term PEGDate % 52-week market enterprise Revenue EBITDA revenue multiples EBITDA multiples multiples EPS ratio
$ in millions, except per share amounts Ticker 12/31/2016 high value value CY 2017 CY 2018 CY 2017 CY 2018 CY 2017 CY 2018 CY 2017 CY 2018 CY 2017 CY 2018 growth CY 2017 CY 2018Dental products
Align Technology, Inc. ALG 96.13$ 94.2% 7,661$ 7,048$ 1,287$ 1,495$ 341$ 420$ 5.5x 4.7x 20.7x 16.8x 32.3x 26.4x 22.8% 1.4x 1.2xHenry Schein, Inc. HSIC 151.71 82.9% 12,211 13,204 12,121 12,779 1,064 1,138 1.1x 1.0x 12.4x 11.6x 20.9x 19.0x 11.2% 1.9x 1.7x3M Company MMM 178.57 98.0% 107,404 117,099 32,681 31,698 9,102 9,278 3.6x 3.7x 12.9x 12.6x 20.7x 19.1x 9.8% 2.1x 1.9xDE TSPL SIRO A Inc. XRA 57.73 87.7% 13,329 14,586 4,170 4,399 1,092 1,215 3.5x 3.3x 13.4x 12.0x 19.0x 17.0x 10.4% 1.8x 1.6x
Mean 3.4x 3.2x 14.8x 13.3x 23.2x 20.4x 13.5% 1.8x 1.6xMedian 3.5x 3.5x 13.1x 12.3x 20.8x 19.1x 10.8% 1.9x 1.7x
Durable medical equipment
Becton, Dic inson and Company BDX 165.55$ 91.1% 35,301$ 45,279$ 12,220$ 12,799$ 4,068$ 4,263$ 3.7x 3.5x 11.1x 10.6x 17.0x 15.6x 10.3% 1.7x 1.5xHill-Rom Holdings, Inc. HRC 56.14 88.9% 3,689 5,606 2,748 2,827 604 653 2.0x 2.0x 9.3x 8.6x 14.3x 13.2x 11.9% 1.2x 1.1xInvacare Corporation IVC 13.05 75.7% 423 445 1,023 1,086 (0) – 0.4x 0.4x M /A M 24.2x 10.0% M 2.4xResMed Inc. RMD 62.05 87.5% 8,747 9,138 2,152 2,381 609 667 4.2x 3.8x 15.0x 13.7x 21.6x 19.2x 10.3% 2.1x 1.9x
Mean 2.6x 2.4x 11.8x 11.0x 17.6x 18.0x 10.6% 1.7x 1.7x
Median 2.9x 2.8x 11.1x 10.6x 17.0x 17.4x 10.3% 1.7x 1.7x
Supplies and distribution
AmerisourceBergen Corporation ABC 78.19$ 75.6% 17,013$ 18,727$ 161,834$ 176,105$ 2,372$ 2,674$ 0.1x 0.1x 7.9x 7.0x 13.3x 11.5x 9.7% 1.4x 1.2xCardinal Health, Inc. CAH 71.97 80.0% 23,035 26,566 135,434 144,856 3,496 3,750 0.2x 0.2x 7.6x 7.1x 12.5x 11.2x 10.3% 1.2x 1.1xHenry Schein, Inc. HSIC 151.71 82.9% 12,211 13,204 12,121 12,779 1,064 1,138 1.1x 1.0x 12.4x 11.6x 20.9x 19.0x 11.2% 1.9x 1.7xMcKesson Corporation MCK 140.45 70.4% 31,754 34,397 198,676 207,670 4,606 4,681 0.2x 0.2x 7.5x 7.3x 11.4x 10.9x 9.1% 1.2x 1.2xOwens & Minor, Inc. OMI 35.29 85.1% 2,171 2,622 9,631 9,812 272 281 0.3x 0.3x 9.7x 9.3x 18.0x 17.0x 4.0% 4.5x 4.3xPatterson Companies, Inc. PDCO 41.03 81.4% 3,926 5,010 5,794 6,002 427 480 0.9x 0.8x 11.7x 10.4x 17.3x 15.4x 9.0% 1.9x 1.7xVWR Corporation VWR 25.03 78.8% 3,293 5,171 4,696 4,866 499 526 1.1x 1.1x 10.4x 9.8x 13.7x 12.6x 9.2% 1.5x 1.4x
Mean 0.5x 0.5x 9.6x 9.0x 15.3x 13.9x 8.9% 1.9x 1.8x
Median 0.3x 0.3x 9.7x 9.3x 13.7x 12.6x 9.2% 1.5x 1.4x
Health care REITs
Sources: WallStreetResearch™ and Bloomberg.
| EY Health — StaT! M&A strategy and tactics

EY | Assurance | Tax | Transactions | AdvisoryAbout EYEY is a global leader in assurance, tax, transaction and advisory services. The insights and quality services we deliver help build trust and confidence in the capital markets and in economies the world over. We develop outstanding leaders who team to deliver on our promises to all of our stakeholders. In so doing, we play a critical role in building a better working world for our people, for our clients and for our communities.
EY refers to the global organization, and may refer to one or more, of the member firms of Ernst & Young Global Limited, each of which is a separate legal entity. Ernst & Young Global Limited, a UK company limited by guarantee, does not provide services to clients. For more information about our organization, please visit ey.com.
Ernst & Young LLP is a client-serving member firm of Ernst & Young Global Limited operating in the US.
Ernst & Young Capital Advisors, LLC (EYCA) is a registered broker-dealer and member of FINRA (finra.org) providing sector-specific advice on M&A, debt capital markets, equity capital markets and capital restructuring transactions. It is an affiliate of Ernst & Young LLP, a member firm of Ernst & Young Global Limited serving clients in the US.
© 2017 Ernst & Young LLP. All Rights Reserved.
SCORE no. 00194-171US
1611-2119280 ED NoneThis material has been prepared for general informational purposes only and is not intended to be relied upon as accounting, tax, or other professional advice. Please refer to your advisors for specific advice.
US Health Care Investment Banking coverage
Health Care Services Managed Care
• Acute care• Alternate site services• Ambulatory surgery centers• Behavioral health• Clinical/hospital outsourcing• Diagnostic services• Dialysis• Home health and hospice• Labs• Long-term care• Physician services• Rehabilitation/physical therapy• Urgent care
• ACO solutions• Care/disease management• Consumer directed health care• Managed care organizations• Pharmacy bene t managers• Population health• Specialty bene t managers• Workers’ compensation
Pharma Services/Distribution Health Care IT
• Alternate site distribution• Compounding pharmacy• CROs/IRBs• Drug distribution• Institutional pharmacy• Medical-surgical distribution• Retail pharmacy• Specialty pharmacy
• Ambulatory solutions• Clinical management• Data/predictive analytics• Enterprise solutions• Mobile health• Payor solutions• Population health• Revenue cycle management• Telemedicine
Jeff McMahon Vice President Ernst & Young Capital Advisors, LLC New York, NY +1 212 773 9119 [email protected]
Gregory Park Senior Managing Director Ernst & Young Capital Advisors, LLC New York, NY +1 212 773 4929 [email protected]
James Metcalf Managing Director Ernst & Young Capital Advisors, LLC New York, NY +1 212 773 1320 [email protected]
US Health Care Investment Banking team