Embed Size (px)
Citation preview
Special Study
Extractive Industry Review
July 2004
ab0cdProject Evaluation Department
PE03-256S
PED Special Study on EI Performance Page i
SPECIAL STUDY EXTRACTIVE INDUSTRY REVIEW
Preface
This Special Study This Special Study on Extractive Industries (EI) is a review of the Bank’s natural resources portfolio. The study was carried out by Arthur Dennis Long, Senior Environmental Evaluation Manager, Project Evaluation Department (PED), with support from the firm of Environmental Equity Inc. (David Blatchford and Tim Peara). Study Approach and Findings The methodological approach, following EBRD’s good practice approach, is as described in the PED’s Evaluation Policy Review of 2004. The starting point for this review is the 1999 Natural Resource’s Operations Policy. The existing and past portfolio of EI projects consists of 37 separate projects with 28 separate entities. Nine of the 37 are mining projects. Repeat investments in the same operation (entity) are treated as one. The study population consists of a total of 21 projects, 18 of which have evaluation information on all PED evaluation indicators, while 3 more recent projects only have ratings on the environmental indicators. The focus of this Special Study is on Sustainability. In the EBRD context, Sustainability is measured through PED’s Project Financial Performance, Transition Impact, Additionality and Environmental indicators, and thus differs from the Brundtland Commission’s definition which includes economic, environmental and social dimensions. This study also benefited from the findings of several other recent EI Reviews, including the Extractive Industry Review of the World Bank Group. Overall the Sector performance is rated Successful. The sector scores relatively well on relevance, efficacy and transition impact, but less well on efficiency and environmental impact. Natural Resources projects have consistently accounted for 8-9% of the total EBRD portfolio. The Bank seeks to maximize transition impact through the implementation of its projects. The Team found that a necessary condition for improving performance is the need to expand the fence-line (scope) of the project. However, the Bank needs to recognize that its goals, while partly aligned with those of project sponsors, are far broader. EI projects are catalyst for regional development. Another condition to improve performance is that the Bank while supporting these major EI projects activities should also promote adjacent complementary activities in other sectors. PED argues that for larger EI projects, the Bank should undertake a cross-sectoral approach which would be more conducive to achieving broad transition impact.
Special Study: Extractive Industries Page ii
TABLE OF CONTENTS Page
PREFACE i CONTENTS ii ABBREVIATIONS AND DEFINED TERMS v EXECUTIVE SUMMARY vi 1. INTRODUCTION 1 1.1 Background to this Special Study 1 1.2 Objectives for this Special Study 2 1.3 Special Study approach and methodology 3 1.3.1 Evaluation scope 3 1.3.2 Approach 4 2. SECTOR CONTEXT AND RATIONALE 5 2.1 EBRD’s Natural Resource Operations Policy 5 2.2 Profile of the Extractive Industry Portfolio 5 2.3 Characteristics of the sector and project types 8 2.3.1 Historic prices 8 2.3.2 Categories of projects developed 9 2.4 EBRD EI activities unaccounted for in the policy 11 2.4.1 Captive mines 11 2.4.2 Financial Intermediaries (FIs) 12 2.4.3 Trade Facilitation Programme 13 2.5 EBRD extractive industry investment as compared with FDI investments and privatisation activities in the sector 14 2.5.1 FDI statistical overview 14 2.5.2 Privatisation in central and eastern Europe 15 3. EVALUATION RESULTS AND COMPLIANCE WITH OPERATIONS’ OBJECTIVES 17
3.1 Study population 17 3.1.1 Study limitations 17 3.2 Performance evaluation of EI projects 18 3.3 Overall sector performance 21 3.3.1 Relevance 21 3.3.2 Efficacy Achievement of the Objectives of the 1999 Natural Resources Operations
Policy 22 3.3.3 Efficiency 23 3.3.4 Mandate indicators 24 3.3.4.1 Transition Impact 24 3.3.4.2 Environmental Impact (Environmental Performance plus Environmental Change) 24 3.3.5 Aggregate Sector Performance 25 3.4 Environmental and social findings in EI projects 25 3.4.1 Compliance with EBRD Environmental Policies (1992/1996/2003) 25 3.4.2 Environmental change 27 3.4.3 Monitoring environment performance 29 3.4.4 Social dimensions of the 2003 Environmental Policy 29 3.5 Lessons learned 31
Special Study: Extractive Industries Page iv SUSAINABLE DEVELOPMENT 33
4.1 Terminology 33 4.2 EBRD Policy 33 4.3 Applying EBRD’s transition mandate through promotion of sustainable development 34 4.3.1 EBRD’s EI evaluation findings and a triple-bottom-line sustainable development
approach 34 4.3.2 Sustainable development at the country level 38 4.4 Implications for EBRD 41
5. MAJOR RECOMMENDATIONS AND CONCLUSIONS 44 5.1 Recommendations 44 5.2 Conclusions 44
LIST OF TABLES 2.1 Typology for the EBRD’s Natural Resources Portfolio 9 3.1 Environmental Performance vs. Extent of Environmental Change 21 3.2 Sector Performance Ratings 25 3.3 Ex-Post EI Sector Strategy Evaluation Logical Framework 26 4.1 Transition Impact vs. Environmental Performance (18 projects) 35 4.2 2002 Environmental Sustainability Index (ESI) and EBRD’s Average Transition Indicator (ATI) 38 4.3 Correlations between potential drivers of environmental sustainability and the 2002 ESI 40 B.1 EI Portfolio Data 9 C.1 Regional FDI by Year, Region and Sector (Note, EI is equivalent to Oil, Gas and Gold) 12 D.1 PED Evaluation Ratings 14 D.2 Analysis 15 E.1 EI Lessons Learned 17 F.1 Components of environmental sustainability and component rationale 28 F.2 Environmental Sustainability Index Building Blocks 29 F.3 Cluster Analysis Results 32 F.4 Correlations between ESI indicators and GDP per capita 33 LIST OF FIGURES 2.1 Cumulative Volume of the Extractive Industry Portfolio 6 2.2 EBRD New Business in Extractive Industry (Signed Projects) 6 2.3 Cumulative Distribution of the EI Portfolio by Country 7 2.4 EI Project Deal Size Distribution 7 2.5 Long-term Crude Oil prices 8 2.6 Gold Price, US$ per ounce (London pm fix) 9 2.7 Russian Oil, Gas & Gold: EBRD investment vs. Total Sector FDI (US$ x 1000) 15 3.1 Overall Performance Percentage 18 3.2 Transition Impact Percentage 19 3.3 Environmental Performance Percentage 20 4.1 EBRD Modified Triple-bottom-Line Logic Analysis 37 4.2 Comparison between the EBRD’s Averaged Transition Indicators for 2002 and the ESI for 2002 40 F.1 ESI Profile for Russia 28 F.2 Relationship between GNP per capita and ESI 29
BOXES 3.1 Definition of the EBRD’s New Social Elements of the Environmental Policy 30 3.2 Positive Example of One Project’s Social Activity 30 4.1 EBRD Natural Resource Operations Policy, Section 1.2. 35 4.2 Guidelines for Selection Environmental Performance Indicators (EPI’s) 42
Special Study: Extractive Industries Page iv A.1 Capital: Fluxes, Transformations, Meanings and Values 6 F.1 IFC Measuring Sustainability: A framework for Private Sector Investments (IFC, 2003) 24 F.2 Dow Jones Corporation Sustainability Assessment Criteria 24 F.3 Environmental Performance Index (EPI) 31 LIST OF APPENDICES Appendix A: Summary of Recommendations of the WBG EI Review 1 Appendix B: EI Portfolio Data 8 Appendix C: Annual and Regional FDI Data 11 Appendix D: PED Evaluation Ratings 13 Appendix E: Lessons Learned 16 Appendix F: Environmental Sustainability Index 26 Appendix G: Management Response 35
Special Study: Extractive Industries Page v
ABBREVIATIONS AFE Authorisation for Expenditures BD Banking Department (EBRD) CEE Central and Eastern Europe DfID Department for International Development (UK) EAP Environmental Action Plan EAU Environmental Appraisal Unit (now ED) EBRD European Bank for Reconstruction and Development ED Environmental Department (at the EBRD) EI Extractive Industries EMS Environmental Management System EPI Environmental Performance Index ESI Environmental Sustainability Index FDI Foreign Direct Investment FI Financial Intermediary FSU Former Soviet Union GHG Greenhouse Gases IAS International Accounting Standards IFC International Finance Corporation IFI International Finance Institutions JV Joint Venture MCCF Multi-lateral Carbon Credit Fund MEI Municipal and Environmental Infrastructure MDB Multilateral Development Banks MW Megawatts NGO Non-government Organisations OCE Office of the Chief Economist (at the EBRD) OCU Official Co-financing Unit (at the EBRD) OEG Operations and Evaluation Group (IFC) OGC Office of the General Counsel (at the EBRD) OL Operation Leader OPER Operation Performance Evaluation Review OpsCom Operations Committee OT Operation Team PED Project Evaluation Department PIU Project Implementation Unit PSA Purchase Sharing Agreement SEA Strategic Environmental Assessment SME Small and medium-sized enterprises TFP Trade Facilitation Programme USD United States dollar WBG World Bank Group WEF World Economic Forum
DEFINED TERMS
the Bank European Bank for Reconstruction and Development the PED Team Staff and contractors of the Project Evaluation Department the Banking Team Staff in the Banking Department Supporting Team Staff in other respective departments within the Bank which have a
role in appraising and monitoring the EI projects
Special Study: Extractive Industries Page vi
EXECUTIVE SUMMARY
operation. exchange
RD’s EI ble social ognised as ironmental supporting ne this by
age to help attract international sponsors ernational
epartment ’s defined summary
s rated as es well on iency and
Of the total projects, 48 per cent had a Good or Better dition, 57
rating on
f the total outcomes RD seem
arent with respect to environmental and social issues than other private PED rates icate that
is room for
d as such the Bank’s role played a rticipation
must focus ncorporate
The Bank works with a variety of project types and sponsors. Greenfield projects with international sponsors are often large and have broad economic benefits. These sponsors bring international best practice to the implementation of these projects. The Bank’s role on environmental issues has focused on ensuring full compliance with international standards and increasing transparency. Rehabilitation and/or expansion projects with existing local sponsors also offer opportunities for broad transition
Extractive Industries (EI) are a vital sector in the EBRD’s countries of They are a major source of foreign direct investment (FDI), a key foreignearner and are critical to meeting national demand for energy. The EBprojects provide jobs, pay royalty fees and taxes, and support charitaprogrammes at the local level. International project sponsors are often recbeing good corporate citizens. Yet, these projects also carry significant envrisks. The EBRD has played a vital role, particularly in the early 1990s, in the utilisation of domestic natural resources through EI projects. It has doproviding financing and political risk coverand lenders to support these projects, and at the same time by promoting intenvironmental standards and industry best practice. This Special Study, prepared by the independent Project Evaluation D(PED), assesses the EBRD’s performance in the EI sector against the Bankevaluation indicators. It is based on reviews of individual projects to obtainperformance results for the sector. Overall, the sector performance iSuccessful. As compared with all the EBRD’s results, the EI sector scorrelevance, efficacy and transition impact, but not as well on efficenvironmental impact. transition impact rating while another 39 per cent were Satisfactory. In adper cent achieved a Good rating and 14 per cent achieved an ExcellentEnvironmental Performance. Natural Resources projects have consistently accounted for 8-9 per cent oEBRD portfolio. The sector’s performance is comparable to the combinedof all evaluated projects. In addition, the EI projects supported by the EBmore transpsector EI projects, with foreign direct investment (FDI), in the region. Achievement of Objectives as Satisfactory. These evaluation results indoverall, the EI sector meets expected performance standards, but that there improvement. FDI in the EI sector continues to increase in the region, anand market share may become less apparent. Retrospectively, the Bankcritical role in supporting the transition of this sector, enabling increased paby the private sector. Going forward, the evaluation argues that the Bank on maximising transition impact, and that to achieve this, the Bank should isustainable development more prominently into its sector objectives.
Page vii Special Study: Extractive Industries
ese deals and the Bank can play a positive role in helping local sponsors address legacy issues.
e was the nt for risk e focus on e broader ves, while tive of the r regional
supporting infrastructure (MEI),
ss-sectoral
ted by the vities, for ities. PED
evaluation argues that the Bank could hese activities. The evaluation ed to ensure that they meet
i r Four broad recommendations emerged from this special study:
• Policy; a
• With respect to environmental performance, the Bank should move from a
ance based roduction, in the EI
• nd ED has
e process of motion of
ve mines, project monitoring.
The Bank’s mandate is to facilitate transition to market economies through sound banking, transition impact, and additionality. The challenge for the Bank is how to remain additional in this sector and to not displace private capital. This evaluation argues that the Bank’s mandate provides the way forward – the Bank should maximise transition through the promotion of sustainable development.
changes. Environmental legacies are a characteristic of th
The evaluation found that a necessary condition for improving performancneed to expand the “fence-line” of the project during appraisal to accoufactors outside the immediate control of the sponsor. The Bank’s exclusivthe legal boundaries of projects does not adequately take into account thregional issues. However, the Bank needs to also recognise that its objectialigned with those of project sponsors, are inherently broader. A key objecBank is to maximise transition impact. Large EI projects can be catalyst fodevelopment. The Bank should thus support these major activities with activities in other sectors, such as municipal and environmental small and medium-sized enterprises (SME), power and energy, etc. A croapproach is generally more conducive to achieving broad transition impact. The Bank is involved in the sector not only through its EI projects, as promoNatural Resource Banking Team, but also through a variety of other actiexample, through captive mines, FI investments and trade facilitation activdid not evaluate these activities. However, theenhance its tracking system to fully account for trecommends that such activities should be designnte national standards of environmental performance.
The Bank should revisit its 1999 Natural Resources OperationsSector Strategy may be a more appropriate document;
focus on meeting national, EU and World Bank standards (a compliparadigm) to adding value through pollution prevention, cleaner pecological offsets, etc., i.e. promotion of sustainable developmentsector;
Reducing Greenhouse Gases (GHG) is part of the current strategy adeveloped indicators to measure GHG emissions. ED is in thmaking this focus more operational, through better measurement, prooff-sets, and more broadly addressing energy efficiency; and
• Improve internal processes to track all EI activities, including capti
FI projects and trade facilitation activities; and improve
Special Study: Extractive Industries Page 1
1. INTRODUCTION 1.1 BACKGROUND TO THIS SPECIAL STUDY This Special Study on Extractive Industries (EI) is an evaluation of the European Bank for Reconstruction and Development’s (EBRD) past performance in this sector as carried out by its independent Project Evaluation Department (PED). The basis for this sector evaluation is the Bank’s Natural Resources Operations Policy of 1999,1 as well as prior strategies including the 1992 and 1995 Energy Operations Policies, and sections on natural resources contained in the applicable country strategies. Chapter 1 provides the context and background for the Special Study; Chapter 2 provides an analysis of the sector rationale and describes the EBRD’s EI portfolio; Chapter 3 presents PED’s evaluation findings and includes a section on EI lessons learned; Chapter 4 discusses transition and sustainable development in the EI context; and Chapter 5 presents the conclusions and recommendations. Natural resource projects (referred to as Extractive Industry (EI) projects),2 as managed by the EBRD’s Natural Resources Team, have been and continue to form a vital core of the EBRD’s business. The Natural Resources Team’s projects comprise a significant portion (see Section 2.2) of the Bank’s overall portfolio, averaging 8-9 per cent per year. The EBRD’s countries of operations have historical patterns of investing in natural resource extraction and have made national decisions to further promote the development of relevant countries’ natural resources to meet development objectives. These are sovereign decisions, dependent on resource availability, public and private sector interest, and are subject to a supporting business environment. Russia, the currently dominant country in the EBRD’s EI portfolio, is the second largest oil exporting country in the world and the largest producer of natural gas. The EBRD plays an important role as a banker and promoter of transition. Therefore, it is not the remit of this Special Study to determine if the EBRD should invest in natural resource projects, rather the focus of the EBRD’s investment strategy, and therefore the focus of this Special Study is whether the Bank has been able to maximise additionality, transition impact, and sound banking in this important sector. At the request of the NGO community in Prague, the World Bank agreed at the World Bank Group’s (WBG) Annual Meeting in 2000 to undertake a review of its EI portfolio.3 While the findings and recommendations of the WBG EI Review are limited to the WBG, they have implications for other multi-lateral development banks (MDB) and international finance institutions (IFI), including the EBRD. The WBG EI Review focuses heavily on corporate governance and human rights issues, two important topics that have been given less focus in this Study. Through evaluation of operation
1 This document is referred to as a Policy document; however, the document is in fact a sector
strategy in which some policy elements are also addressed. 2 The terms “natural resources” and “extractive industries” will be used inter-changeably in this
report. 3 This process and the resulting reports are summarised in Appendix A.
Page 2 of 47 Special Study: Extractive Industries
objectives and past experience, EBRD will be able to formulate future EI strategies and enhance its position in this debate. Within the EBRD, “natural resources” has both an organisational and technical definition. The Natural Resources Team deals with the following sub-sectors:
• oil and gas exploration • pipeline projects • petrochemical refineries • mining.
Refineries are not strictly part of the extractive process, and were excluded from the WBG evaluation reports; likewise with pipeline projects. Therefore, these projects have also been excluded from this Study. In reviewing the 1999 Policy, the natural resource emphasis of the Bank appears to focus on hydrocarbon operations, with relatively less emphasis on mining and mineral processing. The EBRD is indirectly linked to coal and base metal mining projects through “captive mines” associated with integrated metal works (steel, zinc, copper, aluminium), and via energy sources for power plants and district heating. The projects associated with captive mines – which are distributed across different Banking Teams – are considered by example only (Chapter 2.4). As with the WBG, quarry operations (surface mining for limestone, marble, gravel, sand, and clay) are excluded in this Study, even though they represent an extractive process and potentially may have significant environmental impacts. EBRD is also involved in the sector through Financial Intermediaries (FI) and its Trade Facilitation Programme, but a detailed review of these activities was not the focus of this Special Study. Finally, a review of the numerous technical cooperation (TC) activities in the sector, although looked at indirectly through the projects and lessons learned database, is also beyond the scope of this Study. 1.2 OBJECTIVES FOR THIS SPECIAL STUDY The 2001 EBRD “Transition Impact Retrospective Report”, states that: “Exclusive focus on the evaluation of individual projects can miss synergistic and scale effects associated with sustained investment support in a sector, involving many independent projects.”4 This Special Study takes a sector perspective in addressing the Bank’s EI performance. The objectives of this Special Study are to:
• review the Natural Resources Operations Policy of 1999, which include the
following objectives: - focus on Russia (North and Far East) and the Caspian Sea - promote privatisation, particularly in eastern and central Europe and - promote reductions in Greenhouse Gas (GHG) emissions.
• assess whether the challenges, as identified, were met. The challenges identified were to:
4 “Transition Impact Retrospective”, EBRD, 2001, page 9.
Special Study: Extractive Industries Page 3 of 47
- increase private sector participation and promote strategic investments in the sector
- reduce transport bottlenecks and ensure competitive market access - improve the regulatory and institutional framework - set high standards for business conduct and environmental protection.
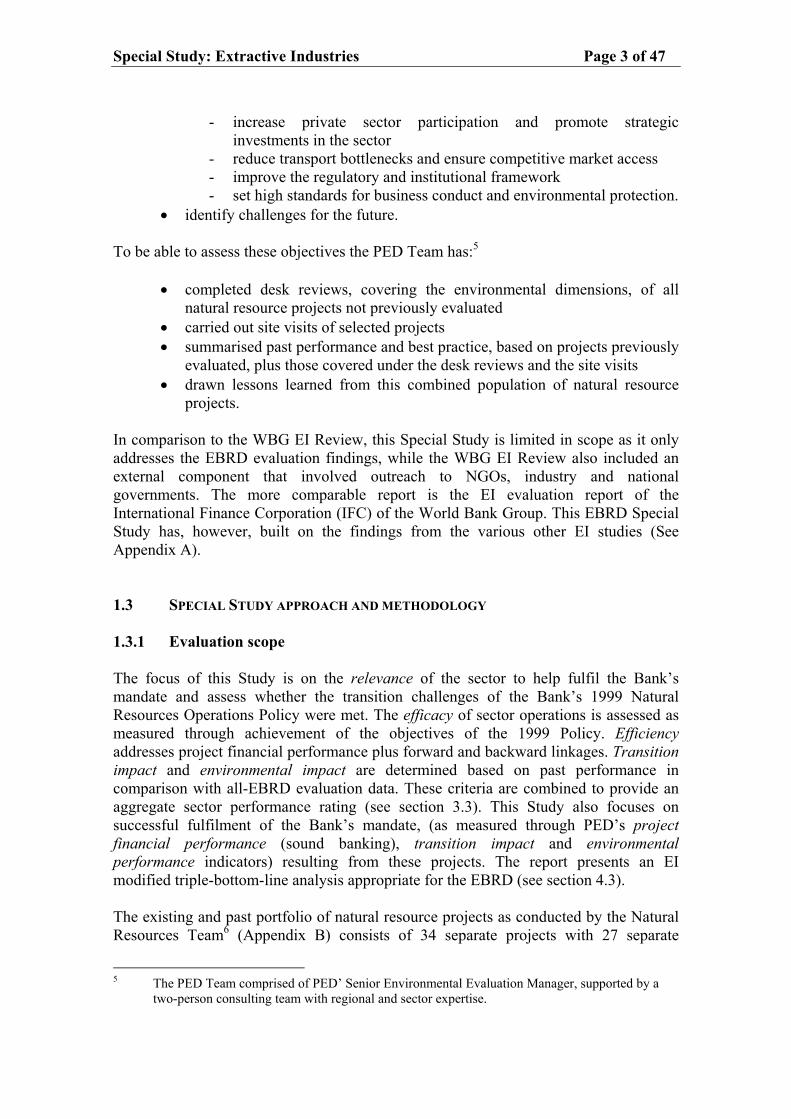
• identify challenges for the future. To be able to assess these objectives the PED Team has:5
• completed desk reviews, covering the environmental dimensions, of all natural resource projects not previously evaluated
• carried out site visits of selected projects • summarised past performance and best practice, based on projects previously
evaluated, plus those covered under the desk reviews and the site visits • drawn lessons learned from this combined population of natural resource
projects. In comparison to the WBG EI Review, this Special Study is limited in scope as it only addresses the EBRD evaluation findings, while the WBG EI Review also included an external component that involved outreach to NGOs, industry and national governments. The more comparable report is the EI evaluation report of the International Finance Corporation (IFC) of the World Bank Group. This EBRD Special Study has, however, built on the findings from the various other EI studies (See Appendix A). 1.3 SPECIAL STUDY APPROACH AND METHODOLOGY 1.3.1 Evaluation scope The focus of this Study is on the relevance of the sector to help fulfil the Bank’s mandate and assess whether the transition challenges of the Bank’s 1999 Natural Resources Operations Policy were met. The efficacy of sector operations is assessed as measured through achievement of the objectives of the 1999 Policy. Efficiency addresses project financial performance plus forward and backward linkages. Transition impact and environmental impact are determined based on past performance in comparison with all-EBRD evaluation data. These criteria are combined to provide an aggregate sector performance rating (see section 3.3). This Study also focuses on successful fulfilment of the Bank’s mandate, (as measured through PED’s project financial performance (sound banking), transition impact and environmental performance indicators) resulting from these projects. The report presents an EI modified triple-bottom-line analysis appropriate for the EBRD (see section 4.3). The existing and past portfolio of natural resource projects as conducted by the Natural Resources Team6 (Appendix B) consists of 34 separate projects with 27 separate
5 The PED Team comprised of PED’ Senior Environmental Evaluation Manager, supported by a
two-person consulting team with regional and sector expertise.
Page 4 of 47 Special Study: Extractive Industries
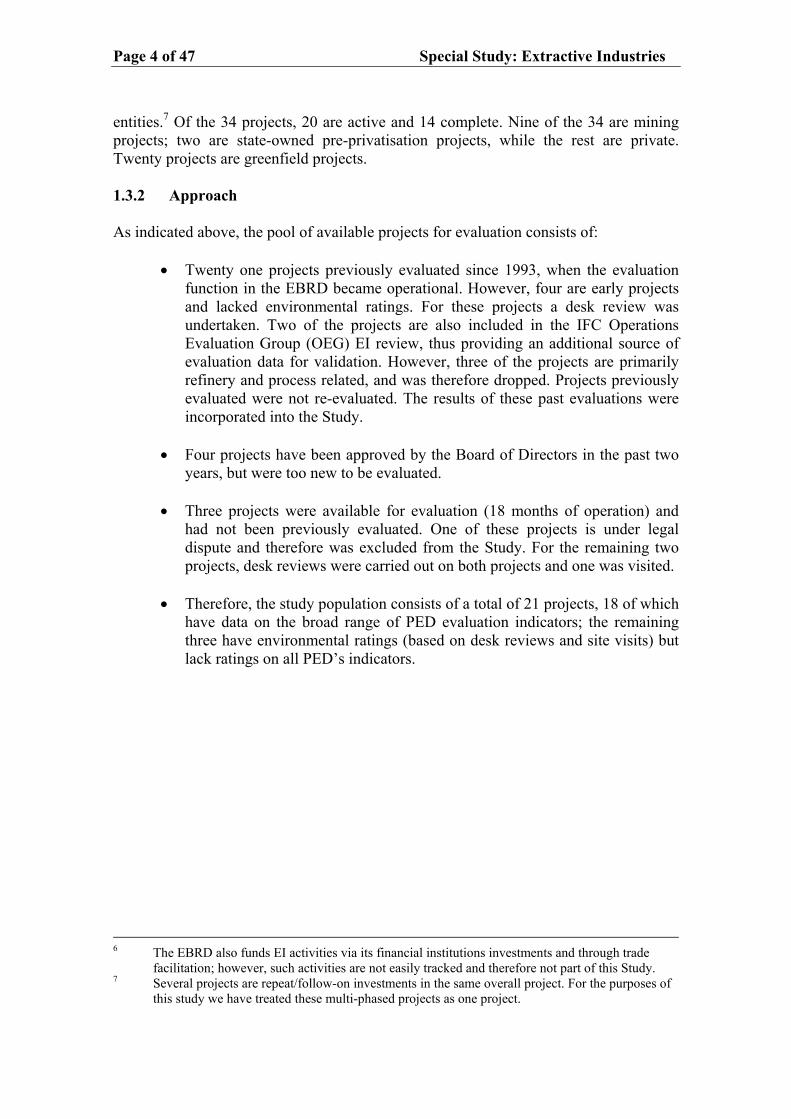
entities.7 Of the 34 projects, 20 are active and 14 complete. Nine of the 34 are mining projects; two are state-owned pre-privatisation projects, while the rest are private. Twenty projects are greenfield projects. 1.3.2 Approach As indicated above, the pool of available projects for evaluation consists of:
• Twenty one projects previously evaluated since 1993, when the evaluation
function in the EBRD became operational. However, four are early projects and lacked environmental ratings. For these projects a desk review was undertaken. Two of the projects are also included in the IFC Operations Evaluation Group (OEG) EI review, thus providing an additional source of evaluation data for validation. However, three of the projects are primarily refinery and process related, and was therefore dropped. Projects previously evaluated were not re-evaluated. The results of these past evaluations were incorporated into the Study.
• Four projects have been approved by the Board of Directors in the past two
years, but were too new to be evaluated.
• Three projects were available for evaluation (18 months of operation) and had not been previously evaluated. One of these projects is under legal dispute and therefore was excluded from the Study. For the remaining two projects, desk reviews were carried out on both projects and one was visited.
• Therefore, the study population consists of a total of 21 projects, 18 of which
have data on the broad range of PED evaluation indicators; the remaining three have environmental ratings (based on desk reviews and site visits) but lack ratings on all PED’s indicators.
6 The EBRD also funds EI activities via its financial institutions investments and through trade
facilitation; however, such activities are not easily tracked and therefore not part of this Study. 7 Several projects are repeat/follow-on investments in the same overall project. For the purposes of
this study we have treated these multi-phased projects as one project.
Special Study: Extractive Industries Page 5 of 47
2. SECTOR CONTEXT AND RATIONALE 2.1 THE EBRD’S NATURAL RESOURCE OPERATIONS POLICY The EBRD’s Natural Resources Operations Policy of 1999 identifies operational objectives and transition challenges which are important for the fulfilment of the Bank’s mandate.8 Prior to this policy, the Bank did not have an EI sector specific policy; rather the Bank’s approach to the sector was encapsulated in its energy policies, country strategies and environmental policies. The 1999 Policy was based on past experience and the portfolio at that time, and provided guidance for future investments. The Policy focuses on oil and gas and partially on mining projects. This document contains the attributes of both a “Policy” and a “Strategy” document. The challenges identified in the Policy are the need to:9
• increase private sector participation and promote strategic investments in the sector
• reduce transport bottlenecks and ensure competitive market access • improve the regulatory and institutional framework • set high standards for business conduct and environmental protection.
To meet the Bank’s operational objectives under the Policy/Strategy the following sector initiatives were identified:
• focus on Russia (North and Far East) and the Caspian Sea • promote privatisation, particularly in eastern and central Europe • promote reductions in Greenhouse Gas (GHG) emissions • support pipeline development.
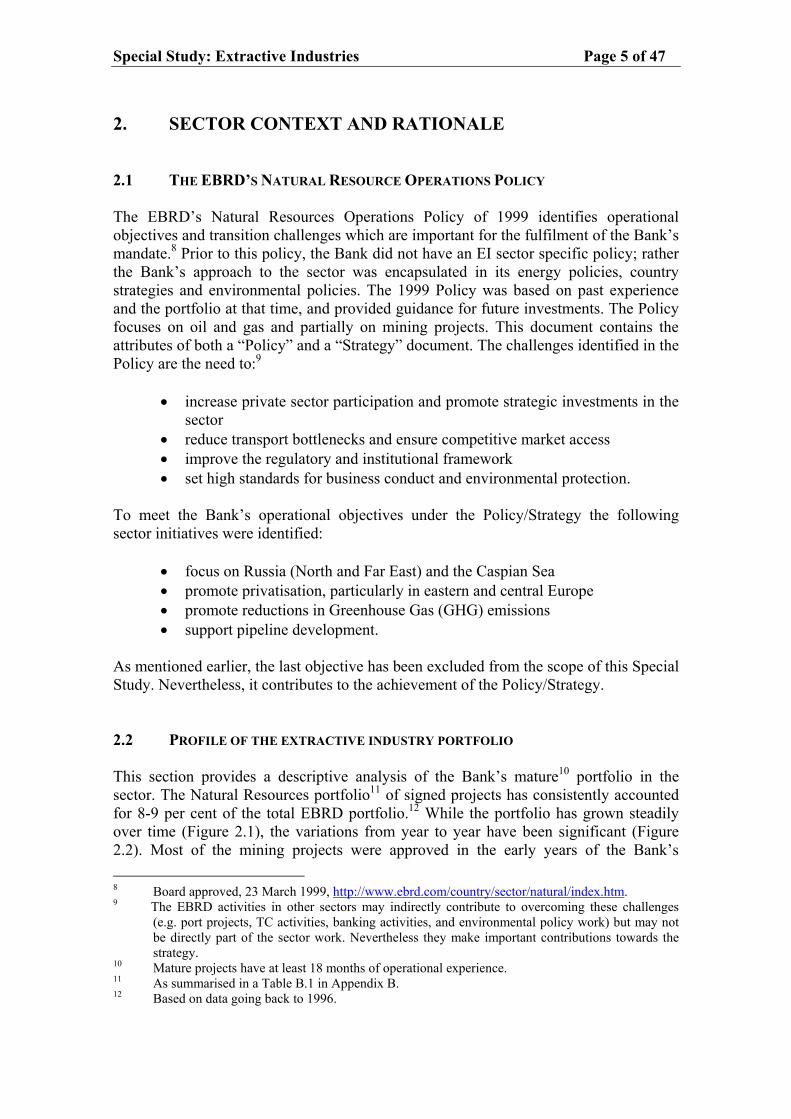
As mentioned earlier, the last objective has been excluded from the scope of this Special Study. Nevertheless, it contributes to the achievement of the Policy/Strategy. 2.2 PROFILE OF THE EXTRACTIVE INDUSTRY PORTFOLIO This section provides a descriptive analysis of the Bank’s mature10 portfolio in the sector. The Natural Resources portfolio11 of signed projects has consistently accounted for 8-9 per cent of the total EBRD portfolio.12 While the portfolio has grown steadily over time (Figure 2.1), the variations from year to year have been significant (Figure 2.2). Most of the mining projects were approved in the early years of the Bank’s 8 Board approved, 23 March 1999, http://www.ebrd.com/country/sector/natural/index.htm. 9 The EBRD activities in other sectors may indirectly contribute to overcoming these challenges
(e.g. port projects, TC activities, banking activities, and environmental policy work) but may not be directly part of the sector work. Nevertheless they make important contributions towards the strategy.
10 Mature projects have at least 18 months of operational experience. 11 As summarised in a Table B.1 in Appendix B. 12 Based on data going back to 1996.
Page 6 of 47 Special Study: Extractive Industries
experience, partly reflecting commodity price cycles. Because of the complexity of EI operations, preparation time is usually lengthy, resulting in variations in the year-on-year portfolio. Mining operations represent 14 per cent of the EI portfolio (by volume) and all are gold related projects.13
Figure 2.1: Cumulative volume of the extractive industry portfolio
0
200,000
400,000
600,000
800,000
1,000,000
1,200,000
1,400,000
1992 1993 1994 1995 1996 1997 1998 1999 2000 2001 2002 2003
EU
R x
1000
Oil & Gas Mining
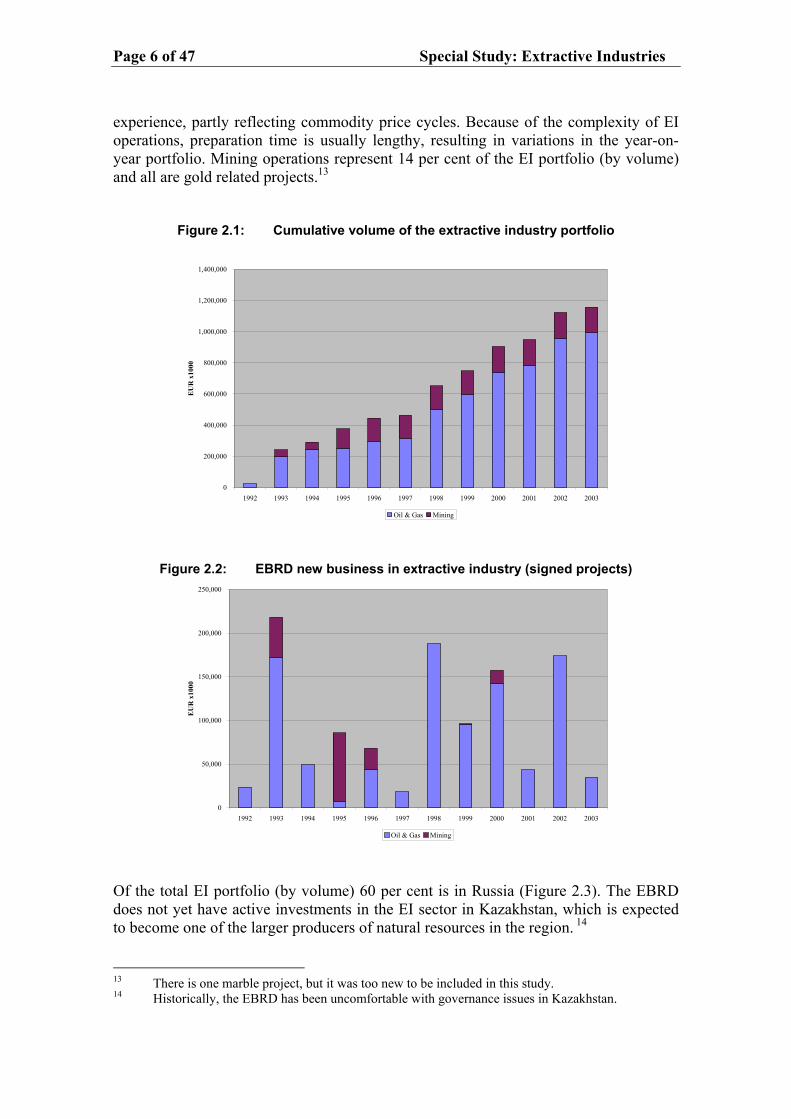
Figure 2.2: EBRD new business in extractive industry (signed projects)
0
50,000
100,000
150,000
200,000
250,000
1992 1993 1994 1995 1996 1997 1998 1999 2000 2001 2002 2003
EU
R x
1000
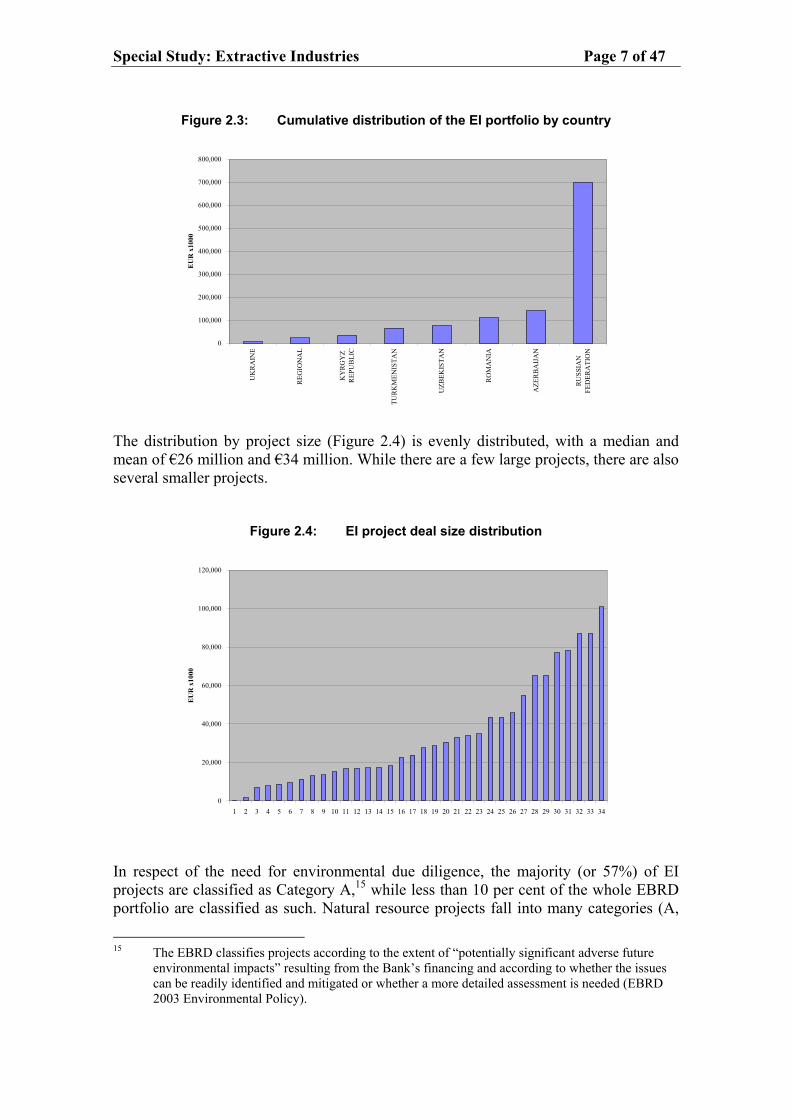
Oil & Gas Mining Of the total EI portfolio (by volume) 60 per cent is in Russia (Figure 2.3). The EBRD does not yet have active investments in the EI sector in Kazakhstan, which is expected to become one of the larger producers of natural resources in the region. 14 13 There is one marble project, but it was too new to be included in this study. 14 Historically, the EBRD has been uncomfortable with governance issues in Kazakhstan.
Special Study: Extractive Industries Page 7 of 47
Figure 2.3: Cumulative distribution of the EI portfolio by country
0
100,000
200,000
300,000
400,000
500,000
600,000
700,000
800,000
UK
RA
INE
REG
ION
AL
KY
RG
YZ
REP
UB
LIC
TUR
KM
ENIS
TAN
UZB
EKIS
TAN
RO
MA
NIA
AZE
RB
AIJ
AN
RU
SSIA
NFE
DER
ATI
ON
EU
R x
1000
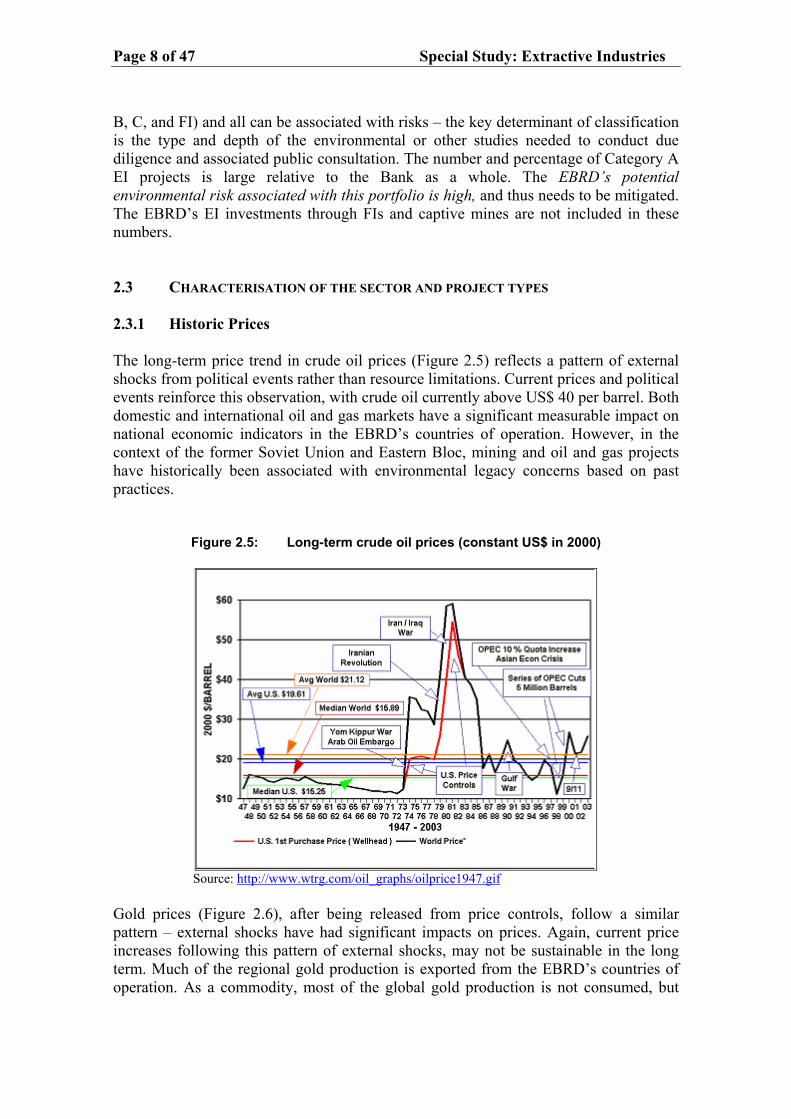
The distribution by project size (Figure 2.4) is evenly distributed, with a median and mean of €26 million and €34 million. While there are a few large projects, there are also several smaller projects.
Figure 2.4: EI project deal size distribution
0
20,000
40,000
60,000
80,000
100,000
120,000
1 2 3 4 5 6 7 8 9 10 11 12 13 14 15 16 17 18 19 20 21 22 23 24 25 26 27 28 29 30 31 32 33 34
EU
R x
1000
In respect of the need for environmental due diligence, the majority (or 57%) of EI projects are classified as Category A,15 while less than 10 per cent of the whole EBRD portfolio are classified as such. Natural resource projects fall into many categories (A,
15 The EBRD classifies projects according to the extent of “potentially significant adverse future
environmental impacts” resulting from the Bank’s financing and according to whether the issues can be readily identified and mitigated or whether a more detailed assessment is needed (EBRD 2003 Environmental Policy).
Page 8 of 47 Special Study: Extractive Industries
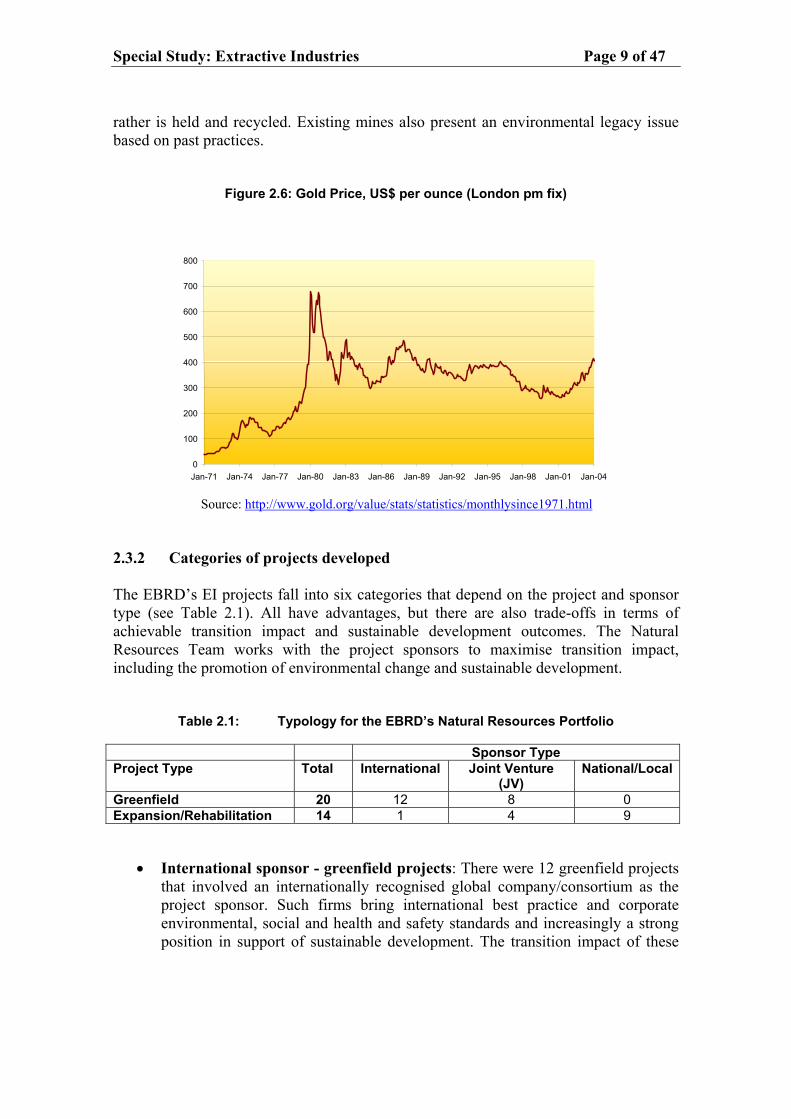
B, C, and FI) and all can be associated with risks – the key determinant of classification is the type and depth of the environmental or other studies needed to conduct due diligence and associated public consultation. The number and percentage of Category A EI projects is large relative to the Bank as a whole. The EBRD’s potential environmental risk associated with this portfolio is high, and thus needs to be mitigated. The EBRD’s EI investments through FIs and captive mines are not included in these numbers. 2.3 CHARACTERISATION OF THE SECTOR AND PROJECT TYPES 2.3.1 Historic Prices The long-term price trend in crude oil prices (Figure 2.5) reflects a pattern of external shocks from political events rather than resource limitations. Current prices and political events reinforce this observation, with crude oil currently above US$ 40 per barrel. Both domestic and international oil and gas markets have a significant measurable impact on national economic indicators in the EBRD’s countries of operation. However, in the context of the former Soviet Union and Eastern Bloc, mining and oil and gas projects have historically been associated with environmental legacy concerns based on past practices.
Figure 2.5: Long-term crude oil prices (constant US$ in 2000)
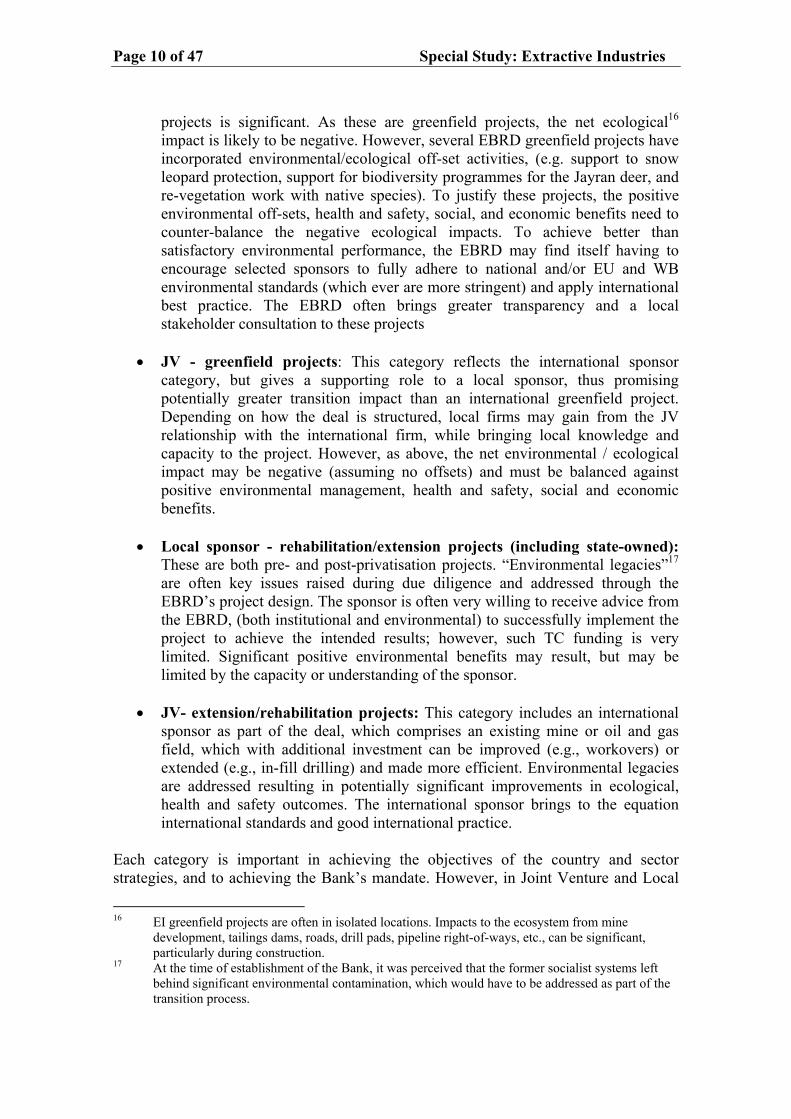
Source: http://www.wtrg.com/oil_graphs/oilprice1947.gif Gold prices (Figure 2.6), after being released from price controls, follow a similar pattern – external shocks have had significant impacts on prices. Again, current price increases following this pattern of external shocks, may not be sustainable in the long term. Much of the regional gold production is exported from the EBRD’s countries of operation. As a commodity, most of the global gold production is not consumed, but
Special Study: Extractive Industries Page 9 of 47
rather is held and recycled. Existing mines also present an environmental legacy issue based on past practices.
Figure 2.6: Gold Price, US$ per ounce (London pm fix)
800
700
600
500
400
300
200
100
0 Jan-74 Jan-77 Jan-80 Jan-01 Jan-04 Jan-71 Jan-83 Jan-86 Jan-89 Jan-92 Jan-95 Jan-98
Source: http://www.gold.org/value/stats/statistics/monthlysince1971.html 2.3.2 Categories of projects developed The EBRD’s EI projects fall into six categories that depend on the project and sponsor type (see Table 2.1). All have advantages, but there are also trade-offs in terms of achievable transition impact and sustainable development outcomes. The Natural Resources Team works with the project sponsors to maximise transition impact, including the promotion of environmental change and sustainable development.
Table 2.1: Typology for the EBRD’s Natural Resources Portfolio Sponsor Type Project Type Total International Joint Venture
(JV) National/Local
Greenfield 20 12 8 0 Expansion/Rehabilitation 14 1 4 9
• International sponsor - greenfield projects: There were 12 greenfield projects that involved an internationally recognised global company/consortium as the project sponsor. Such firms bring international best practice and corporate environmental, social and health and safety standards and increasingly a strong position in support of sustainable development. The transition impact of these
Page 10 of 47 Special Study: Extractive Industries
projects is significant. As these are greenfield projects, the net ecological16 impact is likely to be negative. However, several EBRD greenfield projects have incorporated environmental/ecological off-set activities, (e.g. support to snow leopard protection, support for biodiversity programmes for the Jayran deer, and re-vegetation work with native species). To justify these projects, the positive environmental off-sets, health and safety, social, and economic benefits need to counter-balance the negative ecological impacts. To achieve better than satisfactory environmental performance, the EBRD may find itself having to encourage selected sponsors to fully adhere to national and/or EU and WB environmental standards (which ever are more stringent) and apply international best practice. The EBRD often brings greater transparency and a local stakeholder consultation to these projects
• JV - greenfield projects: This category reflects the international sponsor
category, but gives a supporting role to a local sponsor, thus promising potentially greater transition impact than an international greenfield project. Depending on how the deal is structured, local firms may gain from the JV relationship with the international firm, while bringing local knowledge and capacity to the project. However, as above, the net environmental / ecological impact may be negative (assuming no offsets) and must be balanced against positive environmental management, health and safety, social and economic benefits.
• Local sponsor - rehabilitation/extension projects (including state-owned):
These are both pre- and post-privatisation projects. “Environmental legacies”17 are often key issues raised during due diligence and addressed through the EBRD’s project design. The sponsor is often very willing to receive advice from the EBRD, (both institutional and environmental) to successfully implement the project to achieve the intended results; however, such TC funding is very limited. Significant positive environmental benefits may result, but may be limited by the capacity or understanding of the sponsor.
• JV- extension/rehabilitation projects: This category includes an international
sponsor as part of the deal, which comprises an existing mine or oil and gas field, which with additional investment can be improved (e.g., workovers) or extended (e.g., in-fill drilling) and made more efficient. Environmental legacies are addressed resulting in potentially significant improvements in ecological, health and safety outcomes. The international sponsor brings to the equation international standards and good international practice.
Each category is important in achieving the objectives of the country and sector strategies, and to achieving the Bank’s mandate. However, in Joint Venture and Local
16 EI greenfield projects are often in isolated locations. Impacts to the ecosystem from mine
development, tailings dams, roads, drill pads, pipeline right-of-ways, etc., can be significant, particularly during construction.
17 At the time of establishment of the Bank, it was perceived that the former socialist systems left behind significant environmental contamination, which would have to be addressed as part of the transition process.
Special Study: Extractive Industries Page 11 of 47
Sponsor projects – which account for 63 per cent of the Bank’s current portfolio – transition impacts and the potential for positive environmental change appear to be higher. Country and sector strategies should address which project categories should receive higher priority, given the needs of the country and the project mix available. 2.4 THE EBRD’S EI ACTIVITIES UNACCOUNTED FOR IN THE POLICY While this Special Study is focused on the EBRD’s investments in EI as implemented through the Natural Resources Team, in carrying out this evaluation, the PED Team became aware of other EBRD investments that should also be classified as EI investments. Based on this evaluation, the Study recommends the following: The Bank should distinguish the “what” and “how” of its involvement in EI. What the EBRD is willing to support within the sector should delineate the Bank’s scope and should incorporate issues such as captive mines and funding mechanisms (e.g. direct lending, equity, FI investments) and under what conditions (governance, corruption etc.) the Bank is willing to invest. How the EBRD will implement its operations, and more specifically how the Natural Resources Team will pursue new business, and respond to current market conditions, should be subject to change, as is the case with the Bank’s handling of Country Strategies. The examples below, in respect of unaccounted for EI activities, are provided to be illustrative only and do not constitute a representative or an exhaustive list. 2.4.1 Captive mines As noted, all of the Natural Resource Banking Team’s mining projects are gold mines, while the other mineral related aspects of projects – for example, coal, iron, bauxite, zinc, nickel, copper, and limestone – are often associated with smelting, foundry, or power projects, and are handled in different departments in the Bank. In these cases, a member of the Natural Resources Team is often, but not always, assigned to the project team. The Bank could consider emphasising a matrix management approach to these activities to take advantage of its specialised knowledge in this sector. Mining of coal and ferrous and non-ferrous minerals are important sectors in the EBRD’s countries of operation. Such operations often fall into the category of “captive mines” – defined here as mining operations associated with an industrial operation that the EBRD is financing, for example, steel, aluminium, copper, and cement production, or heating and power production. The EBRD may also finance marble quarries, limestone quarries for cement plants, and clay, gravel and sand quarries for ceramics, building and road construction. From an environmental perspective, such mines may pose significant environmental concerns. Many captive mines are open pit with tailings dams, may involve mine waste leaching, and will involve occupational health and safety issues. Coal mining also raises mine methane issues (explosion/safety risk and GHG) and collectively coal mines have a negative track record with respect to occupational health and safety (accidental deaths and black lung disease). However, unlike gold projects, which are often short term (10-20 years), and mainly lead to exports, iron ore
Page 12 of 47 Special Study: Extractive Industries
mining and other industrial mineral mines tend to be longer-term (50-100 years) and are associated with local industrial production, thus leading to greater potential for transition impacts. As part of this review, the PED Team briefly looked at selected captive mines. The designs of some of these projects included environmental health and mine safety related issues, while others failed to address these associated mines and focused entirely on the industrial project that was the recipient of financing. It proved to be impossible to identify all captive mines in the portfolio. The following are a few examples:
• A large Central Asian integrated steel plant, which includes ownership and operation of several coal mines and a large coal-fired power plant.
• The EBRD recently approved a project for an iron ore pelletising plant for a
subsidiary of a Russian integrated steel producer. The plant is located adjacent to an iron ore mine owned by the same company, yet the EBRD’s environmental and health and safety due diligence made no mention of the mining operations.
During project appraisal the EBRD needs to look up and down the product chain. When a company purchases raw materials from the open market and has multiple sources, then industrial projects can be ring-fenced. However, when the mine is captive to a specific processing operation, the EBRD’s environmental due diligence should also undertake a full review of the mining operations. In accordance with the Environmental Policy, the direct investment must meet EU and national standards, while the rest of the assets (e.g., associated mines) should have a programme to come into compliance with national standards and good international practice over a period of time. Legal leverage may be limited, but if the industrial project is the sole ore purchaser, then the sponsor should be able to demand a specified level of environmental, health and safety and social performance. 2.4.2 Financial Intermediaries (FIs) Investments through FIs now represent over 33 per cent of total EBRD investments per year. FI deals cover a range of activities, from targeted credit lines, to venture capital funds, to leasing operations, to equity investments in local banks. The extent of environmental and social due diligence varies depending on the type of FI activity and the extent of the EBRD’s knowledge of sub-activities. In the case of targeted credit lines, the Environmental Department reviews all sub-activities, while the EBRD has very limited knowledge about loans and equity investments made by banks in which the Bank has only made an equity investment; however, the EBRD maintains a board seat in such investments. The EBRD’s Environmental Policy handles environmental due diligence on FI projects differently from direct investments; specifically, the EBRD normally only requires compliance with local/national standards. Where the sub-activities are on the referral list or would be rated as Category A projects, the EBRD requires an internal review. Effectively, the Bank has two performance standards – direct investments are required to comply with international standards and best practice; while FI investments must
Special Study: Extractive Industries Page 13 of 47
comply with host country standards, refer back to the EBRD certain defined projects types, and comply with the EBRD Exclusion list of banned investments. This approach assumes that local laws are sufficient, and that local banks have the capacity to screen for compliance. The EBRD’s experience is that many countries have stringent environmental laws and regulations, yet at the same time the EBRD environmental staff acknowledges that enforcement is often a serious problem. The issue is less one of performance standards and more of enforcement. Both the EBRD and participating banks lack the capacity to monitor environmental performance of all FI sub-activities, while local environmental agencies are also constrained in their capacity to monitor and enforce national laws. The PED Team met with two FIs that were involved in the EI sector, and reviewed selected project files:
• The manager of a regional equity fund with EI investments in the oil and gas sector informed the PED Team that “these projects do not meet international environmental standards18.” This fund, which is jointly financed by the IFC, had a successful investment with operations in Turkmenistan and Africa. The African project came subsequent to the EBRD’s investment, which focused on the Turkmenistan field.
• The EBRD is supporting mining equipment leasing operations. Environmental
due diligence on these focuses on the emissions performance and safety of the equipment, and a review of the lessee’s operations by the lessor. The lessor’s review focuses on performance indicators including equipment safety, environmental non-compliance, permit status, inspections, accidents/spills, complaints, and environmental impacts, with a particular focus on environmentally sensitive areas. The assumption is that local environmental authorities are responsible for ensuring that mining operators conform to the law. However, given knowledge about poor environmental enforcement of small scale mining operations, this may not be a reasonable assumption.
Due to the vulnerability issues associated with EI activities, PED recommends that for all FI activities involving a sub-activity that could be characterized as EI, the EBRD should consider requiring compliance with national and international standards (EU or WB). While the EBRD provides 86 sub-sector guidelines for FIs on its external website, there are currently no guidelines for oil and gas or gold mining operations. The EBRD maintains an Exclusion List and Referral List, which triggers refusal of project consideration or further contact with the EBRD. 2.4.3 Trade Facilitation Programme The EBRD’s Trade Facilitation Programme (TFP)19 is a network of banks that use the EBRD’s guarantees to reduce risks in international trade. The PED evaluation report on TFP rated overall performance Successful. However, an Internal Audit Report on TFP 18 Conversations with Fund Manger in Moscow in December 2003. 19 This programme was the subject of an evaluation in 2002 (OPER PE-02 211S) and an internal
audit report (7/023).
Page 14 of 47 Special Study: Extractive Industries
noted a limited number of large disbursements (multi-million US dollars) to major EI companies. Had such deals been handled as direct investments, more extensive environmental and social due diligence would have been required. The TFP environmental requirements have been amended in 2004 to capture these projects. Based on these three examples (captive mines, FI deals and TFP activities) PED recommends the following:
The current Standard Industry Coding (SIC), as applied in the EBRD, is used more as a division of responsibility than as an industry accounting system. However, this information is also used to report to the Board and external users on the distribution of the EBRD’s investments. Application of the coding system should be used for its primary purpose of accountability of investments. The Bank could consider modifying its coding system so that projects that fall in more than one category (e.g. captive mines) are captured. This would result in more accurate accounting to the Board, and may allow for better capturing of EI components of projects in all sectors. The Bank’s Natural Resources Operations Policy/Strategy should cover all Bank activities in the sector, not just those within a particular department.
2.5 EBRD EXTRACTIVE INDUSTRY INVESTMENTS AS COMPARED WITH FDI AND
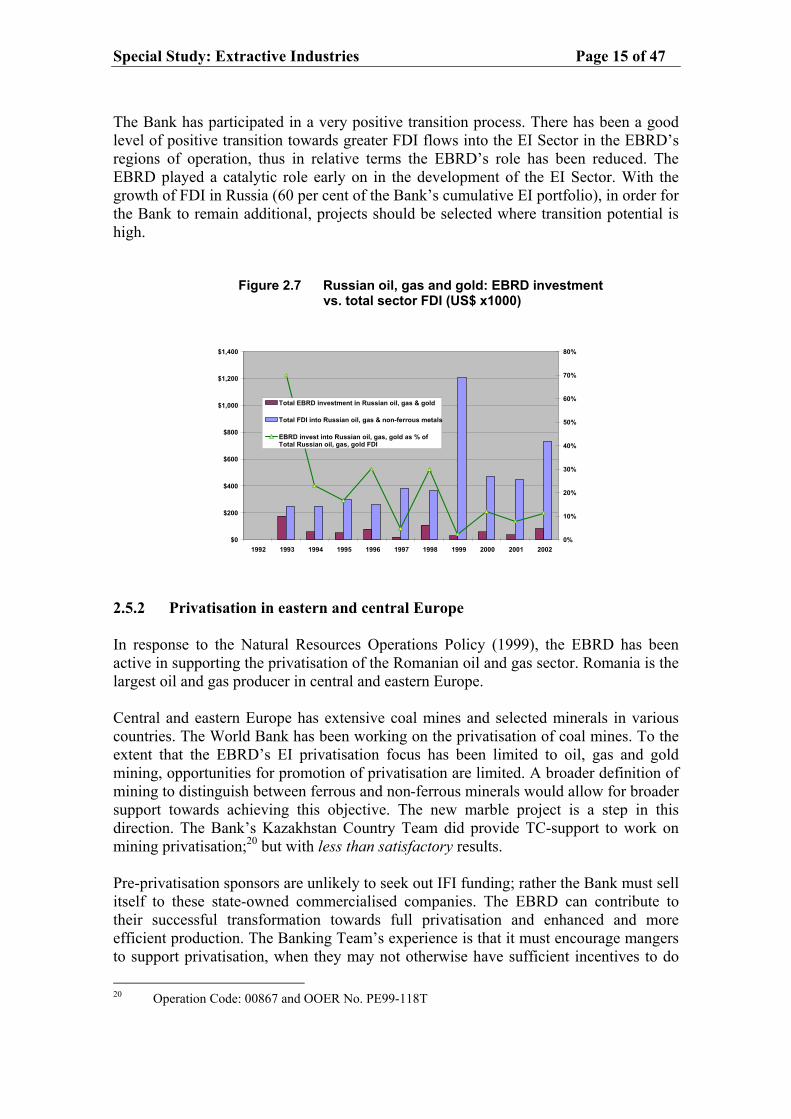
PRIVATISATION ACTIVITIES IN THE SECTOR This section briefly looks at FDI EI trends in the EBRD’s countries of operation. The purpose of this section is to benchmark the EBRD’s operations against industry performance. While difficult to quantify, owing to an absence of a comprehensive data set, it is reasonable to argue that the EBRD’s investment experience relative to other FDI has been better on average because of the Bank’s tendency to invest in larger projects, but more significantly because of the pursuit of its mission to promote corporate governance, fair and open governmental processes, environmental changes, and the transition to market economies. 2.5.1 FDI statistical overview The EBRD’s lending to the EI sector has been high relative to total levels of foreign direct investment (FDI), particularly in its early years of operation. The basic trend has been for total FDI to grow, and as could be expected, the Bank’s proportional share has declined as a percentage of the total in the later years. The Bank’s role can be best observed in Russia because of the importance of the EI Sector to the Russia economy and as a percentage of the Bank’s EI portfolio (Figure 2.7, with reference to data presented in Appendix C). Foreign direct investment into the EI Sector (oil, gas and gold) represented approximately 50 per cent of all FDI in 1993-94 before falling to an average of 10-20 per cent. In 1999, EI Sector FDI accounted 28 per cent of total FDI into Russia. Bank investment represented 70 per cent of Sector FDI in 1993, and between 17-30 per cent in the years 1994, 1995, 1996 and 1998.
Special Study: Extractive Industries Page 15 of 47
The Bank has participated in a very positive transition process. There has been a good level of positive transition towards greater FDI flows into the EI Sector in the EBRD’s regions of operation, thus in relative terms the EBRD’s role has been reduced. The EBRD played a catalytic role early on in the development of the EI Sector. With the growth of FDI in Russia (60 per cent of the Bank’s cumulative EI portfolio), in order for the Bank to remain additional, projects should be selected where transition potential is high.
Figure 2.7 Russian oil, gas and gold: EBRD investment vs. total sector FDI (US$ x1000)
80% $1,400
70% $1,200
60% Total EBRD investment in Russian oil, gas & gold$1,000
50% Total FDI into Russian oil, gas & non-ferrous metals
$800
40% EBRD invest into Russian oil, gas, gold as % of Total Russian oil, gas, gold FDI
$60030% 20% $400
10% $200
0% $0 1992 1993 1994 1995 1996 1997 1998 1999 2000 2001 2002
2.5.2 Privatisation in eastern and central Europe In response to the Natural Resources Operations Policy (1999), the EBRD has been active in supporting the privatisation of the Romanian oil and gas sector. Romania is the largest oil and gas producer in central and eastern Europe. Central and eastern Europe has extensive coal mines and selected minerals in various countries. The World Bank has been working on the privatisation of coal mines. To the extent that the EBRD’s EI privatisation focus has been limited to oil, gas and gold mining, opportunities for promotion of privatisation are limited. A broader definition of mining to distinguish between ferrous and non-ferrous minerals would allow for broader support towards achieving this objective. The new marble project is a step in this direction. The Bank’s Kazakhstan Country Team did provide TC-support to work on mining privatisation;20 but with less than satisfactory results. Pre-privatisation sponsors are unlikely to seek out IFI funding; rather the Bank must sell itself to these state-owned commercialised companies. The EBRD can contribute to their successful transformation towards full privatisation and enhanced and more efficient production. The Banking Team’s experience is that it must encourage mangers to support privatisation, when they may not otherwise have sufficient incentives to do
20 Operation Code: 00867 and OOER No. PE99-118T
Page 16 of 47 Special Study: Extractive Industries
so. This requires a different approach by the Natural Resources team. It could become a “rainmaker”21 for such deals – developing targeted marketing material and actively seeking out potential privatisation deals, in addition to responding to the projects that are presented to the Bank. As noted above, PED recommends that the Bank revisit the Natural Resources Policy/Strategy. The Policy should clearly define what the EBRD will and will not support, addressing such issues as “no-go zones”, future generation and stabilisation funds, governance, corruption, etc. It could also incorporate the EBRD’s position with respect to captive mines, FI investments and trade facilitation activities, and more broadly define Extractive Industries within the EBRD context. The Strategy needs to be based on solid technical data, with a focus on how to maximise transition impacts. It should also be flexible and regularly updated to reflect current market trends. The Bank is considering a new Energy Operations Policy incorporating extraction through energy production and energy efficiency.22 This is a positive step, but would then suggest the need for a separate Mining Policy.
21 “Rainmakers” are staff who focus on business development activities. They develop strong
relationships with potential clients and identify and promote potential projects at an early stage, for the Bank to then follow up on.
22 As discussed by Senior Bank staff at the NGO forum during the 2004 AGM.
Special Study: Extractive Industries Page 17 of 47
3. EVALUATION RESULTS AND COMPLIANCE WITH OPERATIONS’ OBJECTIVES
The findings of past evaluations of projects and their implications are presented in this Chapter. The last section of this Chapter is an introduction to PED’s analysis of lessons learned. Actual lessons learned are summarised in Appendix E, which is an integral part of this report and should be read as part of this Chapter. 3.1 STUDY POPULATION
The existing and past portfolio of natural resource projects (Appendix B) consists of 34 separate projects, with 27 separate entities. PED have previously evaluated 21 projects, and the findings from those evaluations are incorporated into this Special Study. However, four early project evaluations lacked environmental indicators. Desk reviews were carried out on each of these projects to complete the analysis. Three projects remained to be evaluated and were therefore the subject of environmental desk reviews. Site visits were conducted on one mining operation and one oil and gas project. Lastly, three projects were process-related and therefore dropped, and one project is under legal dispute and therefore not included in this Study. Thus the Study population consists of 21 projects/project entities, of which 18 have evaluation data on most indictors; of which 3 only have data on the environmental indicators. As the focus of this Study is on sustainability with specific reference to environmental and social indicators, for those projects that are the subject of a desk review only, complete analysis on all indicators was not undertaken. Social requirements were formally incorporated into the EBRD Environmental Policy in 2003, and therefore had not taken effect on the projects evaluated, and thus do not play a part in the ratings. The implications of the new social policies are addressed in Section 3.4.4. For reasons of confidentiality, this Chapter masks individual projects. 3.1.1 Study limitations In presenting these findings, PED’s Evaluation Team offers two caveats:
• Given a Study population of 21, statistical indicators should only be taken as indicative, particularly when the numbers are sub-aggregated by year, country or by sub-sector (mining vs. oil and gas). The results and findings of this Special Study are specific to this population of 21 projects at the time each was evaluated.
• For past projects that have already been reviewed, the PED Team did not go back to update the findings, except to complete the reviews that were missing an environmental dimension. Evaluation findings are very time dependent. PED’s best practice approach, as described in PED’s 2004 “Evaluation Policy Review”, defines when a project is available for evaluation, thus all projects are in principle evaluated at the same stage in the project cycle. Revisiting projects at a much later date, may provide a more accurate assessment of current conditions,
Page 18 of 47 Special Study: Extractive Industries
but would not allow for cross project comparisons, as projects would have had varying performances over different time periods. In terms of project business success, the 1998 Russian economic crisis was clearly a boundary line. Comparing projects pre- and post-1998 may lead to different outcomes. This should be less of a factor on the environmental dimension.
• In addition, PED’s rating indicators have been defined and modified over time.
PED previously used a four-point scale for several indicators. Based on the available data, for the purposes of this Study, PED has used the four-point scale for environmental performance and the six-point scale for transition impact.
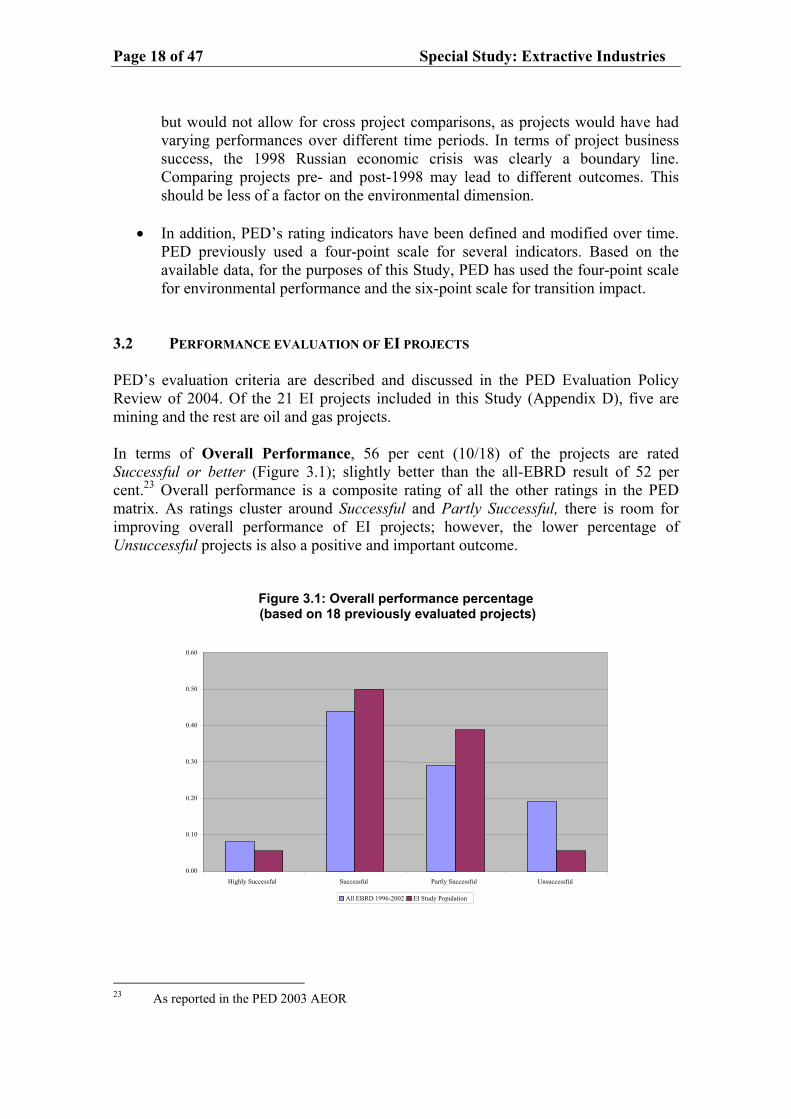
3.2 PERFORMANCE EVALUATION OF EI PROJECTS PED’s evaluation criteria are described and discussed in the PED Evaluation Policy Review of 2004. Of the 21 EI projects included in this Study (Appendix D), five are mining and the rest are oil and gas projects. In terms of Overall Performance, 56 per cent (10/18) of the projects are rated Successful or better (Figure 3.1); slightly better than the all-EBRD result of 52 per cent.23 Overall performance is a composite rating of all the other ratings in the PED matrix. As ratings cluster around Successful and Partly Successful, there is room for improving overall performance of EI projects; however, the lower percentage of Unsuccessful projects is also a positive and important outcome.
Figure 3.1: Overall performance percentage (based on 18 previously evaluated projects)
0.60
0.50
0.40
0.30
0.20
0.10
0.00 Highly Successful Unsuccessful Successful Partly Successful
All EBRD 1996-2002 EI Study Population
23 As reported in the PED 2003 AEOR
Special Study: Extractive Industries Page 19 of 47
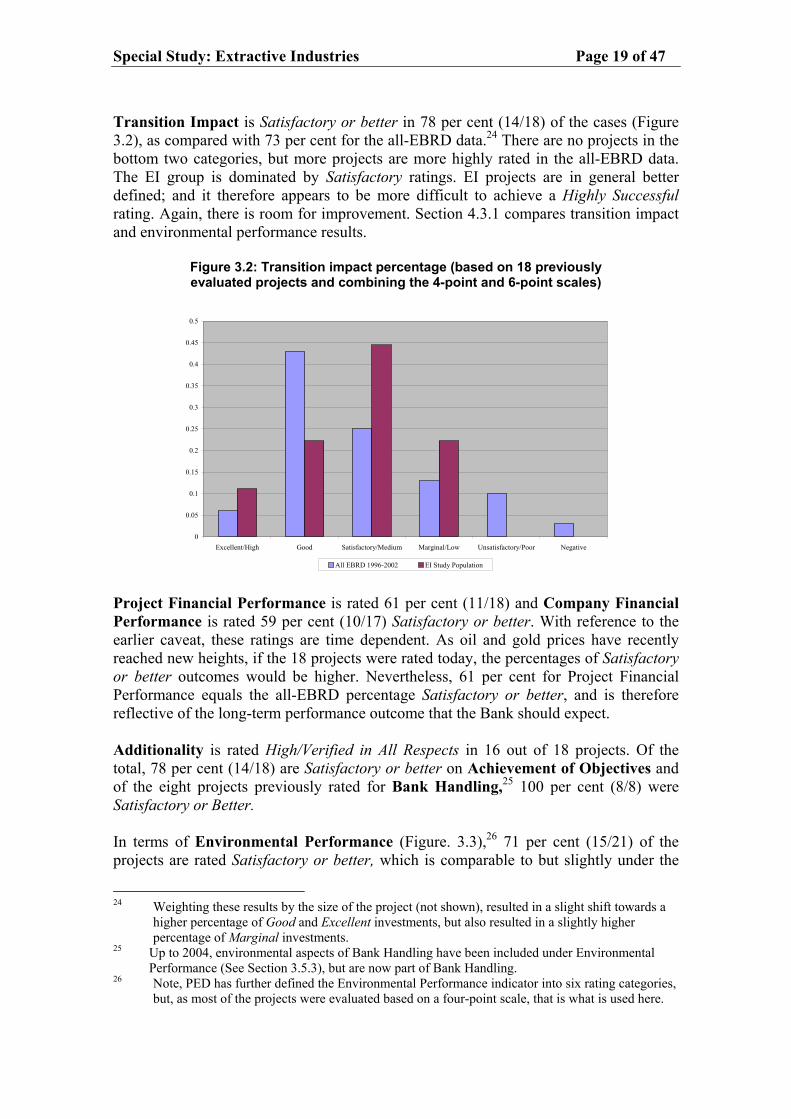
Transition Impact is Satisfactory or better in 78 per cent (14/18) of the cases (Figure 3.2), as compared with 73 per cent for the all-EBRD data.24 There are no projects in the bottom two categories, but more projects are more highly rated in the all-EBRD data. The EI group is dominated by Satisfactory ratings. EI projects are in general better defined; and it therefore appears to be more difficult to achieve a Highly Successful rating. Again, there is room for improvement. Section 4.3.1 compares transition impact and environmental performance results.
Figure 3.2: Transition impact percentage (based on 18 previously evaluated projects and combining the 4-point and 6-point scales)
0
0.05
0.1
0.15
0.2
0.25
0.3
0.35
0.4
0.45
0.5
Excellent/High Good Satisfactory/Medium Marginal/Low Unsatisfactory/Poor Negative
All EBRD 1996-2002 EI Study Population Project Financial Performance is rated 61 per cent (11/18) and Company Financial Performance is rated 59 per cent (10/17) Satisfactory or better. With reference to the earlier caveat, these ratings are time dependent. As oil and gold prices have recently reached new heights, if the 18 projects were rated today, the percentages of Satisfactory or better outcomes would be higher. Nevertheless, 61 per cent for Project Financial Performance equals the all-EBRD percentage Satisfactory or better, and is therefore reflective of the long-term performance outcome that the Bank should expect. Additionality is rated High/Verified in All Respects in 16 out of 18 projects. Of the total, 78 per cent (14/18) are Satisfactory or better on Achievement of Objectives and of the eight projects previously rated for Bank Handling,25 100 per cent (8/8) were Satisfactory or Better. In terms of Environmental Performance (Figure. 3.3),26 71 per cent (15/21) of the projects are rated Satisfactory or better, which is comparable to but slightly under the
24 Weighting these results by the size of the project (not shown), resulted in a slight shift towards a
higher percentage of Good and Excellent investments, but also resulted in a slightly higher percentage of Marginal investments.
25 Up to 2004, environmental aspects of Bank Handling have been included under Environmental Performance (See Section 3.5.3), but are now part of Bank Handling.
26 Note, PED has further defined the Environmental Performance indicator into six rating categories, but, as most of the projects were evaluated based on a four-point scale, that is what is used here.
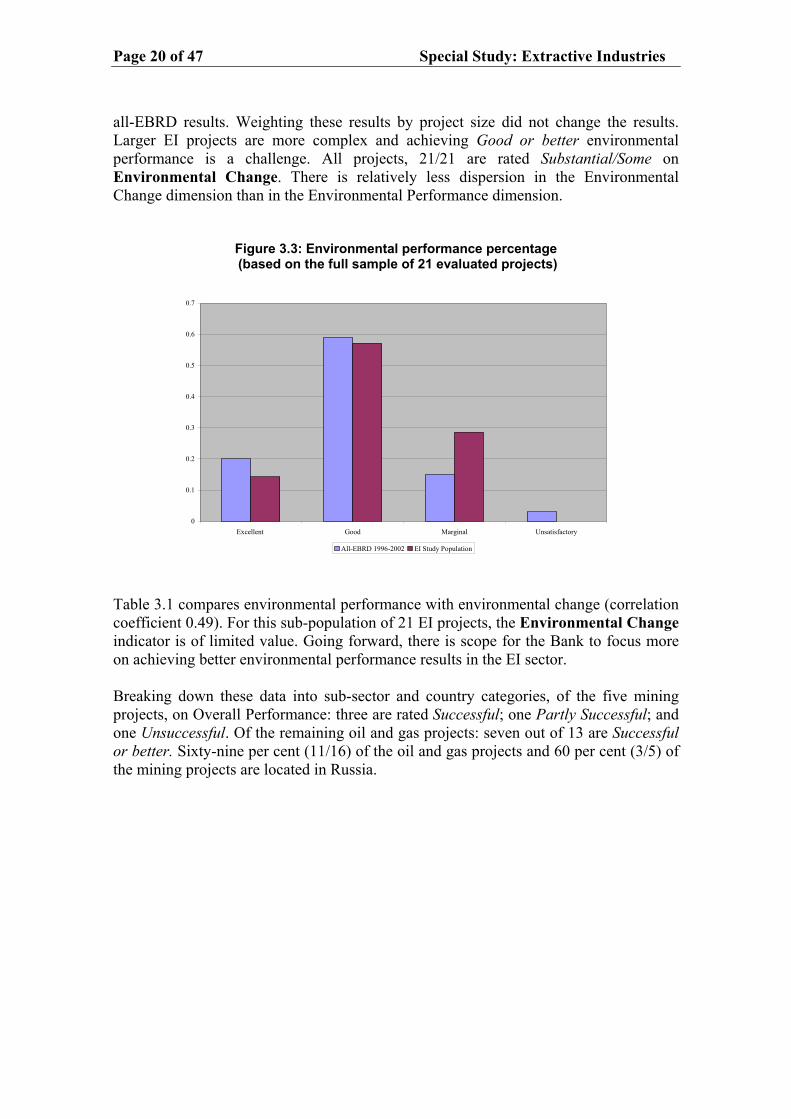
Page 20 of 47 Special Study: Extractive Industries
all-EBRD results. Weighting these results by project size did not change the results. Larger EI projects are more complex and achieving Good or better environmental performance is a challenge. All projects, 21/21 are rated Substantial/Some on Environmental Change. There is relatively less dispersion in the Environmental Change dimension than in the Environmental Performance dimension.
Figure 3.3: Environmental performance percentage (based on the full sample of 21 evaluated projects)
0
0.1
0.2
0.3
0.4
0.5
0.6
0.7
Excellent Good Marginal Unsatisfactory
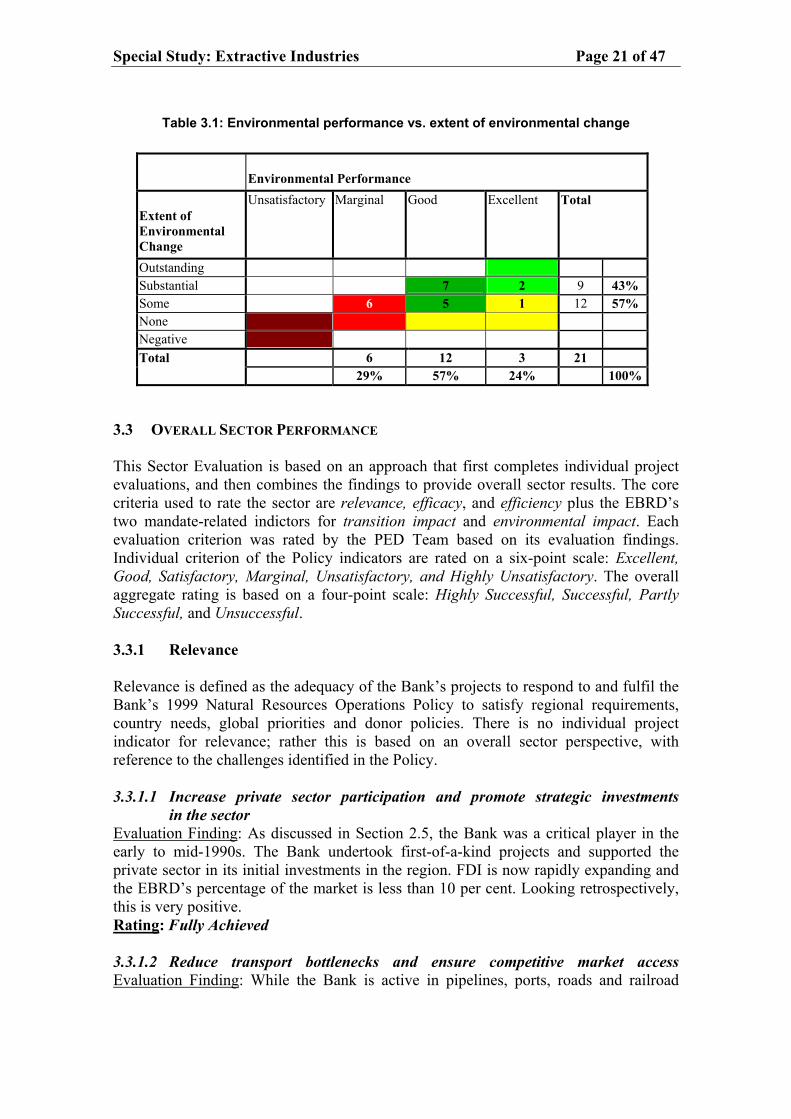
All-EBRD 1996-2002 EI Study Population Table 3.1 compares environmental performance with environmental change (correlation coefficient 0.49). For this sub-population of 21 EI projects, the Environmental Change indicator is of limited value. Going forward, there is scope for the Bank to focus more on achieving better environmental performance results in the EI sector. Breaking down these data into sub-sector and country categories, of the five mining projects, on Overall Performance: three are rated Successful; one Partly Successful; and one Unsuccessful. Of the remaining oil and gas projects: seven out of 13 are Successful or better. Sixty-nine per cent (11/16) of the oil and gas projects and 60 per cent (3/5) of the mining projects are located in Russia.
Special Study: Extractive Industries Page 21 of 47
Table 3.1: Environmental performance vs. extent of environmental change
Environmental Performance
Extent of Environmental Change
Unsatisfactory Marginal Good Excellent Total
Outstanding Substantial 7 2 9 43% Some 6 5 1 12 57% None Negative Total 6 12 3 21 29% 57% 24% 100%
3.3 OVERALL SECTOR PERFORMANCE This Sector Evaluation is based on an approach that first completes individual project evaluations, and then combines the findings to provide overall sector results. The core criteria used to rate the sector are relevance, efficacy, and efficiency plus the EBRD’s two mandate-related indictors for transition impact and environmental impact. Each evaluation criterion was rated by the PED Team based on its evaluation findings. Individual criterion of the Policy indicators are rated on a six-point scale: Excellent, Good, Satisfactory, Marginal, Unsatisfactory, and Highly Unsatisfactory. The overall aggregate rating is based on a four-point scale: Highly Successful, Successful, Partly Successful, and Unsuccessful. 3.3.1 Relevance Relevance is defined as the adequacy of the Bank’s projects to respond to and fulfil the Bank’s 1999 Natural Resources Operations Policy to satisfy regional requirements, country needs, global priorities and donor policies. There is no individual project indicator for relevance; rather this is based on an overall sector perspective, with reference to the challenges identified in the Policy. 3.3.1.1 Increase private sector participation and promote strategic investments
in the sector Evaluation Finding: As discussed in Section 2.5, the Bank was a critical player in the early to mid-1990s. The Bank undertook first-of-a-kind projects and supported the private sector in its initial investments in the region. FDI is now rapidly expanding and the EBRD’s percentage of the market is less than 10 per cent. Looking retrospectively, this is very positive. Rating: Fully Achieved 3.3.1.2 Reduce transport bottlenecks and ensure competitive market access Evaluation Finding: While the Bank is active in pipelines, ports, roads and railroad
Page 22 of 47 Special Study: Extractive Industries
projects, this sub-sector is not part of the scope of this Study, and therefore is not rated. As oil and gold pricing is determined based on international prices, these markets are competitive. The rapid growth in EI-based FDI in the region is indicative of an increasingly competitive market. However, there are sub-sections of the market that remain state-owned and therefore closed to competition. Finally, internal pricing of energy (oil, gas, and coal) has been below global market prices, thus distorting energy intensive sectors. Rating: Reduce transportation bottlenecks – Not-rated
Ensure competitive market access – Achieved 3.3.1.3 Improve the regulatory and institutional framework Evaluation Finding: Private sector projects are not the strongest method, but are an important vehicle for achieving regulatory and institutional reform. Institutional and regulatory changes do come about as a result of the government’s experience in dealing with the EBRD’s projects and with the private sector, but the EBRD’s projects do not directly measure such changes. Sakhalin II Phase 1 was the first PSA in the Russian oil and gas sector; however, Russia has now decided to discontinue the PSA approach. Nevertheless, the experience of working with large EI projects and working through issues such as the use of PSAs does indicate a maturing institutional structure. TC-funded activities are a more direct tool to improving regulatory reform and institutional development. Rating: Achieved 3.3.1.4 Set high standards for business conduct and environmental protection Evaluation Finding: The international sponsors with whom the EBRD has worked have brought international best practice to these projects, including compliance with international accounting standards and environmental norms and standards. Furthermore, with local sponsors, the EBRD has worked to promote good corporate governance and international environmental standards. Rating: Fully Achieved Relevance ratings: The sector is vital in a number of counties of operation, both to meet primary energy needs and as a foreign exchange earner. The growth in FDI in this sector and active local participation are proof of sector relevance. The EBRD was a leader in the sector, with several first-of-a-kind projects, thereby enhancing transition impact in the region. Rating: Good 3.3.2 Efficacy – Achievement of Objectives of the 1999 Natural Resources
Operations Policy Efficacy is defined as the extent to which the Policy objectives were achieved, or are expected to be achieved. The analysis concentrates on the first three Policy objectives, as listed in Section 2, while the fourth objective, “support pipeline development" is excluded from this review for the reasons previously stated. The PED Team has approached this question from two perspectives: (i) Have the objectives as stated been achieved; and (ii) Are the stated objectives appropriate.
Special Study: Extractive Industries Page 23 of 47
3.3.2.1 Focus on Russia (North and Far East) and the Caspian Sea Evaluation Finding: Considering Figure 2.3 above, investments in Russia represent 60 per cent of the Bank’s portfolio, followed by Azerbaijan, with Uzbekistan and Turkmenistan in the fourth and fifth position. Within Russia, the EBRD’s projects have been in the Far East. Within the Caspian, the EBRD’s focus has been on the southern fields rather than in the North Caspian region. At the time the Policy was written, the EBRD anticipated potential investments in Yamal region of Russia, which never materialised. Rating: Achieved 3.3.2.2 Promote privatisation, particularly in central and eastern Europe Evaluation Finding: The EBRD has actively worked with Romania on privatisation of its EI (oil and gas) sector, which has resulted in a privatisation process currently being implemented. The Banking Team has also focused more on privatisation in refineries and distribution companies, where there are greater opportunities in central and eastern Europe. Privatisation of mining activities in the region has received relatively less attention. A previously evaluated TC project in Kazakhstan was rated as less than successful. The PED Team felt that the Romania experience was positive, but that the Bank could have achieved much more on the privatisation front. Rating: Partly achieved 3.3.2.3 Promote reductions in Greenhouse Gas (GHG) emissions Evaluation Finding: The EBRD has focused on reducing flaring and other GHG activities within the context of specific projects. However, none of the projects reported on GHG emissions data until the GHG methodology was developed in 2002. The Bank has worked with several project sponsors to reduce flaring through re-injection, use, sales, or provisions to local communities. However, on a wider perspective, minimising flaring, while important, is relatively minor in comparison to inefficient use of fuels. The EBRD is actively engaged in energy efficiency (district heating, power plants, etc.) but there is no direct link with this Natural Resources objective. Finally, because of the nature of the EBRD’s current mining portfolio (gold based); there is little focus on mining related GHG issues. Rating: Achieved Efficacy rating: The Team found that the strategy was broad and general in nature, essentially that of an opportunistic investor with some regional focus, and as a result the objectives are also broad and lacking in specifics. Given the EBRD’s Transition mandate, the second objective clearly contributes to this mandate. The regional focus dictated by the first objective may or may not optimise regional transition benefits, and, as indicated above, the focus on GHG reductions could be enhanced. Rating: Satisfactory 3.3.3 Efficiency Efficiency is defined as the extent to which benefits are commensurate with the resources invested. Efficiency is best addressed through the EBRD’s Project Financial Performance rating. Of the total 61 per cent are rated satisfactory or better, based on the
Page 24 of 47 Special Study: Extractive Industries
following results: three Excellent, eight Good/Satisfactory, four Marginal, and three Poor. Company Financial Performance is rated at 59 per cent (10/17) Satisfactory or better. These findings are based on results at the time of the evaluation; if re-evaluated today, at current prices, the results would be likely to be better. The Bank’s efficiency can also be assessed by considering forward and backward linkages. The PED Team found that the Bank treated projects as stand alone investments and did not sufficiently consider “clustering” of investments in the vicinity of the evaluated project. EI projects have proved to be catalysts for regional development and the Bank could do more to cluster MEI, SME, Power and other activities around major EI projects so as to maximise transition impact. The Bank’s new multi-sector approach to the BTC and SEIC projects provides an example for future large EI projects. Rating: Satisfactory 3.3.4 Mandate Indicators 3.3.4.1 Transition impact Transition impact at the sector level is defined as the extent of transition impact realised versus expected,27 and the resilience to risk of the net sector transition impact flows resulting from portfolio investments. EI projects have positive transition impact – economic, political, and social. Stability and future generation funds are increasingly associated with the EBRD’s projects. Civil society, which was previously a silent or very minor participant, has become a critical presence during due diligence and in ensuring successful implementation. The PED Team argues that the scope of these projects could be expanded to increase their positive regional transition impact. Rating: Good 3.3.4.2 Environmental Impact (Environmental Performance/Environmental Change Environmental impact is defined as the extent to which overall environmental quality has improved as a result of specific investments in the portfolio. Environmental impact slightly under-performed in comparison with the all-EBRD data. Overall, 71 per cent of the projects are rated Satisfactory or better on Environmental Performance, and all projects (21/21) are rated Substantial/Some on Environmental Change. As EI projects are larger and better defined – they are based on EIAs which include numerous commitments against which these projects are monitored – it appears more difficult to achieve an Excellent rating. In addition, the PED Team attributes the overall performance to the EBRD’s “achieving compliance with EU/WB standards” approach to its environmental management of this portfolio (reflected in the high level of Satisfactory outcomes on Environmental Performance). PED argues that if the Bank wishes to achieve more Good to Excellent ratings it needs to put greater emphasis on “adding value” through project selection, pollution prevention, waste minimisation, etc., thus taking a sustainable development approach,. Achieving greater positive environmental impact should be part of the selection criteria for EI projects. Finally, PED recommends that the Bank should put greater emphasis on addressing historic environmental legacies and reducing GHG emissions. Rating: Good 27 See the PED checklist of transition indicators: 1) competition; 2) market expansion; 3) private
ownership; 4) frameworks for markets; 5) skills transfer; 6) demonstration effects; and 7) setting standards.
Special Study: Extractive Industries Page 25 of 47
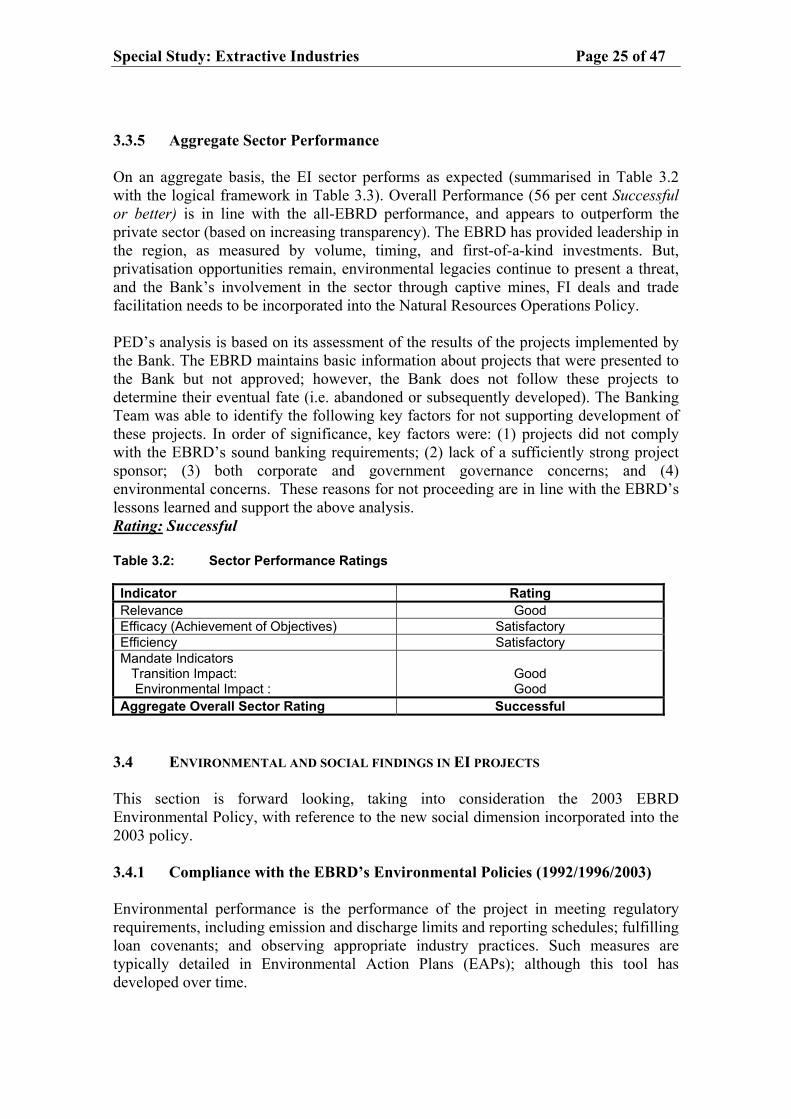
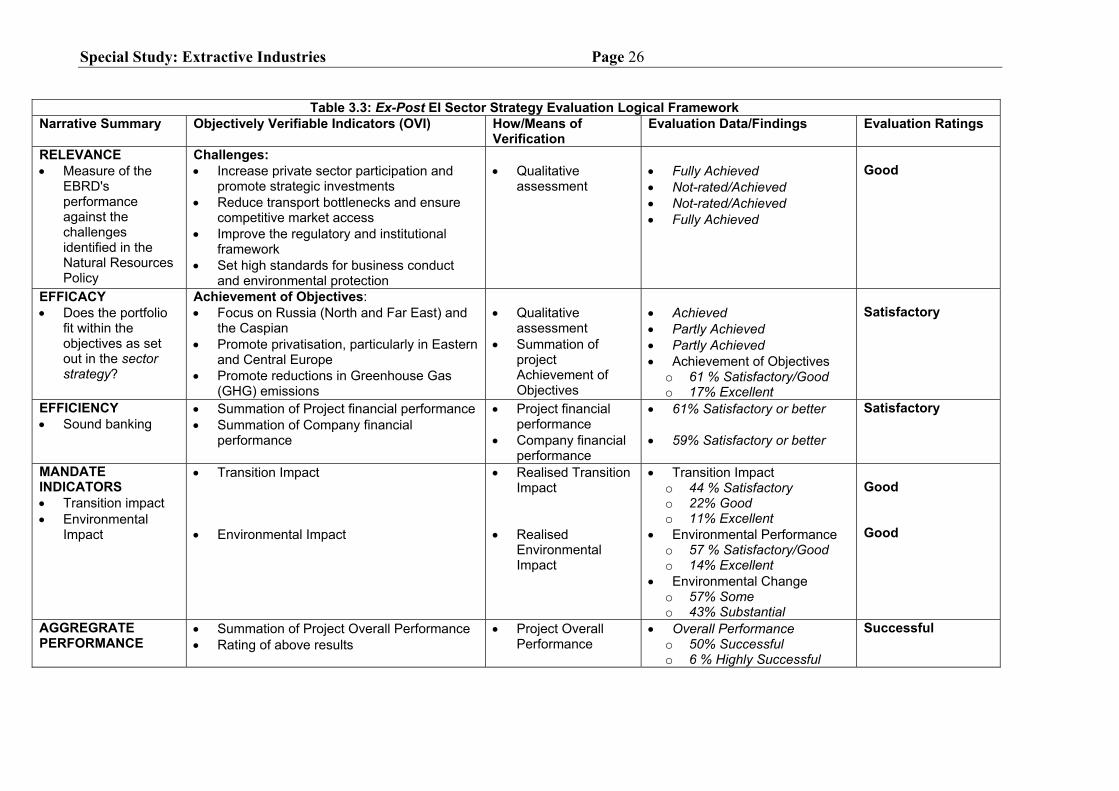
3.3.5 Aggregate Sector Performance On an aggregate basis, the EI sector performs as expected (summarised in Table 3.2 with the logical framework in Table 3.3). Overall Performance (56 per cent Successful or better) is in line with the all-EBRD performance, and appears to outperform the private sector (based on increasing transparency). The EBRD has provided leadership in the region, as measured by volume, timing, and first-of-a-kind investments. But, privatisation opportunities remain, environmental legacies continue to present a threat, and the Bank’s involvement in the sector through captive mines, FI deals and trade facilitation needs to be incorporated into the Natural Resources Operations Policy. PED’s analysis is based on its assessment of the results of the projects implemented by the Bank. The EBRD maintains basic information about projects that were presented to the Bank but not approved; however, the Bank does not follow these projects to determine their eventual fate (i.e. abandoned or subsequently developed). The Banking Team was able to identify the following key factors for not supporting development of these projects. In order of significance, key factors were: (1) projects did not comply with the EBRD’s sound banking requirements; (2) lack of a sufficiently strong project sponsor; (3) both corporate and government governance concerns; and (4) environmental concerns. These reasons for not proceeding are in line with the EBRD’s lessons learned and support the above analysis. Rating: Successful Table 3.2: Sector Performance Ratings Indicator Rating Relevance Good Efficacy (Achievement of Objectives) Satisfactory Efficiency Satisfactory Mandate Indicators Transition Impact: Environmental Impact :
Good Good
Aggregate Overall Sector Rating Successful 3.4 ENVIRONMENTAL AND SOCIAL FINDINGS IN EI PROJECTS This section is forward looking, taking into consideration the 2003 EBRD Environmental Policy, with reference to the new social dimension incorporated into the 2003 policy. 3.4.1 Compliance with the EBRD’s Environmental Policies (1992/1996/2003) Environmental performance is the performance of the project in meeting regulatory requirements, including emission and discharge limits and reporting schedules; fulfilling loan covenants; and observing appropriate industry practices. Such measures are typically detailed in Environmental Action Plans (EAPs); although this tool has developed over time.
Special Study: Extractive Industries Page 26
Table 3.3: Ex-Post EI Sector Strategy Evaluation Logical Framework
Narrative Summary Objectively Verifiable Indicators (OVI) How/Means of Verification
Evaluation Data/Findings Evaluation Ratings
RELEVANCE • Measure of the
EBRD's performance against the challenges identified in the Natural Resources Policy
Challenges: • Increase private sector participation and
promote strategic investments • Reduce transport bottlenecks and ensure
competitive market access • Improve the regulatory and institutional
framework • Set high standards for business conduct
and environmental protection
• Qualitative
assessment
• Fully Achieved • Not-rated/Achieved • Not-rated/Achieved • Fully Achieved
Good
EFFICACY • Does the portfolio
fit within the objectives as set out in the sector strategy?
Achievement of Objectives: • Focus on Russia (North and Far East) and
the Caspian • Promote privatisation, particularly in Eastern
and Central Europe • Promote reductions in Greenhouse Gas
(GHG) emissions
• Qualitative
assessment • Summation of
project Achievement of Objectives
• Achieved • Partly Achieved • Partly Achieved • Achievement of Objectives
o 61 % Satisfactory/Good o 17% Excellent
Satisfactory
EFFICIENCY • Sound banking
• Summation of Project financial performance • Summation of Company financial
performance
• Project financial performance
• Company financial performance
• 61% Satisfactory or better • 59% Satisfactory or better
Satisfactory
MANDATE INDICATORS • Transition impact • Environmental
Impact
• Transition Impact • Environmental Impact
• Realised Transition Impact
• Realised
Environmental Impact
• Transition Impact o 44 % Satisfactory o 22% Good o 11% Excellent
• Environmental Performance o 57 % Satisfactory/Good o 14% Excellent
• Environmental Change o 57% Some o 43% Substantial
Good Good
AGGREGRATE PERFORMANCE
• Summation of Project Overall Performance • Rating of above results
• Project Overall Performance
• Overall Performance o 50% Successful o 6 % Highly Successful
Successful
Special Study: Extractive Industries Page 27
Without this information, a project’s environmental performance and therefore compliance with loan covenants and legal requirements is difficult to assess. Where an investment starts with a pilot project, the EBRD’s EIA analysis needs to address the full implications of the anticipated project to the extent possible, not just those of the pilot project, while the EAP may be more project-specific, but updated from phase-to-phase. Historically, clients have often been unwilling to provide long term plans in their assessments, so as not to raise public expectations of plans under consideration only. For the six projects that were subject to a desk review, the PED Team found that specific monitoring requirements were often determined by authorities on an annual basis. Therefore the EAPs had commitments to more general monitoring and reporting requirements and lacked well-defined measurable performance indicators. Overall, 15 of 21 projects were rated as Satisfactory or better on Environmental Performance indicating compliance with Environmental Action Plans and therefore the relevant Environmental Policy at the time the project was approved, but many of these ratings were based on subjective and qualitative rather than quantitative assessments of performance. Increasingly, the EBRD has required independent lenders environmental audits to provide the level of analysis appropriate for these complex large projects. Project-specific minimum performance requirements for project monitoring A set of project-specific minimum performance requirements for project monitoring should be developed and applied to all EI projects going forward. Such standards should be based on national, EU, or WBG standards as appropriate, with reference to specific regulations, clauses, etc. It is not sufficient to state that the project will “adhere to national, EU or WBG standards as appropriate”; rather staff should specify which standards apply and how they will be achieved. PED is not suggesting that the Bank develop its own standards, but rather that the standards to be applied to each project, be clearly identified and incorporated into the appropriate project documents. The performance requirements should account for environmental, health and safety and social performance, be quantifiable where possible, and be capable of being aggregated across projects to allow the EBRD to quantitatively measure its overall performance. This repeats a broad recommendation of PED’s 2001 Special Study on Environmental Performance (OPER No. PE00-153S). ED is in the process of developing a core set of cross-project environmental performance indicators. Review of existing projects Existing projects should be reviewed to determine: a) whether appropriate data are being regularly collected to allow performance to be quantified; and b) whether appropriate action is being taken to correct any deviations from agreed performance standards. ED is addressing this need through the formation of a monitoring team within the Department. 3.4.2 Environmental Change The EBRD’s definition of environmental change is “the difference in environmental performance at the time of evaluation with performance at the beginning of the project”. Measurement of change implies measurement of performance at a minimum of two points in time and, as described above, this was generally not well handled for the
Page 28 of 47 Special Study: Extractive Industries
projects that were reviewed. Unless it was a greenfield project, it often proved difficult to quantify initial conditions. Assessment of environmental change was therefore largely circumstantial. While recognising this qualification, all 21 projects reviewed were assessed as being likely to have had a positive environmental change. In most cases the key determining factor was the introduction of Western work practices. At a minimum, it is assumed that these practices led to reduced risk of accidents and incidents (e.g. oil spills), resulting in less environmental damage than would otherwise have been the case. Other positive changes include the adoption of systems to report leaks and spills for immediate corrective action, and the introduction of Western technology and training/practices in relation to kick elimination, well shutting in, oil spill planning, and domestic and industrial waste disposal. It was also evident that new work practices have had a positive outcome on worker health and safety. Institutional and regulatory changes at the local and national government levels are more difficult to assess. The Bank assesses environmental change associated with greenfield projects by comparing against a ‘virtual situation’, which is taken to be the situation if the Bank’s loan and procedures were not available. As one example, in a Central Asian gold project, it is unlikely that the project would have proceeded without the EBRD involvement (positive Additionality), therefore effectively eliminating the ‘virtual situation’ described above. In a strict sense therefore, the environmental change would have been none/negative, because without the Bank’s involvement, the project would most likely not exist and there would have been no environmental impact. In this specific example, the project resulted in a positive environmental change due to:
• The introduction of a new technology that allowed waste (tailings) from an
existing mining operation to be re-processed, thereby significantly improving the value of the original ore body and hence optimising the economic return of the asset
• The adoption of US design standards • The introduction of the concept of ‘zero discharge to surface and groundwater’
to the local mining sector, with potential demonstration effects • The commitment to a reclamation/closure plan, again with potential
demonstration effects. Broader definition of environmental change The lack of dispersion in the environmental change results indicates that either there is strong uniformity within these 21 projects, or that the indictor lacks sufficient definition to serve as a useful indicator. The EBRD should adopt a broader definition of environmental change that better defines the steps within the evaluation range (Negative to Outstanding) and accounts for social issues, as well as captures the benefits of greenfield projects in the EI sector that would otherwise be discounted through the application of the counterfactual model. ED is not satisfied with the application of the Environmental Change indicator, and therefore during the due diligence process, ED should be more specific in defining the potential for achieving environmental change and the extent of change anticipated.
Special Study: Extractive Industries Page 29 of 47
3.4.3 Monitoring environment performance Monitoring environmental performance is critical to ensuring successful outcomes for EI projects. For the projects subject to a desk review, the following main areas for improvement were noted:
• Consolidation of all key project documents in a central location – this is being addressed with the new Bank-wide ProjectLink database
• Specify quantitative environmental performance criteria for every project, based on a system that facilitates aggregation of data across projects
• Monitor projects against specified national, EU or WBG environmental performance criteria
• Record of corrective actions • Record of revisions to environmental conditionality, for example at the time of
loan extensions or material changes in a project. Environmental closure checklist/report The EBRD should consider creating an environmental closure checklist/report, either at the end of a project, or at the end of each phase of a project. While this could be written into project documents as a loan/investment condition,28 it should be possible for Bank staff to internally create such a checklist/report based on annual monitoring reports. This would be particularly useful for projects that start with a pilot phase. The purpose of such a report would be to assess Environmental Change achieved and to indicate outstanding issues for follow-on projects. Such information would also assist the Bank in describing its environmental footprint in future Annual Environmental Reports. 3.4.4 Social dimensions of the 2003 Environmental Policy The 2003 EBRD Environmental Policy incorporates, by reference, five social policies (Box 3.1). Through its due diligence process, the Bank has typically addressed community impacts linked to the environment or safety, has been a leader in promoting public disclosure and consultation, and has always supported equal opportunity and non-discriminatory labour practices. In carrying out appropriate environmental and social project screening, perceived significant potential risk on any one of these new social policies could be justification for a Category A rating. The implication of these five new commitments to social issues is that ED should now carry out social appraisal as part of their due diligence process, where appropriate. ED is working with the UK Department for International Development (DfID) to acquire appropriate expertise and develop new instruments to fully implement its new functions.
28 Caveat: Once a project is closed, the Bank’s ability to obtain information from the client is
limited.
Page 30 of 47 Special Study: Extractive Industries
Box 3.1: Definition of the EBRD’s new social elements of the Environmental Policy Indigenous Peoples: This policy addresses how the Bank should take into account the needs of indigenous peoples when designing projects. It defines what constitutes an “indigenous peoples” group, their rights, and the steps the Bank should undertake to protect their culture and rights within the context of its projects. Involuntary Resettlement: This policy addresses how the Bank should address the rights of people who face involuntary resettlement as a result of a Bank project, the rights of project affected persons; how the Bank should assess such impacts, and determines appropriate compensation. Cultural Property: This policy provides guidance on what constitutes “cultural property” and the necessary steps that the Bank should undertake to preserve and enhance cultural property. Harmful Child and Forced Labour: This policy defines harmful child and forced labour issues, and establishes a Bank-wide policy position on Harmful Child and Forced Labour. Discriminatory Practices: This commitment refers to a Bank position on Discriminatory Practices, in line with ILO standards. As all projects covered by this review came under the old Environmental Policies (1992 and 1996), the PED Team did not explicitly review projects for compliance with these new social elements of the 2003 Environmental Policy. However, PED’s informal assessment is that these new policies would not have made significant differences to the design and implementation of existing EI projects. The EBRD was implicitly addressing these four issues in the context of its existing EI projects, and in none of the EI projects reviewed did these emerge as critical unresolved issues. In general, EI projects, particularly those involving an international sponsor, are already and have been incorporating WBG social policies. Several EBRD EI projects had already specifically required compliance with WBG social polices, prior to incorporation of these policies into the EBRD’s 2003 Environmental Policy. However, a broader definition of the social dimension, as referenced in the WBG EI review, could also address issues such as, revenue management, ethical performance, broader human rights, and not just harmful child and forced labour, and discriminatory practices, but compliance with other ILO conventions, etc (see Table 4.3). Going forward, it is important to incorporate social dimensions as a determinate of environmental performance. The EBRD’s environmental evaluation performance indicator will assess the new social dimension of the 2003 Environmental Policy for all projects signed after 2003. Box 3.2, below, provides an example of positive social dimension in one EI project. Box 3.2: Positive example of a project’s social activity One gold project sponsor had established a local development fund based on a corporate policy to donate US$ 2 for every once of gold produced. This fund supports several useful and highly appreciated local health and education activities, including computers and internet links for all local schools, health facilities, expanded power supplies, water and wastewater systems, etc.
Special Study: Extractive Industries Page 31 of 47
3.5 LESSONS LEARNED The unique experiences of the EBRD in the Bank’s countries of operation and the innovative solutions that their staffs have found to deal with the challenges it finds form the basis for this body of knowledge. By recording lessons learned, the Bank seeks to retain its institutional memory; by reading it, staff members can learn or reacquaint themselves with their colleagues’ thoughts on how best to provide capital to target countries under the guiding principles of sound banking, promoting transition (including environmental and sustainability issues) and additionality. The Bank is a knowledge-based learning institution, and the lessons learned contribute to the institutional memory of the Bank. Lessons are drawn from past experience with a bias towards opportunities for improvement, thus as a body of information these data contain a negative bias. It is important to remember that the Bank’s EI projects are meeting their oil, gas or gold production projections, make valuable contributions to national budgets and several are first-of-a-kind projects. Also, through the Bank’s involvement, several projects have resulted in the first ever environmental public meetings held in Russia, Romania, Turkmenistan, and Azerbaijan. Thus, while the focus of the lessons learned is on opportunities for improvement, the Bank and its project sponsors are providing financial and technological leadership, introducing new technologies, new business standards, new approaches to environmental management and increasing transparency, corporate governance, etc. An overriding theme in many of these lessons is the Bank’s ability and requirement to manage the detailed execution of projects using explicit goals with target dates for completion. The starting premise in transition countries must be that cultural attitudes and business practices differ from those of the Bank’s. Market economics, fiscal responsibility, operating efficiencies, and environmental stewardship can be inculcated in project companies, but equally there is the need for the Bank to shield itself against corporate governance abuse. Another recurring theme is the need to investigate, monitor and manage a project’s links, be they physical to upstream or downstream infrastructure, commercial to suppliers, customers and investors, economic to regional or global commodity prices, institutional to local governments, supranational organisations and NGO’s, social to workers and communities as well as environmental to current or future conditions. The larger and more innovative a project, the greater is the need to consider the potential for these linkages to advance or to harm the Bank’s immediate investment and wider transition objective. Several past evaluations stress the desirability of maintaining leverage over negotiations and project implementation via staged Bank involvement and incremental loan disbursement. Other evaluations reference Technical Cooperation (TC) programmes as a way to fund the preparation and broaden the impact of a project beyond what may be feasible on commercial terms alone. The authors also note the need to train individuals, encourage SME’s and strengthen local governments to perform safely and effectively in the new circumstances, which the Bank’s policies or projects create.
Page 32 of 47 Special Study: Extractive Industries
A summary of EI lessons is appended (Appendix E). The lessons have been divided into the various roles and stages of the lending and investing process in order to make it more tractable. Appendix E should be read as an integral part of this report and is only included as an appendix so that it can be used separately. The following broad categories are addressed in PED’s lessons learned database for the EI sector:
• Advisers – how to effectively use advisers • Appraisal/due diligence – complexities in carrying out this function in EI
projects • Budget – the need to adequately budget EI projects • Commodity – monitoring and managing price risk • Coordination – with other organisations • Drafting agreements – complexities presented by EI projects • Environment – the need to address a full range of complex environmental
issues both during project design and implementation • Implementation – how the Bank interacts with a project company • Modelling – elements to include in financial modelling • Monitoring cross-cutting issues and short-comings in project monitoring • Operations – how a project company runs • Process – the Bank’s internal procedures • Results – how to measure and maximise results • Scope – the need to broaden project scope while being realistic • Sponsors – issues surrounding due diligence on project sponsors • Structure – of financing and project company • Technical Cooperation – how best to integrate TC into projects • Training – personnel, SME and local institutions.
Special Study: Extractive Industries Page 33 of 47
4. THE EBRD’S TRANSITION MANDATE AND SUSTAINABLE DEVELOPMENT
This Chapter addresses sustainable development in the context of the EBRD, its transition mandate, and conditions within the EBRD’s countries of operation. The chapter will try to elaborate on the transition potential of “sustainable development”. 4.1 TERMINOLOGY The concept of sustainable development is becoming widely accepted, even if a consensus on its precise meaning is proving more elusive. The most prominent definition is that cited by the Brundtland Commission:
‘In order for development to be sustainable, it must meet the needs of the present without compromising the ability of future generations to meet their own needs’ (WCED, 1987)
The 1992 UN Conference on Environment and Development took this definition further by formally endorsing the concept of sustainable development through the Rio Declaration on Environment and Development. According to the definition in Principle 3 of the Declaration, sustainable development would ‘equitably meet development and environmental needs of present and future generations’. Translating the concept of sustainable development into practical corporate and institutional action is a challenge, both in terms of i) accepting the need for a more comprehensive, integrated approach that takes a long-term view on development, while simultaneously considering the economic, environmental and social aspects of development, and ii) the implicit choices and trade-offs that are a logical consequence of this approach. 4.2 EBRD POLICY The EBRD is directed by its Agreement to promote transition through its various sub-components, including through the promotion ‘in the full range of its activities of environmentally sound and sustainable development’ (Article 2.1 vii). The EBRD ‘recognises that sustainable development is a fundamental aspect of sound business management and that the pursuit of economic growth and a healthy environment are inextricably linked’. The Bank ‘further recognises that sustainable development must rank among the highest priorities of the EBRD’s activities’ (EBRD Environmental Policy, 2003.) For these reasons the EBRD aspires to ‘ensure that its policies and business activities promote sustainable development’ (EBRD Environmental Policy, 2003). The EBRD’s 1999 Natural Resource Operations Policy supports this view by referring to natural resource endowments and their potential for building a country’s physical and
Page 34 of 47 Special Study: Extractive Industries
social asset base (Box 4.1), as well as highlighting the convertibility of a country’s natural endowments into physical and human assets. Box 4.1: EBRD Natural Resource Operations Policy, Section 1.2 Natural resource endowments can contribute in important ways to economic development. Natural resources are part of a country’s stock of wealth. Their exploitation generates a revenue stream that can be used to build up a country’s capital stock or allow higher consumption levels. However, natural resource endowments are finite1. As a general rule therefore, the exploitation of natural resources should aim to build up a country’s physical and human assets by at least the same amount as its natural wealth decreases. Moreover, consideration needs to be given to the environmental impact of natural resource depletion. At a minimum, the increase in accumulatable assets should be equivalent to the total decline in the depletable resource base, including environmental resources. 1 This interpretation of natural resources is clearly limited to oil, gas and minerals, and not the broader definition that would typically include air, water, soil, forests, wildlife, etc 4.3 APPLYING THE EBRD’S TRANSITION MANDATE THROUGH PROMOTION OF
SUSTAINABLE DEVELOPMENT It is possible to approach sustainable development both from the project and country level. 4.3.1 The EBRD’s EI evaluation findings and a modified triple-bottom-line
sustainable development approach This Special Study is limited in numbers and therefore the results are not subject to extensive statistical analysis, particularly when limited to projects on which there is a complete set of data (18 projects). Nevertheless, the PED Team looked at relationships between indicators. The Overall Performance indicator is a dependent variable, but the other indicators – Project Financial Performance, Company Financial Performance, Transition Impact, Environmental Performance, Environmental Change, Fulfilment of Objectives, Additionality, and Bank Handling – are independent variables, i.e. they are created based on separate and distinct criteria. As shown in Table 4.1 transition impact and environmental performance are highly correlated (0.74 correlation coefficient). Causality is not implied. Both dimensions may depend on the same or closely related success factors, such as good sponsor, good governance, etc. In addition, while transition impact is measuring a process, environmental performance measures an outcome. Focusing on either dimension would appear to support positive change in the other dimension. The implications are that transition impact and environmental performance go hand-in-hand.
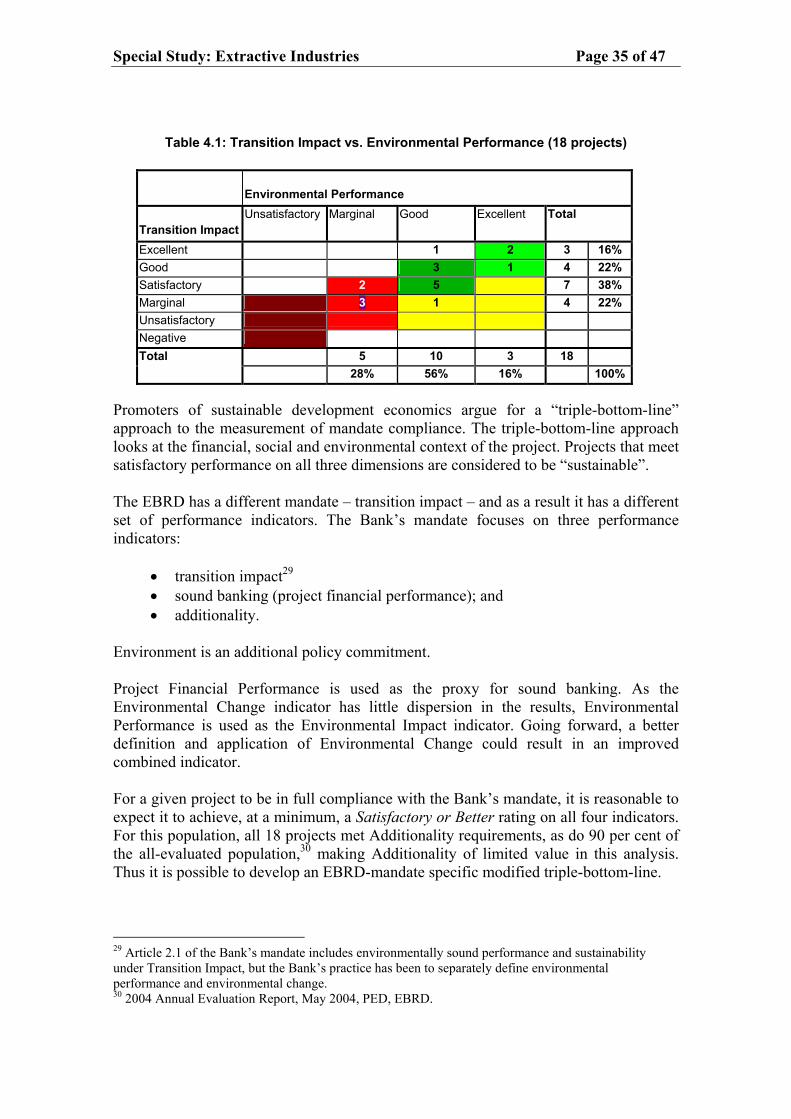
Special Study: Extractive Industries Page 35 of 47
Table 4.1: Transition Impact vs. Environmental Performance (18 projects)
Environmental Performance
Transition ImpactUnsatisfactory Marginal Good Excellent Total
Excellent 1 2 3 16% Good 3 1 4 22% Satisfactory 2 5 7 38% Marginal 3 1 4 22% Unsatisfactory Negative Total 5 10 3 18 28% 56% 16% 100%
Promoters of sustainable development economics argue for a “triple-bottom-line” approach to the measurement of mandate compliance. The triple-bottom-line approach looks at the financial, social and environmental context of the project. Projects that meet satisfactory performance on all three dimensions are considered to be “sustainable”. The EBRD has a different mandate – transition impact – and as a result it has a different set of performance indicators. The Bank’s mandate focuses on three performance indicators:
• transition impact29 • sound banking (project financial performance); and • additionality.
Environment is an additional policy commitment. Project Financial Performance is used as the proxy for sound banking. As the Environmental Change indicator has little dispersion in the results, Environmental Performance is used as the Environmental Impact indicator. Going forward, a better definition and application of Environmental Change could result in an improved combined indicator. For a given project to be in full compliance with the Bank’s mandate, it is reasonable to expect it to achieve, at a minimum, a Satisfactory or Better rating on all four indicators. For this population, all 18 projects met Additionality requirements, as do 90 per cent of the all-evaluated population,30 making Additionality of limited value in this analysis. Thus it is possible to develop an EBRD-mandate specific modified triple-bottom-line.
29 Article 2.1 of the Bank’s mandate includes environmentally sound performance and sustainability under Transition Impact, but the Bank’s practice has been to separately define environmental performance and environmental change. 30 2004 Annual Evaluation Report, May 2004, PED, EBRD.
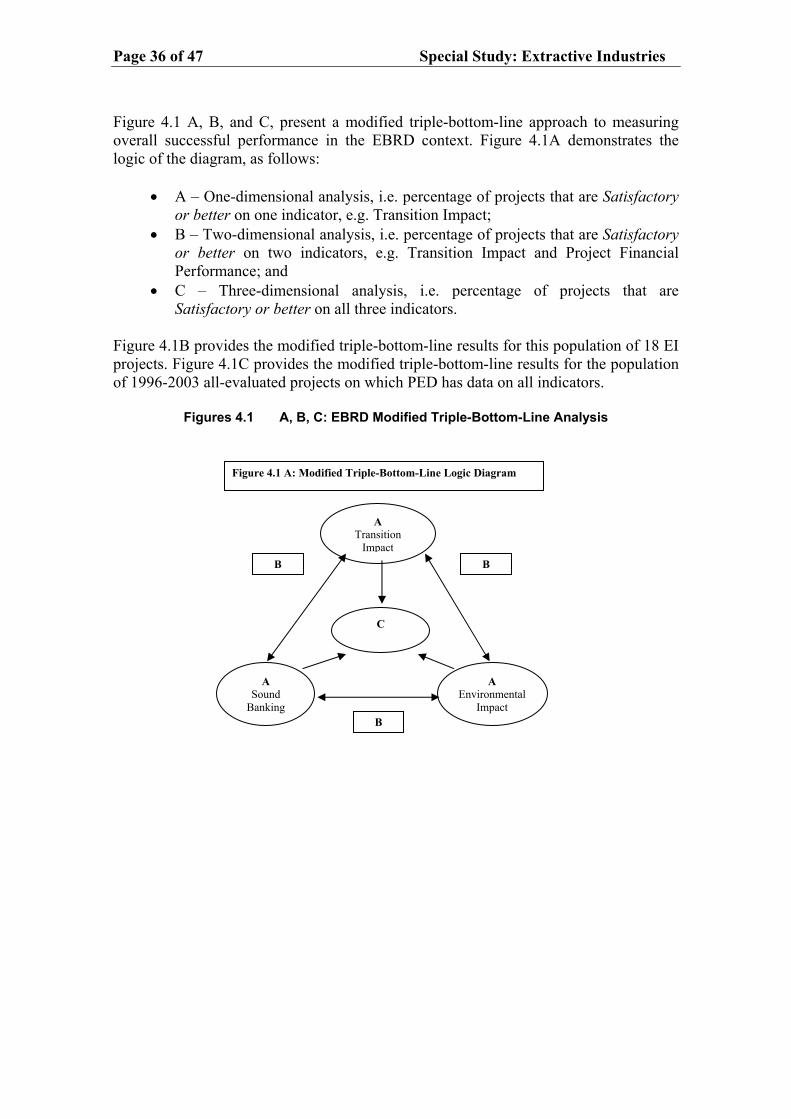
Page 36 of 47 Special Study: Extractive Industries
Figure 4.1 A, B, and C, present a modified triple-bottom-line approach to measuring overall successful performance in the EBRD context. Figure 4.1A demonstrates the logic of the diagram, as follows:
• A – One-dimensional analysis, i.e. percentage of projects that are Satisfactory or better on one indicator, e.g. Transition Impact;
• B – Two-dimensional analysis, i.e. percentage of projects that are Satisfactory or better on two indicators, e.g. Transition Impact and Project Financial Performance; and
• C – Three-dimensional analysis, i.e. percentage of projects that are Satisfactory or better on all three indicators.
Figure 4.1B provides the modified triple-bottom-line results for this population of 18 EI projects. Figure 4.1C provides the modified triple-bottom-line results for the population of 1996-2003 all-evaluated projects on which PED has data on all indicators.
Figures 4.1 A, B, C: EBRD Modified Triple-Bottom-Line Analysis
Figure 4.1 A: Modified Triple-Bottom-Line Logic Diagram
A Transition
ImpactB B
C
A A Sound
Banking Environmental
ImpactB
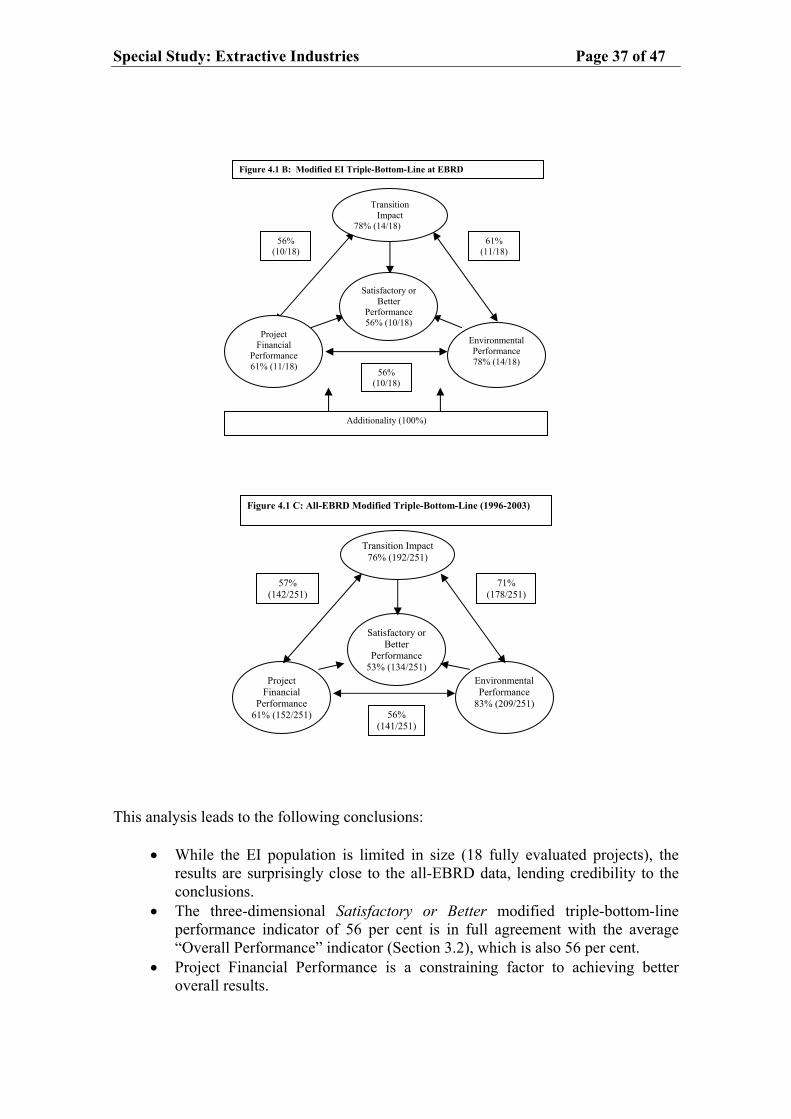
Special Study: Extractive Industries Page 37 of 47
Figure 4.1 B: Modified EI Triple-Bottom-Line at EBRD
Transition Impact
78% (14/18)56% 61%
(10/18) (11/18)
Satisfactory or Better
Performance 56% (10/18)
Project Financial
Performance
Environmental Performance 78% (14/18) 61% (11/18) 56%
(10/18)
Additionality (100%)
Figure 4.1 C: All-EBRD Modified Triple-Bottom-Line (1996-2003)
Transition Impact76% (192/251)
57% 71% (142/251) (178/251)
Satisfactory or Better
Performance 53% (134/251)
Project Financial
EnvironmentalPerformance
Performance 83% (209/251)56% 61% (152/251)
(141/251)
This analysis leads to the following conclusions:
• While the EI population is limited in size (18 fully evaluated projects), the results are surprisingly close to the all-EBRD data, lending credibility to the conclusions.
• The three-dimensional Satisfactory or Better modified triple-bottom-line performance indicator of 56 per cent is in full agreement with the average “Overall Performance” indicator (Section 3.2), which is also 56 per cent.
• Project Financial Performance is a constraining factor to achieving better overall results.
Page 38 of 47 Special Study: Extractive Industries
• Transition Impact and Environmental Impact are closely correlated and work hand-in-hand, and both indicators show Good one-dimensional results.
• Finally, this analysis supports the aggregate rating of Successful for the Sector, and the conclusion that there is scope for improvement. Currently, 44 per cent of the evaluated EI projects do not simultaneously meet all four of the Bank’s mandate indicators. The Bank should strive to achieve a modified triple-bottom-line rating of two-thirds Satisfactory or better.
4.3.2 Sustainable development at the country level Sustainable development has proven difficult to translate to the mainstream business community and therefore apply at project level, but is more easily measured at the Country level. For the EBRD, there is compelling case for using sustainable development metrics in shaping EI policy and prioritising EI investments, particularly since such data sets are beginning to emerge, and in light of the WBG EI Review and industry trends. Equally there is a case for incorporating sustainability criteria at the project level, again with complementary performance indicators. Various sustainable development indicators are now published for international investment markets. The indicators perform as well as or better than market averages, thus supporting the business case for sustainable development. Appendix F provides background information on various measures of sustainable development, with emphasis on the World Economic Forum’s (WEF) Environmental Sustainability Index (ESI). The country ranking and ESI Index results for the EBRD’s countries of operation are shown in Table 4.2. Countries in which the EBRD currently has EI activities are highlighted in bold. In its annual Transition Report, the Bank provides sector specific Transition Indicators and an Averaged Transition Indicator (ATI) across eight business dimensions. The 2002 ATI data are also included in Table 4.2.
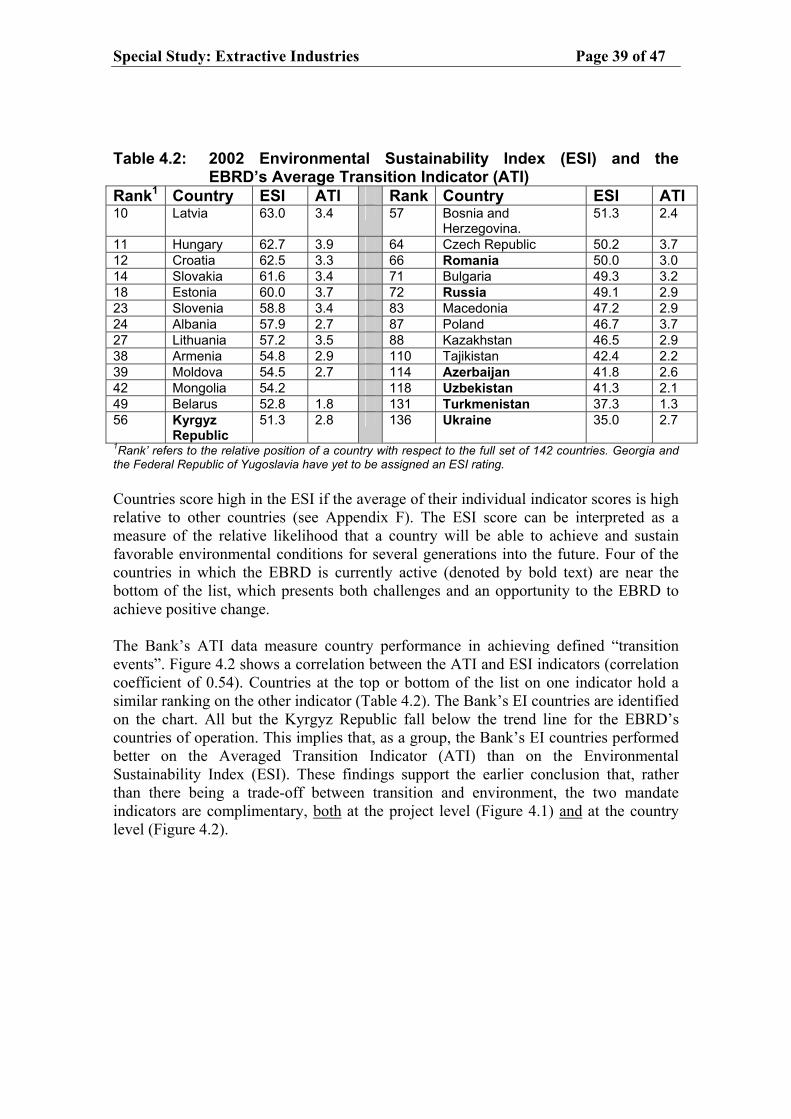
Special Study: Extractive Industries Page 39 of 47
Table 4.2: 2002 Environmental Sustainability Index (ESI) and the EBRD’s Average Transition Indicator (ATI) Rank1 Country ESI ATI Rank Country ESI ATI 10 Latvia 63.0 3.4 57 Bosnia and
Herzegovina. 51.3 2.4
11 Hungary 62.7 3.9 64 Czech Republic 50.2 3.7 12 Croatia 62.5 3.3 66 Romania 50.0 3.0 14 Slovakia 61.6 3.4 71 Bulgaria 49.3 3.2 18 Estonia 60.0 3.7 72 Russia 49.1 2.9 23 Slovenia 58.8 3.4 83 Macedonia 47.2 2.9 24 Albania 57.9 2.7 87 Poland 46.7 3.7 27 Lithuania 57.2 3.5 88 Kazakhstan 46.5 2.9 38 Armenia 54.8 2.9 110 Tajikistan 42.4 2.2 39 Moldova 54.5 2.7 114 Azerbaijan 41.8 2.6 42 Mongolia 54.2 118 Uzbekistan 41.3 2.1 49 Belarus 52.8 1.8 131 Turkmenistan 37.3 1.3 56 Kyrgyz
Republic 51.3 2.8 136 Ukraine 35.0 2.7
1Rank’ refers to the relative position of a country with respect to the full set of 142 countries. Georgia and the Federal Republic of Yugoslavia have yet to be assigned an ESI rating. Countries score high in the ESI if the average of their individual indicator scores is high relative to other countries (see Appendix F). The ESI score can be interpreted as a measure of the relative likelihood that a country will be able to achieve and sustain favorable environmental conditions for several generations into the future. Four of the countries in which the EBRD is currently active (denoted by bold text) are near the bottom of the list, which presents both challenges and an opportunity to the EBRD to achieve positive change. The Bank’s ATI data measure country performance in achieving defined “transition events”. Figure 4.2 shows a correlation between the ATI and ESI indicators (correlation coefficient of 0.54). Countries at the top or bottom of the list on one indicator hold a similar ranking on the other indicator (Table 4.2). The Bank’s EI countries are identified on the chart. All but the Kyrgyz Republic fall below the trend line for the EBRD’s countries of operation. This implies that, as a group, the Bank’s EI countries performed better on the Averaged Transition Indicator (ATI) than on the Environmental Sustainability Index (ESI). These findings support the earlier conclusion that, rather than there being a trade-off between transition and environment, the two mandate indicators are complimentary, both at the project level (Figure 4.1) and at the country level (Figure 4.2).
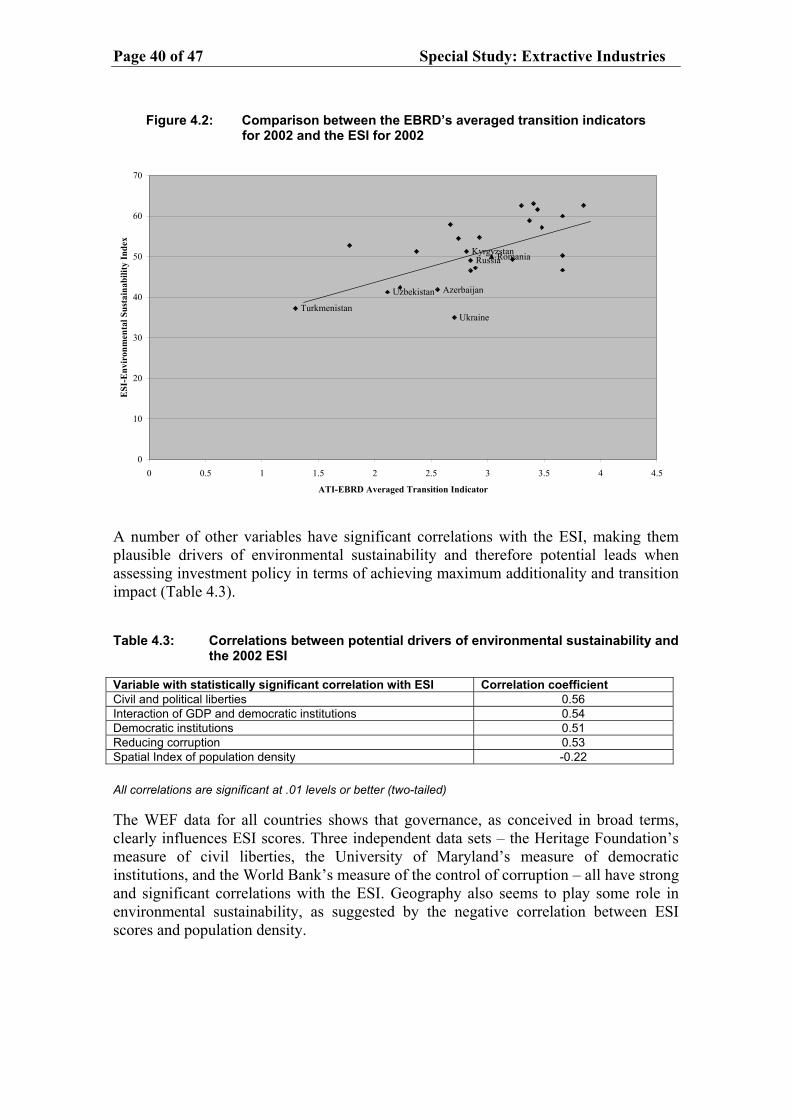
Page 40 of 47 Special Study: Extractive Industries
Figure 4.2: Comparison between the EBRD’s averaged transition indicators for 2002 and the ESI for 2002
Turkmenistan
Azerbaijan
Ukraine
Russia
Uzbekistan
RomaniaKyrgyzstan
0
10
20
30
40
50
60
70
0 0.5 1 1.5 2 2.5 3 3.5 4 4.5
ATI-EBRD Averaged Transition Indicator
ESI
-Env
iron
men
tal S
usta
inab
ility
Inde
x
A number of other variables have significant correlations with the ESI, making them plausible drivers of environmental sustainability and therefore potential leads when assessing investment policy in terms of achieving maximum additionality and transition impact (Table 4.3).
Table 4.3: Correlations between potential drivers of environmental sustainability and the 2002 ESI
Variable with statistically significant correlation with ESI Correlation coefficient Civil and political liberties 0.56 Interaction of GDP and democratic institutions 0.54 Democratic institutions 0.51 Reducing corruption 0.53 Spatial Index of population density -0.22
All correlations are significant at .01 levels or better (two-tailed) The WEF data for all countries shows that governance, as conceived in broad terms, clearly influences ESI scores. Three independent data sets – the Heritage Foundation’s measure of civil liberties, the University of Maryland’s measure of democratic institutions, and the World Bank’s measure of the control of corruption – all have strong and significant correlations with the ESI. Geography also seems to play some role in environmental sustainability, as suggested by the negative correlation between ESI scores and population density.
Special Study: Extractive Industries Page 41 of 47
4.4 IMPLICATIONS FOR THE EBRD The EBRD has a unique mandate to foster transition to open market economies and to promote private and entrepreneurial initiatives in the formally planned economies of central and eastern Europe and the former Soviet Union (Article 1 of the Agreement Establishing the Bank). Central to this process are the concepts of transition impact and additionality. As the emphasis of the transition process has been directed towards macro-economic stabilisation, price and trade liberalisation, privatisation of state assets and institutional reforms, the criteria for assessing transition impact and additionality have to date been appropriately financial and economic. In comparison, quantification of transition impact deriving from consideration of environmental and social / sustainability issues within these processes has been less explicit, and Environmental Performance and Change have been treated as separate indicators. Where these issues have been considered, the emphasis has been principally directed towards demonstrating and setting standards for good environmental and social practice, i.e., the ‘compliance based’ approach or meeting host country, EU and/or WBG standards. Achieving EU international standards is a significant positive outcome and therefore a significant contribution to transition, for which the Bank is to be commended. Investment Strategy The following recommendations relate to expanding the interpretation of sustainable development into the EBRD’s EI transition impact potential. This report does not attempt to determine what the strategy should be, only to suggest that in developing a new strategy the Bank should consider the implications of sustainable development.
• The EBRD should consider how best to incorporate sustainable development considerations into its selection criteria for projects in the EI Sector, thereby reflecting emerging views and stakeholder expectations regarding sustainable development, as well as safeguarding the Bank’s reputation.
• The EBRD’s Natural Resource sector should seek to increase its environmental performance by using ESI data, or similar data sets, to identify, prioritise and evaluate investment opportunities. The ESI data can be used to shape investment strategy at the country level by recognising the positive correlations between environmental sustainability and specific variables that make up the ESI,32 and targeting them accordingly to maximise the effects of investment on sustainable development.
• The Natural Resource Operations Policy should be revised to capture the synergistic potential of the revised investment strategy with three of the strategic directions outlined in the EBRD’s Environmental Policy, i.e.
32 For example, the WEF study has shown that there is a very strong positive relationship between
environmental sustainability and the private sector responsiveness variable.
Page 42 of 47 Special Study: Extractive Industries
• promote environmentally-oriented investments across all sectors • encourage mainstream environmental considerations through the EBRD’s
sectoral and country strategies and technical co-operation activities • build partnerships to address regional and global environmental issues.
Measuring sustainable development at the institution and project level The following recommendations address the need to quantify sustainable development parameters. To reiterate, this report does not intend to prescribe; rather ED should design sustainable development performance indicators to best meet their needs.
• A set of criteria should be developed by OCE, ED, PED and others within the Bank to measure the performance of the EBRD-supported projects with respect to sustainable development. The focus of such criteria should be to measure the additional benefit created by the investment, above and beyond that of achieving compliance. The criteria need to provide information that will record the essential elements of individual projects as well as facilitate aggregation of project data. This will assist in the assessment of the Bank’s overall contribution to sustainable development over time. Only in this way will future projects be able to benefit from previous experience and allow the EBRD to chart a course of continual improvement with respect to sustainable development and achieving regional transition. Several models have been developed in response to the need to measure these project and investment attributes, and could serve as a guide (Appendix F, Boxes F.1 and F.2).
• PED, in close coordination with ED, should revise the current ‘environmental
performance’ and ‘environmental change’ measurements to accommodate sustainable development issues as defined within the 2003 Environmental Policy. The new metrics should be applicable to all projects going forward, thereby allowing aggregation for overall performance and change assessment, while at the same time specific enough to record key indicators of performance and change (Box 4.2).
Special Study: Extractive Industries Page 43 of 47
Box 4.2: Guidelines for selection of Environmental Performance Indicators (EPI’s) (adapted from World Bank, 1999)
• Limitation in number: A small set of well-chosen indicators tend to be better than numerous and overly broad objectives such as ‘protecting biodiversity’.
• Clarity in design: It is important to define the indicators clearly in order to avoid confusion in their development, interpretation and application.
• Realistic collection or development costs: EPI’s must be practical and realistic and therefore their cost of collection or development needs to be considered. This may lead to trade-offs between information content and cost.
• Clear identification of causal links: Causal links must be clearly identified in order to specify appropriate measures.
• High quality and reliability: Indicators, and the information they provide, are only as good as the data from which they are derived. If the ‘ideal’ indicator to measure a problem is based on unreliable data, it is common to depart from the ‘ideal’ and use proxies instead.
• Appropriate spatial and temporal scale: EPI’s often need to be measured on different scales to reflect seasonal variations, assimilative capacity of the receiving environment, lag effects, etc.
• Targets and baselines: The goal of EPI’s is typically to monitor and evaluate the long-term environmental effects of project activities. This implies the need to initially obtain an accurate baseline record of the variables chosen for measurement, as well as measurement during operation and after project completion.
Environmental offsets The following recommendation addresses offsets and highlights the positive work the EBRD is engaged in with respect to carbon offsets.
• Provisions for measuring environmental offsets should be added to the ‘performance’ and ‘change’ metrics, and applied to all the EBRD’s investments. Investments in the Natural Resource Sector are heavily weighted to the gold mining and oil and gas industries. While many environmental and social impacts can be minimised and in some cases avoided, some negative effects are inevitable. The EBRD needs to measure its negative environmental footprint. There is now an expectation that some form of environmental ‘offset’ and equivalent social compensation will balance these negative effects. For example, development in these industries often results in the unavoidable release of Greenhouse Gas Emissions. Offset initiatives being initiated by the EBRD, such as the Netherlands/EBRD Carbon Offsets Fund, have been established partly in recognition of this situation, but the concept of ‘offsets’ needs to be applied across all the EBRD’s EI projects, and measured and balanced against unavoidable environmental and social impacts.
Page 44 of 47 Special Study: Extractive Industries
5. MAJOR RECOMMENDATIONS AND CONCLUSIONS The remit of this Extractive Industry (EI) Special Study was not to determine if the EBRD should invest in the sector. Countries in the EBRD’s region are engaged in EI and their economies and future development are dependent on strong EI returns. The question therefore, for the EBRD, is not if, but how to engage in this important sector so as to maximise transition impact, thus meeting the Bank’s mandate objectives. The evaluation findings, which are in line with overall Bank performance, are as follows: Overall Performance, 56 per cent of the projects are rated Successful or Better; Transition Impact is Good or Better in 48 per cent of the projects and Satisfactory for a further 39 per cent of the projects; 57 per cent of the projects are rated Good and 14 per cent Excellent on Environmental Performance; and 100 per cent are rated Substantial/Some on Environmental Change. Of the total investments, 56 per cent meet a Satisfactory or Better modified triple-bottom-line analysis against the EBRD’s mandate. The aggregate overall sector performance rating is Successful. 5.1 RECOMMENDATIONS: The major recommendations of this Study, which emerge from the recommendations in the previous Chapters, are: Recommendation: The Bank should revisit its 1999 Natural Resources Operations Policy/Strategy.
The Policy should define what the EBRD will and will not support, and could address issues such as “no-go zones”, future generation and stabilisation funds, governance, corruption, etc. All the EBRD’s activities in EI, no matter which Banking Team is responsible for the activity, should be covered by the policy/strategy. At the 2004 AGM, senior Bank staff indicated that the Bank is considering developing an integrated Energy Strategy that will include oil and gas exploration and development operations. This suggests the need for a separate Mining Strategy. The new Strategy(ies) should be proactive, technical and strategic in approach, and needs to:
• Address FDI market trends • Incorporate current knowledge about resource availability • Include other metals (current portfolio is gold based) • Take into consideration the conclusions and recommendations of the various
WGB EI studies and outcomes; as discussed and outlined in Appendix A. • Promote sustainable development factors with a focus on addressing
environmental legacy issues • Be both proactive and reactive in its business development approach with an
increased focus on locally owned firms; and • Maximise transition impact (consider trade-offs between greenfield
sites/international investors vs. expansion projects/local investors).
Special Study: Extractive Industries Page 45 of 47
Recommendation: Move from a “compliance based” approach to a “value added” approach towards environmental performance. The Bank’s environmental mandate incorporates “additionality” and “transition impact” as relevant concepts for environment. The role of the EBRD on environment is not simply to ensure that projects meet national standards – that is the responsibility of national environmental agencies – but to help address environmental legacy issues and improve overall environmental conditions in the EBRD’s region. The Bank’s environmental approach should:
• Reflect changes in industry norms and practices since issuing the 1999 Natural Resources Operations Policy five years ago
• Result in measurable environmental improvements (need to introduce the concept of providing incentives to promote continual improvement, thus reinforcing a value added approach)
• Minimise the environmental footprint of the EBRD’s EI projects and maximise environmental benefits that can result from the EBRD’s EI projects
• Minimise reputation risks. To accomplish this change, a paradigm shift may be required along with a slightly different staff skill mix, for example, the inclusion of social specialists. Recommendation: Promote GHG reductions and offsets (improved environmental quality and a business opportunity). The current focus of the EBRD’s strategy is to reduce GHG within the context of each project. This is a necessary but not sufficient objective. Within the former Soviet Union, a significant portion of the excessive pollution originates from the inefficient use of coal and oil and gas in heating and power production systems. The proposed integrated Energy Strategy would support the concept of looking across the energy extraction, production and use cycle. The EBRD can and is addressing energy efficiency in projects in other sectors, for example:
• It is actively promoting energy efficiency and fuel substitution, and implementing the Netherlands/EBRD Multi-lateral Carbon Credit Fund (MCCF).33 The EBRD should take credit for these activities as offsets against sources of GHG and link this work to the EBRD’s oil and gas investments. There is currently no attempt to account for emissions from projects versus investments in emissions savings and sinks (agribusiness, forestry and recycling projects). What is the EBRD doing to reduce its contribution on a dollar-invested basis?
• The major players in the EI sector (Shell, BP, Exxon etc.) have all made commitments to reduce GHG, both within their projects and within the region. Within the context of the Kyoto Clean Development Mechanism, the EBRD could become a market maker and broker for GHG deals – treat these major
33 The MCCF includes restrictions on the purchase of carbon credits generated by the construction of
large hydro projects, land use change and forestry projects.
Page 46 of 47 Special Study: Extractive Industries
companies as potential project co-sponsors, not just as clients – as the EBRD is in a better position to identify potential offset projects (e.g. energy efficiency projects). The EBRD is already an investor and can become a GHG broker for these deals.
Recommendation: The Bank must improve internal processes – tracking and monitoring. This recommendation combines various internal procedures and issues as follows:
• Better measure the EBRD’s EI involvement by capturing EI projects in other sectors (e.g. iron ore and coal with steel plants, coal with power plants, etc. plus FI investments). It is important that the Bank ensures that the project coding system captures the full extent of the Bank’s investments in EI.
• The Environmental Department should consider establishing clear and consistent monitoring and reporting criteria to allow cross-project comparisons and therefore annual aggregating of data for a retrospective review of the Bank’s footprint, and for inclusion in the Annual Environmental Report.
• The Bank should consider further engaging in the new sustainability agenda e.g. IFC’s Framework, the Equator Principles, or some other accepted definition that recognises both the reconstruction AND greenfield remit of the Bank).
• This expanded natural resources scope has staffing skill mix implications with respect to technical environmental engineering input, expanded project monitoring requirements and socio-economic issues.
• The Office of the Chief Economist, Environmental Department and the Project Evaluation Department should work together to better define environmental and social performance – or sustainable development – and change objectives and link these to project monitoring.
5.2 CONCLUSIONS Based on the evaluation findings from this Special Study, three conclusions emerge. Conclusion 1: Need to expand the project fence-line to consider broader project linkages. Bankers tend to overly narrow the definition of the scope of EI projects. When problems have occurred it has more often been the result of something outside the immediate context of the project – changing market conditions, transportation infrastructure, regulatory, tax and tariff impacts, environmental issues and growing civil society engagement – that have caused projects to under-perform. Both scale and scope have not been sufficiently considered in project design to maximise transition impact. Bankers need to be more rigorous and demanding in carrying out project risk analysis. In addition, the sector policy/strategy covering natural resources should incorporate all EI activities in the Bank, not just those under the Natural Resources Team.
Special Study: Extractive Industries Page 47 of 47
Conclusion 2: Large EI projects have regional development implications. The Bank needs to look for linkages across sectors. The Bank’s objectives align with but do not necessarily coincide with that of EI project sponsors. The EBRD’s mandate is larger. It may be unreasonable to expect the larger EI project sponsors to become promoters of regional development. The EBRD needs to better coordinate within and between banking teams to support major Natural Resource projects with SME, MEI and other sector projects so as to maximise transition gains. A Strategic Environmental Assessment is one tool that the Bank could utilise to better understand local social and environmental conditions, and link them to transition objectives. Large EI projects are catalysts for regional development. Individual bankers will not be able to fully design into their projects cross-sector project clustering and/or donor coordination to ensure maximisation of regional transition impact. Management must work across banking teams and support donor collaboration. The PED Team strongly believes that such clustering results in not only the addition of project specific transition impact, but also in the multiplication of project specific benefits to support regional and country level transition. Summary conclusion: The EBRD has performed Successfully in a challenging sector. There is demand for the EBRD’s banking services in the EI sector. The EBRD has performed well, but there is room for improvement. The EBRD’s objective should always be to maximise transition impact. The necessary condition is that the Bank needs to more broadly define project “fence lines” (Conclusion 1). But that is not enough. The sufficient condition (Conclusion 2) is to support individual projects with cross-sectoral linkages. Promotion of sustainable development will enhance the EBRD’s capacity to maximise transition, which taken together will lead to better project outcomes.
Special Study: Extractive Industries Page 1 of 37
Appendix A: Summary of Recommendations of the WBG EI Review
Special Study: Extractive Industries Page 2 of 37
Starting in 2000, as a result of NGO requests at the WBG Annual Meeting in Prague, the World Bank undertook an EI Review. This review process consists of the following parallel activities:
• An internal review by the respective evaluation departments of the World
Bank (OED), MIGA (OEU) and IFC (OEG), titled Extractive Industries and Sustainable Development: An Evaluation of World Bank Group Experience.
• A special study by the Office of the Compliance Advisor/Ombudsman for IFC and MIGA (CAO), titled Extracting Sustainable Advantage.
• The Extractive Industries Review, under the direction of an independent consultant team led by former Indonesian environment minister, Emil Salim.
To put this effort in context, various other initiatives were implemented and are also under way including, but not limited to, the following: the Whitehorse Initiative (www.nrcan.gc.ca); the Global Mining Initiative (www.globalmining.com); the Extractive Industry Transparency Initiative (www.dfid.gov.uk); and the Johannesburg Summit (www.johannesburgsummit.org). In 2003, 10 leading international banks1 signed up to the “Equator Principles”2 (www.equator-principles.com). Friends of the Earth (www.foei.org), CEE Bank Watch (www.bankwatch.org) and other local, national and international NGOs have also posted, written, campaigned and protested about and against MBD involvement in the EI sector. Finally, national governments have their own strategies, polices, laws, regulations, tax structures etc., which create a business environment which in effect either encourages or discourages EI activities. The main findings of the three WBG Evaluation Departments are that the WBG needs to:
• formulate an integrated strategy which addresses investment priorities,
good governance, and adequate returns to investors and governments, with appropriate safeguards for environmental and social protection resulting in “sustainable” projects;
• strengthen project implementation with appropriate focus on environmental safeguards, project monitoring, documentation etc., throughout the life of a project; and
• do a much better job in engaging stakeholders in the decision-making process and ensuring an equitable distribution of benefits to all stakeholders; and that the process is open and transparent.
The first two items above are reflected in recommendations (1) and (4) within this report. Better engagement of stakeholders did not emerge as a critical issue for the EBRD; but stakeholder and NGO engagement is increasingly important and is addressed in the 2003 Environmental Policy, therefore PED also supports this recommendation.
1 ABN AMRO Bank; Barclays; Citigroup; Credit Lyonnais; Credit Suisse Group; HVB Group;
Rabobank Group; Royal Bank of Scotland; WestLB AG; and Westpac Banking Corporation. 2 A voluntary set of guidelines, modelled after IFC’s environmental polices and procedures, for
managing social and environmental issues related to the financing of development projects.
Special Study: Extractive Industries Page 3 of 37
The CAO study on IFC’s investments focused on Sustainability and found that IFC did a good job of applying its environmental safeguards procedures, relatively less well in applying social safeguards procedures, and its EI portfolio did not fully respond to IFC’s new focus on Sustainability. The EBRD updated its Environmental Policy in April 2003 and has directly incorporated a number of IFC’s safeguard policies. All projects reviewed in this Special Study fall under the remit of the previous policies; however, PED wishes to note that the staffing implications of the new policy commitments are significant and as currently structured, the Environmental Department (ED) lacks the internal staff needed to implement these social policies. The ED is currently working with DfID to develop these new core competencies. The main findings of the independent WBG EI Review are listed below along with an analysis of these results and recommendations as they relate to the EBRD’s operations.3 PED’s Team finds that many of the recommendations of the WBG EI Review are applicable to the EBRD. Rather than repeating them, in this report the PED Team has focussed on additional recommendations appropriate for the EBRD. The PED Team encourages the EBRD to take on board the findings, conclusions and recommendations from these reports that are relevant (as noted above and in the comments below). The conclusions of the EI Review fall under three headings:
1. The importance of pro-poor and corporate governance in extractive industries 2. Environmental and Social components in development of extractive industries 3. Human rights considerations.
The recommendations of the EI Review are listed below:
• Recommendation (1) of EI Review: Promote pro-poor public and corporate governance in the oil, gas and mining sectors. Tailor and sequence interventions to a country’s ability to ensure that EI development will contribute to poverty alleviation through sustainable development. Focus first on good governance. Regain leadership for best practice and encourage improved corporate governance. Push for pro-poor benefits from EI. Ensure local communities receive benefits from projects. Help artisanal and small-scale miners. Comments: The EBRD has a different mandate – transition rather than poverty alleviation. The EBRD is equally interested in the importance of governance at the country and company levels. The PED Team supports the concepts of greater community participation, local capacity building, better access to information, and appropriate revenue sharing. The EBRD’s possible involvement in small scale mining and artisanal mining activities would be through FI investments. The scope of this Special Study did not allow a full investigation of FI activities in natural resource extraction. Chapter 2.4 discusses this issue further, and Recommendation (4) begins to address this concern. The WBG EI Review also stressed that governance had to reach a certain level of performance before investment should take place, although the recommendation for IFC is a little softer i.e. the ability of a government to
3 EI Review, January 12, 2004. www.eireview.org
Special Study: Extractive Industries Page 4 of 37
‘withstand the inherent social, environmental and governance challenges’ must be established up front. The PED Team’s view is that, having recognised the fundamental importance of good governance, the investment community has a role to play in helping the transition from poor governance to good.
• Recommendation (2): Strengthen environmental and social components of WBG interventions in EI. Require integrated environmental and social impact assessments. Update and fully implement the Natural Habitat Policy as a basis for clear No-Go zones. Update and fully implement the resettlement policy. Revise the disclosure policy. Develop sector-specific guidance for tailings disposal, waste management, and the use of toxic substances. Develop guidelines for integrated closure planning and emergency prevention and response. Address the legacy of the past. Comments: The EBRD updated its Environmental Policy in April 2003, incorporating some of IFC’s existing social safeguard operational policies. This is a positive step. The PED Team found discrepancies in the environmental sub-sector guidelines published on the external website for use by FIs – many of which are old, and in addition there are sector gaps, and no guidelines available for oil and gas or gold mining. As currently published, these guidelines do not mandate Best Practice. PED recommends that the guidelines be replaced with reference to specific EU and/or WBG guidelines, as appropriate. In terms of environmental guidance, a common phrase in many project documents is that ‘the sponsor should adhere to national laws, or where relevant EU and/or World Bank policies and guidelines’. This is too general and leaves much to the assumption of the project sponsor. There are challenges in applying EU laws in non-EU countries, as they do not have the enabling legislation, nor do they have the institutional capacity for administration (e.g. many of the Directives refer to and rely on a Competent Authority). One way to deal with this is to recognise this conceptual short-coming and commit the project sponsors to meeting a Duty of Care that is founded on the intent of these laws, set minimum requirements of performance (especially when these can be quantified), and include provision for capacity strengthening (which ties into the governance issue referred to above), possibly through TC Funds. There also needs to be recognition of legacy issues and incentives for continual improvement (not part of the safeguard policies).
• Recommendation (3): Respect Human Rights. Adopt core labour standards
for programs and projects. Recognise indigenous peoples and their land rights. Integrate human rights in safeguards policies relevant to extractive industries, with particular attention to women’s rights. Ensure ‘free prior informed consent before resettlement’, and finally incorporate appropriate ‘revenue sharing’ with local communities. Comments: In conducting this sector evaluation, human rights did not emerge as an issue. However, it is an important principle and should be incorporated into the EBRD’s environmental and social policies and procedures. The PED Team supports the recommendations on core labour standards, indigenous peoples and land rights, women’s rights, informed consent, and local revenue
Special Study: Extractive Industries Page 5 of 37
sharing. Of note, in several countries, including Russia, land tenureship remains an unresolved issue in the transition process, to which the EBRD should give greater policy attention. Finally, the EBRD’s region currently has the highest global rate of increase for HIV/AIDS; therefore public health concerns should be incorporated into the EBRD’s EI projects.
• Recommendation (4): Rebalance Institutional Priorities. Make necessary
institutional changes, with a focus on staff compensation and incentives; support external project monitoring; promote better coordination within the WBG; improve accountability; connect sector and country strategies; support sustainable policy lending; and update safeguard policies to reflect EI findings. Actively promote sustainable energy policies, energy efficiency, recycling, and cleaner fuels, particularly renewables. Comments: Recommendation (4) of this report addresses project tracking and monitoring issues for the EBRD. The policies and procedures are regularly reviewed and updated. The issues surrounding energy use and GHG are addressed in Recommendation (3) of this report.
WORLD BANK GROUP EI POSITION ON SUSTAINABLE DEVELOPMENT The World Bank Group’s Extractive Industries Review prefaces its findings by distinguishing between different types of capital when analysing the components of sustainable development:
• natural capital (natural endowments)4 • created capital (physical infrastructure, machinery and equipment) • human capital (human skills and capacity) • social capital (the cohesiveness of people and their societies) • financial capital (all forms of financial assets, including wages).
The above variants are not necessarily concrete or fixed entities; on the contrary they will change and be transformed over time (Box A.1).
4 The EI review actually defines ‘natural capital’ as ‘nature’s economic and cultural goods and
services’. The term has been re-interpreted here to be consistent with the definitions offered in the EI Review for ‘created’, ‘ human’, ‘social’ and ‘financial’ capital.
Special Study: Extractive Industries Page 6 of 37
Td
TdcerR Tawic
Box A.1: Capital – Fluxes, Transformations, Meanings and Values Through processes such as regeneration and assimilation, natural capital such as forests, water, air andsoil and their associated ecological processes can rejuvenate (naturally or with intervention) just as theycan deteriorate naturally (e.g., fire, flood, drought, volcanic activity) or through intervention (e.g.,pollution and overexploitation). Similarly, financial capital can be transformed into human or socialcapital. Different types of capital have different meaning and values to different groups of people. The EIReview gives the example of indigenous people. For these people, as for other population groups,sustainability concerns their ability to accumulate, maintain, enhance and transfer their wealth to futuregenerations. Monetary wealth is, however, a small part of their overall wealth, which also includesindigenous laws and institutions, environmental knowledge, lands and territory imbued with culturalmeaning, ancestral attachments and spiritual relationships, access to and ownership of commonresources, social support, language and identity.
he EI Review goes on to define the following key dimensions of sustainable evelopment:
• Environmental dimension: seeks to improve human welfare by protecting the sources of ecosystem such as air, water and the raw materials used by humans, and ensuring that the sinks for human wastes are not exceeded in order to prevent harm to humans and their ecosystems. This means holding the scale of the human economic subsystem to within the biophysical limits of the overall ecosystem on which it depends.
• Social dimension: maintaining or increasing social capital, thereby improving conditions for working together and facilitating co-operation. Social capital comprises cohesion of community, connectedness between groups of people, broad acceptance of means of resolving disputes, reciprocity, tolerance, compassion, solidarity, patience, forbearance, fellowship, commonly accepted standards of honesty, and ethics.
• Economic dimension: means the creation of throughput which is limited by the optimum scale of the economy that does not exceed the carrying capacity of the earth’s ecological life support system. Scale is understood as the physical scale of human presence in the ecosystem, as measured by population multiplied by per capita resource use, and optimal scale is one that maximises lives over time at a sufficient level of per capita resource use to support a human quality of life.
he EI Review observes that the adoption of the sustainability criterion into evelopment recognises that created capital is no longer the limiting factor. As natural apital is becoming the limiting factor, logic indicates the need to invest more in nhancing the supply of natural capital: on the source side by harvesting within egeneration rates and on the sink side by disposing within assimilation rates. The EI eview notes that technology can loosen both these constraints.
he EI Review also stresses the importance of sustainable development for poverty lleviation, noting in particular that free markets do not produce the public goods on hich the poor depend, so much more than the rich. This point highlights the
mportance of equity and fairness in the use of natural resources, and therefore in the hoices for corporations and institutions when faced with delivering practical results to
Special Study: Extractive Industries Page 7 of 37
support policy aspirations. The World Bank Group (WBG, 2001) characterises three main issues in this respect, namely:
• the trade-off between present and future generations; • the issue of equitable access to resources, and the impacts of resource use and
the differing impacts of degradation between rich and poor, both within a country and among countries; and
• the perceived lack of overlap between actions that address local and global environmental concerns.
This presents the challenge to develop and implement policies and investment programmes that not only support continued economic development but that also:
• result in a more equitable distribution of the benefits of development, particularly with regard to poverty;
• avoid sacrificing the interests and choices of future generations in order to meet the needs of the current generation; and
• build on the emerging global consensus that natural resources and other valuable environmental assets must be managed in a sustainable manner (WBG, 2001).
Special Study: Extractive Industries Page 8 of 37
APPENDIX B: EI PORTFOLIO DATA
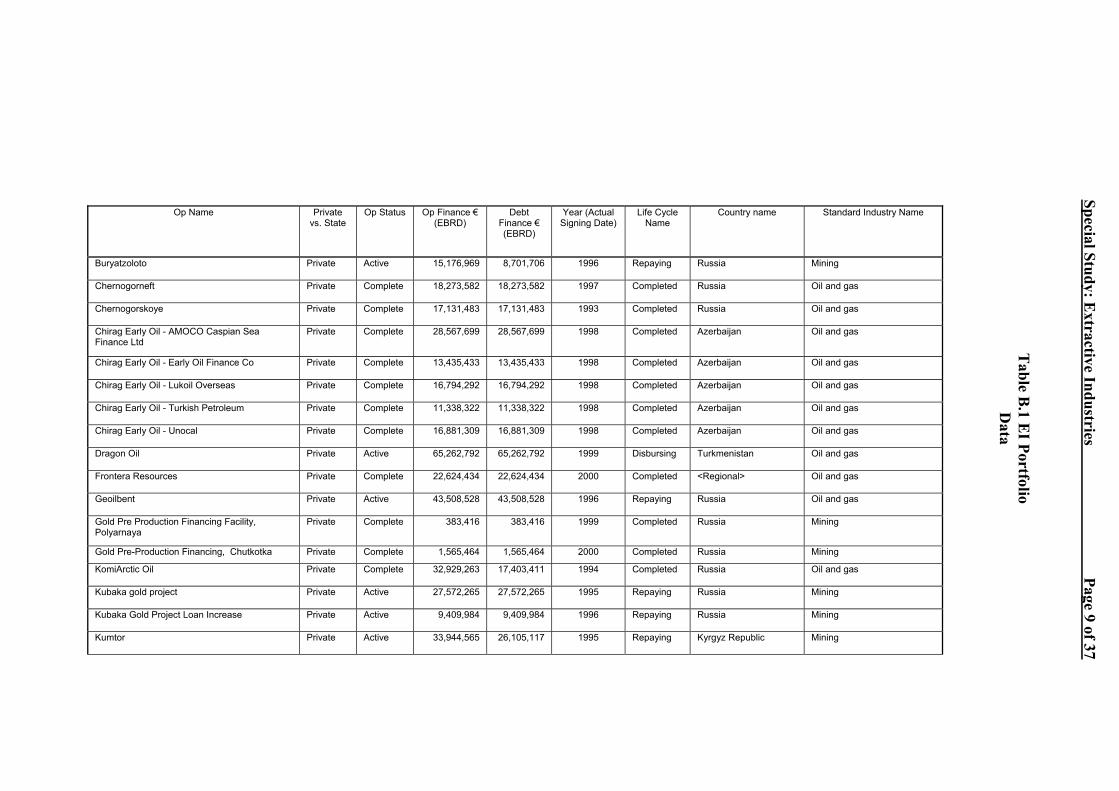
Op Name Private
vs. State Op Status Op Finance €
(EBRD) Debt
Finance € (EBRD)
Year (Actual Signing Date)
Life Cycle Name
Country name Standard Industry Name
Buryatzoloto Private Active 15,176,969 8,701,706 1996 Repaying Russia Mining
Chernogorneft Private Complete 18,273,582 18,273,582 1997 Completed Russia Oil and gas
Chernogorskoye Private Complete 17,131,483 17,131,483 1993 Completed Russia Oil and gas
Chirag Early Oil - AMOCO Caspian Sea Finance Ltd
Private Complete 28,567,699 28,567,699 1998 Completed Azerbaijan Oil and gas
Chirag Early Oil - Early Oil Finance Co Private Complete 13,435,433 13,435,433 1998 Completed Azerbaijan Oil and gas
Chirag Early Oil - Lukoil Overseas Private Complete 16,794,292 16,794,292 1998 Completed Azerbaijan Oil and gas
Chirag Early Oil - Turkish Petroleum Private Complete 11,338,322 11,338,322 1998 Completed Azerbaijan Oil and gas
Chirag Early Oil - Unocal Private Complete 16,881,309 16,881,309 1998 Completed Azerbaijan Oil and gas
Dragon Oil Private Active 65,262,792 65,262,792 1999 Disbursing Turkmenistan Oil and gas
Frontera Resources Private Complete 22,624,434 22,624,434 2000 Completed <Regional> Oil and gas
Geoilbent Private Active 43,508,528 43,508,528 1996 Repaying Russia Oil and gas
Gold Pre Production Financing Facility, Polyarnaya
Private Complete 383,416 383,416 1999 Completed Russia Mining
Gold Pre-Production Financing, Chutkotka Private Complete 1,565,464 1,565,464 2000 Completed Russia Mining
KomiArctic Oil Private Complete 32,929,263 17,403,411 1994 Completed Russia Oil and gas
Kubaka gold project Private Active 27,572,265 27,572,265 1995 Repaying Russia Mining
Kubaka Gold Project Loan Increase Private Active 9,409,984 9,409,984 1996 Repaying Russia Mining
Kumtor Private Active 33,944,565 26,105,117 1995 Repaying Kyrgyz Republic Mining
Special Study: Extractive Industries Page 9 of 37
Table B
.1 EI Portfolio
Data
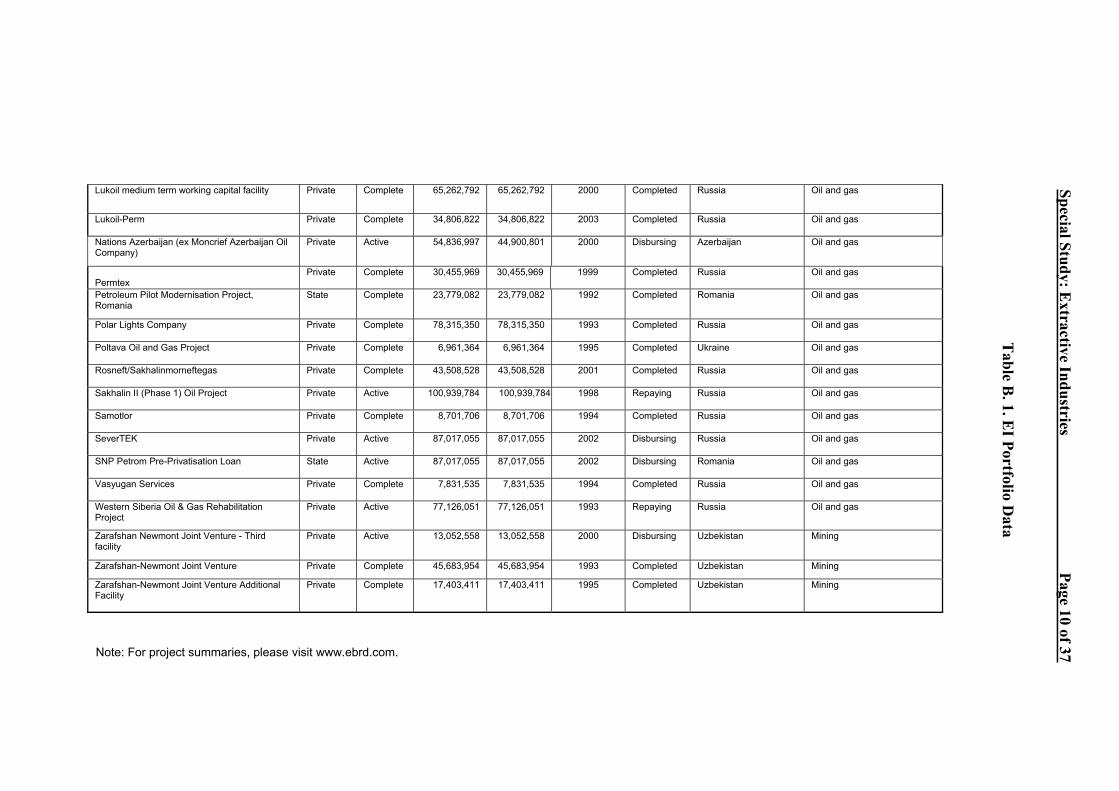
Lukoil medium term working capital facility Private Complete 65,262,792 65,262,792 2000 Completed Russia Oil and gas
Lukoil-Perm Private Complete 34,806,822 34,806,822 2003 Completed Russia Oil and gas
Nations Azerbaijan (ex Moncrief Azerbaijan Oil Company)
Private Active 54,836,997 44,900,801 2000 Disbursing Azerbaijan Oil and gas
Permtex
Private Complete 30,455,969 30,455,969 1999 Completed Russia Oil and gas
Petroleum Pilot Modernisation Project, Romania
State Complete 23,779,082 23,779,082 1992 Completed Romania Oil and gas
Polar Lights Company Private Complete 78,315,350 78,315,350 1993 Completed Russia Oil and gas
Poltava Oil and Gas Project Private Complete 6,961,364 6,961,364 1995 Completed Ukraine Oil and gas
Rosneft/Sakhalinmorneftegas Private Complete 43,508,528 43,508,528 2001 Completed Russia Oil and gas
Sakhalin II (Phase 1) Oil Project Private Active 100,939,784 100,939,784 1998 Repaying Russia Oil and gas
Samotlor Private Complete 8,701,706 8,701,706 1994 Completed Russia Oil and gas
SeverTEK Private Active 87,017,055 87,017,055 2002 Disbursing Russia Oil and gas
SNP Petrom Pre-Privatisation Loan State Active 87,017,055 87,017,055 2002 Disbursing Romania Oil and gas
Vasyugan Services Private Complete 7,831,535 7,831,535 1994 Completed Russia Oil and gas
Western Siberia Oil & Gas Rehabilitation Project
Private Active 77,126,051 77,126,051 1993 Repaying Russia Oil and gas
Zarafshan Newmont Joint Venture - Third facility
Private Active 13,052,558 13,052,558 2000 Disbursing Uzbekistan Mining
Zarafshan-Newmont Joint Venture Private Complete 45,683,954 45,683,954 1993 Completed Uzbekistan Mining
Zarafshan-Newmont Joint Venture Additional Facility
Private Complete 17,403,411 17,403,411 1995 Completed Uzbekistan Mining
Special Study: Extractive Industries
Page 10 of 37
Table B
. 1. EI Portfolio D
ata
Note: For project summaries, please visit www.ebrd.com.
Special Study: Extractive Industries Page 11 of 37
APPENDIX C - ANNUAL AND REGIONAL FDI DATA
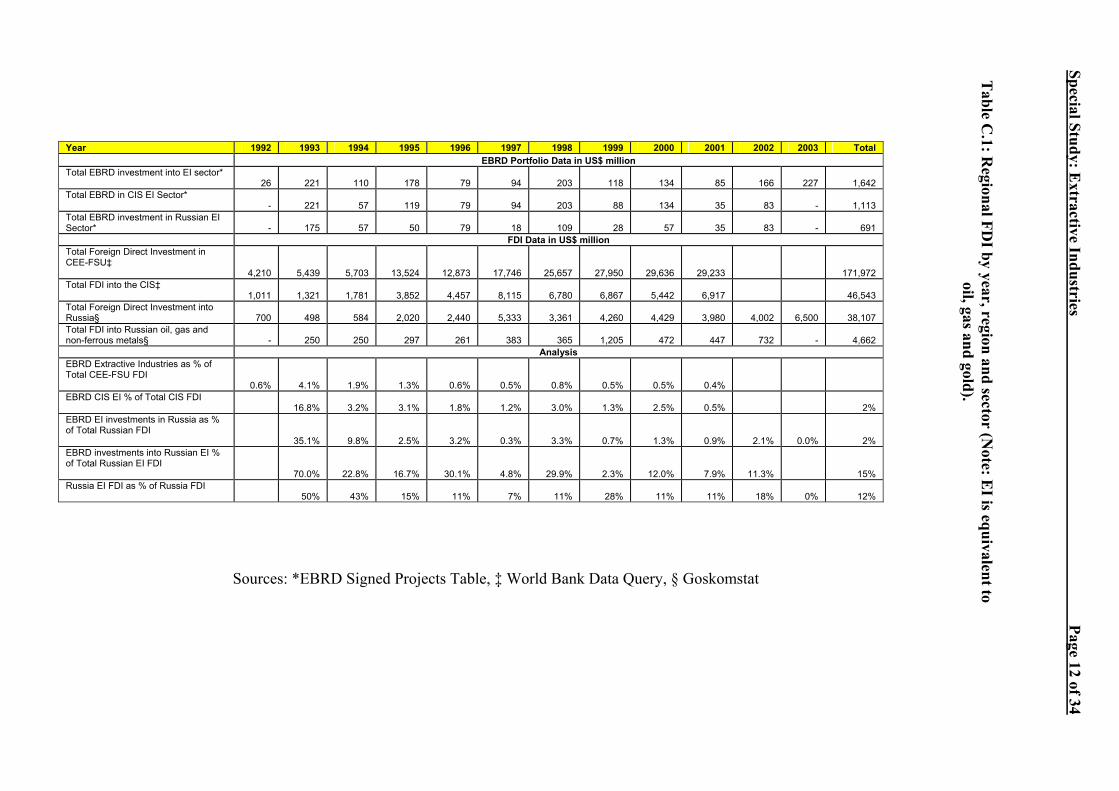
Year 1992 1993 1994 1995 1996 1997 1998 1999 2 EBRD Portfolio Data in US$ million Total EBRD investment into EI sector* 26 221 110 178 79 94 203 118Total EBRD in CIS EI Sector* - 221 57 119 79 94 203 88Total EBRD investment in Russian EI Sector* - 175 57 50 79 18 109 28 FDI Data in US$ million Total Foreign Direct Investment in CEE-FSU‡ 4,210 5,439 5,703 13,524 12,873 17,746 25,657 27,950 29Total FDI into the CIS‡ 1,011 1,321 1,781 3,852 4,457 8,115 6,780 6,867 5Total Foreign Direct Investment into Russia§ 700 498 584 2,020 2,440 5,333 3,361 4,260 4Total FDI into Russian oil, gas and non-ferrous metals§ - 250 250 297 261 383 365 1,205 Analysis EBRD Extractive Industries as % of Total CEE-FSU FDI 0.6% 4.1% 1.9% 1.3% 0.6% 0.5% 0.8% 0.5% 0EBRD CIS EI % of Total CIS FDI 16.8% 3.2% 3.1% 1.8% 1.2% 3.0% 1.3% 2EBRD EI investments in Russia as % of Total Russian FDI 35.1% 9.8% 2.5% 3.2% 0.3% 3.3% 0.7% 1EBRD investments into Russian EI % of Total Russian EI FDI 70.0% 22.8% 16.7% 30.1% 4.8% 29.9% 2.3% 12Russia EI FDI as % of Russia FDI 50% 43% 15% 11% 7% 11% 28%
Sources: *EBRD Signed Projects Table, ‡ World Bank Data Quer
000 2001 2002 2003 Total
134 85 166 227 1,642
134 35 83 - 1,113
57 35 83 - 691
,636 29,233 171,972
,442 6,917 46,543
,429 3,980 4,002 6,500 38,107
472 447 732 - 4,662
.5% 0.4%
.5% 0.5% 2%
.3% 0.9% 2.1% 0.0% 2%
.0% 7.9% 11.3% 15%
11% 11% 18% 0% 12%
y, § Goskomstat
Table C
.1: Regional FD
I by year, region and sector (Note: E
I is equivalent to oil, gas and gold).
Special Study: Extractive Industries
Page 12 of 34
Special Study: Extractive Industries Page 13 of 37
APPENDIX D: PED EVALUATION RATINGS
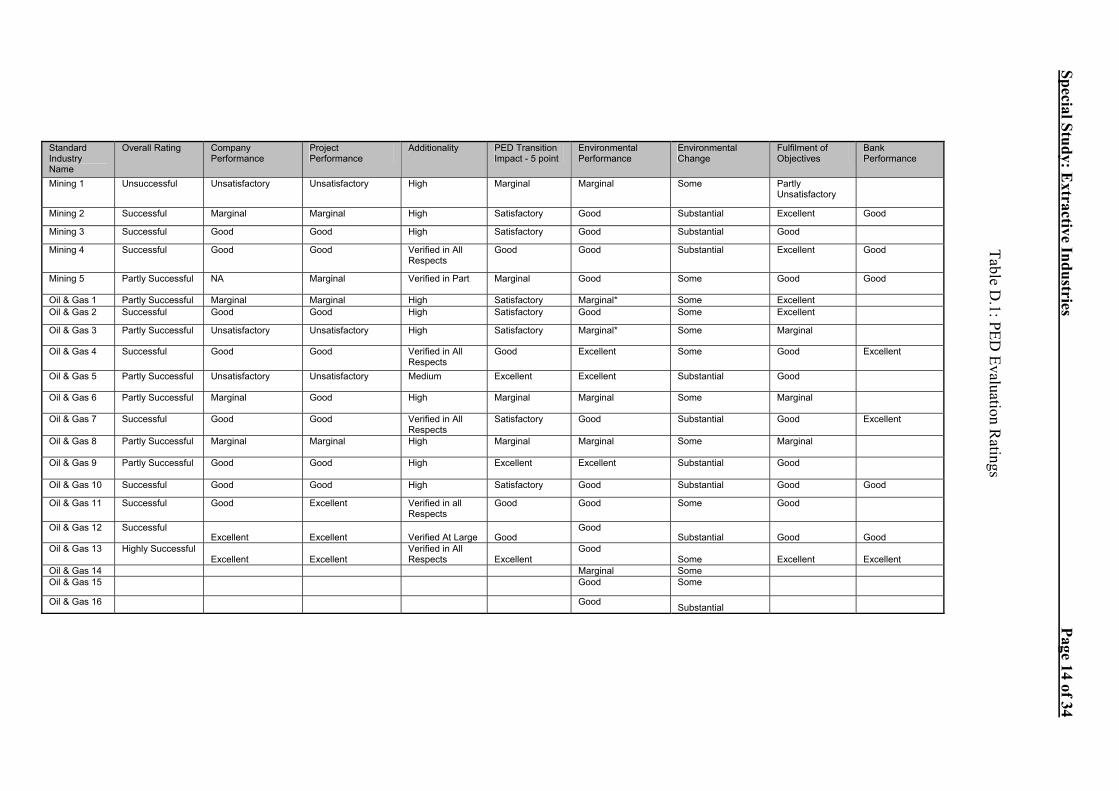
Special Study: Extractive Industries Page 14 of 34
Standard Industry Name
Overall Rating Company Performance
Project Performance
Additionality PED Transition Impact - 5 point
Environmental Performance
Environmental Change
Fulfilment of Objectives
Bank Performance
Mining 1 Unsuccessful Unsatisfactory Unsatisfactory High Marginal Marginal Some Partly Unsatisfactory
Mining 2 Successful Marginal Marginal High Satisfactory Good Substantial Excellent Good
Mining 3 Successful Good Good High Satisfactory Good Substantial Good
Mining 4 Successful Good Good Verified in All Respects
Good Good Substantial Excellent Good
Mining 5 Partly Successful NA Marginal Verified in Part Marginal Good Some Good Good
Oil & Gas 1 Partly Successful Marginal Marginal High Satisfactory Marginal* Some Excellent Oil & Gas 2 Successful Good Good High Satisfactory Good Some Excellent
Oil & Gas 3 Partly Successful Unsatisfactory Unsatisfactory High Satisfactory Marginal* Some Marginal
Oil & Gas 4 Successful Good Good Verified in All
Respects Good Excellent Some Good Excellent
Oil & Gas 5 Partly Successful Unsatisfactory Unsatisfactory Medium Excellent Excellent Substantial Good
Oil & Gas 6 Partly Successful Marginal Good High Marginal Marginal Some Marginal
Oil & Gas 7 Successful Good Good Verified in All Respects
Satisfactory Good Substantial Good Excellent
Oil & Gas 8 Partly Successful Marginal Marginal High Marginal Marginal Some Marginal
Oil & Gas 9 Partly Successful Good Good High Excellent Excellent Substantial Good
Oil & Gas 10 Successful Good Good High Satisfactory Good Substantial Good Good
Oil & Gas 11 Successful Good Excellent Verified in all Respects
Good Good Some Good
Oil & Gas 12 Successful Excellent Excellent Verified At Large Good
Good Substantial Good Good
Oil & Gas 13 Highly Successful Excellent Excellent
Verified in All Respects Excellent
Good Some Excellent Excellent
Oil & Gas 14 Marginal Some Oil & Gas 15
Good Some
Oil & Gas 16 Good Substantial
Table D.1: PED
Evaluation Ratings
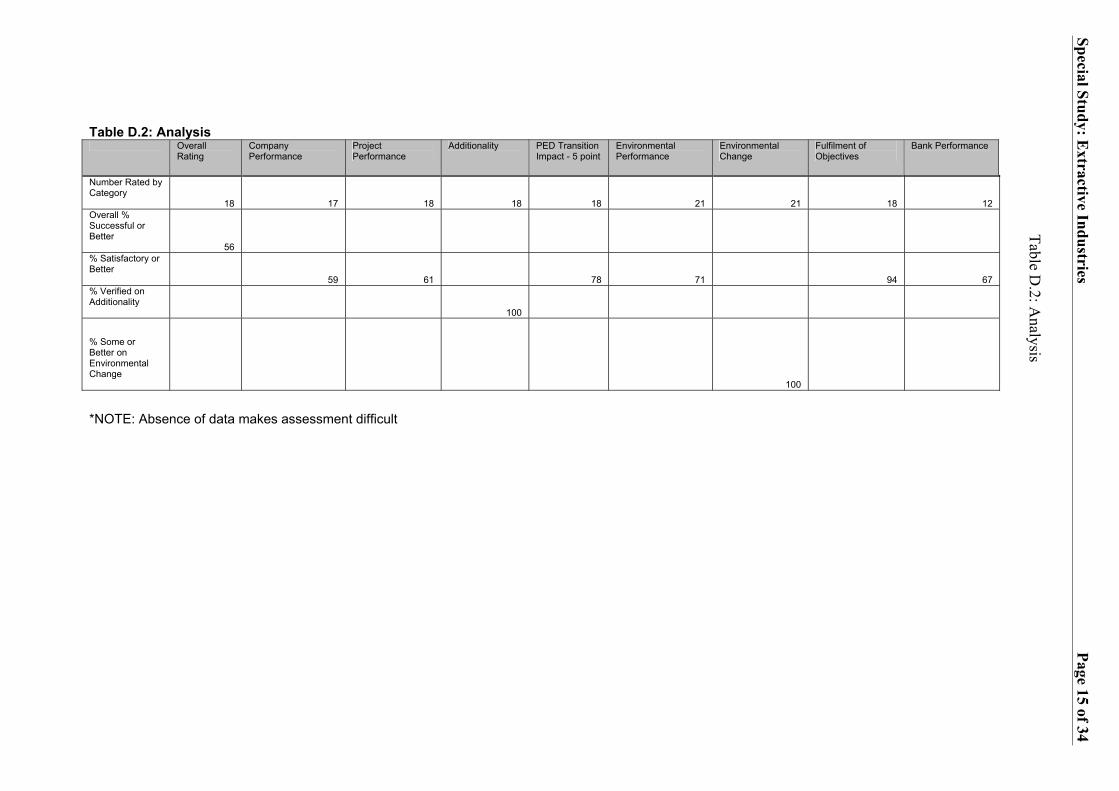
Table D.2: Analysis Overall
Rating Company Performance
Project Performance
Additionality PED Transition Impact - 5 point
Environmental Performance
EnvironmenChange
Number Rated by Category 18 17 18 18 18 21Overall % Successful or Better 56 % Satisfactory or Better 59 61 78 71 % Verified on Additionality 100
% Some or Better on Environmental Change
*NOTE: Absence of data makes assessment difficult
tal Fulfilment of Objectives
Bank Performance
21 18 12
94 67
100
Special Study: Extractive Industries
Page 15 of 34
Table D.2: A
nalysis
Special Study: Extractive Industries Page 16 of 37
APPENDIX E: LESSONS LEARNED
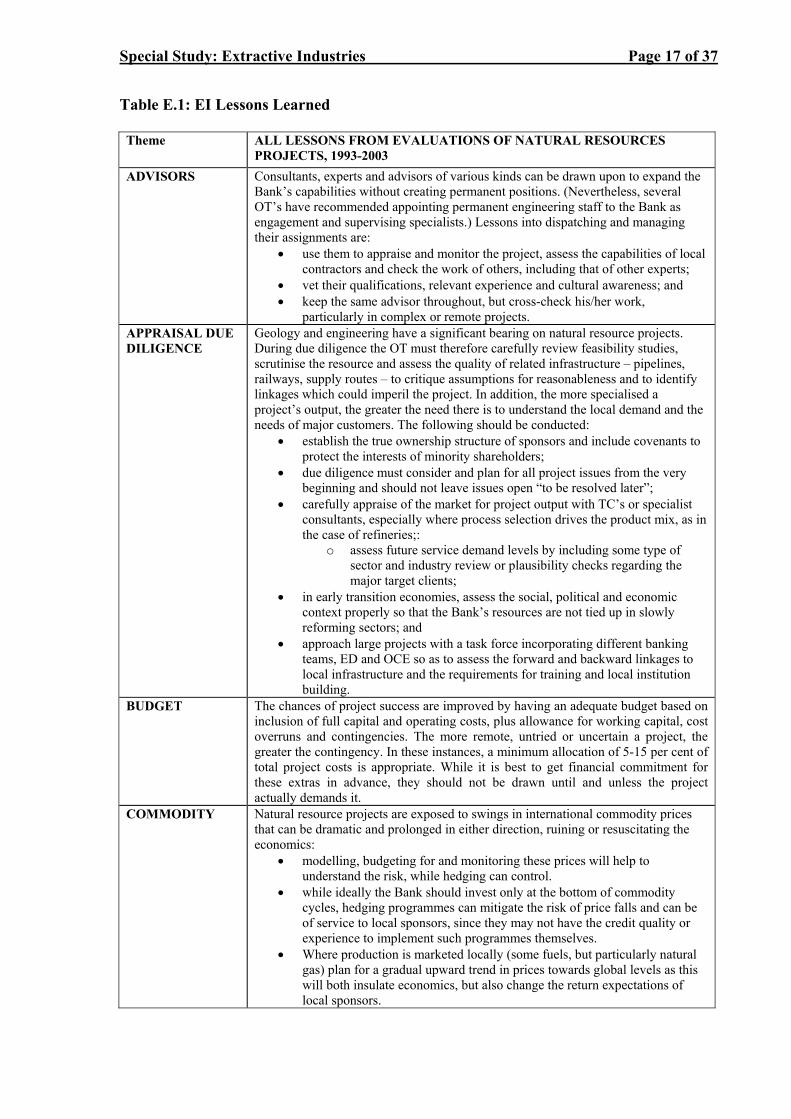
Special Study: Extractive Industries Page 17 of 37
Table E.1: EI Lessons Learned Theme
ALL LESSONS FROM EVALUATIONS OF NATURAL RESOURCES PROJECTS, 1993-2003
ADVISORS
Consultants, experts and advisors of various kinds can be drawn upon to expand the Bank’s capabilities without creating permanent positions. (Nevertheless, several OT’s have recommended appointing permanent engineering staff to the Bank as engagement and supervising specialists.) Lessons into dispatching and managing their assignments are:
• use them to appraise and monitor the project, assess the capabilities of local contractors and check the work of others, including that of other experts;
• vet their qualifications, relevant experience and cultural awareness; and • keep the same advisor throughout, but cross-check his/her work,
particularly in complex or remote projects. APPRAISAL DUE DILIGENCE
Geology and engineering have a significant bearing on natural resource projects. During due diligence the OT must therefore carefully review feasibility studies, scrutinise the resource and assess the quality of related infrastructure – pipelines, railways, supply routes – to critique assumptions for reasonableness and to identify linkages which could imperil the project. In addition, the more specialised a project’s output, the greater the need there is to understand the local demand and the needs of major customers. The following should be conducted:
• establish the true ownership structure of sponsors and include covenants to protect the interests of minority shareholders;
• due diligence must consider and plan for all project issues from the very beginning and should not leave issues open “to be resolved later”;
• carefully appraise of the market for project output with TC’s or specialist consultants, especially where process selection drives the product mix, as in the case of refineries;:
o assess future service demand levels by including some type of sector and industry review or plausibility checks regarding the major target clients;
• in early transition economies, assess the social, political and economic context properly so that the Bank’s resources are not tied up in slowly reforming sectors; and
• approach large projects with a task force incorporating different banking teams, ED and OCE so as to assess the forward and backward linkages to local infrastructure and the requirements for training and local institution building.
BUDGET
The chances of project success are improved by having an adequate budget based on inclusion of full capital and operating costs, plus allowance for working capital, cost overruns and contingencies. The more remote, untried or uncertain a project, the greater the contingency. In these instances, a minimum allocation of 5-15 per cent of total project costs is appropriate. While it is best to get financial commitment for these extras in advance, they should not be drawn until and unless the project actually demands it.
COMMODITY
Natural resource projects are exposed to swings in international commodity prices that can be dramatic and prolonged in either direction, ruining or resuscitating the economics:
• modelling, budgeting for and monitoring these prices will help to understand the risk, while hedging can control.
• while ideally the Bank should invest only at the bottom of commodity cycles, hedging programmes can mitigate the risk of price falls and can be of service to local sponsors, since they may not have the credit quality or experience to implement such programmes themselves.
• Where production is marketed locally (some fuels, but particularly natural gas) plan for a gradual upward trend in prices towards global levels as this will both insulate economics, but also change the return expectations of local sponsors.
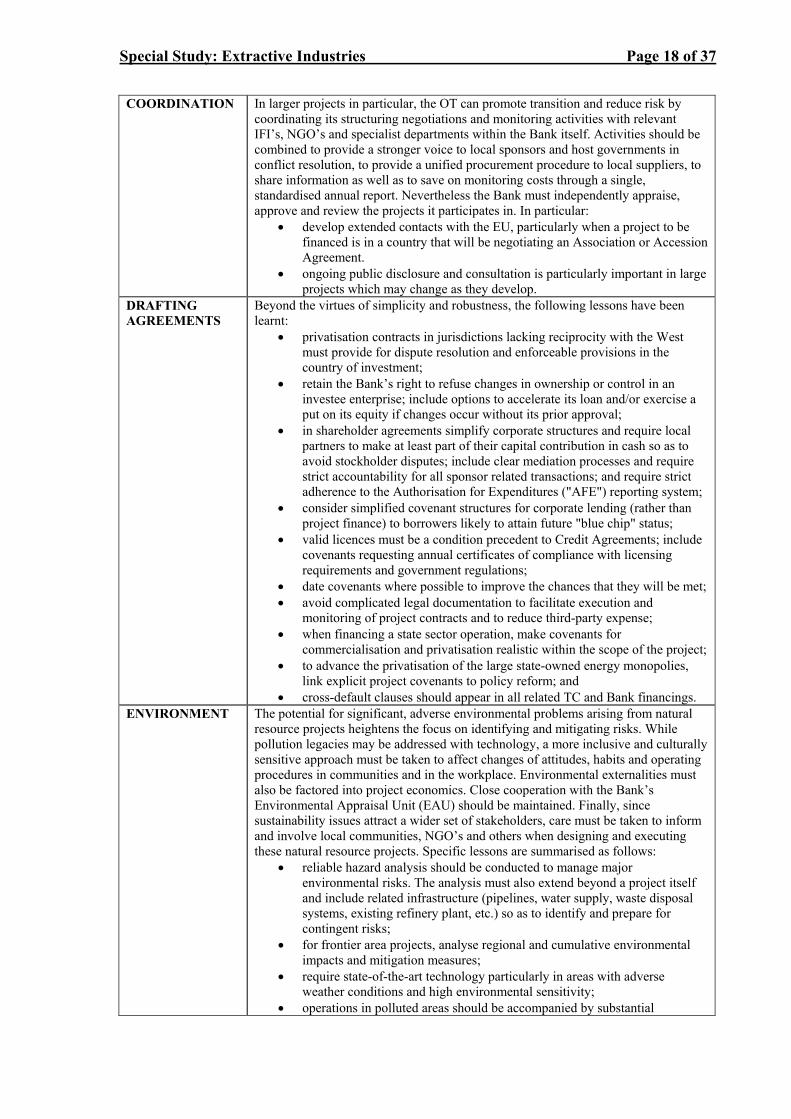
Special Study: Extractive Industries Page 18 of 37
COORDINATION
In larger projects in particular, the OT can promote transition and reduce risk by coordinating its structuring negotiations and monitoring activities with relevant IFI’s, NGO’s and specialist departments within the Bank itself. Activities should be combined to provide a stronger voice to local sponsors and host governments in conflict resolution, to provide a unified procurement procedure to local suppliers, to share information as well as to save on monitoring costs through a single, standardised annual report. Nevertheless the Bank must independently appraise, approve and review the projects it participates in. In particular:
• develop extended contacts with the EU, particularly when a project to be financed is in a country that will be negotiating an Association or Accession Agreement.
• ongoing public disclosure and consultation is particularly important in large projects which may change as they develop.
DRAFTING AGREEMENTS
Beyond the virtues of simplicity and robustness, the following lessons have been learnt:
• privatisation contracts in jurisdictions lacking reciprocity with the West must provide for dispute resolution and enforceable provisions in the country of investment;
• retain the Bank’s right to refuse changes in ownership or control in an investee enterprise; include options to accelerate its loan and/or exercise a put on its equity if changes occur without its prior approval;
• in shareholder agreements simplify corporate structures and require local partners to make at least part of their capital contribution in cash so as to avoid stockholder disputes; include clear mediation processes and require strict accountability for all sponsor related transactions; and require strict adherence to the Authorisation for Expenditures ("AFE") reporting system;
• consider simplified covenant structures for corporate lending (rather than project finance) to borrowers likely to attain future "blue chip" status;
• valid licences must be a condition precedent to Credit Agreements; include covenants requesting annual certificates of compliance with licensing requirements and government regulations;
• date covenants where possible to improve the chances that they will be met; • avoid complicated legal documentation to facilitate execution and
monitoring of project contracts and to reduce third-party expense; • when financing a state sector operation, make covenants for
commercialisation and privatisation realistic within the scope of the project; • to advance the privatisation of the large state-owned energy monopolies,
link explicit project covenants to policy reform; and • cross-default clauses should appear in all related TC and Bank financings.
ENVIRONMENT
The potential for significant, adverse environmental problems arising from natural resource projects heightens the focus on identifying and mitigating risks. While pollution legacies may be addressed with technology, a more inclusive and culturally sensitive approach must be taken to affect changes of attitudes, habits and operating procedures in communities and in the workplace. Environmental externalities must also be factored into project economics. Close cooperation with the Bank’s Environmental Appraisal Unit (EAU) should be maintained. Finally, since sustainability issues attract a wider set of stakeholders, care must be taken to inform and involve local communities, NGO’s and others when designing and executing these natural resource projects. Specific lessons are summarised as follows:
• reliable hazard analysis should be conducted to manage major environmental risks. The analysis must also extend beyond a project itself and include related infrastructure (pipelines, water supply, waste disposal systems, existing refinery plant, etc.) so as to identify and prepare for contingent risks;
• for frontier area projects, analyse regional and cumulative environmental impacts and mitigation measures;
• require state-of-the-art technology particularly in areas with adverse weather conditions and high environmental sensitivity;
• operations in polluted areas should be accompanied by substantial
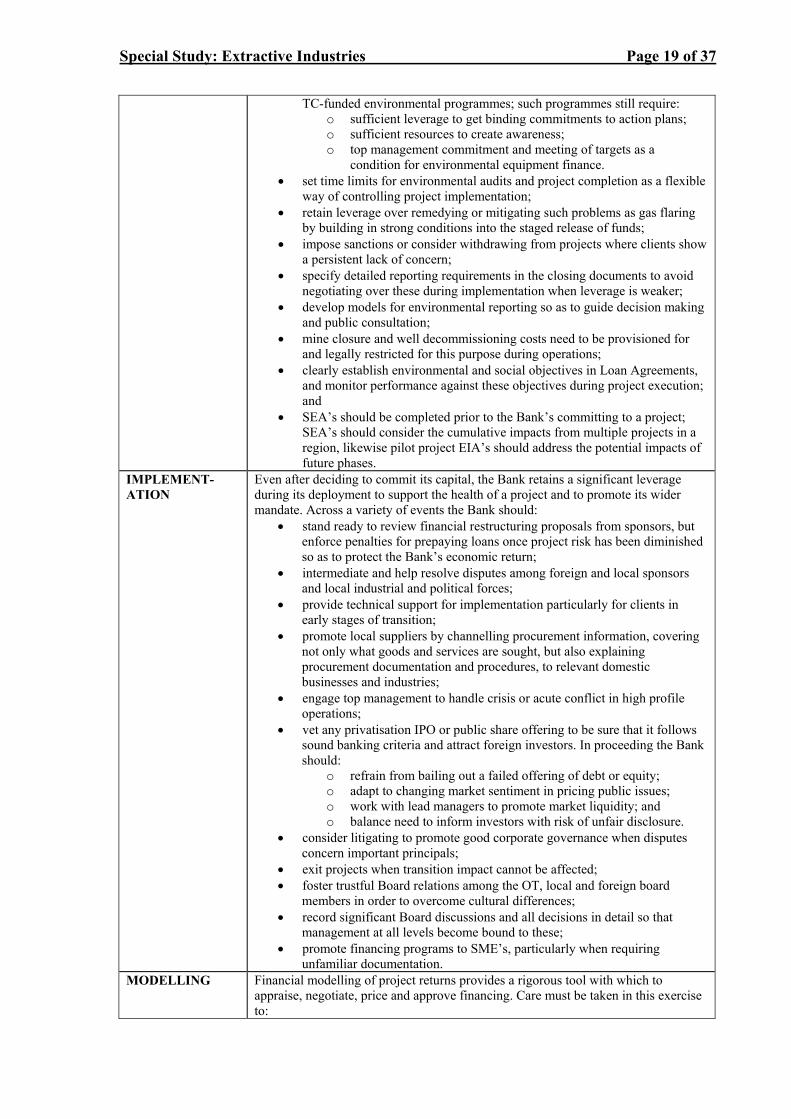
Special Study: Extractive Industries Page 19 of 37
TC-funded environmental programmes; such programmes still require: o sufficient leverage to get binding commitments to action plans; o sufficient resources to create awareness; o top management commitment and meeting of targets as a
condition for environmental equipment finance. • set time limits for environmental audits and project completion as a flexible
way of controlling project implementation; • retain leverage over remedying or mitigating such problems as gas flaring
by building in strong conditions into the staged release of funds; • impose sanctions or consider withdrawing from projects where clients show
a persistent lack of concern; • specify detailed reporting requirements in the closing documents to avoid
negotiating over these during implementation when leverage is weaker; • develop models for environmental reporting so as to guide decision making
and public consultation; • mine closure and well decommissioning costs need to be provisioned for
and legally restricted for this purpose during operations; • clearly establish environmental and social objectives in Loan Agreements,
and monitor performance against these objectives during project execution; and
• SEA’s should be completed prior to the Bank’s committing to a project; SEA’s should consider the cumulative impacts from multiple projects in a region, likewise pilot project EIA’s should address the potential impacts of future phases.
IMPLEMENT-ATION
Even after deciding to commit its capital, the Bank retains a significant leverage during its deployment to support the health of a project and to promote its wider mandate. Across a variety of events the Bank should:
• stand ready to review financial restructuring proposals from sponsors, but enforce penalties for prepaying loans once project risk has been diminished so as to protect the Bank’s economic return;
• intermediate and help resolve disputes among foreign and local sponsors and local industrial and political forces;
• provide technical support for implementation particularly for clients in early stages of transition;
• promote local suppliers by channelling procurement information, covering not only what goods and services are sought, but also explaining procurement documentation and procedures, to relevant domestic businesses and industries;
• engage top management to handle crisis or acute conflict in high profile operations;
• vet any privatisation IPO or public share offering to be sure that it follows sound banking criteria and attract foreign investors. In proceeding the Bank should:
o refrain from bailing out a failed offering of debt or equity; o adapt to changing market sentiment in pricing public issues; o work with lead managers to promote market liquidity; and o balance need to inform investors with risk of unfair disclosure.
• consider litigating to promote good corporate governance when disputes concern important principals;
• exit projects when transition impact cannot be affected; • foster trustful Board relations among the OT, local and foreign board
members in order to overcome cultural differences; • record significant Board discussions and all decisions in detail so that
management at all levels become bound to these; • promote financing programs to SME’s, particularly when requiring
unfamiliar documentation. MODELLING
Financial modelling of project returns provides a rigorous tool with which to appraise, negotiate, price and approve financing. Care must be taken in this exercise to:
Special Study: Extractive Industries Page 20 of 37
• perform sensitivity analysis under realistic scenarios considering changes in parameters (e.g., costs, prices, volumes, delays) in isolation but more significantly in combinations that reflect the actual risks to a project.
o Capital provisions can be made for groups of contingencies such as delays, exchange rates, inflation, equipment pricing, labour, etc.
• present realistic and worst case scenarios as the basis for investment appraisal, recognising that sponsors can mitigate some risks and that loan disbursements can be phased in line with covenant compliance;
• assemble and critically assess all available data, especially historical operating information on mature fields or mines;
• flag the absence of sufficient data as a reason for more extensive feasibility studies;
• flag the withholding of such data as a reason to drop a project entirely; • carefully assess assumptions on costs (e.g., for utilities) and the availability
of supply which are outside the project’s control; • update projections semi-annually to evaluate any problems emerging from
commodity price changes, delays or cost overruns; and • prepare a clear statistical database that can serve as the foundation for the
monitoring of financial and operational performance. MONITORING
Active monitoring of projects is required to maintain credit quality, identify problems at an early stage and ensure progress towards business and environmental goals. Towards these ends, the OT should maintain frequent contact with local and foreign sponsors, coordinate with senior lenders aided and draw upon other resources within the Bank – OGC, EAU, OAU, TC and PED. Specific lessons on monitoring are summarised as follows:
• reporting must include both financial and operational data to warn of declining production and allow for development of remedial plans;
• agree early with sponsors on frequency and level of detail for reporting on procurement activity;
• large TC-components add materially to monitoring needs particularly for new clients in remote early transition locations; consider TC funded expertise to support monitoring, but in all cases budget for this task;
• transferring Bank staff to monitoring may serve the efficiency of a project, but should provide incentives for and take consideration of personnel issues when doing so;
• appreciation for the value and purpose of MIS systems and IAS accounting must be fostered, particularly in enterprises at early stages of transition;
• the Bank should use its full leverage to insist on timely reports of adequate quality since this is fundamental to fulfilling the Bank’s mission to enhance corporate governance and transparency;
• specialised technical/engineering Bank staff can design monitoring plans and provide assistance with monitoring process;
• past due accounts receivable must be monitored during liquidity crises; management skills will extend to bartering when the Banking system is not functioning. Each account should be noted as to collectability, provisioning for write-off and legal proceedings undertaken and be updated on a minimum semi-annual basis;
• maintain watch list status for investee companies that fail in producing timely audited financial statements of acceptable quality;
• working mechanisms need to be in place to spot at the earliest possible time whether the borrower is in breach of contract;
• qualified, independent consultants should be appointed to complex projects to verify feasibility studies, cost estimates, structuring, documentation, construction, completion test and initial project operation.;
• ready site access to will be supported by frequent and intense monitoring activity;
• monitor complex projects with independent environmental audit mechanism supplemented by bi-annual staff trips; and
• define clear focus of monitoring programmes and establish public
Special Study: Extractive Industries Page 21 of 37
disclosure provisions early. Require sponsors of large or complex projects to appoint an environmental contact person.
OPERATIONS
Whereas the Implementation lessons deal chiefly with financial or strategic choices about how the Bank manages its investment, Operations focuses on how the Bank wishes the investee company to manage its affairs so as to advance a project:
• agree up front with the sponsor about the frequency and detail of the procurement information that the Bank requires to aid monitoring and compliance.
• the earlier the transition stage a project is in, and the more remote its location, the greater the need for on-site technical and commercial support; this may be provided through the Bank’s Resident Offices or through TC-funded programmes.
o establish project implementation units (PIU’s) to introduce western practices for tendering and procurement, etc. in lieu of external relations departments.
• early in the life of a project, recruit and involve key staff: o balance old Russian management style necessary for survival with
western management practice necessary for new reporting requirements;
o create middle management to support knowledge transfer of western operating standards to lower employee levels; and
o define roles and obligations of various parties to improve corporate governance.
• set demanding, but achievable targets; • once a risk to implementation has been identified, the Bank needs to guide
management through the required steps and ensure that accepted measures are not only implemented but understood and respected.;
• Ensure that local partners understand the restrictions on changing investment programmes under project financing;
• insist on the implementation of a strict project capital control system at a very early stage for use as a management tool;
• transparency is needed at the top and middle management level to enhance transition;
• envisage and plan for generation change at the middle management level well in advance;
• review and streamlining of the decision-making process in a large state owned entity is crucial to avoid major delays during project execution;
• prepare and insist that the sponsor company adopt a clear statistical base and transparent financial reporting system in order to evaluate a project and initiate its commercialisation/privatisation process;
• Insist that safety procedures be constantly rehearsed; consider TC funding to build capacity in this area; and
• choose production systems which can be easily maintained or replaced by regional suppliers in cases of a major breakdown.
PROCESS
The Bank’s internal policies for handling a project highlight the following lessons: • a full written account of significant information sought and obtained from
clients must be on file, irrespective of the seniority of the Bank delegation; • critical information given orally at Board meetings, particularly in
controversial situations, should be recorded in great detail; and • departing from the advice of the Legal Department requires an appropriate
level of corporate support, perhaps even obtaining re-approval by the Board.
Special Study: Extractive Industries Page 22 of 37
RESULTS
Following Bank policy ought logically to achieve the Bank’s mandate. Natural resource projects highlight the following:
• investment decisions must consider the Bank’s development strategy for a host country, restraining or encouraging investment based on corporate governance;
• management capacity can be built through positive demonstration; • successful projects are used as an example and attract other investors; • even small projects, when properly structured, can create transition impact
through demonstration to other companies operating in the region; and • potential influence on a government through policy dialogue is in reverse
proportion to said government’s reputation for integrity, so temper transition expectations accordingly, particularly where policy objectives run counter to the personal interests of key officials.
SCOPE
A project’s scope encompasses its linkages to other infrastructure and to communities. It involves both the risk and reliance of a project on these links, as well as the limits of the Bank’s support for a project. If defined too narrowly, then risks can be overlooked and related developments can be ignored. If defined too widely, then the expectations of sponsors and communities cannot be met. Specific lessons are as follows:
• technical service projects (e.g., well fraccing) should consider offering this service to outside parties in order to provide an additional income stream and thereby guard against a decline in production at the initial, targeted field or mine;
• reform expectations must be tempered by realistic appraisal of domestic politics and of the stage of host-country transition:
o Sovereign loan agreements cannot substitute firm commitment to defined reform timetables.
• realistically access the limited project implementation capabilities of large enterprises in early stages of transition;
• project appraisal must emphasise the consequences of shortfalls outside the segment financed, since financing a very narrow sub-project may prove to be sub-optimal and risky. In particular, the Bank’s reputation can be at risk to the failure of any part of a project, from having been perceived to support the project in its entirety;
• privatisation of a large industrial complex should involve joint privatisation of related firms that form part of the industrial complex;
• avoid changes to an agreed project concept as this is usually costly and time consuming;
• the Bank should use its strong presence to foster industry consolidation; • in large investment projects, local supplier production of high quality goods
should be stimulated, possibly with the help of other foreign strategic investors, to allow for an adequate know-how transfer to the community;
• when dealing with very large corporations, extensive due diligence should extend beyond the company itself and into its major trading partners who may be party to the contemplated transaction as well as to the Company’s ties and dealings with the Government or government agencies, be they clients, suppliers or shareholders; and
• large, frontier projects must consider regional implications from the start. SPONSORS
Sponsors, both local and international, are fundamental to the origination, execution and hence the financial and transition success of any project. The following lessons have been learned in natural resource projects from relations with and among them:
• while it is self-evident that strong and committed sponsors are desirable, the specific qualities sought are: (1) financial resources sufficient to shoulder possible cost overruns, payment arrears and the like; (2) industry specific technical expertise; and (3) in-country operating and political experience so as to cope with the high capital expenditures, uncertain payments, remote locations and political risks inherent in these projects;
• transition impact and demonstration effects are greatest in private or soon to be privatised enterprises where state influence is minimal;
Special Study: Extractive Industries Page 23 of 37
• payment and supply routes should be dedicated to the Project so as to protect it from sponsor company problems;
• since Projects directed to supplying the State face a high risk of payment arrears, the Bank concentrates on private sector projects where production sharing agreements (PSA’s) form the basis for economic returns;
• do not compromise the due diligence process or negotiating positions when dealing with large, strategic “big-name” sponsors;
• investigate the rationale and risk exposure of each sponsor to ensure that risks and rewards are adequately balanced between foreign and local parties, and ideally where sponsors have skills complementary to each other. If such balance cannot be achieved then seek support agreements and guarantees (completion, performance, or general corporate) from the dominant partner;
• when designing a general borrowing facility, commit resources to selecting and marketing to the intended SME recipients, particularly where this involves novel or complex documentation; and
• with public consultation, inform the sponsor’s local office what is involved and seek their co-operation beyond the strict minimum requirements of document display.
STRUCTURE
The legal, financial and operating structure of a Project that is negotiated by the OT sets the ground rules for its implementation and defines the tools and leverage with which the Bank can influence operations and mitigate risks. Lessons learned in this topic are summarised as follows:
• with a pilot project, confirm that basic assumptions and security packages follow sector practice; structure it with a larger investment in mind;
• re-scheduling of sovereign loans is impracticable, so take great care not to over-stretch the capabilities of the end borrower;
• privatisation negotiations must seek to ensure adherence to good corporate governance and standards of business conduct; include explicit exit options to protect the Bank’s investment and its reputation should occurrence of such breach occur;
• public offerings with caveats for incentive placements to employees must be conditioned and capped in a transparent manner so as to protect other shareholders from dilution or loss of value:
o appraise them independently for credit, dilution, and reputation risk from a transition viewpoint prior to the Bank’s participation; and
o insist on “right of refusal” covenants over changes in ownership or control in order to enhance corporate governance and reduce risk.
• project finance to large enterprises in early stages of transition requires particularly clear project definition and covenants relating to implementation, monitoring and reporting. Phase disbursements for achievement of defined goals to encourage project implementation and reduce the risk of loan rescheduling;
• fully integrate the local sponsor in the implementation and running of a venture especially where they will contractually assume/resume responsibility of the project after a certain time;
• since contract enforceability – not content – is the overriding problem with national suppliers and contractors, research their resources and capabilities before signing contracts, and allow for slippages in budget and schedule;
• link pre-payment fees and stepped down pricing to project completion and client performance which result in falling project, corporate and country risk;
• ensure that prices for services and goods among JV partners follow industry practice under the assumption that local prices will approach global market prices over time;
• with governments, require critical reforms to be enacted before loans are disbursed since there will be little leverage afterwards;
• In cases of dominant local management in particular, explain and stress to
Special Study: Extractive Industries Page 24 of 37
local clients before they sign a loan agreement that major changes to an agreed investment schedule are not automatic, will require Bank approval and are likely to delay both disbursements and subsequent project implementation;
• clearly define and agree completion tests before disbursing a loan; • in a PSA with many participants, the Bank should endeavour to lend to the
majority of the participants so as to strengthen the Bank’s position in the operating committee;
• Carefully observe the linkages among various parts of an industrial conglomerate prior to assigning responsibilities so as to aid restructuring; and
• To exert greater leverage in a policy dialogue, break a large project into a series of smaller projects (or smaller disbursements) where moving ahead is made conditional upon satisfactory resolution of outstanding issues.
TECH COOPERATION
TC programmes can extend a project’s scope to address legacy or transition issues that are beyond the immediate economics – degraded infrastructure, polluted sites, training, managerial development, IT installation or upgrading, IAS accounting, reporting and monitoring, commercialisation or privatisation of the State company, etc. TC’s can also be used better to assess, scope or plan for a large project where backward linkages to resources and forward linkages to markets will bear on the eventual success. The best results are achieved when the sponsors have paid in cash for at least some of the TC programme. In instances where attitudes or practices are to be changed, such as environmental treatment or reporting requirements, then the TC must allocate both money and time to build an awareness of the problem within the affected community and earn a commitment from the affected persons to rectifying it.
• technical and managerial TC’s bring most benefit where closely related to an end investment and where practical, rather than academic or high-tech, in approach;
• phase TC programmes at inception for on-site analysis, after milestone achievements or deviations, and for substantial re-orientation of programmes upon major deviations identified during project review;
• allocate ample time and resources to foster awareness of IT/MIS systems as a tool for market-related management in order to secure client commitment;
• scrutinising TC applications through a different clearing body (TC-Review Committee) than investment operations (Operations Committee);
• to avoid conflicts of interest, where TC consultants will act for the client then they should be solely responsible for procuring the consultant services;
• TC studies should follow western approaches to minimising the life cycle costs for capital projects including, among other things, preparing the FEED before the EPC;
• prior to committing substantial TC resources, realistically assess the chances of a successful financing. Where doubt persists, consider a scoping study as a less expensive alternative to a full study, but in either case, evaluate the reliability and serviceable life of existing equipment and plant; and
• in early transition economies use TC to show the various steps required to fulfil covenants on commercialisation and privatisation to assist the host country in adhering to such covenants in the resulting project and hence improve the transition impact.
TRAINING
Training concerns not only the safe introduction of new technology or equipment to an unfamiliar workforce, but also the strengthening or capacity building of local institutions to regulate and SME’s to supply the project entity. Training is also fundamental to affecting transition and sustainability. Lessons to consider are: • train management in Environmental Management System (“EMS”) in the early
stage of a project to gain their understanding and commitment; • training requirements for plant operators should be carefully evaluated with
allocations made in the investment budget; • resident experts who can be trusted members of a community are best placed to

Special Study: Extractive Industries Page 25 of 37
implement changes in habit and achieve “ownership” of action plans; • insist that personnel receive proper training, particularly for new, complex or
unfamiliar plant and equipment since this will improve efficiency and guard against accidents;
• local institutions may benefit from a capacity building project to boost their ability to assess and monitor a project’s health, safety and environmental performance;
• where projects affect a region, use TC to establish a strong local entity charged with implementing and coordinating all aspects of sustainable development in a transparent fashion; and
• in large or regional projects establish a Vocational Training Centre for SME’s with access to finance in order advance transition impact and sustainable development.
Special Study: Extractive Industries Page 26 of 37
APPENDIX F: ENVIRONMENTAL SUSTAINABILITY INDEX
SUPPORTING DATA AND PERFORMANCE INDICATORS
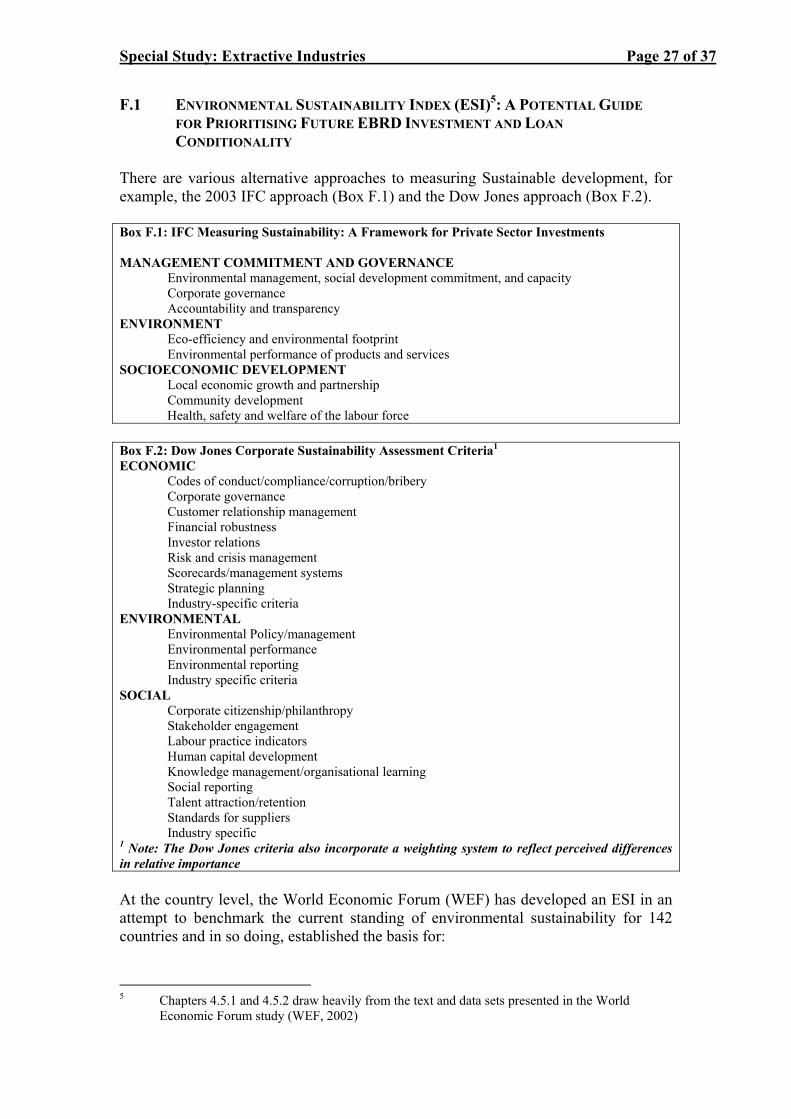
Special Study: Extractive Industries Page 27 of 37
F.1 ENVIRONMENTAL SUSTAINABILITY INDEX (ESI)5: A POTENTIAL GUIDE FOR PRIORITISING FUTURE EBRD INVESTMENT AND LOAN CONDITIONALITY
There are various alternative approaches to measuring Sustainable development, for example, the 2003 IFC approach (Box F.1) and the Dow Jones approach (Box F.2). Box F.1: IFC Measuring Sustainability: A Framework for Private Sector Investments MANAGEMENT COMMITMENT AND GOVERNANCE Environmental management, social development commitment, and capacity Corporate governance Accountability and transparency ENVIRONMENT Eco-efficiency and environmental footprint Environmental performance of products and services SOCIOECONOMIC DEVELOPMENT Local economic growth and partnership Community development Health, safety and welfare of the labour force Box F.2: Dow Jones Corporate Sustainability Assessment Criteria1
ECONOMIC Codes of conduct/compliance/corruption/bribery
Corporate governance Customer relationship management Financial robustness Investor relations Risk and crisis management Scorecards/management systems Strategic planning Industry-specific criteria
ENVIRONMENTAL Environmental Policy/management Environmental performance Environmental reporting
Industry specific criteria SOCIAL Corporate citizenship/philanthropy Stakeholder engagement Labour practice indicators
Human capital development Knowledge management/organisational learning Social reporting Talent attraction/retention Standards for suppliers Industry specific
1 Note: The Dow Jones criteria also incorporate a weighting system to reflect perceived differences in relative importance At the country level, the World Economic Forum (WEF) has developed an ESI in an attempt to benchmark the current standing of environmental sustainability for 142 countries and in so doing, established the basis for:
5 Chapters 4.5.1 and 4.5.2 draw heavily from the text and data sets presented in the World
Economic Forum study (WEF, 2002)
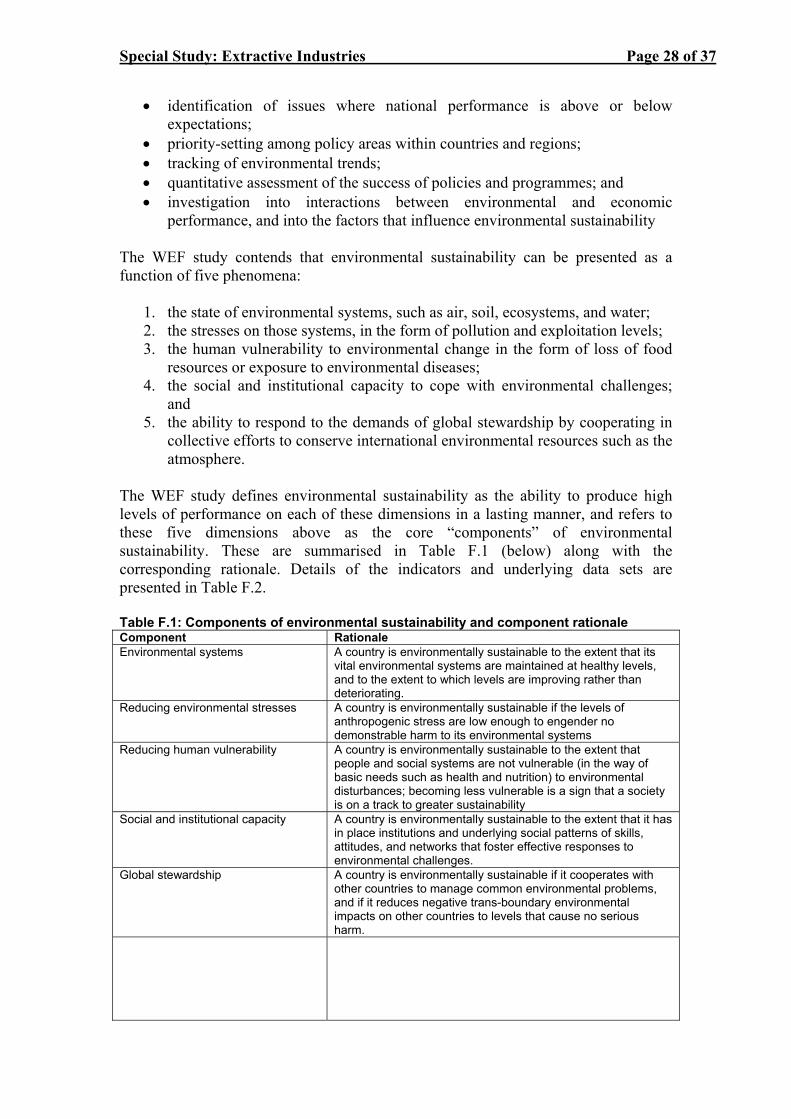
Special Study: Extractive Industries Page 28 of 37
• identification of issues where national performance is above or below expectations;
• priority-setting among policy areas within countries and regions; • tracking of environmental trends; • quantitative assessment of the success of policies and programmes; and • investigation into interactions between environmental and economic
performance, and into the factors that influence environmental sustainability The WEF study contends that environmental sustainability can be presented as a function of five phenomena:
1. the state of environmental systems, such as air, soil, ecosystems, and water; 2. the stresses on those systems, in the form of pollution and exploitation levels; 3. the human vulnerability to environmental change in the form of loss of food
resources or exposure to environmental diseases; 4. the social and institutional capacity to cope with environmental challenges;
and 5. the ability to respond to the demands of global stewardship by cooperating in
collective efforts to conserve international environmental resources such as the atmosphere.
The WEF study defines environmental sustainability as the ability to produce high levels of performance on each of these dimensions in a lasting manner, and refers to these five dimensions above as the core “components” of environmental sustainability. These are summarised in Table F.1 (below) along with the corresponding rationale. Details of the indicators and underlying data sets are presented in Table F.2. Table F.1: Components of environmental sustainability and component rationale Component Rationale Environmental systems A country is environmentally sustainable to the extent that its
vital environmental systems are maintained at healthy levels, and to the extent to which levels are improving rather than deteriorating.
Reducing environmental stresses
A country is environmentally sustainable if the levels of anthropogenic stress are low enough to engender no demonstrable harm to its environmental systems
Reducing human vulnerability A country is environmentally sustainable to the extent that people and social systems are not vulnerable (in the way of basic needs such as health and nutrition) to environmental disturbances; becoming less vulnerable is a sign that a society is on a track to greater sustainability
Social and institutional capacity A country is environmentally sustainable to the extent that it has in place institutions and underlying social patterns of skills, attitudes, and networks that foster effective responses to environmental challenges.
Global stewardship A country is environmentally sustainable if it cooperates with other countries to manage common environmental problems, and if it reduces negative trans-boundary environmental impacts on other countries to levels that cause no serious harm.
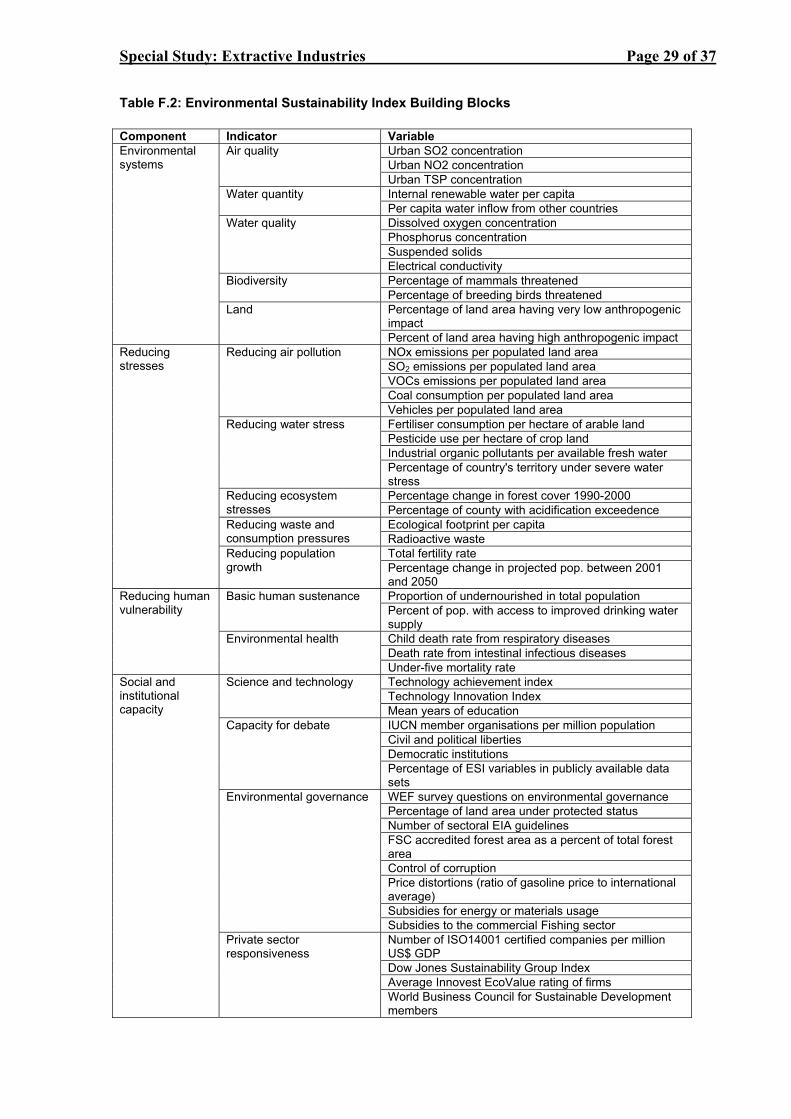
Special Study: Extractive Industries Page 29 of 37
Table F.2: Environmental Sustainability Index Building Blocks Component Indicator Variable
Urban SO2 concentration Urban NO2 concentration
Air quality
Urban TSP concentration Internal renewable water per capita Water quantity Per capita water inflow from other countries Dissolved oxygen concentration Phosphorus concentration Suspended solids
Water quality
Electrical conductivity Percentage of mammals threatened Biodiversity
Percentage of breeding birds threatened Percentage of land area having very low anthropogenic impact
Environmental systems
Land
Percent of land area having high anthropogenic impact NOx emissions per populated land area SO2 emissions per populated land area VOCs emissions per populated land area Coal consumption per populated land area
Reducing air pollution
Vehicles per populated land area Fertiliser consumption per hectare of arable land Pesticide use per hectare of crop land Industrial organic pollutants per available fresh water
Reducing water stress
Percentage of country's territory under severe water stress Percentage change in forest cover 1990-2000 Reducing ecosystem
stresses Percentage of county with acidification exceedence Ecological footprint per capita Reducing waste and
consumption pressures Radioactive waste Total fertility rate
Reducing stresses
Reducing population growth Percentage change in projected pop. between 2001
and 2050 Proportion of undernourished in total population Basic human sustenance Percent of pop. with access to improved drinking water supply Child death rate from respiratory diseases Death rate from intestinal infectious diseases
Reducing human vulnerability
Environmental health
Under-five mortality rate Technology achievement index Technology Innovation Index
Science and technology
Mean years of education IUCN member organisations per million population Civil and political liberties Democratic institutions
Capacity for debate
Percentage of ESI variables in publicly available data sets WEF survey questions on environmental governance Percentage of land area under protected status Number of sectoral EIA guidelines FSC accredited forest area as a percent of total forest area Control of corruption Price distortions (ratio of gasoline price to international average) Subsidies for energy or materials usage
Environmental governance
Subsidies to the commercial Fishing sector Number of ISO14001 certified companies per million US$ GDP Dow Jones Sustainability Group Index Average Innovest EcoValue rating of firms
Social and institutional capacity
Private sector responsiveness
World Business Council for Sustainable Development members
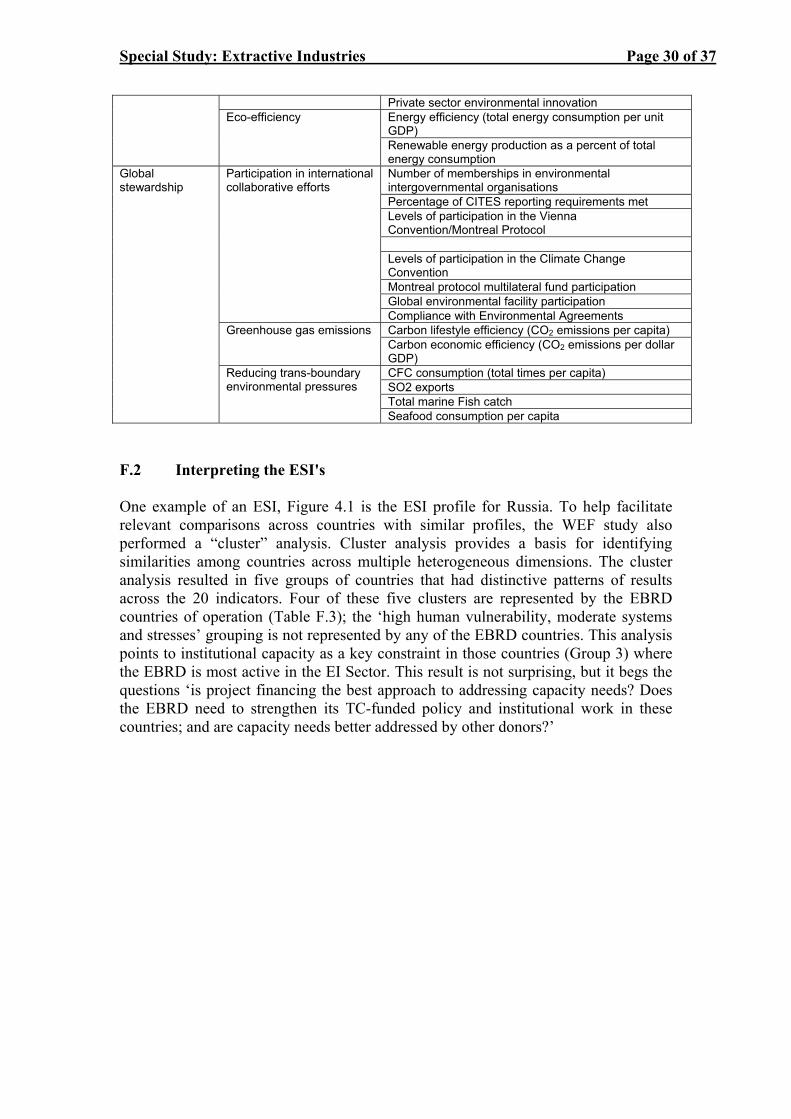
Special Study: Extractive Industries Page 30 of 37
Private sector environmental innovation Energy efficiency (total energy consumption per unit GDP)
Eco-efficiency
Renewable energy production as a percent of total energy consumption Number of memberships in environmental intergovernmental organisations Percentage of CITES reporting requirements met Levels of participation in the Vienna Convention/Montreal Protocol Levels of participation in the Climate Change Convention Montreal protocol multilateral fund participation Global environmental facility participation
Participation in international collaborative efforts
Compliance with Environmental Agreements Carbon lifestyle efficiency (CO2 emissions per capita) Greenhouse gas emissions Carbon economic efficiency (CO2 emissions per dollar GDP) CFC consumption (total times per capita) SO2 exports Total marine Fish catch
Global stewardship
Reducing trans-boundary environmental pressures
Seafood consumption per capita F.2 Interpreting the ESI's One example of an ESI, Figure 4.1 is the ESI profile for Russia. To help facilitate relevant comparisons across countries with similar profiles, the WEF study also performed a “cluster” analysis. Cluster analysis provides a basis for identifying similarities among countries across multiple heterogeneous dimensions. The cluster analysis resulted in five groups of countries that had distinctive patterns of results across the 20 indicators. Four of these five clusters are represented by the EBRD countries of operation (Table F.3); the ‘high human vulnerability, moderate systems and stresses’ grouping is not represented by any of the EBRD countries. This analysis points to institutional capacity as a key constraint in those countries (Group 3) where the EBRD is most active in the EI Sector. This result is not surprising, but it begs the questions ‘is project financing the best approach to addressing capacity needs? Does the EBRD need to strengthen its TC-funded policy and institutional work in these countries; and are capacity needs better addressed by other donors?’
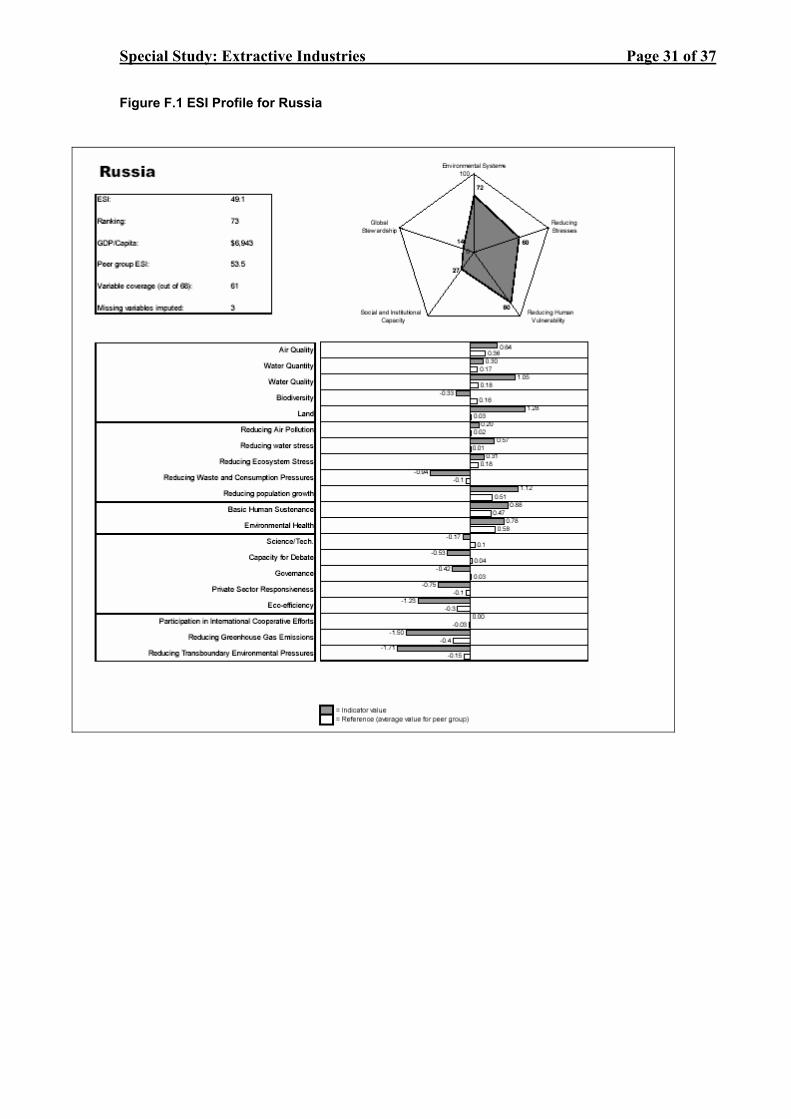
Special Study: Extractive Industries Page 31 of 37
Figure F.1 ESI Profile for Russia
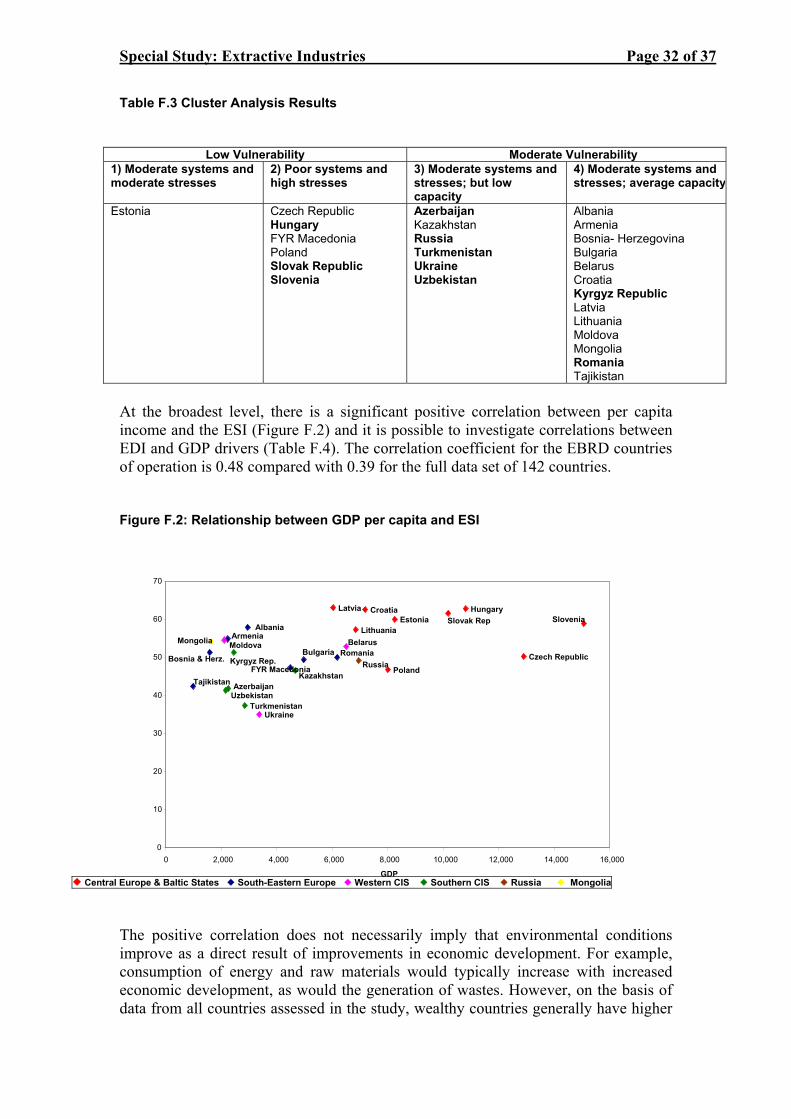
Special Study: Extractive Industries Page 32 of 37
Table F.3 Cluster Analysis Results
Low Vulnerability Moderate Vulnerability 1) Moderate systems and moderate stresses
2) Poor systems and high stresses
3) Moderate systems and stresses; but low capacity
4) Moderate systems and stresses; average capacity
Estonia
Czech Republic Hungary FYR Macedonia Poland Slovak Republic Slovenia
Azerbaijan Kazakhstan Russia Turkmenistan Ukraine Uzbekistan
Albania Armenia Bosnia- Herzegovina Bulgaria Belarus Croatia Kyrgyz Republic Latvia Lithuania Moldova Mongolia Romania Tajikistan
At the broadest level, there is a significant positive correlation between per capita income and the ESI (Figure F.2) and it is possible to investigate correlations between EDI and GDP drivers (Table F.4). The correlation coefficient for the EBRD countries of operation is 0.48 compared with 0.39 for the full data set of 142 countries. Figure F.2: Relationship between GDP per capita and ESI 70 Latvia HungaryCroatia
60 Slovenia Al ania Estonia Slovak Rep b
Armenia Lithuania
Central Europe & Baltic States South-Eastern Europe Western CIS Southern CIS Russia Mongolia
The positive correlation does not necessarily imply that environmental conditions improve as a direct result of improvements in economic development. For example, consumption of energy and raw materials would typically increase with increased economic development, as would the generation of wastes. However, on the basis of data from all countries assessed in the study, wealthy countries generally have higher
PolandTajikistan
Ukraine Turkmenistan Uzbekistan Azerbaijan Kyrgyz Rep. Bosnia & Herz.
Mongolia Moldova
FYR Macedo niaKazakhstan
BulgariaRussia
RomaniaBelarus
Czech Republic 50
40
30
20
10
0 0 4,000 14,000 16,000 2,000 6,000 8,000 10,000 12,000
GDP
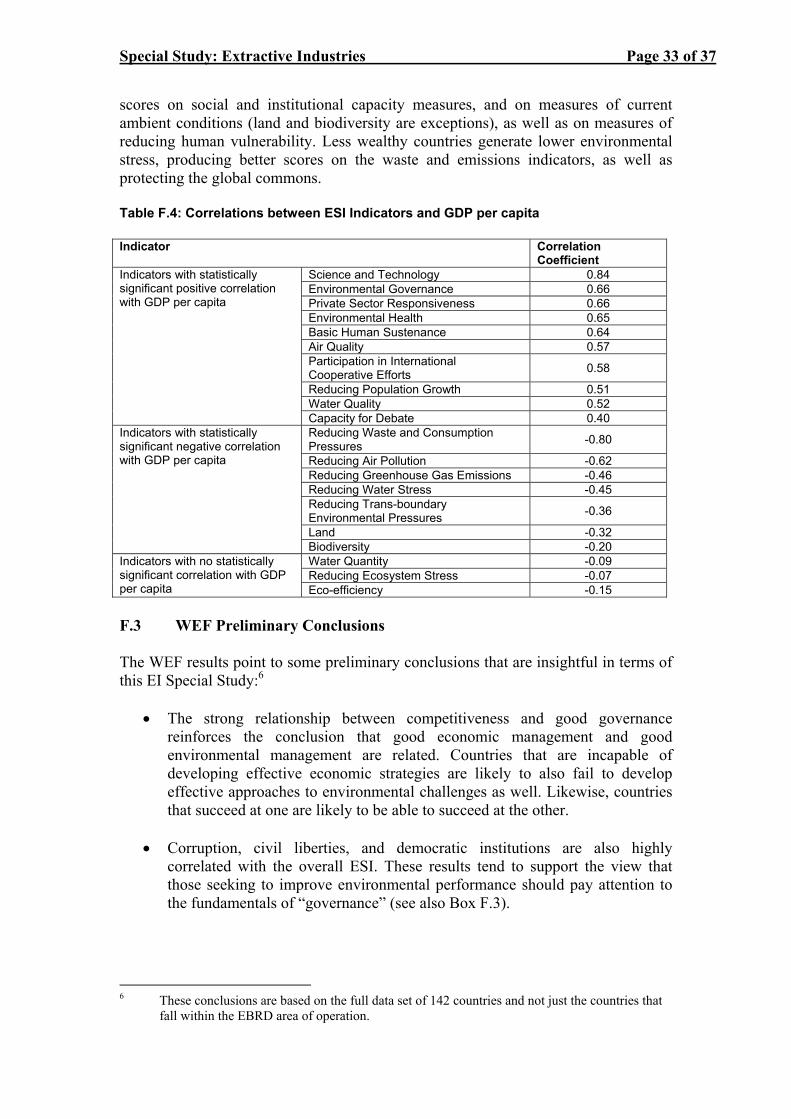
Special Study: Extractive Industries Page 33 of 37
scores on social and institutional capacity measures, and on measures of current ambient conditions (land and biodiversity are exceptions), as well as on measures of reducing human vulnerability. Less wealthy countries generate lower environmental stress, producing better scores on the waste and emissions indicators, as well as protecting the global commons. Table F.4: Correlations between ESI Indicators and GDP per capita Indicator Correlation
Coefficient Science and Technology 0.84 Environmental Governance 0.66 Private Sector Responsiveness 0.66 Environmental Health 0.65 Basic Human Sustenance 0.64 Air Quality 0.57 Participation in International Cooperative Efforts 0.58
Reducing Population Growth 0.51 Water Quality 0.52
Indicators with statistically significant positive correlation with GDP per capita
Capacity for Debate 0.40 Reducing Waste and Consumption Pressures -0.80
Reducing Air Pollution -0.62 Reducing Greenhouse Gas Emissions -0.46 Reducing Water Stress -0.45 Reducing Trans-boundary Environmental Pressures -0.36
Land -0.32
Indicators with statistically significant negative correlation with GDP per capita
Biodiversity -0.20 Water Quantity -0.09 Reducing Ecosystem Stress -0.07
Indicators with no statistically significant correlation with GDP per capita Eco-efficiency -0.15 F.3 WEF Preliminary Conclusions The WEF results point to some preliminary conclusions that are insightful in terms of this EI Special Study:6
• The strong relationship between competitiveness and good governance reinforces the conclusion that good economic management and good environmental management are related. Countries that are incapable of developing effective economic strategies are likely to also fail to develop effective approaches to environmental challenges as well. Likewise, countries that succeed at one are likely to be able to succeed at the other.
• Corruption, civil liberties, and democratic institutions are also highly
correlated with the overall ESI. These results tend to support the view that those seeking to improve environmental performance should pay attention to the fundamentals of “governance” (see also Box F.3).
6 These conclusions are based on the full data set of 142 countries and not just the countries that
fall within the EBRD area of operation.
Special Study: Extractive Industries Page 34 of 37
Box F.3: Environmental Performance Index (EPI) The WEF has also constructed a Pilot Environmental Performance Index (EPI). The EPI derives from a collection of data sets aggregated into four core indicators that gauge air and water quality, greenhouse gas emissions, and land protection. These indicators provide measures of both current performance and rates of change. The carefully targeted, results-oriented EPI provides a valuable counterpoint to the ESI, which covers a much broader range of conditions aimed at measuring long-term environmental prospects. The EPI enables benchmarking of progress towards meeting immediate policy objectives, facilitates judgments about environmental performance, and can be used to identify important differences in performance that may warrant intervention or investigation. The Pilot EPI study confirms the ESI data in respect of governance measures, in that they are better at predicting performance outcomes than per-capita income. Rule of law in particular (as measured by the World Bank’s Aggregated Governance Indicators project, for example), reveals a particularly strong correlation with environmental performance. Given data limitations, it is premature to demonstrate a causal relationship, but the preliminary findings seem to suggest that investments in improved governance may well lead to better environmental results. The impact of governance and other capacity measures is even more striking when the overall EPI is viewed. Per-capita income is correlated very loosely with the EPI (0.34), whereas the ESI’s Social and Institutional Capacity value is strongly correlated (0.71). This Capacity measure is comprised of five separate dimensions (science and technology, capacity for debate, environmental governance, private sector governance, and eco-efficiency). Among these, the one that has the strongest correlation to the EPI is Private Sector Responsiveness, which measures the degree to which the private sector is developing effective responses to environmental challenges through the following five variables: number of ISO 14001 certified companies per million US$ GDP, Dow Jones Sustainability Group Index, Average Innovest EcoValue rating of firms, World Business Council for Sustainable Development members, and private sector environmental innovation). This Private Sector Responsiveness indicator has a correlation coefficient of 0.72, thus indicating that environmental performance is strongly influenced by patterns of environmental governance, independently of levels of wealth. The WEF EPI data indicate that understanding the dynamics of environmental governance is enhanced by explicit consideration of the role of the private sector.
• The very high correlation between competitiveness and the ESI’s Private Sector Responsiveness indicator tends to corroborate the “Porter hypothesis”7 which suggests that firms that succeed in developing innovative responses to environmental challenges benefit both environmentally and economically. Of the 68 variables that make up the ESI, several of the private sector responsiveness measures are among the most highly correlated with the aggregate ESI. As a policy matter, this finding suggests that engaging the private sector in the response to environmental challenges is critical. This is a specific element of the EBRD’s current operations, and highlights the sustainable development benefits of this approach.
• Negative correlations between economic competitiveness and many of the
environmental stress indicators, as well as with the climate change indicators, suggest that, in spite of the overall positive relationship between the ESI and competitiveness, economic strength is not a “cure-all” for environmental ills. High pollution levels and rising greenhouse gas emissions are found in many strong economies, raising the spectre of future negative quality of life impacts.
7 Porter, M.E. "America's Green Strategy," Scientific American, April 1991:168. The Competitive Advantage of Nations, New York: Free Press, 1990.
Special Study: Extractive Industries Page 35 of 37
APPENDIX G: MANAGEMENT RESPONSE
Special Study: Extractive Industries Page 36 of 37
Management Response to PED Review of EBRD Extractive Industry Projects Background Through late 2003 and early 2004 PED compiled a report on a number of the Bank’s projects that directly and indirectly financed Extractive Industries. The Bank uses the term Extractive Industries or “EI” to describe upstream oil and gas production and mining projects. The study did not include transport or downstream (e.g., pipelines, oil tankers, refineries) projects.
Comments Management appreciate this important evaluation study on EBRD projects in extractive industries, which were financed by the Bank between 1993-2003. The overall Successful performance rating of the sector provided by PED demonstrates the Bank’s significant contribution to the transition process in this sector. Moving forward, the Bank will continue to improve further its track record in the sector.
In broad terms, Management welcome the key recommendations of the PED Report and will work with all stakeholders to consider implementing the recommendations:
1. The Bank should revisit its 1999 Natural Resources Operations Policy/Strategy The Bank is preparing a new, comprehensive and balanced Energy Policy and it is intended that upstream oil and gas and hydrocarbon transport operations, as well as the Bank’s approach to coal mining, will be incorporated as part of the new EBRD Energy Policy. See Annex 1 for an outline of the proposed consultation process on the Energy Policy.
2. Move from a “Compliance-Based” approach to an “Adding Value-Based” approach towards environmental performance. The new Environmental Policy (BDS03-034f) requires our projects to be in compliance with rigorous standards and also encompasses the idea of Adding Value. Environmental initiatives are often developed within, or in parallel to, the Bank’s EI projects. In line with the Mandate, the Bank will continue to move in this direction.
3. Promote GHG reductions and offsets (improved environmental and a business opportunity) As acknowledged in the PED report, the Bank is already very actively promoting GHG reductions within the context of its Mandate, both in standalone projects and as a part of environmental appraisal and action plans. The new Energy Policy shall review how the Bank can better promote GHG reductions and offsets.
4. The Bank Must Improve Internal Processes – Tracking and Monitoring.
Management accept the need for better monitoring and for incremental data collection and assessment. This recommendation will be considered during the regular review of the Bank’s internal processes, and in the internal discussions of the Bank’s Energy Policy.
Special Study: Extractive Industries Page 37 of 37
Annex 1
EBRD – PROCESS FOR THE NEW ENERGY POLICY The process for the preparation of a new Energy Policy for the EBRD will commence in September 2004 and should be completed in July 2005. The Policy will replace two existing policies; the Natural Resources Operations Policy (oil, gas, coal mining and mining of precious and non-precious metals) of March 1999, and the Energy Operations Policy (power generation, transmission and distribution, heat generation and distribution, gas distribution and utilisation of power, heat and gas including energy consumers as well as energy utilities) of May 2000. These policies can be accessed on the EBRD’s website at www.ebrd.com/about/strategy/index.htm. The indicative timetable is as follows:-
• September 2004 The Bank will invite comments on its website based on the soon to be published Extractive Industries Report prepared by the EBRD’s Project Evaluation Department, together with the “Management Response,” (www.ebrd.com/project/eval/index.htm) and the previous policies referred to above.
• October / December 2004 The Bank will consult with a range of stakeholders in informal sessions or electronically, including selected clients/potential clients in power and energy, energy efficiency, renewables, oil and gas, mining as well as selected energy and mining institutions and "think tanks" in the region and the oil/gas producers association; the EBRD’s Environmental Advisory Council and NGOs. With the involvement of independent Facilitators the Bank will consult NGOs in three locations (London, Moscow and Sofia) to seek a wide range of perspectives.
• January 2005 Taking into consideration the comments received during the initial consultation period, the Bank will prepare the draft Energy Policy.
• March 2005 The Bank will publish on its website the draft Energy Policy for 45 calendar days during which time the public will be invited to send comments to the Bank.
• July 2005 After the consultation period, the Bank will respond to the comments and finalise the new draft Energy Policy for consideration by the Board of Directors. The final Policy document and the summary of comments and staff responses will be posted on the Bank’s website in accordance with the Public Information Policy. In addition, the summary will be e-mailed to participants in the consultation process for their information.