Embed Size (px)
Citation preview
Earth Planets Space, 63, 903–913, 2011
Extraction of lineaments from gravity anomaly maps using the gradientcalculation: Application to Central Anatolia
D. Aydogan
Istanbul University, Engineering Faculty, Department of Geophysics, 34320, Avcilar, Istanbul, Turkey
(Received December 3, 2007; Revised April 7, 2011; Accepted April 9, 2011; Online published December 29, 2011)
Linear anomalies are important in the interpretation of gravity and magnetic data because they indicate someimportant structural features. In this study, a method is proposed to extract lineaments which may be difficult torecognize. It is based on the convolution between the templates obtained from the second horizontal derivativeof the theoretical anomaly due to a truncated horizontal plate and the gravity anomaly. Local maxima of thegradient magnitude determine lineaments in a gravity anomaly map. The method is used in the edge detectionof geological structures closer to the surface, which are masked by other structures with various depths anddimensions. A source code in Matlab format for the proposed algorithm is implemented. Firstly, it was tested onsynthetic examples and satisfactory results were obtained. Secondly, it was tested on gravity-anomaly maps ofthe Tuzgolu (Salt Lake) basin in Central Anatolia, Turkey. Subsequently, the proposed algorithm and normalizedstandard deviation (NSTD), another edge-detection filter, were evaluated together to obtain the horizontal locationof potential-field source boundaries. A visual evaluation of the outputs was carried out and the results comparedwith each other. These examples demonstrate that the proposed method can be used in the visual interpretationof gravity-anomaly maps in order to detect geological features such as major and minor faults.Key words: Gravity anomaly, horizontal gradients, template, lineaments, Tuzgolu basin, Central Anatolia,Turkey.
1. IntroductionOne of the most common problems encountered in geo-
physical studies is how to determine the geometry of faults,or contacts, at different depths. Gravity is an effective geo-physical method, for determining vertical geological fea-tures. These vertical discontinuities, which might corre-spond to subsurface faults and contacts, appear on gravityand magnetic maps as lineaments. Numerous techniquesexist in geophysics to analyze gravity anomalies producedby faults or the boundary of two geologic zones. Majorfaults which can be defined as first-order faults can be in-ferred from gradient zones on gravity-anomaly maps (Zenget al., 1994). But, it is generally difficult to recognize sec-ondary faults which may be masked due to larger structures.
Edge-detection algorithms are suitable for the analysis ofpotential-field data. These are used in the visual interpreta-tion of both gravity, and magnetic, maps in order to detectmain geological structures. Lineaments in gravity and mag-netic maps are used to identify areas of high priority for fur-ther detailed exploration. The Radon transform is a usefulmethod for analyzing lineaments in a 2-D map. Pawlowski(1997) has shown the applicability of the Radon transformin displaying linear features in magnetic maps. Yunxuan(1992) applied the Radon transform to synthetic gravitymaps in order to demonstrate its usefulness for upward and
Copyright c© The Society of Geomagnetism and Earth, Planetary and Space Sci-ences (SGEPSS); The Seismological Society of Japan; The Volcanological Societyof Japan; The Geodetic Society of Japan; The Japanese Society for Planetary Sci-ences; TERRAPUB.
doi:10.5047/eps.2011.04.003
downward continuation to remove unwanted linear features.Sykes and Das (2000) used the Radon transform to en-hance linear features in geophysical maps. Boschetti (2005)has proposed different edge-detection algorithms based onthe use of horizontal or vertical gradients of potential-fieldanomalies. Aydogan (2007) interpreted lineaments of theBouguer anomaly map of Biga, and its surrounding area,by using a cellular neural network algorithm that is used forimage processing. Several edge-detection algorithms canbe found in the literature, all of which are based on imagegradients. These gradients are calculated from the image it-self, rather than measured. Edge detection neither generatesnew information, nor extracts information from geophysi-cal maps. It only transforms such information (Boschetti,2005). Via edge detection, the information which is con-tained within the entire image pixel set is displayed in aform that helps the user to focus on the main features of amap and to interpret them in terms of geological structures(Hornby et al., 1999).
Works on edge detection have been adopted by vari-ous authors (Blakely and Simpson, 1986; McGrath, 1991;Mallat and Zhong, 1992; Moreau et al., 1997; Boschetti etal., 2001; Trompat et al., 2003; Cooper and Cowan, 2006).Several authors have developed various methods based onthe use of horizontal, or vertical, gradients of potential-fieldanomalies (Rao et al., 1981; Grauch and Cordell, 1987;Reid et al., 1990; Marcotte et al., 1992; Roest et al., 1992;Zeng et al., 1994; Hsu et al., 1996; Fedi and Florio, 2001).
Since potential-field data correspond to the superpositionof effects from all causative sources, the determination of
903
904 D. AYDOGAN: EXTRACTION OF LINEAMENTS USING A GRADIENT METHOD
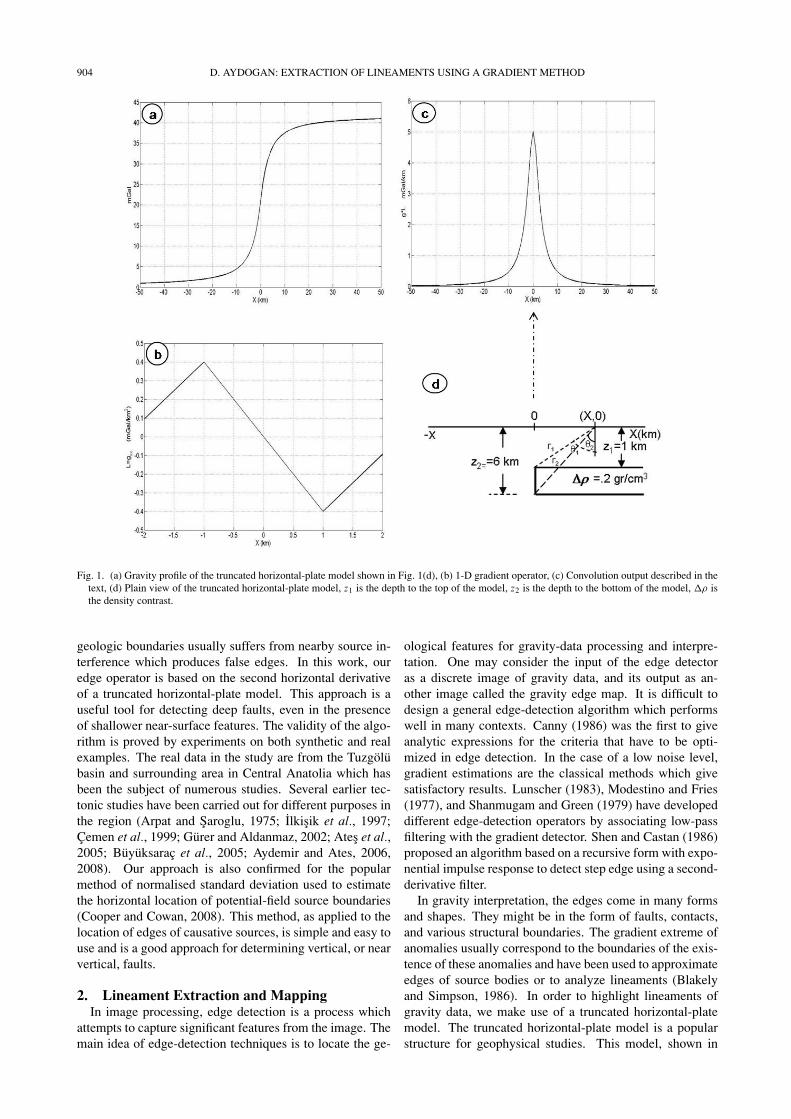
Fig. 1. (a) Gravity profile of the truncated horizontal-plate model shown in Fig. 1(d), (b) 1-D gradient operator, (c) Convolution output described in thetext, (d) Plain view of the truncated horizontal-plate model, z1 is the depth to the top of the model, z2 is the depth to the bottom of the model, �ρ isthe density contrast.
geologic boundaries usually suffers from nearby source in-terference which produces false edges. In this work, ouredge operator is based on the second horizontal derivativeof a truncated horizontal-plate model. This approach is auseful tool for detecting deep faults, even in the presenceof shallower near-surface features. The validity of the algo-rithm is proved by experiments on both synthetic and realexamples. The real data in the study are from the Tuzgolubasin and surrounding area in Central Anatolia which hasbeen the subject of numerous studies. Several earlier tec-tonic studies have been carried out for different purposes inthe region (Arpat and Saroglu, 1975; Ilkisik et al., 1997;Cemen et al., 1999; Gurer and Aldanmaz, 2002; Ates et al.,2005; Buyuksarac et al., 2005; Aydemir and Ates, 2006,2008). Our approach is also confirmed for the popularmethod of normalised standard deviation used to estimatethe horizontal location of potential-field source boundaries(Cooper and Cowan, 2008). This method, as applied to thelocation of edges of causative sources, is simple and easy touse and is a good approach for determining vertical, or nearvertical, faults.
2. Lineament Extraction and MappingIn image processing, edge detection is a process which
attempts to capture significant features from the image. Themain idea of edge-detection techniques is to locate the ge-
ological features for gravity-data processing and interpre-tation. One may consider the input of the edge detectoras a discrete image of gravity data, and its output as an-other image called the gravity edge map. It is difficult todesign a general edge-detection algorithm which performswell in many contexts. Canny (1986) was the first to giveanalytic expressions for the criteria that have to be opti-mized in edge detection. In the case of a low noise level,gradient estimations are the classical methods which givesatisfactory results. Lunscher (1983), Modestino and Fries(1977), and Shanmugam and Green (1979) have developeddifferent edge-detection operators by associating low-passfiltering with the gradient detector. Shen and Castan (1986)proposed an algorithm based on a recursive form with expo-nential impulse response to detect step edge using a second-derivative filter.
In gravity interpretation, the edges come in many formsand shapes. They might be in the form of faults, contacts,and various structural boundaries. The gradient extreme ofanomalies usually correspond to the boundaries of the exis-tence of these anomalies and have been used to approximateedges of source bodies or to analyze lineaments (Blakelyand Simpson, 1986). In order to highlight lineaments ofgravity data, we make use of a truncated horizontal-platemodel. The truncated horizontal-plate model is a popularstructure for geophysical studies. This model, shown in

D. AYDOGAN: EXTRACTION OF LINEAMENTS USING A GRADIENT METHOD 905
xz cross-section in Fig. 1(d), semi-infinite in the positivex-axis direction, is bounded by upper and lower horizontalplanes z1 and z2. Assuming uniform density distributions inthe model and the surrounding medium, the gravity effect,and the first and second horizontal derivatives, are given by,respectively,
g = 2k�ρ
{x log
r2
r1+z2
(π
2+θ2
)−z1
(π
2+θ1
)}, (1)
gx = 2k�ρ
{log
r2
r1
}, (2)
gxx = 2k�ρ
{x
r22
− x
r21
}, (3)
(Telford et al., 1976). Where k is the gravitational constant,and �ρ is the density contrast between the model and thesurrounding medium,
Many filters are available to enhance subtle detail inpotential-field data, such as downward continuation, hor-izontal and vertical derivatives, and other forms of high-pass filters. A commonly-used edge-detection filter is thetotal horizontal derivative (Cooper and Cowan, 2008). Itcan be used to enhance certain features, smooth out noiseor highlight previously-known shape in potential-field data.The horizontal gradients can be estimated from the convolu-tion kernels (referred to as gradient operator, edge detector,mask operator and template). The two-dimensional cross-correlation is a simple and robust algorithm used to solvedifferent problems in the field of image processing. In thespace domain, if L is the gradient operator (n × m) andg(x, y) is the potential-field data (M×N ), cross-correlationof L with g is written as
L ◦ g(x, y) =n−1∑i=0
m−1∑j=0
L(i, j)g(x + i, y + j), (4)
where the circle denotes cross-correlation. The mathemati-cal definition of discrete convolution is written as
L ∗ g(x, y) =n−1∑i=0
m−1∑j=0
L(i, j)g(x − i, y − j), (5)
where the asterisk denotes convolution. Equations (4) and(5) are identical when the gradient operator is symmetric.The key difference between the two is that convolution isassociative. However, in the frequency domain we canexpress it as a multiplication of the Fourier transforms ofthe given functions.
The first step in image processing is the estimation ofthe derivatives in the x- and y-directions in order to smooththe image. In the time domain, this process is carried outthrough the convolution of the 2-D Gaussian function andthe image using the following equations.
fx = ∂
∂x(G ∗ I ), (6a)
fy = ∂
∂y(G ∗ I ). (6b)
Here, I is the image, G is the 2-D Gaussian function, fx
and fy are the derivatives in the x- and y-directions, respec-
tively. These expressions are not so effective in gradient cal-culations. Using the properties of the convolution processin a more effective way is given below (Canny, 1986);
fx = ∂
∂x(G ∗ I ) = ∂
∂x(G) ∗ I, (7a)
fy = ∂
∂y(G ∗ I ) = ∂
∂y(G) ∗ I (7b)
The magnitude of the gradient is given by
M =√
f 2x + f 2
y . (8)
In this study, the first horizontal derivative of the trun-cated horizontal-plate model equation (Eq. (2)) was usedto smooth the gravity data. Here, g is the gravity data,gx and gy are the first horizontal derivatives in the x- andy-directions which can be estimated from the Eqs. (9) and(10).
fx = ∂
∂x(gx ∗ g) = ∂
∂x(gx ) ∗ g = Lx ∗ g, (9)
fy = ∂
∂y(gy ∗ g) = ∂
∂y(gy) ∗ g = L y ∗ g. (10)
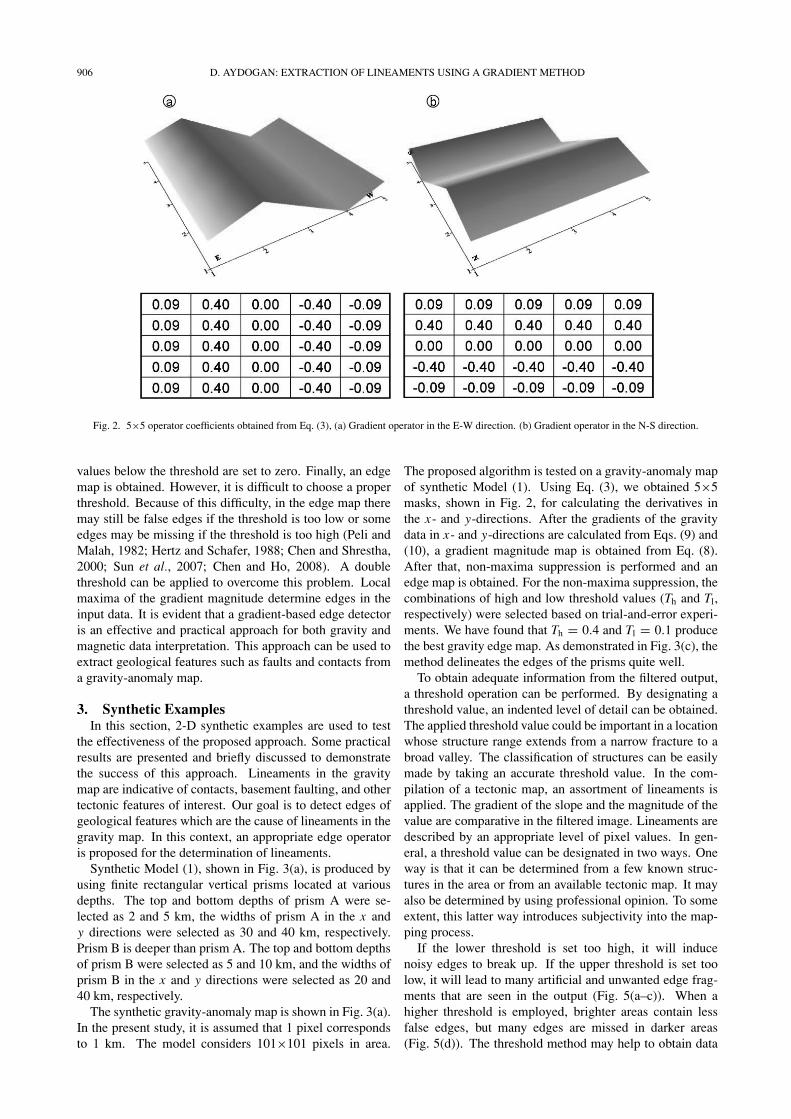
Here, Lx and L y are the mask operators in the x- and y-directions derived from Eq. (3), respectively. Also, we haveused the second horizontal derivative expression (Eq. (3))in order to estimate the coefficients of the mask operators.These are shown in Fig. 2.
The edge can be identified by the closed maximum ofconvolution between these kernels and the gravity data. Forthe 1-D example, gravity-anomaly (Fig. 1(a)) and edge-operator coefficients (Fig. 1(b)) have been computed alongthe profile using Eqs. (1) and (3). Figure 1(c) displays theconvolution output. As shown in Fig. 1(c), the maximumamplitude of the convolution output delineates the edge ofthis model quite well.
The edge-detection process can be considered as a pixelclassification process by the determination of some pixelas a boundary. It can be determined whether the pixel is aboundary pixel, or not, by taking into account the pixels andits neighboring values for each pixel in a digitized image.
In the image process, a threshold value is generally ap-plied to gradient magnitude values in order to determinelineaments of an image. The threshold value is the mostsignificant parameter that is used in the stage of determin-ing edges from a filtered image. A number of studies inthe literature are available for selecting the threshold valuein image processing problems: some of which are Prewittand Mendelsohn (1966), Otsu (1979), Pun (1980) and Tsai(1985).
After gravity data are transformed into the gradient do-main, a threshold can be given, and the gradient magnitudewhose corresponding gradient values are greater than thethreshold can then be obtained. These maxima indicate thestrike of lineaments. This is the lineaments identificationprocedure. Enhancement, or attenuation, of certain linea-ments can be realized through non-maximum suppression.The edge map is obtained by taking the gradient of the in-put data and limiting it to an available threshold value. All
906 D. AYDOGAN: EXTRACTION OF LINEAMENTS USING A GRADIENT METHOD
Fig. 2. 5×5 operator coefficients obtained from Eq. (3), (a) Gradient operator in the E-W direction. (b) Gradient operator in the N-S direction.
values below the threshold are set to zero. Finally, an edgemap is obtained. However, it is difficult to choose a properthreshold. Because of this difficulty, in the edge map theremay still be false edges if the threshold is too low or someedges may be missing if the threshold is too high (Peli andMalah, 1982; Hertz and Schafer, 1988; Chen and Shrestha,2000; Sun et al., 2007; Chen and Ho, 2008). A doublethreshold can be applied to overcome this problem. Localmaxima of the gradient magnitude determine edges in theinput data. It is evident that a gradient-based edge detectoris an effective and practical approach for both gravity andmagnetic data interpretation. This approach can be used toextract geological features such as faults and contacts froma gravity-anomaly map.
3. Synthetic ExamplesIn this section, 2-D synthetic examples are used to test
the effectiveness of the proposed approach. Some practicalresults are presented and briefly discussed to demonstratethe success of this approach. Lineaments in the gravitymap are indicative of contacts, basement faulting, and othertectonic features of interest. Our goal is to detect edges ofgeological features which are the cause of lineaments in thegravity map. In this context, an appropriate edge operatoris proposed for the determination of lineaments.
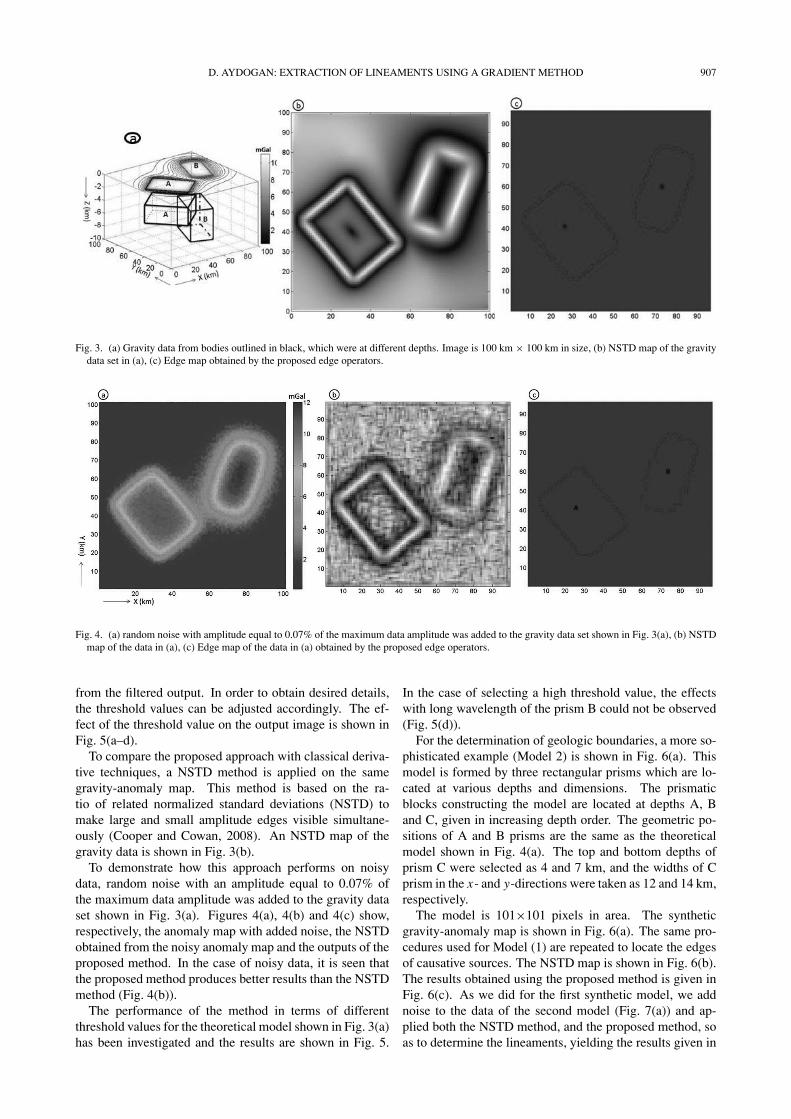
Synthetic Model (1), shown in Fig. 3(a), is produced byusing finite rectangular vertical prisms located at variousdepths. The top and bottom depths of prism A were se-lected as 2 and 5 km, the widths of prism A in the x andy directions were selected as 30 and 40 km, respectively.Prism B is deeper than prism A. The top and bottom depthsof prism B were selected as 5 and 10 km, and the widths ofprism B in the x and y directions were selected as 20 and40 km, respectively.
The synthetic gravity-anomaly map is shown in Fig. 3(a).In the present study, it is assumed that 1 pixel correspondsto 1 km. The model considers 101×101 pixels in area.
The proposed algorithm is tested on a gravity-anomaly mapof synthetic Model (1). Using Eq. (3), we obtained 5×5masks, shown in Fig. 2, for calculating the derivatives inthe x- and y-directions. After the gradients of the gravitydata in x- and y-directions are calculated from Eqs. (9) and(10), a gradient magnitude map is obtained from Eq. (8).After that, non-maxima suppression is performed and anedge map is obtained. For the non-maxima suppression, thecombinations of high and low threshold values (Th and Tl,respectively) were selected based on trial-and-error experi-ments. We have found that Th = 0.4 and Tl = 0.1 producethe best gravity edge map. As demonstrated in Fig. 3(c), themethod delineates the edges of the prisms quite well.
To obtain adequate information from the filtered output,a threshold operation can be performed. By designating athreshold value, an indented level of detail can be obtained.The applied threshold value could be important in a locationwhose structure range extends from a narrow fracture to abroad valley. The classification of structures can be easilymade by taking an accurate threshold value. In the com-pilation of a tectonic map, an assortment of lineaments isapplied. The gradient of the slope and the magnitude of thevalue are comparative in the filtered image. Lineaments aredescribed by an appropriate level of pixel values. In gen-eral, a threshold value can be designated in two ways. Oneway is that it can be determined from a few known struc-tures in the area or from an available tectonic map. It mayalso be determined by using professional opinion. To someextent, this latter way introduces subjectivity into the map-ping process.
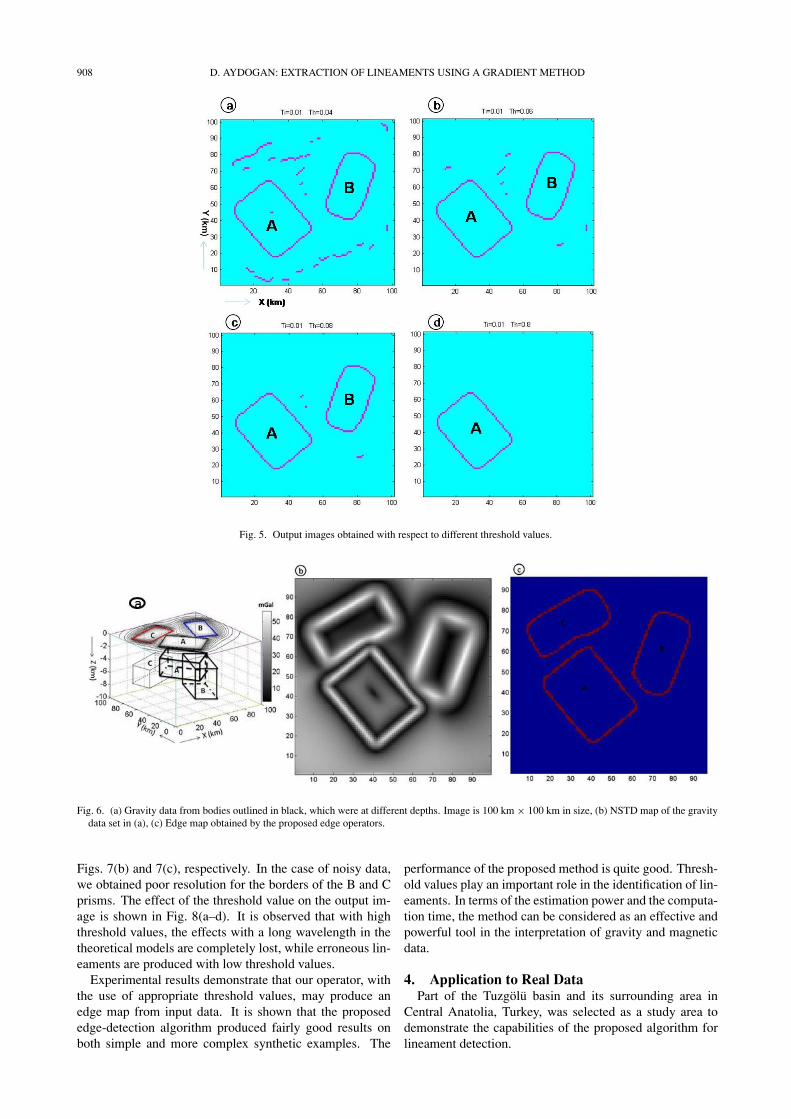
If the lower threshold is set too high, it will inducenoisy edges to break up. If the upper threshold is set toolow, it will lead to many artificial and unwanted edge frag-ments that are seen in the output (Fig. 5(a–c)). When ahigher threshold is employed, brighter areas contain lessfalse edges, but many edges are missed in darker areas(Fig. 5(d)). The threshold method may help to obtain data
D. AYDOGAN: EXTRACTION OF LINEAMENTS USING A GRADIENT METHOD 907
Fig. 3. (a) Gravity data from bodies outlined in black, which were at different depths. Image is 100 km × 100 km in size, (b) NSTD map of the gravitydata set in (a), (c) Edge map obtained by the proposed edge operators.
Fig. 4. (a) random noise with amplitude equal to 0.07% of the maximum data amplitude was added to the gravity data set shown in Fig. 3(a), (b) NSTDmap of the data in (a), (c) Edge map of the data in (a) obtained by the proposed edge operators.
from the filtered output. In order to obtain desired details,the threshold values can be adjusted accordingly. The ef-fect of the threshold value on the output image is shown inFig. 5(a–d).
To compare the proposed approach with classical deriva-tive techniques, a NSTD method is applied on the samegravity-anomaly map. This method is based on the ra-tio of related normalized standard deviations (NSTD) tomake large and small amplitude edges visible simultane-ously (Cooper and Cowan, 2008). An NSTD map of thegravity data is shown in Fig. 3(b).
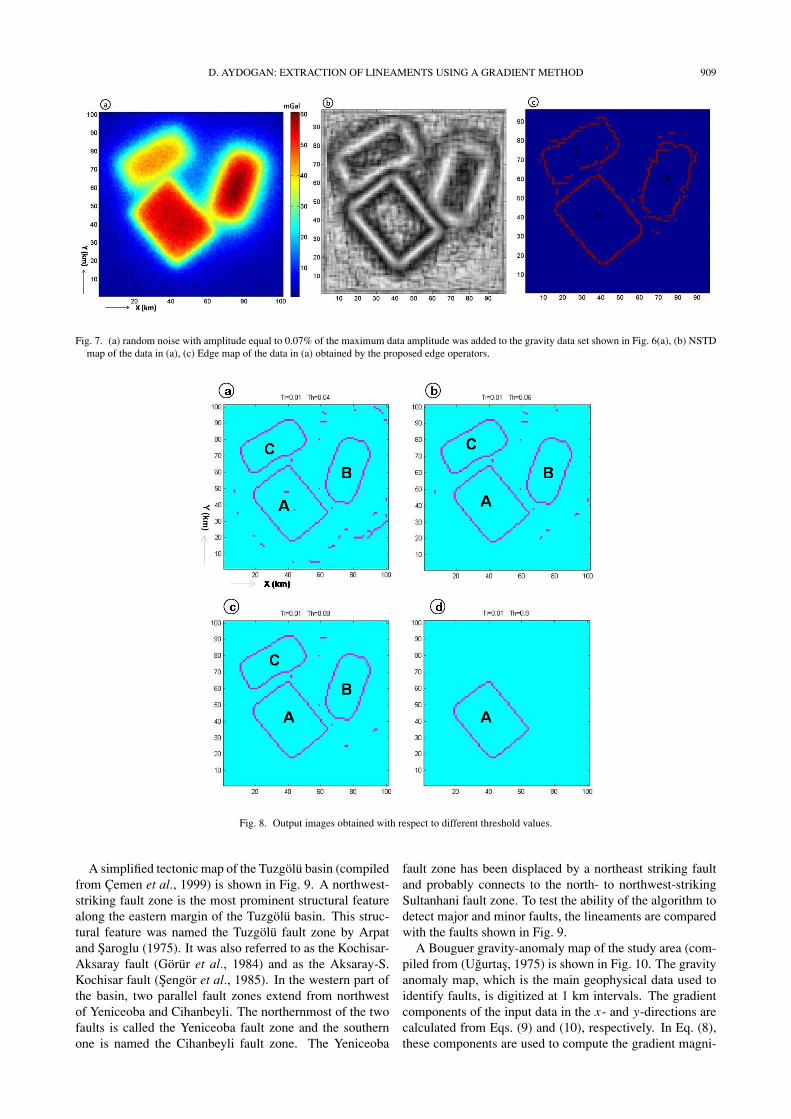
To demonstrate how this approach performs on noisydata, random noise with an amplitude equal to 0.07% ofthe maximum data amplitude was added to the gravity dataset shown in Fig. 3(a). Figures 4(a), 4(b) and 4(c) show,respectively, the anomaly map with added noise, the NSTDobtained from the noisy anomaly map and the outputs of theproposed method. In the case of noisy data, it is seen thatthe proposed method produces better results than the NSTDmethod (Fig. 4(b)).
The performance of the method in terms of differentthreshold values for the theoretical model shown in Fig. 3(a)has been investigated and the results are shown in Fig. 5.
In the case of selecting a high threshold value, the effectswith long wavelength of the prism B could not be observed(Fig. 5(d)).
For the determination of geologic boundaries, a more so-phisticated example (Model 2) is shown in Fig. 6(a). Thismodel is formed by three rectangular prisms which are lo-cated at various depths and dimensions. The prismaticblocks constructing the model are located at depths A, Band C, given in increasing depth order. The geometric po-sitions of A and B prisms are the same as the theoreticalmodel shown in Fig. 4(a). The top and bottom depths ofprism C were selected as 4 and 7 km, and the widths of Cprism in the x- and y-directions were taken as 12 and 14 km,respectively.
The model is 101×101 pixels in area. The syntheticgravity-anomaly map is shown in Fig. 6(a). The same pro-cedures used for Model (1) are repeated to locate the edgesof causative sources. The NSTD map is shown in Fig. 6(b).The results obtained using the proposed method is given inFig. 6(c). As we did for the first synthetic model, we addnoise to the data of the second model (Fig. 7(a)) and ap-plied both the NSTD method, and the proposed method, soas to determine the lineaments, yielding the results given in
908 D. AYDOGAN: EXTRACTION OF LINEAMENTS USING A GRADIENT METHOD
Fig. 5. Output images obtained with respect to different threshold values.
Fig. 6. (a) Gravity data from bodies outlined in black, which were at different depths. Image is 100 km × 100 km in size, (b) NSTD map of the gravitydata set in (a), (c) Edge map obtained by the proposed edge operators.
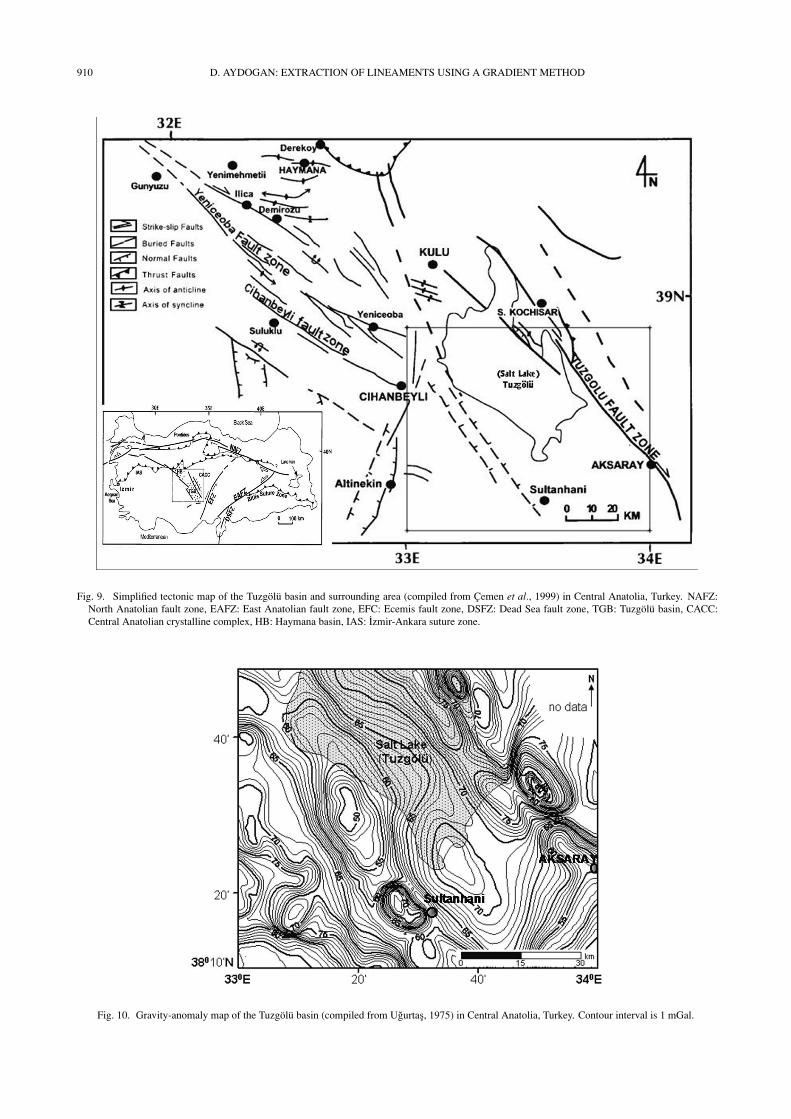
Figs. 7(b) and 7(c), respectively. In the case of noisy data,we obtained poor resolution for the borders of the B and Cprisms. The effect of the threshold value on the output im-age is shown in Fig. 8(a–d). It is observed that with highthreshold values, the effects with a long wavelength in thetheoretical models are completely lost, while erroneous lin-eaments are produced with low threshold values.
Experimental results demonstrate that our operator, withthe use of appropriate threshold values, may produce anedge map from input data. It is shown that the proposededge-detection algorithm produced fairly good results onboth simple and more complex synthetic examples. The
performance of the proposed method is quite good. Thresh-old values play an important role in the identification of lin-eaments. In terms of the estimation power and the computa-tion time, the method can be considered as an effective andpowerful tool in the interpretation of gravity and magneticdata.
4. Application to Real DataPart of the Tuzgolu basin and its surrounding area in
Central Anatolia, Turkey, was selected as a study area todemonstrate the capabilities of the proposed algorithm forlineament detection.
D. AYDOGAN: EXTRACTION OF LINEAMENTS USING A GRADIENT METHOD 909
Fig. 7. (a) random noise with amplitude equal to 0.07% of the maximum data amplitude was added to the gravity data set shown in Fig. 6(a), (b) NSTDmap of the data in (a), (c) Edge map of the data in (a) obtained by the proposed edge operators.
Fig. 8. Output images obtained with respect to different threshold values.
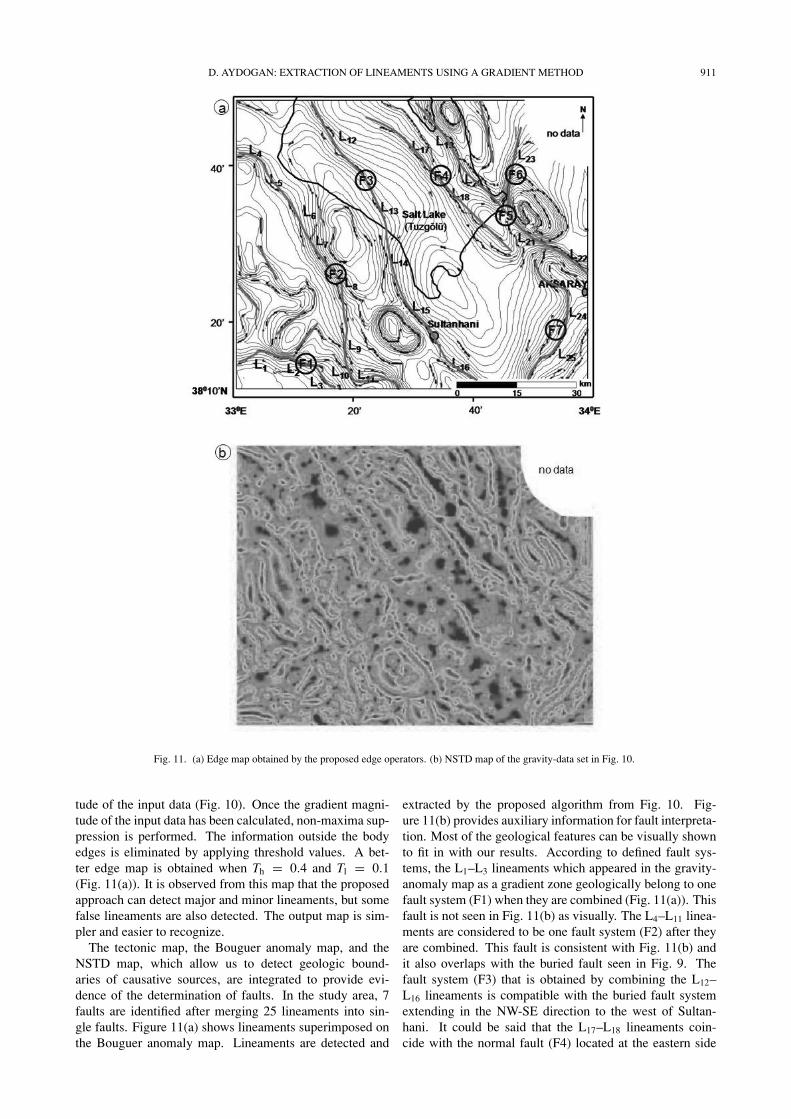
A simplified tectonic map of the Tuzgolu basin (compiledfrom Cemen et al., 1999) is shown in Fig. 9. A northwest-striking fault zone is the most prominent structural featurealong the eastern margin of the Tuzgolu basin. This struc-tural feature was named the Tuzgolu fault zone by Arpatand Saroglu (1975). It was also referred to as the Kochisar-Aksaray fault (Gorur et al., 1984) and as the Aksaray-S.Kochisar fault (Sengor et al., 1985). In the western part ofthe basin, two parallel fault zones extend from northwestof Yeniceoba and Cihanbeyli. The northernmost of the twofaults is called the Yeniceoba fault zone and the southernone is named the Cihanbeyli fault zone. The Yeniceoba
fault zone has been displaced by a northeast striking faultand probably connects to the north- to northwest-strikingSultanhani fault zone. To test the ability of the algorithm todetect major and minor faults, the lineaments are comparedwith the faults shown in Fig. 9.
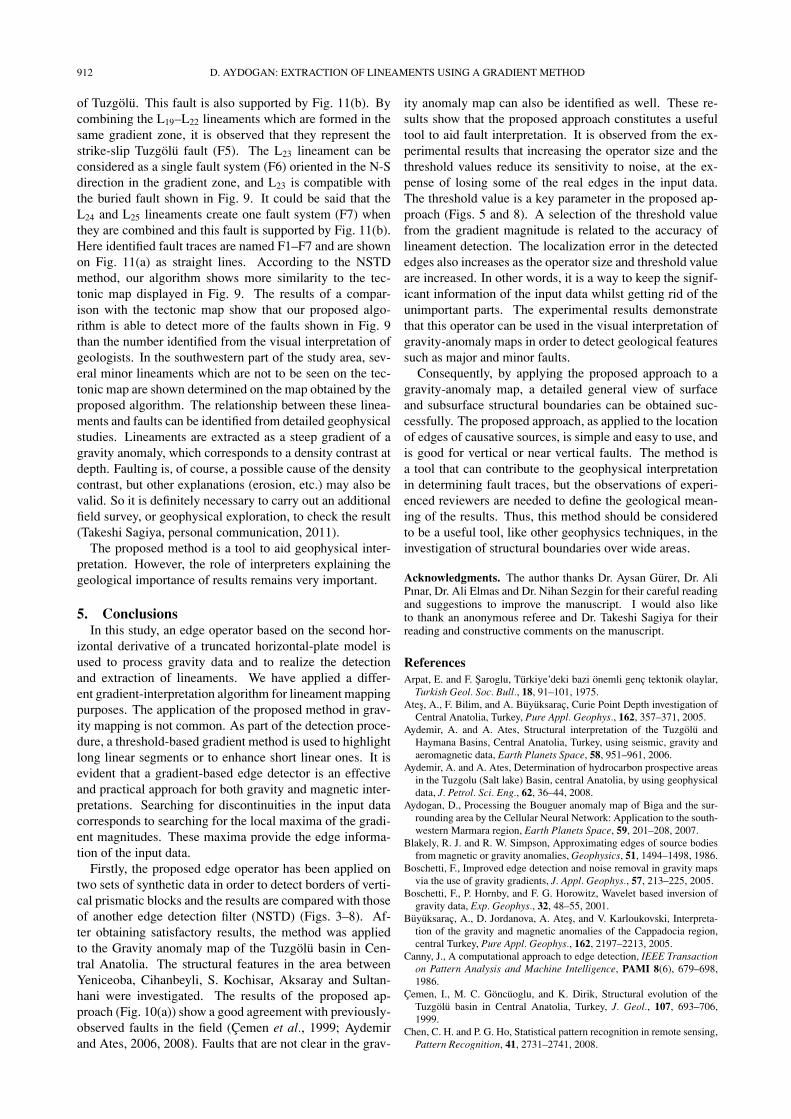
A Bouguer gravity-anomaly map of the study area (com-piled from (Ugurtas, 1975) is shown in Fig. 10. The gravityanomaly map, which is the main geophysical data used toidentify faults, is digitized at 1 km intervals. The gradientcomponents of the input data in the x- and y-directions arecalculated from Eqs. (9) and (10), respectively. In Eq. (8),these components are used to compute the gradient magni-
910 D. AYDOGAN: EXTRACTION OF LINEAMENTS USING A GRADIENT METHOD
Fig. 9. Simplified tectonic map of the Tuzgolu basin and surrounding area (compiled from Cemen et al., 1999) in Central Anatolia, Turkey. NAFZ:North Anatolian fault zone, EAFZ: East Anatolian fault zone, EFC: Ecemis fault zone, DSFZ: Dead Sea fault zone, TGB: Tuzgolu basin, CACC:Central Anatolian crystalline complex, HB: Haymana basin, IAS: Izmir-Ankara suture zone.
Fig. 10. Gravity-anomaly map of the Tuzgolu basin (compiled from Ugurtas, 1975) in Central Anatolia, Turkey. Contour interval is 1 mGal.
D. AYDOGAN: EXTRACTION OF LINEAMENTS USING A GRADIENT METHOD 911
Fig. 11. (a) Edge map obtained by the proposed edge operators. (b) NSTD map of the gravity-data set in Fig. 10.
tude of the input data (Fig. 10). Once the gradient magni-tude of the input data has been calculated, non-maxima sup-pression is performed. The information outside the bodyedges is eliminated by applying threshold values. A bet-ter edge map is obtained when Th = 0.4 and Tl = 0.1(Fig. 11(a)). It is observed from this map that the proposedapproach can detect major and minor lineaments, but somefalse lineaments are also detected. The output map is sim-pler and easier to recognize.
The tectonic map, the Bouguer anomaly map, and theNSTD map, which allow us to detect geologic bound-aries of causative sources, are integrated to provide evi-dence of the determination of faults. In the study area, 7faults are identified after merging 25 lineaments into sin-gle faults. Figure 11(a) shows lineaments superimposed onthe Bouguer anomaly map. Lineaments are detected and
extracted by the proposed algorithm from Fig. 10. Fig-ure 11(b) provides auxiliary information for fault interpreta-tion. Most of the geological features can be visually shownto fit in with our results. According to defined fault sys-tems, the L1–L3 lineaments which appeared in the gravity-anomaly map as a gradient zone geologically belong to onefault system (F1) when they are combined (Fig. 11(a)). Thisfault is not seen in Fig. 11(b) as visually. The L4–L11 linea-ments are considered to be one fault system (F2) after theyare combined. This fault is consistent with Fig. 11(b) andit also overlaps with the buried fault seen in Fig. 9. Thefault system (F3) that is obtained by combining the L12–L16 lineaments is compatible with the buried fault systemextending in the NW-SE direction to the west of Sultan-hani. It could be said that the L17–L18 lineaments coin-cide with the normal fault (F4) located at the eastern side
912 D. AYDOGAN: EXTRACTION OF LINEAMENTS USING A GRADIENT METHOD
of Tuzgolu. This fault is also supported by Fig. 11(b). Bycombining the L19–L22 lineaments which are formed in thesame gradient zone, it is observed that they represent thestrike-slip Tuzgolu fault (F5). The L23 lineament can beconsidered as a single fault system (F6) oriented in the N-Sdirection in the gradient zone, and L23 is compatible withthe buried fault shown in Fig. 9. It could be said that theL24 and L25 lineaments create one fault system (F7) whenthey are combined and this fault is supported by Fig. 11(b).Here identified fault traces are named F1–F7 and are shownon Fig. 11(a) as straight lines. According to the NSTDmethod, our algorithm shows more similarity to the tec-tonic map displayed in Fig. 9. The results of a compar-ison with the tectonic map show that our proposed algo-rithm is able to detect more of the faults shown in Fig. 9than the number identified from the visual interpretation ofgeologists. In the southwestern part of the study area, sev-eral minor lineaments which are not to be seen on the tec-tonic map are shown determined on the map obtained by theproposed algorithm. The relationship between these linea-ments and faults can be identified from detailed geophysicalstudies. Lineaments are extracted as a steep gradient of agravity anomaly, which corresponds to a density contrast atdepth. Faulting is, of course, a possible cause of the densitycontrast, but other explanations (erosion, etc.) may also bevalid. So it is definitely necessary to carry out an additionalfield survey, or geophysical exploration, to check the result(Takeshi Sagiya, personal communication, 2011).
The proposed method is a tool to aid geophysical inter-pretation. However, the role of interpreters explaining thegeological importance of results remains very important.
5. ConclusionsIn this study, an edge operator based on the second hor-
izontal derivative of a truncated horizontal-plate model isused to process gravity data and to realize the detectionand extraction of lineaments. We have applied a differ-ent gradient-interpretation algorithm for lineament mappingpurposes. The application of the proposed method in grav-ity mapping is not common. As part of the detection proce-dure, a threshold-based gradient method is used to highlightlong linear segments or to enhance short linear ones. It isevident that a gradient-based edge detector is an effectiveand practical approach for both gravity and magnetic inter-pretations. Searching for discontinuities in the input datacorresponds to searching for the local maxima of the gradi-ent magnitudes. These maxima provide the edge informa-tion of the input data.
Firstly, the proposed edge operator has been applied ontwo sets of synthetic data in order to detect borders of verti-cal prismatic blocks and the results are compared with thoseof another edge detection filter (NSTD) (Figs. 3–8). Af-ter obtaining satisfactory results, the method was appliedto the Gravity anomaly map of the Tuzgolu basin in Cen-tral Anatolia. The structural features in the area betweenYeniceoba, Cihanbeyli, S. Kochisar, Aksaray and Sultan-hani were investigated. The results of the proposed ap-proach (Fig. 10(a)) show a good agreement with previously-observed faults in the field (Cemen et al., 1999; Aydemirand Ates, 2006, 2008). Faults that are not clear in the grav-
ity anomaly map can also be identified as well. These re-sults show that the proposed approach constitutes a usefultool to aid fault interpretation. It is observed from the ex-perimental results that increasing the operator size and thethreshold values reduce its sensitivity to noise, at the ex-pense of losing some of the real edges in the input data.The threshold value is a key parameter in the proposed ap-proach (Figs. 5 and 8). A selection of the threshold valuefrom the gradient magnitude is related to the accuracy oflineament detection. The localization error in the detectededges also increases as the operator size and threshold valueare increased. In other words, it is a way to keep the signif-icant information of the input data whilst getting rid of theunimportant parts. The experimental results demonstratethat this operator can be used in the visual interpretation ofgravity-anomaly maps in order to detect geological featuressuch as major and minor faults.
Consequently, by applying the proposed approach to agravity-anomaly map, a detailed general view of surfaceand subsurface structural boundaries can be obtained suc-cessfully. The proposed approach, as applied to the locationof edges of causative sources, is simple and easy to use, andis good for vertical or near vertical faults. The method isa tool that can contribute to the geophysical interpretationin determining fault traces, but the observations of experi-enced reviewers are needed to define the geological mean-ing of the results. Thus, this method should be consideredto be a useful tool, like other geophysics techniques, in theinvestigation of structural boundaries over wide areas.
Acknowledgments. The author thanks Dr. Aysan Gurer, Dr. AliPınar, Dr. Ali Elmas and Dr. Nihan Sezgin for their careful readingand suggestions to improve the manuscript. I would also liketo thank an anonymous referee and Dr. Takeshi Sagiya for theirreading and constructive comments on the manuscript.
ReferencesArpat, E. and F. Saroglu, Turkiye’deki bazi onemli genc tektonik olaylar,
Turkish Geol. Soc. Bull., 18, 91–101, 1975.Ates, A., F. Bilim, and A. Buyuksarac, Curie Point Depth investigation of
Central Anatolia, Turkey, Pure Appl. Geophys., 162, 357–371, 2005.Aydemir, A. and A. Ates, Structural interpretation of the Tuzgolu and
Haymana Basins, Central Anatolia, Turkey, using seismic, gravity andaeromagnetic data, Earth Planets Space, 58, 951–961, 2006.
Aydemir, A. and A. Ates, Determination of hydrocarbon prospective areasin the Tuzgolu (Salt lake) Basin, central Anatolia, by using geophysicaldata, J. Petrol. Sci. Eng., 62, 36–44, 2008.
Aydogan, D., Processing the Bouguer anomaly map of Biga and the sur-rounding area by the Cellular Neural Network: Application to the south-western Marmara region, Earth Planets Space, 59, 201–208, 2007.
Blakely, R. J. and R. W. Simpson, Approximating edges of source bodiesfrom magnetic or gravity anomalies, Geophysics, 51, 1494–1498, 1986.
Boschetti, F., Improved edge detection and noise removal in gravity mapsvia the use of gravity gradients, J. Appl. Geophys., 57, 213–225, 2005.
Boschetti, F., P. Hornby, and F. G. Horowitz, Wavelet based inversion ofgravity data, Exp. Geophys., 32, 48–55, 2001.
Buyuksarac, A., D. Jordanova, A. Ates, and V. Karloukovski, Interpreta-tion of the gravity and magnetic anomalies of the Cappadocia region,central Turkey, Pure Appl. Geophys., 162, 2197–2213, 2005.
Canny, J., A computational approach to edge detection, IEEE Transactionon Pattern Analysis and Machine Intelligence, PAMI 8(6), 679–698,1986.
Cemen, I., M. C. Goncuoglu, and K. Dirik, Structural evolution of theTuzgolu basin in Central Anatolia, Turkey, J. Geol., 107, 693–706,1999.
Chen, C. H. and P. G. Ho, Statistical pattern recognition in remote sensing,Pattern Recognition, 41, 2731–2741, 2008.
D. AYDOGAN: EXTRACTION OF LINEAMENTS USING A GRADIENT METHOD 913
Chen, C. H. and B. Shrestha, Classification of multi-sensor remote sensingimages using self-organizing feature maps and radial basis function net-works, in Proceedings of International Geosciences and Remote Sens-ing Symposium (IGARSS), Hawaii, 2000.
Cooper, G. R. J. and D. R. Cowan, Enhancing potential field data usingfilters based on the local phase, Comput. Geosci., 32, 1585–1591, 2006.
Cooper, G. R. J. and D. R. Cowan, Edge enhancement of potential-fielddata using normalized statistics, Geophysics, 73, H1–H4, 2008.
Fedi, M. and G. Florio, Detection of potential fields source boundaries byenhanced horizontal derivative method, Geophys. Prospect., 49, 40–58,2001.
Gorur, N., F. Y. Oktay, I. Seymen, and A. M. C. Sengor, Paleotectonicevolution of Tuzgolu basin complex, Central Turkey, in The GeologicalEvolution of the Eastern Mediterranean, edited by Dixon, J. E. and A.H. F Robertson, Spec. Publ. Geol. Soc., 17, 81–96, 1984.
Grauch, V. J. S. and L. Cordell, Limitations of determining density or mag-netic boundaries from the horizontal gradient of gravity or pseudograv-ity data, Geophysics, 52, 118–121, 1987.
Gurer, O. F. and E. Aldanmaz, Origin of the Upper Cretaceous-Tertiarysedimentary basins within the Taurid-Anatolide platform in Turkey,Geol. Mag., 139(2), 191–197, 2002.
Hertz, L. and R. W. Schafer, Multilevel thresholding using edge matching,Comput. Vision Graphics Image Process., 44, 279–295, 1988.
Hornby, P., F. Boschetti, and F. Horowitz, Analysis of potential field datain the wavelet domain, Geophys. J. Int., 137, 175–196, 1999.
Hsu, S. K, J. C. Sibuet, and C. T. Shyu, High-resolution detection of ge-ologic boundaries from potential field anomalies: an enhanced analyticsignal technique, Geophysics, 61, 373–386, 1996.
Ilkisik, O. M., A. Gurer, T. Tokgoz, and C. Kaya, Geoelectromagneticand geothermic investigations in the Ihlara Valley geothermal field, J.Volcanol. Geotherm. Res., 78, 297–308, 1997.
Lunscher, W. H. H. J., The asymptotic optimal frequency domain filterfor edge detection, IEEE Transaction on Pattern Analysis and MachineIntelligence, PAMI 5(6), 678–679, 1983.
Mallat, S. and S. Zhong, Characterization of signals from multiscale edges,IEEE Transactions on Pattern Recognition and Machine Intelligence,14, 710–732, 1992.
Marcotte, D. L., C. D. Hardwick, and J. B. Nelson, Automated interpreta-tion of horizontal magnetic gradient profile data, Geophysics, 57, 288–295, 1992.
McGrath, P. H., Dip and depth extent of density boundaries using hor-izontal derivatives of upward continued gravity data, Geophysics, 56,1533–1542, 1991.
Modestino, J. W. and R. W. Fries, Edge detection in noisy images usingrecursive digital filter, Comput. Graphics Image Process, PAMI 1, 409–433, 1977.
Moreau, F., D. Gibert, M. Holschneider, and G. Saracco, Wavelet analysisof potential fields, Inverse Problems, 13, 165–78, 1997.
Otsu, N., A threshold selection method from gray-level histograms, IEEETransactions on Systems, 9(1), 62–66, 1979.
Pawlowski, R. S., Use of slant stack for geologic or geophysical maplineament analysis, Geophysics, 62, 1774–1778, 1997.
Peli, T. and D. Malah, A study of edge detection algorithms, Comput.Graphics Image Process., 20, 1–21, 1982.
Prewitt, J. M. S. and M. L. Mendelsohn, The analysis of cell images, Ann.Newyork Academy Sci., 128, 1035–1053, 1966.
Pun, T., A new method for gray-level picture thresholding using the en-tropy of the histogram, Signal Processing, 2, 223–237, 1980.
Rao, D. A., H. V. Babu, and P. V. Narayan, Interpretation of magneticanomalies due to dikes: The complex gradient method, Geophysics, 46,1572–1578, 1981.
Reid, A. B., J. M. Allsop, H. Granser, A. J. Millett, and I. W. Somerton,Magnetic interpretation in three dimensions using Euler deconvolution,Geophysics, 55, 80–91, 1990.
Roest, W. R., J. Verhoef, and M. Pilkington, Magnetic interpretation usingthe 3-D analytic signal, Geophysics, 57, 116–125, 1992.
Sengor, A. M. C., N. Gorur, and F. Saroglu, Strike slip deformation basinformation and sedimentation, strike-slip faulting and related basin for-mation in zones of tectonic escape, Turkey as a case study, in Strike-slipFaulting and Basin Formation, Soc. Econ. Paleont. Mineral. Spec. Pub.,edited by Biddle, K. T. and N. Christie-Blick, 37, 227–264, 1985.
Shanmugam, K. S. and J. A. Green, An optimal frequency domain filter foredge detection in digital pictures, IEEE Transaction on Pattern Analysisand Machine Intelligence, 1, 37–49, 1979.
Shen, J. and C. Castan, An optimal linear operator for edge detection,Proceeding Conference on Vision and Pattern Recognition (CUPR),109–114, 1986.
Sun, G., Q. Liu, C. Ji, and X. Li, A novel approach for edge detection basedon the theory of universal gravity, Pattern Recognition, 40, 2766–2775,2007.
Sykes, M. P. and U. C. Das, Directional filtering for linear feature enhance-ment in geophysical maps, Geophysics, 65, 1758–1768, 2000.
Telford, W. M., L. P. Geldart, R. E. Sheriff, and D. A. Keys, AppliedGeophysics, Cambridge University Press, 1976.
Trompat, H., F. Boschetti, and P. Hornby, Improved downward continua-tion of potential field data, Expl. Geophys., 34(4), 249–256, 2003.
Tsai, W., Moment preserving thresholding: A new approach, Comput.Vision Graphics Image Processing, 29, 377–393, 1985.
Ugurtas, G., Geophysical interpretation of part of the Tuzgolu basin, M. T.A. Bull., 85, 38–45, 1975.
Yunxuan, Z., Application of the Radon transform to the processing of air-borne geophysical data, Ph.D. thesis, Internat, Inst., Aerospace Surveyand Earth Sciences, 1992.
Zeng, H., Q. Zhang, and J. Liu, Location of secondary faults from cross-correlation of the second vertical derivative of gravity anomalies, Geo-phys. Prospect., 42, 841–854, 1994.
D. Aydogan (e-mail: [email protected])