Embed Size (px)
Citation preview
SpatialSciences2003 PA
GE
1
The feasibility of extracting urban fringe land cover information frompixel-level fused TM and SPOT images
Gang-Jun Liu1, Tony W Norton2, Christopher J Pettit3
Department of Geospatial Science, RMIT University, GPO Box 2476V Melbourne, VIC 3001, Australia1 Tel: +61 9925 53351, Fax: +61 9663 2517, Email: [email protected]
2 Tel: +61 9925 53279, Fax: +61 9663 2517, Email: [email protected] Tel: +61 9925 3271, Fax: +61 9663 2517, Email: [email protected]
ABSTRACT
Given a set of remotely sensed images with different spatial and spectral resolutions, information preservingtechniques of pixel-level image fusion can be used to generate a synthesised image that maximises thepreservation of both the spectral and the spatial information available from the source images. Thesetechniques have the potential for improving the quality of information on urban fringe land cover patterns, whichare important to many applications. Here, we assess the feasibility of extracting useful land cover information inorder to derive more accurate spatial information to inform sustainable land-use of the urban fringe. After a briefreview of some existing pixel-level image fusion techniques, the results from applying a wavelet transformbased pixel-level image fusion technique on subsets of TM and SPOT images over a portion of the easternfringe of Melbourne are evaluated in terms of spectral fidality and spatial enhancement. We argue that thewavelet fusion technique demonstrated here may provide an efficient and cost-effective means to supportenhanced land cover and land use assessment.
KEYWORDS: Urban-rural fringe land use, sustainable management, wavelet transformation, pixel-level imagefusion, TM, SPOT
Introduction
Australia’s cities and regional centres will continue to grow at more than twice the rate of smaller centres,producing enormous challenges for landuse zoning and environmental management including the protection ofopen space, natural environments and amenities at the urban fringe (Newton et al. 2002). The urban–rural fringecan be defined as the area extending from the edge of a city’s contiguous urban development to the outer edgeof the vehicular commuter belt (McKenzie 1996). The urban–rural fringe forms as businesses and individualsattempt to exploit the relative advantages afforded by access to both urban and rural settings (Davis et al.1994). The rapid pace of change makes the urban–rural fringe a potential zone of competition and conflict(Troughton 1981). The urban-rural fringe is identified as one of the most significant points of land use conflict(Planning and Local Government Advisory Committee 1996). Management issues confronting the urban-ruralfringe of Australian cities will continue and are likely to be intense (Cocks 1996).
Strategies to protect and enhance the quality of urban life must give greater emphasis to the sustainability of theurban-rural fringe. Fortunately, sophisticated technologies such as remote sensing systems are beingdeveloped to aid land-use planning and management and to support the sustainable use of natural resources inthese situations (Li et al. 2001, Pettit 2003). Remote sensing systems can be used to efficiently characterise,monitor and manage land cover and land use, and human activities that may threaten sustainability.Complementary information about these regions can be obtained and/or derived from a variety of satellite andground-based sources to help develop a comprehensive and dynamic understanding of land use and landcover change in the urban-rural fringe. Even so, issues remain with the integration of some technologies anddata sources.
This paper assesses the feasibility of extracting useful urban fringe land cover information from pixel-level fusedTM and SPOT satellite images in order to derive more accurate spatial information for the urban-rural fringe ofMelbourne, Australia.
Click here to return to program
Click here to return to author index
SpatialSciences2003 PA
GE
2
Study area
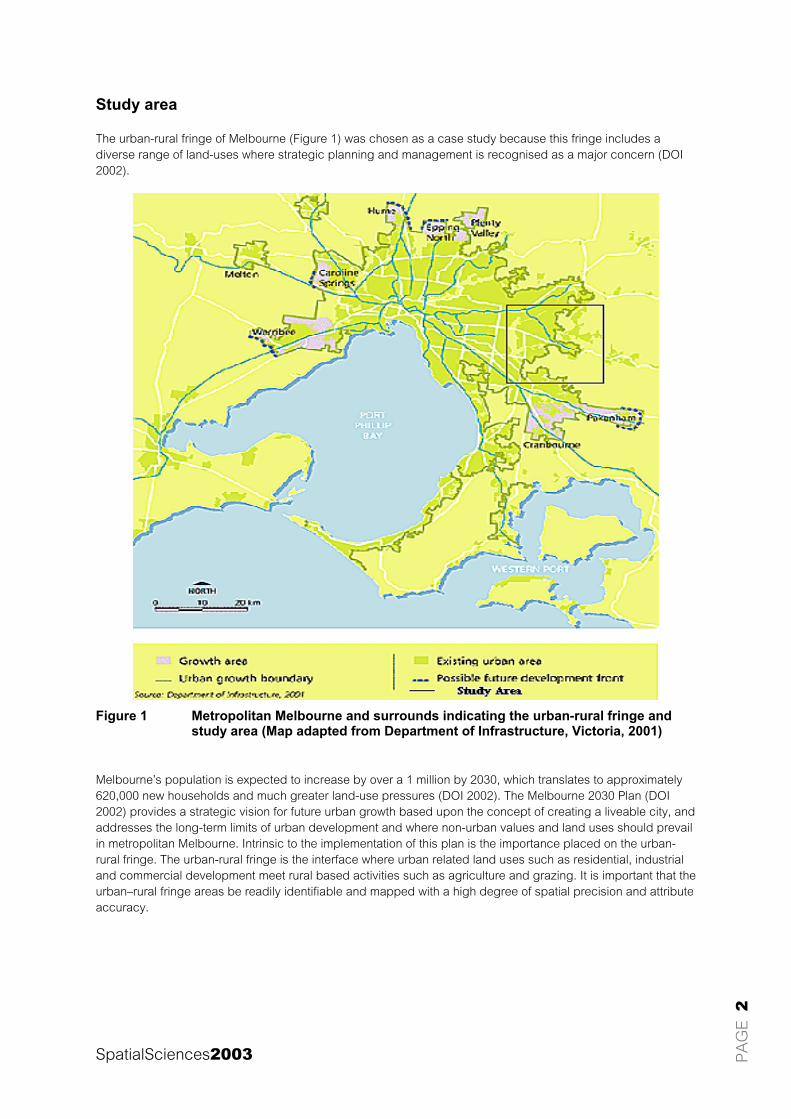
The urban-rural fringe of Melbourne (Figure 1) was chosen as a case study because this fringe includes adiverse range of land-uses where strategic planning and management is recognised as a major concern (DOI2002).
Figure 1 Metropolitan Melbourne and surrounds indicating the urban-rural fringe andstudy area (Map adapted from Department of Infrastructure, Victoria, 2001)
Melbourne’s population is expected to increase by over a 1 million by 2030, which translates to approximately620,000 new households and much greater land-use pressures (DOI 2002). The Melbourne 2030 Plan (DOI2002) provides a strategic vision for future urban growth based upon the concept of creating a liveable city, andaddresses the long-term limits of urban development and where non-urban values and land uses should prevailin metropolitan Melbourne. Intrinsic to the implementation of this plan is the importance placed on the urban-rural fringe. The urban-rural fringe is the interface where urban related land uses such as residential, industrialand commercial development meet rural based activities such as agriculture and grazing. It is important that theurban–rural fringe areas be readily identifiable and mapped with a high degree of spatial precision and attributeaccuracy.
SpatialSciences2003 PA
GE
3
Datasets
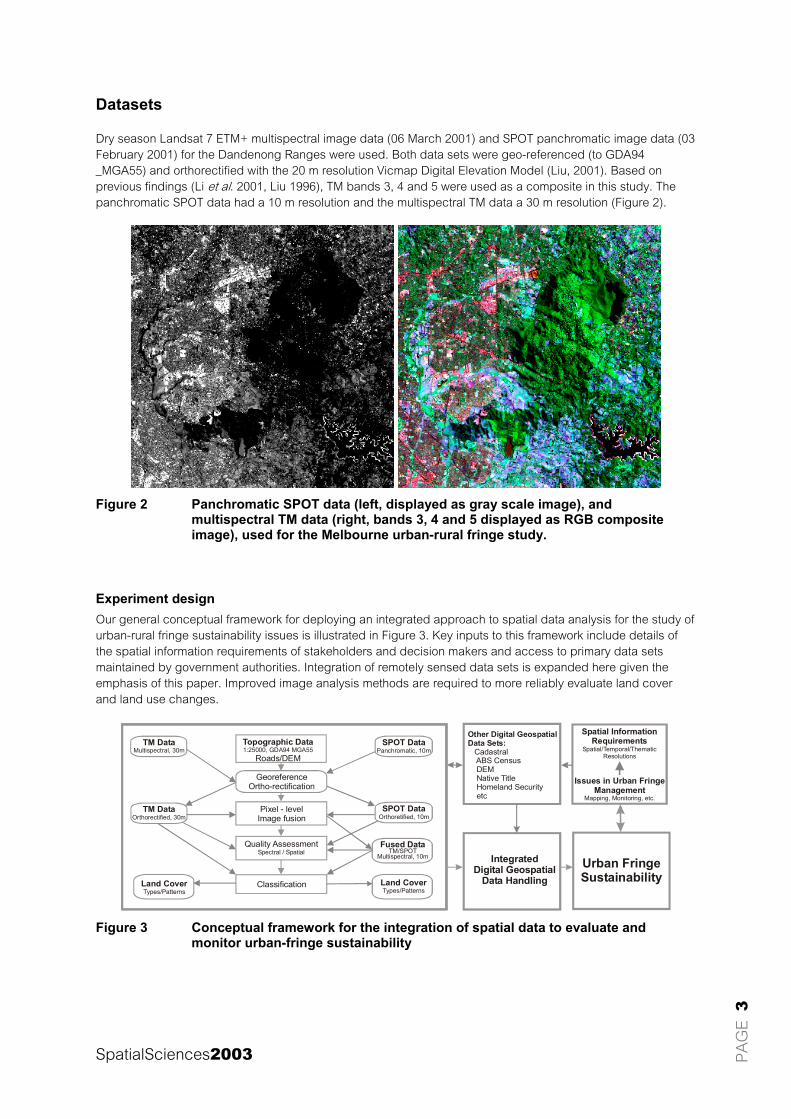
Dry season Landsat 7 ETM+ multispectral image data (06 March 2001) and SPOT panchromatic image data (03February 2001) for the Dandenong Ranges were used. Both data sets were geo-referenced (to GDA94_MGA55) and orthorectified with the 20 m resolution Vicmap Digital Elevation Model (Liu, 2001). Based onprevious findings (Li et al. 2001, Liu 1996), TM bands 3, 4 and 5 were used as a composite in this study. Thepanchromatic SPOT data had a 10 m resolution and the multispectral TM data a 30 m resolution (Figure 2).
Figure 2 Panchromatic SPOT data (left, displayed as gray scale image), andmultispectral TM data (right, bands 3, 4 and 5 displayed as RGB compositeimage), used for the Melbourne urban-rural fringe study.
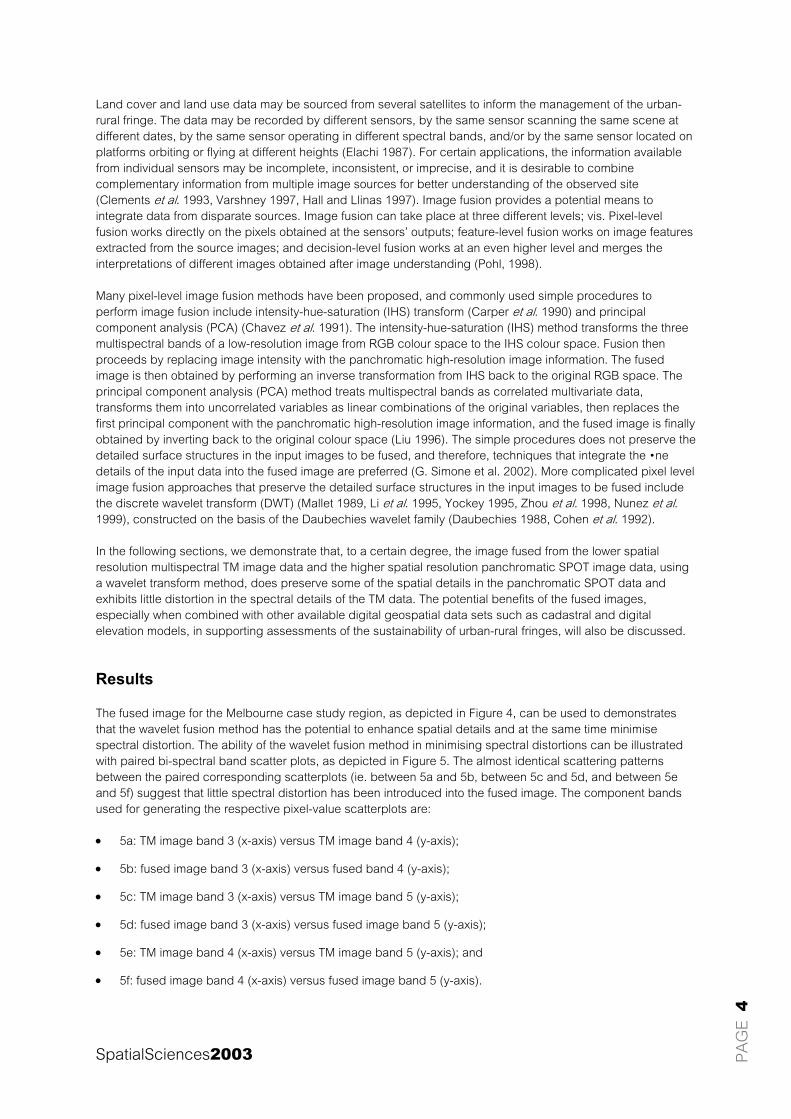
Experiment designOur general conceptual framework for deploying an integrated approach to spatial data analysis for the study ofurban-rural fringe sustainability issues is illustrated in Figure 3. Key inputs to this framework include details ofthe spatial information requirements of stakeholders and decision makers and access to primary data setsmaintained by government authorities. Integration of remotely sensed data sets is expanded here given theemphasis of this paper. Improved image analysis methods are required to more reliably evaluate land coverand land use changes.
IntegratedDigital Geospatial
Data Handling
Other Digital GeospatialData Sets: Cadastral ABS Census DEM Native Title Homeland Security etc
Spatial InformationRequirements
Spatial/Temporal/ThematicResolutions
Issues in Urban Fringe Management
Mapping, Monitoring, etc.
Topographic Data
Roads/DEM1:25000, GDA94 MGA55
Georeference Ortho-rectification
Classification
Pixel - level Image fusion
Quality AssessmentSpectral / Spatial
TM DataMultispectral, 30m
TM DataOrthorectified, 30m
SPOT DataPanchromatic, 10m
SPOT DataOrthoretified, 10m
Fused Data TM/SPOT
Multispectral, 10m
Land CoverTypes/Patterns
Land CoverTypes/Patterns
Urban FringeSustainability
Figure 3 Conceptual framework for the integration of spatial data to evaluate andmonitor urban-fringe sustainability
SpatialSciences2003 PA
GE
4
Land cover and land use data may be sourced from several satellites to inform the management of the urban-rural fringe. The data may be recorded by different sensors, by the same sensor scanning the same scene atdifferent dates, by the same sensor operating in different spectral bands, and/or by the same sensor located onplatforms orbiting or flying at different heights (Elachi 1987). For certain applications, the information availablefrom individual sensors may be incomplete, inconsistent, or imprecise, and it is desirable to combinecomplementary information from multiple image sources for better understanding of the observed site(Clements et al. 1993, Varshney 1997, Hall and Llinas 1997). Image fusion provides a potential means tointegrate data from disparate sources. Image fusion can take place at three different levels; vis. Pixel-levelfusion works directly on the pixels obtained at the sensors’ outputs; feature-level fusion works on image featuresextracted from the source images; and decision-level fusion works at an even higher level and merges theinterpretations of different images obtained after image understanding (Pohl, 1998).
Many pixel-level image fusion methods have been proposed, and commonly used simple procedures toperform image fusion include intensity-hue-saturation (IHS) transform (Carper et al. 1990) and principalcomponent analysis (PCA) (Chavez et al. 1991). The intensity-hue-saturation (IHS) method transforms the threemultispectral bands of a low-resolution image from RGB colour space to the IHS colour space. Fusion thenproceeds by replacing image intensity with the panchromatic high-resolution image information. The fusedimage is then obtained by performing an inverse transformation from IHS back to the original RGB space. Theprincipal component analysis (PCA) method treats multispectral bands as correlated multivariate data,transforms them into uncorrelated variables as linear combinations of the original variables, then replaces thefirst principal component with the panchromatic high-resolution image information, and the fused image is finallyobtained by inverting back to the original colour space (Liu 1996). The simple procedures does not preserve thedetailed surface structures in the input images to be fused, and therefore, techniques that integrate the •nedetails of the input data into the fused image are preferred (G. Simone et al. 2002). More complicated pixel levelimage fusion approaches that preserve the detailed surface structures in the input images to be fused includethe discrete wavelet transform (DWT) (Mallet 1989, Li et al. 1995, Yockey 1995, Zhou et al. 1998, Nunez et al.1999), constructed on the basis of the Daubechies wavelet family (Daubechies 1988, Cohen et al. 1992).
In the following sections, we demonstrate that, to a certain degree, the image fused from the lower spatialresolution multispectral TM image data and the higher spatial resolution panchromatic SPOT image data, usinga wavelet transform method, does preserve some of the spatial details in the panchromatic SPOT data andexhibits little distortion in the spectral details of the TM data. The potential benefits of the fused images,especially when combined with other available digital geospatial data sets such as cadastral and digitalelevation models, in supporting assessments of the sustainability of urban-rural fringes, will also be discussed.
Results
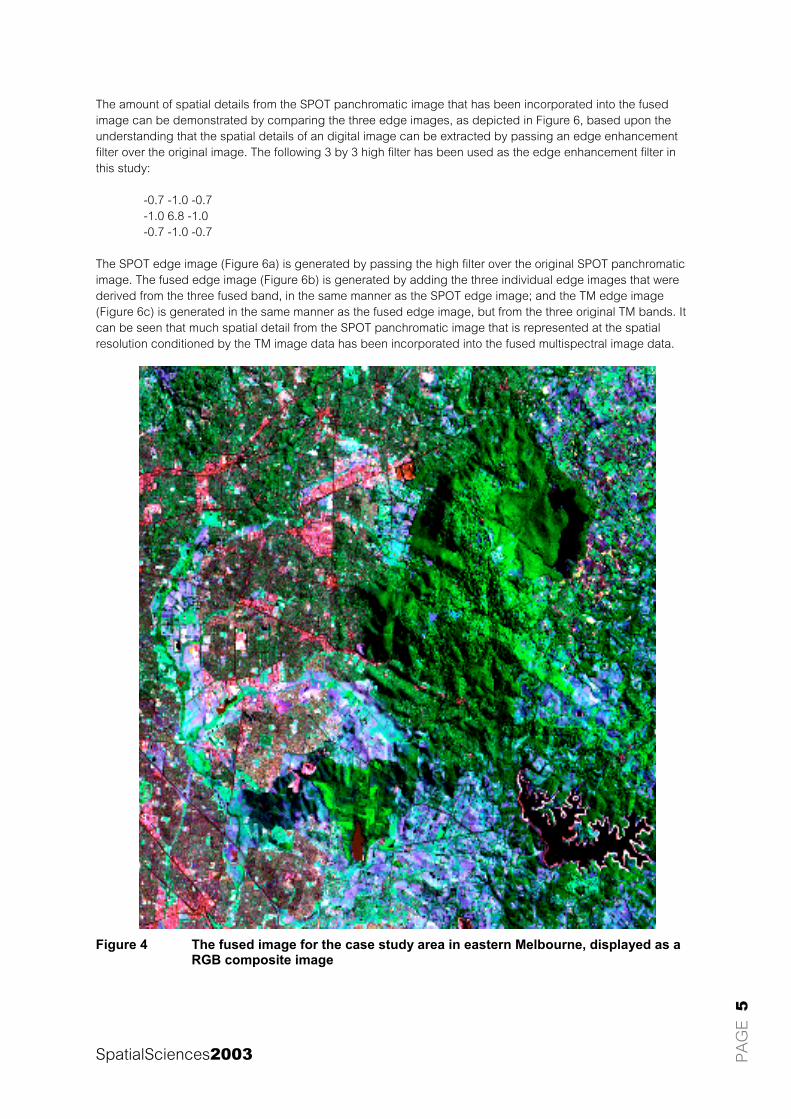
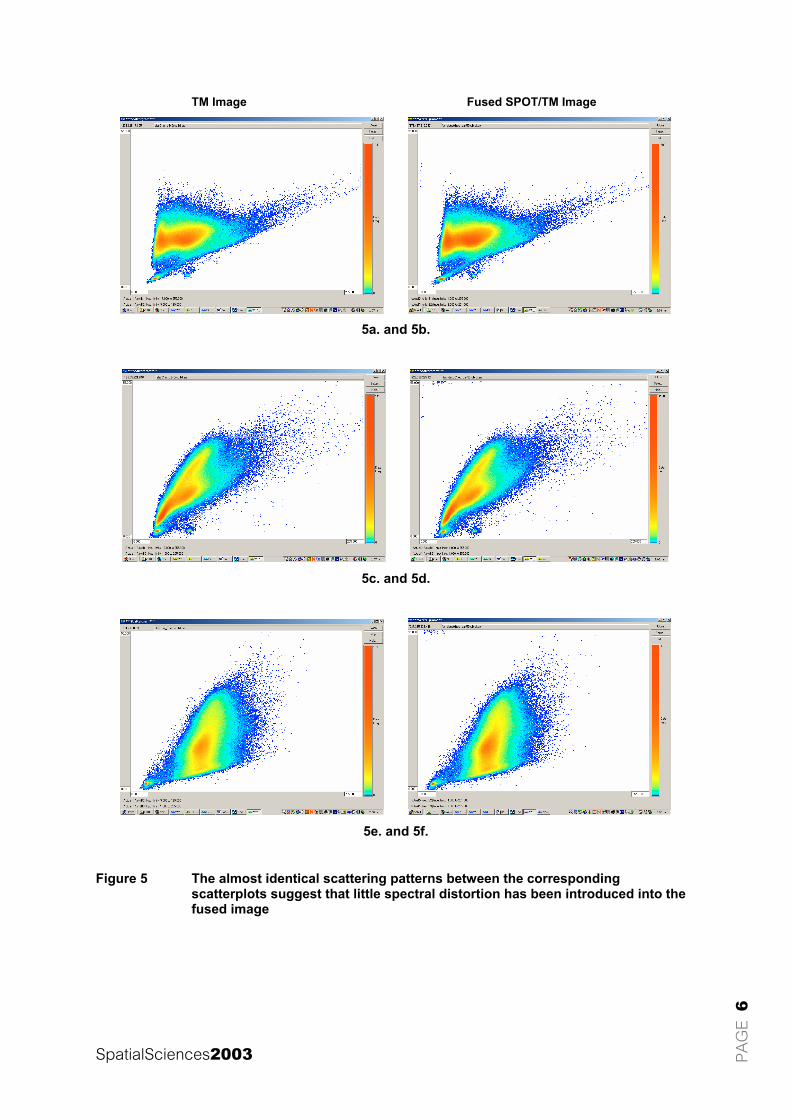
The fused image for the Melbourne case study region, as depicted in Figure 4, can be used to demonstratesthat the wavelet fusion method has the potential to enhance spatial details and at the same time minimisespectral distortion. The ability of the wavelet fusion method in minimising spectral distortions can be illustratedwith paired bi-spectral band scatter plots, as depicted in Figure 5. The almost identical scattering patternsbetween the paired corresponding scatterplots (ie. between 5a and 5b, between 5c and 5d, and between 5eand 5f) suggest that little spectral distortion has been introduced into the fused image. The component bandsused for generating the respective pixel-value scatterplots are:
• 5a: TM image band 3 (x-axis) versus TM image band 4 (y-axis);
• 5b: fused image band 3 (x-axis) versus fused band 4 (y-axis);
• 5c: TM image band 3 (x-axis) versus TM image band 5 (y-axis);
• 5d: fused image band 3 (x-axis) versus fused image band 5 (y-axis);
• 5e: TM image band 4 (x-axis) versus TM image band 5 (y-axis); and
• 5f: fused image band 4 (x-axis) versus fused image band 5 (y-axis).
SpatialSciences2003 PA
GE
5
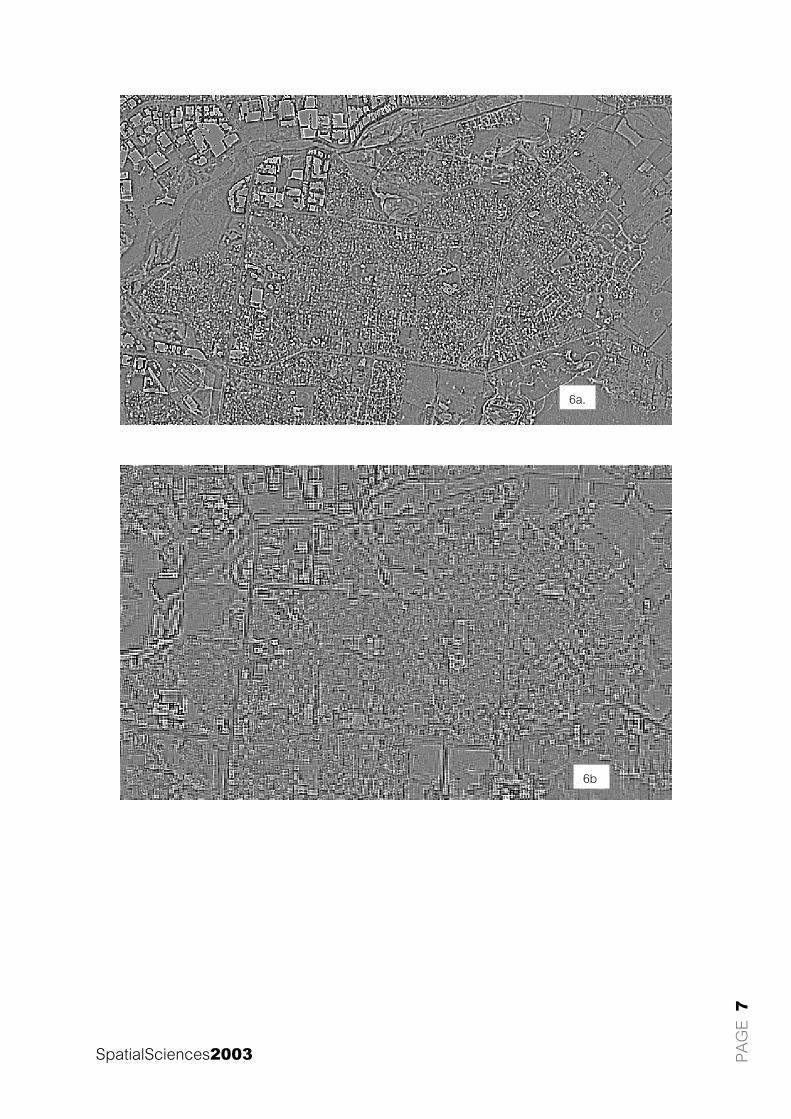
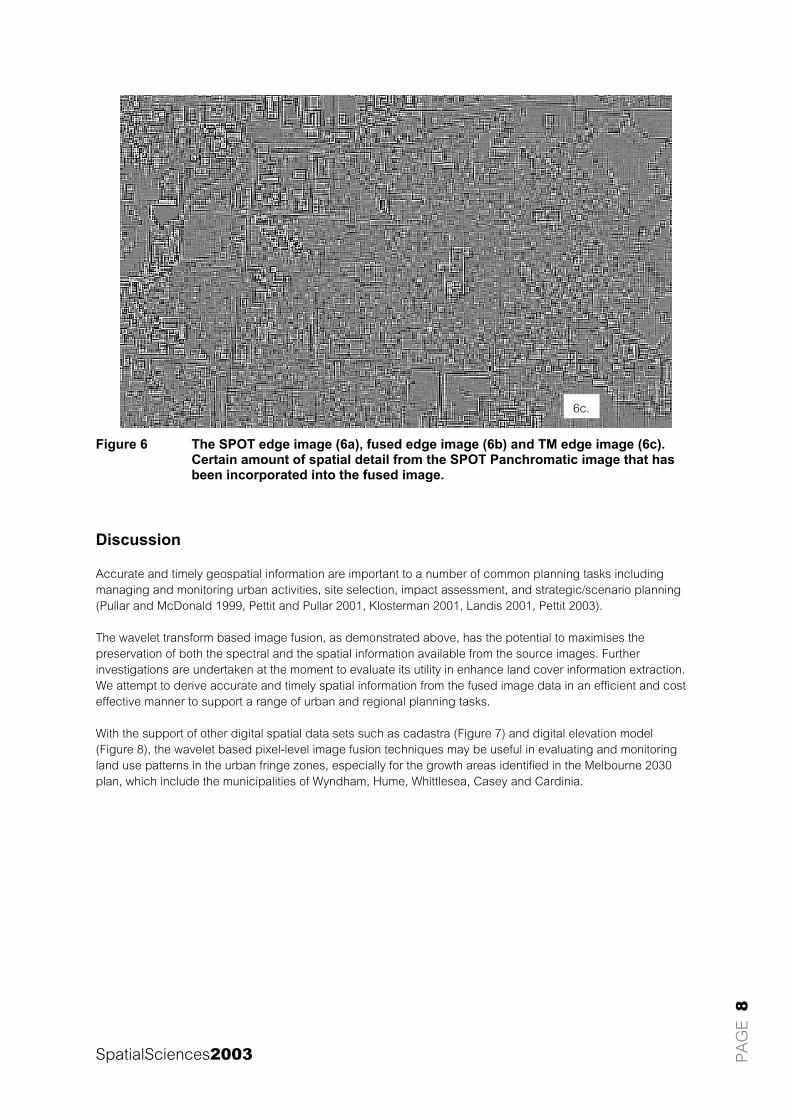
The amount of spatial details from the SPOT panchromatic image that has been incorporated into the fusedimage can be demonstrated by comparing the three edge images, as depicted in Figure 6, based upon theunderstanding that the spatial details of an digital image can be extracted by passing an edge enhancementfilter over the original image. The following 3 by 3 high filter has been used as the edge enhancement filter inthis study:
-0.7 -1.0 -0.7-1.0 6.8 -1.0-0.7 -1.0 -0.7
The SPOT edge image (Figure 6a) is generated by passing the high filter over the original SPOT panchromaticimage. The fused edge image (Figure 6b) is generated by adding the three individual edge images that werederived from the three fused band, in the same manner as the SPOT edge image; and the TM edge image(Figure 6c) is generated in the same manner as the fused edge image, but from the three original TM bands. Itcan be seen that much spatial detail from the SPOT panchromatic image that is represented at the spatialresolution conditioned by the TM image data has been incorporated into the fused multispectral image data.
Figure 4 The fused image for the case study area in eastern Melbourne, displayed as aRGB composite image
SpatialSciences2003 PA
GE
6
TM Image Fused SPOT/TM Image
5a. and 5b.
5c. and 5d.
5e. and 5f.
Figure 5 The almost identical scattering patterns between the correspondingscatterplots suggest that little spectral distortion has been introduced into thefused image
SpatialSciences2003 PA
GE
7
6b
6a.
SpatialSciences2003 PA
GE
8
Figure 6 The SPOT edge image (6a), fused edge image (6b) and TM edge image (6c).Certain amount of spatial detail from the SPOT Panchromatic image that hasbeen incorporated into the fused image.
Discussion
Accurate and timely geospatial information are important to a number of common planning tasks includingmanaging and monitoring urban activities, site selection, impact assessment, and strategic/scenario planning(Pullar and McDonald 1999, Pettit and Pullar 2001, Klosterman 2001, Landis 2001, Pettit 2003).
The wavelet transform based image fusion, as demonstrated above, has the potential to maximises thepreservation of both the spectral and the spatial information available from the source images. Furtherinvestigations are undertaken at the moment to evaluate its utility in enhance land cover information extraction.We attempt to derive accurate and timely spatial information from the fused image data in an efficient and costeffective manner to support a range of urban and regional planning tasks.
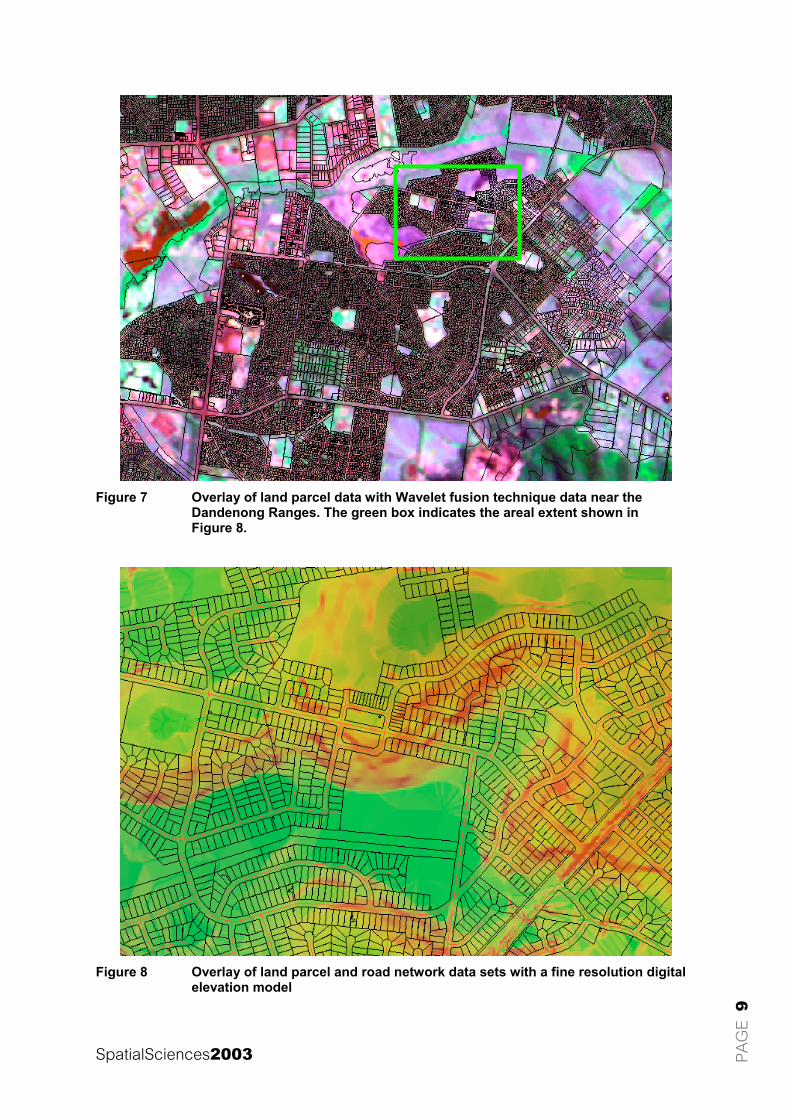
With the support of other digital spatial data sets such as cadastra (Figure 7) and digital elevation model(Figure 8), the wavelet based pixel-level image fusion techniques may be useful in evaluating and monitoringland use patterns in the urban fringe zones, especially for the growth areas identified in the Melbourne 2030plan, which include the municipalities of Wyndham, Hume, Whittlesea, Casey and Cardinia.
6c.
SpatialSciences2003 PA
GE
9
Figure 7 Overlay of land parcel data with Wavelet fusion technique data near theDandenong Ranges. The green box indicates the areal extent shown inFigure 8.
Figure 8 Overlay of land parcel and road network data sets with a fine resolution digitalelevation model

SpatialSciences2003 PA
GE
10
In Victoria, a comprehensive state-wide high resolution digital spatial data sets, including TM and SPOT images,have been accumulated over the years. It is envisaged that by undertaking the wavelet based fusion of Landsatand SPOT imagery, more accurate spatial datasets including land use data can be produced and updatedmore cost effectively. The 10 m resolution fused image data can be used as a cost effective means forsupporting activities in the mapping, measuring, monitoring and modelling of the urban growth process.
Acknowledgments
We are grateful to John White of Land Victoria for helping supply the orthorectified TM and SPOT images, andMay Treloar and Renado Schnitzer of Geospatial Science @ RMIT for assistance with the presentation of thepaper.
References
Australian Bureau of Statistics, 2003. Census data for Australia. AGPS, Canberra.
BRS. 2002. Land Use Mapping at Catchment Scale: Principles, Procedures and Definitions. Canberra, Bureauof Rural Science. Edition 2 February 2002.
Bureau of Rural Sciences. 2002. Land Use Mapping at Catchment Scale: Principles, Procedures andDefinitions. Canberra, Bureau of Rural Science. Edition 2 February 2002.
Carper, W.J. et al., 1990. The use of Intensity-Hue-Saturation transformation for merging SPOT panchromaticand multispectral image data, Photogrammetric Engineering and Remote Sensing 56 (4) () 459–467.
Chavez, P.S. et al., 1991. Comparison of three different methods to merge multiresolution and multispectraldata: Landsat TM and SPOT panchromatic, Photogrammetric Engineering and Remote Sensing 57 (3) :295–303.
Clement, V et al. 1993. Interpretation of remotely sensed images in a context of multisensor fusion using amultispecialist architecture, IEEE Trans. Geosci. Remote Sensing 31 (4).
Cocks, D. 1996. People Policy: Australia’s population choices. University of New South wales press, Sydney.
Cohen, A.I. et al. 1992. Biorthogonal bases of compactly supported wavelets, Communications on Pure andApplied Mathematics 45 (5) (1992) 485–560.
Davis, J., A. Nelson, and K. Dueker 1994 The New ‘Burbs: The Exurbs and Their Implications for PlanningPolicy. Journal of the American Planning Association 60(1):45–59.
DOI. 2002. Melbourne 2030: Planning for Sustainable Growth. Melbourne, Victorian Department ofInfrastructure. October 2002.
DOI. 2002. Melbourne 2030: Planning for Sustainable Growth. Melbourne, Victorian Department ofInfrastructure. October 2002.
Elachi, C. 1987. Introduction to the physics and techniques of remote sensing, in: J.A. Kong (Series Ed.), WileySeries in Remote Sensing, 1987.
Hall, D.L. and J. Llinas, 1997. An introduction to multisensor data fusion, Proc. IEEE 85 (1):6–23.
Klosterman, R. E. 2001. The What if? Planning Support System. In Planning Support Systems. (ed.) Brail, R. K. &Klosterman, R. E. Redlands, California, ESRI Press: 263–284.
Klosterman, R. E. 2001. The What if? Planning Support System. In Planning Support Systems. (ed.) Brail, R. K. &Klosterman, R. E. Redlands, California, ESRI Press: 263–284.

SpatialSciences2003 PA
GE
11
Lamb, R. 1983 The Extent and Form of Exurban Sprawl. Growth Change 14(1):40–47.
Landis, J. 2001. CUF, CUFII, and CURBA: A family of spatially explicit urban growth and land-use policysimulation models. In Planning Support Systems: Integrating geographic information systems, models,and visualisation tools. (ed.) Brail, R. K. & Klosterman, R. E. Redlands, California, ESRI Press: 157–200.
Landis, J. 2001. CUF, CUFII, and CURBA: A family of spatially explicit urban growth and land-use policysimulation models. In Planning Support Systems: Integrating geographic information systems, models,and visualisation tools. (ed.) Brail, R. K. & Klosterman, R. E. Redlands, California, ESRI Press: 157–200.
Li, H. et al., 1995. Multisensor image fusion using the wavelet transform, Graphical Models and ImageProcessing 57 (3) : 235–245.
Li, X., J.A. Peterson, G-J Liu, and L. Qian 2001. Assessing Regional Sustainability: The Case of Land Use andLand Cover Change in the Middle Yiluo Catchment of the Yellow River Basin, China. AppliedGeography 21(1):87–106.
Liu, G-J. 2001. Vicmap Digital Elevation Model: Technical Specifications and Product Description.http://www.giconnections.vic.gov.au/menupage/products/vicmap_elevation_11.pdf.
Liu, G-J. 1996. Land cover mapping in a salinised dryland farming area in southeastern Australia using LandsatTM data. Geocarto International, 11(4):47–59.
McKenzie, F. 1996 Beyond the Suburbs: Population Change in the Major Exurban Regions of Australia.Canberra: Department of Immigration and Multicultural Affairs.
McKenzie, F. 1997 Growth Management or Encouragement? A Critical Review of Land Use Policies AffectingAustralia’s Major Exurban Regions. Urban Policy and Research 15(2):83–101.
Nelson, A. 1992 Characterizing Exurbia. Journal of Planning Literature 6:350–368.
Newton, P.W. et al., 2001. Human Settlements Theme Report. Australia State of the Environment Report 2001 (ThemeReport) AGPS, Canberra.
Nunez, J. et al., 1999. Multiresolution-based image fusion with additive wavelet decomposition, IEEE Trans.Geosci. Remote Sensing 37 (3) : 1204–1211.
Pettit, C. & Pullar, D. 2001. Introduction to Urban and Regional Planning using ArcView 3.x. cited in:http://campus.esri.com/.
Pettit, C. 2003. Formulating a Sustainable Development Land Use Strategy for Hervey Bay 2021.In The 8thInternational Conference on Computers in Urban Planning and Urban Management, 27–29 May,Sendai, Japan, CUPUM.
Pettit, C. 2003. Formulating a Sustainable Development Land Use Strategy for Hervey Bay 2021.In The 8thInternational Conference on Computers in Urban Planning and Urban Management, 27–29 May,Sendai, Japan, CUPUM.
Pettit, C. & Pullar, D. 2001. Introduction to Urban and Regional Planning using ArcView 3.x. cited in:http://campus.esri.com/.
Planning and Local Government Advisory Committee. 1996. Review of Issues on the Urban Fringe. Melbourne,Department of Planning and Local Government. Final Report November 1996.
Planning and Local Government Advisory Committee. 1996. Review of Issues on the Urban Fringe. Melbourne,Department of Planning and Local Government. Final Report November 1996.
Pohl, C. 1998. Multisensor image fusion in remote sensing: concepts, methods and applications, InternationalJournal of Remote Sensing 19 (5) :823–854.
SpatialSciences2003 PA
GE
12
Pullar, D. & McDonald, G. 1999. Geographical Information Systems: A tool for planning. Australian Planner 36:216–222.
Pullar, D. & McDonald, G. 1999. Geographical Information Systems: A tool for planning. Australian Planner 36:216–222.
Staley, S. R. & Mildner, C. S. 1999. Urban-Growth Boundaries and Housing Affordability: Lessons from Portland.Reason Public Policy Institute October, 1999: http://www.rppi.org/urban/pb11.html.
Troughton, M. 1981 The Rural–Urban Fringe: A Challenge to Resource Management. In The Rural–UrbanFringe: Canadian Perspectives, K. Beesley and L. Russwarm, eds., pp. 218–243. Toronto: YorkUniversity Geographical Monographs No. 10.
USA Bureau of the Census, 2003. International Database. USA government, Washington DC., USA.
Varshney, P.K. 1997. Multisensor data fusion, Electron. Commun. Eng. J. 245–263.
Yockey, D.A. 1995. Image merging and data fusion by means of the discrete two-dimensional wavelettransform, Journal of Optical Society of America A 12 (9) () 1834–1841.
Zhou, J. et al., 1998. A wavelet transform method to merge Landsat TM and SPOT panchromatic data,International Journal of Remote Sensing 19 (4) : 743–757.