Embed Size (px)
DESCRIPTION
Extra-tropical flow regimes and connections with tropical rainfall i n the MINERVA experiments. Franco Molteni , Frederic Vitart , Tim Stockdale, Laura Ferranti (European Centre for Medium-Range Weather Forecasts, Reading, U.K.) Susanna Corti (ISAC-CNR, Italy) - PowerPoint PPT Presentation
Citation preview
Int. Conference on S2S Prediction, 10-13 Feb. 2014 1
Extra-tropical flow regimes
and connections with tropical rainfall
in the MINERVA experiments
Franco Molteni, Frederic Vitart, Tim Stockdale, Laura Ferranti
(European Centre for Medium-Range Weather Forecasts, Reading, U.K.)
Susanna Corti (ISAC-CNR, Italy)
Ben Cash, David Straus (COLA/George Mason Univ., USA)
Int. Conference on S2S Prediction, 10-13 Feb. 2014 2
The MINERVA experiments
MINERVA: a COLA-ECMWF project sponsored by the NCAR Accelerated Scientific Discovery programme: seasonal re-forecasts at T319, T639 (30yr, Nov+May IC) and T1279 (12yr, May IC) with IFS_cy38r1 + NEMO_v-3.1, run on NCAR Yellowstone HPC, 28M core-hours)
Outline of results:Predictive skill for NAO and PNA for seasonal (DJF) and month-2 (Dec) meansProbabilistic prediction of flow regime occurrence in the sub-seasonal range for the Atlantic and Pacific sectorsTeleconnections of Indo-Pacific rainfall and NH 500 hPa height: impact on NAO long-range predictions
Int. Conference on S2S Prediction, 10-13 Feb. 2014 3
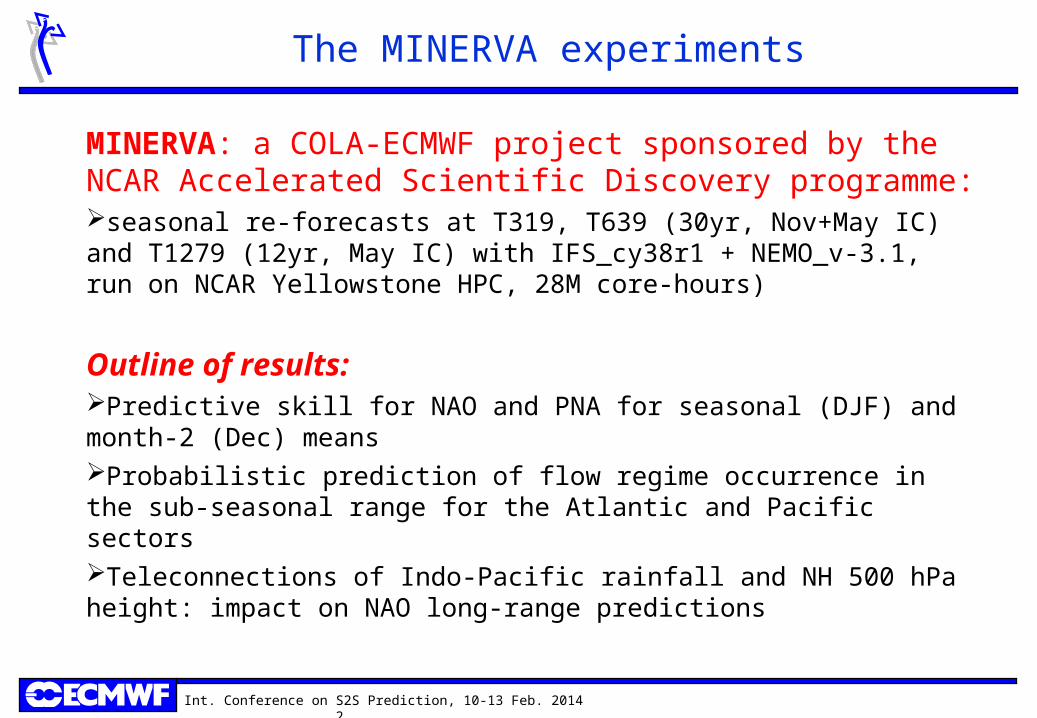
NAO, Dec (m2)
T319ac = 0.37
T639ac = 0.50
ERAEns mean
Ens members
Z 500Anomaly
index = 1 σ
Int. Conference on S2S Prediction, 10-13 Feb. 2014 4
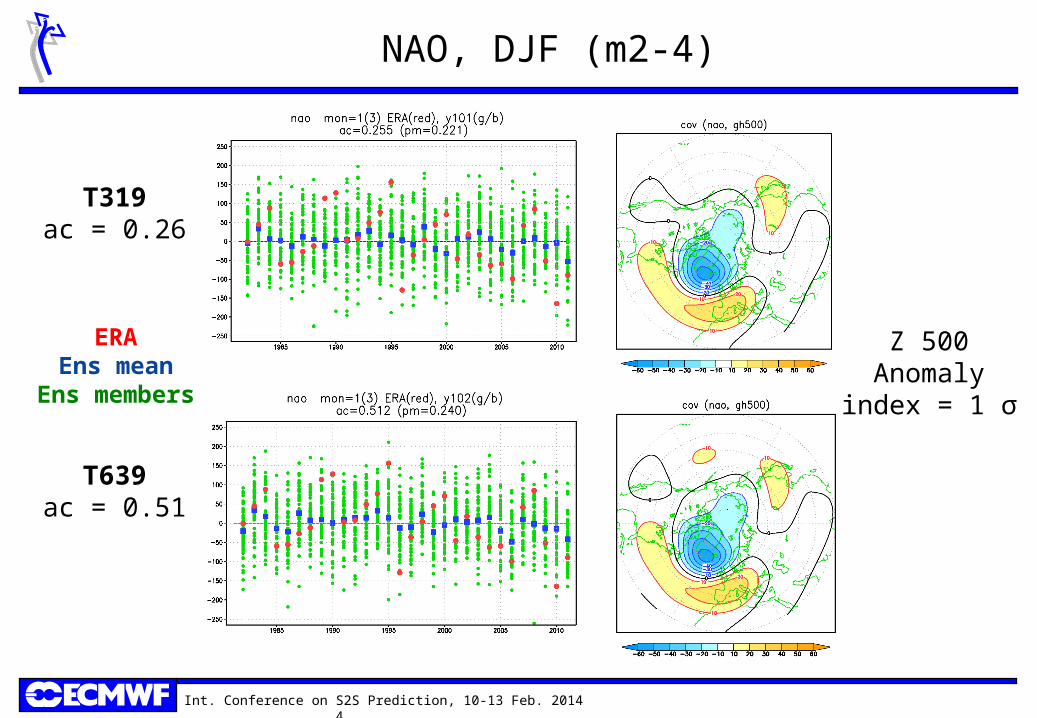
NAO, DJF (m2-4)
T319ac = 0.26
T639ac = 0.51
ERAEns mean
Ens members
Z 500Anomaly
index = 1 σ
Int. Conference on S2S Prediction, 10-13 Feb. 2014 5
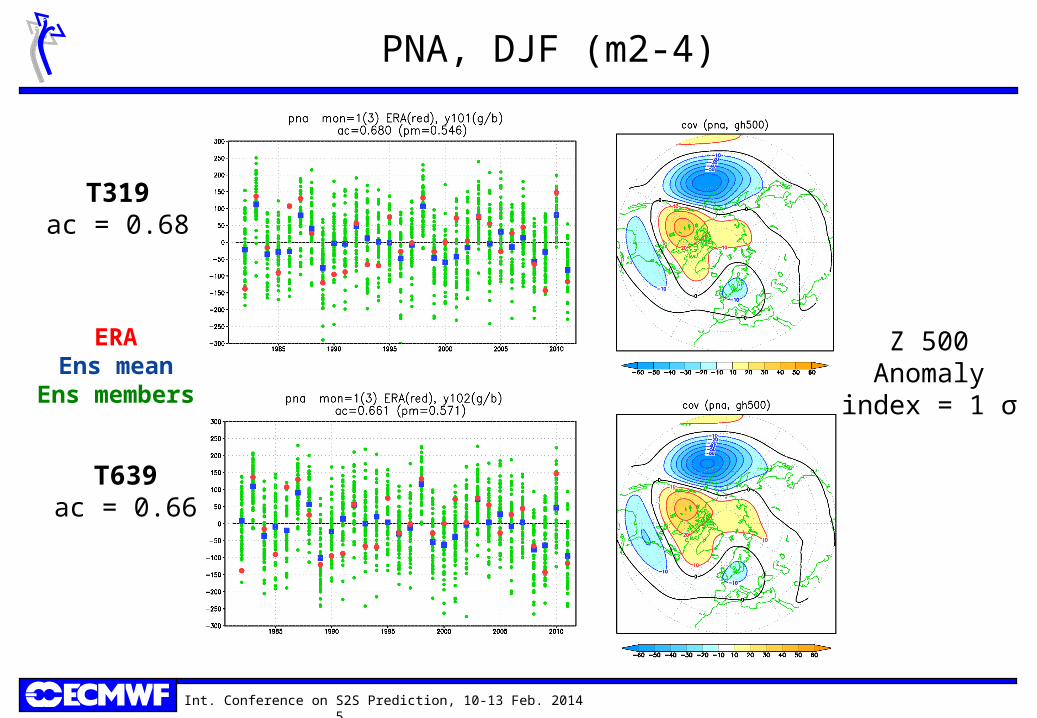
PNA, DJF (m2-4)
T319ac = 0.68
T639ac = 0.66
ERAEns mean
Ens members
Z 500Anomaly
index = 1 σ
Int. Conference on S2S Prediction, 10-13 Feb. 2014 7
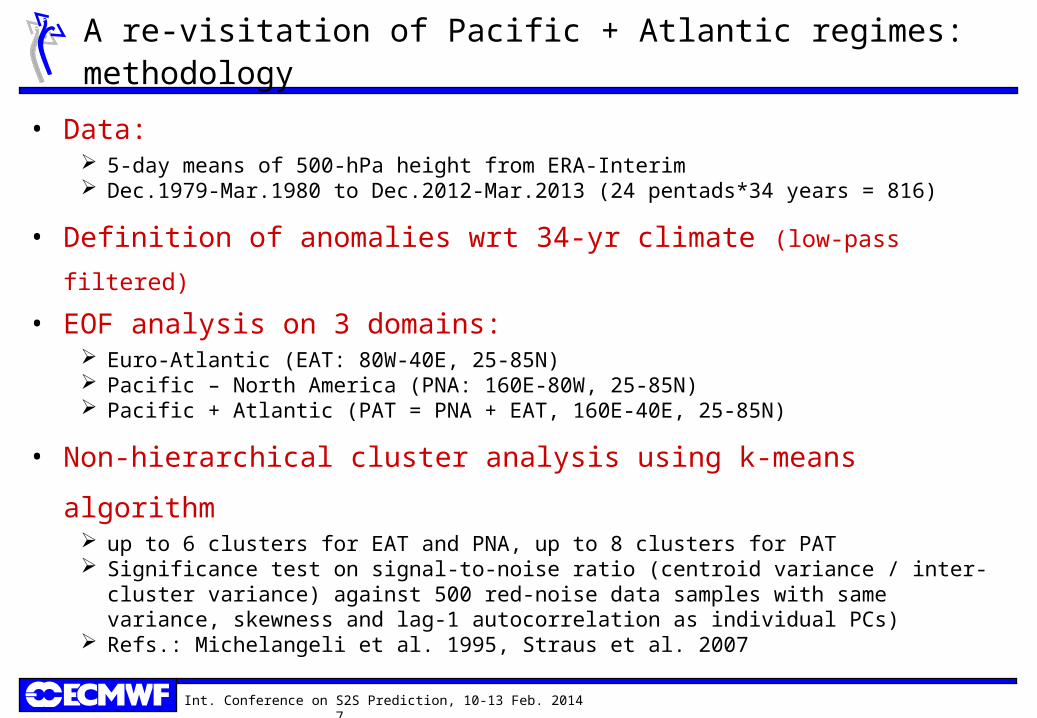
A re-visitation of Pacific + Atlantic regimes: methodology
• Data: 5-day means of 500-hPa height from ERA-Interim Dec.1979-Mar.1980 to Dec.2012-Mar.2013 (24 pentads*34 years = 816)
• Definition of anomalies wrt 34-yr climate (low-pass filtered)
• EOF analysis on 3 domains: Euro-Atlantic (EAT: 80W-40E, 25-85N) Pacific – North America (PNA: 160E-80W, 25-85N) Pacific + Atlantic (PAT = PNA + EAT, 160E-40E, 25-85N)
• Non-hierarchical cluster analysis using k-means algorithm up to 6 clusters for EAT and PNA, up to 8 clusters for PAT Significance test on signal-to-noise ratio (centroid variance / inter-cluster
variance) against 500 red-noise data samples with same variance, skewness and lag-1 autocorrelation as individual PCs)
Refs.: Michelangeli et al. 1995, Straus et al. 2007
Int. Conference on S2S Prediction, 10-13 Feb. 2014 9
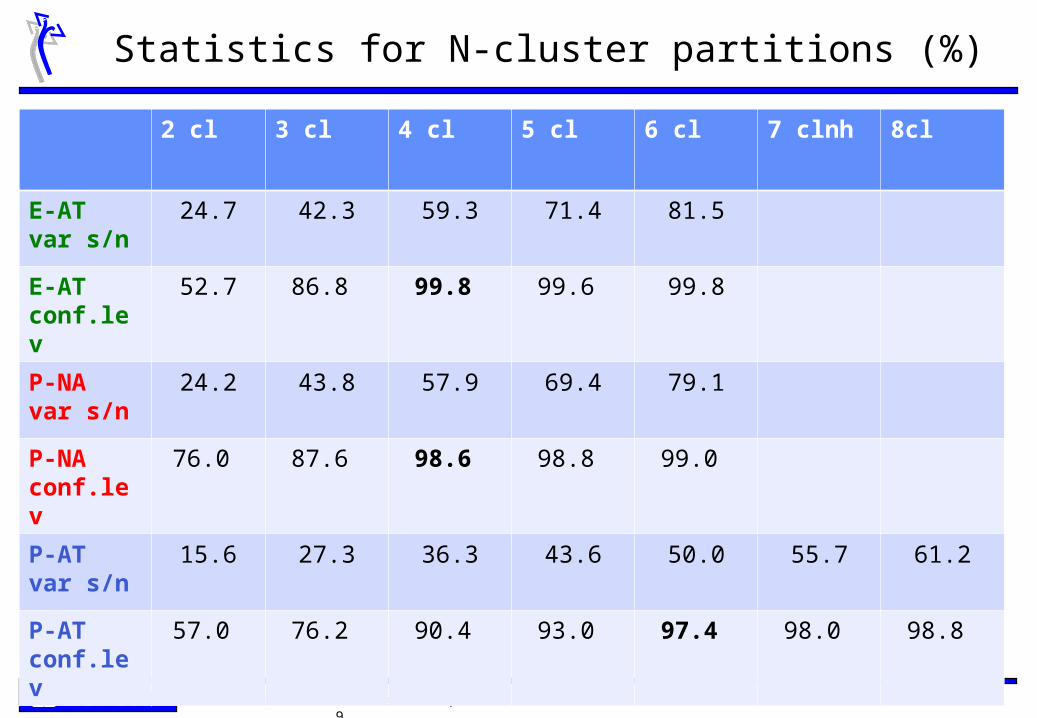
Statistics for N-cluster partitions (%)
2 cl 3 cl 4 cl 5 cl 6 cl 7 clnh 8cl
E-AT var s/n
24.7 42.3 59.3 71.4 81.5
E-AT conf.lev
52.7 86.8 99.8 99.6 99.8
P-NA var s/n
24.2 43.8 57.9 69.4 79.1
P-NA conf.lev
76.0 87.6 98.6 98.8 99.0
P-AT var s/n
15.6 27.3 36.3 43.6 50.0 55.7 61.2
P-AT conf.lev
57.0 76.2 90.4 93.0 97.4 98.0 98.8
Int. Conference on S2S Prediction, 10-13 Feb. 2014 10
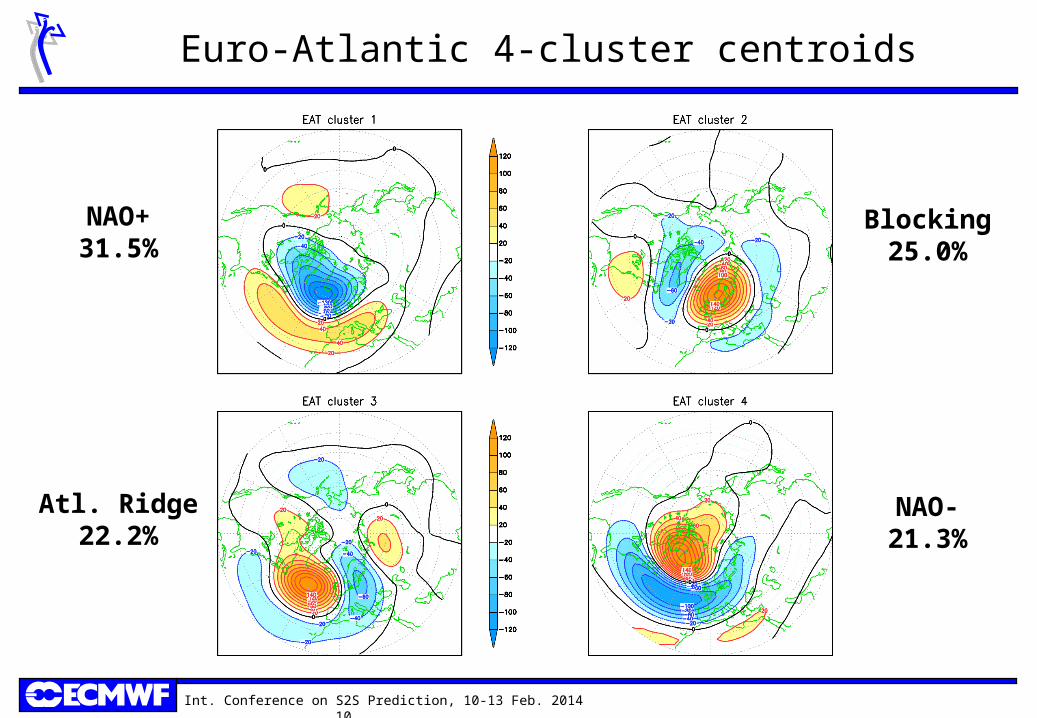
Euro-Atlantic 4-cluster centroids
NAO+31.5%
Atl. Ridge22.2%
Blocking25.0%
NAO-21.3%
Int. Conference on S2S Prediction, 10-13 Feb. 2014 11
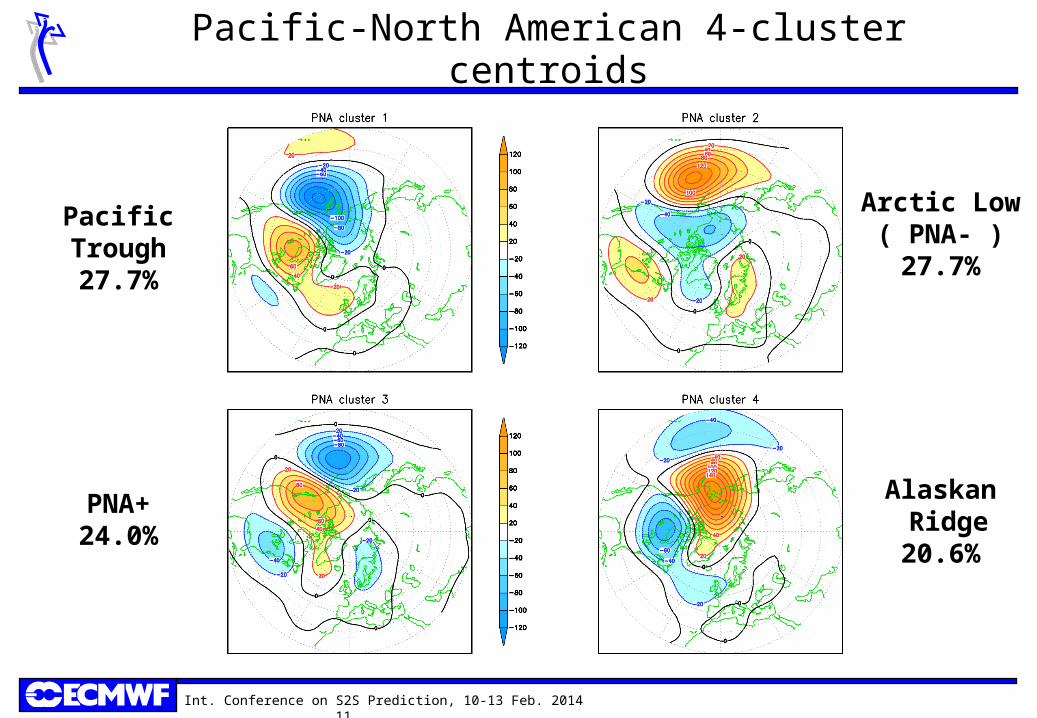
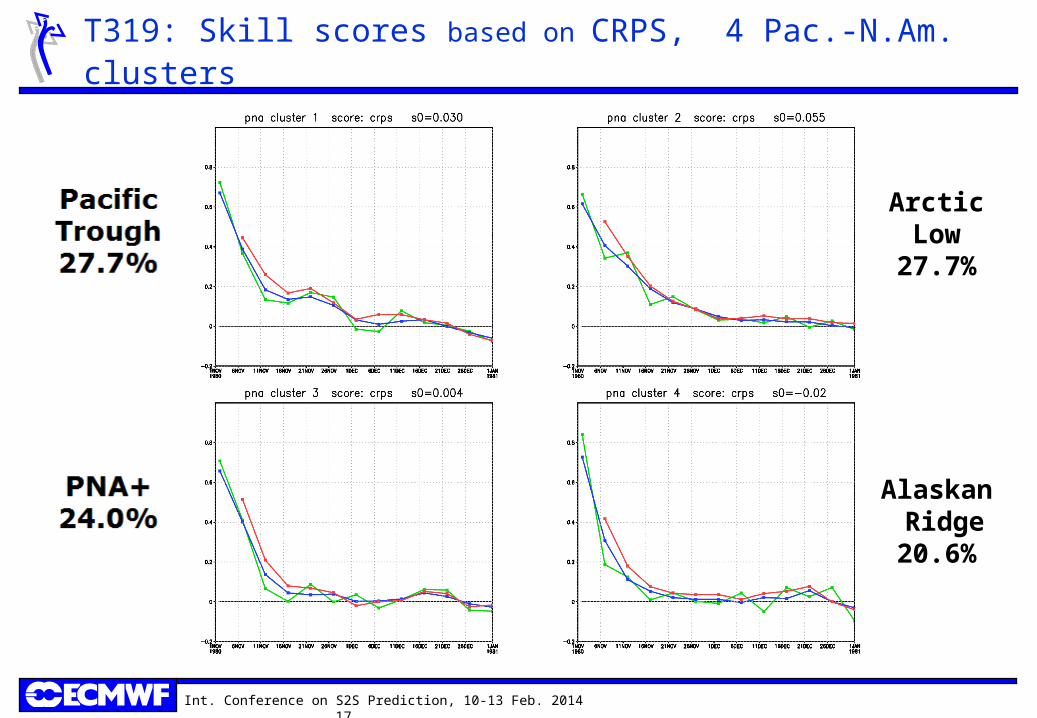
Pacific-North American 4-cluster centroids
PacificTrough27.7%
PNA+24.0%
Arctic Low( PNA- )27.7%
Alaskan Ridge20.6%
Int. Conference on S2S Prediction, 10-13 Feb. 2014 12
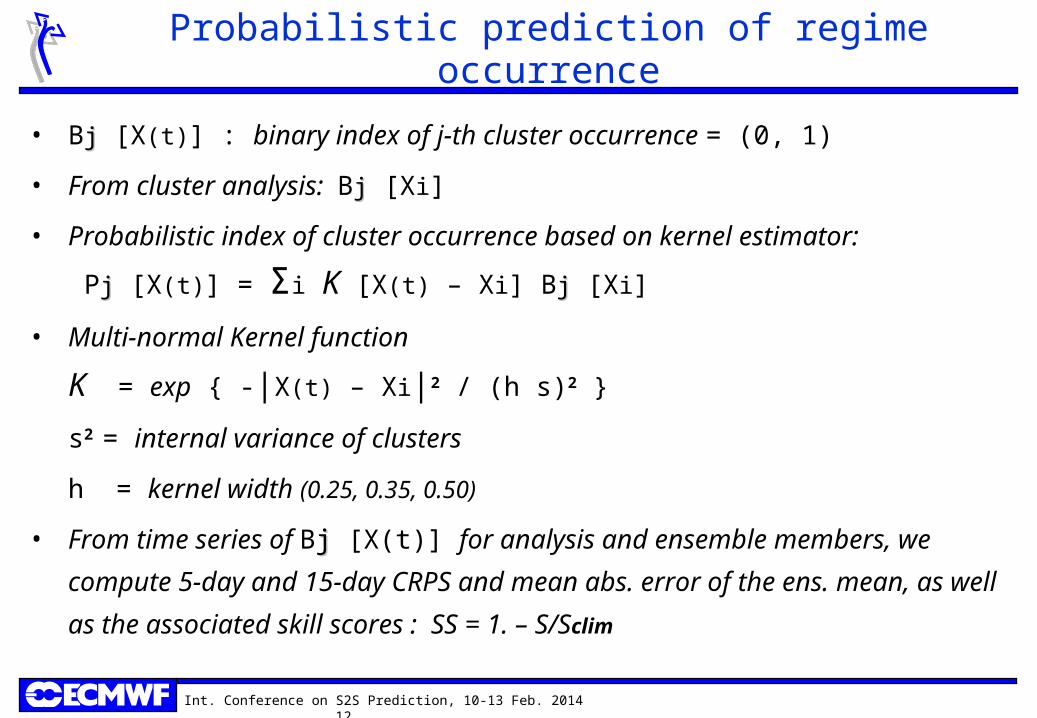
Probabilistic prediction of regime occurrence
• Bjj [X(t)] : binary index of j-th cluster occurrence = (0, 1)
• From cluster analysis: Bjj [Xi]
• Probabilistic index of cluster occurrence based on kernel estimator:
Pjj [X(t)] = Σi K [X(t) – Xi] Bjj [Xi]
• Multi-normal Kernel function
K = exp { -|X(t) – Xi|2 / (h s)2 }
s2 = internal variance of clusters
h = kernel width (0.25, 0.35, 0.50)
• From time series of Bjj [X(t)] for analysis and ensemble members, we
compute 5-day and 15-day CRPS and mean abs. error of the ens.
mean, as well as the associated skill scores : SS = 1. – S/Sclim
Int. Conference on S2S Prediction, 10-13 Feb. 2014 13
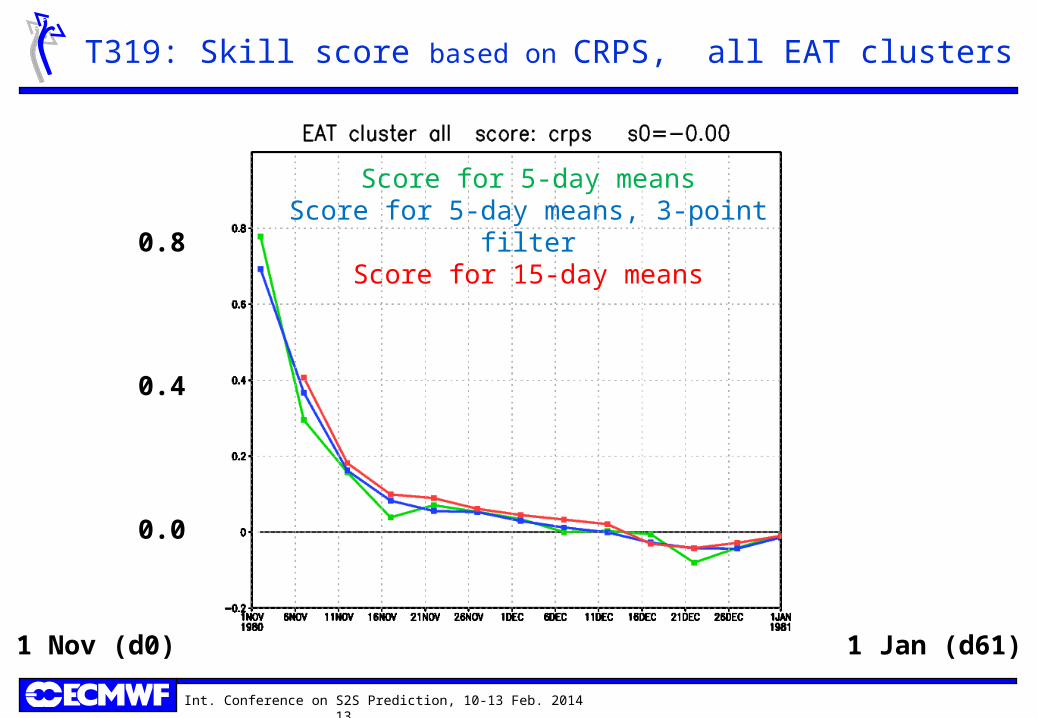
T319: Skill score based on CRPS, all EAT clusters
1 Nov (d0) 1 Jan (d61)
Score for 5-day meansScore for 5-day means, 3-point filter
Score for 15-day means0.8
0.4
0.0
Int. Conference on S2S Prediction, 10-13 Feb. 2014 14
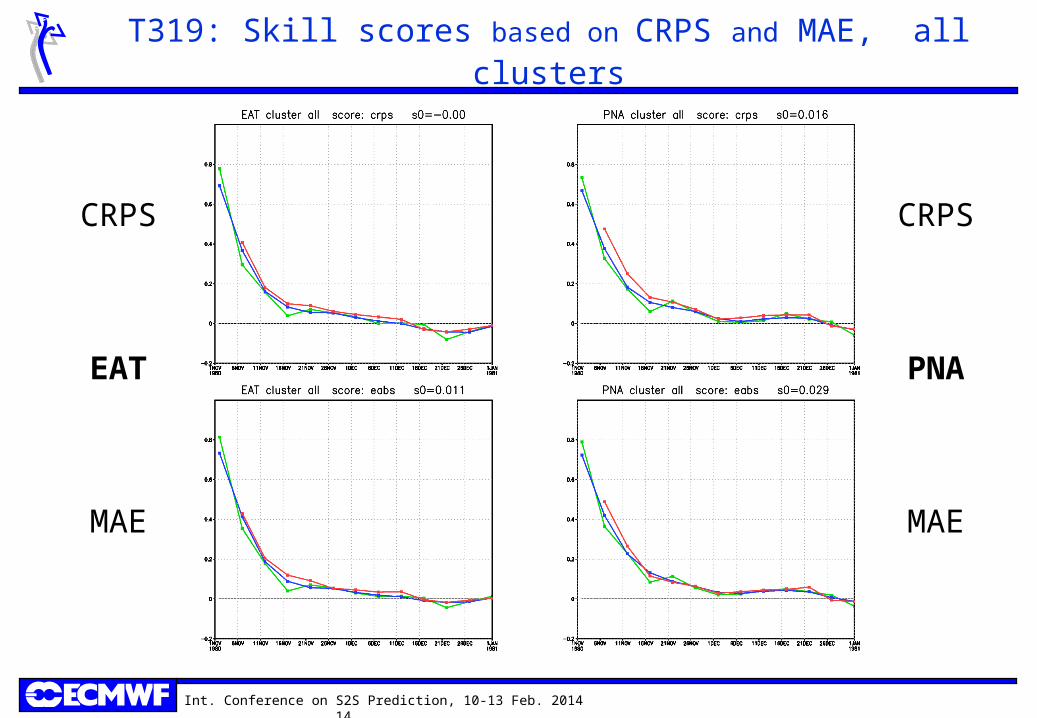
T319: Skill scores based on CRPS and MAE, all clusters
CRPS
EAT
MAE
CRPS
PNA
MAE
Int. Conference on S2S Prediction, 10-13 Feb. 2014 15
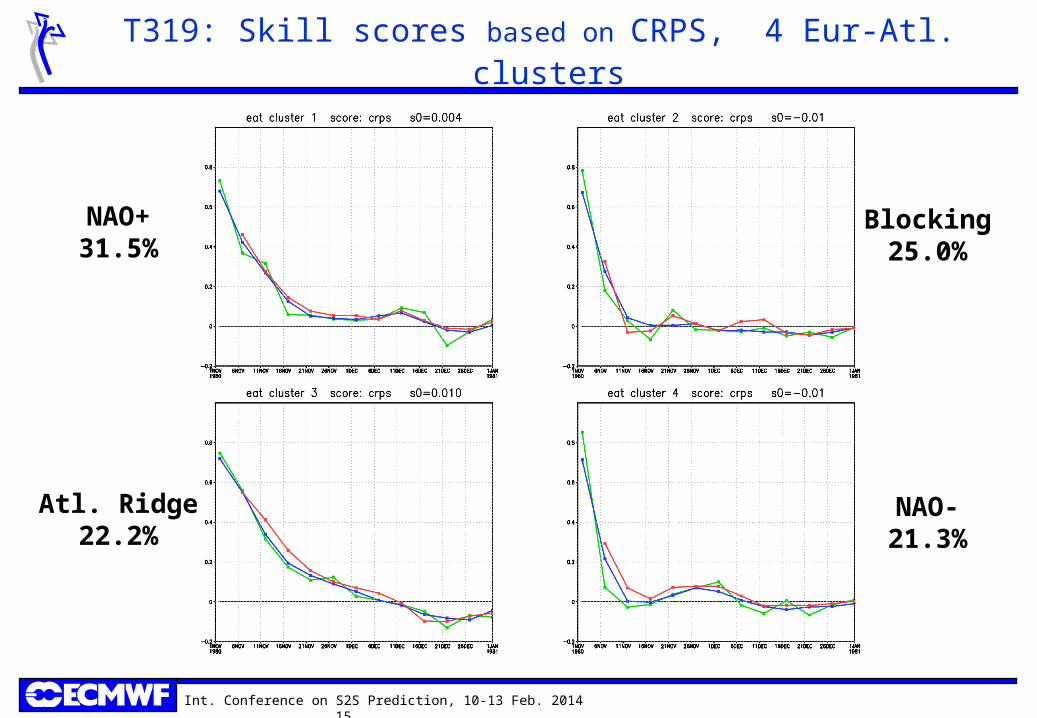
T319: Skill scores based on CRPS, 4 Eur-Atl. clusters
NAO+31.5%
Atl. Ridge22.2%
Blocking25.0%
NAO-21.3%
Int. Conference on S2S Prediction, 10-13 Feb. 2014 16
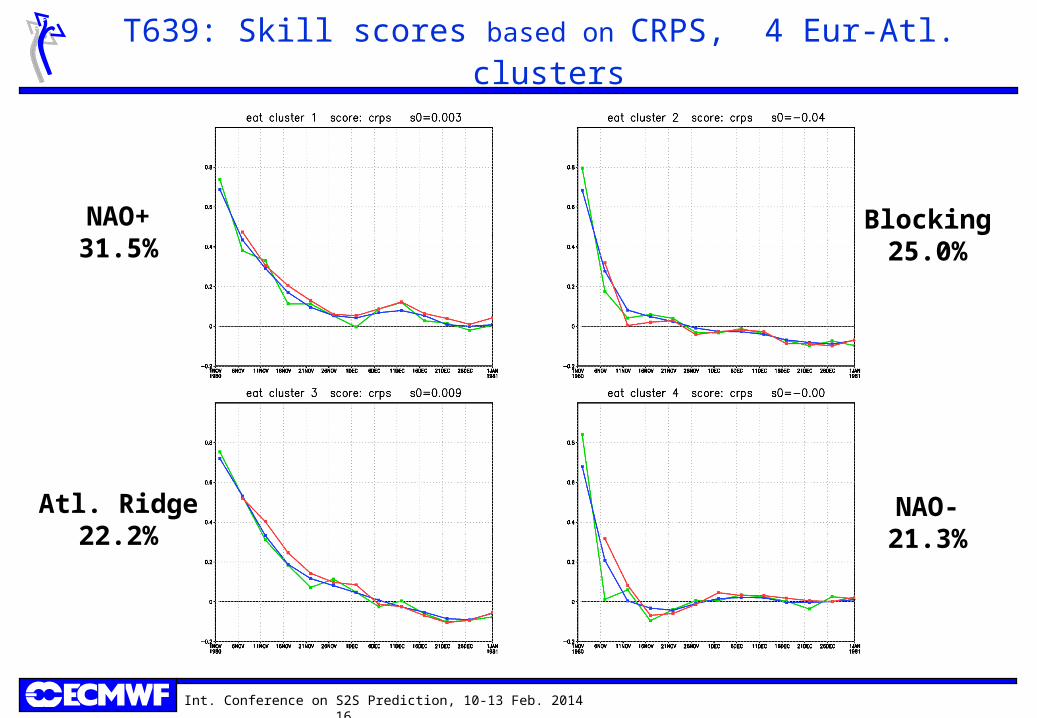
T639: Skill scores based on CRPS, 4 Eur-Atl. clusters
NAO+31.5%
Atl. Ridge22.2%
Blocking25.0%
NAO-21.3%
Int. Conference on S2S Prediction, 10-13 Feb. 2014 17
T319: Skill scores based on CRPS, 4 Pac.-N.Am. clusters
ArcticLow
27.7%
Alaskan Ridge20.6%
Int. Conference on S2S Prediction, 10-13 Feb. 2014 18
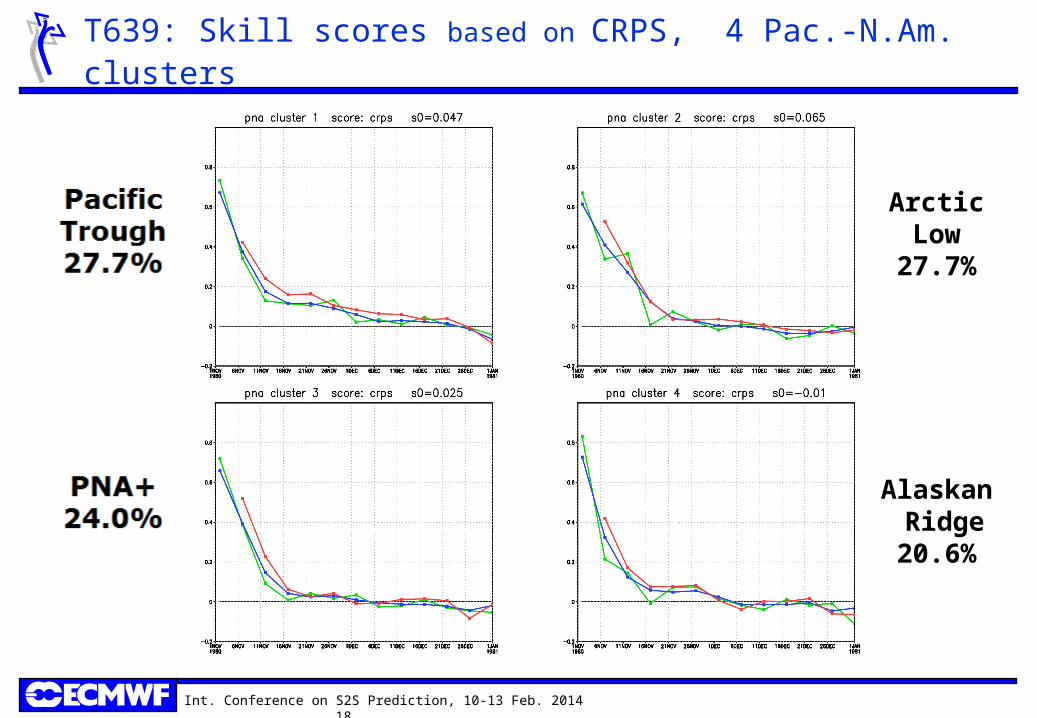
T639: Skill scores based on CRPS, 4 Pac.-N.Am. clusters
ArcticLow
27.7%
Alaskan Ridge20.6%
Int. Conference on S2S Prediction, 10-13 Feb. 2014 19
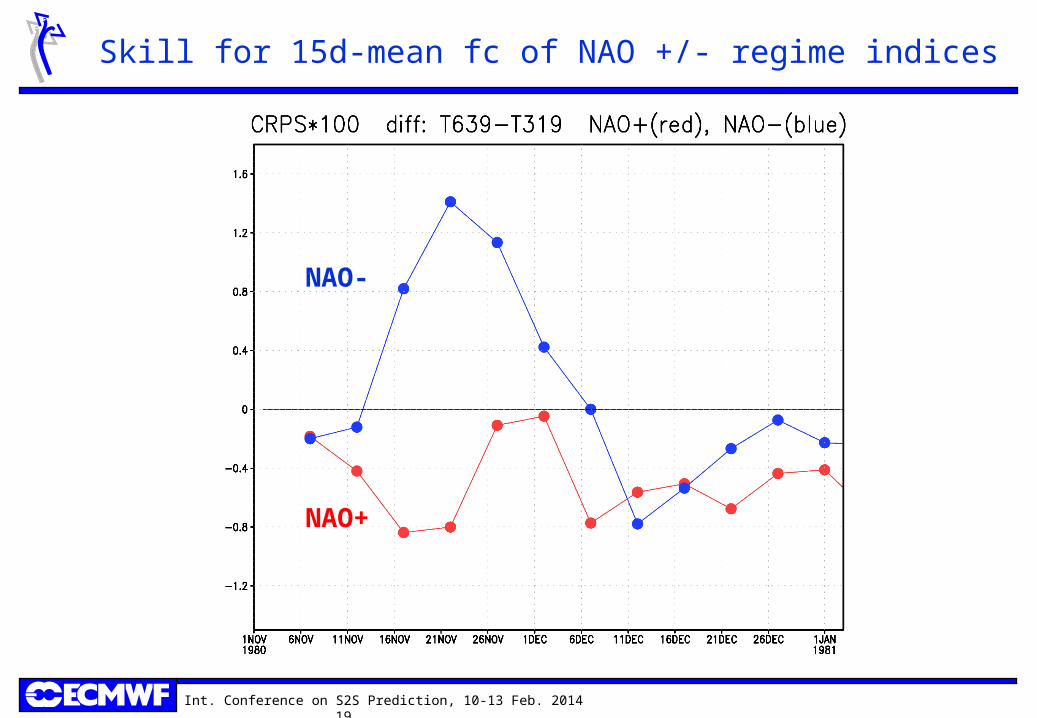
Skill for 15d-mean fc of NAO +/- regime indices
NAO+
NAO-
Int. Conference on S2S Prediction, 10-13 Feb. 2014 20
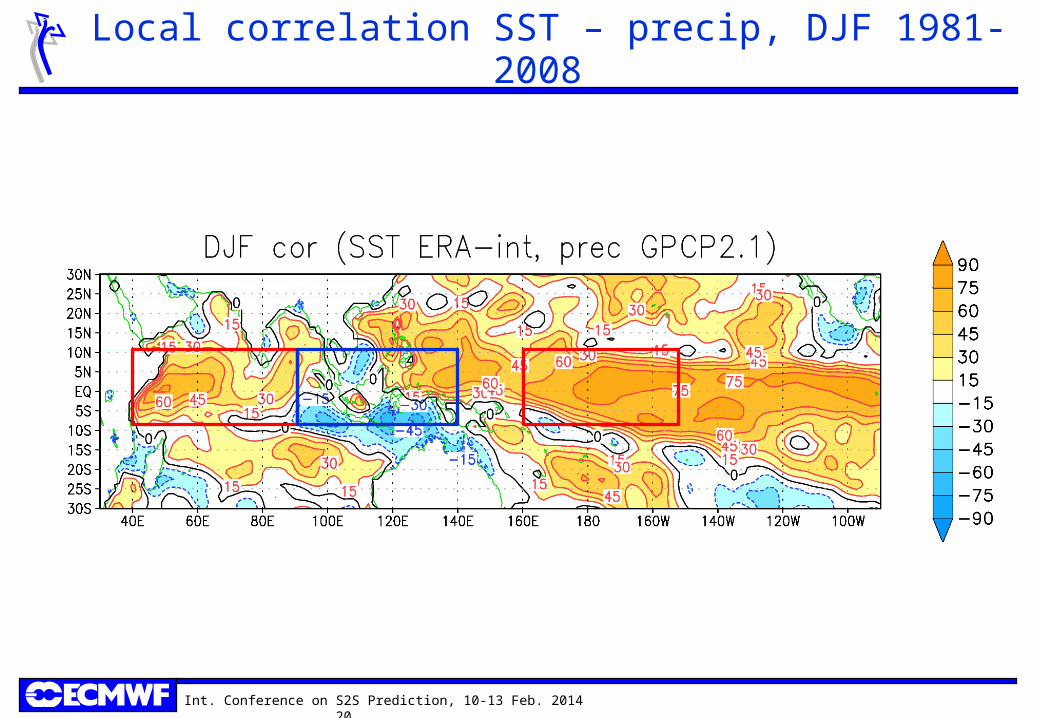
Local correlation SST – precip, DJF 1981-2008
Int. Conference on S2S Prediction, 10-13 Feb. 2014 21
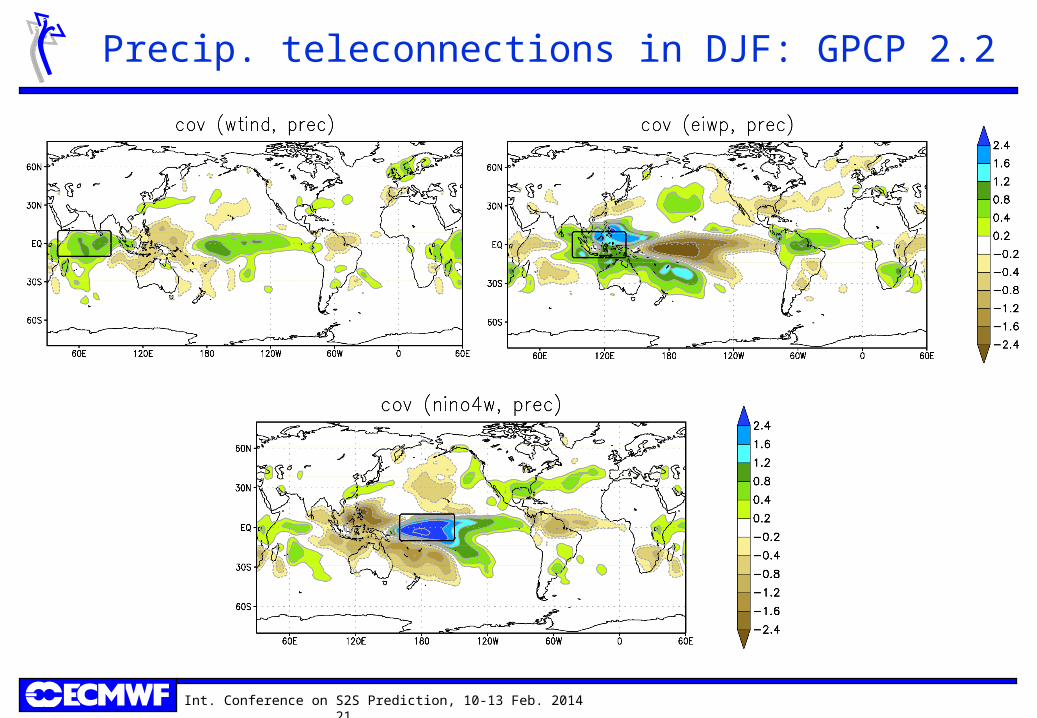
Precip. teleconnections in DJF: GPCP 2.2
Int. Conference on S2S Prediction, 10-13 Feb. 2014 22
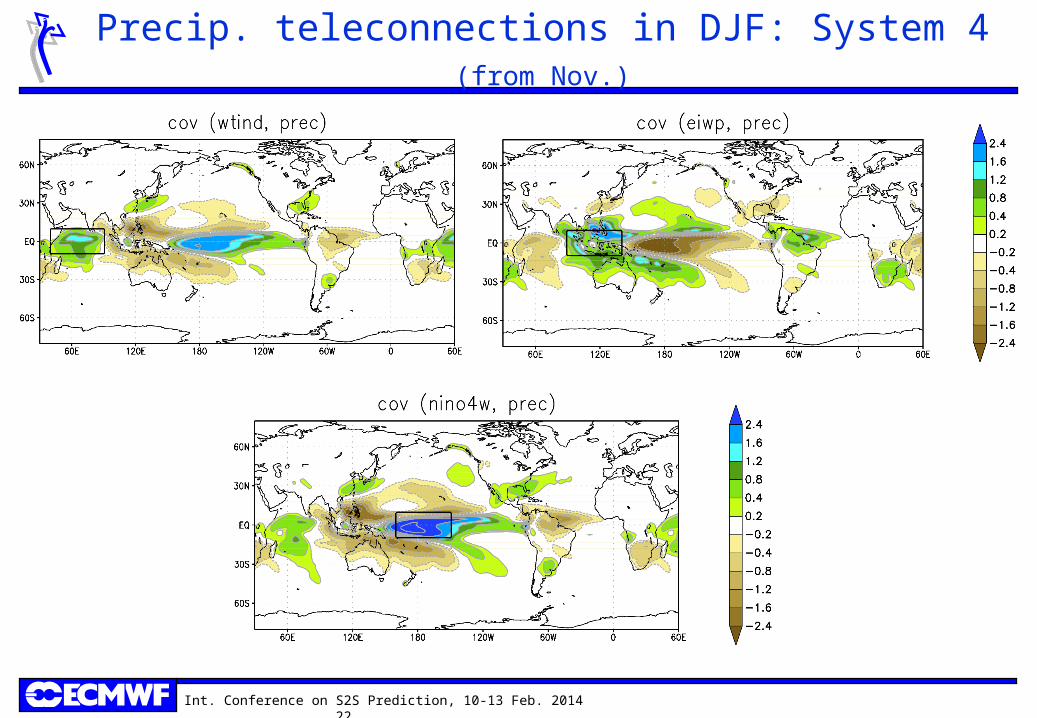
Precip. teleconnections in DJF: System 4 (from Nov.)
Int. Conference on S2S Prediction, 10-13 Feb. 2014 23
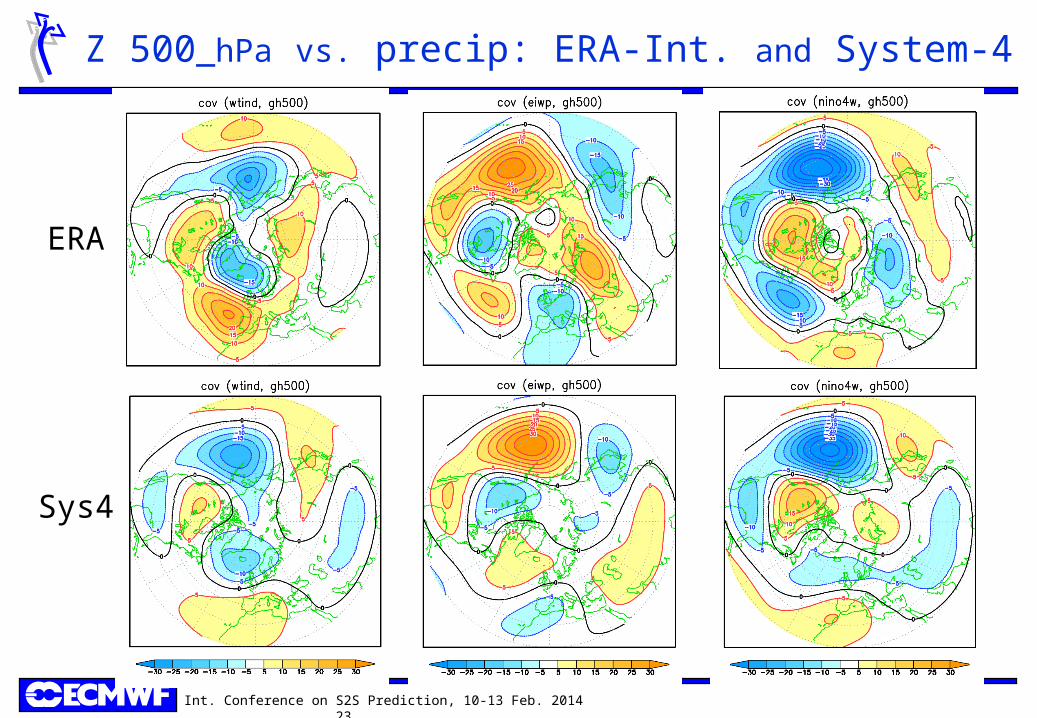
Z 500_hPa vs. precip: ERA-Int. and System-4
ERA
Sys4
Int. Conference on S2S Prediction, 10-13 Feb. 2014 24
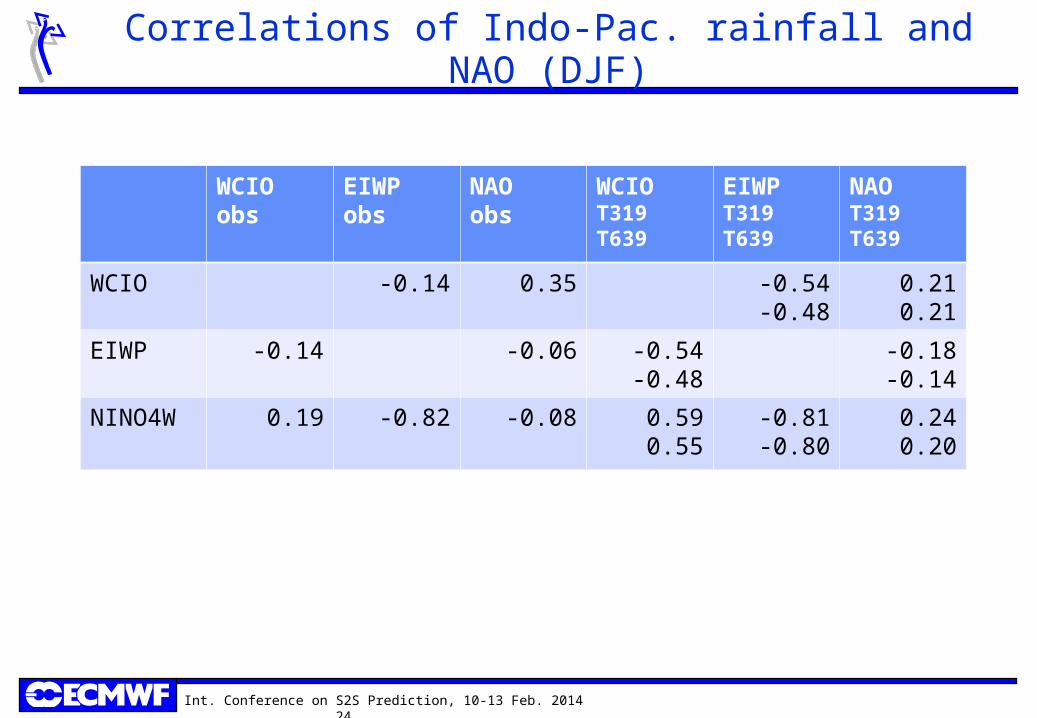
Correlations of Indo-Pac. rainfall and NAO (DJF)
WCIOobs
EIWPobs
NAOobs
WCIOT319T639
EIWPT319T639
NAOT319T639
WCIO -0.14 0.35 -0.54-0.48
0.210.21
EIWP -0.14 -0.06 -0.54-0.48
-0.18-0.14
NINO4W 0.19 -0.82 -0.08 0.590.55
-0.81-0.80
0.240.20
Int. Conference on S2S Prediction, 10-13 Feb. 2014 25
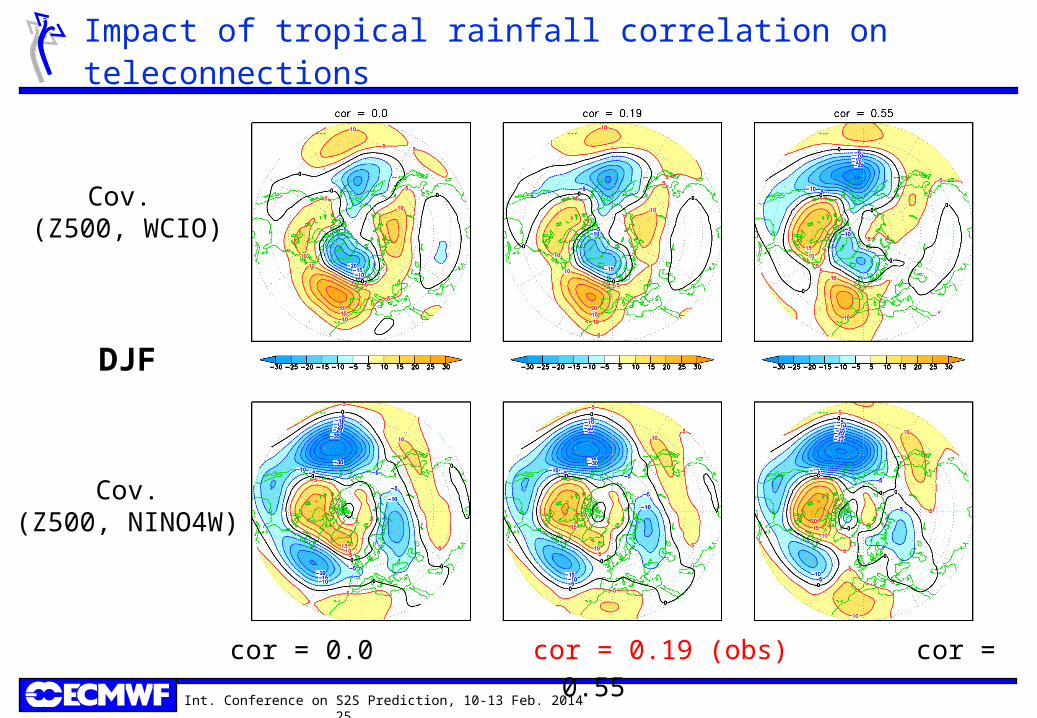
Impact of tropical rainfall correlation on teleconnections
Cov. (Z500, WCIO)
DJF
Cov.(Z500, NINO4W)
cor = 0.0 cor = 0.19 (obs) cor = 0.55
Int. Conference on S2S Prediction, 10-13 Feb. 2014 26
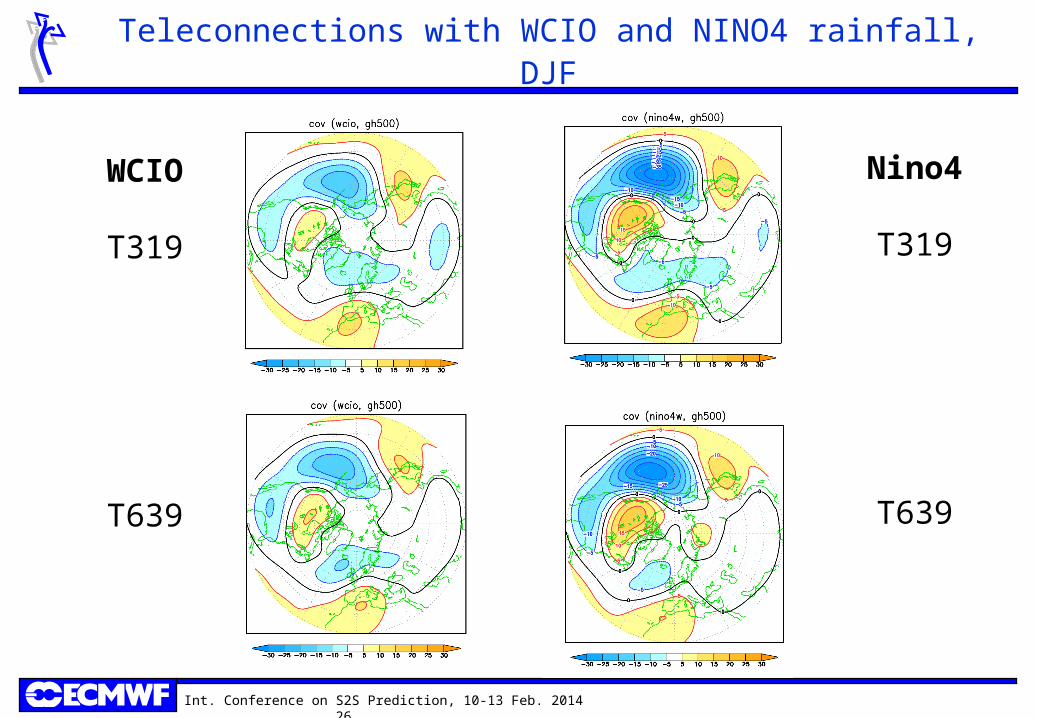
Teleconnections with WCIO and NINO4 rainfall, DJF
WCIO
T319
T639
Nino4
T319
T639
Int. Conference on S2S Prediction, 10-13 Feb. 2014 27
Summary
On seasonal timescale, T639 has the same predictive skill as T319 for PNA, but a (notably) higher skill for NAO; the NAO skill improvement is also seen in month-2 means.
On the sub-seasonal scale, considerable difference in predictive skill are found for different flow regimes. In the Euro-Atlantic sector, the NAO+ and Atlantic Ridge regimes are more predictable than NAO- and Blocking.
T639 shows a better skill than T319 in predicting the NAO+ regime occurrence, while skill for NAO- shows a stronger drop at day 20~30
For Indo-Pacific rainfall, the MINERVA runs (as Sys-4) show stronger links between rainfall over the Western Indian Ocean and over the Maritime Continents / Central Pacific than those found in GPCP data. As a result, extratropical teleconnection patterns from these three tropical regions look more similar than in observations, and the NAO – Indian Ocean rainfall connection is underestimated. This problem is alleviated in T639 wrt T319, but only by 10~15%.