Embed Size (px)
Citation preview
Dis cus si on Paper No. 17-064
External Financing Constraints and Firm’s Innovative Activities During
the Financial CrisisMarek Giebel and Kornelius Kraft
Dis cus si on Paper No. 17-064
External Financing Constraints and Firm’s Innovative Activities During
the Financial CrisisMarek Giebel and Kornelius Kraft
Download this ZEW Discussion Paper from our ftp server:
http://ftp.zew.de/pub/zew-docs/dp/dp17064.pdf
Die Dis cus si on Pape rs die nen einer mög lichst schnel len Ver brei tung von neue ren For schungs arbei ten des ZEW. Die Bei trä ge lie gen in allei ni ger Ver ant wor tung
der Auto ren und stel len nicht not wen di ger wei se die Mei nung des ZEW dar.
Dis cus si on Papers are inten ded to make results of ZEW research prompt ly avai la ble to other eco no mists in order to encou ra ge dis cus si on and sug gesti ons for revi si ons. The aut hors are sole ly
respon si ble for the con tents which do not neces sa ri ly repre sent the opi ni on of the ZEW.
1
External financing constraints and firm’s innovative activities during the financial crisis
by
Marek Giebela and Kornelius Kraftb
October 2017
Abstract
We investigate the effect of individual banks’ liquidity shocks during the recent financial crisis of
2008/2009 on the innovation activities of their business customers. Individual banks’ liquidity
shocks are identified by the degree of interbank market usage. We use a difference-in-differences
approach to identify the effect of interbank reliance during the crisis on total innovation
expenditures in comparison to the periods before. Our results imply that those firms which have a
business relation to a bank with higher interbank market reliance reduce their innovation
activities during the financial crisis to a higher degree than other firms.
JEL Codes: G01, G21, G30, O16, O30, O31
Keywords: Financial crisis, financial constraints of banks, financing of innovation, innovation
activity
a Corresponding author at: TU Dortmund University, Faculty of Business, Economics and Social Sciences, Vogelpothsweg 87, D-44227 Dortmund, [email protected] b TU Dortmund, Faculty of Business, Economics and Social Sciences, Vogelpothsweg 87, D-44227 Dortmund, ZEW Mannheim, IZA Bonn and KU Leuven, Belgium, [email protected]
2
1. Introduction
It is well known that innovation activity is a major determinant of technological progress and of
growth of an economy (Aghion and Howitt 2009; Grossman and Helpman 1994; Solow 1957).
At least since Schumpeter (1911) it is also widely recognized that technological progress and
economic growth is associated with the availability of financial resources, and this is not an easy
relationship if external financing is considered. Asymmetric information problems like adverse
selection and moral hazard cause external financing constraints (Hall 2002). These constraints
seriously hamper innovation activities and, consequently, technological progress and growth (e.g.
Hall 2002).
The collapse of Lehman Brothers in late 2008 marked the peak in tension on the financial
markets during the financial crisis of 2008/2009. After the Lehman bankruptcy, interbank market
conditions worsened drastically, with the volume traded on this market reduced and this in turn
leading to lower bank lending to the corporate sector (e.g. Ivashina and Scharfstein 2010; Iyer et
al. 2014). It has been shown that these lending constraints were transmitted to the real sector, and
led to reduced corporate investments and employment (e.g. Campello et al. 2010; Chodorow-
Reich 2013; Cingano et al. 2016). In contrast to capital and employment effects, causal evidence
on the interaction between the bank system and innovation at firm level during the financial crisis
does not exist.1
The purpose of the paper is to fill this gap by investigating the effects of the financial crisis on
innovation activity. Our approach relies on the financial crisis as an unexpected, exogenous and
drastic distortion of financial markets, which had serious consequences for the lending behavior
of banks. We use the fact that the collapse of the interbank market led to lending reductions and
in consequence to reductions in real outcomes like capital expenditures (e.g. Cingano et al. 2016).
Thus, in order to facilitate identification of the consequences of the crisis, we utilize as a cross-
sectional dimension the interbank reliance of banks and then estimate the impact of this relative
engagement on their corporate customers’ innovative activities within a difference-in-differences
context.
1 To our knowledge there exists literature investigating the effect of specific firm characteristics on innovation activity in the financial crisis (e.g. Amore 2015; Archibugi et al. 2013a & 2013b; Campello et al. 2010; Filippetti and Archibugi 2011; Paunov 2012).

3
Our main data source is the Mannheim Innovation Panel (MIP), a survey of innovative firms
conducted by the Center for European Economic Research (ZEW Mannheim, Germany). The
MIP allows us to identify the main bank of each firm. This offers the opportunity to match the
firm data on innovation with information on banks obtained from the Bankscope database
compiled by Bureau van Dijk. Using this rich balance sheet data set, an informative indicator for
every individual bank’s reliance on interbank market transactions before the crisis is computed.
Next, the data on the refinancing structure of individual banks is matched with information on
their corporate customers.
Our difference-in-differences estimates imply that it is indeed more likely that innovation
expenditures will be reduced during the crisis due to financing constraints if the firm’s bank relies
heavily on the interbank market. Moreover, decomposition of total innovation expenditures
shows that the effect is stronger on investments in innovation than for current innovation
expenditures. We also test for the effect on R&D, with similar results. Next, we investigate the
impact of the crisis on marketing expenditures as an activity largely unrelated to technical
progress, much less connected with uncertainty than innovation and a regular firm activity. Here
we find no effect of banks’ reliance on the interbank market.
Our study is structured as follows. In Section 2 we discuss both the institutional and the
theoretical background. Section 3 explains the relationship between the financial crisis and the
real economy2. In the next section data, methodology and results for the test concerning financial
constraints of banks and the relation to financing problems of innovative activities are presented
and discussed. The fifth and last section comprises our conclusion.
2. Related Literature
2.1 External innovation financing
It is generally acknowledged that R&D investment differs from investment in normal assets (Hall
2002). This is rooted in the nature of R&D expenditures, which provide low collateral, are
usually sunk and uncertain with respect to outcome and market success (Hall 2002). Among
others, Himmelberg and Petersen (1994) as well as Czarnitzki and Hottenrott (2011b) show that
2 Real economy comprises the part of the economy (e.g. firms) that has the objective of producing goods and services rather than financial services (e.g. banks).
4
internal means are more important for R&D investment than for ordinary investments. These and
other studies (e.g. Bond et al. 2005; Brown et al. 2012; Harhoff 1998; Hottenrott and Peters
2012) demonstrate that internal financing constraints have a negative effect on R&D spending.
Originating in asymmetric information between investors and inventors, financing of R&D has
aspects of Akerlof’s (1970) market for lemons and is characterized by high “lemon premia” (Hall
and Lerner 2010). Likewise, it is more difficult to obtain external finance for R&D investments
than for other investments (Hall and Lerner 2010). Using a credit rating index as proxy for access
to external finance, Czarnitzki and Hottenrott (2011a, 2011b) show that external financing
matters for R&D expenditure.3 In addition, empirical studies like Freel (2007) and Mina et al.
(2013) investigate the relationship between innovativeness and access to external finance. They
emphasize that accessing external financing is indeed more difficult for highly innovative firms.
As stated above, essential for our empirical study is an indicator for individual bank liquidity
shocks. Therefore, our work is related to the strand of literature which investigates in several
different ways the importance of bank financing for firms’ innovative activity (e.g. Alessandrini
et al. 2010; Amore et al. 2013; Ayyagari et al. 2011; Benfratello et al. 2008; Chava et al. 2013;
Cornaggia et al. 2015; Hsu et al. 2014). Among these, Amore et al. (2013), Chava et al. (2013)
and Cornaggia et al. (2015) show that banking deregulation in the U.S. had effects on the
innovative activity of firms. Considering bank development in Italy, Benfratello et al. (2008) find
a strong and robust effect on process innovation but a weaker one for product innovation. Finally,
Alessandrini et al. (2010) show empirically that a bank system that is functionally more distant4
from the local economy hampers innovation. These studies support the notion that external
finance is of relevance for innovation.
2.2 Innovation expenditures during economic downturns
The empirical research on the issue of how firms adjust their innovation investments in economic
downturns is ambiguous. There is evidence that R&D expenditures might be counter-cyclical
without credit constraints (e.g. Aghion et al. 2012). Conversely, financing constraints, as
explained above, lead to a pro-cyclical behavior of innovation activities (e.g. Barlevy 2007). In 3 Czarnitzki and Toole (2011) find no significant influence. 4 “Functional distance is computed as the number of branches operating in a province j, each weighted by the logarithm of one plus the kilometric distance between the capital of that province and the capitals of provinces where parent banks are headquartered“ Alessandrini et al. (2010, 6).
5
addition, several studies (e.g. Aghion et al. 2012; López-García et al. 2013; Männasoo and
Meriküll 2014; Ouyang 2011) take access to external finance into account. They find that a lack
of access to external finance is a major reason for a pro-cyclical behavior of R&D investments if
internal resources are scarce.
Another example, highly related to our work, is Nanda and Nicholas (2014), who investigate the
effect of bank distress during the great recession on innovation. They use the share of bank
suspensions5 to total banks as a measure for county-level bank distress. Applying the indicator in
a difference-in-differences context, their results imply that higher distress indeed leads to lower
firm-level innovation.
3. External innovation financing and the recent financial crisis
We use the effect of the financial crisis as a period of strong disruptions within the financial
sector as well as severe problems of the real economy. In such periods spillovers from
disturbances from the financial sector to the real economy are more easily identified than in
“normal” times. Moreover, identifying to what extent individual banks are affected by the crisis
and thus the addition of a cross-sectional differentiation between the suppliers of debts is
particularly helpful for measuring the effects on innovation activity. Following the argumentation
of Nanda and Nicholas (2014), this impact on innovation works directly if innovation activity is
financed by bank loans. Or it has an indirect effect if the firm has in general a weak access to
external funding and reallocates internal resources from innovation projects to other, more
important activities.
The German banking structure is based on the “Three-Pillar-Banking-System”. Thus, in
principle, three kinds of banks can be distinguished: private, cooperative and publicly owned
savings banks. Both the cooperative and the public savings banks concentrate on the regional
markets where they are located and mostly abstain from investment in international assets.6
Moreover their own financing is largely but not solely based on deposits. Deposits do usually not
5 According to Nanda and Nicholas (2014), suspended banks are different from failed banks because they “could subsequently re- open” (Nanda and Nicholas 2014, 278). 6 Both pillars mentioned are two-tier systems themselves. Besides regional savings banks in the public banks pillar, Landesbanken serve as central institutions and are responsible for capital market transactions and refinancing at wholesale funding markets. The same holds for the cooperative bank pillar, where cooperative central banks also exist with functions similar to Landesbanken.
6
fluctuate much and during the financial crisis they remained fairly stable (e.g. Cornett et al.
2011). Private banks pursue a quite different business model as they are engaged in international
investment and source liquidity to a significant degree by other resources than core deposits.
Following the description in Bräuning and Fecht (2016), there are two markets for bank liquidity
in the Eurozone. First, the primary market, in which banks borrow money from the European
Central Bank against collateral through open market operations (Bräuning and Fecht 2016).
Second, the interbank market which plays a crucial role in the financial system by redistributing
liquid assets among banks. Both banks with a surplus of liquid assets and those with a lack of
liquidity use the interbank market to exchange financial resources by secured or unsecured
lending. As argued in Bräuning and Fecht (2016), unsecured lending is preferred in normal times
since there is no need for costly collateral and interest rates.
Consequently, a shock in the banking system that affects the interbank market negatively leads to
severe consequences with respect to liquidity provision and cost of funds. If there is no
immediate possibility to compensate the deficit by other sources of financing, banks more likely
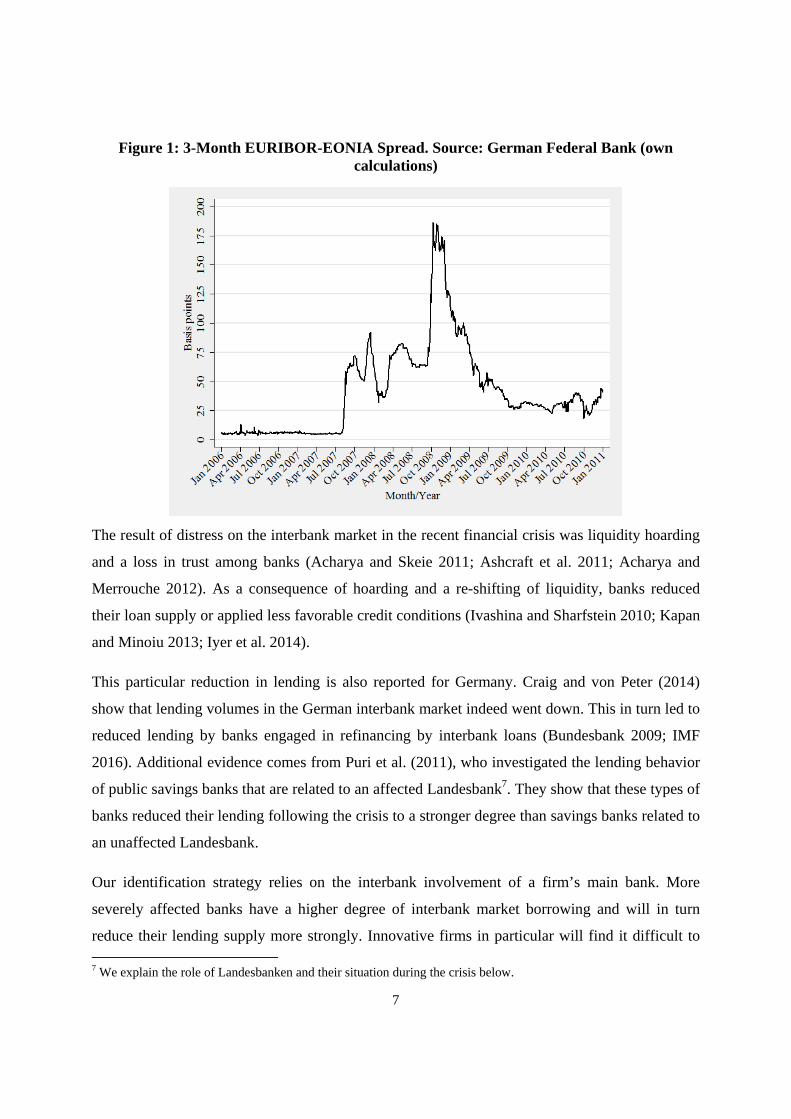
use liquidity for internal purposes than for loan supply (e.g. Cornett et al. 2011). Strains on the
interbank market are exemplified by the spread between the European interbank interest rate and
the overnight risk-free swap rate. The difference between the 3-month Euro InterBank Offered
Rate (EURIBOR) and the 3-month Euro OverNight Index Average (EONIA) rates are shown in
Figure 1. The emerging tensions on the interbank market in mid-2007 are reflected in the rise of
the EURIBOR-EONIA spread. The spread reached its height in October 2008, immediately after
the collapse of Lehman Brothers. Thus, following the insolvency of the Lehman Brothers bank in
September 2008, the interbank market almost dried up.
7
Figure 1: 3-Month EURIBOR-EONIA Spread. Source: German Federal Bank (own calculations)
The result of distress on the interbank market in the recent financial crisis was liquidity hoarding
and a loss in trust among banks (Acharya and Skeie 2011; Ashcraft et al. 2011; Acharya and
Merrouche 2012). As a consequence of hoarding and a re-shifting of liquidity, banks reduced
their loan supply or applied less favorable credit conditions (Ivashina and Sharfstein 2010; Kapan
and Minoiu 2013; Iyer et al. 2014).
This particular reduction in lending is also reported for Germany. Craig and von Peter (2014)
show that lending volumes in the German interbank market indeed went down. This in turn led to
reduced lending by banks engaged in refinancing by interbank loans (Bundesbank 2009; IMF
2016). Additional evidence comes from Puri et al. (2011), who investigated the lending behavior
of public savings banks that are related to an affected Landesbank7. They show that these types of
banks reduced their lending following the crisis to a stronger degree than savings banks related to
an unaffected Landesbank.
Our identification strategy relies on the interbank involvement of a firm’s main bank. More
severely affected banks have a higher degree of interbank market borrowing and will in turn
reduce their lending supply more strongly. Innovative firms in particular will find it difficult to 7 We explain the role of Landesbanken and their situation during the crisis below.
8
obtain external finance if financial markets are under stress (Lee et al. 2015; North et al. 2013).8
Firms might try to find substitutes like equity financing (Kahle and Stulz 2013), but this will with
all likelihood be rather difficult during such a major turmoil on the financial markets.
4. Test for changes of innovation expenditures
4.1 Data and Methodology
Our sample of 2187 non-financial firms9 ranges from 2005 to 2010. We are able to identify the
individual banks with which firms have commercial relations.10 Information available on the
individual firm level is matched with data on their banks with respect to interbank borrowing. All
data on banks originates from the Bankscope database, which is compiled by Bureau van Dijk.
All information on the firms is based on the Mannheim Innovation Panel (MIP), which represents
the German section of the European CIS Survey. This matching affords us the opportunity to
identify the possible mechanism of how shocks incurred by banks were transmitted to their
clients.11
We use total innovation expenditures ‘Total innovation expenditures’ as outcome variable to
investigate the effect of the degree of bank stress on corporate innovation activity. Total
innovation expenditures are quite broadly defined and the MIP characterizes total innovation
expenditures as expenditures for (internal) R&D, expenditures for acquisition of external
knowledge (licenses, external R&D), expenditures for product design and production preparation
related to innovation, expenditures for market tests and market introductions, retraining of
personnel, additional investment and material for the purpose of innovation.
Using this information we are able to decompose total innovation expenditures into investment
for innovation projects ‘Investment for innovation projects’ and current innovation expenditures
‘Current innovation expenditures’. Investment into innovation projects covers expenditures for
8 Among others Freel (2007) and Mina et al. (2013) show that innovators have problems in accessing external financing even in normal times. 9 The firms in our sample belong to the manufacturing industry and knowledge-intensive services. Innovative activity of knowledge-intensive services and their contribution to economic growth was highlighted by Barras (1986). Moreover Barras (1986), Freel (2006), Gallouj and Weinstein (1997) as well as Tether (2005) further characterize innovation activity in the knowledge-intensive service industries. 10 We do not consider firms which are switching their bank in the sample period. 11 In the case of private banks, we used the balance sheet data for the whole bank if the firm was affiliate to a branch of the specific bank.

9
additional investment and tangible assets for the purpose of innovation. Current innovation costs
cover the rest of the total innovation expenditures, for example expenses for personnel, material
and external knowledge. Thus, investments in innovation projects are to some degree more
tangible and flexible compared to current innovation costs.
We calculate the value of current innovation costs as the difference between total innovation
expenditures and investments in innovation projects. Please note that we use repeated cross-
sections, as unfortunately many firms do not participate in the survey on a regular basis. As we
have repeated cross-sections for multiple consecutive years available, we apply a variant of the
difference-in-differences methodology. Our treatment is a continuous variable and therefore we
use a modification of the standard model. Moreover, we use several pre- and post- treatment
periods and apply difference-in-differences model, suggested by Imbens and Wooldridge (2009).
Following Cameron and Trivedi (2009, 531), our Tobit model for a lognormal dependent variable
with a threshold is:
ln ∗ ,
~ 0, (1)
where ∗ equals one of the above-mentioned expenditures and is the unobserved latent variable.
The observed dependent variable is equal to:
lnln ∗ if ln ln ∗
if ln ln ∗ (2)
The dependent variables are log-transformed following the suggestion of Cameron and Trivedi
(2009, 532), as firms are possibly not innovative.12 To evaluate the banks’ involvement in the
interbank market and their influence on the firms’ financing during the crisis, the following
variable is computed: the ratio of interbank market borrowing to total assets (INTERBANK) in
percent. The measure is based on data from 2006 to take account of banks’ pre-crisis reliance on
interbank borrowing. It is quite likely that banks with a higher ratio of INTERBANK face greater
problems in the crisis. We therefore expect a positive coefficient of INTERBANK.13
12 Non-innovative firms report a value of zero innovation expenditures. The transformation requires that censored values of our dependent variable are set to a value which is smaller or equal to the smallest uncensored value. In our case, is slightly lower than the smallest value. 13 In 2009, the Dresdner Bank and Commerzbank merged. Since we do not want to create a selection problem by dropping those observations, we cope with their merger by using the mean (38.17492) of both banks’ 2006 interbank
10
Hence, we use a variant of the well-known difference-in-differences model by taking account of
the treatment intensity. Similar empirical models have been applied by Acemoglu et al. (2004),
Duchin et al. (2010) and Waldinger (2010). Basically, it is assumed that the effect of the
treatment variable is stronger if the value of this variable increases. The similarity to the usual
difference-in-differences model is that the treatment variable enters the equation twice: first
unchanged and then interacted with the relevant treatment period, in our case the time of the
crisis. Thus, the interaction variable INTERBANK POST takes the value of the INTERBANK
measure if the year is 2008 and later, and is zero for all years before 2008. Its coefficient informs
us about the impact of INTERBANK on the specific expenditures due to the crisis.
represents the vector of firm-specific regressors and the coefficients to be estimated. We
use lagged values of employees divided by 1000 ‘Employees in thousands’ to capture the effect
of firm size. In addition, we include the square to account for a non-linear relationship. Moreover,
we control for possible age effects by including the variables ‘Age’ and ‘Age squared’. In
addition, we add a dummy for location in eastern Germany ‘Located in eastern Germany’. To
control for the effect of belonging to a group of firms, we include a dummy ‘Part of firm group’
which assumes unit value if the firm is part of a group and 0 if not.
As an alternative to the availability of internal means we use the lagged value of rating ‘Firm
rating’. A higher rating is associated with a higher probability of default by the firm. Clearly, in
all likelihood access to external finance is limited in the case of a weak rating since banks
interpret this as a negative signal. A weak (high value in our case) rating evaluation can also be
interpreted as insufficient availability of internal means. This in turn will probably negatively
affect innovation expenditures. In addition the lagged growth of sales volume ‘Sales growth’ is
included. This variable is interpreted by Behr et al. (2013) as well as Carbo-Valverde et al. (2009)
as a proxy variable for Tobin’s Q and therefore growth and investment opportunities.
A set of one period-lagged bank controls as used before are covered in . These are bank size
measured in the logarithm of bank assets and return on average assets. To control for industry-
specific differences, we include a set of industry dummies . In addition, a set of time dummies
values. The approach is appropriate since both banks are quite similar with respect to bank type, size and other balance sheet characteristics. In addition, in our sample, the interbank values for Dresdner bank (37.575087) and Commerzbank (38.774753) are close together.
11
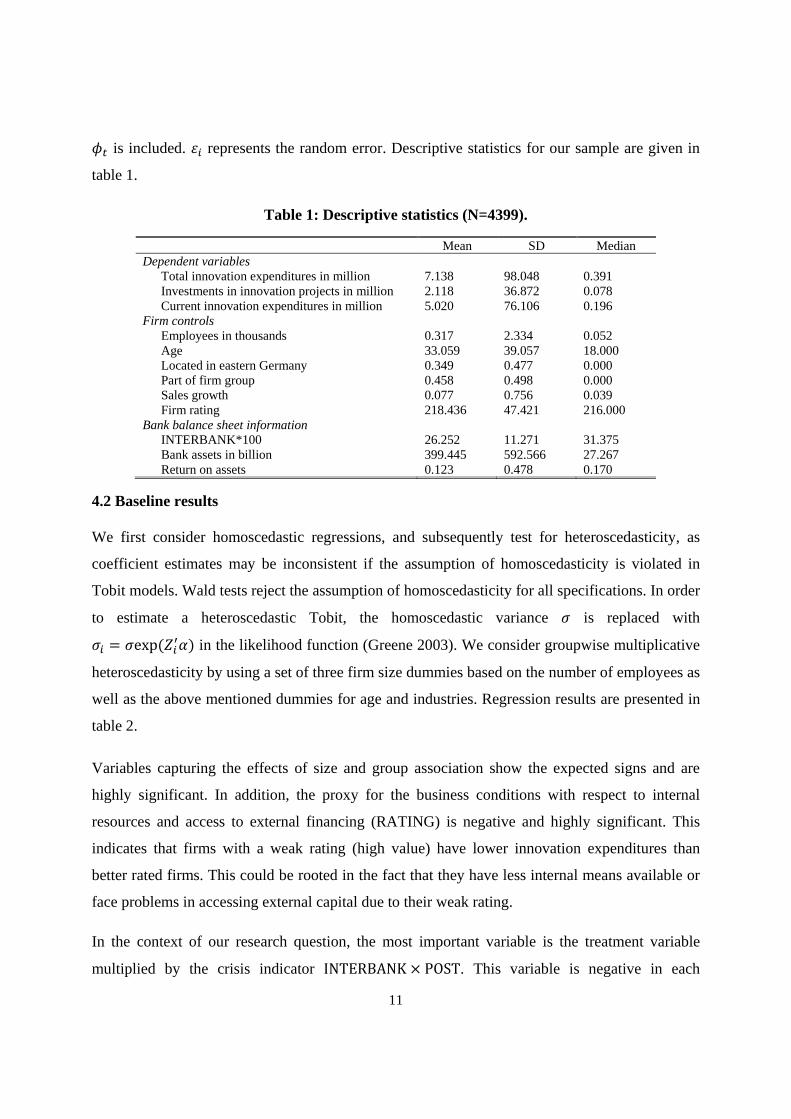
is included. represents the random error. Descriptive statistics for our sample are given in
table 1.
Table 1: Descriptive statistics (N=4399).
Mean SD Median Dependent variables
Total innovation expenditures in million 7.138 98.048 0.391 Investments in innovation projects in million 2.118 36.872 0.078 Current innovation expenditures in million 5.020 76.106 0.196
Firm controls Employees in thousands 0.317 2.334 0.052 Age 33.059 39.057 18.000 Located in eastern Germany 0.349 0.477 0.000 Part of firm group 0.458 0.498 0.000 Sales growth 0.077 0.756 0.039 Firm rating 218.436 47.421 216.000
Bank balance sheet information INTERBANK*100 26.252 11.271 31.375 Bank assets in billion 399.445 592.566 27.267 Return on assets 0.123 0.478 0.170
4.2 Baseline results
We first consider homoscedastic regressions, and subsequently test for heteroscedasticity, as
coefficient estimates may be inconsistent if the assumption of homoscedasticity is violated in
Tobit models. Wald tests reject the assumption of homoscedasticity for all specifications. In order
to estimate a heteroscedastic Tobit, the homoscedastic variance is replaced with
exp in the likelihood function (Greene 2003). We consider groupwise multiplicative
heteroscedasticity by using a set of three firm size dummies based on the number of employees as
well as the above mentioned dummies for age and industries. Regression results are presented in
table 2.
Variables capturing the effects of size and group association show the expected signs and are
highly significant. In addition, the proxy for the business conditions with respect to internal
resources and access to external financing (RATING) is negative and highly significant. This
indicates that firms with a weak rating (high value) have lower innovation expenditures than
better rated firms. This could be rooted in the fact that they have less internal means available or
face problems in accessing external capital due to their weak rating.
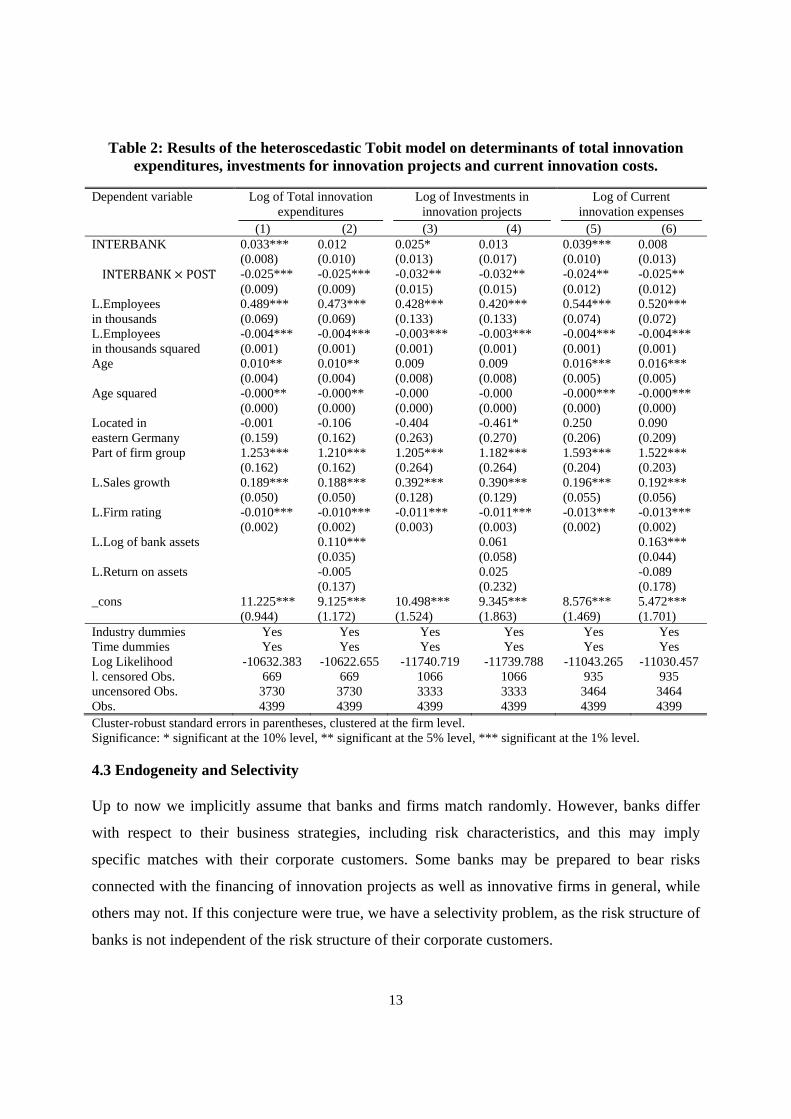
In the context of our research question, the most important variable is the treatment variable
multiplied by the crisis indicator INTERBANK POST. This variable is negative in each

12
regression and at least significant at the 5 percent level. This means that if firms are associated
with a main bank which has a higher interbank market borrowing-to-assets ratio, they reduce
their innovation expenditures of either type during the crisis (in comparison to observations with
a lower interbank market borrowing-to-assets ratio). Thus, a firm with a main bank that has a one
standard deviation higher interbank market value than another firm reduces the innovation
expenditures by about 28% due to the crisis.
The results of the alternative measurement clearly show that firms related to a bank which is
more engaged in interbank market borrowing reduce innovation expenditure to a larger extent.14
Moreover, the reduction in investments in innovation projects apparently determines the
reduction in total innovation expenditures.
14 Robustness tests using the mean of the INTERBANK value of the years 2004 to 2006 for each bank leads to similar results. Results are available upon request.
13
Table 2: Results of the heteroscedastic Tobit model on determinants of total innovation expenditures, investments for innovation projects and current innovation costs.
Dependent variable Log of Total innovation expenditures
Log of Investments in innovation projects
Log of Current innovation expenses
(1) (2) (3) (4) (5) (6) INTERBANK 0.033*** 0.012 0.025* 0.013 0.039*** 0.008 (0.008) (0.010) (0.013) (0.017) (0.010) (0.013) INTERBANK POST -0.025*** -0.025*** -0.032** -0.032** -0.024** -0.025**
(0.009) (0.009) (0.015) (0.015) (0.012) (0.012) L.Employees 0.489*** 0.473*** 0.428*** 0.420*** 0.544*** 0.520*** in thousands (0.069) (0.069) (0.133) (0.133) (0.074) (0.072) L.Employees -0.004*** -0.004*** -0.003*** -0.003*** -0.004*** -0.004*** in thousands squared (0.001) (0.001) (0.001) (0.001) (0.001) (0.001) Age 0.010** 0.010** 0.009 0.009 0.016*** 0.016*** (0.004) (0.004) (0.008) (0.008) (0.005) (0.005) Age squared -0.000** -0.000** -0.000 -0.000 -0.000*** -0.000*** (0.000) (0.000) (0.000) (0.000) (0.000) (0.000) Located in -0.001 -0.106 -0.404 -0.461* 0.250 0.090 eastern Germany (0.159) (0.162) (0.263) (0.270) (0.206) (0.209) Part of firm group 1.253*** 1.210*** 1.205*** 1.182*** 1.593*** 1.522*** (0.162) (0.162) (0.264) (0.264) (0.204) (0.203) L.Sales growth 0.189*** 0.188*** 0.392*** 0.390*** 0.196*** 0.192*** (0.050) (0.050) (0.128) (0.129) (0.055) (0.056) L.Firm rating -0.010*** -0.010*** -0.011*** -0.011*** -0.013*** -0.013*** (0.002) (0.002) (0.003) (0.003) (0.002) (0.002) L.Log of bank assets 0.110*** 0.061 0.163*** (0.035) (0.058) (0.044) L.Return on assets -0.005 0.025 -0.089 (0.137) (0.232) (0.178) _cons 11.225*** 9.125*** 10.498*** 9.345*** 8.576*** 5.472*** (0.944) (1.172) (1.524) (1.863) (1.469) (1.701) Industry dummies Yes Yes Yes Yes Yes Yes Time dummies Yes Yes Yes Yes Yes Yes Log Likelihood -10632.383 -10622.655 -11740.719 -11739.788 -11043.265 -11030.457 l. censored Obs. 669 669 1066 1066 935 935 uncensored Obs. 3730 3730 3333 3333 3464 3464 Obs. 4399 4399 4399 4399 4399 4399 Cluster-robust standard errors in parentheses, clustered at the firm level. Significance: * significant at the 10% level, ** significant at the 5% level, *** significant at the 1% level.
4.3 Endogeneity and Selectivity
Up to now we implicitly assume that banks and firms match randomly. However, banks differ
with respect to their business strategies, including risk characteristics, and this may imply
specific matches with their corporate customers. Some banks may be prepared to bear risks
connected with the financing of innovation projects as well as innovative firms in general, while
others may not. If this conjecture were true, we have a selectivity problem, as the risk structure of
banks is not independent of the risk structure of their corporate customers.
14
We use inverse probability weighting to tackle selectivity on observables on the part of the
firms.15 If the selectivity hypothesis is true, we observe two firm types. One type chooses banks
with openness to risk and the other type of firm is associated with banks that are less prepared to
finance risky projects. The aim is to eliminate any observable differences between the two firm
types. After re-weighting, the two samples of corporate customers should be equal with regard to
their explanatory variables.
Clearly, obtaining the propensity score is based on a dichotomy, but our main variable of interest
INTERBANK is continuous. Our approach for solving this problem is to use the German
structure of the “three-pillar banking system”. Thus, in principle, three kinds of banks can be
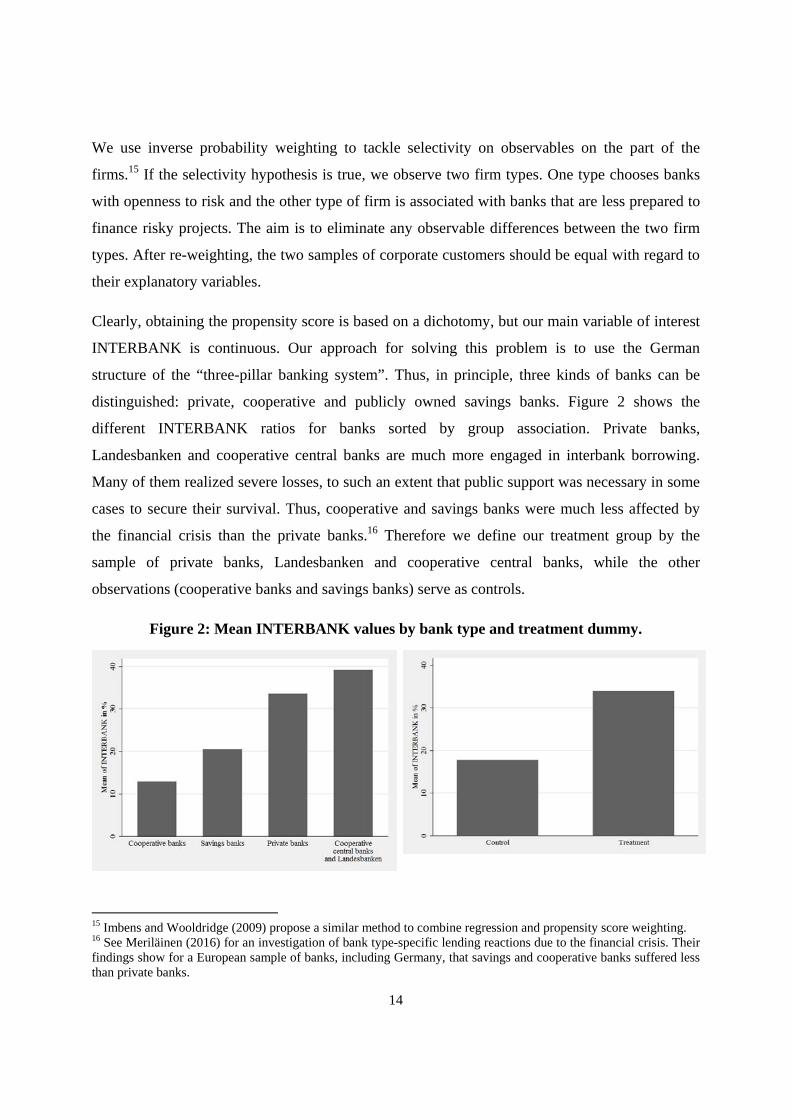
distinguished: private, cooperative and publicly owned savings banks. Figure 2 shows the
different INTERBANK ratios for banks sorted by group association. Private banks,
Landesbanken and cooperative central banks are much more engaged in interbank borrowing.
Many of them realized severe losses, to such an extent that public support was necessary in some
cases to secure their survival. Thus, cooperative and savings banks were much less affected by
the financial crisis than the private banks.16 Therefore we define our treatment group by the
sample of private banks, Landesbanken and cooperative central banks, while the other
observations (cooperative banks and savings banks) serve as controls.
Figure 2: Mean INTERBANK values by bank type and treatment dummy.
15 Imbens and Wooldridge (2009) propose a similar method to combine regression and propensity score weighting. 16 See Meriläinen (2016) for an investigation of bank type-specific lending reactions due to the financial crisis. Their findings show for a European sample of banks, including Germany, that savings and cooperative banks suffered less than private banks.

15
Based on this categorization we apply a Probit regression to determine the propensity score. The
dependent variable is the relation to a bank of the treatment group (yes/no) in order to implement
a match between treated firms and control observations. To take firm size into account we use
three dummy variables ‘1-9 employees’, ’10-49 employees’ and ’50-99 employees’, which take
unit values if a firm employs less than 9, between 10 and 49 or between 50 and 99 employees.
The large firms form the reference group. In addition, we use similarly specified dummy
variables ‘Age 0-15’ and ‘Age 16-30’ to control for firm age-specific effects. Further explanatory
variables are ‘Located in eastern Germany’, ‘Part of a firm group’ and ‘Firm rating’. Moreover,
we use as a measure for risky activities ‘mean innovation expenditures per employee’17 which is
the pre-crisis mean value of innovation expenditures per employee aggregated at the 3-digit
NACE Rev. 1 industry level.
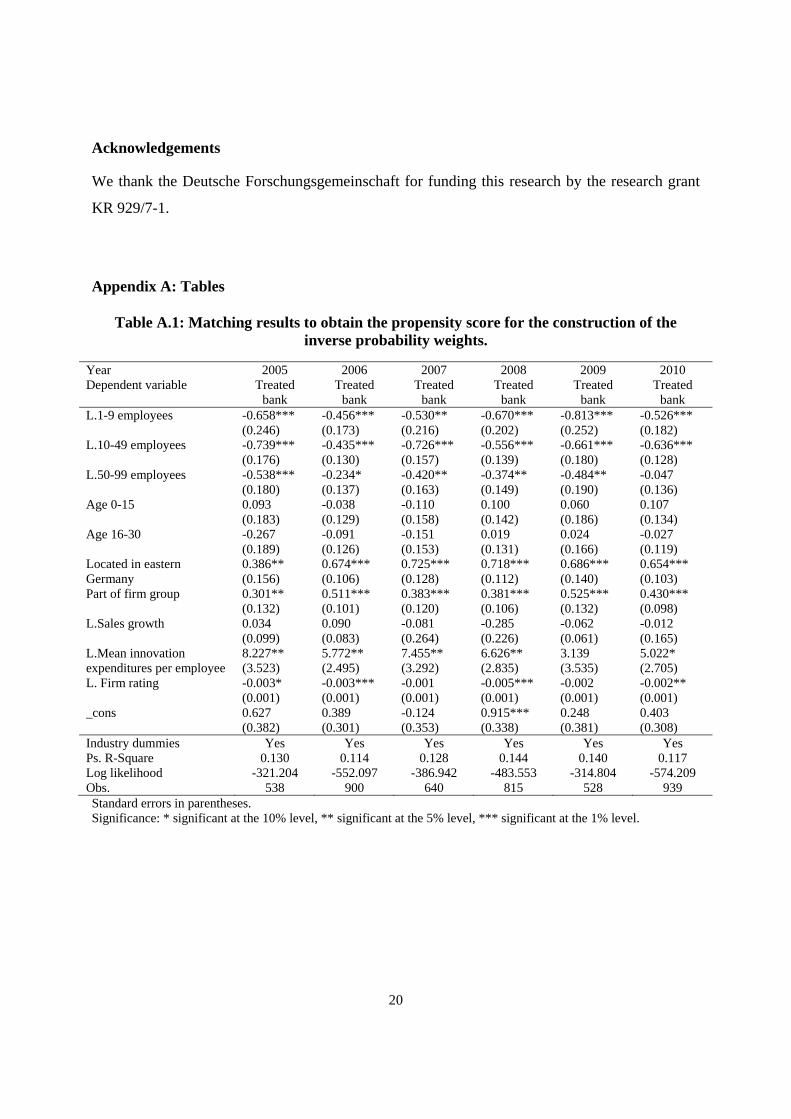
We re-estimate our results using inverse probability weights as proposed by Imbens and
Wooldridge (2009). In Table A.1 of the Appendix, we present results of the Probit regression to
compute the propensity score for each year. We calculate the inverse probability weight based on
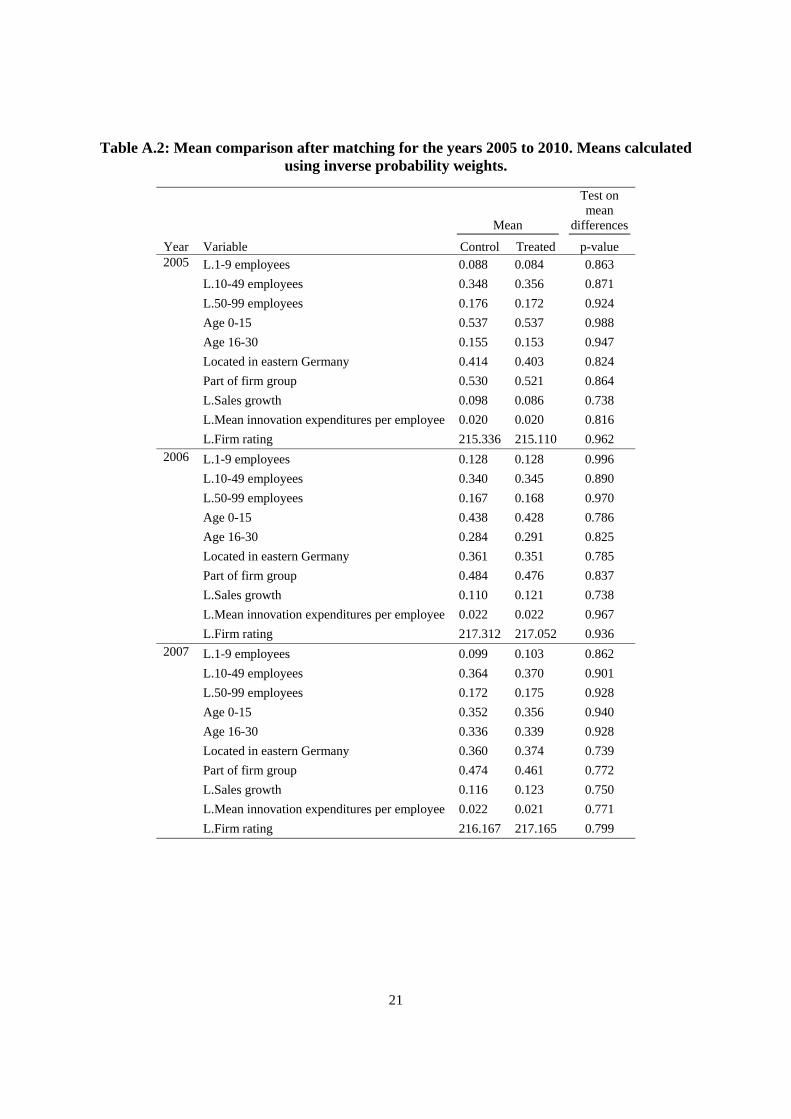
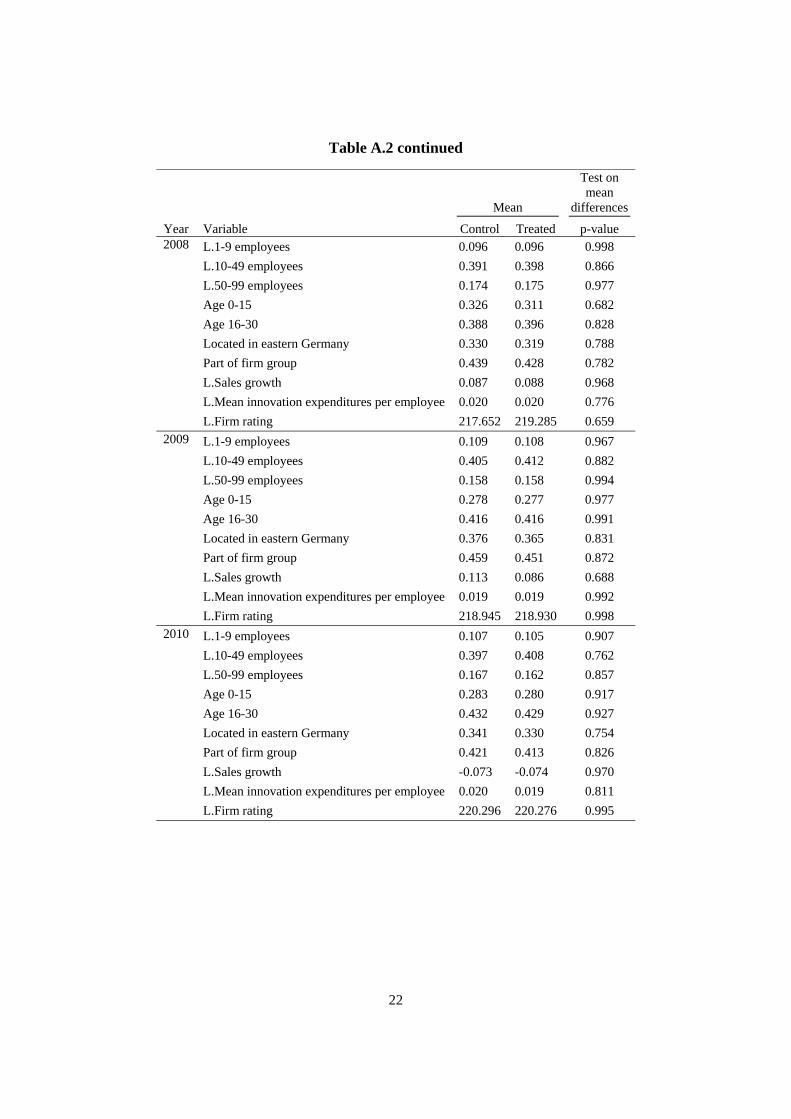
the obtained propensity score and apply it to each firm for the specific year. The tests on mean
differences between the explanatory variables for our two samples using inverse probability
weights are also presented in Table A.2 of the Appendix. Results of re-weighted regressions are
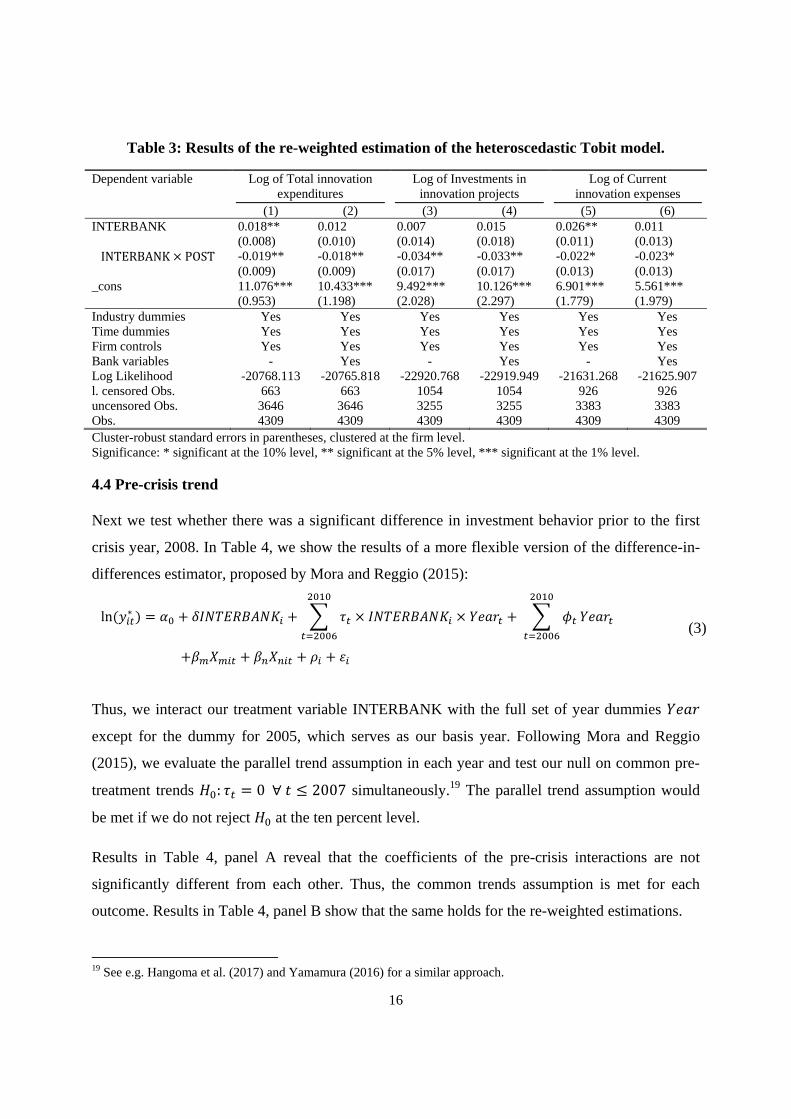
given in Table 3.18 Again, the interaction of interest is negative and significant at least at the 10%
level for total innovation expenditures, investments in innovation projects and current innovation
costs. These results are similar to the earlier results presented in Table 3 and coincide with the
overall results of the earlier Probit regressions.
17 Results are similar when using research and development expenses per employee or sales with products newly introduced to the market. However, these indicators reduce the number of observations. 18 Missing pre-crisis industry level innovation expenditure information causes a small sample reduction. Moreover, sample size decreases due to the fact that we restrict our sample to observations in the region of common support.
16
Table 3: Results of the re-weighted estimation of the heteroscedastic Tobit model.
Dependent variable Log of Total innovation expenditures
Log of Investments in innovation projects
Log of Current innovation expenses
(1) (2) (3) (4) (5) (6) INTERBANK 0.018** 0.012 0.007 0.015 0.026** 0.011 (0.008) (0.010) (0.014) (0.018) (0.011) (0.013) INTERBANK POST -0.019** -0.018** -0.034** -0.033** -0.022* -0.023*
(0.009) (0.009) (0.017) (0.017) (0.013) (0.013) _cons 11.076*** 10.433*** 9.492*** 10.126*** 6.901*** 5.561*** (0.953) (1.198) (2.028) (2.297) (1.779) (1.979) Industry dummies Yes Yes Yes Yes Yes Yes Time dummies Yes Yes Yes Yes Yes Yes Firm controls Yes Yes Yes Yes Yes Yes Bank variables - Yes - Yes - Yes Log Likelihood -20768.113 -20765.818 -22920.768 -22919.949 -21631.268 -21625.907 l. censored Obs. 663 663 1054 1054 926 926 uncensored Obs. 3646 3646 3255 3255 3383 3383 Obs. 4309 4309 4309 4309 4309 4309 Cluster-robust standard errors in parentheses, clustered at the firm level. Significance: * significant at the 10% level, ** significant at the 5% level, *** significant at the 1% level.
4.4 Pre-crisis trend
Next we test whether there was a significant difference in investment behavior prior to the first
crisis year, 2008. In Table 4, we show the results of a more flexible version of the difference-in-
differences estimator, proposed by Mora and Reggio (2015):
ln ∗ (3)
Thus, we interact our treatment variable INTERBANK with the full set of year dummies
except for the dummy for 2005, which serves as our basis year. Following Mora and Reggio
(2015), we evaluate the parallel trend assumption in each year and test our null on common pre-
treatment trends : 0∀ 2007 simultaneously.19 The parallel trend assumption would
be met if we do not reject at the ten percent level.
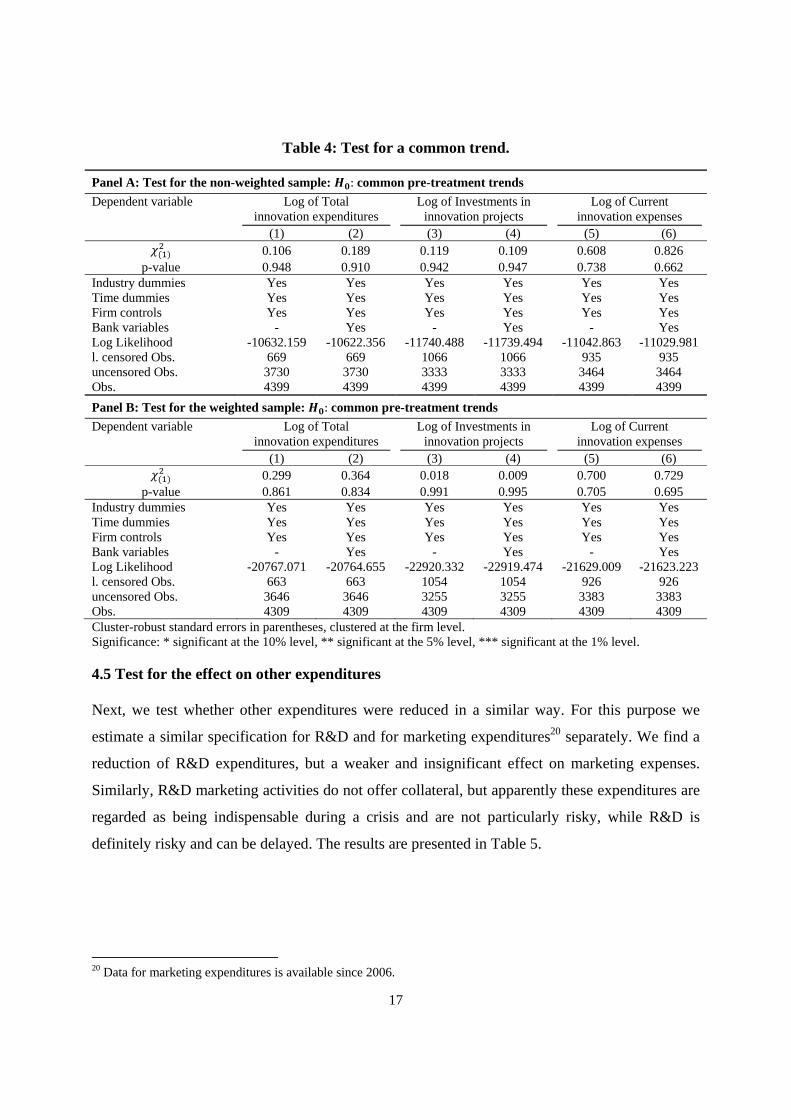
Results in Table 4, panel A reveal that the coefficients of the pre-crisis interactions are not
significantly different from each other. Thus, the common trends assumption is met for each
outcome. Results in Table 4, panel B show that the same holds for the re-weighted estimations.
19 See e.g. Hangoma et al. (2017) and Yamamura (2016) for a similar approach.
17
Table 4: Test for a common trend.
Panel A: Test for the non-weighted sample: : common pre-treatment trends
Dependent variable Log of Total innovation expenditures
Log of Investments in innovation projects
Log of Current innovation expenses
(1) (2) (3) (4) (5) (6) 0.106 0.189 0.119 0.109 0.608 0.826
p-value 0.948 0.910 0.942 0.947 0.738 0.662 Industry dummies Yes Yes Yes Yes Yes Yes Time dummies Yes Yes Yes Yes Yes Yes Firm controls Yes Yes Yes Yes Yes Yes Bank variables - Yes - Yes - Yes Log Likelihood -10632.159 -10622.356 -11740.488 -11739.494 -11042.863 -11029.981 l. censored Obs. 669 669 1066 1066 935 935 uncensored Obs. 3730 3730 3333 3333 3464 3464 Obs. 4399 4399 4399 4399 4399 4399
Panel B: Test for the weighted sample: : common pre-treatment trends
Dependent variable Log of Total innovation expenditures
Log of Investments in innovation projects
Log of Current innovation expenses
(1) (2) (3) (4) (5) (6) 0.299 0.364 0.018 0.009 0.700 0.729
p-value 0.861 0.834 0.991 0.995 0.705 0.695 Industry dummies Yes Yes Yes Yes Yes Yes Time dummies Yes Yes Yes Yes Yes Yes Firm controls Yes Yes Yes Yes Yes Yes Bank variables - Yes - Yes - Yes Log Likelihood -20767.071 -20764.655 -22920.332 -22919.474 -21629.009 -21623.223 l. censored Obs. 663 663 1054 1054 926 926 uncensored Obs. 3646 3646 3255 3255 3383 3383 Obs. 4309 4309 4309 4309 4309 4309 Cluster-robust standard errors in parentheses, clustered at the firm level. Significance: * significant at the 10% level, ** significant at the 5% level, *** significant at the 1% level.
4.5 Test for the effect on other expenditures
Next, we test whether other expenditures were reduced in a similar way. For this purpose we
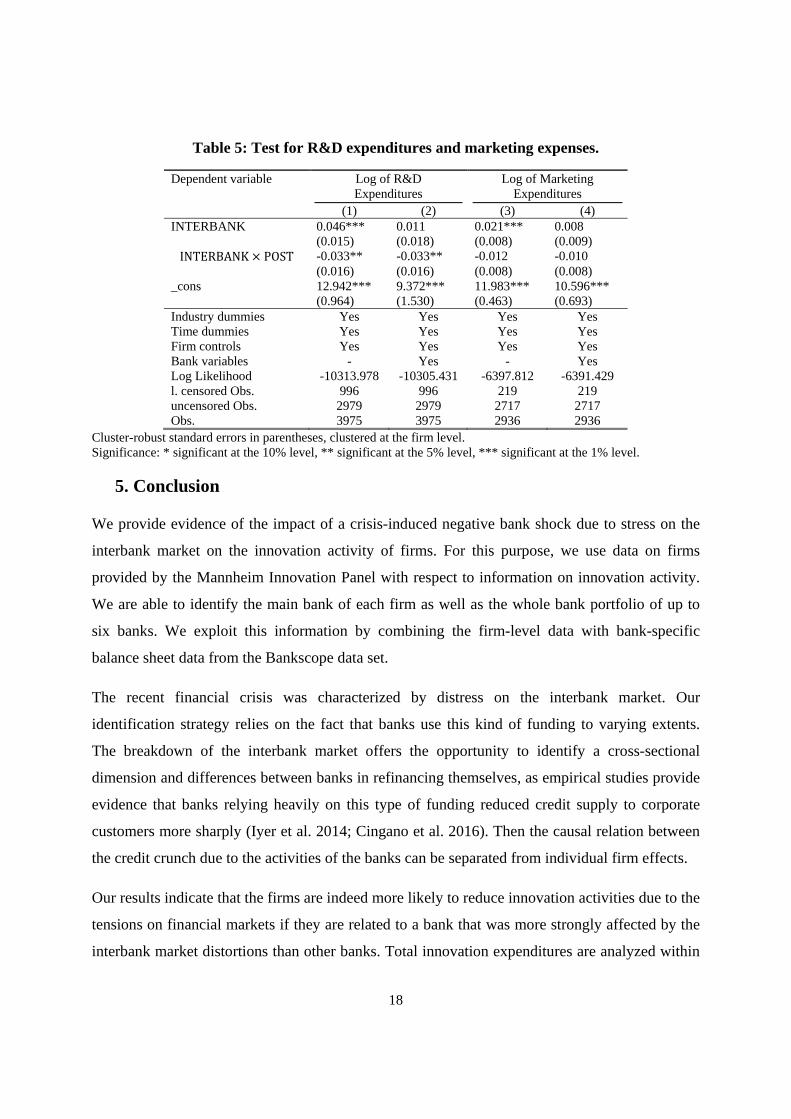
estimate a similar specification for R&D and for marketing expenditures20 separately. We find a
reduction of R&D expenditures, but a weaker and insignificant effect on marketing expenses.
Similarly, R&D marketing activities do not offer collateral, but apparently these expenditures are
regarded as being indispensable during a crisis and are not particularly risky, while R&D is
definitely risky and can be delayed. The results are presented in Table 5.
20 Data for marketing expenditures is available since 2006.
18
Table 5: Test for R&D expenditures and marketing expenses.
Dependent variable Log of R&D Expenditures
Log of Marketing Expenditures
(1) (2) (3) (4) INTERBANK 0.046*** 0.011 0.021*** 0.008 (0.015) (0.018) (0.008) (0.009) INTERBANK POST -0.033** -0.033** -0.012 -0.010
(0.016) (0.016) (0.008) (0.008) _cons 12.942*** 9.372*** 11.983*** 10.596*** (0.964) (1.530) (0.463) (0.693) Industry dummies Yes Yes Yes Yes Time dummies Yes Yes Yes Yes Firm controls Yes Yes Yes Yes Bank variables - Yes - Yes Log Likelihood -10313.978 -10305.431 -6397.812 -6391.429 l. censored Obs. 996 996 219 219 uncensored Obs. 2979 2979 2717 2717 Obs. 3975 3975 2936 2936
Cluster-robust standard errors in parentheses, clustered at the firm level. Significance: * significant at the 10% level, ** significant at the 5% level, *** significant at the 1% level.
5. Conclusion
We provide evidence of the impact of a crisis-induced negative bank shock due to stress on the
interbank market on the innovation activity of firms. For this purpose, we use data on firms
provided by the Mannheim Innovation Panel with respect to information on innovation activity.
We are able to identify the main bank of each firm as well as the whole bank portfolio of up to
six banks. We exploit this information by combining the firm-level data with bank-specific
balance sheet data from the Bankscope data set.
The recent financial crisis was characterized by distress on the interbank market. Our
identification strategy relies on the fact that banks use this kind of funding to varying extents.
The breakdown of the interbank market offers the opportunity to identify a cross-sectional
dimension and differences between banks in refinancing themselves, as empirical studies provide
evidence that banks relying heavily on this type of funding reduced credit supply to corporate
customers more sharply (Iyer et al. 2014; Cingano et al. 2016). Then the causal relation between
the credit crunch due to the activities of the banks can be separated from individual firm effects.
Our results indicate that the firms are indeed more likely to reduce innovation activities due to the
tensions on financial markets if they are related to a bank that was more strongly affected by the
interbank market distortions than other banks. Total innovation expenditures are analyzed within

19
a difference-in-differences framework. The general result is that the banks’ capacities for
refinancing have an impact on the financing of their corporate customers’ innovation
expenditures. The decomposition of total innovation expenditures shows that investments in
innovation are affected to a greater extent than current innovation costs, which probably comprise
intangible expense. Hence, according to these results, external finance has an impact on
innovative activity. Additional tests using R&D expenditures as outcome variable lead to similar
results. Analyzing marketing expenditures, the results imply that there is no significant impact on
this kind of expenditure, which is unrelated to technological progress.
The financial crisis offers an interesting opportunity to investigate the effect of a drastic shock to
the banks, which was transmitted to firms in the form of reduced external financing.
Summarizing, according to our empirical results both internal and external financing resources
affect innovative activity, and an unfortunate event like the financial crisis not only has a short-
run effect on current profits, but exerts a negative impact on the growth of the economy by
affecting innovative activity.
Our results have implications for the policy debate on bank business activities, subsidization and
regulation in general. Bank strategies affect the funding of loans. Recent regulatory developments
of the Basle II and III accords aim at stabilizing banks by for example holding a certain amount
of core capital. In addition, the German bank system kept the three-pillar structure and therefore a
quite heterogeneous funding structure by core deposits and wholesale funding. Our results imply
that it is necessary to implement policies for banks that guarantee a stable refinancing structure in
a stress situation to secure the unconstrained credit supply to their corporate (and also private)
customers.
In addition, other studies like Brautzsch et al. (2015) and Hud and Hussinger (2015) underlined
the importance of public subsidies for innovative firms in an economic downturn. Consequently,
if other sources of financing are scarce, policy makers should aim at programs to promote
innovation activity during economic downturns.
20
Acknowledgements
We thank the Deutsche Forschungsgemeinschaft for funding this research by the research grant
KR 929/7-1.
Appendix A: Tables
Table A.1: Matching results to obtain the propensity score for the construction of the inverse probability weights.
Year 2005 2006 2007 2008 2009 2010 Dependent variable Treated
bank Treated
bank Treated
bank Treated
bank Treated
bank Treated
bank L.1-9 employees -0.658*** -0.456*** -0.530** -0.670*** -0.813*** -0.526*** (0.246) (0.173) (0.216) (0.202) (0.252) (0.182) L.10-49 employees -0.739*** -0.435*** -0.726*** -0.556*** -0.661*** -0.636*** (0.176) (0.130) (0.157) (0.139) (0.180) (0.128) L.50-99 employees -0.538*** -0.234* -0.420** -0.374** -0.484** -0.047 (0.180) (0.137) (0.163) (0.149) (0.190) (0.136) Age 0-15 0.093 -0.038 -0.110 0.100 0.060 0.107 (0.183) (0.129) (0.158) (0.142) (0.186) (0.134) Age 16-30 -0.267 -0.091 -0.151 0.019 0.024 -0.027 (0.189) (0.126) (0.153) (0.131) (0.166) (0.119)Located in eastern 0.386** 0.674*** 0.725*** 0.718*** 0.686*** 0.654*** Germany (0.156) (0.106) (0.128) (0.112) (0.140) (0.103) Part of firm group 0.301** 0.511*** 0.383*** 0.381*** 0.525*** 0.430*** (0.132) (0.101) (0.120) (0.106) (0.132) (0.098) L.Sales growth 0.034 0.090 -0.081 -0.285 -0.062 -0.012 (0.099) (0.083) (0.264) (0.226) (0.061) (0.165) L.Mean innovation 8.227** 5.772** 7.455** 6.626** 3.139 5.022* expenditures per employee (3.523) (2.495) (3.292) (2.835) (3.535) (2.705) L. Firm rating -0.003* -0.003*** -0.001 -0.005*** -0.002 -0.002** (0.001) (0.001) (0.001) (0.001) (0.001) (0.001) _cons 0.627 0.389 -0.124 0.915*** 0.248 0.403 (0.382) (0.301) (0.353) (0.338) (0.381) (0.308) Industry dummies Yes Yes Yes Yes Yes Yes Ps. R-Square 0.130 0.114 0.128 0.144 0.140 0.117 Log likelihood -321.204 -552.097 -386.942 -483.553 -314.804 -574.209 Obs. 538 900 640 815 528 939 Standard errors in parentheses. Significance: * significant at the 10% level, ** significant at the 5% level, *** significant at the 1% level.
21
Table A.2: Mean comparison after matching for the years 2005 to 2010. Means calculated using inverse probability weights.
Mean
Test on mean
differences
Year Variable Control Treated p-value 2005 L.1-9 employees 0.088 0.084 0.863
L.10-49 employees 0.348 0.356 0.871
L.50-99 employees 0.176 0.172 0.924
Age 0-15 0.537 0.537 0.988
Age 16-30 0.155 0.153 0.947
Located in eastern Germany 0.414 0.403 0.824
Part of firm group 0.530 0.521 0.864
L.Sales growth 0.098 0.086 0.738
L.Mean innovation expenditures per employee 0.020 0.020 0.816
L.Firm rating 215.336 215.110 0.962 2006 L.1-9 employees 0.128 0.128 0.996
L.10-49 employees 0.340 0.345 0.890
L.50-99 employees 0.167 0.168 0.970
Age 0-15 0.438 0.428 0.786
Age 16-30 0.284 0.291 0.825
Located in eastern Germany 0.361 0.351 0.785
Part of firm group 0.484 0.476 0.837
L.Sales growth 0.110 0.121 0.738
L.Mean innovation expenditures per employee 0.022 0.022 0.967
L.Firm rating 217.312 217.052 0.936 2007 L.1-9 employees 0.099 0.103 0.862
L.10-49 employees 0.364 0.370 0.901
L.50-99 employees 0.172 0.175 0.928
Age 0-15 0.352 0.356 0.940
Age 16-30 0.336 0.339 0.928
Located in eastern Germany 0.360 0.374 0.739
Part of firm group 0.474 0.461 0.772
L.Sales growth 0.116 0.123 0.750
L.Mean innovation expenditures per employee 0.022 0.021 0.771
L.Firm rating 216.167 217.165 0.799
22
Table A.2 continued
Mean
Test on mean
differences
Year Variable Control Treated p-value 2008 L.1-9 employees 0.096 0.096 0.998
L.10-49 employees 0.391 0.398 0.866
L.50-99 employees 0.174 0.175 0.977
Age 0-15 0.326 0.311 0.682
Age 16-30 0.388 0.396 0.828
Located in eastern Germany 0.330 0.319 0.788
Part of firm group 0.439 0.428 0.782
L.Sales growth 0.087 0.088 0.968
L.Mean innovation expenditures per employee 0.020 0.020 0.776
L.Firm rating 217.652 219.285 0.659 2009 L.1-9 employees 0.109 0.108 0.967
L.10-49 employees 0.405 0.412 0.882
L.50-99 employees 0.158 0.158 0.994
Age 0-15 0.278 0.277 0.977
Age 16-30 0.416 0.416 0.991
Located in eastern Germany 0.376 0.365 0.831
Part of firm group 0.459 0.451 0.872
L.Sales growth 0.113 0.086 0.688
L.Mean innovation expenditures per employee 0.019 0.019 0.992
L.Firm rating 218.945 218.930 0.998 2010 L.1-9 employees 0.107 0.105 0.907
L.10-49 employees 0.397 0.408 0.762
L.50-99 employees 0.167 0.162 0.857
Age 0-15 0.283 0.280 0.917
Age 16-30 0.432 0.429 0.927
Located in eastern Germany 0.341 0.330 0.754
Part of firm group 0.421 0.413 0.826
L.Sales growth -0.073 -0.074 0.970
L.Mean innovation expenditures per employee 0.020 0.019 0.811
L.Firm rating 220.296 220.276 0.995
23
References
Acemoglu, D., D. H. Autor and D. Lyle (2004), Women, war, and wages: The effect of female labor supply on the wage structure at midcentury, Journal of political Economy, 112(3), 497-551.
Acharya, V., and O. Merrouche (2012), Precautionary hoarding of liquidity and inter-bank markets: Evidence from the sub-prime crisis, Review of Finance, 1-54.
Acharya, V., and D. Skeie (2011), A model of liquidity hoarding and term premia in inter-bank markets, Journal of Monetary Economics, 58, 436–47.
Aghion, P., P. Askenazy , N. Berman, G. Cette and L. Eymard (2012), Credit Constraint and the Cyclicality of R&D Investment: Evidence from France, Journal of the European Economic Association, 10(5), 1001-1024.
Aghion, P. and P. Howitt (2009), The Economics of Growth. MIT Press, Cambridge, Mass.
Akerlof, G. A. (1970), “The Market for "Lemons": Quality Uncertainty and the Market Mechanism”, The Quarterly Journal of Economics, 84(3), 488-500.
Alessandrini, P., A. F. Presbitero, and A. Zazzaro (2010), Bank size or distance: what hampers innovation adoption by SMEs?, Journal of Economic Geography, 10(6), 845-881.
Amore, M. D., C. Schneider and A. Žaldokas (2013), Credit supply and corporate innovation, Journal of Financial Economics, 109(3), 835-855.
Amore, M.D. (2015), Companies learning to innovate in recessions, Research Policy 44(8), 1574–1583.
Archibugi D., A. Filippetti, and M. Frenz (2013a), Economic crisis and innovation: is destruction prevailing over accumulation?, Research Policy, 42(2):303–314.
Archibugi D., A. Filippetti, and M. Frenz (2013b), The impact of the economic crisis on innovation: evidence from Europe, Technological Forecasting and Social Change, 80(7), 1247–1260.
Ashcraft, A., J. McAndrews, and D. Skeie (2011), Precautionary reserves and the interbank market, Journal of Money, Credit and Banking, 43, 311–48.
Ayyagari, M., A. Demirgüç-Kunt, V. Maksimovic (2011), Firm innovation in emerging markets: the role of finance, governance and competition, Journal of Financial and Quantitative Analysis, 46, 1545–1580.
Barlevy, G. (2007), On the cyclicality of research and development, The American Economic Review, 97(4), 1131-1164.
Barras, R. (1986), Towards a theory of innovation in services, Research policy, 15(4), 161-173.

24
Behr, P., L. Norden, and F. Noth (2013), Financial constraints of private firms and bank lending behavior, Journal of Banking and Finance, 37(9), 3472-3485.
Benfratello, L., F. Schiantarelli and A. Sembenelli (2008), Banks and innovation: Microeconometric evidence on Italian firms, Journal of Financial Economics, 90(2), 197-217.
Bond, S., D. Harhoff and J. Van Reenen (2005), Investment, R&D and Financial Constraints in Britain and Germany, Annales d'Economie et de Statistique, 79/80, 435-462.
Brautzsch, H. U., J. Günther, B. Loose, U. Ludwig, and N. Nulsch (2015), Can R&D subsidies counteract the economic crisis?–Macroeconomic effects in Germany, Research Policy, 44(3), 623-633.
Bräuning, F. and F. Fecht (2016), Relationship lending in the interbank market and the price of liquidity, Review of Finance, 21(1), 33-75.
Brown, J. R., G. Martinsson and B. C. Petersen (2012), Do financing constraints matter for R&D?, European Economic Review, 56(8), 1512-1529.
Bundesbank (2009), Die Entwicklung der Kredite an den privaten Sektor in Deutschland während der globalen Finanzkrise, Monatsbericht, September 2009.
Cameron, A. C. and P. K. Trivedi (2009), Microeconometrics using stata, fifth edition, College Station, TX: Stata press.
Campello, M., J.R. Graham and C.R. Harvey, (2010), The real effects of financial constraints: evidence from a financial crisis. Journal of Financial Economics, 97, 470–487.
Carbo-Valverde, S., F. Rodriguez-Fernandez and G. F. Udell (2009), Bank market power and SME financing constraints, Review of Finance, 13(2), 309-340.
Chava, S., A. Oettl, A. Subramanian and K. V. Subramanian (2013), Banking deregulation and innovation, Journal of Financial Economics, 109(3), 759-774.
Chodorow-Reich, G. (2013), The employment effects of credit market disruptions: Firm-level evidence from the 2008–9 financial crisis, The Quarterly Journal of Economics, 129(1), 1-59.
Cingano, F., F. Manaresi and E. Sette (2016), Does Credit Crunch Investment Down? New Evidence on the Real Effects of the Bank-Lending Channel, Review of Financial Studies, 29(10), 2737-2773.
Cornaggia, J., Y. Mao, X. Tian and B. Wolfe (2015), Does banking competition affect innovation?, Journal of Financial Economics, 115(1), 189-209.
Cornett, M., J. McNutt, P. Strahan and H. Tehranian (2011), Liquidity risk management and credit supply in the financial crisis, Journal of Financial Economics, 101, 297–312.

25
Craig, B. and G. von Peter (2014), Interbank tiering and money center banks, Journal of Financial Intermediation, 23(3), 322-347.
Czarnitzki, D. and H. Hottenrott (2011a), Financial constraints: Routine versus cutting edge R&D investment, Journal of Economics & Management Strategy, 20(1), 121-157.
Czarnitzki, D. and H. Hottenrott (2011b), R&D investment and financing constraints of small and medium sized firms, Small Business Economics, 36(1), 65-83.
Czarnitzki, D., and A. A. Toole (2011), Patent protection, market uncertainty, and R&D investment, The Review of Economics and Statistics, 93(1), 147-159.
Duchin, R., Ozbas, O. and B. A. Sensoy (2010), Costly external finance, corporate investment, and the subprime mortgage credit crisis, Journal of Financial Economics, 97(3), 418-435.
Filippetti, A. and D. Archibugi (2011), Innovation in times of crisis: national systems of innovation, structure, and demand. Research Policy, 40(2), 179–192.
Freel, M. (2006), Patterns of technological innovation in knowledge‐intensive business services, Industry and Innovation, 13(3), 335-358.
Freel, M. S., (2007), Are small innovators credit rationed?, Small Business Economics, 28(1), 23–35.
Gallouj, F., and O. Weinstein (1997), Innovation in services, Research policy, 26(4-5), 537-556.
Greene, W. H., (2003), Econometric Analysis, fifth edition, Prentice Hall, Upper Saddle River, NJ.
Grossman, G.M. and E. Helpman (1994), Endogenous innovation in the theory of growth, Journal of Economic Perspectives, 8(1), 23–44.
Hall, B. H. (2002), The Financing of Research and Development, Oxford Review of Economic Policy, 18(1), 35–51.
Hall, B. H. and J. Lerner (2010), The Financing of R & D and Innovation, In: Hall, B. H. and N. Rosenberg (Eds.), Handbook of the Economics of Innovation, Elsevier, North-Holland.
Hangoma, P., B. Robberstad and A. Aakvik (2017), Does Free Public Health Care Increase Utilization and Reduce Spending? Heterogeneity and Long-Term Effects, World Development, forthcoming (https://doi.org/10.1016/j.worlddev.2017.05.040).
Harhoff, D. (1998), Are There Financing Constraints for R&D and Investment in German Manufacturing Firms?, Annales d'Économie et de Statistique, 49/50, 421-456.
Harhoff, D. and T. Körting (1998), Lending relationships in Germany–Empirical evidence from survey data, Journal of Banking & Finance, 22(10), 1317-1353.
Himmelberg, C.P. and B.C. Petersen (1994), R&D and Internal Finance: A Panel Study of Small Firms in High-Tech Industries, Review of Economics and Statistics 76, 38-51.
26
Hottenrott, H., and B. Peters (2012), Innovative capability and financing constraints for innovation: More money, more innovation?, Review of Economics and Statistics, 94(4), 1126-1142.
Hsu, P. H., X. Tian and Y. Xu (2014), Financial development and innovation: Cross-country evidence, Journal of Financial Economics, 112(1), 116-135.
Hud, M., and K. Hussinger (2015), The impact of R&D subsidies during the crisis, Research Policy, 44(10), 1844-1855.
Imbens, G. W. and J. M. Wooldridge (2009), Recent developments in the econometrics of program evaluation, Journal of economic literature, 47(1), 5-86.
IMF (2016), Germany; Financial Sector Assessment Program-Systemic Liquidity and Bank Funding-Technical Notes, No 16/195, IMF Staff Country Reports, International Monetary Fund.
Ivashina, V. and D. Scharfstein (2010), Bank lending during the financial crisis of 2008, Journal of Financial Economics, 97(3), 319-338.
Iyer, R., J.-L. Peydró, S. da-Rocha-Lopes and A. Schoar (2014), Interbank Liquidity Crunch and the Firm Credit Crunch: Evidence from the 2007–2009 Crisis, Review of Financial Studies, 27(1), 347-372.
Kahle, K. M., and R. M. Stulz (2013), Access to capital, investment, and the financial crisis. Journal of Financial Economics, 110(2), 280-299.
Kapan, T. and C. Minoiu (2013), Balance Sheet Strength and Bank Lending During the Global Financial Crisis, Working Papers (No. 13/102), International Monetary Fund.
Lee, S., H. Sameen and M. Cowling (2015), Access to finance for innovative SMEs since the financial crisis, Research Policy, 44(2), 370-380.
López-García, P., J.M. Montero and E. Moral-Benito (2013), Business cycles and investment in productivity-enhancing activities: Evidence from Spanish Firms, Industry and Innovation, 20(7), 611-636.
Männasoo, K. and J. Meriküll (2014), R&D, Credit Constraints, and Demand Fluctuations: Comparative Micro Evidence from Ten New EU Members, Eastern European Economics, 52(2), 49-64.
Meriläinen, J. M. (2016), Lending growth during the financial crisis and the sovereign debt crisis: The role of bank ownership type, Journal of International Financial Markets, Institutions and Money, 41, 168-182.
Mina, A., H. Lahr and A. Hughes (2013), The demand and supply of external finance for innovative firms, Industrial and Corporate Change, 22(4), 869–901.
Mora, R. and I. Reggio (2015), didq: A command for treatment-effect estimation under alternative assumptions, The Stata Journal, 15 (3), 796-808.

27
Nanda, R. and T. Nicholas, (2014), Did bank distress stifle innovation during the Great Depression?, Journal of Financial Economics, 114(2), 273-292.
North, D., Baldock, R. and F. Ullah (2013), Funding the growth of UK technology-based small firms since the financial crash: are there breakages in the finance escalator?, Venture Capital, 15(3), 237–260.
Ouyang, M. (2011), On the Cyclicality of R&D. Review of Economics and Statistics, 93(2), 542-553.
Paunov, C. (2012), The global crisis and firms’ investments in innovation, Research Policy, 41(1), 24–35.
Puri, M., J. Rocholl and S. Steffen (2011), Global retail lending in the aftermath of the US financial crisis: Distinguishing between supply and demand effects, Journal of Financial Economics, 100(3), 556-578.
Schumpeter, J. (1911), The Theory of Economic Development, Harvard University Press, Cambridge, MA.
Solow, R. M. (1957), Technical change and the aggregate production function, The review of Economics and Statistics, 39(3), 312-320.
Tether, B. S. (2005), Do services innovate (differently)? Insights from the European innobarometer survey, Industry & Innovation, 12(2), 153-184.
Waldinger, F. (2010), Quality matters: The expulsion of professors and the consequences for PhD student outcomes in Nazi Germany, Journal of Political Economy, 118(4), 787-831.
Yamamura, E. (2016), Impact of the Fukushima nuclear accident on obesity of children in Japan (2008–2014), Economics and Human Biology, 21, 110-121.