Embed Size (px)
Citation preview

Are financing constraints binding for
investment? Evidence from natural
experiment.
This working paper is authored or co-authored by Saïd Business School faculty. The paper is circulated for
discussion purposes only, contents should be considered preliminary and are not to be quoted or reproduced
without the author’s permission.
August 2016
Katarzyna Habu
Oxford University Centre for Business Taxation
Working paper series | 2016
WP 16/11

Are �nancing constraints binding for investment?
Evidence from natural experiment. �
Katarzyna Anna Habu
Oxford University Centre for Business Taxation and Oxford University
This version: August 2016
Abstract
This paper empirically tests the e¤ects of �nancing constraints and cost of cap-
ital on investment using the 2006 Canadian income trusts tax reform as a natural
experiment. Income trusts are two-layer Canadian �ow-through entities that are
not taxed at the trust level if they distribute all their cash �ows. They consist of an
income trust and an operating company. The popularity of the income trust struc-
ture can be attributed to two distinct tax advantages. The �rst one is the ability
to decrease corporate income tax at the operating company level due to facilitating
higher leverage, the second one is lower total tax on distributed pro�ts for ultimate
owners. Earnings, which might otherwise have been retained and used as a low
cost source of �nance for investment, are eliminated (by higher related-party debt)
at the operating company level and cannot be retained (at the trust level) without
foregoing the tax advantage. Therefore on one hand an income trust has a lower
cost of capital for all sources of �nancing due to elimination of corporation tax,
but on the other hand it has to rely more on the more expensive external sources
to �nance its investment. I investigate these con�icting forces and their e¤ects on
investment by looking at both immediate and longer run e¤ects of the 2006 reform
announcement, which imposed corporation tax on income trusts starting from 2011
and, by o¤ering them an option to return to being a corporation, relaxed the �-
nancing constraint. The results show that �nancing constraints are binding. The
2006 reform announcement did not a¤ect investment of income trusts until they
converted back to corporate form. The availability of cash is more important for
investment than cost of capital. Investment of income trusts increased after the
reform, in spite of an increase in the cost of capital.
JEL: H25, H32, Key words: investment, �nancing constraints, income trusts
�I would like to thank Steve Bond, Mike Devereux, Glen Loutzenhiser, Brian Bell and participantsof the Oxford University Centre for Business Taxation Research Seminar and IIPF 2015 annual meetingfor very helpful comments and suggestions on preliminary draft of this work. This paper is a Chapter ofmy DPhil thesis at the University of Oxford. The usual disclaimer applies.
1

1 Introduction
The question of how taxes a¤ect investment has been extensively analyzed by the eco-
nomic literature. It is relevant for policy design, especially in the context of designing
tax reforms that aim to encourage growth. Through the analysis of various tax policies
the literature assesses the e¤ects of taxation on investment1. The focus of the empirical
and theoretical contributions centres around discussion of the e¤ects of cost of capital
and �nancing constraints.
The analysis of the e¤ects of cost of capital on investment can be traced back to
Jorgensen (1963) who introduces the neoclassical theory model. This model has later
been tested empirically by Hall and Jorgensen (1967). Subsequent developments in the
theoretical contributions to understand the e¤ects of cost of capital on investment are
primarily based on applications of q theory (Tobin (1969)). In general, this literature is
vast and still very active.2 The general agreement is that the estimated elasticity of the
capital stock to the user cost of capital ranges between -0.25 and -1. Therefore an increase
in the cost of capital in the neoclassical framework will tend to reduce investment.
Financing constraints and the availability of internal sources of �nance also a¤ect
investment. Empirical literature in this �eld uses two di¤erent approaches: reduced-form
regression of investment on cash �ows or Euler equation methods with early contributions
from Fazzari et al. (1988), Gertler and Hubbard (1988) and Fazzari and Petersen (1993).
Generally, the conclusions reached are that improved access to internal �nance and the
availability of cash increase investment. Related to this, the cost of external sources of
�nancing such as debt and new equity has been found to be higher than that of internal
sources of �nancing such as retained earnings (Fazzari et al. (1988), Bond and Meghir
(1994), Calomiris and Hubbard (1995)). The literature o¤ers various explanations for
why internal sources of �nancing may be less costly than new share issues and debt
�nancing. Among the most important ones are transaction costs, tax advantages, agency
problems, costs of �nancial distress and asymmetric information.
In the early literature, the e¤ects of cost of capital on investment have been ana-
lyzed separately from �nancing constraints. The more recent contributions discuss the
interplay between those two e¤ects (Keuschnigg and Ribi (2010), Edgerton (2010), Zwick
and Mahon (2016)). Keuschnigg and Ribi (2010) provide a model in which �nancing
constraints interact with cost of capital and they �nd that, in the absence of �nancing
frictions, pro�t taxes reduce investment by their e¤ect on the user cost of capital. With
�nance constraints due to moral hazard, investment becomes sensitive to cash-�ow and
own equity of �rms. In turn, Edgerton (2010) �nds that �rms are considerably more
responsive to investment incentives when their ratio of cash �ows to assets is high. He
1For comprahensive literature reviews summarizing the e¤ects of tax incentives on investment seeHassettHubbard2002 (2002), Bond and Van Reenen (2007)
2For summaries see Hassett and Hubbard (2002) and Hanlon and Heitzman (2010).
2

explicitly models a �rm facing �nancing constraints by using tax-adjusted Q model based
on Hayashi (1982) and Summers (1981) in a setting with �nancial constraints and carry-
backs and carryforwards of operating losses. His model allows him to hypothesize that
investment responses to tax incentives may di¤er between taxable and nontaxable �rms,
and they may be dampened by a binding �nancing constraint. This is also what he �nds
in his empirical contribution. Zwick and Mahon (2016) show results from bonus depreci-
ation reform in the US which indicate that �nancial frictions might amplify investment
responses to tax incentives. What is more, they show that �rms respond strongly when
tax policy generates immediate cash �ows but not when cash �ows come in the future.
This paper contributes to the discussion of the joint e¤ects of �nancing constraints and
cost of capital on investment. It tests the binding nature of �nancing constraints using
a tax reform of Canadian income trusts. Income trusts were two-layer Canadian �ow-
through entities that were not taxed at the trust level, if they distributed all their cash
�ows. They consisted of an income trust and an operating company. The unitholders
of income trusts were taxed on the distributions made at their marginal income tax
rates. The popularity of the income trust structure can be attributed to two distinct
tax advantages. The �rst one is the ability to decrease corporate income tax at the
operating company level due to facilitating higher leverage, the second one is lower total
tax on distributed pro�ts for ultimate owners. Earnings, which might otherwise have
been retained and used as a low cost source of �nance for investment, were eliminated
(by higher related-party debt) at the operating company level and could not be retained
(at the trust level) without foregoing the tax advantage. Therefore on one hand an
income trust had a lower cost of capital for all sources of �nancing due to elimination of
corporation tax, but on the other hand it was cash constrained and it had to rely more
on the more expensive external sources to �nance its investment.
In the context of a traditional company, reducing the e¤ective tax rate to zero, reduces
the cost of capital for all types of �nancing. Holding everything else constant, if a similar
tax avoidance scheme was available to Canadian corporates, by decreasing cost of capital,
it would induce higher investment. In the context of an income trust, the cost of capital
for any given source of investment �nance will also be lower if the e¤ective corporate
income tax rate can be reduced close to zero. However, the trusts structure also makes
investment more reliant on external sources of �nance (third party debt or issues of new
units) which may be more costly than internal funds. Therefore for income trusts the
�nancing constraints are often binding due to low availability of cash �ows. Therefore the
cost of investment of an income trust is higher than that of a traditional corporation with
the same tax payments, and this could lead to lower investment than that of a traditional
Canadian corporation.
Since the decision of the company to convert to income trust is an endogenous one, I
do not analyze its e¤ects on investment. Instead, to show whether �nancially constrained
3
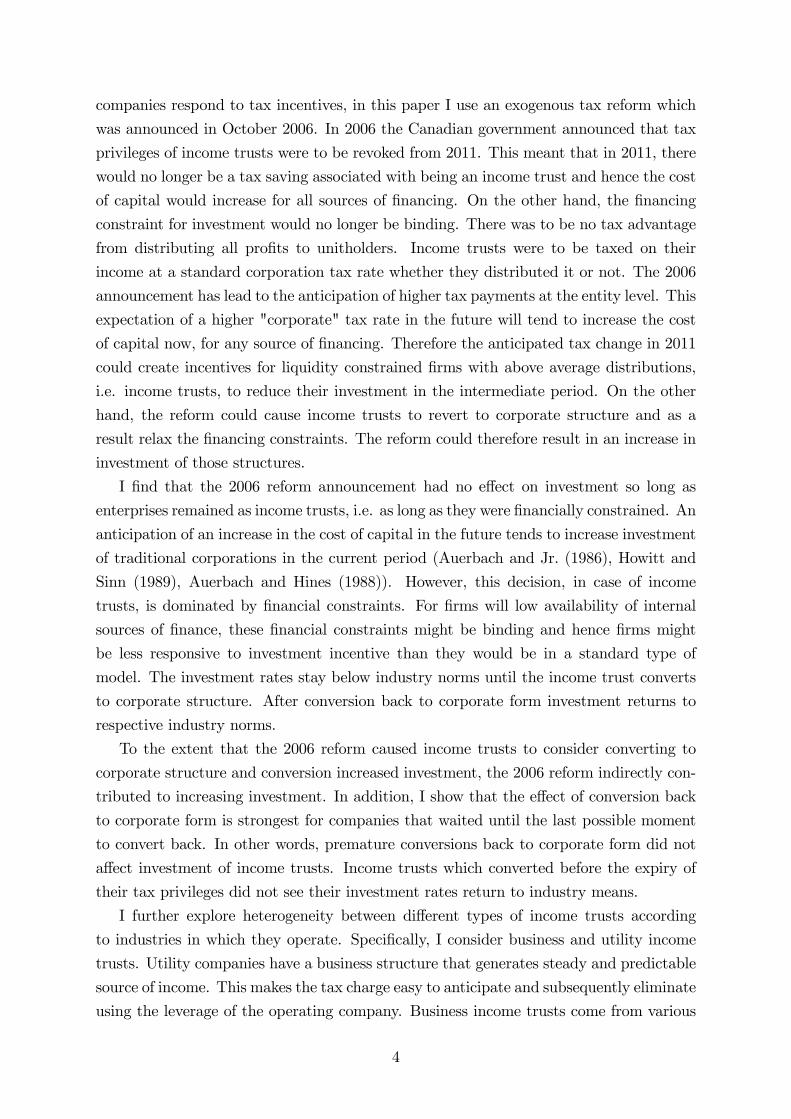
companies respond to tax incentives, in this paper I use an exogenous tax reform which
was announced in October 2006. In 2006 the Canadian government announced that tax
privileges of income trusts were to be revoked from 2011. This meant that in 2011, there
would no longer be a tax saving associated with being an income trust and hence the cost
of capital would increase for all sources of �nancing. On the other hand, the �nancing
constraint for investment would no longer be binding. There was to be no tax advantage
from distributing all pro�ts to unitholders. Income trusts were to be taxed on their
income at a standard corporation tax rate whether they distributed it or not. The 2006
announcement has lead to the anticipation of higher tax payments at the entity level. This
expectation of a higher "corporate" tax rate in the future will tend to increase the cost
of capital now, for any source of �nancing. Therefore the anticipated tax change in 2011
could create incentives for liquidity constrained �rms with above average distributions,
i.e. income trusts, to reduce their investment in the intermediate period. On the other
hand, the reform could cause income trusts to revert to corporate structure and as a
result relax the �nancing constraints. The reform could therefore result in an increase in
investment of those structures.
I �nd that the 2006 reform announcement had no e¤ect on investment so long as
enterprises remained as income trusts, i.e. as long as they were �nancially constrained. An
anticipation of an increase in the cost of capital in the future tends to increase investment
of traditional corporations in the current period (Auerbach and Jr. (1986), Howitt and
Sinn (1989), Auerbach and Hines (1988)). However, this decision, in case of income
trusts, is dominated by �nancial constraints. For �rms will low availability of internal
sources of �nance, these �nancial constraints might be binding and hence �rms might
be less responsive to investment incentive than they would be in a standard type of
model. The investment rates stay below industry norms until the income trust converts
to corporate structure. After conversion back to corporate form investment returns to
respective industry norms.
To the extent that the 2006 reform caused income trusts to consider converting to
corporate structure and conversion increased investment, the 2006 reform indirectly con-
tributed to increasing investment. In addition, I show that the e¤ect of conversion back
to corporate form is strongest for companies that waited until the last possible moment
to convert back. In other words, premature conversions back to corporate form did not
a¤ect investment of income trusts. Income trusts which converted before the expiry of
their tax privileges did not see their investment rates return to industry means.
I further explore heterogeneity between di¤erent types of income trusts according
to industries in which they operate. Speci�cally, I consider business and utility income
trusts. Utility companies have a business structure that generates steady and predictable
source of income. This makes the tax charge easy to anticipate and subsequently eliminate
using the leverage of the operating company. Business income trusts come from various
4

industries, some of which are growing fast and hence the tax charge is less predictable.
They were generally thought of as less suitable for income trust structure (Aggarwal
and Mintz (2004), Lefebvre and Goomar (2006), Halpern and Norli (2006)). I show that
the decision of a publicly traded company to convert to an income trust had a negative
e¤ect on investment rate, but only for utility type income trusts. I also show that
utility type income trusts invested more than typical Canadian utility companies before
they converted to the trust structure. Business income trusts outside the utilities sector
did not lower their investment after their conversion, but companies which converted to
business income trusts had lower investment than sector averages for corporates before
they actually converted to the trust structure.3
These �ndings lead me to the conclusion that when �nancing constraints are binding
�rms do not react to tax (dis)incentives. They support recent contributions from the
empirical literature on the e¤ects of limited cash �ow on investment incentives (Zwick
and Mahon (2016) and Edgerton (2010)). In line with those studies, I show that limited
availability of cash at the company level a¤ects investment and dampens the e¤ects of
cost of capital. The conversion to income trust structure, in spite of o¤ering very low
cost of capital, reduces investment of converted companies. Further, similar to Zwick
and Mahon (2016), investment does not react to the incentive unless there are immediate
cash �ow bene�ts. The 2006 reform had no immediate e¤ects, since �nancing constraints
were binding for income trusts until they converted back to corporate form. This e¤ect
dominates the expectation of higher cost of capital in the future. However, once �nancing
constraints ceased to be binding and income trust converted back to corporate form,
the investment of income trusts has returned to industry means. These results suggest
that the e¤ect of �nancial constraints strongly prevails over that of cost of capital for
investment.
The rest of the paper is organized as follows. Section 2 gives an overview of Canadian
Income trusts structure and their tax treatment in more detail, Section 3 presents a
simple empirical model, Section 4 describes the data, while Section 5 reports the empirical
results. Section 6 concludes.3I draw on the research of Edwards and Shevlin (2011) and Doidge and Dyck (2013), who both analyze
the 2006 Canadian trusts tax reform. Edwards and Shevlin (2011) look at the e¤ects of the 2006 incometrusts reform on market valuations of income trusts, while Doidge and Dyck (2013) analyze the impact ofthe reform on investment as well as payouts and leverage. In addition, they include empirical evidence forthe e¤ect of conversion to income trust status on those variables. Their �ndings point towards negativee¤ects of conversion to income trust on investment, but positive e¤ects on payouts. On the other hand,they �nd that after the 2006 reform trusts have signi�cantly increased their investment rates relativeto corporations, while their payouts declined relative to corporations. There is some evidence in theliterature that the 2006 reform resulted in negative unit price and market value e¤ects for income trusts(Doidge and Dyck (2013), Edwards and Shevlin (2011), Glew and Johnson (2011)).
5

2 Canadian Income Trusts
The structure of income trusts crucially consists of two main entities - an income trust
and an operating company. The general mechanism of setting up an income trust usually
starts with management of an existing company proposing the structure to the company
shareholders. Subject to their approval a Canadian resident income trust is set up as a
separate entity, which sells its units to the public via an o¤ering. The trust is controlled by
a group of trustees and is established for the bene�t of investors who are its bene�ciaries,
and whose interests in the trust capital and income are represented by their ownership of
publicly issued units in the trust (Mintz and Richardson (2006)). The proceeds gathered
from the public o¤ering are used to acquire subordinated debt and common shares of the
operating company (usually third party loans such as bank loans remain in the hands
of the operating company). The underlying company can either be a previously private
company or income producing assets such as real estate.4
The subordinated notes owned by the income trust are long-term unsecured high-yield
debt that is subordinated to third party issued debt. In reality this internal debt plays a
role of tax advantaged form of equity. It is used by the income trust to minimize the tax-
able income of the operating company. The interest payments on this internal debt �ow
from the operating company to the income trust (see Figure 1) and the amount is usually
set so that the taxable income of the operating company is reduced almost to zero.5 The
income trust uses all of the income received from the operating company received in the
form of interest, royalty or lease payments and distributes it to its unitholders. In Canada,
income trusts were quali�ed as mutual funds, which meant that if they distributed all
their income they were not liable to pay any tax and hence were �owthrough entities for
tax purposes. Undistributed income at the trust level was subject to tax at the highest
personal income tax rate - which was 46%.6The amounts distributed to unitholders were
taxed at the marginal personal income tax rate, which di¤ered between di¤erent types of
shareholders.
One of the reasons why the income trust scheme became so popular in Canada is that
it allowed Canadian corporations to avoid paying corporate income tax. What appealed
to unitholders was that the relevant marginal Canadian income tax rate was at the time
lower than combined corporate and dividend tax rates across all types of investors. This
meant that there was a tax advantage to unitholders of income trusts over shareholders
4For a detailed analysis of an example of income trust IPO - General Donlee, which was a privatecompany before doing IPO as an income trust - see Hayward (2002).
5An alternative would be to set up a royalty income trust which buys all of the patents of the operatingcompany and leases them the operating company for a fee that will wipe out the taxable pro�t. Therefore,the income paid to the income trust by the operating company can also take the form of lease or royaltypayments.
6Distributions in excess of the income generated reduce the cost base of the trust units for capitalgains purposes resulting in higher capital gain taxes on the sale of the trust units.
6

Figure 1: Simple sketch of income trust structure.
Unitholders
Income trust
Operating company
Trust Units
Equity,
debt
royalty
interest,
lease
Cash
distributions
Interest, royalty,
lease payments,
dividends and
return on capital
of Canadian corporates. Table 1 summarizes the after tax income of shareholders and
unitholders in Ontario (one of Canadian provinces) and compares it between di¤erent
types of investors.7
In Ontario the federal and provincial tax rate for a traditional corporation were 35%.
On top of this a shareholder had to pay 14% tax rate on dividend payments, which
meant the total tax was 49%.8 In turn the Canadian top personal tax rate was 46%.
Pension funds in Canada are tax exempt entities, which meant that the only tax for
pension fund shareholders in Canadian corporations was 35% - the corporate tax rate,
while pension funds paid no tax if they held units of income trust. No tax credits were
available for pension fund and non-resident shareholders of Canadian corporations. In
addition, foreign investors are liable to pay withholding tax, which for example for US
investors was 15%. This meant that foreign unitholders of income trusts paid 15% tax
rate, while foreign shareholders of Canadian corporations paid 45% tax rate. It is clear
that the bene�ts of holding trust units were largest for tax exempt investors such as
pension funds, and also for foreign investors. It is less clear whether such structure was
an attractive tax-saving opportunity for a Canadian resident tax payer.
A similar structure that yields similar tax bene�ts can of course be achieved by any
company using a combination of debt and equity. For example, in the "closely held com-
7An additional complication in case of Canada was that the corporate provincial tax rate variedbetween provinces.
8Canadian resident tax payers could obtain a tax credit on tax paid by company, but before the tax re-form of 2005 there was no full integration and hence taxable Canadian unitholders and shareholders werenot indi¤erent between whether they held interests in income trusts or corporations. Income trusts werestrictly preferred. This changed after the 2005 reform, which increased dividend tax credits and fully inte-grated the tax system for Canadian resident tax payers (for more details see Edwards and Shevlin (2011)and PwC report: http://www.caiti.info/resources/Income_trust_Dec_2006_discussion_paper.pdf)
7

Table 1: After-tax income received out of 100 dollars of income, by type of investor(Ontario).
type Canadiantaxtreatmentbefore2005
topCanadiantaxpayer pensionfund foreigninvestor(US)100%debtcapitalizedincometrust 54 100 85
corporation 51 65 55
pany" setting, where there are few shareholders, owners can lend to companies in order
to reduce the corporate tax liability. However, Canada, as many other countries, has
anti-avoidance rules for "closely held companies" designed to prevent owners lending to
companies in order to reduce CIT liability.9 The high levels of debt required to reduce
taxable pro�ts are more di¢ cult to obtain when there are many shareholders - i.e. in the
"widely held company" setting. Income trusts seem intended to make the closely-held
companies form of CIT avoidance available to more widely held companies. The lack
of legislation to govern this particular form of tax avoidance seems to be an important
omission and possibly a motivation for later reforms. The income trust structure inter-
nalizes the discussion between shareholders and debtholders by making them the same
people. This is achieved by so called "stapled �nancing", which combines debt and equity
into a single security - a unit, which pays out a combination of interest and dividends.
This means that the company can handle large amounts of internal debt to create tax
shelter without risk of default or bankruptcy. For example, if the operating company
has lower cash �ow and cannot make interest payments as they become due, the trust
can renegotiate the debt terms by lowering interest payments in a manner that preserves
value without entering into costly bankruptcy proceedings. Furthermore, by the fact
that shareholders and debtholders are the same people, the incentives of the underlying
company to make an unpro�table, value reducing investments are lower.10
It is possible for the operating company to retain some of their pro�ts to fund in-
vestment. The retained pro�t is then taxed at the corporate tax rate and the treatment
is no di¤erent than in the traditional corporation. If the operating company does not
retain any pro�ts to fund new investment, the alternative is for the income trust to rely
on external funding. It faces two options, either to issue new units or third party debt. It
is tax ine¢ cient to retain income at the trust level as it is taxed at the highest marginal
personal tax rate. This debt is senior to internal debt and can be either bank debt or
privately placed debt. The problem is that this debt increases unitholders�risk, hence it
was generally small compared to the trust�s free cash �ow.
9General Anti Avoidance Rules (GAAR) provisions were introduced in Canadian jurisdiction in 1988.10In Canada, at the time, the thin capitalization rules which are intended to limit the ratio of debt to
equity only applied to Canadian corporations, but not to partnerships or income trusts. Since then therules have been tightened.
8

2.1 Why did companies convert to income trusts?
Income trusts were a controversial subject in Canada at the beginning of this century.
The opinions on bene�ts and disadvantages of income trust structure have varied amongst
policy makers and public opinion. Some say that income trusts have brought about
investment gains and helped the stagnating market boom (Hayward (2002), Aggarwal and
Mintz (2004), Glew and Johnson (2011), Elayan et al. (2009), Doidge and Dyck (2013),
Hudec and Rogers (2004), Wang (2006)). Some say that they have caused big tax leakages
for Canadian tax revenues and hampered growth via reducing investment (Aggarwal and
Mintz (2004), Tait and Lawford (2007)). Many authors seem to agree that the income
trust structure has no added bene�ts apart from the tax saving advantage (Edgar (2004),
Alarie and lacobucci (2007)). Speci�cally, Iacobucci (2013) points out that the fact the
2006 reform has almost eliminated income trusts from Canadian markets, means that
even though they utilized some of the bene�ts of choosing their own governance form,
this clearly was not the driving factor for choosing to convert into income trust structure.11
Generally, a decision of a company to convert to income trust or to use income trust as
a means of public o¤ering is a complex one. Most of the companies at the time seemed to
have been driven by the prospect of liquidity at attractive price (see the survey by Hudec
and Rogers (2004)). This was especially bene�cial for companies with large debt, who
could obtain large amounts of cash without having to give up the control of management
and decision making. What is more, Tait and Lawford (2007) suggest that the pressure
from investors might have contributed to �rms being forced into income trust structure
to maximize shareholder value.12
There is obviously a cost to converting to income trust, which varied from $200,000
to $110,000,000 (see Iacobucci (2013)). This cost as a percentage of total market capi-
talization of these companies ranged from 0.02% to 6.9% (only 6 conversions were more
than 1%). Part of this cost is certainly the investment banking industry fees. Jog and
Wang (2004) estimate that these have amounted to $800 million in the years 2001 - 2003.
This clearly indicates that conversions from standard corporations as well as income trust
IPOs were a very good deal for investment banks and encouragement on their side for
companies to use this structure could not be neglected.
The fact that some �rms used the structure to gather funds, while some seemed pressed
to convert in spite of their misgivings, seems to suggest that some companies could have
11The income trust structure allows owners of a taxable corporation to retain many of the non-taxadvantages of the corporate form while avoiding payments of corporation tax. Speci�cally, units haveattributes of ordinary common shares in that each carries a right to vote and to receive distributions.What is more, annual meetings of unitholders are held during which trustees are elected, auditors areappointed and other matters are discussed. Finally trustees have rights and obligations similar to thoseof directors of ordinary corporations (Hayward (2002), Mintz and Richardson (2006)).12The authors of this paper discuss an enormous relief that some of the directors and CEOs of com-
panies felt after the 2006 reform was announced. They cite a high pro�le CEO who said that companieswere under increasing pressure to use the structure.
9

bene�ted from the structure more than others. The question that a large body of the
Canadian tax law literature explores is what are the characteristics that make a business
suitable to become an income trust (Aggarwal and Mintz (2004), Lefebvre and Goomar
(2006), Halpern and Norli (2006)). The best candidates are the operating companies with
relatively stable operating cash �ows and minimal need for new investment. Therefore
these companies display no cyclicality, very limited existing or potential competition,
mature products in mature markets, low levels of �xed and variable costs, and more than
one revenue stream containing some degree of diversi�cation.13 These characteristics
imply that these companies have very predictable tax charges which is a key aspect in
eliminating the taxation at the operating company level.
The best suited candidates for the income trust structure were real estate and utility
type trusts. However, later conversions in spite of being other types of businesses, also
display some of the listed characteristics; for example restaurants, sugar producers or
transport companies might not be ideal candidates for this type of structure, but they
posses some of the desirable characteristics such as mature products.14 The biggest worry
in Canada in 2005 and 2006 was that the income trust structure became so popular that
even businesses that did not have any characteristics conducive to being a good income
trust started converting to the structure.
2.2 The rise and fall of income trusts
The �rst Canadian tax ruling that enabled the creation of income trust structures was
awarded in December 1985 to Enerplus Resources Fund Royalty Trust. The �rst corporate
conversion into an income trust structure occurred in 1995 and was done by Enermark
Income Fund. Initially, the income trust structure was not very popular and there were
not very many conversions or IPOs using this strategy until the beginning of 2000s (see
13NB. These are also the characteristics which allow leverage to be high for traditional corporations.14Non-traditional income trust o¤erings include for example: Connors Brothers Income Fund (a sar-
dine cannery), A &W Revenue Royalties Income Fund (a restaurant), Keg Royalties Income Fund (arestaurant), Sun Gro Horticulture Income Fund (a distributor of peat moss), Davis + Henderson IncomeFund (a cheque printer), Versacold Income Trust (an operator of refrigerated warehousing, distribution,and related businesses), General Donlee Income Fund (a manufacturer of precision-machined productsfor the military, aerospace, and other commercial industries), Swiss Water Deca¤einated Co¤ee IncomeFund (a co¤ee producer), Prime Restaurants Royalty Income Fund (a restaurant).
10

Figure 2).15 ;16
Figure 2: Number of income trusts created by year. Note: trusts, in their traditionalform, were no longer created after the 2006 reform. Source: own data.
0
10
20
30
40
50
60
70
before 1995 1996 1997 1998 1999 2000 2001 2002 2003 2004 2005 2006
IPO new conversion
After the dot-com bubble crash of 2000, the IPO market in Canada dried out. This
meant that investment banks were looking for new sources of fees. What is more, the tax
e¢ cient distributions of income trusts allowed unitholders to pay a premium to purchase
income trust units when compared with shares in corporations, particularly in the low in-
terest rate environment that followed the dot com crash. The �rst high pro�le conversion
to income trust was done by Yellow Pages Group after it became Yellow Pages Income
Fund in 2003.
Since then, income trusts recorded a spectacular surge in popularity starting from
early 2000s. Aggarwal and Mintz (2004) report that in 2003 they represented 7% of the
entire capitalization of the Toronto Stock Exchange, while Pazzaglia et al. (2005) state
15There are several di¤erent ways a taxable Canadian company can decide to take advantage of theincome trust structure. First, the operating company can be a private stand-alone �rm whose sharehold-ers decide to raise funds through a public o¤ering of income trust units. This is similar to the standardinitial public o¤ering, but at the time was more likely to be successful. Secondly, we may have a public orprivate �rm whose shareholders decide to have only part of its business to become an income trust. Thiscan for example occur by setting up a royalty income trust which buys all of the patents or licenses ofthe operating company and leases them for a fee back to the operating company. The ordinary businessof the underlying company remains private. Thirdly, the income trust could have been previously apublicly traded company whose shareholders decide to convert all or part of its shares into income trustunits without any new �nancing at the time of conversion. Finally, some of the utility type income trustshave been created by acquisition of new oil �elds or pipelines which coincided with creation of an incometrust.16In Figure 2 conversion refers to conversion of a previously publicly traded company to income trust,
IPO means that a previously private company used income trust as means of an IPO, new means newlyacquired utility or real estate assets that went public in trust form immediately after inception as acompany.
11

that the number of public o¤erings involving income trusts constituted 41% and 86%
of the total Canadian IPOs in 2002 and 2003 respectively. At their peak in 2006 they
were 13% of the total value of the Toronto Stock Exchange (Doidge and Dyck (2013)).
Income trusts received another boost when some of the Canadian provinces in years 2004
- 2005 implemented limited liability legislation that shields trusts investors from personal
liability. At the end of 2005 the largest income trusts were added to S&P/TSX Composite
Index. Such a quick rise in their importance and numbers meant that sooner or later
they must have come under detailed scrutiny of the Canadian government.
The Canadian government became concerned with the issue of income trusts, espe-
cially the potential tax leakage that they might cause. It made multiple attempts to
discourage the increasing income trusts numbers; the �rst one was made in 2004. In
that year�s March budget the Canadian Finance Minister tried to prohibit pension funds
from investing more than 1% of their assets in income trusts or owning more than 5%
of any one trust. This proposal was not accepted by the parliament, but this indicated
that income trusts had clearly become a very important part of the political debate in
Canada.
Further, in 2005 the Canadian government o¢ cially started investigating the issue of
income trusts. In September, the Minister of Finance announced a freeze on advance tax
rulings for companies converting to income trusts, which was interpreted as an action
against the trust structure. This led to cessation of IPO activity for 2 months (from
September until November) and a reduction in trust index value of approximately 20% (as
reported by Halpern and Norli (2006)). Everyone anticipated that the government�s next
move would be to eliminate the tax-free status of income trusts (Elayan (2007)). Instead,
in November that year the government announced that it would not be implementing any
changes to the taxation of Canadian income trusts, but instead introduced dividend tax
reform. Speci�cally, by introducing enhanced gross up and dividend tax credit mechanism
it equalized the treatment of Canadian resident taxpaying shareholders and unitholders
in terms of their tax liability. This eliminated the tax advantage income trusts had for
taxable Canadian domestic investors. However, it did not eliminate the advantage held
by tax exempt or foreign shareholders.17
After that reform, the issue of income trusts appeared to be settled, which resulted in
more income trust conversions at the end of 2005 and at the beginning of 2006. However,
in October 2006 the �nal blow to Canadian income trusts was given by the government
as it announced a tax on income trust distributions (excluding REITs) with e¤ect from
1st January 2011. The reform, which was announced on October 31, 2006, is also knows
as Halloween Massacre or Tax Fairness Plan (TFP).18 The imposition of tax, which was
17This move had academic support before it was introduced. The advocates of the dividend tax creditswere Aggarwal and Mintz (2004).18The 2006 reform has met with some criticism in the academic literature. Namely, Alarie and lacobucci
(2007) suggest that in spite of claims of being neutral, the reform actually actively discouraged the
12

announced to be equivalent to that paid by corporations, was meant to equalize the
tax treatment of Canadian corporations and income trusts.19 The government said that
the main motivation behind the reform was a response to an increase in tax avoidance.
As a result the income trust structure would no longer be tax bene�cial to companies
starting from January 2011. The reform was to take e¤ect immediately with respect to
all new trusts created after 31st October 2006, but no new ones were created. Trusts that
already existed were given 4 years grandfathering period during which they were allowed
to exist on previous terms, provided that they adhered to "normal growth" limitations
imposed after the TFP reform. Speci�cally, if the trust grew by more than 100% of its
market capitalization in 2006, it would immediately be subject to the new tax.20 After
January 2011 companies were allowed to remain in the trust structure with no tax bene�ts
associated with the structure.
Table 2 describes the tax rates imposed on income trusts and corporates as of January
2011. As mentioned above the combined federal and provincial corporation tax rate has
been decreased in Canada from 35% in 2006 to 31.5% in 2011. This meant that pension
funds, which were not liable to pay any investor-level tax and received no tax credits, were
only taxed at the corporate tax level of 31.5%. In turn, domestic Canadian residents who
were shareholders of Canadian corporations were now taxed at 31.5% corporation tax
rate and 14% dividend tax rate (after tax credits), which meant that the total investor
tax rate was 45.5% in 2011. In the case of foreign investors, with 31.5% corporation
tax rate and 15% withholding tax rate (US), their total tax liability was 41.5% in 2011.
The reform has changed the tax treatment of pension funds and non-resident investors,
without altering that of resident taxpayers (apart from the 0.5% tax cut).
Table 2: After-tax income received out of 100 dollar of income, by type of investor(Ontario).
type asofJanuary2011 topCanadiantaxpayer pensionfund foreigninvestor(US)100%debtcapitalizedincometrust 54.5 68.5 58.5
corporation 54.5 68.5 58.5
Due to the fact that the 31.5% tax rate was imposed on distributions of income
adoption of trust structure. They say that this might not be welcome from an e¢ ciency perspective.19The government announcement in October 2006 did not give a speci�c tax rate that was to be
applied to income trusts. The only aspect that was speci�ed by the governement was that trusts andcorporates will be taxed the same. Crucially, the 2006 reform also announced a decrease in corporate taxrates by 0.5 percentage points from 2011. This was coupled with corporation tax rate decreases alreadyannounced in the 2006 budget that decreased the Canadian federal corporation tax rate from 21% to19% by 2010. Combined with provincial taxes that meant that the rate would fall from 35% in 2006 to32% by 2010 and then to 31.5% in 2011.20For example, government cited the example of insertion of a disproportionately large amount of
additional capital as one of the situations when tax would be immediately imposed.
13

trusts, it e¤ectively equalized the treatment of corporates and income trusts for all types
of investors. Until the expiry of their privileges on January 1st 2011, existing trusts
had 4 years to decide what to do next. The �rst option was given to them by the
Canadian Department of Finance which announced that income trusts would be allowed
to convert into taxable Canadian corporations without any adverse tax consequences
to them or their unitholders so long as the conversion occurred before December 31st
2012. Therefore, in the period between January 2011 and December 2012 trusts could
still convert to corporate structure, but in that period there would be no advantage from
being an income trust. If they converted after December 2012 there would be a tax
cost associated with conversion. Therefore, as Figure 3 shows, most of the conversions
happened before or on January 1st 2011.21 Some of income trusts have exited the income
trust status immediately in 2007, some waited longer even until 2011 when their privileges
expired. The "normal growth" constraint on income trusts would have meant that trusts
with better growth prospects would exit the trust structure before January 2011 and
only trusts with lower growth prospects would remain trusts for as long as possible.
After December 2012 only 16 companies that were not REITs have remained in a trust
structure and only 11 of those were still trading as of September 2013.
Figure 3: Number of exits out of the trust structure. Conversion means converstionto publicly traded corporate structure, other is either conversion to private compnay,liquidation etc..Source: own data.
0
10
20
30
40
50
60
70
80
2005 2006 2007 2008 2009 2010 2011 2012
conversion other
Alternatively, income trusts could have converted to private companies. The reform
21The Conversion Rules were enacted into law in 2009 and allow two di¤erent conversion methods.The �rst one is exchange method: unit for share exchange with corporate successor. The second one isdistribution method: distribution of shares of a corporate subsidiary by the income trust to its unitholderson redemption of the trust units.
14

could have induced large pension funds to take existing trusts, in which they had large
shares, private. Another option was a takeover by other private or public companies
or other income trusts. This could have occurred due to the fact that the 2006 reform
caused the aggregate market capitalization of income trusts to drop by 13% (Doidge and
Dyck (2013)). As a result of this market capitalization drop, companies which converted
to income trust structure for tax saving purposes, but whose underlying business might
have not been suitable for the structure, could have faced withdrawal of investors and
might have been forced to liquidate or to become acquisition targets. Most of those other
types of exits from the trust structure occurred in the early years after the 2006 reform
(see Figure 3).
In Figure 4 we can see how income trusts have reacted to the 2006 reform in terms
of decisions on how and whether to carry on operating.22 We can see that over a half
of existing income trusts have decided to carry on as corporations and convert, while
only 6% of all trusts decided to continue in the current form and not convert. Most of
those have said that the cost of conversion to corporate form was too high (Doidge and
Dyck (2013)). 14% of income trusts were taken over by private companies, while 4% were
taken over by public ones. Not many businesses converted to private companies - only
4%. Once the company went public, it did not have incentives to go back to being private
again.
Finally, after the 2006 reform no more traditional income trusts were created in
Canada as there was no tax advantage to this structure anymore. However, the structure
has recently received some attention with some new energy trusts emerging in 2010 -
2012. These new trusts are exploiting a loophole in the 2006 legislation, which allows
trusts holding non-Canadian properties or assets to exploit the income trust structure.
The 4 new energy trusts, currently trading on TSX, are Argent, Crius, Eagle and Parallel.
They all hold utility type assets located in US, but the income trust itself is located in
Canada.
22In many cases, the question of what happened to income trusts after the 2006 reform does not havea straightforward answer. For example, the trust would �rst be taken over by another trust which thenwould convert to a publicly traded company. Or the trust would �rst go private but then one year laterit will be in liquidation. In Figure 4, I only show what initially happens to the trust, i.e. if it �rst wentprivate and then wound down, I will count it as "to private".
15

Figure 4: Conversions from income trusts to corporations by type of conversion over2006-2011. Total sample of trusts is 286, REITs are included in the "not a¤ected"category.Source: own data.
2
15 5%
23 8%
16 6% 3
1%
21 7%
39 14%
10 3% 11
4%
147 52%
in liquidation
not affected
not converting
other
takeover by another trust
takeover by private company
takeover by public company
to private
to publicly traded corp
3 Empirical model
To estimate the e¤ects of tax incentives on investment I use the exogenous shock created
by the 2006 income trusts reform. This reform a¤ected income trusts only, with no e¤ect
on corporates. Therefore it is suited to using di¤erence in di¤erence methodology by
comparing income trusts to publicly traded Canadian corporations before and after the
reform. The identi�cation strategy relies on the fact that corporations were not a¤ected
by the announcement of the 2006 reform, while income trusts lost their tax privileges,
though not immediately (see �gure 5 for the unanticipated drop in the market value of
income trusts relative to corporations). To identify the e¤ects of the reform on investment
I also require common trends in investment rate in the absence of the 2006 reform. As
described above the reform was primarily intended to curb down tax avoidance, hence it
is conceivable that it was not introduced in response to changes in investment for one type
of companies.23 To conduct the analysis I estimate, using OLS, the following baseline
model:
Iit = �i + �1trust_dummyi + �2comp_is_trustit + �3post_TFP_dummy +
+�4comp_is_trustit � post_TFP_dummyt + �5post_conversionit + �Xit + �t + �it;
where Iit is the investment rate of company i in year t; trust_dummy is equal to 1 in
23For a graph showing mean investment rates of income trusts from a balanced panel and corporatesfrom a matched sample of traditional companies with similar characteristics see Fig 13 in the Appendix.
16

all years if the company was even an income trust, comp_is_trust is a dummy that takes
value 1 in the year the company converts to income trust and remains 1 until it exits the
structure and is 0 before that, post_TFP_dummy takes value 1 in the year 2007 and
remains 1 after that, post_conversion takes value 1 in the year the income trust exits
the trust structure and remains 1 forever after, �t are industry �xed e¤ects24, Xit is a
vector of control variables. The investment rate is de�ned as capital expenditures divided
by last year�s total assets. Vector Xit includes control variables as suggested by previous
literature on Canadian income trusts; these are lagged log total assets, market to book
ratio, cash �ow, leverage and industry median investment, payouts, cash holdings and
leverage.25 I use the whole sample of observations from 1994 until 2013 in the baseline
regression.
Figure 5: Market value of Canadian income trusts relative to corporations - Datastream.
140
160
180
200
220
240
260
280
440
450
460
470
480
490
500
510
01-Sep-06
08-Sep-06
15-Sep-06
22-Sep-06
29-Sep-06
06-Oct-06
13-Oct-06
20-Oct-06
27-Oct-06
03-Nov-06
10-Nov-06
17-Nov-06
24-Nov-06
01-Dec-06
08-Dec-06
15-Dec-06
22-Dec-06
29-Dec-06
Incometrustsonly Corporatesonly
I do not answer the question of what happens to investment of a company after it
becomes an income trust separately. This is because the decision to become an income
trust is an endogenous one and a company which is planning on reducing its investment
in the future might have a incentive to convert to income trust structure. However, in
estimating the e¤ects of the 2006 reform on investment I separately include a dummy
that signi�es the conversion to income trust structure, comp_is_trustit. Therefore the
coe¢ cient �2 in the equation above will tell me how investment of previously publicly
traded companies changes after they convert to income trust structure.
Due to the fact that existing trusts have received grandfathering period after the 2006
reform until 2011, it is very hard to identify the immediate e¤ects of the 2006 reform.
24See Appendix, Table 7 for a summary of industry codes and which industry they refer to.25More precise de�nitions of these control variables are provided in the Appendix, section 7.1.
17
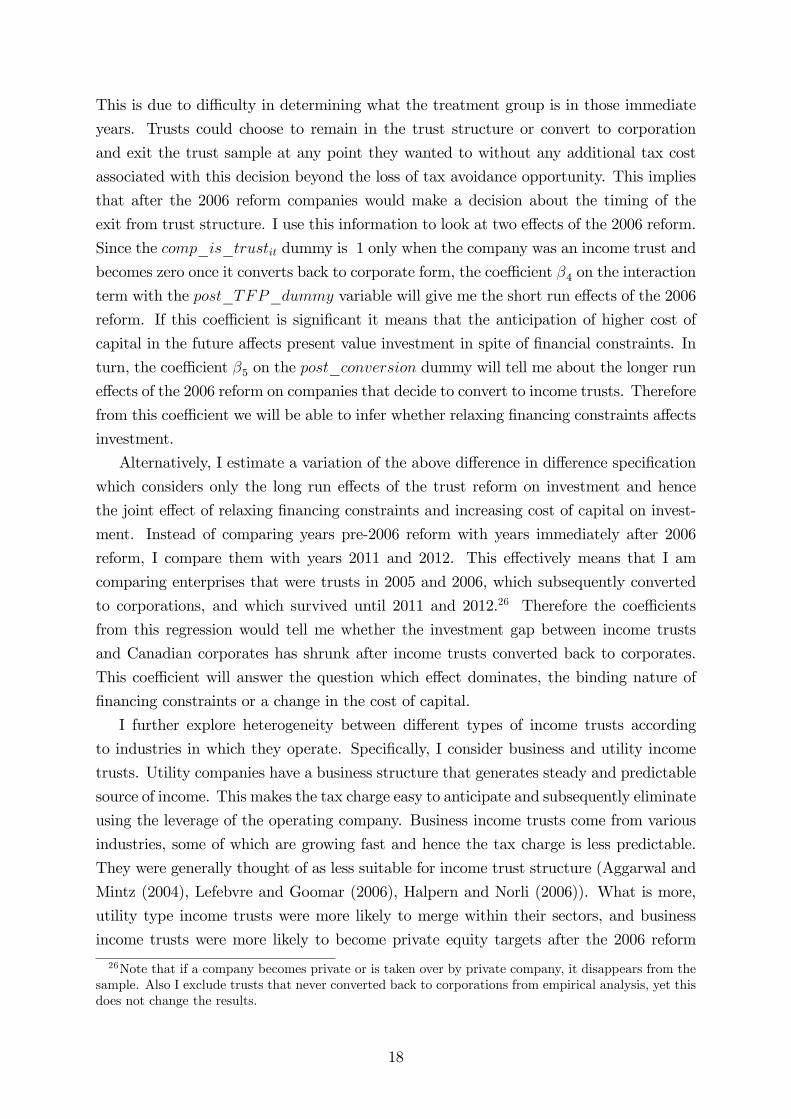
This is due to di¢ culty in determining what the treatment group is in those immediate
years. Trusts could choose to remain in the trust structure or convert to corporation
and exit the trust sample at any point they wanted to without any additional tax cost
associated with this decision beyond the loss of tax avoidance opportunity. This implies
that after the 2006 reform companies would make a decision about the timing of the
exit from trust structure. I use this information to look at two e¤ects of the 2006 reform.
Since the comp_is_trustit dummy is 1 only when the company was an income trust and
becomes zero once it converts back to corporate form, the coe¢ cient �4 on the interaction
term with the post_TFP_dummy variable will give me the short run e¤ects of the 2006
reform. If this coe¢ cient is signi�cant it means that the anticipation of higher cost of
capital in the future a¤ects present value investment in spite of �nancial constraints. In
turn, the coe¢ cient �5 on the post_conversion dummy will tell me about the longer run
e¤ects of the 2006 reform on companies that decide to convert to income trusts. Therefore
from this coe¢ cient we will be able to infer whether relaxing �nancing constraints a¤ects
investment.
Alternatively, I estimate a variation of the above di¤erence in di¤erence speci�cation
which considers only the long run e¤ects of the trust reform on investment and hence
the joint e¤ect of relaxing �nancing constraints and increasing cost of capital on invest-
ment. Instead of comparing years pre-2006 reform with years immediately after 2006
reform, I compare them with years 2011 and 2012. This e¤ectively means that I am
comparing enterprises that were trusts in 2005 and 2006, which subsequently converted
to corporations, and which survived until 2011 and 2012.26 Therefore the coe¢ cients
from this regression would tell me whether the investment gap between income trusts
and Canadian corporates has shrunk after income trusts converted back to corporates.
This coe¢ cient will answer the question which e¤ect dominates, the binding nature of
�nancing constraints or a change in the cost of capital.
I further explore heterogeneity between di¤erent types of income trusts according
to industries in which they operate. Speci�cally, I consider business and utility income
trusts. Utility companies have a business structure that generates steady and predictable
source of income. This makes the tax charge easy to anticipate and subsequently eliminate
using the leverage of the operating company. Business income trusts come from various
industries, some of which are growing fast and hence the tax charge is less predictable.
They were generally thought of as less suitable for income trust structure (Aggarwal and
Mintz (2004), Lefebvre and Goomar (2006), Halpern and Norli (2006)). What is more,
utility type income trusts were more likely to merge within their sectors, and business
income trusts were more likely to become private equity targets after the 2006 reform
26Note that if a company becomes private or is taken over by private company, it disappears from thesample. Also I exclude trusts that never converted back to corporations from empirical analysis, yet thisdoes not change the results.
18

(Glew and Johnson (2011)). To consider di¤ering investment responses between di¤erent
types of income trusts I run triple di¤erence in di¤erence model of the form:
Iit = �i + �1bu sin ess_trusti + �2utlity_trusti +
+�3bu sin ess_trusti � comp_is_trustit + �4utlity_trusti � comp_is_trustit ++�5bu sin ess_trusti � post_TFP_dummyt � comp_is_trustit ++�6utlity_trusti � post_TFP_dummyt � comp_is_trustit ++�7utlity_trusti � post_conversionit + �8bu sin ess_trusti � post_conversionit ++�Xit + �t + �it;
The coe¢ cients of interest here are �5 which tells me me how di¤erent was the im-
mediate impact of the 2006 reform on investment of business income trusts relative to
corporations and �6 which tells me how di¤erent was the immediate e¤ect of the re-
form on investment of utility type trusts relative to corporations. I am also interested in
the coe¢ cients on the post_conversion dummies for both utility and income trusts to
estimate the indirect e¤ects of the 2006 reform on investment.
In both of those di¤erence in di¤erence speci�cations I am initially comparing years
1994 - 2006 with years after the reform, either 2007 - 2013 in the baseline set of results
and 2011-2012 for the long-run e¤ects of the reform.
3.1 Sample selection
The problem with OLS estimations of the di¤erence in di¤erence is that the decision to
convert to income trust may not be exogenous and, as mentioned in Section 2, there are
particular types of companies that are more suited for the structure and hence more likely
to convert. For example, Pazzaglia et al. (2005) �nd that the converting companies have
higher market-to-book ratios and higher pro�tability than non- converting companies.27
The comparison of characteristics of public companies that converted to income trusts
in the years before they converted with characteristics of similar corporates over the
similar time period (see Table 3) suggests that, on average, before they converted to
the income trust structure these enterprises invested more than similar corporates, held
less cash, were larger (more total assets, larger market capitalization and net sales).28
Income trusts on average paid about the same amount of dividends out as corporates,
but had higher leverage. This means that when estimating the e¤ects of conversion to
27NB. These could be associated with higher pro�tability to market power ratios, rather than withbetter growth opportunities.28I only have data before conversion to income trust for companies that were previously publicly
traded.
19

income trust on investment, companies with certain characteristics might be self selecting
themselves into the income trust sample.
Table 3: Descriptive statistics: income trusts vs corporates. Mean for income trustscalculated using years before conversion to income trust, Mean for corporates calculatedon all observations for 1995 - 2005 and with comparable size and industry mix to theincome trust ones. All data winsorized at 1 percent. Source: Datastream.
incometrustsstats N mean sd median max mininvestmentrate(capex) 227 0.16 0.16 0.10 0.45 0investmentrate(capexplusacquisitions) 185 0.22 0.18 0.18 0.48 0cashholdings 301 0.07 0.14 0.01 0.75 0payouts 303 0.01 0.01 - 0.04 0leverage 290 0.26 0.15 0.26 0.54 0totalassets 318 373,609 443,789 158,963 1,390,613 3,079cashflowsafterdividends 303 0.09 0.06 0.11 0.14 -0.18bookvaluepershare 293 4.70 3.64 3.82 11.39 0.01marketcapitalization 185 390,772 416,528 213,472 1,141,345 5,319netsales 341 249,658 260,464 116,163 770,935 0netincomebeforeextraordinaryitemsanddividends 340 13,770 18,132 7,174 47,689 -12740
incometaxes 344 5,535 5,983 2,563 14,653 -726incometaxes/totalassets 309 0.02 0.02 0.02 0.03 -0.02 corporates N mean sd median max mininvestmentrate(capex) 3,377 0.12 0.14 0.05 0.45 0investmentrate(capexplusacquisitions) 2,522 0.15 0.16 0.08 0.48 0cashholdings 4,426 0.15 0.21 0.05 0.75 0payouts 4,251 0.01 0.01 0.00 0.04 0leverage 4,301 0.21 0.19 0.18 0.54 0totalassets 4,524 345,535 483,013 101,429 1,390,613 709cashflowsafterdividends 4,233 0.01 0.15 0.06 0.14 -0.50bookvaluepershare 4,460 4.36 4.12 2.80 11.39 0.01marketcapitalization 4,006 289,787 387,630 94,210 1,141,345 2,084netsales 4,575 212,707 287,489 51,055 770,935 0netincomebeforeextraordinaryitemsanddividends 4,581 8,758 18,286 1,567 47,689 -12740
incometaxes 4,422 3,845 5,686 451 14,653 -726incometaxes/totalassets 4,365 0.01 0.02 0.01 0.03 -0.02
To partially account for the self-selection problem I reestimate the empirical models
discussed above using �rm �xed e¤ects regressions. The inclusion of �rm �xed e¤ects
excludes the e¤ects of selection of companies with particular, constant over time, char-
acteristics on my results. But I also have to worry about companies self selecting to
become an income trust based on time varying characteristics, for example, companies�
expectations, at the time of conversion, that investment opportunities are deteriorating.
To account for this, in addition to traditional controls, I also control for time trends as
well as industry median investment, payouts, cash holdings and leverage in the baseline
regression.
Alternatively, to account for the self selection of companies into income trust group I
20

use a non-parametric propensity score matching. This method allows me to estimate not
only the causal e¤ects of the reform but also the e¤ects of conversion to income trust struc-
ture. Propensity score matching is a method that enables choosing comparable control
companies with respect to the group of treated companies, in my case income trusts. As
such, in the �rst stage I regress the income trust dummy on a set of observable characteris-
tics that determine whether a company is likely to become an income trust. In the probit
regression I include the following: lagged leverage, lagged payouts, lagged investment,
lagged cash holdings, lagged tax rate, lagged growth opportunities, lagged tangibility,
lagged pro�tability, lagged industry median investment, lagged industry median payouts,
lagged industry median casholdings, lagged industry median leverage, lagged logarithm of
total assets. The predicted probabilities from the �rst stage regression, known as propen-
sity scores, are then used to construct a matched sample of comparable corporates. It
is important to note here that I want to choose comparable corporates based on the pre
2006 reform characteristics of both income trusts and corporates. Therefore I run the
probit model on both 2005 and 2006 only and compare the results using either of those
years.
The matching algorithm I use is the nearest neighborhood matching within a caliper,
without replacement.29 This means that for each income trust I �nd the closest compa-
rable Canadian corporate in terms of the propensity score within a certain distance of
predicted probability. This strategy generates a sample of income trusts that belong to
the treated group and a same-sized sample of Canadian corporates that belong to the
control group which have similar propensity scores.30 In the second stage I estimate the
same di¤erence in di¤erence model I discussed above but controlling for sample selection
by using propensity score matched observations only.
4 Data
4.1 Data sources description
A substantial part of this project involved detailed data collection on Canadian income
trusts. The sample of Canadian income trusts comes from a list of income trusts traded
on the Toronto Stock Exchange (TSX) at the end of October 2006. To this, I also added
income trusts that traded on TSX before October 2006 and were taken over or wound29I experiment with various matching approaches, but they all yield similar results. When considering
propensity score matching one always has to trade o¤ bias with variance of the estimates, i.e. using moreobservations to construct the matched sample (e.g. matching within a radius, k-nearest neighbourhoodor kernel meatching) implies lower variance in the estimates, but if the observations used for matchingare not very similar to to the treated group then the larger bias arises.30For the results from the �rst stage probit model see Table 8 in the Appendix. For the quality of
matching post estimation test where I compare means of the explanatory variables for both matched andunmatched samples see Fig 14 in the Appendix.
21

down before the 2006 reforms. The total number of income trusts in my data sample is
286, of which 16 were no longer trading in October 2006.31
To obtain detailed information about each income trust I manually collect data on
each of them from SEDAR.32 SEDAR o¤ers access to most public securities documents
and information �led by public companies in Canada. The type of information o¤ered,
which is useful in the context of this paper, includes:
� initial public o¤ering (IPO) documents, which detail the operations of a privatecompany before the income trust conversion as well as the name of underlying
operating company
� material change documents, notices and news releases, which enable me to collectinformation on conversions to and from income trusts and exact dates of those
events
The above documents also enable to me collect data on the type of company that
the income trust was before the conversion, namely private or public and the method of
conversion, namely using IPO and going from private to public or converting the shares
into trust units or setting up a new entity to purchase properties or mines as was the
case for a lot of REITs and energy trusts. SEDAR also allows me to include information
on what happened with the income trust after it stopped reporting information in the
Datastream database. Therefore, I collect information on names of corporations that
income trusts converted to, names of trusts or companies that took over the income
trusts and information on whether and how income trusts stopped their operations.
In Canada over the period 1994 - 2013 there were 286 income trusts in total, of which
61% were business income trusts, while the rest were either energy, pipelines or real
estate income trusts (see Figure 6). 11% of companies in my initial sample are REITs,
that were not publicly traded companies before, but either were created for the purpose
of purchasing new properties at the time of the IPO or were private companies before.
These trusts are dropped from the empirical analysis. Of the total 286 income trusts,
almost 60% were private companies before they decided to do an IPO using business
income trusts structure. 23% were publicly traded companies in Canada which decided
to convert all of their shares into income trusts units, while 7% converted only part of
their business into income trust.33 Complementary to that information, 30% of income
31In Datastream I only found data for 275 income trusts. This sample is further limited as I includemore variables.32http://www.sedar.com/homepage_en.htm This is equivalent to UK�s Company House in so far as
it publishes accounting statements of all Canadian companies.33Bautex Energy Trust is an example of trust who did a conversion, but only partially. Bautex Energy
Ltd reorganized itself into Baytex Energy Trust and Crew Energy Inc. In this arrangement BautexEnergy Ltd split into two units, an income trust that traded units and corporation which trades shares.Private companies also do partial IPOs, where only part of their company goes public using income trust
22

trusts converted from publicly traded corporations, while 55% became income trusts via
IPO. The remaining 14% of companies were created just prior to IPO and those are
mainly REITs and energy trusts.
Figure 6: Distribution of business income trusts by type.Source: own data.
173 61%
32 11%
32 11%
28 10%
21 7%
Business Trust
Energy Trust
not traded in Sept 2006
REIT
Power & Pipelines
For �nancial variables I use Datastream database, which is commonly used in Cana-
dian corporate �nance studies.34 Datastream includes information on Canadian listed
companies only. This is a limitation in that over 60% of Canadian business income trusts
were private companies before the conversion to the trust structure. However, since the
reporting requirement for private companies in Canada does not exist, there is no publicly
available data on previous accounts of those companies anywhere.35 What is more, the
�nancial statements of income trusts are generally consolidated ones, which means that
I cannot distinguish between accounts of income trusts and underlying businesses.36
4.2 Data cleaning and selection
In the main analysis I always exclude REITs and income trusts that have done an IPO
in Canada via IDS or IPS. These last two types of trusts are based in the US and their
reactions to the reforms will not be comparable to the domestic Canadian income trusts.
structure. Example here is AirCanada, which operated as private company, but created Aeroplan incometrust which purchased all customer license loyalty cards from the operating company and leased themback for a fee.34I also re-run some robustness checks using Compustat. However, Compustat covers fewer income
trusts and does not o¤er any additional information over Datastream.35This has also been con�rmed by looking at the income trusts in the Orbis dataset, which contains
the accounting data on private and public companies if it is available.36See Jog and Wang (2006) for further discusson on di¤erent discolure requirements for Canadian
enterprises.
23

I exclude REITs due to the fact that the reform of 2006 did not apply to them, hence I
do not want them to be in�uencing my di¤erence in di¤erence estimations. This means
that I exclude just over 10% of the income trusts at the outset.
The sample of Canadian traded companies used for my analysis comes from Datas-
tream. Following Doidge and Dyck (2013) I initially included all the Canadian traded
companies that have any data on their main �nancial variables. This however, means
that in my empirical analysis I would be comparing income trusts to companies from
di¤erent industries and with di¤erent size distributions. To the extent that di¤erent in-
dustries might react di¤erently to economic outcomes, in my empirical analysis I drop all
corporations from industries in which income trusts have no presence37.
Further, I consider the size distribution of income trusts and traditional Canadian
companies. In Figure 7 we can see that income trusts are quite large in comparison to
traditional corporates. To make the sample of corporations more comparable I exclude
all companies with log(assets) smaller than 10, which means that I exclude all compa-
nies with assets smaller than $22million. Small businesses are inherently di¤erent from
larger ones and if income trusts are large relative to traditional Canadian companies it it
imperative that we do not include the former in the analysis sample.
Figure 7: Size distribution plots after dropping industries in which trusts do not operate;income trusts and corporates comparison.Source: Datastream.
05
10
0 10 20
corporations
010
20
0 10 20
income trusts
Per
cent
log_assets
The manual sample selection is a simple way to construct a comparable sample of
corporates to use for the di¤erence in di¤erence regressions. The more sophisticated
37For a summary table with industries included in the selected sample see Table 7 in the Appendix.
24

strategy I use is propensity score matching described above that will choose the sample
of corporates based on their predicted probabilities from the regression of explanatory
variables on an income trust dummy. This method selects comparable corporates based
not only on industry and size, but also additional relevant characteristics identi�ed by
the Canadian income trusts literature.
4.3 Summary statistics
In this subsection I provide descriptive statistics on the main variable of interest - invest-
ment. First, I look at the behaviour of this variable around the conversion to income trust
date. Then I consider its behaviour around the 2006 TFP reform for both income trusts
and other publicly traded companies. The summary statistics are the �rst indication of
the e¤ects the 2006 reform had on investment.
In Figure 8 I look at investment around the conversion date. I set year 0 as a conversion
year for each company and look at what happens 2 years before and 2 years after the
conversion to income trusts. I use a balanced sample of companies, hence I require a
public company to exist for all 5 years around the conversion and a private company
to exist at least 2 more years after the conversion. I can see that investment rate of
formerly public companies decreases in the year of conversion as well as in the two years
after conversion. It falls substantially from a mean of about 18% to a mean of about
11%. The investment rate of formerly private companies decreases from 24% in the
year of conversion to below 5% 2 years after the conversion. However, in the case of
formerly private companies we cannot be certain whether the investment rate in the
year of conversion was unusually high or not.38 In Figure 9 I compare business and
utility income trusts, but only for companies that were previously publicly traded ones.
There are signi�cant di¤erences in the reaction of investment rates to conversion between
business and utility income trusts. Utility income trusts decrease their investment rates
after conversion while business income trusts do not. Investment rate of business income
trusts is much lower throughout the sample than that of utility income trusts.
This decrease in investment is coupled with an increase in payouts or distributions for
formerly public companies. To some extent this e¤ect is mechanical as to take advantage
of the trust structure an income trust has to pay out all its cash �ows. This will mean
that cash �ows minus payouts decline substantially for those companies. In the year
of conversion we observe a sharp decrease in cash holdings of income trusts that were
previously publicly traded companies. This decrease is much smaller one and two years
after conversion. I �nd that the increase in payouts is larger than the increase in cash
�ows, which means a decrease in free cash �ows (which is measured by cash �ows minus
dividends or distributions). This is consistent with what the trust structure implies
38This was also the year of an IPO for all of these private companies.
25

in terms of its �ow through nature. It also con�rms the cash constrained nature of
companies that do decide to convert to income trust structure. This is an important
factor in explaining the e¤ects of the 2006 reform on investment.
Furthermore, due to limited availability of internal �nance, income trusts have to
�nd other ways to �nance its investment. One of the possibilities is external borrowing.
Consistent with that, leverage of formerly public companies increases after conversion
to income trusts. The increase in leverage suggests that borrowing from third parties
increases in importance as a source of �nancing for investment.
Figure 8: Mean investment over previous years total assets, by type of entity beforeconversion; winsorized at 1 percent, balanced panel.
1
0
0.02
0.04
0.06
0.08
0.1
0.12
-2 -1 0 1 2
Cash holdings
private company public company
0
0.05
0.1
0.15
0.2
0.25
-2 -1 0 1 2
Investment
private company public company
0.1
0.12
0.14
0.16
0.18
0.2
0.22
0.24
-2 -1 0 1 2
Leverage
private company public company
0 0.01 0.02 0.03 0.04 0.05 0.06 0.07 0.08 0.09
-2 -1 0 1 2
Payouts
private company public company
Figure 9: Mean investment over previous years total assets, by type of entity: businessvs utility trusts; winsorized at 1 percent, balanced panel, only previously publicly tradedcompanies included.
1
0
0.1
0.2
0.3
0.4
0.5
0.6
-2 -1 0 1 2
Investment
utility trust business trust
0
0.05
0.1
0.15
0.2
0.25
0.3
-2 -1 0 1 2
Leverage
utility trust business trust
0
0.02
0.04
0.06
0.08
0.1
-2 -1 0 1 2
Cash holdings
utility trust business trust
0
0.02
0.04
0.06
0.08
0.1
0.12
-2 -1 0 1 2
Payouts
utility trust business trust
Income trusts were generally quite successful in reducing their corporate tax payments
to almost zero through high internal leverage. We cannot obtain data on interest pay-
26

ments between the income trusts and their operating companies. Therefore we do not
know the extent of internal debt that exists within these structures. However, we can
look at tax payments of income trusts to proxy for the extent of internal leverage within
the structures. Lower tax payments would imply successful reduction of taxable pro�ts
through the use of high interest payments.39 In Figure 10 we can observe that income
tax and income tax divided by total assets decrease sharply in the year of conversion and
one year after conversion. There seems to be no change from �rst to second year after the
conversion in terms of tax payable. What is more, the income taxes payable by converted
companies are very close to zero, which implies that the income trust structure via its
use of interest deductibility is very successful in reducing the overall tax charge.
Figure 10: Mean income taxes payable and income tax divided by total assets, balancedpanel. Source: Datastream.
0
5
10
15
20
25
-0.005
0
0.005
0.01
0.015
0.02
0.025
0.03
0.035
-2 -1 0 1 2 Th
ou
san
ds
income tax / total assets income tax
The second part of descriptive statistics involves looking at what happens to invest-
ment after the 2006 reform. Figure 11 explores a sample of 200 income trusts for which
I have �nancial variables data and divides them by the year in which they exited the
sample of income trusts. As such, the 2007 line refers to the mean investment rate of
income trusts that exited the sample in 2007; the rest of the lines are de�ned accordingly.
From this �gure we can see that trusts that exited the sample in 2011 had the lowest
investment rate on average amongst all groups. Trusts that exited in 2010 had slightly
higher mean investment rate while trusts which exited in 2009 had even higher mean
investment rate.40 These results point to an important distinction between the indirect
e¤ects of the 2006 reform on income trusts which converted before 2011 versus those that39The only available measure in Datastream is total income tax, which represent all income taxes
levied on the income of a company by federal, state and foreign governments. This is a crude proxy forCanadian corporate income tax, but it is the best one in the data we have. This is due to the inclusionof foreign taxes in the measure.40This pattern prevails for business income trusts, but not for utility income trusts.
27

converted before the expiry of their tax privileges. I will explore this di¤erence in the
empirical estimations.
Figure 11: Investment means for income trusts by when they exited the trust status,winsorized at 1 percent.
.05
.1.1
5.2
mea
n_in
v2
2006 2007 2008 2009 2010 2011year
2007 20082009 20102011
Figure 12 compares income trusts to corporations using a comparable industry and size
mix and divides the comparison by business and utility trusts. We can see that investment
rate of business income trusts declined following the 2006 reform announcement. However,
the investment rate of corporations fell by more, suggesting an important role for other
factors such as �nancial crisis in explaining the decline in investment rates of Canadian
enterprises. This implies that the gap between investment rate of business trusts and
investment rate of corporations narrowed after the 2006 reform announcement. Similar
can be said about the e¤ect of the 2006 reform announcement on investment rates of utility
trusts relative to investment rates of corporations. This is unsurprising in so far as income
trusts invest little and mainly in necessary running costs relative to corporations and pay
out most of their cash �ow. This means that when the �nancial crisis hit, corporations
could have decreased their investment by larger amounts, while income trusts could not
as they still need some cash to cover basic running costs.
28

Figure 12: Mean inverstment, corporations and income trusts comparison; winsorized at1 percent, comparable industry and size corporate sample.
0
0.05
0.1
0.15
0.2
0.25
2003 2004 2005 2006 2007 2008 2009 2010 2011 2012
Business trusts vs corporates
companies that were at some point business trusts (not accounting for conversion)
companies that were never trusts (comparable industry mix to business trusts)
0
0.05
0.1
0.15
0.2
0.25
0.3
0.35
0.4
2003 2004 2005 2006 2007 2008 2009 2010 2011 2012
Utility trusts vs corporates
companies that were at some point utlity trusts (not accounting for conversion)
companies that were never trusts (comparable industry mix to utility trusts)
5 Results
5.1 Baseline estimates
Tables 4 and 5 present results on the e¤ects of the 2006 reform announcement on invest-
ment rates of income trusts, where the speci�cation estimated is discussed in section 3.
The post_TFP_dummy is equal to 1 in year 2007 and in all subsequent years. There-
fore the interaction term between comp_is_trust dummy and post_TFP_dummy will
tell me how investment rate of income trusts changed relative to corporations from the
29

same sector after the 2006 reform announcement (Table 4) or relative to their own in-
vestment before the reform announcement (Table 5). Columns 2, 4 and 5-7 in each of
those tables introduce a dummy called post_conversion, which equals 1 in the year the
company converts from income trust to corporate status and remains 1 forever after; it is
zero before that. The coe¢ cient on this dummy estimates the e¤ect of conversion from
income trust to corporate status on investment rate, i.e. describes the indirect e¤ect of
the 2006 reform on investment.
In addition to time varying comp_is_trust dummy, I also include time invariant
trust_dummy, which is equal to 1 in all years if the company was ever an income trust.
All speci�cations include a set of control variables: logarithm of total assets, market
to book ratio, cash �ow, leverage and industry medians of investment, leverage, cash
holdings and payouts.41 I de�ne business trust as a dummy that is equal to 1 if the trust
was classi�ed by S&P as business type, while the utility trust is equal to 1 if it was not
a business income trust or REIT. Therefore any trust classi�ed as energy or power and
pipelines is in that group. Table 4 includes industry and year �xed e¤ects, while Table 5
includes �rm �xed e¤ects. These two tables utilize years 1994 -2013 in columns 1-5 and
years 2000- 2013 in column 6 and 7 and the sample includes trusts before, during and
after conversion as well as Canadian corporations. The sample size is 7,761 company year
observations (columns 1-5) and 6,941 (in columns 6,7). The estimates of the coe¢ cients
on control variables can be found in Table 9 in the Appendix.
Before I discuss the main results, I consider the results related to the decision of
companies to convert to income trust structure and its e¤ect on investment. This is
estimated by the coe¢ cient on the comp_is_trust dummy, which is equal to 0 when the
enterprise is in corporate status and is equal to 1 in the year the enterprise converts to
income trust status and remains 1 while it is in that status. This dummy returns to 0 after
the company converts out of the trust status. In Table 4 columns 1 and 2 estimate the
average e¤ect of becoming a trust on investment rate. Results from column 1 indicate
that investment rates of companies which converted to trusts did not have unusually
high or low investment rates relative to industry norms prior to conversion (coe¢ cient
on trust_dummy is insigni�cant and not di¤erent from zero). However, the conversion
to income trust structure caused a signi�cant and large decline in investment rates for
companies which converted to the structure. What is more interesting is the di¤erence
between the behaviour of business and utility type income trusts. This heterogeneity
between utility and business income trusts appears to be of �rst-order importance (see
columns 3- 7). The results indicate that utility companies which converted to utility
income trusts had signi�cantly and unusually high investment rates relative to industry
41Note that at the moment previously private companies are included in the sample with dummy equalto 1 for all observations, but they have no observations prior to becoming an income trusts. The removalof those does not alter the results, but changes the magnitudes of my coe¢ cients slightly.
30

norms prior to conversion. The conversion to utility income trust resulted in a large and
signi�cant drop in investment rates of corporations from utility sectors to much below
the industry norms. At the same time companies which later converted to business
income trusts appear to have had unusually and signi�cantly low investment rates prior
to conversion relative to the industry norms42.
These results suggest that companies in the income trust structure seem to invest
less than similar corporates after conversion. This implies that in spite of lower cost of
capital, the binding �nancial constraint dominates the investment decision. The estimates
of those coe¢ cients already suggest how important the availability of free cash �ow is for
investment. However, one might argue that due to self selection of income trusts into that
category these coe¢ cients do not estimate causal relationship but merely a correlation.
Therefore the main focus of this section are the e¤ects of the exogenous 2006 reform.
Columns 1 and 2 in Table 4 look at the e¤ect of the 2006 reform announcement and �nd
the coe¢ cient on the interaction term between comp_is_trust and post_TFP_dummy
to be insigni�cant and 0.007. This suggests that the 2006 reform announcement had no
e¤ect on investment rates of income trusts relative to industry norms, while they remained
in the trust structure. This means that the anticipation of higher cost of capital in the
future does not a¤ect investment of cash constrained companies. The post_conversion
dummy in Column 2 is insigni�cant, which would suggest there was no e¤ect of conversion
back to corporate structure on investment rate either. This would imply that �nancing
constraints did not a¤ect investment of income trusts either.
However, in columns 3-7 we can see that an important heterogeneity exists between
business and utility type income trusts. Business trusts switch from investment rates be-
low industry norms before (negative coe¢ cient on business_trust dummy) and during
(the interaction term between business_trust and comp_is_trust dummy is not signif-
icantly di¤erent from zero) period in trust status to investment rates at sector norms in
years after conversion out of trust status in to corporate status (the sum of coe¢ cients
on trust_dummy and its interaction with post_conversion dummy is close to zero and
not signi�cantly di¤erent from it). It is too soon to judge whether this e¤ect is tempo-
rary or persistent. What is more, it could also re�ect self-selection of those trusts which
42The inclusion of a utility comp dummy which takes value 1 if a company comes from the utilitysector, but is not an income trust. It is insigni�cant due to the presence of industry �xed e¤ects, butwithout industry �xed e¤ect (results not reported here) it is signi�cant and positive suggesting thatthe utility type companies invest more than other Canadian corporates. Results without industry �xede¤ects and �rm �xed e¤ects (not reported here) indicate that investment rate of business trusts is notlow relative to overall sample average; when contrasted with results from Table 4 this suggests thatthese were the enterprises with low investment rates relative to sector norms, but tended to operatein sectors with high investment rates relative to overall sample average. What is more, in regressionswithout industry �xed e¤ects trust dummy is positive which suggests that companies which convertedto income trust have invested more than average Canadian corporates before the conversion, but thate¤ect disappears when I include industry �xed e¤ects (Table 4), which suggests that income trusts werefrom industries which on average invested more.
31

converted to corporate status. In contrast, for utility_trusts in columns 3-7 the net
e¤ect for period while they remained income trusts is negative (utility_trust dummy is
positive and 0.058 in column 4, while utility_trust interacted with comp_is_is_trust
is negative and signi�cant and -0.094, which implies the total e¤ect of -0.036, which is
also signi�cant), while net e¤ect for period after conversion is zero (the positive coe¢ -
cient on utility_trust dummy cancels out with the negative coe¢ cient on its interaction
with post_conversion dummy). This implies that utility income trusts switch from in-
vestment rates below sectoral norms during period in the trust status and after 2006
announcement to investment rates at sectoral norms in years after conversion out of trust
status to corporate status. Therefore utility trusts are similar to business trusts in that
respect.
The heterogeneity analysis con�rms that there is no e¤ect of the 2006 reform an-
nouncement on investment. Hence the anticipation of increased cost of capital does not
a¤ect �rm behaviour. However, the distinction between utility and business income trusts
reveals that binding �nancial constraints play an important role in how investment reacts
to tax disincentives. In spite of higher cost of capital after conversion to corporate struc-
ture, income trusts which converted increase their investment back to industry norms.
This implies that the availability of cash �ow dominates the e¤ect of cost of capital.
Columns 5-7 introduce dummies called post_conv_early and post_conv_late, which
describe the timing of the conversion back to corporate structure for income trusts.
These results test the implications of Figure 11 from descriptive statistics. Speci�cally,
post_conv_early is equal to 1 if income trust converted to corporate form in years before
the tax saving advantage expired, i.e. before 2011. Post_conv_late is a dummy which
is 1 for income trusts trusts which waited until the last possible moment to convert back
to corporate structure, i.e. the ones which converted in 2011 or 2012. These dummies
similarly to post_conversion dummy take value 1 after the company converted back to
corporate form. The results show that the e¤ect of conversion back on investment is
strongest for income trusts which delayed their conversion to corporate form until 2011.
This suggest that income trusts which converted before their tax privileges expired did
not see their investment return to industry norms after the conversion. Columns 6 and 7
additionally limit the sample by excluding years 1994 - 1999, but this does not seem to
alter the result.
Column 7 in Table 4 includes industry �xed e¤ects which are interacted with sub-
period dummies. One may worry that comparing investment rates of income trusts to
industry means over such a long time period could bias my results. This will especially
be a problem if some industries have reacted to the �nancial crisis more strongly than
others. I therefore interact the industry �xed e¤ects with 3 sub-periods, 2003-2006, 2007-
2010 and 2011-12. This enables me to control for time varying heterogeneity between
industries. The results are broadly similar.
32

The results from Table 5 with �rm �xed e¤ects broadly con�rm the results from Table
4. Therefore the overall conclusion from these results is that the TFP reform in itself did
not change investment rates of income trusts. However, to the extent that this reform
created a wave of conversions of income trusts to corporate structures it had an indirect
e¤ect on investment of income trusts. The conversion back to corporate structure has
returned investment of business and utility type trusts to their sectoral norms from the
level below the norms during the period they were in the trust structure.43 Therefore
overally, �nancial constraints appear to be binding in so far as investment only changes
once income trusts convert to corporates and they are not subject to limited cash �ow.
5.2 Propensity score matching
As discussed in the empirical methodology section the choice of the traditional corpo-
rations as a comparison group for income trusts can be done using propensity score
matching. This approach not only controls for self selection on observables, but also
allows construction of a more comparable sample of control observations in terms of ob-
servable characteristics. What is more, it serves as a robustness check for the di¤erence
in di¤erence OLS estimates. The results from the di¤erence in di¤erence combined with
propensity score matching con�rm the OLS ones (see Tables 10 -13 in the Appendix). In
Tables 10 and 11 I include industry �xed e¤ects as controls in Table 12 I exclude them,
while in Table 13 I control for �rm �xed e¤ects instead. In Table 10 in the �rst stage of
propensity score matching I use 2005 as a baseline year for matching. This means that I
run the probit regression for year 2005 that determines the likelihood of being an income
trust. I perform the nearest neighborhood matching for this one year and use observations
for companies that were matched in this year in the di¤erence in di¤erence regressions
that follow. In tables 11-13 I instead use year 2006 as a baseline year, which o¤ers slightly
more observations, but does not a¤ect the coe¢ cient estimates substantially. We can see
that in all these tables, the results from the baseline OLS come through in spite of the
sample being much smaller than the baseline OLS one (2,637 in Tables 11-13).
5.3 Long-run e¤ects
Results from Table 6 consider long-run e¤ects of the 2006 reform announcement on invest-
ment rates and as such direct e¤ects of relaxing the �nancial constraint on investment.
They compare years immediately before the TFP reform (2003-2006) with years 2011-
2012 - years after all income trusts that were going to convert to corporate structure have
already done so. Years 2007-2010 are excluded from the sample completely. I only include
43The results presented here use capital expenditure divided by total assets as a measure of investment,but they are also robust to using capital expenditure and acquisitions divided by total assets as well ascapital expenditure divided by �xed assets.
33

income trusts which survived until 2011-12, therefore deleting the income trusts with no
observations in 2011-12. What is more, I require a balanced sample of observations for
the comparable corporations. Therefore I restrict my sample only to �rms which have
data for all years 2003- 2012. Results from regressions with industry �xed e¤ects are in
columns 1-3, results with �rm �xed e¤ects are in columns 4 and 5. The coe¢ cient of
interest is the one on the interaction between trust_dummy and years_2011_12. Trust
dummy is 1 if the company was ever an income trust, while years_2011_12 is 1 in years
2011 and 2012 and zero otherwise. This interaction terms enables me to look at the e¤ect
of conversion back to corporate structure on investment rates of income trusts.
Firstly, investment rate in years 2011-12 has decreased relative to years 2003-2006
for all Canadian companies. Secondly, on average income trusts have increased their
investment rates in years 2011-2012 relative to their industry norms (column 1). This
result turns out to be purely the e¤ect of the increase in investment rates of business
income trusts. Utility income trusts do not change their investment rates in 2011-12
relative to 2003-2006. Both of these e¤ects are robust to di¤erent types of speci�cations
and inclusion (columns 4 and 5) and exclusion (columns 2 and 3) of �rm �xed e¤ects.
In addition, column 3 includes industry dummies interacted with sub-period dummies.
The sub-period dummies are for years 2003-2006 and for 2011-12. This allows for time
varying heterogeneity in investment rates. This does not change the conclusions albeit
some of the coe¢ cients are estimated imprecisely.
These results are consistent with what I have shown in Tables 4 and 5 in terms of
post_conversion dummy, namely that after the conversion to corporate structure the
investment rates of both utility and business income trusts return to their sectoral norms
irrespective of where they started from.44
5.4 Further robustness test
In this section I test the robustness of the baseline estimates. I reestimate the model
using non-winsorized investment and the coe¢ cients tend to have larger standard errors.
One may be concerned that investment tends to be lumpy and a lot of �rms actually
have zero investment for a lot of years in the sample. Out of over 7,000 observations
used in the baseline regressions about 700 report zero investment, i.e. about 10 percent.
To see whether these zero investment observations a¤ect the results I do two things.
Firstly, I exclude all observations where investment was zero. Secondly, I run a lower
bound censored Tobit model using investment bounded at zero as a censoring variable.
The exclusion of zero investment observations makes the results more robust, while Tobit
model�s most interesting feature is that now business income trusts appear to have in-
44These results are also robust to implementing them on the propensity score matched sample (Table14 in the Appendix). If anything, the coe¢ cients are estimated more precisely in the propensity scorematched sample than in the full OLS sample.
34

creased their investment immediately after the 2006 reform. In addition, they also have
decreased their investment following conversion from corporate to income trust form.
Therefore the overall e¤ect of the 2006 reform is still negative and investment of business
income trusts do not appear to return to industry means even after conversion back to
corporate form (see Table 15 in the Appendix).
I also experiment with using only years 2005 and 2006 as a pre treatment sample. The
problem with using these years only is the 2005 dividend tax credit reform, that could
have already had a �rst order e¤ect on investment of corporates as well as second order
e¤ect on the investment of income trusts. This could mean that using only years 2005
and 2006 I am looking at very uncertain times for both treatment and control groups
during which corporates could have increased their investment while income trusts could
have already decreased their investment. I experiment with including di¤erent number
of years before the 2006 reform to see how sensitive my results are to the sample choice.
The results are available upon request; the coe¢ cients have the same signs and similar
magnitudes as in the baseline regressions, but they have larger standard errors, possibly
due to fewer observations being used.
Furthermore, instead of using capital expenditure as a numerator for investment rate,
I use capital expenditure together with acquisitions. This does not change the main
results of the paper, the only substantial di¤erence being that utility income trusts seem
to record substantially lower investment after the announcement of the 2006 reform.
This is most likely due to the fact that once the reform was announced acquisitions and
expansion of income trusts beyond the normal 100% growth level would have resulted in
immediate imposition of corporation tax. This suggests that post 2006 reform income
trusts would have ceased to acquire new companies actively, if they wanted to avoid
paying tax.
Since the starting point of this paper was the work of Doidge and Dyck (2013) on
speci�c properties of income trusts, I discuss here why and how my estimates of the e¤ects
of the reform on investment di¤er from their result. Doidge and Dyck (2013) use data for
years 2007 - 2010 and estimate changes in investment rates after the reform, attributing
all of the di¤erences between income trusts and corporates over the analyzed period to
the 2006 reform. They �nd that investment rates of income trusts increased relative to
investment rates of corporations following the announcement of the 2006 reform, and that
conversion to corporate form had no e¤ect on the change in investment rate. There are
several reasons why my results di¤er from Doidge and Dyck (2013). Firstly, Doidge and
Dyck (2013) might �nd no e¤ects of conversion back to corporate structure on investment
rate since their analysis stops in 2010, before most of the conversions to corporations
actually happened. Since I utilize later years 2011-13, I observe investment rates of
income trusts which converted to corporates for longer and for far larger sample than
Doidge and Dyck (2013) could. As I show in the paper the strongest e¤ects of conversion
35
back on investment rate occurred for companies which converted in 2011. What is more,
I use di¤erence in di¤erence methodology to compare Canadian corporates to similar
income trusts before and after the 2006 reform, while Doidge and Dyck (2013) utilize
only years 2007-2010. Therefore they do not control for the pre-reform characteristics of
income trusts relative to corporates. As I show in the paper companies which converted to
income trusts have already had di¤erent investment rates from their respective industry
means. Finally, the distinction between utility and business type income trusts, which
Doidge and Dyck (2013) do not discuss at all, is of �rst order importance for my analysis.
Finally, I test the robustness of the estimation results using placebo regressions. I
vary the year of the reform to show that the e¤ects discussed in this paper come from the
2006 reform and not from systematic di¤erences between treatment and control groups.
As shown in Figure 13 mean investment rates for corporations and income trusts before
the reform look to be moving together. However, I do not have enough data for pre-
refrom years for income trusts to show longer time series trends of mean investment
rates. Instead, I use the placebo regressions as shown in Tables 16-18. In Table 16 I use
the regression from Table 4 column 1 and vary the post_TFP dummy to be any year
from 2000 until 2011. I can see that the interaction e¤ect of company_is_trust and
post_TFP_placebo is only signi�cant from 2007 onwards, but not before. In Table 17 I
instead use column 4 from Table 4 as a baseline and vary the year of the reform between
columns. Again, the interactions with post_TFP_placebo only become signi�cant in
2005, but not before. The reason why some e¤ects might already be seen for 2005 is
that the post_TFP_placebo dummy is 1 from 2006 onwards in those regressions. It is
entirely plausible that some of the e¤ects of the 2006 reform could have already a¤ected
�rms investment in 2006. Table 17 shows the results from Table 16 using the propensity
score matched sample as in Table 11. It con�rms what we see in Table 16.
36

Table 4: Levels of investment rate after TFP (with industry �xed e¤ects).
(1) (2) (3) (4) (5) (6) (7)VARIABLES cx cx cx cx cx 00-06vs
07-1300-06vs07-13
trust_dummy 0.003 0.003 (0.008) (0.011) comp_is_trust -0.042*** -0.042*** (0.010) (0.012) post_TFP_dummy -0.025*** -0.025*** -0.025*** -0.025*** -0.025*** -0.016*** -0.040*** (0.005) (0.005) (0.005) (0.005) (0.005) (0.005) (0.010)comp_is_trust#c.post_TFP_dummy 0.007 0.007 (0.009) (0.009) post_conversion -0.000 (0.009) business_trust -0.010 -0.026** -0.027** -0.033*** -0.035*** (0.009) (0.011) (0.011) (0.011) (0.011)utility_trust 0.029** 0.058*** 0.060*** 0.033* 0.031* (0.013) (0.014) (0.014) (0.018) (0.018)utility_trust#c.comp_is_trust -0.065*** -0.094*** -0.096*** -0.068*** -0.074*** (0.017) (0.017) (0.017) (0.019) (0.019)business_trust#c.comp_is_trust -0.031*** -0.015 -0.015 -0.003 0.003 (0.011) (0.012) (0.012) (0.011) (0.013)utility_trust*comp_is_trust*post_TFP_dummy
-0.010 0.002 0.001 -0.004 0.001
(0.017) (0.016) (0.017) (0.017) (0.018)post_TFP_dummy*business_trust*comp_is_trust
0.012 0.008 0.008 -0.001 -0.011
(0.009) (0.009) (0.009) (0.009) (0.011)post_conversion#c.business_trust 0.023** (0.009) post_conversion#c.utility_trust -0.051*** (0.014) post_conv_early#c.business_trust 0.018 0.025* 0.032** (0.014) (0.014) (0.014)post_conv_early#c.utility_trust -0.034** -0.012 -0.018 (0.014) (0.016) (0.015)post_conv_late#c.business_trust 0.026*** 0.031*** 0.028** (0.010) (0.010) (0.012)post_conv_late#c.utility_trust -0.060*** -0.034** -0.025 (0.016) (0.017) (0.019)Constant 0.182*** 0.182*** 0.183*** 0.183*** 0.182*** 0.178*** 0.194*** (0.021) (0.021) (0.021) (0.021) (0.021) (0.022) (0.033)Observations 7,761 7,761 7,761 7,761 7,761 6,941 6,941R-squared 0.290 0.290 0.291 0.292 0.292 0.297 0.320YearFE NO NO NO NO NO NO NOIndustryFE YES YES YES YES YES YES YESIndustrysubperiodFE NO NO NO NO NO NO YESFirmFE NO NO NO NO NO NO NO
Standard errors clustered at �rm level in parentheses; *** p<0.01, ** p<0.05, * p<0.1. Note:
Investment winsorized at 1%. Removes trusts with no data post conversion. Columns 1-4 use the full
sample 1994 - 2013, while columns 5 and 6 compare use 2000-2013. Trust_dummy equals 1 if a company
was ever an income trust, comp_is_trust equals 1 in the year the company converts to income trust
and stays 1 until the year it converts back, post_conversion equals 1 in the year a trust converts back
to corporation and forever after, it is zero otherwise. Early_post_conv is a dummy which is 1 when an
income trusts converted before the expiry of its privileges, i.e. before 2011, late_post_conv is a dummy
which is 1 if an income trust converted in 2011 or 2012. Control variables are included in all regressions.
37

Table 5: Levels of investment rate after TFP (with �rm �xed e¤ects).
(1) (2) (3) (4) (5) (6)VARIABLES cx cx cx cx cx 00-06vs07-13 comp_is_trust -0.032*** -0.029*** (0.010) (0.011) post_TFP_dummy -0.018*** -0.018*** -0.018*** -0.018*** -0.019*** -0.014*** (0.004) (0.004) (0.004) (0.004) (0.004) (0.005)comp_is_trust*post_TFP_dummy 0.009 0.009 (0.008) (0.008) post_conversion 0.004 (0.009) utility_trust#*comp_is_trust -0.047** -0.064*** -0.064*** -0.049** (0.018) (0.018) (0.019) (0.020)business_trust*comp_is_trust -0.023** -0.010 -0.005 0.001 (0.010) (0.011) (0.012) (0.011)utility_trust*comp_is_trust*post_TFP_dummy
-0.006 0.001 0.001 -0.001
(0.019) (0.018) (0.019) (0.019)post_TFP_dummy*business_trust*comp_is_trust
0.015* 0.011 0.013* 0.009
(0.008) (0.008) (0.008) (0.008)post_conversion*business_trust 0.019** (0.010) post_conversion*utility_trust -0.027* (0.014) post_conv_early*business_trust -0.006 -0.000 (0.014) (0.014)post_conv_early*utility_trust -0.027** -0.013 (0.013) (0.015)post_conv_late*business_trust 0.030*** 0.034*** (0.010) (0.009)post_conv_late*utility_trust -0.027 -0.011 (0.017) (0.018)Constant 0.463*** 0.463*** 0.461*** 0.459*** 0.458*** 0.452*** (0.030) (0.030) (0.030) (0.030) (0.030) (0.033)Observations 7,761 7,761 7,761 7,761 7,761 6,941R-squared 0.111 0.111 0.112 0.113 0.114 0.115Numberofcompany1 1,226 1,226 1,226 1,226 1,226 1,144YearFE NO NO NO NO NO NOIndustryFE NO NO NO NO NO NOFirmFE YES YES YES YES YES YES
Standard errors clustered at �rm level in parentheses; *** p<0.01, ** p<0.05, * p<0.1. Note:
Investment winsorized at 1%. Removes trusts with no data post conversion. Columns 1-4 use the full
sample 1994 - 2013, while column 5 uses 2000-2013. Trust_dummy equals 1 if a company was ever an
income trust, comp_is_trust equals 1 in the year the company converts to income trust and stays 1
until the year it converts back, post_conversion equals 1 in the year a trust converts back to corporation
and forever after, it is zero otherwise. Early_post_conv is a dummy which is 1 when an income trusts
converted before the expiry of its privileges, i.e. before 2011, late_post_conv is a dummy which is 1 if
an income trust converted in 2011 or 2012. Control variables are included in all regressions.
38

Table 6: Levels of investment rate after TFP; comparison of 2003-2006 with 2011- 2012.
(1) (2) (3) (4) (5)VARIABLES cx:03-06 cx:03-06 cx:03-06 cx:03-06 cx:03-06 trust_dummy -0.032*** (0.008) years_11_12 -0.015** -0.015** 0.076 -0.002 -0.002 (0.007) (0.007) (0.047) (0.007) (0.007)trust_dummy*years_11_12 0.023** 0.014 (0.010) (0.011) utility_trust -0.018 -0.034* (0.015) (0.017) business_trust -0.038*** -0.039*** (0.009) (0.010) utility_trust*years_11_12 0.002 0.024 -0.001 (0.018) (0.022) (0.020)years_11_12*business_trust 0.031*** 0.025* 0.018 (0.011) (0.013) (0.011)Constant 0.181*** 0.184*** 0.128*** 0.503*** 0.501*** (0.028) (0.029) (0.032) (0.049) (0.049)Observations 3,549 3,549 3,549 3,549 3,549R-squared 0.321 0.322 0.351 0.119 0.119YearFE NO NO NO NO NOIndustryFE YES YES YES NO NOIndustrysubperiodFE NO NO YES NO NOFirmFE NO NO NO YES YES
Standard errors clustered at �rm level in parentheses; *** p<0.01, ** p<0.05, * p<0.1 Investment
winsorized at 1%. Compare 2005-06 to 2011-12 and 2004-05 and 2011-12. Years 2006-2010 removed from
the sample. Control variables are included in all regressions.
39

6 Conclusion
The results from the 2006 Canadian income trust reform indicate the importance of
�nancing constraints for investment. The fact that income trusts were not a¤ected by
the announcement of the 2006 reform that introduced higher cost of capital in the future
suggests that binding cash constraints dominate the e¤ects of cost of capital. This is
con�rmed by the fact that income trusts seem to increase their investment after conversion
back to corporate form. In spite of higher cost of capital, the increased availability of
internal �nance after conversion back to corporation, increases investment of income
trusts back to industry norms. The emphasis on the heterogeneity of the e¤ects between
utility and business income trusts helps to highlight these results.
These �ndings feed into the literature on the importance of cash �ow availability
at a company level. The 2006 reform analysis has shown that tax policies targeted at
�nancially constrained companies might possibly have limited e¤ects. In turn, a simple
change in the availability of internal �nance a¤ects the investment decision of a company
to a much larger extent than change in the cost of capital.
References
Aggarwal, L., Mintz, J., 2004. Income trusts and shareholders taxation: Getting it right.
Canadian Tax Journal 52 (3), 792�818.
Alarie, B., lacobucci, E. M., 2007. Tax policy, capital structure and income trusts. The
Canadian Business Law Journal 45 (1), 1�19.
Auerbach, A. J., Hines, James R, J., May 1988. Investment Tax Incentives and Frequent
Tax Reforms. American Economic Review 78 (2), 211�16.
Auerbach, A. J., Jr., J. R. H., Apr. 1986. Anticipated Tax Changes and the Timing of
Investment. NBER Working Papers 1886, National Bureau of Economic Research, Inc.
URL https://ideas.repec.org/p/nbr/nberwo/1886.html
Bond, S., Meghir, C., April 1994. Dynamic Investment Models and the Firm�s Financial
Policy. Review of Economic Studies 61 (2), 197�222.
URL http://ideas.repec.org/a/bla/restud/v61y1994i2p197-222.html
Bond, S., Van Reenen, J., January 2007. Microeconometric Models of Investment and
Employment. In: Heckman, J., Leamer, E. (Eds.), Handbook of Econometrics. Vol. 6
of Handbook of Econometrics. Elsevier, Ch. 65.
Calomiris, C. W., Hubbard, R. G., October 1995. Internal Finance and Investment:
Evidence from the Undistributed Pro�ts Tax of 1936-37. The Journal of Business 68 (4),
40

443�82.
URL http://ideas.repec.org/a/ucp/jnlbus/v68y1995i4p443-82.html
Doidge, C., Dyck, A., 2013. Taxes and corporate policies: Evidence from a quasi natural
experiment. The Journal of Finance.
Edgar, T., 2004. The Trouble with Income Trusts. canadian tax journal 52 (3), 819�852.
Edgerton, J., December 2010. Investment incentives and corporate tax asymmetries. Jour-
nal of Public Economics 94 (11-12), 936�952.
URL http://ideas.repec.org/a/eee/pubeco/v94y2010i11-12p936-952.html
Edwards, A., Shevlin, T., 2011. The value of a �ow-through entity in an integrated
corporate tax system. Journal of Financial Economics 101 (2), 473�491.
Elayan, F. A., 2007. To tax or not to tax income trusts: The valuation e¤ect of a canadian
dividend tax cut. 2008 annual conference paper.
Elayan, F. A., Li, J., Donnelly, M. E., Young, A. W., 2009. Changes to income trust
taxation in canada: Investor reaction and dividend clientele theory. Journal of Business
Finance and Accounting 36 (5-6), 725�753.
Fazzari, S. M., Hubbard, R. G., Petersen, B. C., May 1988. Investment, Financing Deci-
sions, and Tax Policy. American Economic Review 78 (2), 200�205.
URL http://ideas.repec.org/a/aea/aecrev/v78y1988i2p200-205.html
Fazzari, S. M., Petersen, B. C., Autumn 1993. Working Capital and Fixed Investment:
New Evidence on Financing Constraints. RAND Journal of Economics 24 (3), 328�342.
URL http://ideas.repec.org/a/rje/randje/v24y1993iautumnp328-342.html
Gertler, M., Hubbard, R. G., 1988. Financial factors in business �uctuations. Proceedings
- Economic Policy Symposium - Jackson Hole, 33�78.
URL http://ideas.repec.org/a/fip/fedkpr/y1988p33-78.html
Glew, I. A., Johnson, L. D., 2011. Consequences of the halloween nightmare: analysis of
investors otilde; response to an overnight tax legislation change in the canadian income
trust sector. Canadian Journal of Administrative Sciences / Revue Canadienne des
Sciences de l�Administration 28 (1), 53�69.
Hall, B., Jorgensen, D., 1967. Tax Policy and Investment Behavior. American Economic
Review 57, 391�414.
Halpern, P., Norli, O., 2006. Canadian business trusts: A new organizational structure.
Journal of Applied Corporate Finance 18 (3), 66�75.
41

Hanlon, M., Heitzman, S., 2010. A review of tax research. Journal of Accounting and
Economics 50 (2â¼AS3), 127 �178.
URL http://www.sciencedirect.com/science/article/pii/S0165410110000340
Hassett, K. A., Hubbard, R. G., 2002. Tax policy and business investment. In: Auerbach,
A. J., Feldstein, M. (Eds.), Handbook of Public Economics. Vol. 3 of Handbook of
Public Economics. Elsevier, Ch. 20, pp. 1293�1343.
HassettHubbard2002, 2002. Tax policy and business investment. In: Auerbach, A. J.,
Feldstein, M. (Eds.), Handbook of Public Economics. Vol. 3 of Handbook of Public
Economics. Elsevier, Ch. 20, pp. 1293�1343.
Hayashi, F., January 1982. Tobin�s Marginal q and Average q: A Neoclassical Interpre-
tation. Econometrica 50 (1), 213�24.
Hayward, P. D., 2002. Income trusts: A Stax-e¢ cientµT product or the product of tax
ine¢ ciency? Canadian Tax Journal 50 (5), 1529�1569.
Howitt, P., Sinn, H.-W., March 1989. Gradual Reforms of Capital Income Taxation.
American Economic Review 79 (1), 106�24.
Hudec, A. J., Rogers, J. L., 2004. Canadian income funds: An attractive �nancing alter-
native for canadian and u.s. franchisors. Franchise Law Journal, 24 (2).
Iacobucci, E. M., 2013. Innovation and the organizational contract: Lessons from income
trusts. New York University Law Review 88 (1), 216�239.
Jog, V., Wang, L., 2004. The growth of income trusts in canada and the economic con-
sequences. Canadian Tax Journal 52 (3), 853�880.
Jog, V., Wang, L., 2006. A comparison of business income trust governance and corporate
governance: Is there a need for legislation or further regulation? McGill Law Journal
51, 327�383.
Jorgensen, D., 1963. Capital Theory and Investment Behavior. American Economic Re-
view 53, 247�59.
Keuschnigg, C., Ribi, E., 2010. Pro�t Taxation and Finance Constraints. Tech. rep.
Lefebvre, R., Goomar, A., Mar. 2006. Demystifying income trusts. Working Papers
060301, Certi�ed General Accountants Association of Canada.
Mintz, J. M., Richardson, S. R., 2006. Income trusts and Integration of Business and
Investor Taxes: A Policy Analayiss and Proposal. canadian tax journal 54 (2), 359�
406.
42

Pazzaglia, F., Aguerrevere, F., Ravi, R., 2005. What drives a corporation to convert into
an income trust. Working papers.
Summers, L. H., 1981. Taxation and Corporate Investment: A q-Theory Approach.
Brookings Papers on Economic Activity 12 (1), 67�140.
URL http://ideas.repec.org/a/bin/bpeajo/v12y1981i1981-1p67-140.html
Tait, A., Lawford, J., 2007. Income trusts: A challenge for regulators. Tech. rep.
Tobin, J., February 1969. A General Equilibrium Approach to Monetary Theory. Journal
of Money, Credit and Banking 1 (1), 15�29.
URL http://ideas.repec.org/a/mcb/jmoncb/v1y1969i1p15-29.html
Wang, Z., 2006. Income trust: A new way of corporate �nancing and governance? Tech.
rep.
Zwick, E., Mahon, J., January 2016. Tax policy and heterogeneous investment behavior.
Working Paper 21876, National Bureau of Economic Research.
43

7 Appendix 1
Figure 13: Mean investment rates of income trusts and comparable corporates in theyears before and after 2006 reform announcement.. Balanced panel, propensity scorematched sample used. Source: Datastream.
0
0.02
0.04
0.06
0.08
0.1
0.12
0.14
0.16
2004 2005 2006 2007 2008
corporates incometrusts
44

Table 7: Industry codes, corresponding names and number of income trusts and corpo-rates in each industry. Source: Datastream data.
industryname industrycode incometrusts corporates
BuildingMat.&Fix. 30 7 47
GasDistribution 31 1 19
IndustrialSuppliers 32 2 13
SpecialtyChemicals 33 3 41
ComputerHardware 34 17
FarmFishPlantation 35 2 14
HomeConstruction 36 5
ElectricalEquipment 37 31
Forestry 38 2 28
HeavyConstruction 39 1 18
DeliveryServices 40 1 6
MediaAgencies 41 1 17
ConsumerFinance 42 1 4
IndustrialMachinery 43 3 55
Defence 44 6
HealthcareProviders 45 2 21
FinancialAdmin. 46 1 7
Waste,DisposalSvs. 47 1 15
PersonalProducts 48 3
Coal 49 2 35
Exploration&Prod. 50 39 701
OilEquip.&Services 51 21 163
Pipelines 52 4 18
NonferrousMetals 54 2 142
RecreationalServices 55 1 15
Iron&Steel 56 1 37
ElectronicEquipment 57 43
Software 58 1 145
Dur.HouseholdProd. 59 1 6
Furnishings 60 2 22
Toys 61 15
Nondur.HouseholdProd 62 1 7
AutoParts 63 1 17
TransportServices 64 6 13
Automobiles 65 3
ApparelRetailers 66 11
Brewers 67 3 12
Distillers&Vintners 68 5
Clothing&Accessory 69 13
Containers&Package 70 1 14
FoodProducts 71 8 50
Restaurants&Bars 72 10 27
RenewableEnergyEq. 74 12
ConsumerElectronics 75 6
InvestmentCompanies 77 1 49
Plat.&PreciousMetal 78 76
Tobacco 79 2
Hotels 80 8
Paper 82 3 26
AlternativeFuels 83 11
Publishing 84 3 37
BusinessSupportSvs. 86 12 84
BroadlineRetailers 87 2 14
FoodRetail,Wholesale 88 3 18
Diamonds&Gemstones 89 39
SpecialtyRetailers 90 5 27
Multiutilities 91 2 5
CommodityChemicals 92 21
Aluminium 93 7
Travel&Tourism 94 1 8
Pharmaceuticals 95 43
Alt.Electricity 96 6 23
IntegratedOil&Gas 97 18
Aerospace 98 1 15
MarineTransportation 99 1 4
Gambling 100 3 13
Divers.Industrials 101 1 15
Banks 102 20
MedicalSupplies 103 1 7
AssetManagers 104 26
LifeInsurance 106 12
Prop.&CasualtyIns. 107 13
InsuranceBrokers 108 4
InvestmentServices 111 2 22
RealEstateHold,Dev 112 6 74
SpecialtyFinance 113 4 245
SoftDrinks 114 9
Broadcast&Entertain 115 5 49
Unclassified 116 91
Comm.Vehicles,Trucks 117 2 14
GoldMining 119 424
DrugRetailers 120 4
GeneralMining 122 609
Telecom.Equipment 126 1 58
Unquotedequities 127 5 139
Airlines 129 2 13
Semiconductors 130 20
Trucking 131 3 13
MedicalEquipment 132 1 33
FullLineInsurance 141 4
FixedLineTelecom. 142 2 26
MobileTelecom. 143 12
Water 144 5
ComputerServices 150 1 35
Internet 151 25
MortgageFinance 152 3 22
RecreationalProducts 155 1 3
Spec.ConsumerService 156 4 19
Biotechnology 157 92
ExchangeTradedFunds 159 1
Ind.&OfficeREITs 160 13 35
RetailREITs 161 8 19
ResidentialREITs 162 5 22
DiversifiedREITs 163 2 13
SpecialtyREITs 164 2
Hotel&LodgingREITs 166 5 12
Con.Electricity 169 7 23
7.1 Variable de�nitions
The main variable of interest in my paper is a rate of investment. In baseline speci�cations
I de�ne it as capital expenditures45 divided by last years�total assets. In robustness checks45In Datastream capital expenditures are de�ned as funds used to acquire �xed assets other than
those associated with acquisitions. It includes but is not restricted to: additions to property, plant and
45

I also use the sum of capital expenditures and acquisitions46 divided by last years�total
assets and capital expenditures divided by last years��xed assets. The control variables
are de�ned as follows:
� payouts: total dividends (or distributions in case of income trusts) paid divided bycurrent year total assets
� cash holdings: cash and short term investments divided by total assets current year
� market to book ratio: short term debt plus long term debt plus market capitalizationdivided by current year total assets
� cash �ow: net income before extraordinary items plus depreciation and amortizationdivided by current year total assets
� cash �ow volatility: for a given �rm in year t-1 the standard deviation of CF is
computed over the previous (up to) 9 years, industry CF volatility in year t equal
the average standard deviation of corporates in a given industry
� leverage: short term debt plus long term debt divided by current year total assets
� new working capital (NWC): current assets minus cash minus current liabilities
divided by current year total assets
� (gross) pro�tability: operating income plus depreciation and amortization dividedby current year total assets
� tangibility: net PPE divided by current year total assets, where net PPE is grossproperty plant and equipment minus accumulated reserves for depreciation deple-
tion and amortization
7.2 Note to all tables that follow
Standard errors clustered at �rm level in parentheses; *** p<0.01, ** p<0.05, * p<0.1.
Investment winsorized at 1%. Removes trusts with no data post conversion. Columns
1-4 use the full sample 1994 - 2013, while columns 5 and 6 compare use 2000-2013.
Trust_dummy equals 1 if a company was ever an income trust, comp_is_trust equals 1
in the year the company converts to income trust and stays 1 until the year it converts
equipment and investments in machinery and equipment.46In Datastream acqusitions represent assets acquired through pooling of interests or mergers. It does
not include capital expenditures of acquired companies. It includes but is not restricted to: net assets ofacquired companies, additions to �xed assets from acquisitions, working capital of companies acquired,excess of cost of acquired companies, discount on acquisitions. Income trusts are observed to make onaverage larger acqusitions than corporations in similar sectors and of similar size.
46

back, post_conversion equals 1 in the year a trust converts back to corporation and forever
after, it is zero otherwise. Early_post_conv is a dummy which is 1 when an income trusts
converted before the expiry of its privileges, i.e. before 2011, late_post_conv is a dummy
which is 1 if an income trust converted in 2011 or 2012. Table 13 compares 2003-06 to
2011-12. Years 2006-2010 removed from the sample .
47

Table 8: Results from estimating �rst stage equation for the propensity score matching.
(1) (2) (3) VARIABLES full sample 2005 2006 L.leverage -0.143 -0.662 -0.078 (0.117) (0.598) (0.586) L.payout 0.133** 11.497*** 16.976*** (0.060) (2.838) (3.809) L.investment -0.386*** 0.067 -0.289 (0.145) (0.104) (0.348) L.cash_holdings -3.045** -14.343*** -10.759*** (1.231) (3.411) (3.326) L.tax_rate -0.004* 0.021 -0.181 (0.002) (0.021) (0.218) L.growth_opportunities -0.026 0.047 -0.048 (0.046) (0.064) (0.120) L.tangibility -0.318 -0.266 -0.913** (0.207) (0.478) (0.418) L.profitability 0.679*** 0.363 0.059 (0.216) (0.767) (0.180) L.industry_median_investment 0.507** -9.839 -77.180 (0.206) (13.118) (57.769) L.industry_median_payout 9.254*** 7.185 31.729 (2.480) (18.168) (29.708) L.industry_median_cashhold 0.174 5.927 -0.695 (0.396) (14.016) (23.034) L.industry_median_leverage -1.734*** -1.008 -9.163 (0.290) (3.576) (8.172) L.log_asstes 0.150*** 0.163*** 0.092* (0.028) (0.052) (0.055) Constant -1.697*** -2.356** 1.382 (0.621) (1.095) (2.505) Observations 7,609 382 421 Year FE NO NO NO Industry FE YES YES YES Industry subperiod FE NO NO NO Firm FE NO NO NO
48

Figure 14: The quality of propensity score matching procedure. Means of variables beforeand after matching.
Table 9: Levels of investment rate after TFP, with industry �xed e¤ects. Coe¢ cientestimates on control variables.
(1) (2) (3) (4) (5) (6) (7) VARIABLES cx cx cx cx cx 00-06 vs
07-13 00-06 vs
07-13 L.log_asstes -0.007*** -0.007*** -0.007*** -0.007*** -0.007*** -0.007*** -0.007*** (0.001) (0.001) (0.001) (0.001) (0.001) (0.001) (0.001) growth_opportunities 0.001*** 0.001*** 0.001*** 0.001*** 0.001*** 0.001*** 0.001*** (0.000) (0.000) (0.000) (0.000) (0.000) (0.000) (0.000) cash_flow 0.007*** 0.007*** 0.007*** 0.007*** 0.007*** 0.007*** 0.007*** (0.003) (0.003) (0.003) (0.003) (0.003) (0.002) (0.002) leverage -0.003 -0.003 -0.003 -0.003 -0.003 -0.003 -0.004 (0.002) (0.002) (0.002) (0.002) (0.002) (0.002) (0.002) L.industry_median_investment 0.071* 0.071* 0.071* 0.071* 0.071* 0.243*** 0.121** (0.040) (0.040) (0.040) (0.039) (0.039) (0.050) (0.056) L.industry_median_payout -0.157 -0.157 -0.189 -0.192 -0.192 -0.026 0.377** (0.148) (0.148) (0.149) (0.149) (0.149) (0.130) (0.151) L.industry_median_cashhold 0.098*** 0.098*** 0.099*** 0.099*** 0.100*** 0.091*** 0.091*** (0.026) (0.026) (0.026) (0.026) (0.026) (0.028) (0.030) L.industry_median_leverage -0.024 -0.024 -0.024 -0.026 -0.026 -0.037** -0.019 (0.017) (0.017) (0.017) (0.017) (0.017) (0.015) (0.021) Constant 0.182*** 0.182*** 0.183*** 0.183*** 0.182*** 0.178*** 0.194*** (0.021) (0.021) (0.021) (0.021) (0.021) (0.022) (0.033) Observations 7,761 7,761 7,761 7,761 7,761 6,941 6,941 R-squared 0.290 0.290 0.291 0.292 0.292 0.297 0.320 Year FE NO NO NO NO NO NO NO Industry FE YES YES YES YES YES YES YES Industry subperiod FE NO NO NO NO NO NO YES Firm FE NO NO NO NO NO NO NO
Robust standard errors in parentheses *** p<0.01, ** p<0.05, * p<0.1
49

Table 10: Levels of investment rate after TFP (with industry �xed e¤ects), no controlsbut the sample is the propensity score matched sample using 2005 as a baseline matchingyear
(1) (2) (3) (4) (5) (6) (7)VARIABLES cx cx cx cx cx 00-06vs07-13 00-06vs07-
13 trust_dummy 0.006 0.010 (0.011) (0.013) comp_is_trust -0.052*** -0.056*** (0.011) (0.012) post_TFP_dummy -0.040*** -0.039*** -0.041*** -0.040*** -0.040*** -0.039*** -0.022* (0.007) (0.007) (0.007) (0.007) (0.007) (0.008) (0.012)comp_is_trust*post_TFP_dummy 0.017* 0.017* (0.010) (0.010) post_conversion -0.009 (0.011) business_trust -0.009 -0.024* -0.027* -0.037** -0.032* (0.012) (0.014) (0.014) (0.015) (0.017)utility_trust 0.020 0.052** 0.053*** 0.026 0.015 (0.019) (0.020) (0.020) (0.025) (0.026)utility_trust*comp_is_trust -0.094*** -0.126*** -0.128*** -0.103*** -0.100*** (0.016) (0.017) (0.017) (0.020) (0.023)business_trust*comp_is_trust -0.023** -0.008 -0.005 0.006 0.002 (0.010) (0.011) (0.012) (0.011) (0.013)utility_trust*comp_is_trust*post_TFP_dummy
-0.002 0.012 0.011 0.006 0.035*
(0.018) (0.017) (0.018) (0.018) (0.020)post_TFP_dummy*business_trust*comp_is_trust
0.025** 0.017* 0.019** 0.018* 0.013
(0.010) (0.010) (0.010) (0.010) (0.011)post_conversion#c.business_trust 0.033*** (0.012) post_conversion#c.utility_trust -0.073*** (0.017) post_conv_early*business_trust 0.006 0.009 0.010 (0.012) (0.012) (0.012)post_conv_early*utility_trust -0.050*** -0.035* -0.020 (0.017) (0.019) (0.020)post_conv_late*business_trust 0.047*** 0.055*** 0.041** (0.014) (0.014) (0.017)post_conv_late*utility_trust -0.086*** -0.067*** -0.057* (0.019) (0.021) (0.031)Constant 0.021*** 0.021*** 0.021*** 0.021*** 0.021*** 0.026*** 0.012 (0.001) (0.001) (0.001) (0.001) (0.001) (0.002) (.)Observations 2,263 2,263 2,263 2,263 2,263 1,989 1,989R-squared 0.449 0.449 0.462 0.471 0.473 0.463 0.516YearFE NO NO NO NO NO NO NOIndustryFE YES YES YES YES YES YES YESIndustrysubperiodFE NO NO NO NO NO NO YESFirmFE NO NO NO NO NO NO NO
50

Table 11: Levels of investment rate after TFP (with industry �xed e¤ects), no controlsbut the sample is the propensity score matched sample using 2006 as a baseline matchingyear
(1) (2) (3) (4) (5) (6) (7)VARIABLES cx cx cx cx cx 00-06vs07-
1300-06vs07-13
trust_dummy -0.003 -0.000 (0.011) (0.013) comp_is_trust -0.043*** -0.045*** (0.011) (0.013) post_TFP_dummy -0.043*** -0.041*** -0.043*** -0.042*** -0.042*** -0.041*** -0.037*** (0.007) (0.007) (0.007) (0.007) (0.007) (0.008) (0.014)comp_is_trust*post_TFP_dummy 0.018* 0.018* (0.009) (0.009) post_conversion -0.007 (0.010) business_trust -0.016 -0.031** -0.034** -0.042*** -0.040*** (0.011) (0.013) (0.013) (0.014) (0.015)utility_trust 0.019 0.056** 0.058** 0.036 0.040 (0.020) (0.023) (0.023) (0.024) (0.026)utility_trust*comp_is_trust -0.085*** -0.121*** -0.124*** -0.104*** -0.118*** (0.017) (0.018) (0.018) (0.019) (0.021)business_trust#*comp_is_trust -0.018* -0.004 -0.000 0.009 0.009 (0.010) (0.011) (0.011) (0.011) (0.011)utility_trust*comp_is_trust*post_TFP_dummy
-0.008 0.006 0.005 0.002 0.031
(0.018) (0.017) (0.018) (0.019) (0.022)post_TFP_dummy*business_trust*comp_is_trust
0.026*** 0.019** 0.021** 0.020** 0.014
(0.009) (0.009) (0.009) (0.010) (0.010)post_conversion*business_trust 0.030*** (0.010) post_conversion*utility_trust -0.077*** (0.018) post_conv_early*business_trust 0.002 0.005 0.010 (0.011) (0.011) (0.010)post_conv_early*utility_trust -0.046** -0.035* -0.025 (0.018) (0.019) (0.020)post_conv_late*business_trust 0.045*** 0.052*** 0.040** (0.012) (0.012) (0.016)post_conv_late*utility_trust -0.096*** -0.080*** -0.079*** (0.021) (0.022) (0.030)Constant 0.069*** 0.069*** 0.064*** 0.063*** 0.062*** 0.062*** 0.097*** (0.010) (0.010) (0.009) (0.009) (0.009) (0.009) (0.017)Observations 2,637 2,637 2,637 2,637 2,637 2,369 2,369R-squared 0.437 0.437 0.448 0.457 0.459 0.455 0.496YearFE NO NO NO NO NO NO NOIndustryFE YES YES YES YES YES YES YESIndustrysubperiodFE NO NO NO NO NO NO YESFirmFE NO NO NO NO NO NO NO
51

Table 12: Levels of investment rate after TFP (with no inudstry �xed e¤ects), no controlsbut the sample is the propensity score matched sample using 2006 as a baseline matchingyear
(1) (2) (3) (4) (5) (6) VARIABLES cx cx cx cx cx 00-06 vs
07-13 trust_dummy 0.032* 0.037* (0.017) (0.021) comp_is_trust -0.051*** -0.055*** (0.016) (0.019) post_TFP_dummy -0.039*** -0.037*** -0.039*** -0.036*** -0.036*** -0.039*** (0.008) (0.007) (0.007) (0.007) (0.007) (0.008) comp_is_trust*post_TFP_dummy 0.003 0.003 (0.011) (0.011) post_conversion -0.010 (0.013) business_trust -0.024* -0.034** -0.035** -0.048*** (0.013) (0.015) (0.015) (0.014) utility_trust 0.143*** 0.187*** 0.188*** 0.160*** (0.022) (0.021) (0.021) (0.024) utility_trust*comp_is_trust -0.103*** -0.145*** -0.147*** -0.123*** (0.023) (0.022) (0.022) (0.023) business_trust*comp_is_trust -0.032*** -0.021* -0.020 -0.012 (0.011) (0.012) (0.012) (0.011) utility_trust*comp_is_trust*post_TFP_dummy 0.005 0.021 0.020 0.018 (0.019) (0.019) (0.020) (0.020) post_TFP_dummy*business_trust*comp_is_trust 0.018 0.011 0.011 0.013 (0.011) (0.011) (0.011) (0.011) post_conversion*business_trust 0.021* (0.011) post_conversion*utility_trust -0.092*** (0.019) post_conv_early*business_trust 0.012 0.017 (0.013) (0.012) post_conv_early*utility_trust -0.074** -0.059** (0.030) (0.029) post_conv_late*business_trust 0.026** 0.035*** (0.012) (0.012) post_conv_late*utility_trust -0.104*** -0.082*** (0.020) (0.021) Constant 0.117*** 0.117*** 0.117*** 0.116*** 0.116*** 0.120*** (0.009) (0.009) (0.009) (0.009) (0.009) (0.011) Observations 2,637 2,637 2,637 2,637 2,637 2,369 R-squared 0.037 0.038 0.126 0.136 0.137 0.118 Year FE NO NO NO NO NO NO Industry FE YES YES YES YES YES YES Industry subperiod FE NO NO NO NO NO NO Firm FE NO NO NO NO NO NO
52

Table 13: Levels of investment rate after TFP with �rm �xed e¤ects on a propensityscore matched sample using 2006 as a baseline year for matching.
(1) (2) (3) (4) (5) (6) VARIABLES cx cx cx cx cx 00-06 vs
07-13 comp_is_trust -0.035*** -0.042*** (0.012) (0.014) comp_is_trust*post_TFP_dummy 0.018* 0.023** (0.010) (0.010) post_TFP_dummy -0.044*** -0.042*** -0.044*** -0.042*** -0.043*** -0.041*** (0.007) (0.007) (0.007) (0.007) (0.007) (0.007) post_conversion -0.012 (0.011) utility_trust*comp_is_trust -0.056** -0.094*** -0.096*** -0.075*** (0.023) (0.021) (0.021) (0.022) business_trust*comp_is_trust -0.026** -0.016 -0.009 -0.001 (0.012) (0.012) (0.012) (0.012) utility_trust* comp_is_trust* post_TFP_dummy
-0.010 0.006 0.006 0.000
(0.023) (0.022) (0.022) (0.023) post_TFP_dummy*business_trust* comp_is_trust
0.036*** 0.030*** 0.035*** 0.031***
(0.009) (0.009) (0.008) (0.009) post_conversion*business_trust 0.016 (0.011) post_conversion*utility_trust -0.065*** (0.017) post_conv_early*business_trust -0.026 -0.024 (0.017) (0.017) post_conv_early*utility_trust -0.051*** -0.041** (0.015) (0.019) post_conv_late*business_trust 0.036*** 0.040*** (0.012) (0.012) post_conv_late*utility_trust -0.071*** -0.056** (0.021) (0.022) Constant 0.126*** 0.127*** 0.125*** 0.127*** 0.126*** 0.122*** (0.005) (0.005) (0.004) (0.004) (0.004) (0.004) Observations 2,637 2,350 2,350 2,350 2,350 2,090 R-squared 0.060 0.061 0.072 0.083 0.090 0.076 Number of company1 248 200 200 200 200 200 Year FE NO NO NO NO NO NO Industry FE NO NO NO NO NO NO Firm FE YES YES YES YES YES YES
53

Table 14: Levels of investment rate after TFP; comparison of 2003-2006 with 2011- 2012using propensity score matched sample with 2006 as a baseline year for matching.
(1) (2) (3) (4) (5) VARIABLES cx:03-06 cx:03-06 cx:03-06 cx:03-06 cx:03-06 trust_dummy -0.048*** (0.011) years_11_12 -0.039*** -0.037*** -0.028 -0.029** -0.028** (0.012) (0.012) (0.039) (0.011) (0.011) trust_dummy*years_11_12 0.029* 0.018 (0.015) (0.015) utility_trust -0.069*** -0.077*** (0.022) (0.023) business_trust -0.037*** -0.036*** (0.013) (0.014) utility_trust*years_11_12 -0.017 0.020 -0.027 (0.023) (0.031) (0.025) years_11_12*business_trust 0.045*** 0.034** 0.035** (0.015) (0.017) (0.015) Constant 0.069*** 0.059*** 0.068** 0.113*** 0.113*** (0.012) (0.011) (0.027) (0.002) (0.002) Observations 1,246 1,246 1,246 1,246 1,246 R-squared 0.463 0.473 0.501 0.015 0.027 Year FE NO NO NO NO NO Industry FE YES YES YES NO NO Industry subperiod FE NO NO YES NO NO Firm FE NO NO NO YES YES
54

Table 15: Levels of investment rate after TFP with industry �xed e¤ects. Tobit modelwith lower bound censoring at zero.
(1) (2) (3) (4) (5) (6) (7) VARIABLES cx cx cx cx cx 00-06 vs
07-13 00-06 vs
07-13 trust_dummy -0.009 -0.009 (0.010) (0.013) comp_is_trust -0.061*** -0.061*** (0.013) (0.015) post_TFP_dummy -0.028*** -0.028*** -0.028*** -0.028*** -0.027*** -0.017*** -0.041*** (0.006) (0.006) (0.006) (0.006) (0.006) (0.006) (0.002) comp_is_trust*post_TFP_dummy 0.016 0.016 (0.011) (0.011) post_conversion 0.000 (0.011) business_trust -0.018* -0.037*** -0.039*** -0.047*** -0.047*** (0.010) (0.012) (0.012) (0.012) (0.003) utility_trust 0.010 0.049** 0.052** 0.019 0.019*** (0.018) (0.023) (0.023) (0.026) (0.004) ctility_trust*comp_is_trust -0.074*** -0.113*** -0.116*** -0.085*** -0.107*** (0.023) (0.025) (0.025) (0.025) (0.005) business_trust*comp_is_trust -0.056*** -0.037*** -0.036*** -0.022* -0.021*** (0.013) (0.013) (0.013) (0.013) (0.003) utility_trust*comp_is_trust* post_TFP_dummy
-0.009 0.005 0.004 -0.000 0.026***
(0.020) (0.019) (0.019) (0.019) (0.005) post_TFP_dummy*business_trust* comp_is_trust
0.027** 0.021* 0.021* 0.012 0.003
(0.012) (0.011) (0.011) (0.012) (0.003) cost_conversion*business_trust 0.029*** (0.010) post_conversion*utility_trust -0.065*** (0.019) post_conv_early*business_trust 0.018 0.027** 0.032*** (0.013) (0.013) (0.003) post_conv_early*utility_trust -0.041** -0.015 -0.018*** (0.018) (0.019) (0.003) post_conv_late*business_trust 0.033*** 0.041*** 0.035*** (0.011) (0.012) (0.002)
Post post_conv_late*utility_trust -0.079*** -0.048** -0.036*** (0.022) (0.022) (0.004) Constant 0.136*** 0.136*** 0.136*** 0.136*** 0.135*** 0.123*** 0.124*** (0.026) (0.026) (0.026) (0.026) (0.026) (0.027) (0.002) Observations 7,486 7,486 7,486 7,486 7,486 6,684 6,684 Year FE NO NO NO NO NO NO NO Industry FE YES YES YES YES YES YES YES Industry subperiod FE NO NO NO NO NO NO YES Firm FE NO NO NO NO NO NO NO
55

Table16:LevelsofinvestmentrateafterTFPwithindustry�xede¤ects.Placeboregressionsusingcolumn1Table4asbaselineand
varyingyearofthereform.
(1
) (2
) (3
) (4
) (5
) (6
) (7
) (8
) (9
) (1
0)
(11)
(1
2)
VA
RIA
BLE
S 20
00
2001
20
02
2003
20
04
2005
20
06
2007
20
08
2009
20
10
2011
trust
_dum
my
-0.0
00
-0.0
00
-0.0
01
-0.0
01
-0.0
01
0.00
0 0.
003
0.00
5 0.
009
0.00
6 0.
005
0.00
6
(0.0
08)
(0.0
08)
(0.0
08)
(0.0
09)
(0.0
09)
(0.0
08)
(0.0
08)
(0.0
08)
(0.0
08)
(0.0
09)
(0.0
09)
(0.0
09)
com
p_is
_tru
st
-0.0
40
-0.0
63**
* -0
.067
***
-0.0
47**
* -0
.032
**
-0.0
34**
* -0
.042
***
-0.0
47**
* -0
.053
***
-0.0
48**
* -0
.046
***
-0.0
47**
*
(0.0
32)
(0.0
20)
(0.0
16)
(0.0
13)
(0.0
13)
(0.0
11)
(0.0
10)
(0.0
10)
(0.0
09)
(0.0
09)
(0.0
09)
(0.0
09)
post
_TFP
_pla
cebo
-0
.028
***
-0.0
23**
* -0
.013
***
-0.0
09**
-0
.012
**
-0.0
18**
* -0
.025
***
-0.0
28**
* -0
.036
***
-0.0
22**
* -0
.020
***
-0.0
32**
*
(0.0
05)
(0.0
05)
(0.0
05)
(0.0
05)
(0.0
05)
(0.0
05)
(0.0
05)
(0.0
05)
(0.0
05)
(0.0
05)
(0.0
05)
(0.0
05)
com
p_is
_tru
st*p
ost_
TFP_
plac
ebo
0.00
7 0.
032
0.03
5**
0.01
4 -0
.004
-0
.002
0.
007
0.01
3*
0.02
0***
0.
018*
* 0.
024*
* 0.
024*
*
(0.0
33)
(0.0
20)
(0.0
15)
(0.0
11)
(0.0
11)
(0.0
10)
(0.0
09)
(0.0
08)
(0.0
08)
(0.0
08)
(0.0
09)
(0.0
11)
Con
stan
t 0.
197*
**
0.19
0***
0.
176*
**
0.17
2***
0.
174*
**
0.18
0***
0.
182*
**
0.17
9***
0.
179*
**
0.16
8***
0.
164*
**
0.16
2***
(0.0
21)
(0.0
21)
(0.0
21)
(0.0
21)
(0.0
21)
(0.0
21)
(0.0
21)
(0.0
21)
(0.0
20)
(0.0
20)
(0.0
20)
(0.0
20)
Obs
erva
tions
7,
761
7,76
1 7,
761
7,76
1 7,
761
7,76
1 7,
761
7,76
1 7,
761
7,76
1 7,
761
7,76
1 R
-squ
ared
0.
288
0.28
8 0.
286
0.28
5 0.
286
0.28
7 0.
290
0.29
1 0.
295
0.28
8 0.
287
0.28
9 Y
ear F
E N
O
NO
N
O
NO
N
O
NO
N
O
NO
N
O
NO
N
O
NO
In
dust
ry F
E Y
ES
YES
Y
ES
YES
Y
ES
YES
Y
ES
YES
Y
ES
YES
Y
ES
YES
In
dust
ry su
bper
iod
FE
NO
N
O
NO
N
O
NO
N
O
NO
N
O
NO
N
O
NO
N
O
Firm
FE
NO
N
O
NO
N
O
NO
N
O
NO
N
O
NO
N
O
NO
N
O
56

Table17:LevelsofinvestmentrateafterTFPwithindustry�xede¤ects.Placeboregressionsusingcolumn4Table4asbaselineand
varyingyearofthereform.
(1
) (2
) (3
) (4
) (5
) (6
) (7
) (8
) (9
) (1
0)
VA
RIA
BLE
S 20
02
2003
20
04
2005
20
06
2007
20
08
2009
20
10
2011
busi
ness
_tru
st
-0.0
24**
-0
.024
**
-0.0
25**
-0
.025
**
-0.0
26**
-0
.025
**
-0.0
25**
-0
.023
**
-0.0
22*
-0.0
19*
(0
.011
) (0
.011
) (0
.011
) (0
.011
) (0
.011
) (0
.011
) (0
.011
) (0
.011
) (0
.011
) (0
.011
) ut
ility
_tru
st
0.06
3***
0.
063*
**
0.05
9***
0.
057*
**
0.05
8***
0.
060*
**
0.06
4***
0.
073*
**
0.07
4***
0.
067*
**
(0
.015
) (0
.015
) (0
.015
) (0
.015
) (0
.014
) (0
.015
) (0
.014
) (0
.015
) (0
.016
) (0
.015
) ut
ility
_tru
st*c
omp_
is_t
rust
-0
.127
***
-0.1
00**
* -0
.077
***
-0.0
77**
* -0
.094
***
-0.1
01**
* -0
.110
***
-0.1
16**
* -0
.113
***
-0.1
03**
*
(0.0
23)
(0.0
18)
(0.0
19)
(0.0
18)
(0.0
17)
(0.0
18)
(0.0
16)
(0.0
17)
(0.0
16)
(0.0
14)
busi
ness
_tru
st*c
omp_
is_t
rust
-0
.049
***
-0.0
36**
* -0
.021
-0
.017
-0
.015
-0
.018
* -0
.019
* -0
.019
* -0
.020
* -0
.023
**
(0
.018
) (0
.013
) (0
.013
) (0
.012
) (0
.012
) (0
.011
) (0
.011
) (0
.011
) (0
.011
) (0
.010
) po
st_T
FP_p
lace
bo
-0.0
12**
-0
.008
* -0
.011
**
-0.0
17**
* -0
.025
***
-0.0
28**
* -0
.036
***
-0.0
22**
* -0
.020
***
-0.0
31**
*
(0.0
05)
(0.0
05)
(0.0
05)
(0.0
05)
(0.0
05)
(0.0
05)
(0.0
05)
(0.0
05)
(0.0
05)
(0.0
05)
utili
ty_t
rust
*com
p_is
_tru
st*p
ost_
TFP_
plac
ebo
0.03
9*
0.00
7 -0
.022
-0
.023
0.
002
0.01
3 0.
034*
* 0.
061*
**
0.08
3***
0.
064*
**
(0
.022
) (0
.017
) (0
.019
) (0
.018
) (0
.016
) (0
.018
) (0
.016
) (0
.017
) (0
.022
) (0
.013
) po
st_T
FP_p
lace
bo*b
usin
ess_
trust
*com
p_is
_tru
st
0.03
8**
0.02
5**
0.01
1 0.
009
0.00
8 0.
012
0.01
2 0.
008
0.01
2 0.
015
(0
.017
) (0
.010
) (0
.010
) (0
.009
) (0
.009
) (0
.007
) (0
.008
) (0
.008
) (0
.011
) (0
.011
) c.
post
_con
vers
ion#
c.bu
sine
ss_t
rust
0.
013
0.01
2 0.
015
0.01
8*
0.02
3**
0.02
5***
0.
032*
**
0.02
3**
0.01
9*
0.01
8*
(0
.010
) (0
.010
) (0
.010
) (0
.009
) (0
.009
) (0
.009
) (0
.010
) (0
.010
) (0
.011
) (0
.010
) c.
post
_con
vers
ion#
c.ut
ility
_tru
st
-0.0
64**
* -0
.063
***
-0.0
56**
* -0
.051
***
-0.0
51**
* -0
.052
***
-0.0
53**
* -0
.072
***
-0.0
74**
* -0
.059
***
(0
.015
) (0
.015
) (0
.014
) (0
.014
) (0
.014
) (0
.014
) (0
.015
) (0
.016
) (0
.018
) (0
.015
) C
onst
ant
0.17
6***
0.
172*
**
0.17
4***
0.
180*
**
0.18
3***
0.
180*
**
0.18
0***
0.
170*
**
0.16
6***
0.
163*
**
(0
.021
) (0
.021
) (0
.021
) (0
.021
) (0
.021
) (0
.021
) (0
.021
) (0
.021
) (0
.021
) (0
.021
) O
bser
vatio
ns
7,76
1 7,
761
7,76
1 7,
761
7,76
1 7,
761
7,76
1 7,
761
7,76
1 7,
761
R-s
quar
ed
0.28
8 0.
287
0.28
8 0.
290
0.29
2 0.
293
0.29
7 0.
291
0.28
9 0.
291
Yea
r FE
NO
N
O
NO
N
O
NO
N
O
NO
N
O
NO
N
O
Indu
stry
FE
YES
Y
ES
YES
Y
ES
YES
Y
ES
YES
Y
ES
YES
Y
ES
Indu
stry
subp
erio
d FE
N
O
NO
N
O
NO
N
O
NO
N
O
NO
N
O
NO
Fi
rm F
E N
O
NO
N
O
NO
N
O
NO
N
O
NO
N
O
NO
R
obus
t sta
ndar
d er
rors
in p
aren
thes
es
***
p<0.
01, *
* p<
0.05
, * p
<0.1
57

Table18:LevelsofinvestmentrateafterTFPwithindustry�xede¤ects.Placeboregressionsusingcolumn4Table11asbaselineand
varyingyearofthereform.
(1
) (2
) (3
) (4
) (5
) (6
) (7
) (8
) (9
) V
AR
IAB
LES
2003
20
04
2005
20
06
2007
20
08
2009
20
10
2011
bu
sine
ss_t
rust
-0
.025
**
-0.0
29**
-0
.030
**
-0.0
31**
-0
.028
**
-0.0
27**
-0
.022
* -0
.020
-0
.020
(0.0
13)
(0.0
13)
(0.0
13)
(0.0
13)
(0.0
13)
(0.0
13)
(0.0
13)
(0.0
13)
(0.0
13)
utili
ty_t
rust
0.
061*
**
0.05
6**
0.05
4**
0.05
6**
0.06
0***
0.
065*
**
0.07
4***
0.
078*
**
0.06
9***
(0.0
23)
(0.0
23)
(0.0
23)
(0.0
23)
(0.0
23)
(0.0
23)
(0.0
23)
(0.0
24)
(0.0
22)
c.ut
ility
_tru
st#c
.com
p_is
_tru
st
-0.1
26**
* -0
.106
***
-0.1
07**
* -0
.121
***
-0.1
27**
* -0
.135
***
-0.1
42**
* -0
.143
***
-0.1
31**
*
(0.0
21)
(0.0
19)
(0.0
19)
(0.0
18)
(0.0
19)
(0.0
19)
(0.0
19)
(0.0
20)
(0.0
17)
c.bu
sine
ss_t
rust
#c.c
omp_
is_t
rust
-0
.013
-0
.002
-0
.006
-0
.004
-0
.006
-0
.006
-0
.010
-0
.011
-0
.010
(0.0
13)
(0.0
12)
(0.0
11)
(0.0
11)
(0.0
11)
(0.0
10)
(0.0
10)
(0.0
10)
(0.0
10)
post
_TFP
_pla
cebo
-0
.017
***
-0.0
23**
* -0
.033
***
-0.0
42**
* -0
.041
***
-0.0
42**
* -0
.028
***
-0.0
20**
* -0
.024
***
(0
.005
) (0
.006
) (0
.006
) (0
.007
) (0
.007
) (0
.007
) (0
.007
) (0
.007
) (0
.008
) ut
ility
_tru
st*c
omp_
is_t
rust
*pos
t_TF
P_pl
aceb
o 0.
007
-0.0
16
-0.0
17
0.00
6 0.
014
0.03
3*
0.06
1***
0.
107*
**
0.06
2***
(0.0
18)
(0.0
19)
(0.0
17)
(0.0
17)
(0.0
18)
(0.0
18)
(0.0
20)
(0.0
29)
(0.0
15)
post
_TFP
_pla
cebo
*bus
ines
s_tru
st*c
omp_
is_t
rust
0.
017
0.01
1 0.
020*
* 0.
019*
* 0.
019*
* 0.
014
0.01
3 0.
020
0.00
7
(0.0
11)
(0.0
10)
(0.0
08)
(0.0
09)
(0.0
09)
(0.0
09)
(0.0
09)
(0.0
13)
(0.0
12)
post
_con
vers
ion#
c.bu
sine
ss_t
rust
0.
009
0.01
6 0.
022*
* 0.
030*
**
0.03
1***
0.
035*
**
0.02
1**
0.01
1 0.
010
(0
.010
) (0
.010
) (0
.010
) (0
.010
) (0
.010
) (0
.010
) (0
.010
) (0
.011
) (0
.010
) po
st_c
onve
rsio
n#c.
utili
ty_t
rust
-0
.100
***
-0.0
90**
* -0
.081
***
-0.0
77**
* -0
.079
***
-0.0
85**
* -0
.106
***
-0.1
20**
* -0
.103
***
(0
.018
) (0
.018
) (0
.018
) (0
.018
) (0
.018
) (0
.019
) (0
.020
) (0
.022
) (0
.018
) C
onst
ant
0.05
7***
0.
060*
**
0.06
2***
0.
063*
**
0.06
1***
0.
058*
**
0.05
3***
0.
050*
**
0.04
9***
(0.0
09)
(0.0
09)
(0.0
10)
(0.0
09)
(0.0
09)
(0.0
09)
(0.0
09)
(0.0
09)
(0.0
09)
Obs
erva
tions
2,
637
2,63
7 2,
637
2,63
7 2,
637
2,63
7 2,
637
2,63
7 2,
637
R-s
quar
ed
0.44
1 0.
446
0.45
3 0.
457
0.45
4 0.
452
0.44
4 0.
443
0.44
0 Y
ear F
E N
O
NO
N
O
NO
N
O
NO
N
O
NO
N
O
Indu
stry
FE
YES
Y
ES
YES
Y
ES
YES
Y
ES
YES
Y
ES
YES
In
dust
ry su
bper
iod
FE
NO
N
O
NO
N
O
NO
N
O
NO
N
O
NO
Fi
rm F
E N
O
NO
N
O
NO
N
O
NO
N
O
NO
N
O
58

Oxford University Centre for Business Taxation Working Paper series recent papers
WP 16/10 Li Liu and Ben Lockwood VAT notches, voluntary registration and bunching: Theory and UK evidence WP 16/09 Harry Grubert and Roseanne Altshuler Shifting the burden of taxation from the corporate to the personal level and getting the corporate tax rate down to 15 percent WP 16/08 Margaret K McKeehan and George R Zodrow Balancing act: weighing the factors affecting the taxation of capital income in a small open economy WP 16/07 Michael P Devereux and Li Liu Stimulating investment through incorporation WP16/05 Tobias Böhm, Nadine Riedel and Martin Simmler Large and influential: firm size and governments’ corporate tax rate choice? WP16/04 Dhammika Dharmapala The economics of corporate and business tax reform
WP 16/03 Rita de la Feria EU VAT principles as interpretative aids to EU VAT rules: the inherent paradox
WP 16/02 Irem Guceri Will the real R&D employees please stand up? Effects of tax breaks on firm level outcomes WP 16/01 Giorgia Maffini, Jing Xing and Michael P Devereux The impact of investment incentives: evidence from UK corporation tax returns WP 15/33 Anzhela Cédelle Enhanced co-operation: a way forward for tax harmonisation in the EU? WP 15/32 James Mahon and Eric Zwick Do experts help firms optimise? WP 15/31 Robin Boadway, Motohiro Sato and Jean-François Tremblay Cash-flow business taxation revisited: bankruptcy, risk aversion and asymmetric information WP 15/30 Martin Simmler Do multinational firms invest more? On the impact of internal debt financing and transfer pricing on capital accumulation WP 15/29 Daniel Shaviro The crossroads versus the seesaw: getting a 'fix' on recent international tax policy developments WP 15/28 Zhonglan Dai, Douglas A Shackelford, Yue (Layla) Ying and Harold H Zhang Do companies invest more after shareholder tax cuts?

WP 15/27 Martin Ruf and Julia Schmider Who bears the cost of taxing the rich? An empirical study on CEO pay WP 15/26 Eric Orhn The corporate investment response to the domestic production activities deduction WP 15/25 Li Liu International taxation and MNE investment: evidence from the UK change to territoriality WP 15/24 Edward D Kleinbard Reimagining capital income taxation WP 15/23 James R Hines Jr, Niklas Potrafke, Marina Riem and Christoph Schinke Inter vivos transfers of ownership in family firms WP 15/22 Céline Azémar and Dhammika Dharmapala Tax sparing agreements, territorial tax reforms, and foreign direct investment WP 15/21 Wei Cui A critical review of proposals for destination-based cash-flow corporate taxation as an international tax reform option WP 15/20 Andrew Bird and Stephen A Karolyi Governance and taxes: evidence from regression discontinuity WP 15/19 Reuven Avi-Yonah Reinventing the wheel: what we can learn from the Tax Reform Act of 1986 WP 15/18 Annette Alstadsæter, Salvador Barrios, Gaetan Nicodeme, Agnieszka Maria Skonieczna and Antonio Vezzani Patent boxes design, patents,location and local R&D WP 15/17 Laurent Bach Do better entrepreneurs avoid more taxes? WP 15/16 Nadja Dwenger, Frank M Fossen and Martin Simmler From financial to real economic crisis: evidence from individual firm–bank relationships in Germany WP 15/15 Giorgia Maffini and John Vella Evidence-based policy-making? The Commission's proposal for an FTT WP 15/14 Clemens Fuest and Jing Xing How can a country 'graduate' from procyclical fiscal policy? Evidence from China? WP 15/13 Richard Collier and Giorgia Maffini The UK international tax agenda for business and the impact of the OECD BEPS project WP 15/12 Irem Guceri and Li Liu Effectiveness of fiscal incentives for R&D: quasi-experimental evidence WP 15/11 Irem Guceri Tax incentives and R&D: an evaluation of the 2002 UK reform using micro data

WP 15/10 Rita de la Feria and Parintira Tanawong Surcharges and penalties in UK tax law WP 15/09 Ernesto Crivelli, Ruud de Mooij, Michael Keen Base erosion, profit-shifting and developing countries WP 15/08 Judith Freedman Managing tax complexity: the institutional framework for tax policy-making and oversight
WP 15/07 Michael P Devereux, Giorgia Maffini and Jing Xing Corporate tax incentives and capital structure: empirical evidence from UK tax returns WP 15/06 Li Liu and Ben Lockwood VAT notches WP 15/05 Clemens Fuest and Li Liu Does ownership affect the impact of taxes on firm behaviour? Evidence from China. WP 15/04 Michael P Devereux, Clemens Fuest and Ben Lockwood The taxation of foreign profits: a unified view WP 15/03 Jitao Tang and Rosanne Altshuler The spillover effects of outward foreign direct investment on home countries: evidence from the United States WP 15/02 Juan Carlos Suarez Serrato and Owen Zidar Who benefits from state corporate tax cuts? A local labour markets approach with heterogeneous firms WP 15/01 Ronald B Davies, Julien Martin, Mathieu Parenti and Farid Toubal Knocking on Tax Haven’s Door: multinational firms and transfer pricing WP 14/27 Peter Birch Sørensen Taxation and the optimal constraint on corporate debt finance WP 14/26 Johannes Becker, Ronald B Davies and Gitte Jakobs The economics of advance pricing agreements WP 14/25 Michael P Devereux and John Vella Are we heading towards a corporate tax system fit for the 21st century? WP 14/24 Martin Simmler Do multinational firms invest more? On the impact of internal debt financing on capital accumulation WP 14/23 Ben Lockwood and Erez Yerushalmi Should transactions services be taxed at the same rate as consumption? WP 14/22 Chris Sanchirico As American as Apple Inc: International tax and ownership nationality WP 14/19 Jörg Paetzold and Hannes Winner Taking the High Road? Compliance with commuter tax allowances and the role of evasion spillovers

WP 14/18 David Gamage How should governments promote distributive justice?: A framework for analyzing the optimal choice of tax instruments WP 14/16 Scott D Dyreng, Jeffrey L Hoopes and Jaron H Wilde Public pressure and corporate tax behaviour WP 14/15 Eric Zwick and James Mahon Do financial frictions amplify fiscal policy? Evidence from business investment stimulus WP 14/14 David Weisbach The use of neutralities in international tax policy WP 14/13 Rita de la Feria Blueprint for reform of VAT rates in Europe WP 14/12 Miguel Almunia and David Lopez Rodriguez Heterogeneous responses to effective tax enforcement: evidence from Spanish firms WP 14/11 Charles E McLure, Jack Mintz and George R Zodrow US Supreme Court unanimously chooses substance over form in foreign tax credit WP 14/10 David Neumark and Helen Simpson Place-based policies WP 14/09 Johannes Becker and Ronald B Davies A negotiation-based model of tax-induced transfer pricing WP 14/08 Marko Koethenbuerger and Michael Stimmelmayr Taxing multinationals in the presence of internal capital markets WP 14/07 Michael Devereux and Rita de la Feria Designing and implementing a destination-based corporate tax WP 14/05 John W Diamond and George R Zodrow The dynamic economic effects of a US corporate income tax rate reduction WP 14/04 Claudia Keser, Gerrit Kimpel and Andreas Oesterricher The CCCTB option – an experimental study WP 14/03 Arjan Lejour The foreign investment effects of tax treaties WP 14/02 Ralph-C. Bayer Harald Oberhofer and Hannes Winner The occurrence of tax amnesties: theory and evidence WP14/01 Nils Herger, Steve McCorriston and Christos Kotsogiannisz Multiple taxes and alternative forms of FDI: evidence from cross-border acquisitions