Embed Size (px)
Citation preview
SANDIA REPORT SAND2012-4080 Unlimited Release May 2012
Extending and Automating a Systems-Theoretic Hazard Analysis for Requirements Generation and Analysis
John Thomas
Prepared by Sandia National Laboratories
Albuquerque, New Mexico 87185 and Livermore, California 94550
Sandia National Laboratories is a multi-program laboratory managed and operated by Sandia Corporation,
a wholly owned subsidiary of Lockheed Martin Corporation, for the U.S. Department of Energy's National Nuclear Security Administration under contract DE-AC04-94AL85000.
Approved for public release; further dissemination unlimited.
2
Issued by Sandia National Laboratories, operated for the United States Department of Energy
by Sandia Corporation. NOTICE: This report was prepared as an account of work sponsored by an agency of the United States Government. Neither the United States Government, nor any agency thereof, nor any of their employees, nor any of their contractors, subcontractors, or their employees, make any warranty, express or implied, or assume any legal liability or responsibility for the
accuracy, completeness, or usefulness of any information, apparatus, product, or process disclosed, or represent that its use would not infringe privately owned rights. Reference herein to any specific commercial product, process, or service by trade name, trademark, manufacturer, or otherwise, does not necessarily constitute or imply its endorsement, recommendation, or favoring by the United States Government, any agency thereof, or any of their contractors or subcontractors. The views and opinions expressed herein do not necessarily state or reflect those of the United States Government, any agency thereof, or any of their contractors.
Printed in the United States of America. This report has been reproduced directly from the best available copy. Available to DOE and DOE contractors from U.S. Department of Energy Office of Scientific and Technical Information P.O. Box 62
Oak Ridge, TN 37831 Telephone: (865) 576-8401 Facsimile: (865) 576-5728 E-Mail: [email protected] Online ordering: http://www.osti.gov/bridge Available to the public from
U.S. Department of Commerce National Technical Information Service 5285 Port Royal Rd. Springfield, VA 22161 Telephone: (800) 553-6847 Facsimile: (703) 605-6900 E-Mail: [email protected]
Online order: http://www.ntis.gov/help/ordermethods.asp?loc=7-4-0#online
3
SAND2012-4080
Unlimited Release
May 2012
Extending and Automating a Systems-Theoretic Hazard Analysis for Requirements Generation and
Analysis
John Thomas
Engineering Systems Division, School of Engineering
Massachusetts Institute of Technology
Sandia National Laboratories
P.O. Box 5800
Albuquerque, New Mexico 87185-MS0405
Abstract
Systems Theoretic Process Analysis (STPA) is a powerful new hazard analysis method designed to go beyond traditional safety techniques—such as Fault Tree Analysis (FTA)—that overlook important causes of accidents like flawed requirements, dysfunctional component interactions, and software errors. While proving to be very effective on real systems, no formal structure has been defined for STPA and its application has been ad-hoc with no rigorous procedures or model-based design tools. This report defines a formal mathematical structure underlying STPA and describes a procedure for systematically performing an STPA analysis based on that structure. A method for using the results of the hazard analysis to generate formal safety-critical, model-based system and software requirements is also presented. Techniques to automate both the analysis and the requirements generation are introduced, as well as a method to detect conflicts between the safety and other functional model-based requirements during early development of the system.

4
5
CONTENTS
1 Introduction and Motivation ...............................................................................................7
2 Evaluation of traditional hazard analysis techniques............................................................7
2.1 Fault Tree Analysis ........................................................................................................7
2.1.1 Evaluation ..............................................................................................................9
2.2 Event Tree Analysis .....................................................................................................12
2.2.1 Evaluation ............................................................................................................13
2.3 FMEA and FMECA .......................................................................................................14
2.3.1 Evaluation ............................................................................................................15
2.4 General evaluation of failure-based methods..............................................................16
3 The STAMP Accident Model ..............................................................................................19
4 STPA Hazard Analysis .........................................................................................................20
5 Formal Specification for Hazardous Control Actions ..........................................................24
6 A Procedure to Identify Hazardous Control Actions ...........................................................25
6.1 Part 1: Control actions provided in a state where the action is hazardous ...................26
6.2 Part 2: Control actions not provided in a state that makes inaction hazardous ............28
7 Formal method for identifying Hazardous Control Actions ................................................29
8 Generating Model-Based Specifications ............................................................................31
9 Conclusions: ......................................................................................................................34
10 References ........................................................................................................................34
FIGURES
Figure 1: Example fault tree from the original Bell Laboratory study [8] ......................................8
Figure 2: A partial fault tree for an aircraft collision avoidance system [11] ...............................10
Figure 3: A partial fault tree for proposed airspace procedures [12] ..........................................11
Figure 4: Simplified event tree for a nuclear reactor adapted from [27] ....................................13
Figure 5: A Venn diagram of failure scenarios and unsafe scenarios ..........................................16
Figure 6: Preliminary control diagram for an automated door controller...................................21
Figure 7: General control loop with causal factors .....................................................................23
Figure 8: Augmented control structure with the door controller’s process model .....................27
6
TABLES
Table 1: Example FMECA worksheet adapted from [39] ............................................................15
Table 2: Potentially hazardous control actions for a simple automated door controller ............22
Table 3: Contexts for the open door control action....................................................................28
Table 4: Contexts for the lack of an open door control action ....................................................29
Table 5: Example hazardous control action table for the door open command .........................31
Table 6: Example SpecTRM-RL table for the door open command.............................................33
7
1 Introduction and Motivation
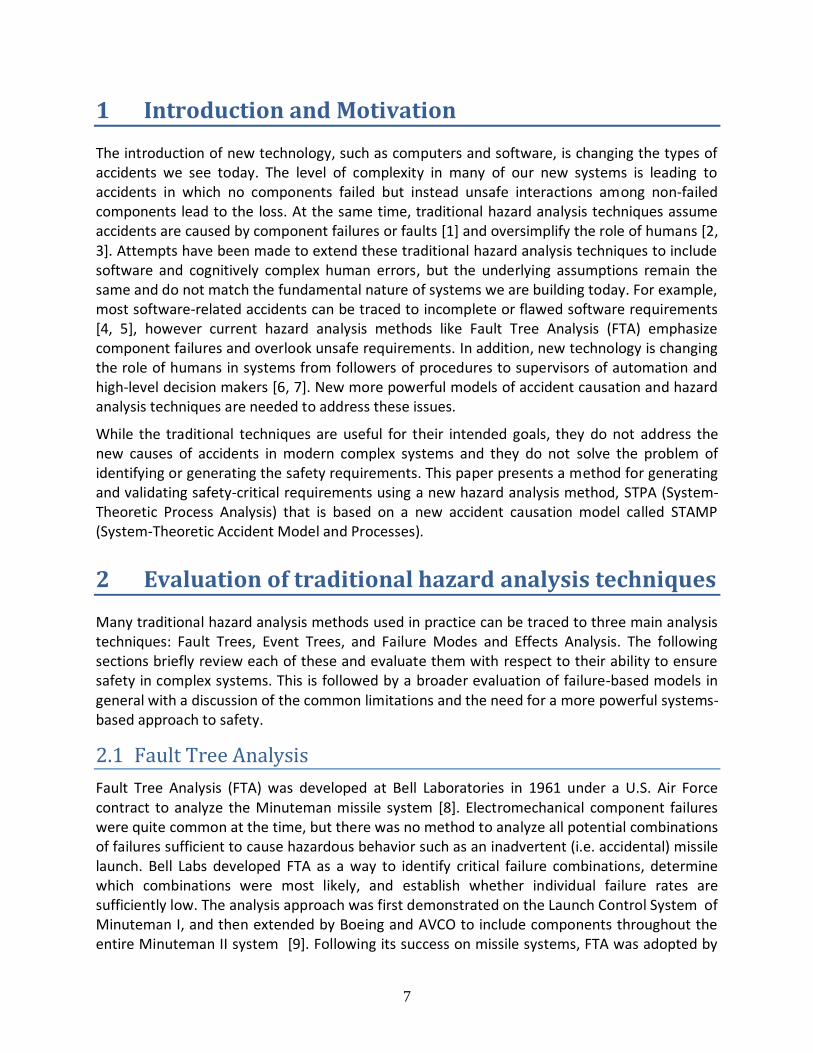
The introduction of new technology, such as computers and software, is changing the types of accidents we see today. The level of complexity in many of our new systems is leading to accidents in which no components failed but instead unsafe interactions among non-failed components lead to the loss. At the same time, traditional hazard analysis techniques assume accidents are caused by component failures or faults [1] and oversimplify the role of humans [2, 3]. Attempts have been made to extend these traditional hazard analysis techniques to include software and cognitively complex human errors, but the underlying assumptions remain the same and do not match the fundamental nature of systems we are building today. For example, most software-related accidents can be traced to incomplete or flawed software requirements [4, 5], however current hazard analysis methods like Fault Tree Analysis (FTA) emphasize component failures and overlook unsafe requirements. In addition, new technology is changing the role of humans in systems from followers of procedures to supervisors of automation and high-level decision makers [6, 7]. New more powerful models of accident causation and hazard analysis techniques are needed to address these issues.
While the traditional techniques are useful for their intended goals, they do not address the new causes of accidents in modern complex systems and they do not solve the problem of identifying or generating the safety requirements. This paper presents a method for generating and validating safety-critical requirements using a new hazard analysis method, STPA (System-Theoretic Process Analysis) that is based on a new accident causation model called STAMP (System-Theoretic Accident Model and Processes).
2 Evaluation of traditional hazard analysis techniques
Many traditional hazard analysis methods used in practice can be traced to three main analysis techniques: Fault Trees, Event Trees, and Failure Modes and Effects Analysis. The following sections briefly review each of these and evaluate them with respect to their ability to ensure safety in complex systems. This is followed by a broader evaluation of failure-based models in general with a discussion of the common limitations and the need for a more powerful systems-based approach to safety.
2.1 Fault Tree Analysis
Fault Tree Analysis (FTA) was developed at Bell Laboratories in 1961 under a U.S. Air Force contract to analyze the Minuteman missile system [8]. Electromechanical component failures were quite common at the time, but there was no method to analyze all potential combinations of failures sufficient to cause hazardous behavior such as an inadvertent (i.e. accidental) missile launch. Bell Labs developed FTA as a way to identify critical failure combinations, determine which combinations were most likely, and establish whether individual failure rates are sufficiently low. The analysis approach was first demonstrated on the Launch Control System of Minuteman I, and then extended by Boeing and AVCO to include components throughout the entire Minuteman II system [9]. Following its success on missile systems, FTA was adopted by
8
organizations in many different industries and is now one of the most popular techniques used during hazard analysis.
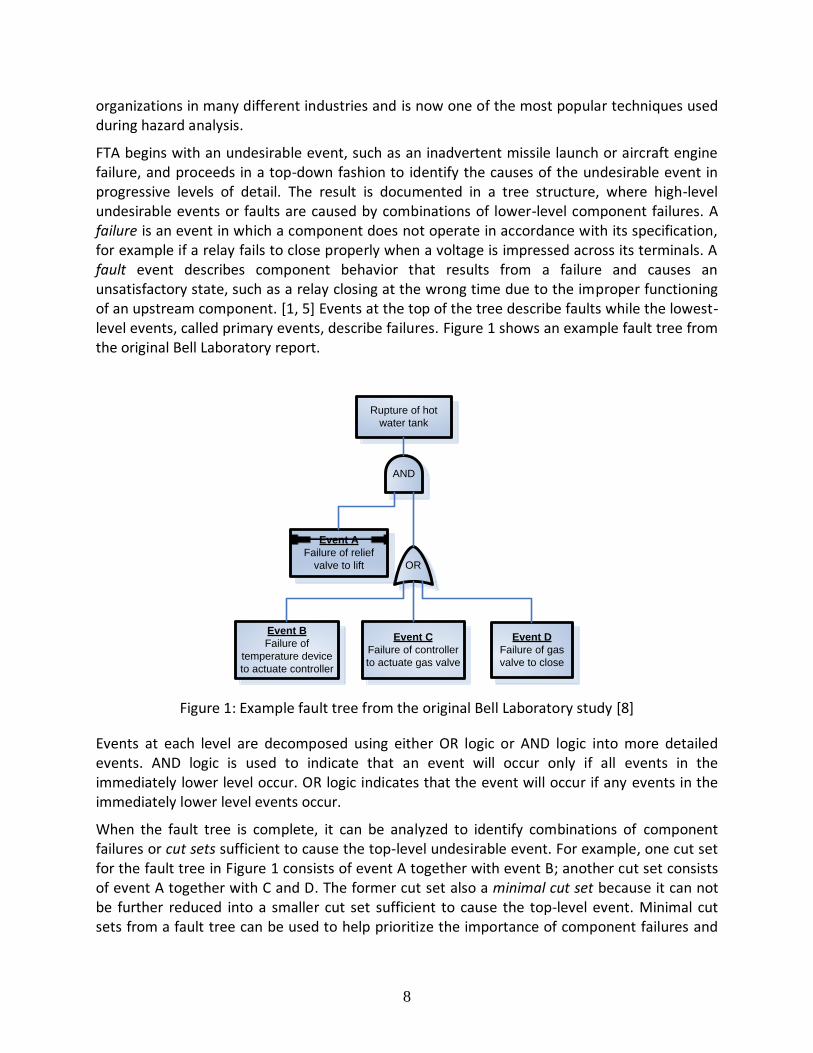
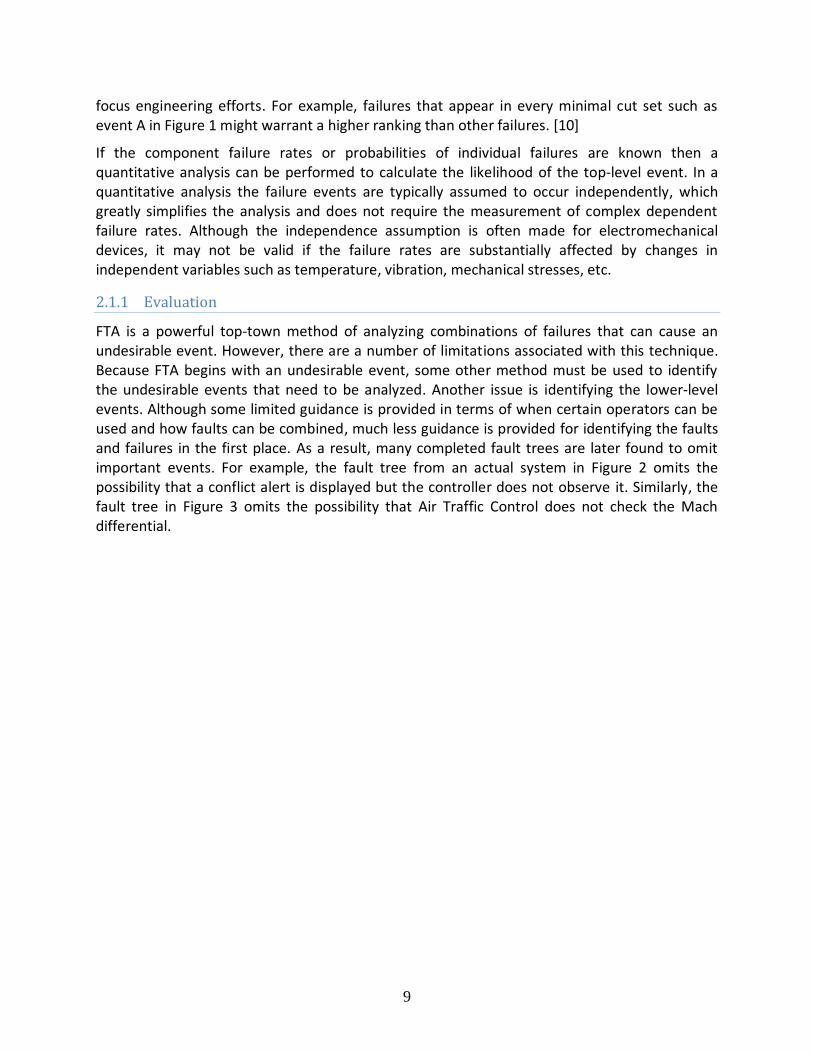
FTA begins with an undesirable event, such as an inadvertent missile launch or aircraft engine failure, and proceeds in a top-down fashion to identify the causes of the undesirable event in progressive levels of detail. The result is documented in a tree structure, where high-level undesirable events or faults are caused by combinations of lower-level component failures. A failure is an event in which a component does not operate in accordance with its specification, for example if a relay fails to close properly when a voltage is impressed across its terminals. A fault event describes component behavior that results from a failure and causes an unsatisfactory state, such as a relay closing at the wrong time due to the improper functioning of an upstream component. [1, 5] Events at the top of the tree describe faults while the lowest-level events, called primary events, describe failures. Figure 1 shows an example fault tree from the original Bell Laboratory report.
Rupture of hot
water tank
OR
Event B
Failure of
temperature device
to actuate controller
Event C
Failure of controller
to actuate gas valve
Event D
Failure of gas
valve to close
AND
Event A
Failure of relief
valve to lift
Figure 1: Example fault tree from the original Bell Laboratory study [8]
Events at each level are decomposed using either OR logic or AND logic into more detailed events. AND logic is used to indicate that an event will occur only if all events in the immediately lower level occur. OR logic indicates that the event will occur if any events in the immediately lower level events occur.
When the fault tree is complete, it can be analyzed to identify combinations of component failures or cut sets sufficient to cause the top-level undesirable event. For example, one cut set for the fault tree in Figure 1 consists of event A together with event B; another cut set consists of event A together with C and D. The former cut set also a minimal cut set because it can not be further reduced into a smaller cut set sufficient to cause the top-level event. Minimal cut sets from a fault tree can be used to help prioritize the importance of component failures and
9
focus engineering efforts. For example, failures that appear in every minimal cut set such as event A in Figure 1 might warrant a higher ranking than other failures. [10]
If the component failure rates or probabilities of individual failures are known then a quantitative analysis can be performed to calculate the likelihood of the top-level event. In a quantitative analysis the failure events are typically assumed to occur independently, which greatly simplifies the analysis and does not require the measurement of complex dependent failure rates. Although the independence assumption is often made for electromechanical devices, it may not be valid if the failure rates are substantially affected by changes in independent variables such as temperature, vibration, mechanical stresses, etc.
2.1.1 Evaluation
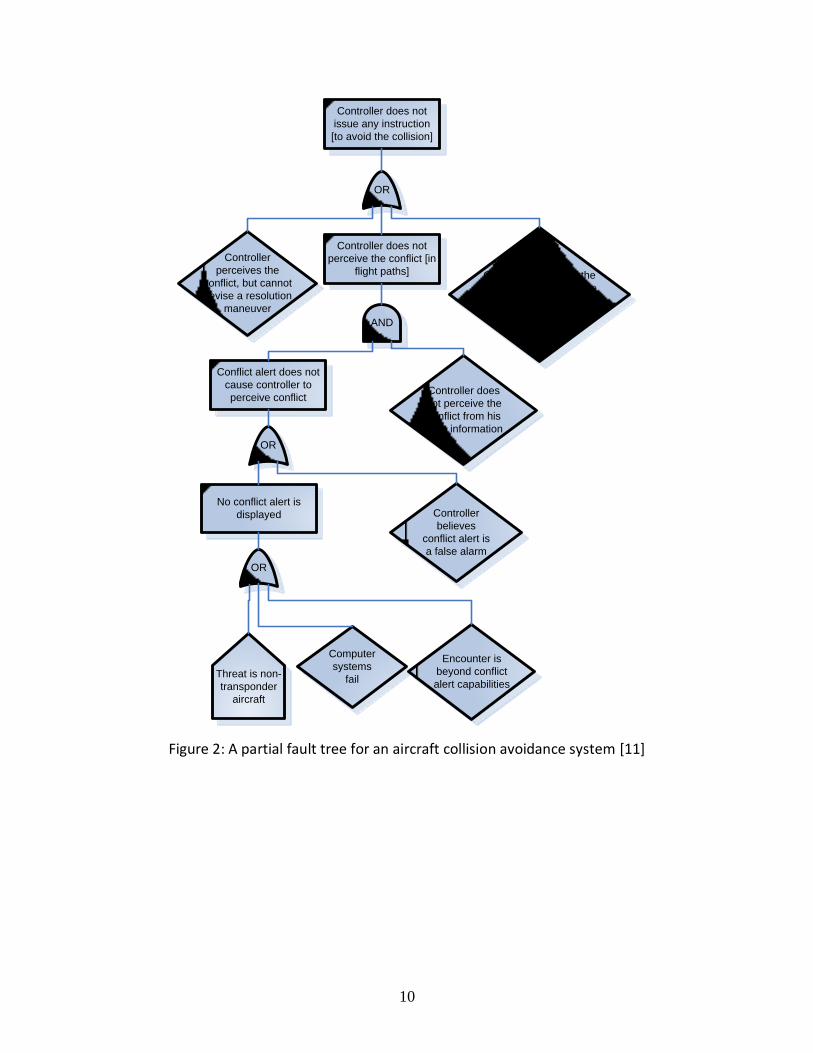
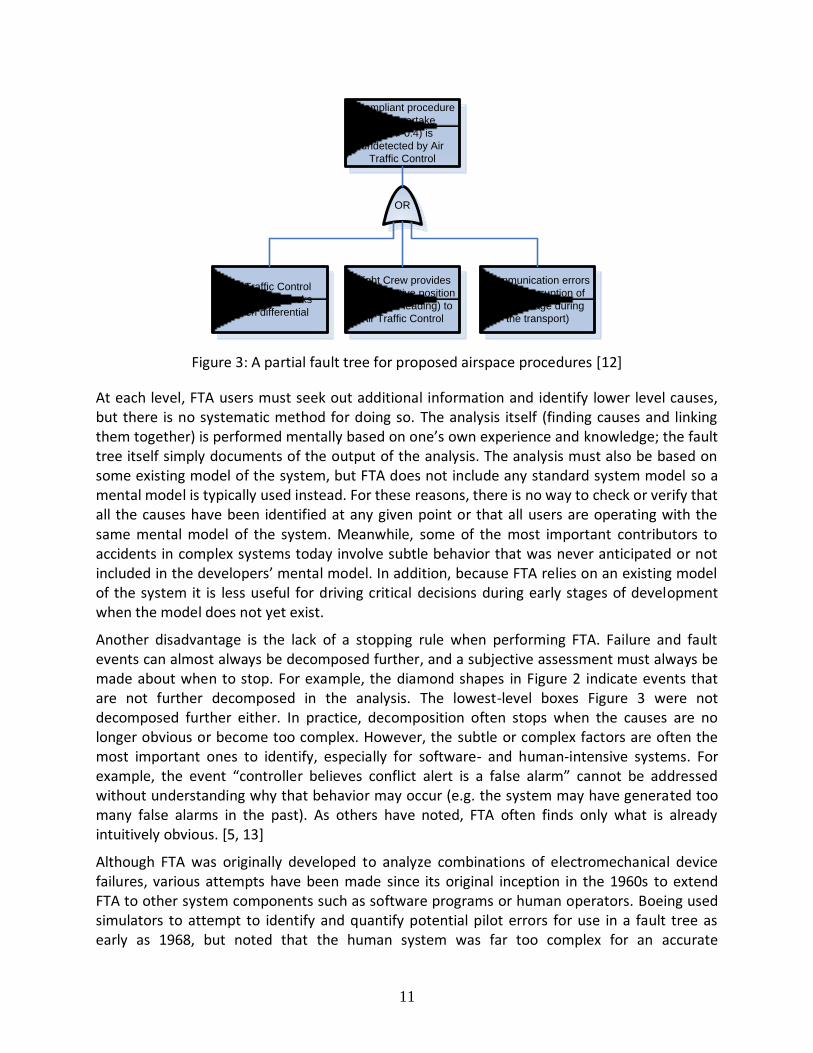
FTA is a powerful top-town method of analyzing combinations of failures that can cause an undesirable event. However, there are a number of limitations associated with this technique. Because FTA begins with an undesirable event, some other method must be used to identify the undesirable events that need to be analyzed. Another issue is identifying the lower-level events. Although some limited guidance is provided in terms of when certain operators can be used and how faults can be combined, much less guidance is provided for identifying the faults and failures in the first place. As a result, many completed fault trees are later found to omit important events. For example, the fault tree from an actual system in Figure 2 omits the possibility that a conflict alert is displayed but the controller does not observe it. Similarly, the fault tree in Figure 3 omits the possibility that Air Traffic Control does not check the Mach differential.
10
Controller does not
perceive the conflict [in
flight paths]
Controller does not
issue any instruction
[to avoid the collision]
OR
Controller
perceives the
conflict, but cannot
devise a resolution
maneuver
Controller perceives the
conflict and may be able
to devise a resolution
maneuver but does not
have the timeAND
No conflict alert is
displayed Controller
believes
conflict alert is
a false alarm
OR
Conflict alert does not
cause controller to
perceive conflictController does
not perceive the
conflict from his
flight information
OR
Computer
systems
fail
Encounter is
beyond conflict
alert capabilitiesThreat is non-
transponder
aircraft
Figure 2: A partial fault tree for an aircraft collision avoidance system [11]
11
Incompliant procedure
(with overtake
Mach>0.4) is
undetected by Air
Traffic Control
OR
Air Traffic Control
incorrectly checks
Mach differential
Flight Crew provides
wrong relative position
(behind or leading) to
Air Traffic Control
Communication errors
(partial corruption of
the message during
the transport)
Figure 3: A partial fault tree for proposed airspace procedures [12]
At each level, FTA users must seek out additional information and identify lower level causes, but there is no systematic method for doing so. The analysis itself (finding causes and linking them together) is performed mentally based on one’s own experience and knowledge; the fault tree itself simply documents of the output of the analysis. The analysis must also be based on some existing model of the system, but FTA does not include any standard system model so a mental model is typically used instead. For these reasons, there is no way to check or verify that all the causes have been identified at any given point or that all users are operating with the same mental model of the system. Meanwhile, some of the most important contributors to accidents in complex systems today involve subtle behavior that was never anticipated or not included in the developers’ mental model. In addition, because FTA relies on an existing model of the system it is less useful for driving critical decisions during early stages of development when the model does not yet exist.
Another disadvantage is the lack of a stopping rule when performing FTA. Failure and fault events can almost always be decomposed further, and a subjective assessment must always be made about when to stop. For example, the diamond shapes in Figure 2 indicate events that are not further decomposed in the analysis. The lowest-level boxes Figure 3 were not decomposed further either. In practice, decomposition often stops when the causes are no longer obvious or become too complex. However, the subtle or complex factors are often the most important ones to identify, especially for software- and human-intensive systems. For example, the event “controller believes conflict alert is a false alarm” cannot be addressed without understanding why that behavior may occur (e.g. the system may have generated too many false alarms in the past). As others have noted, FTA often finds only what is already intuitively obvious. [5, 13]
Although FTA was originally developed to analyze combinations of electromechanical device failures, various attempts have been made since its original inception in the 1960s to extend FTA to other system components such as software programs or human operators. Boeing used simulators to attempt to identify and quantify potential pilot errors for use in a fault tree as early as 1968, but noted that the human system was far too complex for an accurate
12
assessment and that developing numerical values was slow and painful process [14]. A number of improvements have been made since then, but the same limitations are still being observed:
Operators do not get simulator sickness as do pilots, they do not have to make billion dollar tradeoffs which they might in an actual severe accident, and the simulators themselves can only simulate ‘standard, textbook scenarios.’ .... ‘Hot cognition’, decision making under fire and uncertainty, is just not elicited in a simulator. [15]
The most serious problem … continues to be the same problem that was recognized in the early 1960s among HRA practitioners—the scarcity of data on human performance that are useful for quantitative predictions of human behavior in complex systems. … Except for use of highly fallible expert judgment, the training simulator is the only practical method for collecting data on human errors that have very low probabilities of occurrence (1E-4 or smaller) or which are associated with operating conditions that would occur with a very low frequency. Yet the simulator is not the real world. How can raw data from training simulators be modified to reflect real-world performance? This is not a small problem. [16]
Expert judgments have also been utilized as a way to identify and quantify operator errors in a fault tree [12, 17]. In practice, this approach is typically used when there is little or no objective data available for the quantity of interest; critics argue that it is therefore not possible to validate (or falsify) the expert estimates that are used [18]. Expert estimates are also subject to a number of cognitive biases: estimates are almost always overconfident, usually over- or under-estimate the quantity of interest, and vary significantly between experts. [19, 20] Although numerous methods have been proposed to reduce systematic biases, critics argue that these approaches only improve inter-judge reliability and do not necessarily validate the estimates themselves. [18, 19]
Because FTA focuses on decomposition into failure events, it is difficult to analyze complex computer software systems. Software is fundamentally different from hardware—when software exhibits unsafe behavior, it is not due to “wear and tear” on the software. Software is unsafe when it correctly follows flawed programming that existed from the beginning. In practice, software errors are often ignored completely in the fault tree [5, 21], or included in a box labeled “software failure” that is not decomposed further as in Figure 2.
2.2 Event Tree Analysis
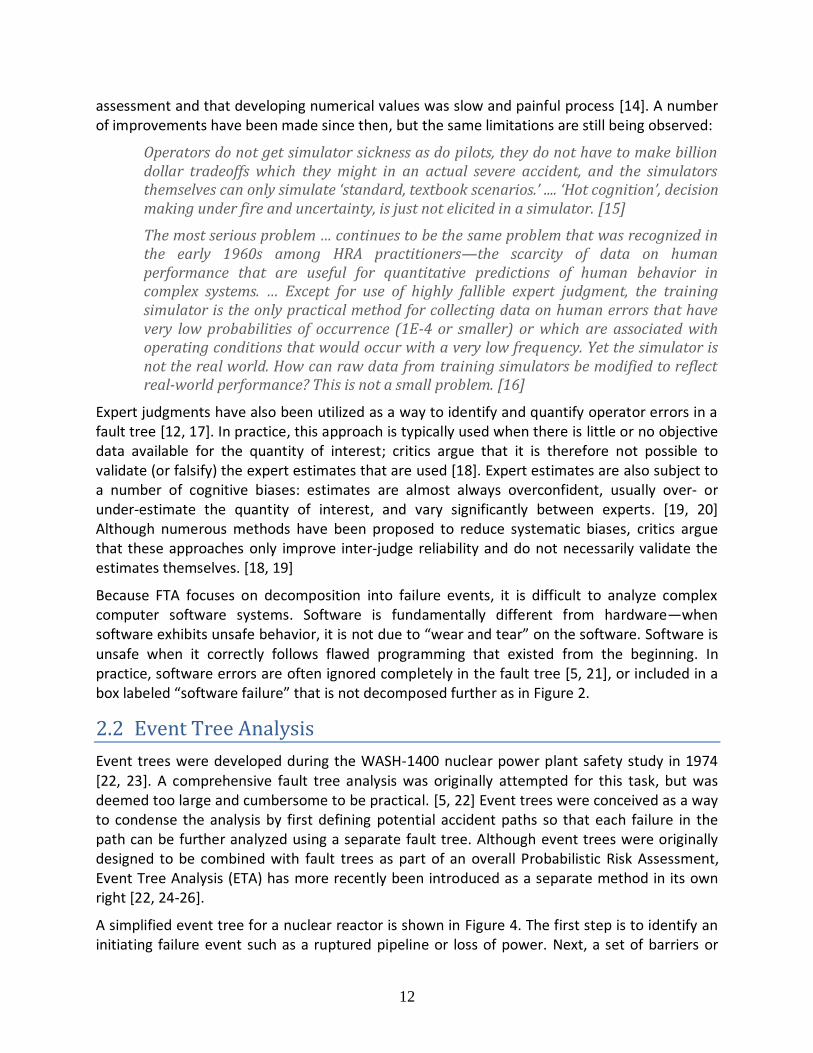
Event trees were developed during the WASH-1400 nuclear power plant safety study in 1974 [22, 23]. A comprehensive fault tree analysis was originally attempted for this task, but was deemed too large and cumbersome to be practical. [5, 22] Event trees were conceived as a way to condense the analysis by first defining potential accident paths so that each failure in the path can be further analyzed using a separate fault tree. Although event trees were originally designed to be combined with fault trees as part of an overall Probabilistic Risk Assessment, Event Tree Analysis (ETA) has more recently been introduced as a separate method in its own right [22, 24-26].
A simplified event tree for a nuclear reactor is shown in Figure 4. The first step is to identify an initiating failure event such as a ruptured pipeline or loss of power. Next, a set of barriers or
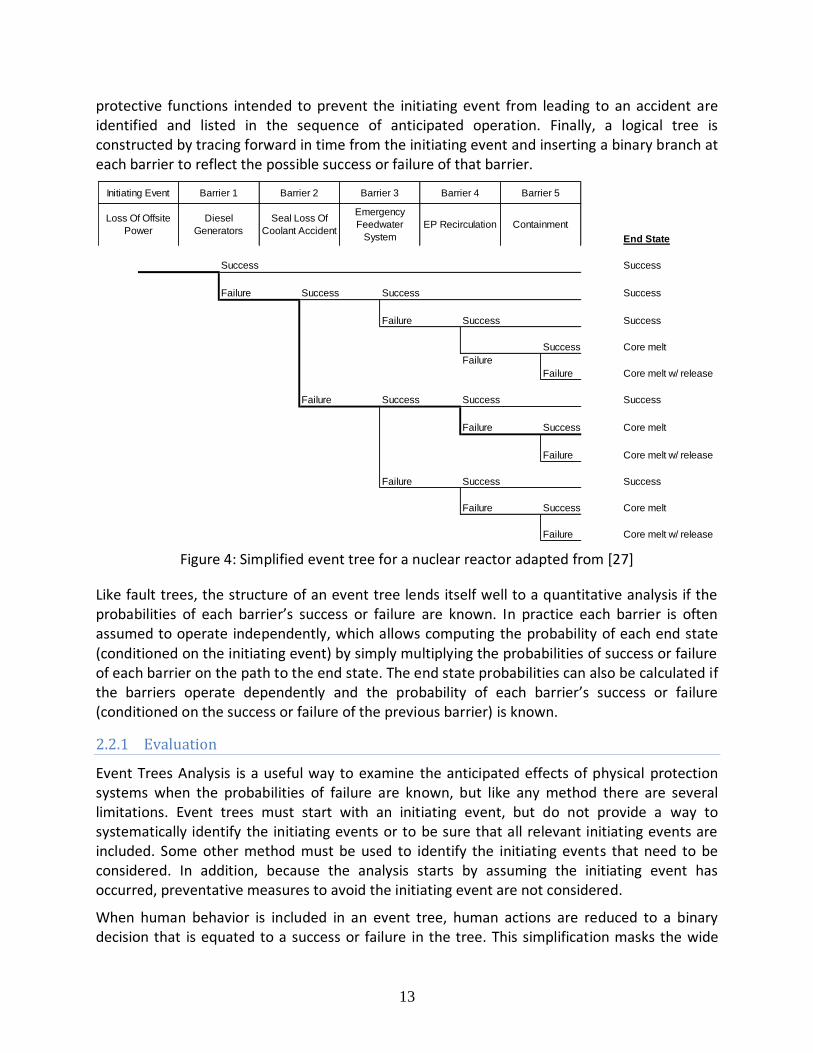
13
protective functions intended to prevent the initiating event from leading to an accident are identified and listed in the sequence of anticipated operation. Finally, a logical tree is constructed by tracing forward in time from the initiating event and inserting a binary branch at each barrier to reflect the possible success or failure of that barrier.
Figure 4: Simplified event tree for a nuclear reactor adapted from [27]
Like fault trees, the structure of an event tree lends itself well to a quantitative analysis if the probabilities of each barrier’s success or failure are known. In practice each barrier is often assumed to operate independently, which allows computing the probability of each end state (conditioned on the initiating event) by simply multiplying the probabilities of success or failure of each barrier on the path to the end state. The end state probabilities can also be calculated if the barriers operate dependently and the probability of each barrier’s success or failure (conditioned on the success or failure of the previous barrier) is known.
2.2.1 Evaluation
Event Trees Analysis is a useful way to examine the anticipated effects of physical protection systems when the probabilities of failure are known, but like any method there are several limitations. Event trees must start with an initiating event, but do not provide a way to systematically identify the initiating events or to be sure that all relevant initiating events are included. Some other method must be used to identify the initiating events that need to be considered. In addition, because the analysis starts by assuming the initiating event has occurred, preventative measures to avoid the initiating event are not considered.
When human behavior is included in an event tree, human actions are reduced to a binary decision that is equated to a success or failure in the tree. This simplification masks the wide
End State
Success Success
Failure Success Success Success
Failure Success Success
Success Core melt
Failure
Failure Core melt w/ release
Failure Success Success Success
Failure Success Core melt
Failure Core melt w/ release
Failure Success Success
Failure Success Core melt
Failure Core melt w/ release
Barrier 5
Loss Of Offsite
Power
Diesel
Generators
Seal Loss Of
Coolant Accident
Emergency
Feedwater
System
EP Recirculation Containment
Initiating Event Barrier 1 Barrier 2 Barrier 3 Barrier 4
14
range of behaviors possible at any given moment and removes critical context that explains why a person would choose a given action. Human behavior is intimately connected to and influenced by the context in which it occurs: the information available, goals, past experiences, beliefs about the current system state, interpretation of various observations, etc. By removing the context, preventative measures to ensure safe behavior are easily overlooked.
Although the barriers in an event tree are often assumed to operate independently of each other, in practice they may not be truly independent. For example, in the recent Fukushima accident the loss of offsite power and the loss of the diesel generators were not independent events; they were both caused by the same factors. In general, the behavior of multiple barriers can be heavily dependent on the same set of factors, especially if human behavior is involved. For example, in the infamous Three Mile Island (TMI) incident the operators were unaware of steam forming in the core and they manually disabled the primary loop pumps and the emergency core cooling pumps. Clearly, the failure of these barriers to operate was not independent.
Design errors and requirements flaws are critical factors that cannot be analyzed with an event tree. In the example above, an important reason TMI operators did not initially believe coolant was being lost is that an indicator lamp erroneously suggested that a relief valve was closed and a water level indicator erroneously suggested the water level was sufficient. Both of these instruments satisfied their individual requirements and in fact operated exactly as designed, but the design and requirements were flawed. A stuck relief valve caused a mismatch between the indicator lamp and the actual state of the valve, and trapped steam in the reactor core caused a mismatch between the measured water level and the actual level in the core. Design and requirements issues such as these are not addressed in an event tree.
Higher-level systemic causes such as organizational and managerial issues are also omitted from an event tree. For example, poor management, ineffective communication, misplaced regulatory priorities, and complacent attitudes were important contributors at TMI [28] and simultaneously affected the efficacy of multiple barriers, but these aspects are all omitted in an event tree. Event trees also omit non-linear or feedback relationships that can contribute an accident, such as two or more processes that mutually affect each other. For example, the operators at TMI initially believed that coolant was not being lost because their interactions with the system reinforced this belief. Processes operating at a much higher level are also important; for example, low accident rates can give rise to complacency and increased pressures to reduce budget and oversight, which in turn leads to higher accident rates. [29] All of these aspects are overlooked in an event tree.
Note that many of these omitted factors are also missing in FTA; combining event trees and fault trees may improve some aspects of the analysis but it does not address these factors that are missing from both techniques. This is discussed in more detail in section 2.4.
2.3 FMEA and FMECA
Failure Modes and Effect Analysis (FMEA) and it’s cousin Failure Modes Effects and Criticality Analysis (FMECA) were developed by reliability engineers to systemically evaluate the effect of component failures on system performance [24]. These approaches were first introduced as a
15
procedure for weapons systems in 1949 [30], and in 1955 a similar procedure was introduced by the U.S. Navy Bureau of Aeronautics [31]. In the 1960s these methods were refined and adopted by the aerospace industry and used on a number of NASA programs including Apollo. [32] By the 1970s they were being used in civil aviation, the automotive industry, and even offshore petroleum exploration. [32-35] Today FMEA and FMECA are used across a broad array of fields including food, drug, and cosmetic industries [36].
Due to its popularity, FMEA has been implemented in a number of different ways but generally follows the same bottom-up approach. First, the various components in the system are identified. Next, the failure modes—defined as mechanisms by which a component may fail to achieve its designed function—are identified [37, 38]. For each failure mode, the potential causes and effects on the system are investigated. FMECA follows the same basic process, but in addition assigns a criticality to each failure mode by examining the severity and probability of each identified effect. Table 1 below shows an example FMECA worksheet that summarizes the analysis.
Table 1: Example FMECA worksheet adapted from [39]
Component Failure Mode Cause Effect Severity
Probability of Occurrence Criticality
Water Tank Leak Corrosion Lost water Catastrophic Very Low High
Valve
Stuck closed
Dirt, corrosion
No water Catastrophic Low Very High
Stuck open Corrosion, power
False trip Marginal Moderate Low
Note that the same process can be applied to either physical or functional models of the system, although in practice there can be a significant overlap between the two. For example, if applied to a physical model then the analysis of failure modes, effects, and severity are still identified with respect to the designed function of each component, and if applied to a functional model then the causes and failures may still be based on the physical implementation of the components. [37, 38, 40]
2.3.1 Evaluation
FMEA and FMECA are useful methods for analyzing the reliability of physical system components and prioritizing them with respect to reliability goals. However, there are a number of limitations especially when applied to other systems or other goals. Because these methods start by identifying low-level failures to analyze further, the resulting scenarios that are analyzed include both hazardous and non-hazardous scenarios triggered by a failure. Both types of scenarios are analyzed in the same level of detail. If the goal is safety-related, then the effort spent analyzing non-hazardous failures may consume important resources while not adding significant value to the analysis.
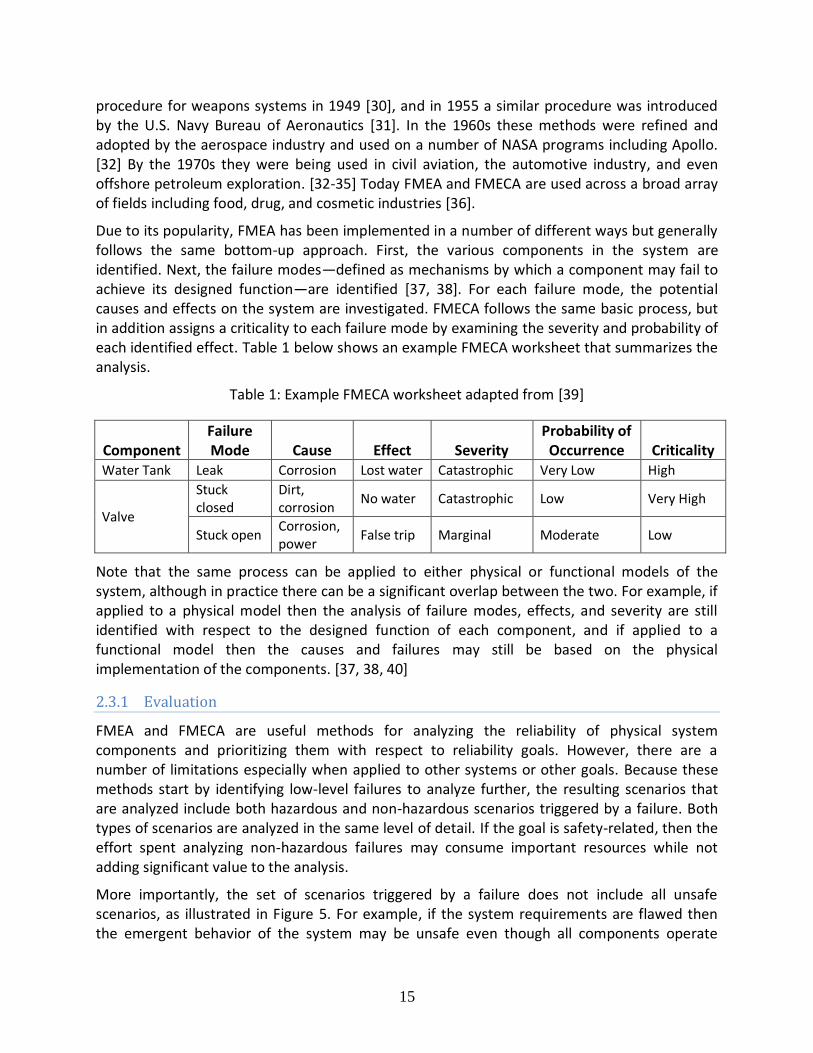
More importantly, the set of scenarios triggered by a failure does not include all unsafe scenarios, as illustrated in Figure 5. For example, if the system requirements are flawed then the emergent behavior of the system may be unsafe even though all components operate
16
exactly as designed and required. Filtering out all scenarios that do not begin with a failure effectively excludes these types of hazardous scenarios.
Figure 5: A Venn diagram of failure scenarios and unsafe scenarios
Like other methods, FMECA assumes a linear progression of events and does not capture non-linear and feedback relationships. However, unlike other methods, FMECA only considers scenarios initiated by a single failure and omits scenarios that result only from a combination of several failures. By focusing on single failures, only a subset of scenarios triggered by a failure (the left circle in Figure 5) are analyzed.
2.4 General evaluation of failure-based methods
One of the most important limitations of failure-based methods is that by definition they omit entire classes of factors that lead to accidents. In general, failure-based methods were designed to model the propagation of component failures in a system that cause an undesired event. However, many causes of accidents do not involve any component failure. With today’s systems becoming increasingly complex, more and more accidents are occurring not due to component failures but instead due to critical design errors or requirements flaws. In addition, socio-technical systems tend to exhibit dynamic non-linear behavior that is difficult or impossible to capture with a technique designed for a linear propagation of faults. Continuously adaptive behavior, goal-seeking behavior, local optimization with global deterioration, goal erosion, mutually reinforcing relationships causing exponential growth or collapse, and budgetary/financial pressures are just a few factors that can have a critical impact on the safety of a system. However these are dynamic processes, not independent failure events, and are not explained with a one-way linear fault propagation structure.
Similarly, human error in a failure-based method is treated in exactly the same way as a hardware failure—as a deviation from a specified behavior or procedure. However, like

17
software, the number of potential ways a human can deviate is virtually infinite. Even if all noncompliant behaviors could be listed, it is not sufficient to just identify them; in order to prevent a behavior it is necessary to understand why a person might behave that way. In other words, it requires first understanding the conditions under which unsafe decisions might make sense to a person at the time and then modifying or adding requirements to make the correct decisions obvious. Unfortunately, framing human error as a failure requires oversimplifying human behavior as a binary decision between right and wrong, which only obscures the underlying reason for the error. Many important human-related causal factors can be overlooked because they are difficult or impossible to model in a fault tree, including:
Correct human behavior was not defined for certain situations
Specified human behavior is known but thought to be incorrect
Procedures conflict with each other, or it is not obvious which procedure applies
Information necessary to carry out a procedure is not available or is incorrect
The person has multiple responsibilities or goals that may conflict
Past experiences and current knowledge conflict with a procedure
Procedures are not clear or misunderstood
Procedures are known but responsibility for the procedures is unclear or misunderstood
Procedures are known and followed, but they are unsafe
Consider an example1: In the 2010 Deepwater Horizon oil spill, a critical factor was that workers reported a successful negative pressure test when in reality oil had already begun seeping into the well. [41, 42] The workers did not know that earlier tests had clogged a pipe that rendered a key instrument reading invalid. Note that in this case the behavior was compliant—the workers followed the required procedures but the procedures were unsafe. The behavior was not a “failure event” because nothing failed – the flaw existed from the beginning in the form of inadequate procedures and feedback for the crew. A failure-based method could help focus engineering efforts on preventing the pipe from getting clogged or perhaps preventing workers from deviating from procedures, but would not help address the flawed requirements and inadequate feedback loops that existed. For example, a potential solution that adds equipment to detects a clogged pipe and adjusting worker procedures to utilize this information would be masked by a failure-based method that focuses only on preventing clogs and enforcing worker compliance with existing procedures.
Most failure-based methods were originally designed and developed to handle simple electromechanical components. Numerous attempts have been made to extend these methods to other components like software, but software is fundamentally different in the sense that it does not fail like hardware does. Unlike hardware, software always behaves exactly the way it was programmed (and therein lies the problem). If software exhibits unsafe behavior, it is because that unsafe behavior was programmed from the beginning—not because the software “wore out” or “broke” over time. Because of this fundamentally different problem and the
1 This example is necessarily an oversimplification of the complex events that unfolded on the Deepwater Horizon, but it is nevertheless a useful illustration for the point being made.
18
virtually infinite number of ways software can be programmed incorrectly, it is very difficult to capture software-related causes in a failure-based method. In practice, software errors are often ignored completely [5, 21], or included under a label of “software failure” that is not decomposed further. However simply stating that the software could cause an undesirable event offers little assistance to the system and software developers who need to make the software safe.
Failure-based methods are often be applied quantitatively to consider the probability of certain failures and outcomes. Assuming independence between different failure events is very common and can significantly simplify the analysis, but this assumption is often made incorrectly. For example, the primary and backup O-rings on the Challenger shuttle were originally believed to be independent and redundant2. [43] Unfortunately, they weren’t truly independent because low temperature and mechanical pressures affected both O-rings and contributed to their simultaneous failure in the famous 1986 accident. While assuming independence between failure events may simplify the probabilistic calculations, doing so has often resulted in overconfident probabilities for hazardous events.
Accurately quantifying probabilities for software errors is difficult or impossible. Even if all potential software errors could be listed for a simple system, predicting their probability of occurrence is not feasible. An error is either known to exist or not known to exist. If an error is ever known, it’s far more effective to simply fix it than to add events to a fault-based model or guess a probability of occurrence.
Although software errors are important, the majority of software-related accidents can be traced to flawed requirements rather than a problem with the software implementation itself [44, 45]. Clearly in any system—whether dealing with software, hardware, or even human components—safety is dependent on having correct and safe requirements. However, there is no empirical data for quantifying the probability that a requirement is flawed. Like software instructions, if a requirement is ever known to be flawed it is far more effective to fix it than to guess the probability that it is wrong.
Requirements provided in the form of procedures for human operators are also critical for ensuring safety. For example, inadequate procedures played an important role in the Three Mile Island partial nuclear meltdown in 1979. Many operating and emergency procedures contained substantive errors, typographical errors, imprecise or sloppy terminology, and violated the nuclear reactor’s specifications [5]. Again, there is typically no data to support a probabilistic estimate of a flawed procedure before an accident. Even if such an estimate had been produced for Three Mile Island before 1979, it most likely would have been incorrect; before the accident the procedures were thought to be safe. Only afterward in hindsight were the flaws discovered.
2 The SRB O-ring joint criticality status was originally classified as C 1R (redundant). When Marshall proposed changing the status to C 1 (non-redundant), Thiokol engineers disagreed with the change and argued that it should remain C 1R. Although status was eventually officially changed to C 1, this issue remained an important factor in the resulting accident. 43. Vaughan, D., The Challenger launch decision : risky technology, culture, and deviance at NASA. 1996, Chicago: University of Chicago Press. xv, 575 p.
19
It’s easy to see the lack of a probabilistic estimate for these problems and focus on creating methods to produce such estimates. However, it’s important to recognize that the problem is much larger than just the lack of a quantitative probability. Suppose such an estimate did exist for requirements. What would the number mean? Any value other than 0% or 100% just indicates a lack of knowledge—i.e. it is not known whether a given requirement is flawed or safe, and the engineering task is therefore incomplete. The core issue is therefore not a difficulty quantifying existing knowledge; the core issue is obtaining the right knowledge in the first place. Addressing these problems will require better methods for finding flaws and creating safe requirements, not methods that estimate what is already known.
When human behavior is included in a quantitative fault tree, the quantitative analysis typically assumes that the behavior is random with a given probability. However, human behavior is not random—it is heavily influenced by the context in which is appears. For example, in the 2005 Texas City explosion a critical factor is that operators did not follow standard operating procedures to release hydrocarbons via the 3-pound venting system. Instead, they bypassed the venting system and released hydrocarbons through a blowdown stack into open air. In the absence of any knowledge about the system it might appear that these operators “flipped a coin” to decide whether to follow the procedure, but this is far from true. The decision was a direct result of influence from supervisory personnel who advocated the bypass because it significantly shortened the startup time and had been used successfully many times in the past [46, 47]. With this additional knowledge, the operators’ behavior does not appear random at all—it was both predictable and preventable given the context in which it occurred. While quantitative failure-based methods tend to isolate the context by emphasizing human actions as random events, a better understanding of the context can often lead to a more accurate perception and more effective solutions.
Although human error is often only used to refer to behavior during the operation of a system, it also applies to the development of a system. For example, software errors and flawed requirements are really just forms of human error. In fact, even hardware failures can be traced back to human decisions regarding the design and construction of the component, the selection of the component for a specific purpose in an assumed operating environment, the design of the system that interfaces with the component, and the inclusion of any protective measures that detect and handle (or don’t) the potential failure of the component. Therefore it is not surprising that the same issues that plague software errors and flawed requirements appear again for human behavior in general.
3 The STAMP Accident Model
STAMP is a model of accident causation that treats safety as a control problem, rather than as a failure problem [48]. While unsafe control includes inadequate handling of failures, it also includes system and software design errors and erroneous human decision making. In STAMP, accidents are viewed as the result of inadequate enforcement of constraints on system behavior. The reason behind the inadequate enforcement may involve classic component
20
failures, but it can also result from unsafe interactions among components operating as designed or from erroneous control actions by software or humans.
STAMP is based on the observation that there are four types of hazardous control actions that need to be eliminated or controlled to prevent accidents:
1. A control action required for safety is not provided or is not followed
2. An unsafe control action is provided that leads to a hazard
3. A potentially safe control action is provided too late, too early, or out of sequence
4. A safe control action is stopped too soon or applied too long
One potential cause of a hazardous control action in STAMP is an inadequate process model used by human or automated controllers. The process model contains the controller’s understanding of 1) the current state of the controlled process, 2) the desired state of the controlled process, and 3) the ways the process can change state. This model is used by the controller to determine what control actions are needed. In software, this process model is usually implemented in variables and embedded in the program algorithms. For humans, the process model is often called the “mental model”. Software and human errors frequently result from incorrect process models, e.g., the software thinks the spacecraft has landed and shuts off the descent engines. [49] Accidents can therefore occur when an incorrect or incomplete process model causes a controller to provide control actions that are hazardous. While process model flaws are not the only cause of accidents in STAMP, it is a major contributor.
4 STPA Hazard Analysis
STPA (System Theoretic Process Analysis) is a hazard analysis technique built on STAMP. The first step in STPA is to identify the potentially unsafe control actions for the specific system being considered. These unsafe control actions are used to create safety requirements and constraints on the behavior of both the system and its components. Additional analysis can then be performed to identify the detailed scenarios leading to the violation of the safety constraints. As in any hazard analysis, these scenarios are then used to control or mitigate the hazards in the system design.
Before beginning an STPA hazard analysis, potential accidents and related system-level hazards are identified along with the corresponding system safety constraints that must be controlled. As an illustrative example, consider a simple automated door control system for a train. The accidents to be considered are: injury to a person by falling out of the train, being hit by a closing door, or being trapped inside a train during an emergency. The system-level hazards relevant to this definition of an accident include:
H-1: Doors close on a person in the doorway
H-2: Doors open when the train is not in a station or is not aligned with a station platform
H-3: Passengers/staff are unable to exit during an emergency.

21
Figure 6: Preliminary control diagram for an automated door controller
STPA is performed on a functional control diagram of the system, which is shown in Figure 6 for the train door controller. The first part of STPA identifies hazardous control actions for each component that could produce a system-level hazard by violating the system safety constraints. Once the set of hazardous control actions has been identified, the second part of STPA analyzes the system to determine the potential scenarios that could lead to providing a hazardous control action. These scenarios can be used to design controls for the hazards or, if the design already exists, to ensure that these scenarios are adequately controlled.
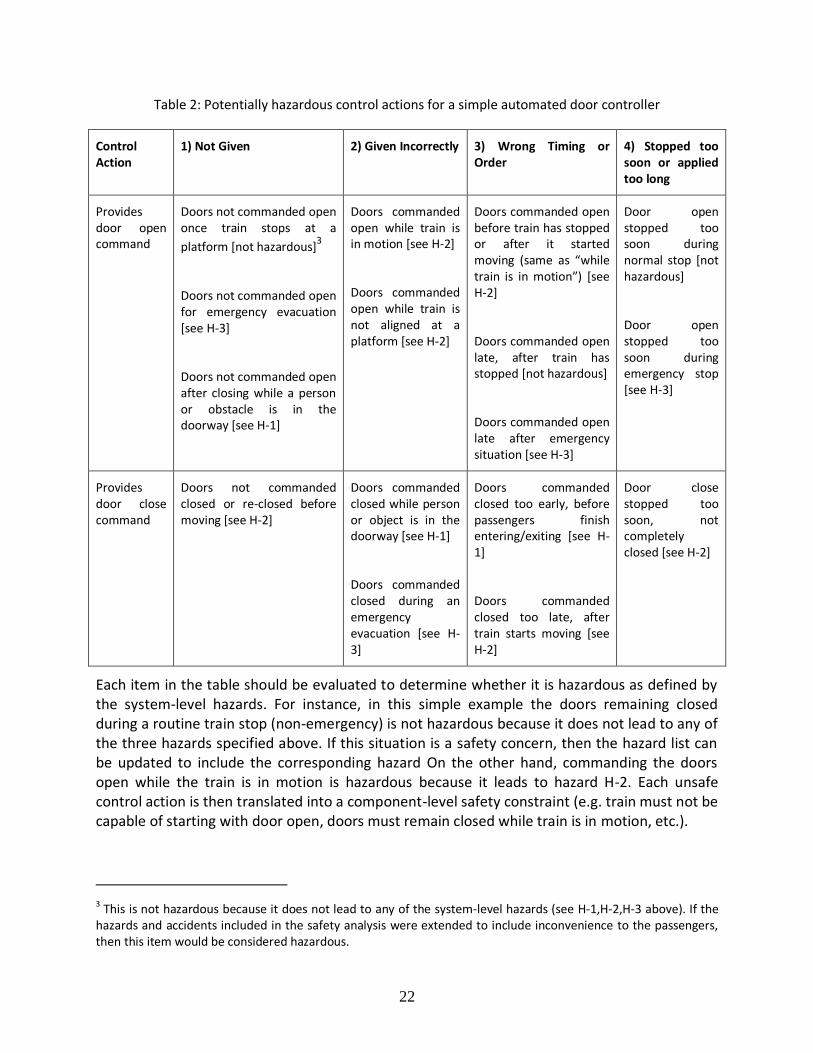
STPA Step One: The first step of STPA identifies control actions for each component that can lead to one or more of the defined system hazards. The four general types of unsafe control actions were shown above. Hazardous control actions can be documented using a table as in Table 1. The hazardous control actions can then be translated into system and component safety requirements and constraints.
22
Table 2: Potentially hazardous control actions for a simple automated door controller
Control Action
1) Not Given 2) Given Incorrectly 3) Wrong Timing or Order
4) Stopped too soon or applied too long
Provides door open command
Doors not commanded open once train stops at a
platform [not hazardous]3
Doors not commanded open for emergency evacuation [see H-3]
Doors not commanded open after closing while a person or obstacle is in the doorway [see H-1]
Doors commanded open while train is in motion [see H-2]
Doors commanded open while train is not aligned at a platform [see H-2]
Doors commanded open before train has stopped or after it started moving (same as “while train is in motion”) *see H-2]
Doors commanded open late, after train has stopped [not hazardous]
Doors commanded open late after emergency situation [see H-3]
Door open stopped too soon during normal stop [not hazardous]
Door open stopped too soon during emergency stop [see H-3]
Provides door close command
Doors not commanded closed or re-closed before moving [see H-2]
Doors commanded closed while person or object is in the doorway [see H-1]
Doors commanded closed during an emergency evacuation [see H-3]
Doors commanded closed too early, before passengers finish entering/exiting [see H-1]
Doors commanded closed too late, after train starts moving [see H-2]
Door close stopped too soon, not completely closed [see H-2]
Each item in the table should be evaluated to determine whether it is hazardous as defined by the system-level hazards. For instance, in this simple example the doors remaining closed during a routine train stop (non-emergency) is not hazardous because it does not lead to any of the three hazards specified above. If this situation is a safety concern, then the hazard list can be updated to include the corresponding hazard On the other hand, commanding the doors open while the train is in motion is hazardous because it leads to hazard H-2. Each unsafe control action is then translated into a component-level safety constraint (e.g. train must not be capable of starting with door open, doors must remain closed while train is in motion, etc.).
3 This is not hazardous because it does not lead to any of the system-level hazards (see H-1,H-2,H-3 above). If the hazards and accidents included in the safety analysis were extended to include inconvenience to the passengers, then this item would be considered hazardous.
23
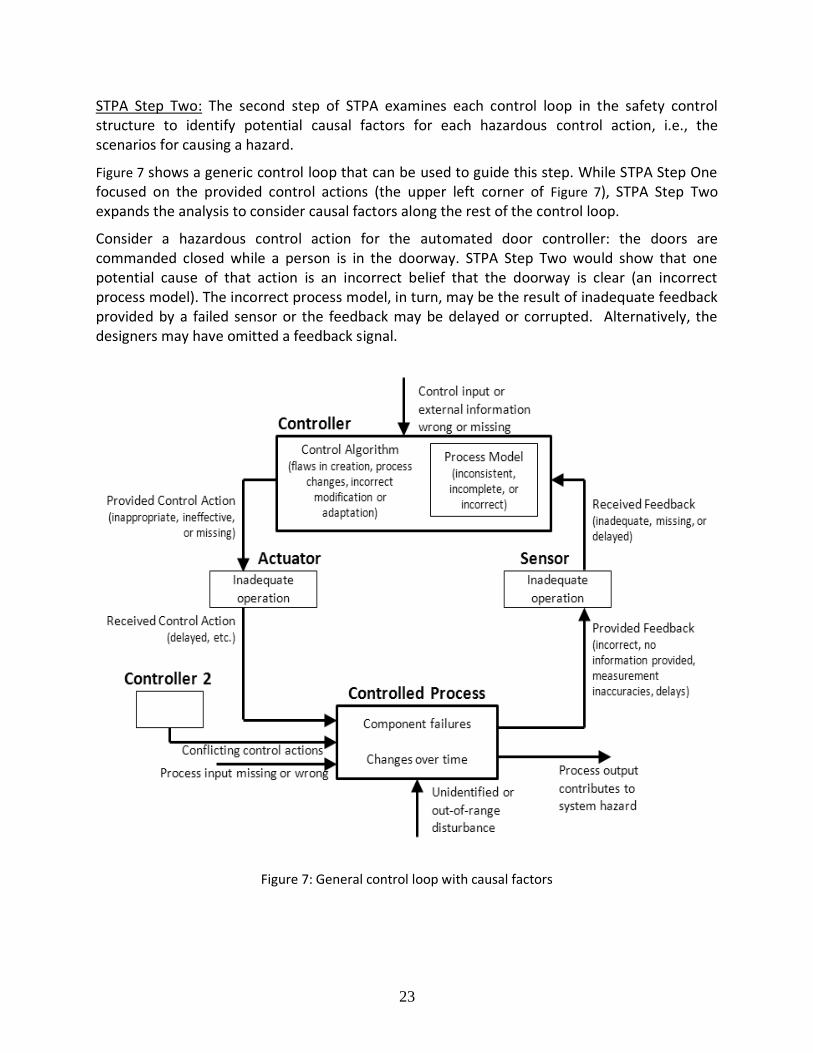
STPA Step Two: The second step of STPA examines each control loop in the safety control structure to identify potential causal factors for each hazardous control action, i.e., the scenarios for causing a hazard.
Figure 7 shows a generic control loop that can be used to guide this step. While STPA Step One focused on the provided control actions (the upper left corner of Figure 7), STPA Step Two expands the analysis to consider causal factors along the rest of the control loop.
Consider a hazardous control action for the automated door controller: the doors are commanded closed while a person is in the doorway. STPA Step Two would show that one potential cause of that action is an incorrect belief that the doorway is clear (an incorrect process model). The incorrect process model, in turn, may be the result of inadequate feedback provided by a failed sensor or the feedback may be delayed or corrupted. Alternatively, the designers may have omitted a feedback signal.
Figure 7: General control loop with causal factors
24
Once the second step of STPA has been applied to determine potential causes for each hazardous control action identified in STPA Step One, the causes should be eliminated or controlled in the design.
5 Formal Specification for Hazardous Control Actions
In this section, a formal specification is introduced and defined for hazardous control actions in STAMP. This specification forms the basis for procedures that identify hazardous control actions during STPA Step One. The specification is also used in later sections to develop of automated algorithms that assist in identifying the actions and to generate requirements that enforce safe behavior. In addition, although the formal structure is defined here relative to system-level hazards, an identical structure can be applied relative to system-level functions or goals. These parallel structures form the basis for methods in section 8 that can be used generate both safety and functional model-based requirements as well as detecting potential conflicts between the two.
A hazardous control action in the STAMP accident model can be expressed formally as a four-tuple (S,T,CA,C) where:
S is a controller in the system that can issue control actions. The controller may be automated or a human.
T is the type of control action. There are two possible types: Provided describes a control action that is issued by the controller while Not Provided describes a control action that is not issued.
CA is the control action or command that is output by the controller.
C is the context in which the control action is or is not provided.
For example, in the case of an automated train door controller, consider the following hazardous control action: The train door controller provides the open door command while the train is moving. This control command can be expressed as (S,T,CA,C) where:
S = Train door controller
T = Provided
CA = Open door command
C = Train is moving
Each element of a hazardous control action is a member of a larger set, i.e. the following properties must hold:
1. S ∈ Ş, where Ş is the set of controllers in the system 2. T ∈ , where = {Provided, Not Provided} 3. CA ∈ (S), where (S) is the set of control actions that can be provided by
controller S 4. C ∈ (S), where (S) is the set of potential contexts for controller S
25
To assist in enumerating or aggregating individual contexts, it is helpful to further decompose the context C into variables, values, and conditions:
V is a variable or attribute in the system or environment that may take on two or more values. For example, train motion and train position are two potential variables for a train.
VL is a value that can be assumed by a variable. For example, stopped is a value that can be assumed by the variable train motion.
CO is a condition expressed as a single variable/value pair. For example, train motion is stopped is a condition.
The context C is the combination of one or more conditions and defines a unique state of the system or environment in which a control action may be given.
The following additional properties related to the context of a hazardous control action can therefore be defined:
5. V ∈ (S), where (S) is the set of variables referenced in the system hazards 6. VL ∈ (V), where (V) is the set of values that can be assumed by variable V 7. CO = (V, VL) ∈ (S), where (S) is the set of conditions for controller S 8. C = (CO1, CO2, ...), where each COi is independent. That is, no two COi refer to the
same variable V.
Finally, each hazardous control action must be linked to a system-level hazard:
9. To qualify as a hazardous control action, the event (S, T, CA, C) must cause a hazard H ∈ , where is the set of system level hazards.
A hazardous control action expressed as a four-tuple (S, T, CA, C) must satisfy the above properties 1-9.
6 A Procedure to Identify Hazardous Control Actions
This section introduces a procedure for rigorously and systematically identifying the hazardous control actions during the first step of STPA. [50]. The approach is based on the idea that many control actions are only hazardous in certain contexts. For example, a command to open the doors of a train is not hazardous by itself—it depends on the system state or state of the environment in which the command is given. For example, the command to open train doors is hazardous when the train is moving, or when the train is stopped but misaligned with the platform. The new procedure involves identifying potential control actions, identifying potentially hazardous states, and then analyzing which combinations together yield a hazardous control action.
Three parts of the procedure are described in the following sections, and each part can be performed independently of the others. The first part deals with control actions that are provided under conditions that make the action hazardous. The second part deals with control actions that are not provided under conditions that make inaction hazardous.
26
6.1 Part 1: Control actions provided in a state where the action is hazardous
In this procedure, a controller and the associated control actions are selected from the control structure. In the train example above, the automated door controller can provide four control actions: open doors, stop opening doors, close doors, or stop closing doors. Next, the controller’s process model is defined to determine the environmental and system states that affect the safety of the control actions.
Controllers use the values of the process model to determine what control actions to provide. In order to make safe decisions, the control algorithm must use process model variable values (i.e., system state or environmental values that are known to the controller). If the controller does not know the values of system state and environmental values that are related to hazards, then the controller cannot be designed to provide safe control actions. Figure 8 shows the required process model for the door controller to carry out its control safely. The required variables in the process model are identified by the definition of the system hazards. For example, hazard H-1 identifies the state of the doorway (whether it is clear or not) as an important environmental variable in deciding whether to close the doors or not.
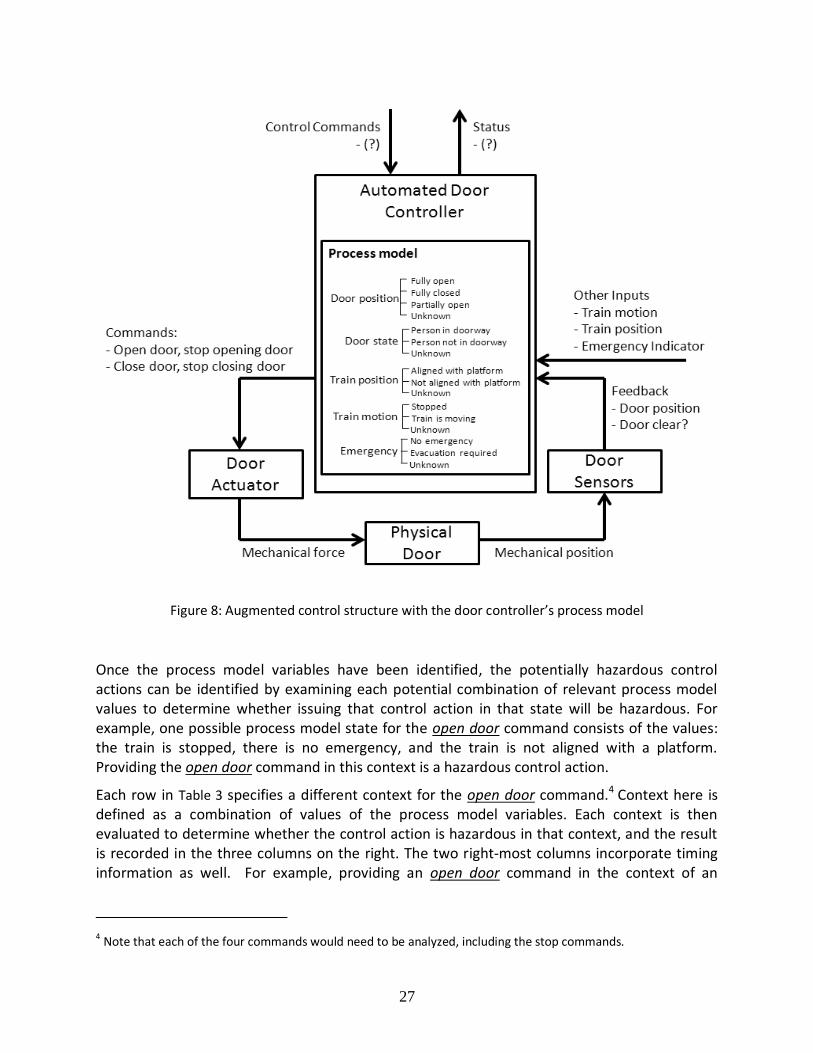
27
Figure 8: Augmented control structure with the door controller’s process model
Once the process model variables have been identified, the potentially hazardous control actions can be identified by examining each potential combination of relevant process model values to determine whether issuing that control action in that state will be hazardous. For example, one possible process model state for the open door command consists of the values: the train is stopped, there is no emergency, and the train is not aligned with a platform. Providing the open door command in this context is a hazardous control action.
Each row in Table 3 specifies a different context for the open door command.4 Context here is defined as a combination of values of the process model variables. Each context is then evaluated to determine whether the control action is hazardous in that context, and the result is recorded in the three columns on the right. The two right-most columns incorporate timing information as well. For example, providing an open door command in the context of an
4 Note that each of the four commands would need to be analyzed, including the stop commands.
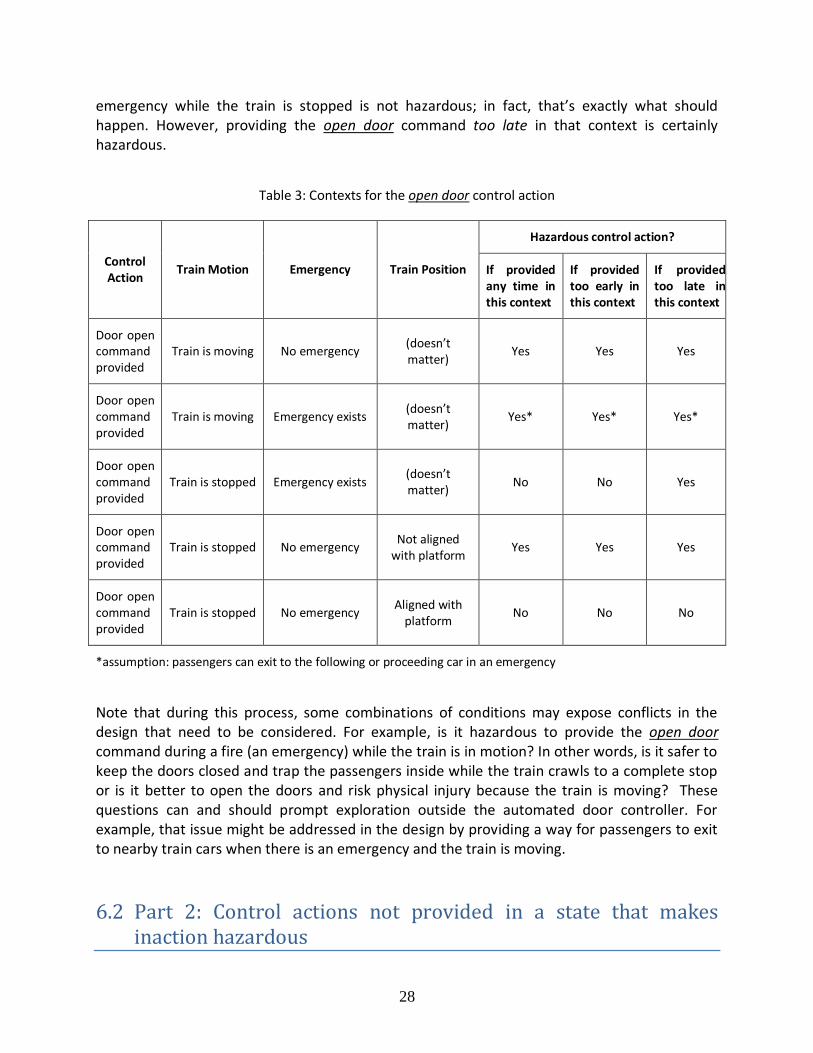
28
emergency while the train is stopped is not hazardous; in fact, that’s exactly what should happen. However, providing the open door command too late in that context is certainly hazardous.
Table 3: Contexts for the open door control action
Control Action
Train Motion Emergency Train Position
Hazardous control action?
If provided any time in this context
If provided too early in this context
If provided too late in this context
Door open command provided
Train is moving No emergency (doesn’t matter)
Yes Yes Yes
Door open command provided
Train is moving Emergency exists (doesn’t matter)
Yes* Yes* Yes*
Door open command provided
Train is stopped Emergency exists (doesn’t matter)
No No Yes
Door open command provided
Train is stopped No emergency Not aligned
with platform Yes Yes Yes
Door open command provided
Train is stopped No emergency Aligned with
platform No No No
*assumption: passengers can exit to the following or proceeding car in an emergency
Note that during this process, some combinations of conditions may expose conflicts in the design that need to be considered. For example, is it hazardous to provide the open door command during a fire (an emergency) while the train is in motion? In other words, is it safer to keep the doors closed and trap the passengers inside while the train crawls to a complete stop or is it better to open the doors and risk physical injury because the train is moving? These questions can and should prompt exploration outside the automated door controller. For example, that issue might be addressed in the design by providing a way for passengers to exit to nearby train cars when there is an emergency and the train is moving.
6.2 Part 2: Control actions not provided in a state that makes inaction hazardous
29
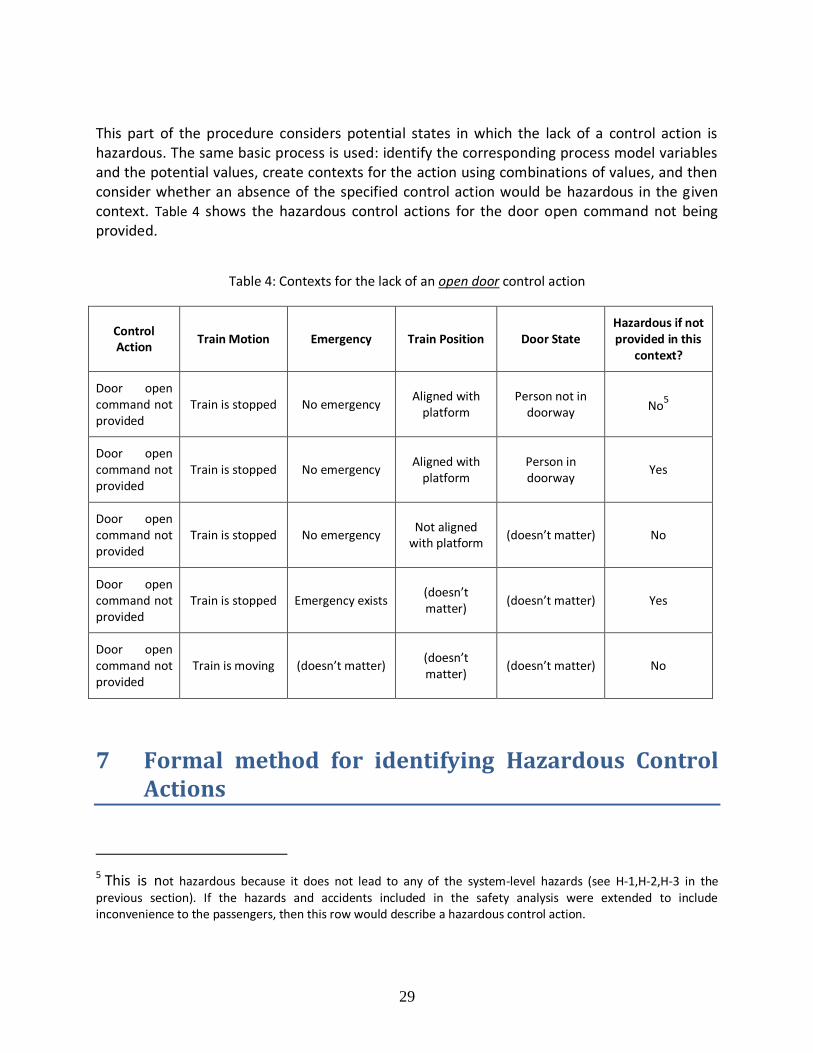
This part of the procedure considers potential states in which the lack of a control action is hazardous. The same basic process is used: identify the corresponding process model variables and the potential values, create contexts for the action using combinations of values, and then consider whether an absence of the specified control action would be hazardous in the given context. Table 4 shows the hazardous control actions for the door open command not being provided.
Table 4: Contexts for the lack of an open door control action
Control Action
Train Motion Emergency Train Position Door State Hazardous if not provided in this
context?
Door open command not provided
Train is stopped No emergency Aligned with
platform Person not in
doorway No5
Door open command not provided
Train is stopped No emergency Aligned with
platform Person in doorway
Yes
Door open command not provided
Train is stopped No emergency Not aligned
with platform (doesn’t matter) No
Door open command not provided
Train is stopped Emergency exists (doesn’t matter)
(doesn’t matter) Yes
Door open command not provided
Train is moving (doesn’t matter) (doesn’t matter)
(doesn’t matter) No
7 Formal method for identifying Hazardous Control Actions
5 This is not hazardous because it does not lead to any of the system-level hazards (see H-1,H-2,H-3 in the previous section). If the hazards and accidents included in the safety analysis were extended to include inconvenience to the passengers, then this row would describe a hazardous control action.
30
This section defines a formal method that can be used to automate much of the manual process described in the previous section. Based on the formal structure defined in Section 5, a set of potentially hazardous control actions can be enumerated given certain information about the system. The information needed is:
: the set of system-level hazards
Ş: the set of controllers in the system
(S): the set of control actions for each controller S
: the set of variables referenced in the hazards
(V): the set of potential values for each variable V
Most, if not all, of this information can be determined well in advance of the detailed design of a system. The set is typically determined during the Preliminary Hazard Analysis (PHA) of the system. The set Ş and (S) can be extracted from a preliminary control structure of the system. The set is identical to the process model variables in the control structure, and can be extracted from the set of hazards . The potential values (V) are also found in the process model, and can be defined once is known.
Given this basic information about the system, properties 1-8 from Section 5 can be applied to automatically generate a list of potential hazardous control actions in the form of combinations of (S, T, CA, C). First, a controller S is selected from the set Ş. Then the set of conditions (S) is generated by pairing each variable in with each value in (V). Then the set of contexts is generated by combining each independent condition from (S). Finally, the list of potentially hazardous control actions for the selected controller S is generated by combining each element of , (S), and (S). This process can be repeated for each controller S in the set Ş.
This process guarantees that properties 1-8 from Section 5 are satisfied. Because a detailed behavioral model of the system typically does not exist during the earliest phases of development, it may not be possible to automatically apply property 9. However, this final step can be performed by the engineering team. Because the algorithm above generates combinations that satisfy all other criteria, the generated list is a superset of the actual hazardous control actions. Therefore this task is essentially a trimming exercise: the team does not need to add any new hazardous control actions, they only need to remove non-hazardous control actions from the list based on their knowledge of the physics or other engineering properties of the overall system outside the domain of formal logic. For example, in the following table the engineering team would need to fill in the column on the far right:
31
Table 5: Example hazardous control action table for the door open command
Control Action
Train Motion
Emergency Train Position Hazardous?
Door open
command
Moving (doesn’t
matter)
(doesn’t matter) Yes
Door open
command
Stopped Yes (doesn’t matter) No
Door open
command
Stopped No Not at platform Yes
Door open
command
Stopped No At platform No
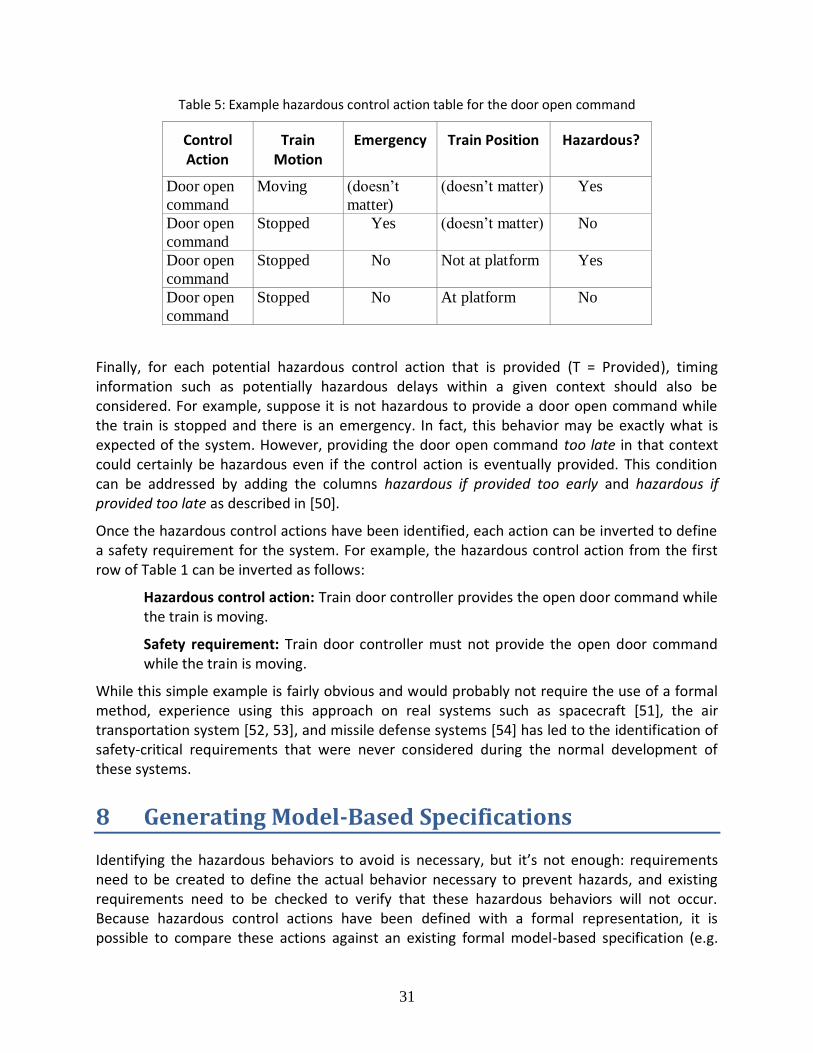
Finally, for each potential hazardous control action that is provided (T = Provided), timing information such as potentially hazardous delays within a given context should also be considered. For example, suppose it is not hazardous to provide a door open command while the train is stopped and there is an emergency. In fact, this behavior may be exactly what is expected of the system. However, providing the door open command too late in that context could certainly be hazardous even if the control action is eventually provided. This condition can be addressed by adding the columns hazardous if provided too early and hazardous if provided too late as described in [50].
Once the hazardous control actions have been identified, each action can be inverted to define a safety requirement for the system. For example, the hazardous control action from the first row of Table 1 can be inverted as follows:
Hazardous control action: Train door controller provides the open door command while the train is moving.
Safety requirement: Train door controller must not provide the open door command while the train is moving.
While this simple example is fairly obvious and would probably not require the use of a formal method, experience using this approach on real systems such as spacecraft [51], the air transportation system [52, 53], and missile defense systems [54] has led to the identification of safety-critical requirements that were never considered during the normal development of these systems.
8 Generating Model-Based Specifications
Identifying the hazardous behaviors to avoid is necessary, but it’s not enough: requirements need to be created to define the actual behavior necessary to prevent hazards, and existing requirements need to be checked to verify that these hazardous behaviors will not occur. Because hazardous control actions have been defined with a formal representation, it is possible to compare these actions against an existing formal model-based specification (e.g.
32
SpecTRM-RL) to determine whether these hazardous control actions may occur. Furthermore, if no formal specification exists, it is possible to automatically generate the parts of the specification necessary to ensure hazardous behavior is prevented.
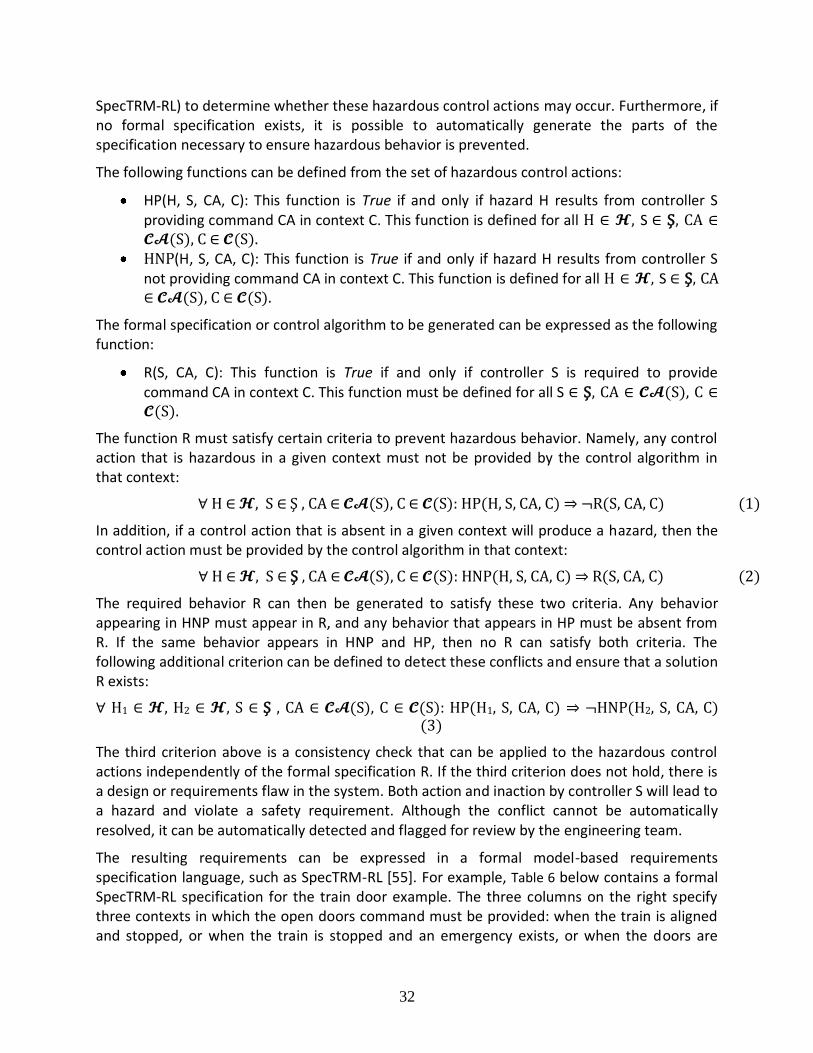
The following functions can be defined from the set of hazardous control actions:
HP(H, S, CA, C): This function is True if and only if hazard H results from controller S providing command CA in context C. This function is defined for all H ∈ , S ∈ Ş, CA ∈
(S), C ∈ (S). HNP(H, S, CA, C): This function is True if and only if hazard H results from controller S
not providing command CA in context C. This function is defined for all H ∈ , S ∈ Ş, CA ∈ (S), C ∈ (S).
The formal specification or control algorithm to be generated can be expressed as the following function:
R(S, CA, C): This function is True if and only if controller S is required to provide command CA in context C. This function must be defined for all S ∈ Ş, CA ∈ (S), C ∈
(S).
The function R must satisfy certain criteria to prevent hazardous behavior. Namely, any control action that is hazardous in a given context must not be provided by the control algorithm in that context:
∀ H ∈ , S ∈ Ş , CA ∈ (S), C ∈ (S): HP(H, S, CA, C) ⇒ ¬R(S, CA, C) (1)
In addition, if a control action that is absent in a given context will produce a hazard, then the control action must be provided by the control algorithm in that context:
∀ H ∈ , S ∈ Ş , CA ∈ (S), C ∈ (S): HNP(H, S, CA, C) ⇒ R(S, CA, C) (2)
The required behavior R can then be generated to satisfy these two criteria. Any behavior appearing in HNP must appear in R, and any behavior that appears in HP must be absent from R. If the same behavior appears in HNP and HP, then no R can satisfy both criteria. The following additional criterion can be defined to detect these conflicts and ensure that a solution R exists:
∀ H1 ∈ , H2 ∈ , S ∈ Ş , CA ∈ (S), C ∈ (S): HP(H1, S, CA, C) ⇒ ¬HNP(H2, S, CA, C) (3)
The third criterion above is a consistency check that can be applied to the hazardous control actions independently of the formal specification R. If the third criterion does not hold, there is a design or requirements flaw in the system. Both action and inaction by controller S will lead to a hazard and violate a safety requirement. Although the conflict cannot be automatically resolved, it can be automatically detected and flagged for review by the engineering team.
The resulting requirements can be expressed in a formal model-based requirements specification language, such as SpecTRM-RL [55]. For example, Table 6 below contains a formal SpecTRM-RL specification for the train door example. The three columns on the right specify three contexts in which the open doors command must be provided: when the train is aligned and stopped, or when the train is stopped and an emergency exists, or when the doors are
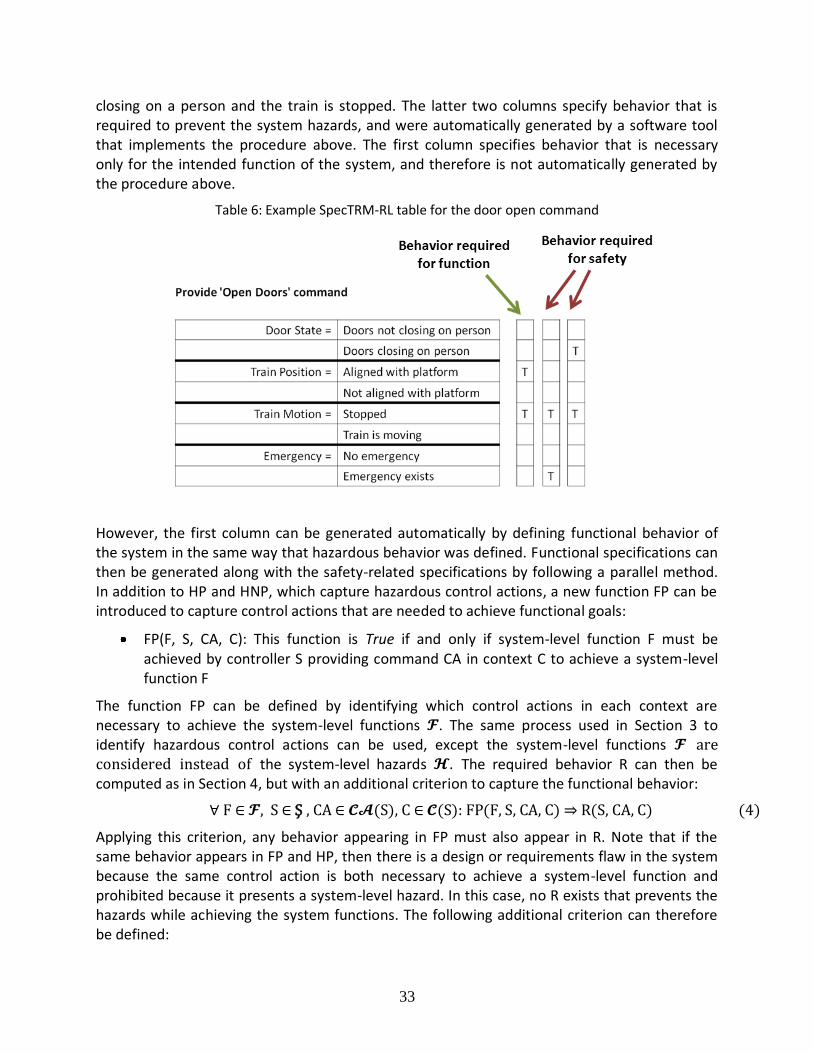
33
closing on a person and the train is stopped. The latter two columns specify behavior that is required to prevent the system hazards, and were automatically generated by a software tool that implements the procedure above. The first column specifies behavior that is necessary only for the intended function of the system, and therefore is not automatically generated by the procedure above.
Table 6: Example SpecTRM-RL table for the door open command
However, the first column can be generated automatically by defining functional behavior of the system in the same way that hazardous behavior was defined. Functional specifications can then be generated along with the safety-related specifications by following a parallel method. In addition to HP and HNP, which capture hazardous control actions, a new function FP can be introduced to capture control actions that are needed to achieve functional goals:
FP(F, S, CA, C): This function is True if and only if system-level function F must be achieved by controller S providing command CA in context C to achieve a system-level function F
The function FP can be defined by identifying which control actions in each context are necessary to achieve the system-level functions . The same process used in Section 3 to identify hazardous control actions can be used, except the system-level functions are considered instead of the system-level hazards . The required behavior R can then be computed as in Section 4, but with an additional criterion to capture the functional behavior:
∀ F ∈ , S ∈ Ş , CA ∈ (S), C ∈ (S): FP(F, S, CA, C) ⇒ R(S, CA, C) (4)
Applying this criterion, any behavior appearing in FP must also appear in R. Note that if the same behavior appears in FP and HP, then there is a design or requirements flaw in the system because the same control action is both necessary to achieve a system-level function and prohibited because it presents a system-level hazard. In this case, no R exists that prevents the hazards while achieving the system functions. The following additional criterion can therefore be defined:

34
∀ H ∈ , F ∈ , S ∈ Ş , CA ∈ (S), C ∈ (S): HP(H, S, CA, C) ⇒ ¬FP(F, S, CA, C) (5)
This final criterion is a consistency check to detect conflicts between hazardous and functional behavior. As before, these conflicts cannot be automatically resolved, but they can be automatically detected and flagged for review by the engineering team.
9 Conclusions:
Traditional hazard analysis techniques were evaluated and found to overlook several important types of causal factors including like flawed requirements, dysfunctional component interactions, and software and other design errors. A new hazard analysis technique called STPA was also described. STPA has been applied to many complex systems and has proven to be both feasible and effective in systems for which traditional analyses had already been performed. STPA found the same hazardous scenarios as existing analyses, but STPA also found additional scenarios involving complex software and human errors [51, 54].
Although STPA has proven to be very effective on real systems, no formal structure had been defined for STPA and its application was ad-hoc with no rigorous procedures or model-based design tools. This report defines a formal mathematical structure underlying STPA and describes a procedure for systematically performing an STPA analysis based on that structure. A method for using the results of the hazard analysis to generate formal safety-critical, model-based system and software requirements is also presented. Techniques to automate both the analysis and the requirements generation are discussed, as well as a method to detect conflicts between the safety and other functional model-based requirements during early development of the system. Current research is exploring potential ways in which similar kinds of detailed procedures can be created to assist the analyst during STPA Step Two. Much of the analysis is potentially automatable and we are also exploring this potential.
10 References
1. Vesely, W.E. and N.H. Roberts, Fault Tree Handbook. 1987: US Independent Agencies
and Commissions.
2. Dekker, S., Ten questions about human error : a new view of human factors and system
safety. Human factors in transportation. 2005, Mahwah, N.J.: Lawrence Erlbaum
Associates. xix, 230 p.
3. Dekker, S., The field guide to understanding human error. 2006, Aldershot, England ;
Burlington, VT: Ashgate. xv, 236 p.
4. Lutz, R.R. Analyzing software requirements errors in safety-critical, embedded systems.
in International Conference on Software Requirements. 1992. IEEE.
5. Leveson, N., SafeWare : system safety and computers. 1995, Reading, Mass.: Addison-
Wesley. xvii, 680 p.
35
6. Bainbridge, L., Ironies of Automation, in New Technology and Human Error, J.
Rasmussen, K. Duncan, and J. Leplat, Editors. 1987, John wiley and Sons: New York.
7. Sarter, N.B. and D.D. Woods, How in the World Did We Ever Get into That Mode -
Mode Error and Awareness in Supervisory Control. Human Factors, 1995. 37(1): p. 5-19.
8. Watson, H.A., Launch Control Safety Study. Vol. 1. 1962.
9. Ericson, C.A. Fault Tree Analysis – A History. in Proceedings of The 17th International
System Safety Conference. 1999.
10. Mannan, S. and F.P. Lees, Lee's loss prevention in the process industries: hazard
identification, assessment, and control. Lee's Loss Prevention in the Process Industries:
Hazard Identification, Assessment, and Control. 2005: Elsevier Butterworth-Heinemann.
11. Lebron, J.E., System safety study of minimum TCAS II, 1983, Federal Aviation
Administration: Washington, D.C. p. 360 p. in various pagings.
12. RTCA, Safety, Performance an Interoperability Requirements Document for the In-Trail
Procedure in the Oceanic Airspace (ATSA-ITP) Application, 2008: Washington, DC.
13. Childs, C., Cosmetic System Safety. Hazard Prevention, 1979.
14. Hixenbaugh, A.F., Fault Tree for Safety, 1968, Defense Technical Information Center
Boeing Co. Support Systems Engineering Seattle, WA Ft. Belvoir. p. 29 p.
15. Dougherty, E.M., Human Reliability-Analysis - Where Shouldst Thou Turn. Reliability
Engineering & System Safety, 1990. 29(3): p. 283-299.
16. Swain, A.D., Human Reliability-Analysis - Need, Status, Trends and Limitations.
Reliability Engineering & System Safety, 1990. 29(3): p. 301-313.
17. RTCA and EUROCAE, Guidelines for Approval of the Provision and Use of Air Traffic
Services Supported by Data Communications, 2002.
18. Moray, N., Dougherty's dilemma and the one-sidedness of human reliability analysis
(HRA). Reliability Engineering & System Safety, 1990. 29(3): p. 337-344.
19. Kantowitz, B.H. and Y. Fujita, Cognitive theory, identifiability and human reliability
analysis (HRA). Reliability Engineering & System Safety, 1990. 29(3): p. 317-328.
20. Mosleh, A., V.M. Bier, and G. Apostolakis, A Critique of Current Practice for the Use of
Expert Opinions in Probabilistic Risk Assessment. Reliability Engineering & System
Safety, 1988. 20(1): p. 63-85.
21. Leveson, N. and C.S. Turner, An Investigation of the Therac-25 Accidents. Computer,
1993. 26(7): p. 18-41.
22. Ericson, C.A., Hazard analysis techniques for system safety. 2005, Hoboken, NJ: Wiley-
Interscience. xx, 499 p.
23. Rasmussen, N.C., Reactor safety study : an assessment of accident risks in U.S.
commercial nuclear power plants. 1975, Washington; Springfield, Va.: N.R.C.; National
Technical Information Service.
36
24. Rausand, M. and A. Høyland, System reliability theory : models, statistical methods, and
applications. 2nd ed. Wiley series in probability and statistics Applied probability and
statistics. 2004, Hoboken, NJ: Wiley-Interscience. xix, 636 p.
25. Verma, A.K., Reliability and safety engineering. 1st ed. Springer series in reliability
engineering. 2010, New York: Springer.
26. Skelton, B., Process safety analysis : an introduction. 1997, Houston, Tex.: Gulf Pub. xii,
213 p.
27. Apostolakis, G., et al., Integration of Reactor Design, Operations, and Safety, in MIT
Course 22.392006.
28. Walker, J.S., Three Mile Island : a nuclear crisis in historical perspective. 2004,
Berkeley: University of California Press. xi, 303 p.
29. Marais, K., J.H. Saleh, and N.G. Leveson, Archetypes for organizational safety. Safety
science, 2006. 44(7): p. 565-582.
30. Military, U.S., MIL-P-1629 Procedures for Performing a Failure Modes Effects and
Criticality Analysis, 1949.
31. Dhillon, B.S., Maintainability, maintenance, and reliability for engineers. 2006, Boca
Raton: CRC/Taylor & Francis. 217 p.
32. Stamatis, D.H., Design for Six Sigma. Six sigma and beyond. 2002: ST LUCIE PR.
33. SAE, ARP926 Design Analysis Procedure For Failure Modes, Effects and Criticality
Analysis 1967.
34. National Research Council, Safety and offshore oil. 1981: National Academy Press.
35. National Academy of Engineering, Outer continental shelf resource development safety:
a review of technology and regulation for the systematic minimization of environmental
intrusion from petroleum products. 1972: National Academy of Engineering, Marine
Board.
36. Duckworth, H.A. and R.A. Moore, Social Responsibility: Failure Mode Effects and
Analysis. Industrial Innovation Series. 2010: Taylor and Francis.
37. Crow, D. and A. Feinberg, Design for Reliability. Electronics Handbook Series. 2001:
CRC Press.
38. Stamatis, D.H., Failure Mode and Effect Analysis: Fmea from Theory to Execution.
2003: ASQ Quality Press.
39. Goble, W.M., Control systems safety evaluation and reliability. 3rd ed. ISA resources for
measurement and control series. 2010, Research Triangle Park, NC: International Society
of Automation. xvi, 458 p.
40. Fullwood, R.R. and R.R. Fullwood, Probabilistic safety assessment in the chemical and
nuclear industries. 2000, Boston: Butterworth-Heinemann. xxix, 514 p.
41. BP, Deepwater Horizon Accident investigation Report. 2010.
42. Drilling, N.C.o.t.B.D.H.O.S.a.O., Deep Water: The Gulf Oil Disaster and the Future of
Offshore Drilling. 2010.
37
43. Vaughan, D., The Challenger launch decision : risky technology, culture, and deviance at
NASA. 1996, Chicago: University of Chicago Press. xv, 575 p.
44. Lutz, R.R., Analyzing software requirements errors in safety-critical, embedded systems.
Technical report. Iowa State University. Dept. of Computer Science. 1993, Ames, Iowa:
Iowa State University Dept. of Computer Science. 14 p.
45. Leveson, N., Completeness in formal specification language design for process-control
systems, in Proceedings of the third workshop on Formal methods in software
practice2000, ACM: Portland, Oregon, United States. p. 75-87.
46. Division, U.S.D.C.f.t.S.D.o.T.H., Statement of Facts. 2007.
47. Panel, B., The Report of the BP U.S. Refineries Independent Safety Review Panel. 2007.
48. Leveson, N., Engineering a safer world : systems thinking applied to safety. Engineering
systems. 2012, Cambridge, Mass.: MIT Press. xx, 534 p.
49. Leveson, N.G., Role of software in spacecraft accidents. Journal of spacecraft and
Rockets, 2004. 41(4): p. 564-575.
50. Thomas, J. and N. Leveson, Performing Hazard Analysis on Complex, Software- and
Human-Intensive Systems, in International System Safety Conference2011, System Safety
Society: Las Vegas, NV.
51. Ishimatsu, T., et al., Modeling and Hazard Analysis using STPA, in Conference of the
International Association for the Advancement of Space Safety2010: Huntsville,
Alabama.
52. Laracy, J.R., A systems-theoretic security model for large scale, complex systems applied
to the US air transportation system, in Engineering Systems Division2007, Massachusetts
Institute of Technology, Engineering Systems Division.
53. Fleming, C., et al., Safety Assurance in Nextgen. NASA Technical Report, 2011.
54. Pereira, S., G. Lee, and J. Howard, A System-Theoretic Hazard Analysis Methodology for
a Non-advocate Safety Assessment of the Ballistic Missile Defense System, in AIAA
Missile Sciences Conference2006: Monterey, CA.
55. Leveson, N.G., M.P.E. Heimdahl, and J.D. Reese, Designing specification languages for
process control systems: lessons learned and steps to the future, in Proceedings of the 7th
European software engineering conference held jointly with the 7th ACM SIGSOFT
international symposium on Foundations of software engineering1999, Springer-Verlag:
Toulouse, France. p. 127-145.

38
Distribution:
1 MS 0405 C. Aas, 0432
1 MS 0405 N. Brown, 0432
1 MS 0492 J. Brewer, 0411
1 MS 0899 Technical Library, 9536
1 MS 0359 D. Chavez, LDRD Office, 1911

39