Embed Size (px)
Citation preview
1
The Sustainable Development Goals Report 2021
Extended Report
-Goal 1-
End poverty in all its forms everywhere
Note: The UN Statistics Division (UNSD) prepares the annual The Sustainable Development Goals Report, also known as the glossy report, based on storyline inputs submitted by UN international agencies in their capacity as mandated custodian agencies for the SDG indicators. However, due to space constraints, not all information received from custodian agencies is able to be included in the final glossy report. Therefore, in order to provide the general public with all information regarding the indicators, this ‘Extended Report’ has been prepared by UNSD. It includes all storyline contents for each indicator as provided by the custodian agencies and is unedited. For instances where the custodian agency has not submitted a storyline for an indicator, please see the custodian agency focal point information linked for further information.
2
Contents
Indicator 1.1.1: Proportion of the population living below the international poverty line by sex, age, employment status and geographic
location (urban/rural) ............................................................................................................................................................................................... 3
Indicator 1.2.1: Proportion of population living below the national poverty line, by sex and age ....................................................................... 6
Indicator 1.2.2: Proportion of men, women and children of all ages living in poverty in all its dimensions according to national definitions .. 7
Indicator 1.3.1: Proportion of population covered by social protection floors/systems, by sex, distinguishing children, unemployed persons,
older persons, persons with disabilities, pregnant women, newborns, work-injury victims and the poor and the vulnerable .......................... 8
Indicator 1.4.1: Proportion of population living in households with access to basic services ............................................................................. 11
Indicator 1.4.2: Proportion of total adult population with secure tenure rights to land, (a) with legally recognized documentation, and (b)
who perceive their rights to land as secure, by sex and type of tenure ............................................................................................................... 12
Indicator 1.5.1/11.5.1/13.1.1: Number of deaths, missing persons and directly affected persons attributed to disasters per 100,000
population ............................................................................................................................................................................................................... 13
Indicator 1.5.2: Direct economic loss attributed to disasters in relation to global gross domestic product (GDP) ............................................ 14
Indicator 1.5.3/11.b.1/13.1.2: Number of countries that adopt and implement national disaster risk reduction strategies in line with the
Sendai Framework for Disaster Risk Reduction 2015–2030 .................................................................................................................................. 15
Indicator 1.5.4/11.b.2/13.1.3: Proportion of local governments that adopt and implement local disaster risk reduction strategies in line
with national disaster risk reduction strategies ..................................................................................................................................................... 15
Indicator 1.a.1: Total official development assistance grants from all donors that focus on poverty reduction as a share of the recipient
country’s gross national income ............................................................................................................................................................................. 16
Indicator 1.a.2: Proportion of total government spending on essential services (education, health and social protection) ............................ 17
Indicator 1.b.1: Pro-poor public social spending.................................................................................................................................................... 18
3
Target 1.1: By 2030, eradicate extreme poverty for all people everywhere, currently measured as people living on less than $1.25 a day
Indicator 1.1.1: Proportion of the population living below the international poverty line by sex, age, employment status and
geographic location (urban/rural)
Achieving the goal of eradicating extreme poverty by 2030 will require unprecedented interventions to reverse the first increase in global poverty in a generation caused by the COVID-19 pandemic
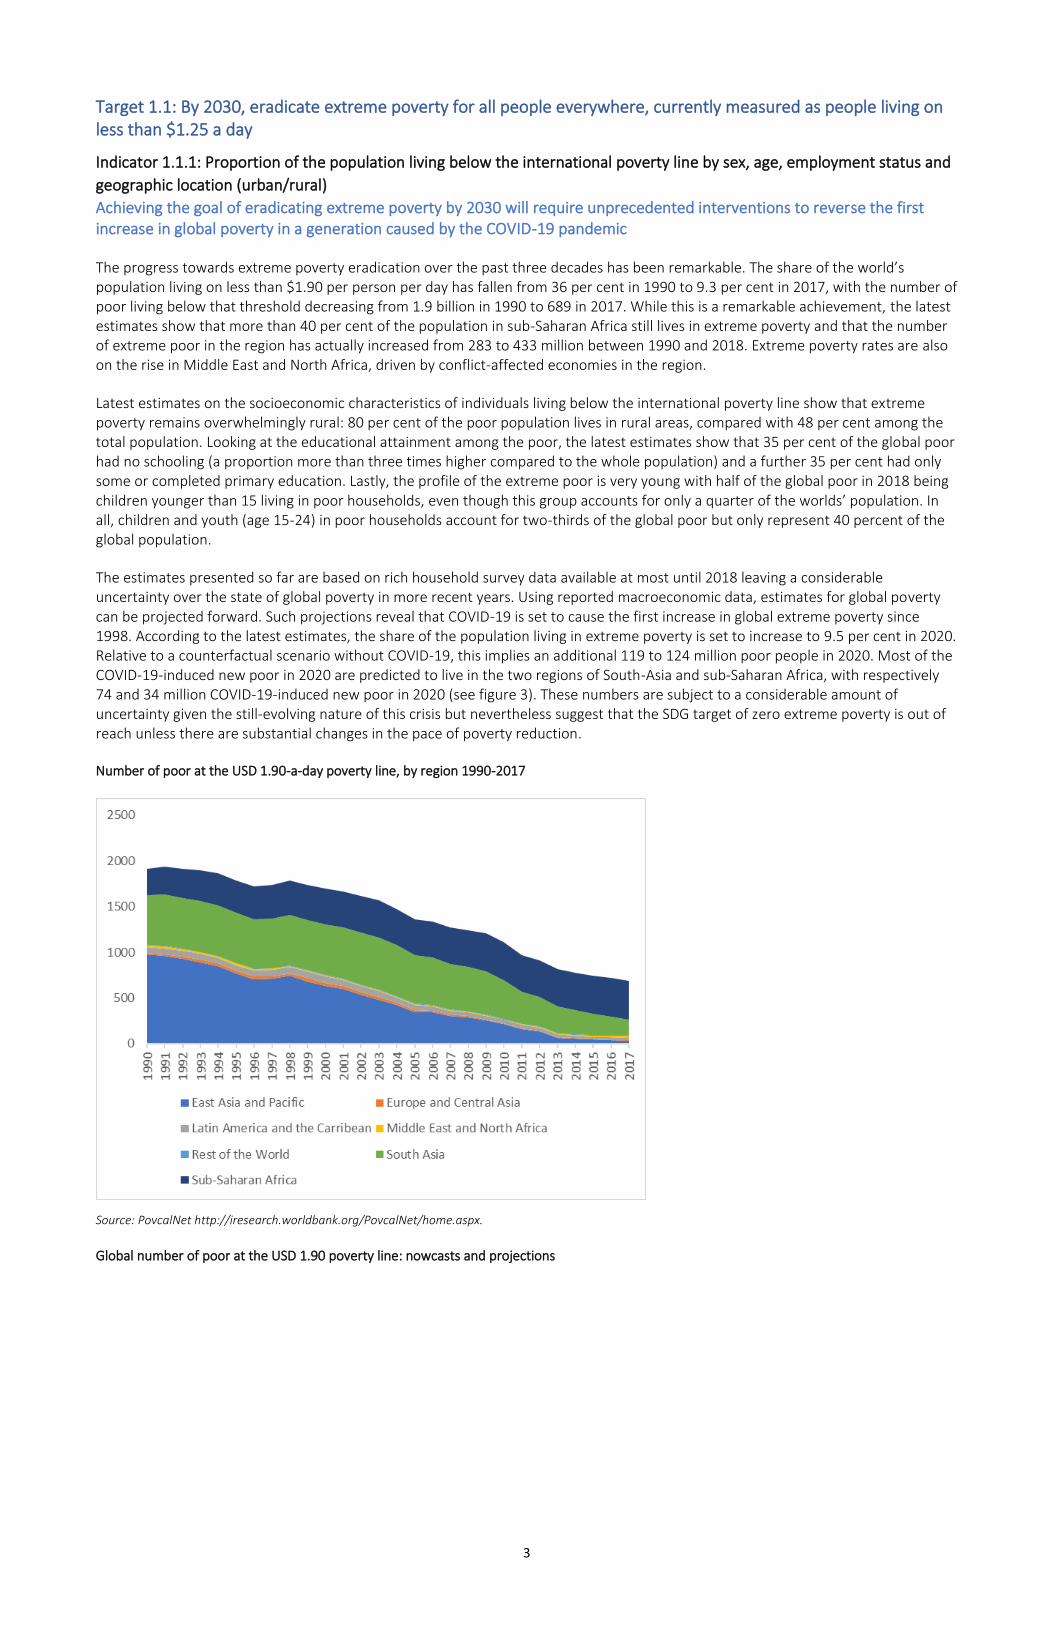
The progress towards extreme poverty eradication over the past three decades has been remarkable. The share of the world’s population living on less than $1.90 per person per day has fallen from 36 per cent in 1990 to 9.3 per cent in 2017, with the number of poor living below that threshold decreasing from 1.9 billion in 1990 to 689 in 2017. While this is a remarkable achievement, the latest estimates show that more than 40 per cent of the population in sub-Saharan Africa still lives in extreme poverty and that the number of extreme poor in the region has actually increased from 283 to 433 million between 1990 and 2018. Extreme poverty rates are also on the rise in Middle East and North Africa, driven by conflict-affected economies in the region.
Latest estimates on the socioeconomic characteristics of individuals living below the international poverty line show that extreme poverty remains overwhelmingly rural: 80 per cent of the poor population lives in rural areas, compared with 48 per cent among the total population. Looking at the educational attainment among the poor, the latest estimates show that 35 per cent of the global poor had no schooling (a proportion more than three times higher compared to the whole population) and a further 35 per cent had only some or completed primary education. Lastly, the profile of the extreme poor is very young with half of the global poor in 2018 being children younger than 15 living in poor households, even though this group accounts for only a quarter of the worlds’ population. In all, children and youth (age 15-24) in poor households account for two-thirds of the global poor but only represent 40 percent of the global population.
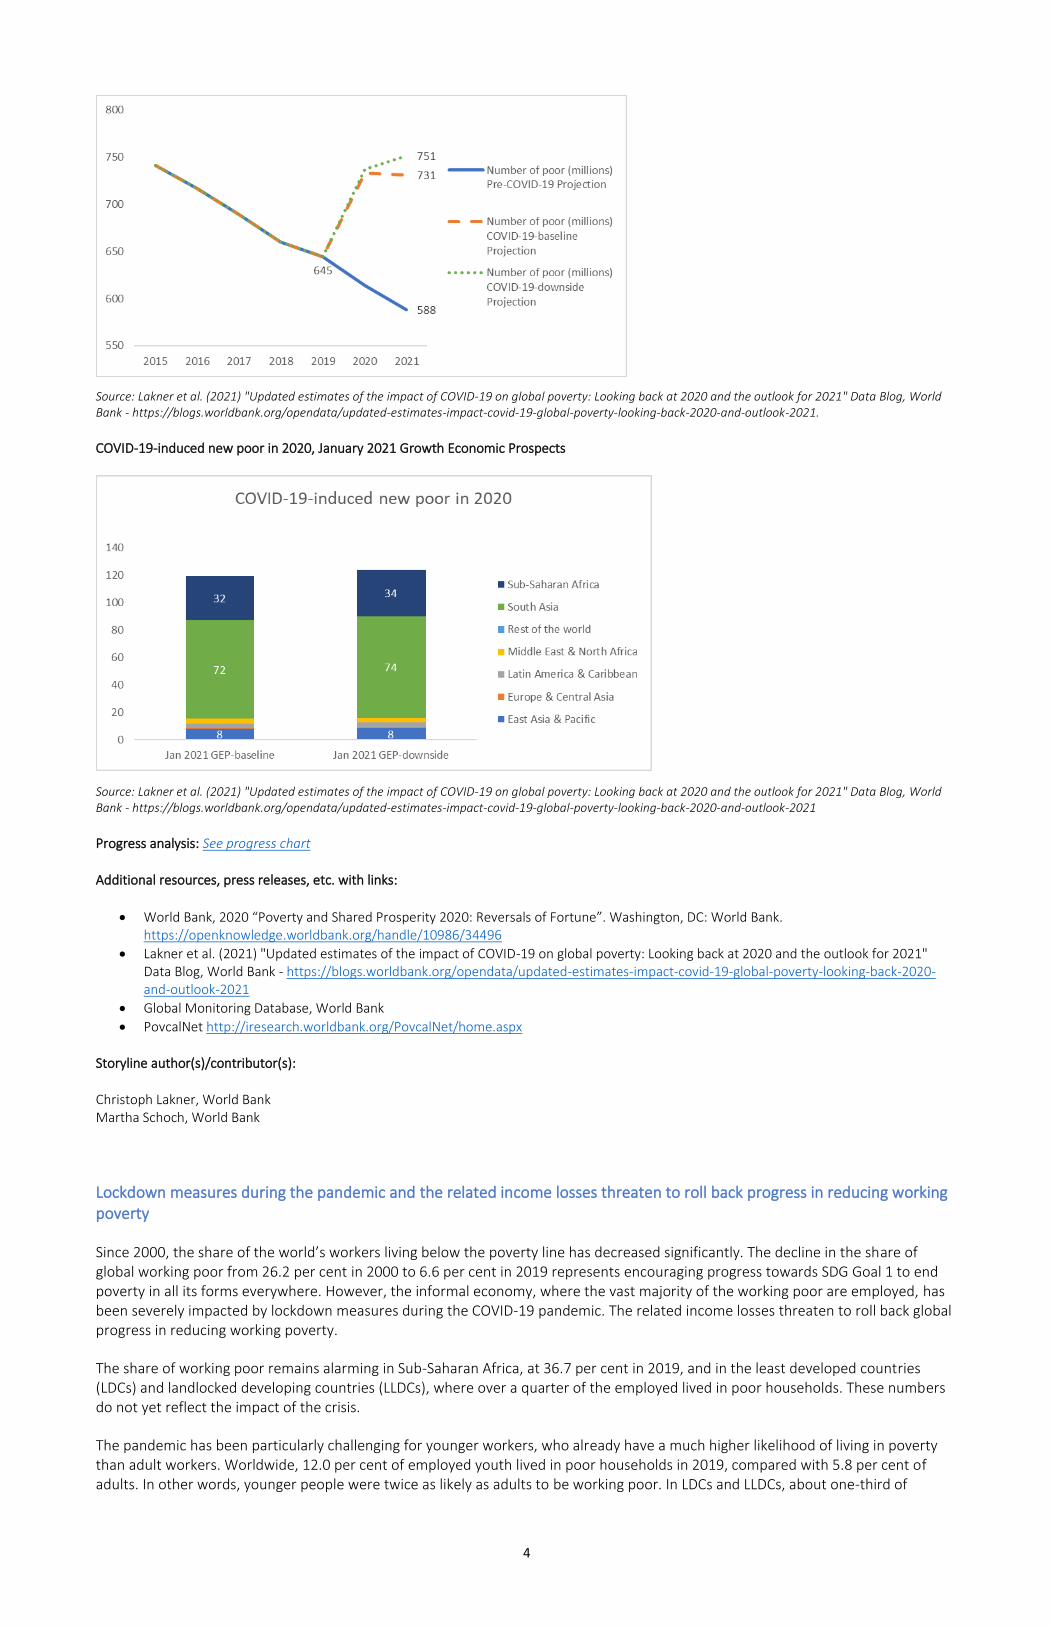
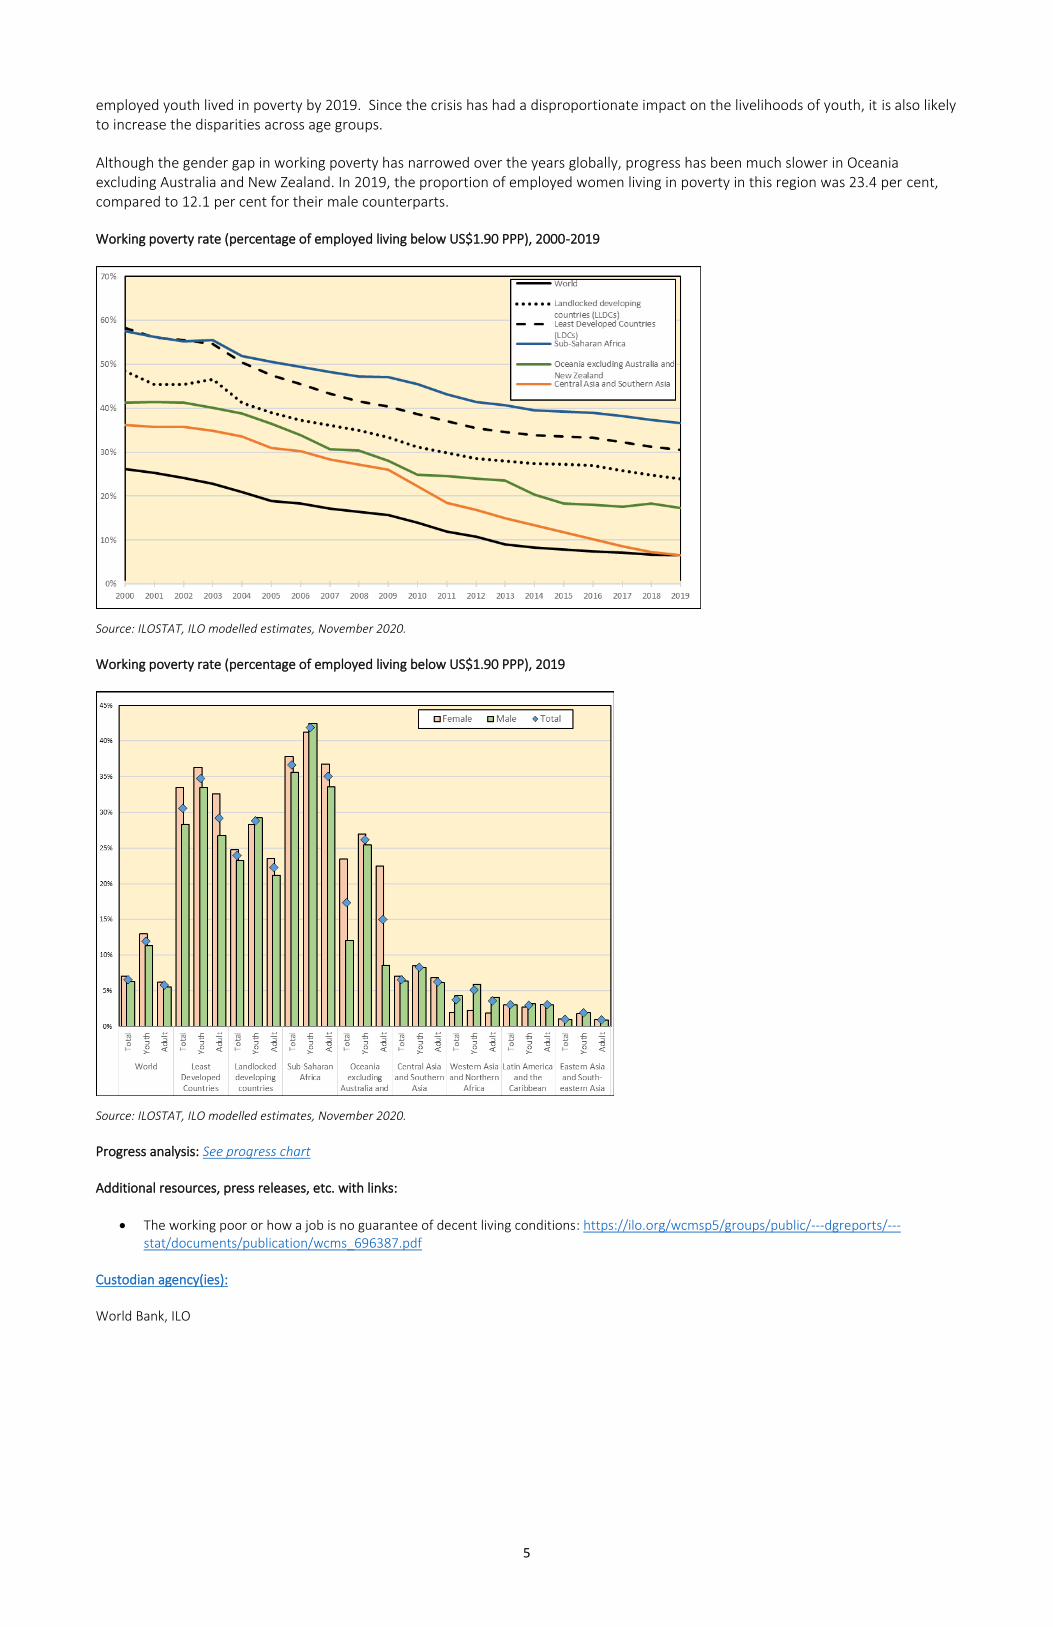
The estimates presented so far are based on rich household survey data available at most until 2018 leaving a considerable uncertainty over the state of global poverty in more recent years. Using reported macroeconomic data, estimates for global poverty can be projected forward. Such projections reveal that COVID-19 is set to cause the first increase in global extreme poverty since 1998. According to the latest estimates, the share of the population living in extreme poverty is set to increase to 9.5 per cent in 2020. Relative to a counterfactual scenario without COVID-19, this implies an additional 119 to 124 million poor people in 2020. Most of the COVID-19-induced new poor in 2020 are predicted to live in the two regions of South-Asia and sub-Saharan Africa, with respectively 74 and 34 million COVID-19-induced new poor in 2020 (see figure 3). These numbers are subject to a considerable amount of uncertainty given the still-evolving nature of this crisis but nevertheless suggest that the SDG target of zero extreme poverty is out of reach unless there are substantial changes in the pace of poverty reduction.
Number of poor at the USD 1.90-a-day poverty line, by region 1990-2017
Source: PovcalNet http://iresearch.worldbank.org/PovcalNet/home.aspx.
Global number of poor at the USD 1.90 poverty line: nowcasts and projections
4
Source: Lakner et al. (2021) "Updated estimates of the impact of COVID-19 on global poverty: Looking back at 2020 and the outlook for 2021" Data Blog, World Bank - https://blogs.worldbank.org/opendata/updated-estimates-impact-covid-19-global-poverty-looking-back-2020-and-outlook-2021.
COVID-19-induced new poor in 2020, January 2021 Growth Economic Prospects
Source: Lakner et al. (2021) "Updated estimates of the impact of COVID-19 on global poverty: Looking back at 2020 and the outlook for 2021" Data Blog, World Bank - https://blogs.worldbank.org/opendata/updated-estimates-impact-covid-19-global-poverty-looking-back-2020-and-outlook-2021
Progress analysis: See progress chart
Additional resources, press releases, etc. with links:
• World Bank, 2020 “Poverty and Shared Prosperity 2020: Reversals of Fortune”. Washington, DC: World Bank. https://openknowledge.worldbank.org/handle/10986/34496
• Lakner et al. (2021) "Updated estimates of the impact of COVID-19 on global poverty: Looking back at 2020 and the outlook for 2021" Data Blog, World Bank - https://blogs.worldbank.org/opendata/updated-estimates-impact-covid-19-global-poverty-looking-back-2020-and-outlook-2021
• Global Monitoring Database, World Bank
• PovcalNet http://iresearch.worldbank.org/PovcalNet/home.aspx
Storyline author(s)/contributor(s):
Christoph Lakner, World Bank Martha Schoch, World Bank
Lockdown measures during the pandemic and the related income losses threaten to roll back progress in reducing working poverty
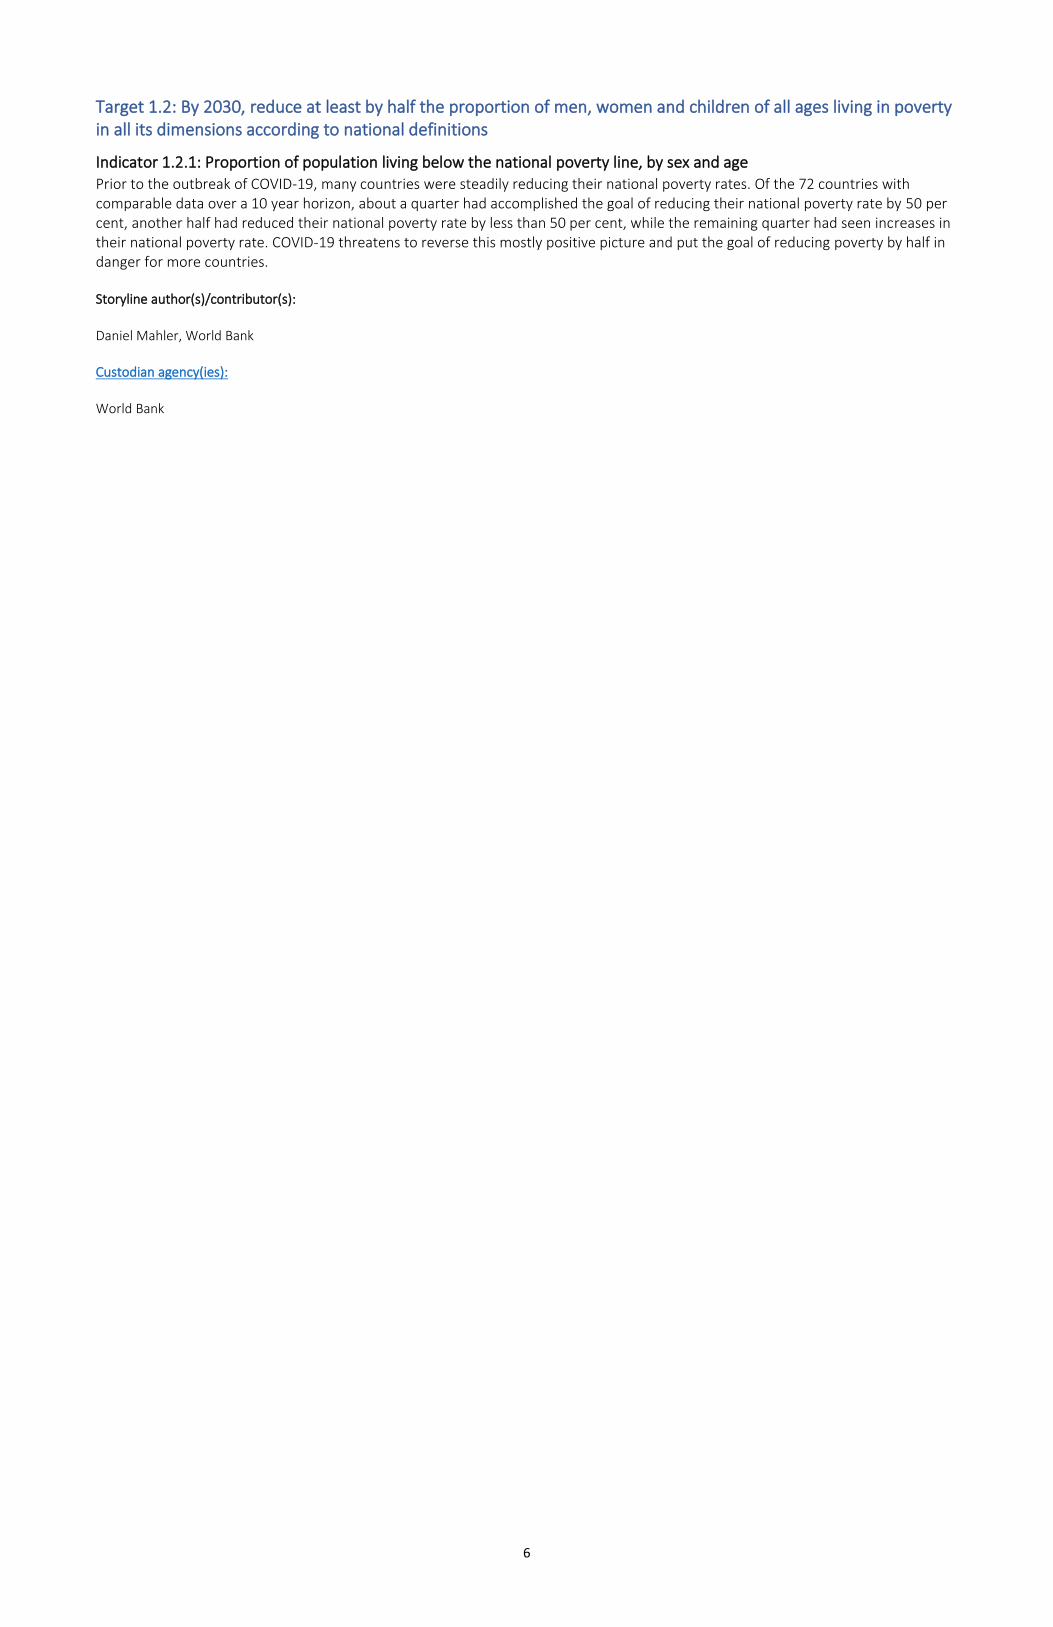
Since 2000, the share of the world’s workers living below the poverty line has decreased significantly. The decline in the share of global working poor from 26.2 per cent in 2000 to 6.6 per cent in 2019 represents encouraging progress towards SDG Goal 1 to end poverty in all its forms everywhere. However, the informal economy, where the vast majority of the working poor are employed, has been severely impacted by lockdown measures during the COVID-19 pandemic. The related income losses threaten to roll back global progress in reducing working poverty.
The share of working poor remains alarming in Sub-Saharan Africa, at 36.7 per cent in 2019, and in the least developed countries (LDCs) and landlocked developing countries (LLDCs), where over a quarter of the employed lived in poor households. These numbers do not yet reflect the impact of the crisis.
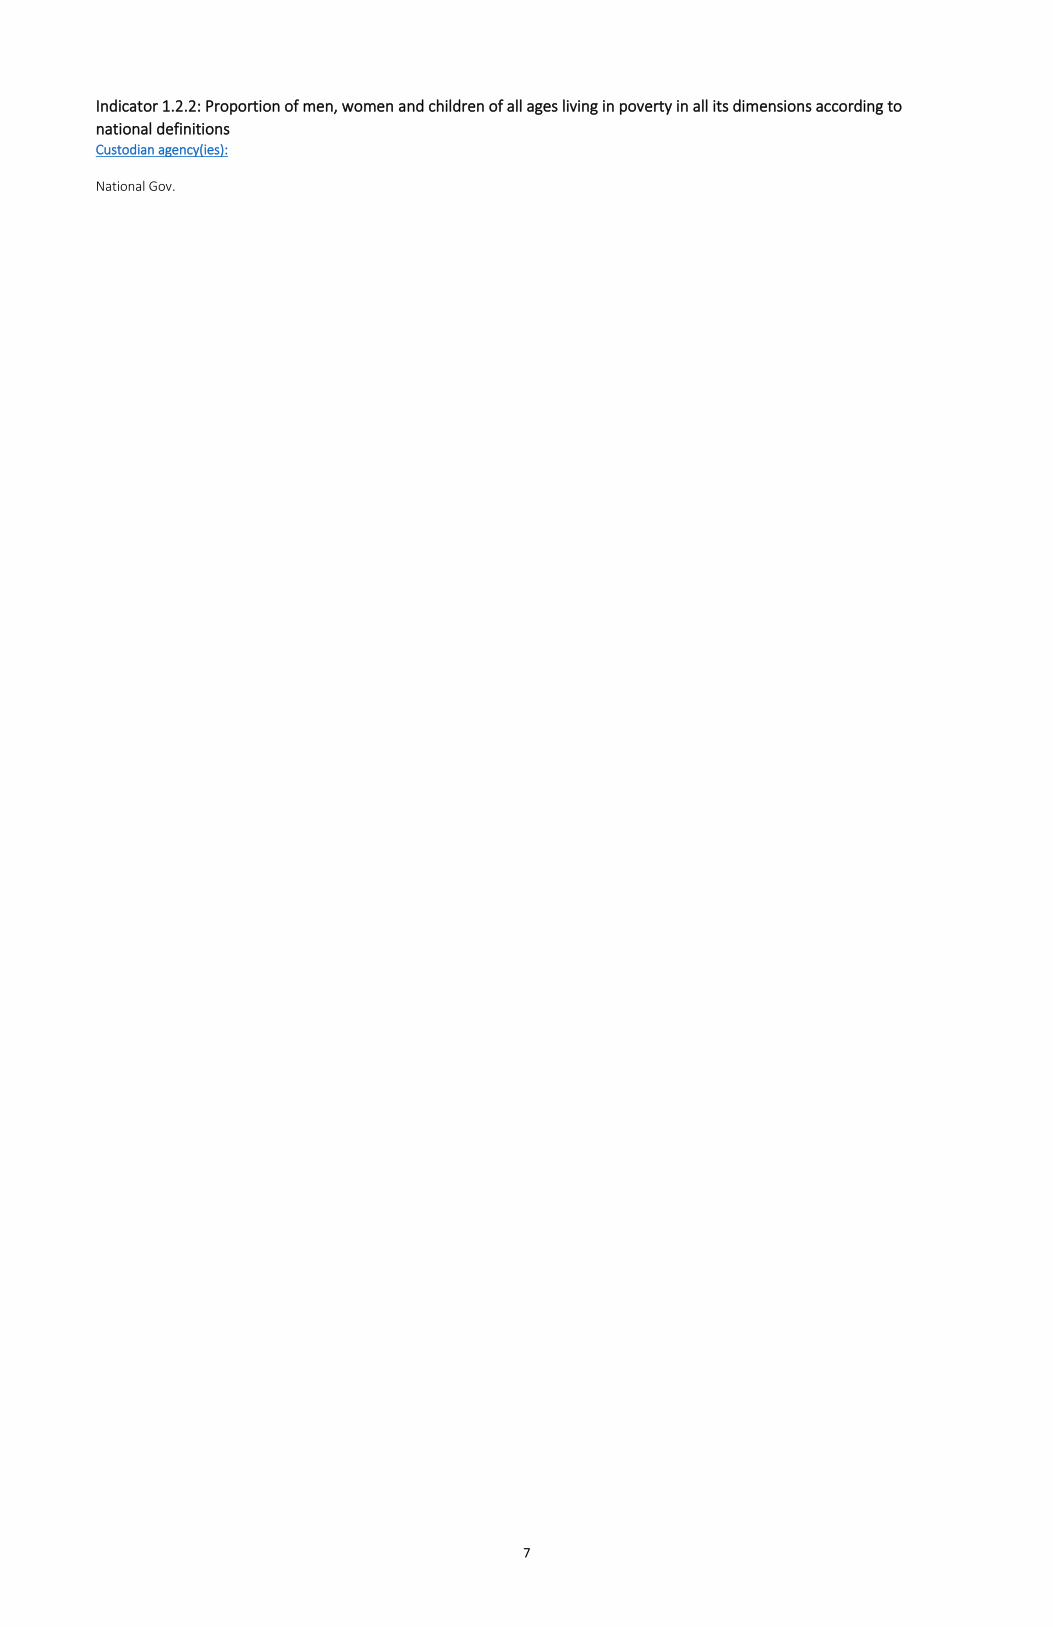
The pandemic has been particularly challenging for younger workers, who already have a much higher likelihood of living in poverty than adult workers. Worldwide, 12.0 per cent of employed youth lived in poor households in 2019, compared with 5.8 per cent of adults. In other words, younger people were twice as likely as adults to be working poor. In LDCs and LLDCs, about one-third of
5
employed youth lived in poverty by 2019. Since the crisis has had a disproportionate impact on the livelihoods of youth, it is also likely to increase the disparities across age groups.
Although the gender gap in working poverty has narrowed over the years globally, progress has been much slower in Oceania excluding Australia and New Zealand. In 2019, the proportion of employed women living in poverty in this region was 23.4 per cent, compared to 12.1 per cent for their male counterparts.
Working poverty rate (percentage of employed living below US$1.90 PPP), 2000-2019
Source: ILOSTAT, ILO modelled estimates, November 2020.
Working poverty rate (percentage of employed living below US$1.90 PPP), 2019
Source: ILOSTAT, ILO modelled estimates, November 2020.
Progress analysis: See progress chart
Additional resources, press releases, etc. with links:
• The working poor or how a job is no guarantee of decent living conditions: https://ilo.org/wcmsp5/groups/public/---dgreports/---stat/documents/publication/wcms_696387.pdf
Custodian agency(ies):
World Bank, ILO
6
Target 1.2: By 2030, reduce at least by half the proportion of men, women and children of all ages living in poverty in all its dimensions according to national definitions
Indicator 1.2.1: Proportion of population living below the national poverty line, by sex and age Prior to the outbreak of COVID-19, many countries were steadily reducing their national poverty rates. Of the 72 countries with comparable data over a 10 year horizon, about a quarter had accomplished the goal of reducing their national poverty rate by 50 per cent, another half had reduced their national poverty rate by less than 50 per cent, while the remaining quarter had seen increases in their national poverty rate. COVID-19 threatens to reverse this mostly positive picture and put the goal of reducing poverty by half in danger for more countries.
Storyline author(s)/contributor(s):
Daniel Mahler, World Bank
Custodian agency(ies):
World Bank
7
Indicator 1.2.2: Proportion of men, women and children of all ages living in poverty in all its dimensions according to
national definitions Custodian agency(ies):
National Gov.
8
Target 1.3: Implement nationally appropriate social protection systems and measures for all, including floors, and by 2030 achieve substantial coverage of the poor and the vulnerable
Indicator 1.3.1: Proportion of population covered by social protection floors/systems, by sex, distinguishing children,
unemployed persons, older persons, persons with disabilities, pregnant women, newborns, work-injury victims and the
poor and the vulnerable
Only 47 per cent of the global population are effectively covered by at least one social protection cash benefit, while the remaining 53 per cent – as many as 4 billion people – are left unprotected
Social protection systems are essential to ensure that no one is left behind. Social protection measures are fundamental to prevent and reduce poverty across the life cycle, including benefits for children, for mothers with newborns, for persons with disabilities, for the workers in case of work injury, for the unemployed, and for older persons. The COVID-19 crisis has demonstrated the importance of social protection systems to protect people’s health, jobs and incomes. However, it also revealed the consequences of high coverage gaps in many countries, exposing the vulnerability of the population coping with the devastating health and employment impact of the crisis. Between 1 February and 31 December 2020, governments of 209 countries and territories announced more than 1600 social protection measures (mostly short-term) in response to the COVID-19 crisis.
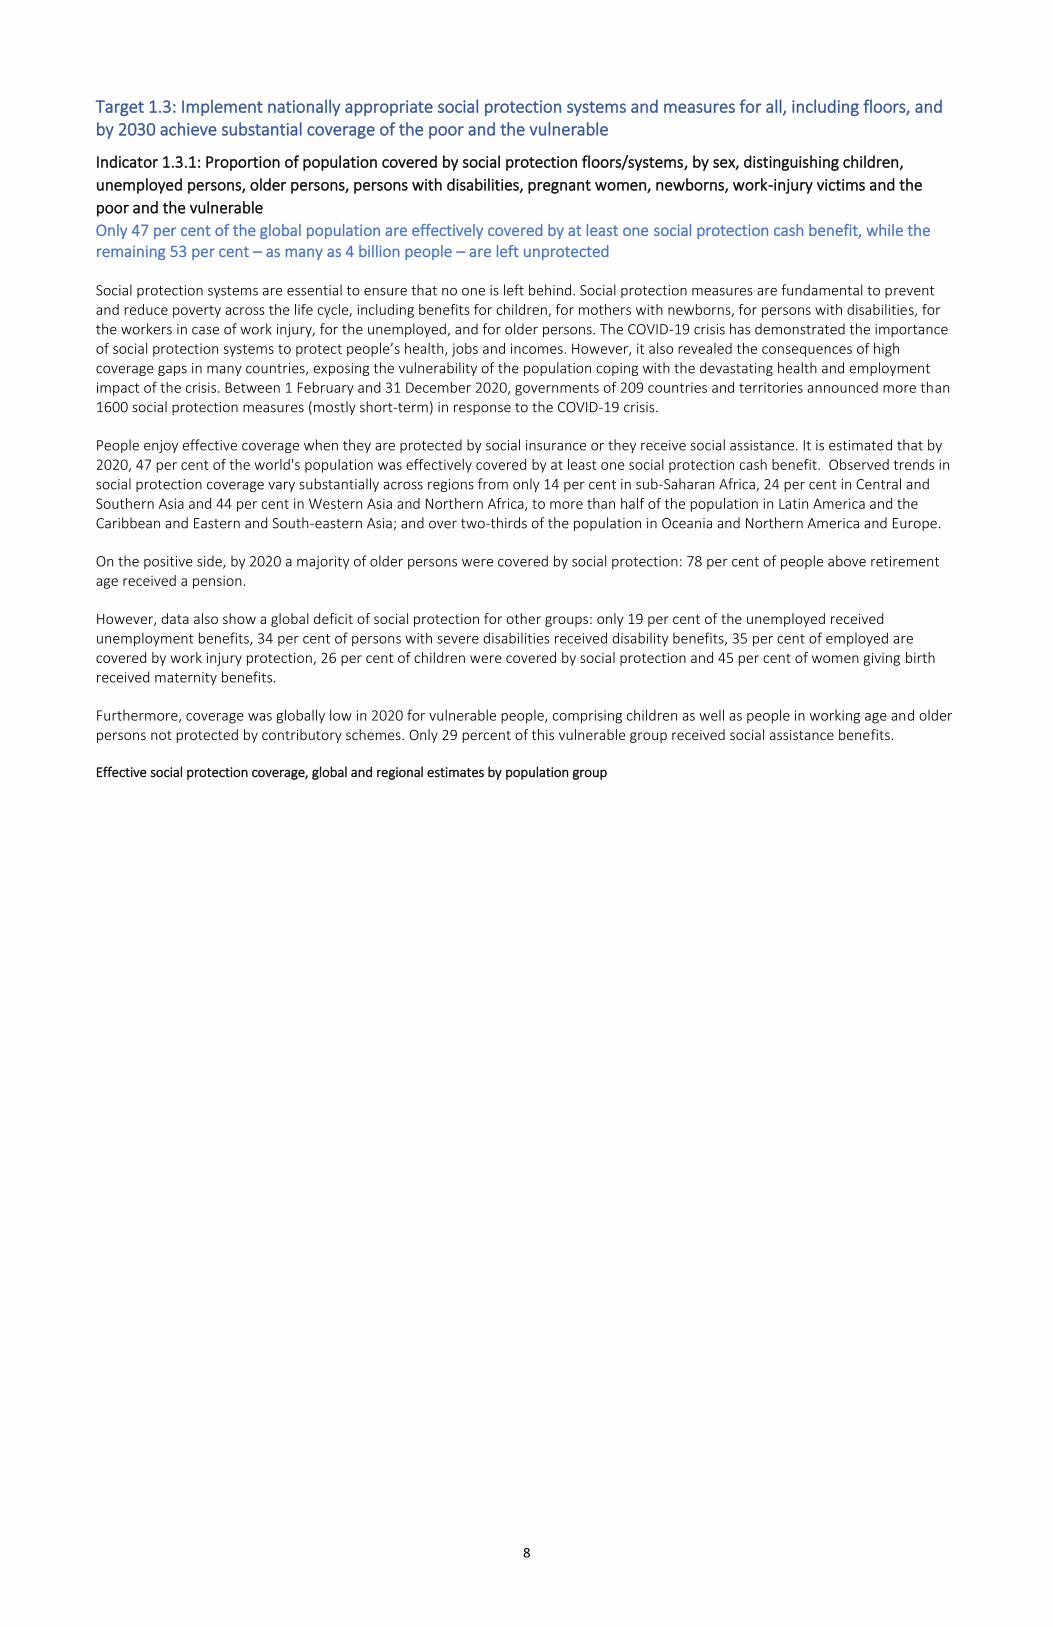
People enjoy effective coverage when they are protected by social insurance or they receive social assistance. It is estimated that by 2020, 47 per cent of the world's population was effectively covered by at least one social protection cash benefit. Observed trends in social protection coverage vary substantially across regions from only 14 per cent in sub-Saharan Africa, 24 per cent in Central and Southern Asia and 44 per cent in Western Asia and Northern Africa, to more than half of the population in Latin America and the Caribbean and Eastern and South-eastern Asia; and over two-thirds of the population in Oceania and Northern America and Europe.
On the positive side, by 2020 a majority of older persons were covered by social protection: 78 per cent of people above retirement age received a pension.
However, data also show a global deficit of social protection for other groups: only 19 per cent of the unemployed received unemployment benefits, 34 per cent of persons with severe disabilities received disability benefits, 35 per cent of employed are covered by work injury protection, 26 per cent of children were covered by social protection and 45 per cent of women giving birth received maternity benefits.
Furthermore, coverage was globally low in 2020 for vulnerable people, comprising children as well as people in working age and older persons not protected by contributory schemes. Only 29 percent of this vulnerable group received social assistance benefits.
Effective social protection coverage, global and regional estimates by population group
9
Note: SA refers to social assistance only; SP refers to social protection. Coverage for 2020 does not include temporary measures introduced in response to COVID-19 crisis; Source: ILO estimates based on national data.
Progress analysis: See progress chart
Additional resources, press releases, etc. with links:
• World Social Protection Report data and figures (https://wspr.social-protection.org to be updated 1 September 2021)
• World Social Protection Data Dashboards (https://wspdb.social-protection.org)
• Social Protection Monitor (https://www.social-protection.org/gimi/ShowWiki.action?id=3417)
Storyline author(s)/contributor(s):
Fabio Duran, Valeria Nesterenko, Zhiming Yu
There has never been a more critical time for investments in social protection. Effective social protection systems are crucial to fight extreme poverty and safeguard the poor and vulnerable against crises such as COVID-19, climate-related hazards and other shocks and disasters
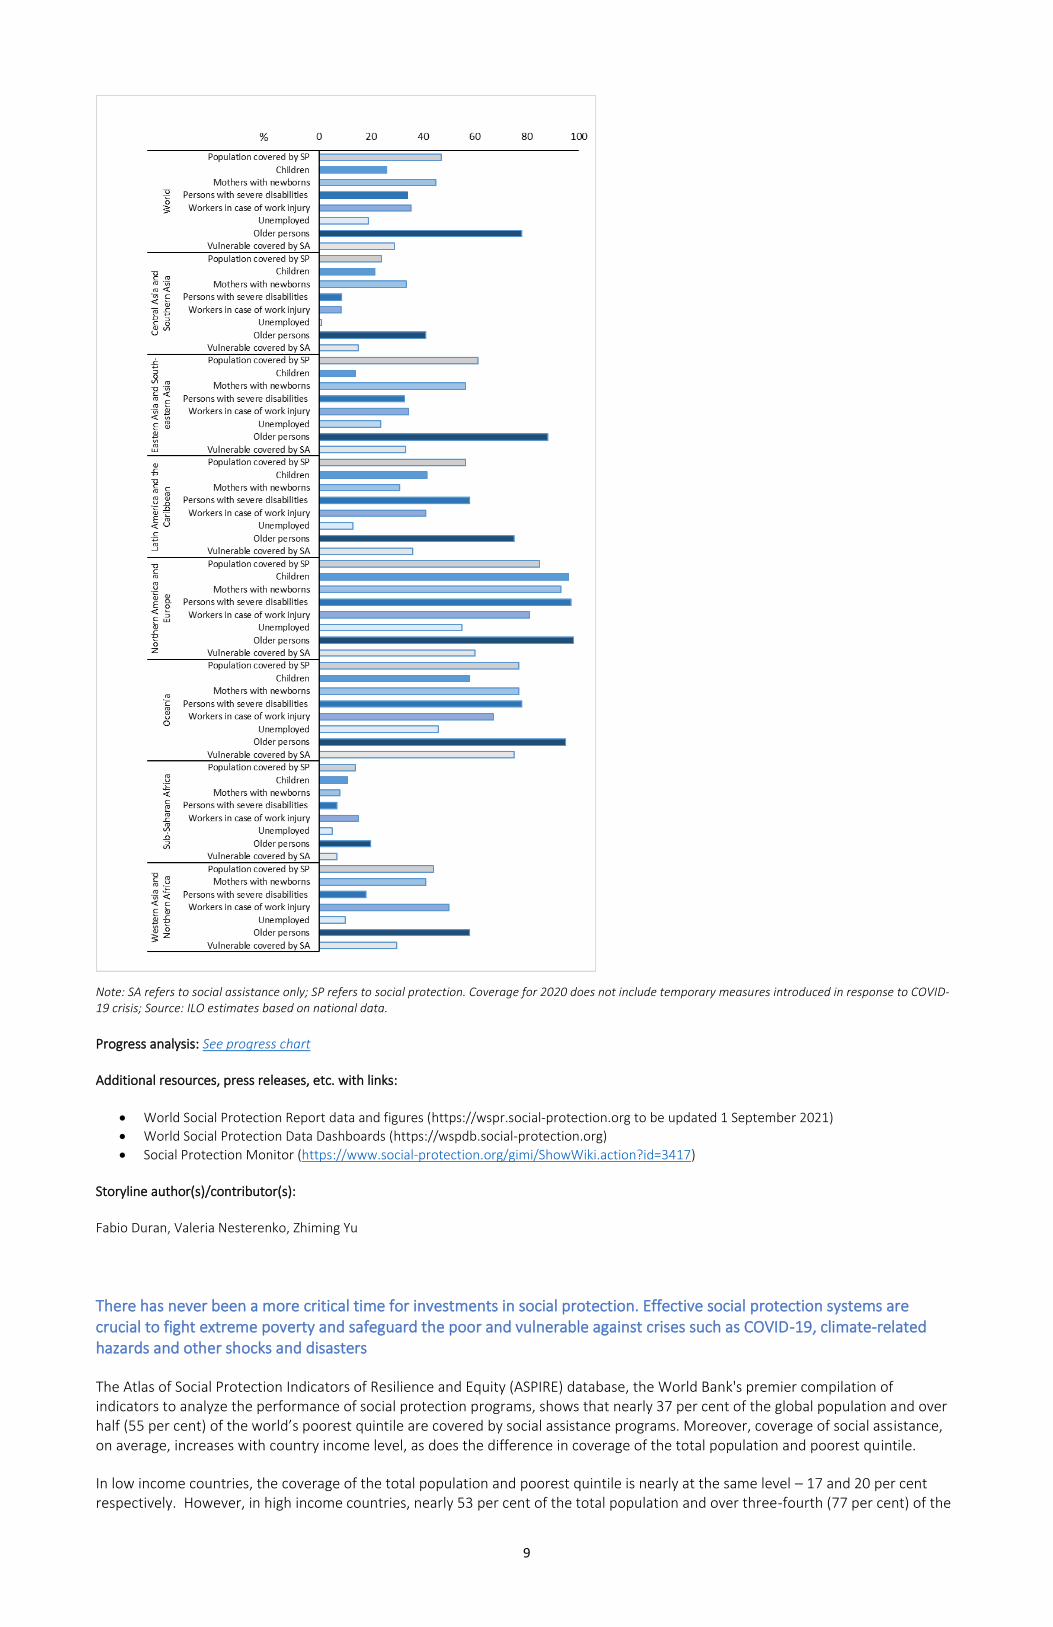
The Atlas of Social Protection Indicators of Resilience and Equity (ASPIRE) database, the World Bank's premier compilation of indicators to analyze the performance of social protection programs, shows that nearly 37 per cent of the global population and over half (55 per cent) of the world’s poorest quintile are covered by social assistance programs. Moreover, coverage of social assistance, on average, increases with country income level, as does the difference in coverage of the total population and poorest quintile.
In low income countries, the coverage of the total population and poorest quintile is nearly at the same level – 17 and 20 per cent respectively. However, in high income countries, nearly 53 per cent of the total population and over three-fourth (77 per cent) of the
10
poor are covered by social assistance – a difference of 24 percentage points. While countries within the same income group may have considerably different rates of coverage, the broader picture shows that the level of income plays a significant role in driving social assistance.
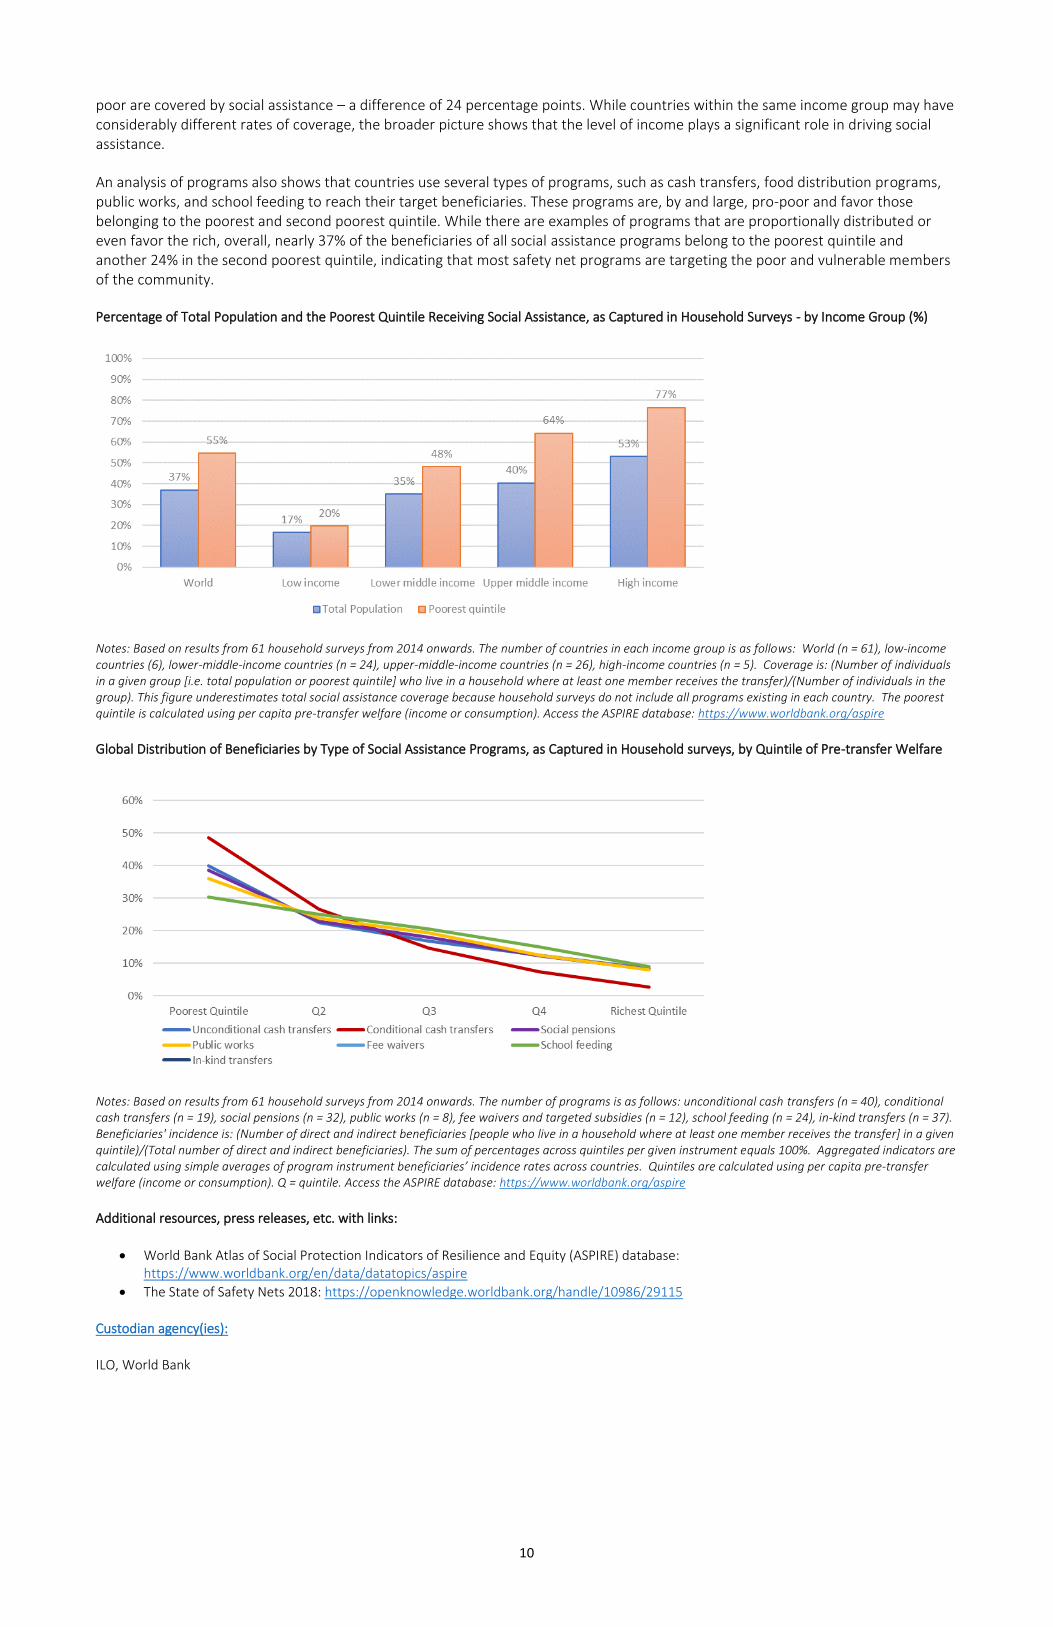
An analysis of programs also shows that countries use several types of programs, such as cash transfers, food distribution programs, public works, and school feeding to reach their target beneficiaries. These programs are, by and large, pro-poor and favor those belonging to the poorest and second poorest quintile. While there are examples of programs that are proportionally distributed or even favor the rich, overall, nearly 37% of the beneficiaries of all social assistance programs belong to the poorest quintile and another 24% in the second poorest quintile, indicating that most safety net programs are targeting the poor and vulnerable members of the community.
Percentage of Total Population and the Poorest Quintile Receiving Social Assistance, as Captured in Household Surveys - by Income Group (%)
Notes: Based on results from 61 household surveys from 2014 onwards. The number of countries in each income group is as follows: World (n = 61), low-income countries (6), lower-middle-income countries (n = 24), upper-middle-income countries (n = 26), high-income countries (n = 5). Coverage is: (Number of individuals in a given group [i.e. total population or poorest quintile] who live in a household where at least one member receives the transfer)/(Number of individuals in the group). This figure underestimates total social assistance coverage because household surveys do not include all programs existing in each country. The poorest quintile is calculated using per capita pre-transfer welfare (income or consumption). Access the ASPIRE database: https://www.worldbank.org/aspire
Global Distribution of Beneficiaries by Type of Social Assistance Programs, as Captured in Household surveys, by Quintile of Pre-transfer Welfare
Notes: Based on results from 61 household surveys from 2014 onwards. The number of programs is as follows: unconditional cash transfers (n = 40), conditional cash transfers (n = 19), social pensions (n = 32), public works (n = 8), fee waivers and targeted subsidies (n = 12), school feeding (n = 24), in-kind transfers (n = 37). Beneficiaries' incidence is: (Number of direct and indirect beneficiaries [people who live in a household where at least one member receives the transfer] in a given quintile)/(Total number of direct and indirect beneficiaries). The sum of percentages across quintiles per given instrument equals 100%. Aggregated indicators are calculated using simple averages of program instrument beneficiaries’ incidence rates across countries. Quintiles are calculated using per capita pre-transfer welfare (income or consumption). Q = quintile. Access the ASPIRE database: https://www.worldbank.org/aspire
Additional resources, press releases, etc. with links:
• World Bank Atlas of Social Protection Indicators of Resilience and Equity (ASPIRE) database: https://www.worldbank.org/en/data/datatopics/aspire
• The State of Safety Nets 2018: https://openknowledge.worldbank.org/handle/10986/29115
Custodian agency(ies):
ILO, World Bank
11
Target 1.4: By 2030, ensure that all men and women, in particular the poor and the vulnerable, have equal rights to economic resources, as well as access to basic services, ownership and control over land and other forms of property, inheritance, natural resources, appropriate new technology and financial services, including microfinance
Indicator 1.4.1: Proportion of population living in households with access to basic services
Custodian agency(ies):
UN-Habitat
12
Indicator 1.4.2: Proportion of total adult population with secure tenure rights to land, (a) with legally recognized
documentation, and (b) who perceive their rights to land as secure, by sex and type of tenure
Custodian agency(ies):
World Bank, UN-Habitat
13
Target 1.5: By 2030, build the resilience of the poor and those in vulnerable situations and reduce their exposure and vulnerability to climate-related extreme events and other economic, social and environmental shocks and disasters
Indicator 1.5.1/11.5.1/13.1.1: Number of deaths, missing persons and directly affected persons attributed to disasters per
100,000 population
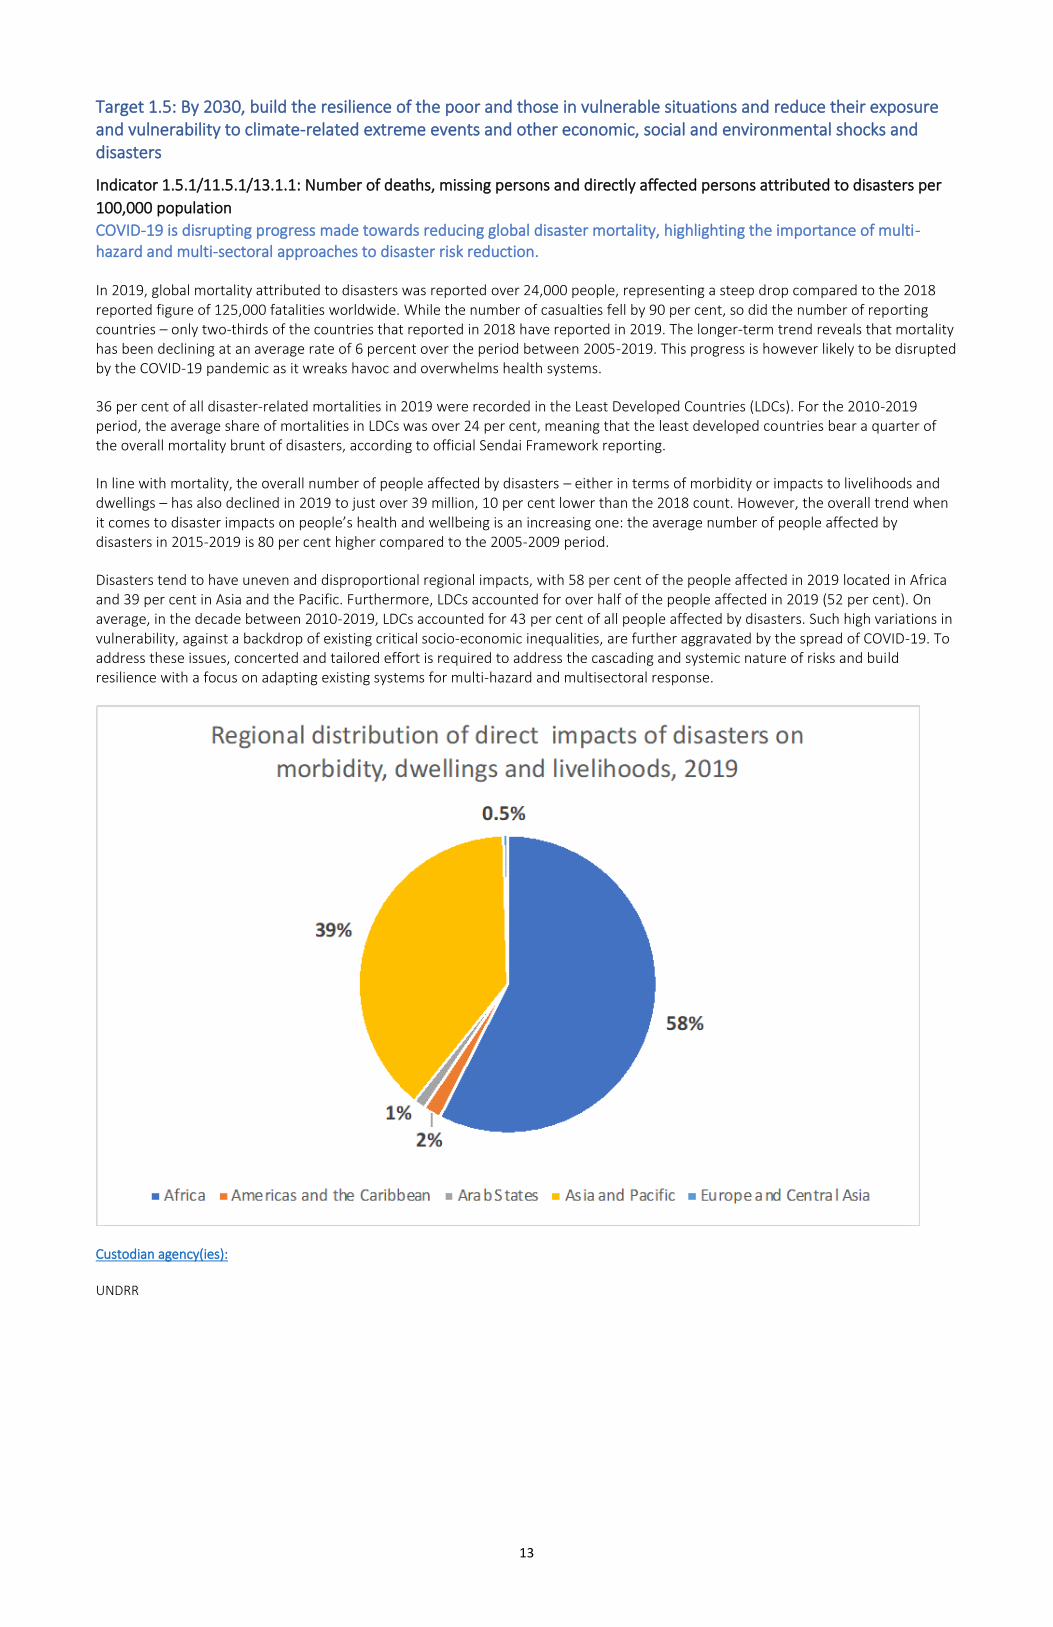
COVID-19 is disrupting progress made towards reducing global disaster mortality, highlighting the importance of multi-hazard and multi-sectoral approaches to disaster risk reduction.
In 2019, global mortality attributed to disasters was reported over 24,000 people, representing a steep drop compared to the 2018 reported figure of 125,000 fatalities worldwide. While the number of casualties fell by 90 per cent, so did the number of reporting countries – only two-thirds of the countries that reported in 2018 have reported in 2019. The longer-term trend reveals that mortality has been declining at an average rate of 6 percent over the period between 2005-2019. This progress is however likely to be disrupted by the COVID-19 pandemic as it wreaks havoc and overwhelms health systems.
36 per cent of all disaster-related mortalities in 2019 were recorded in the Least Developed Countries (LDCs). For the 2010-2019 period, the average share of mortalities in LDCs was over 24 per cent, meaning that the least developed countries bear a quarter of the overall mortality brunt of disasters, according to official Sendai Framework reporting.
In line with mortality, the overall number of people affected by disasters – either in terms of morbidity or impacts to livelihoods and dwellings – has also declined in 2019 to just over 39 million, 10 per cent lower than the 2018 count. However, the overall trend when it comes to disaster impacts on people’s health and wellbeing is an increasing one: the average number of people affected by disasters in 2015-2019 is 80 per cent higher compared to the 2005-2009 period.
Disasters tend to have uneven and disproportional regional impacts, with 58 per cent of the people affected in 2019 located in Africa and 39 per cent in Asia and the Pacific. Furthermore, LDCs accounted for over half of the people affected in 2019 (52 per cent). On average, in the decade between 2010-2019, LDCs accounted for 43 per cent of all people affected by disasters. Such high variations in vulnerability, against a backdrop of existing critical socio-economic inequalities, are further aggravated by the spread of COVID-19. To address these issues, concerted and tailored effort is required to address the cascading and systemic nature of risks and build resilience with a focus on adapting existing systems for multi-hazard and multisectoral response.
Custodian agency(ies):
UNDRR
14
Indicator 1.5.2: Direct economic loss attributed to disasters in relation to global gross domestic product (GDP)
The adverse effects of disasters are stifling economic development and require more ambitious disaster risk reduction action to meet SDG 1 within deadline.
The adverse impacts of disasters on socio-economic systems pose a major obstacle to poverty reduction. The effects of the COVID-19 pandemic are further inverting development trajectories and stunting economic growth. With its cascading and devastating impacts across entire economies, COVID-19 demonstrates the interconnected nature of risk today, highlighting the urgent need for a concerted global effort to accelerate risk reduction activities through collective commitments.
Based on the latest reporting under the Sendai Framework monitoring process, direct economic loss of USD 70.4 billion was reported by 53 countries in 2019, compared with reported disaster losses of USD 24 billion globally in 2018.
60 per cent of the overall disaster impact in 2019 (USD 42.5 billion) was recorded in the agricultural sector. The significance of this share is underscored by agriculture’s importance for the economic development of many countries across the globe, its innate interactions with the environment and direct reliance on natural resources. Urgent and ambitious action is needed to build more resilient agricultural systems.
Custodian agency(ies):
UNDRR
15
Indicator 1.5.3/11.b.1/13.1.2: Number of countries that adopt and implement national disaster risk reduction strategies in
line with the Sendai Framework for Disaster Risk Reduction 2015–2030
Indicator 1.5.4/11.b.2/13.1.3: Proportion of local governments that adopt and implement local disaster risk reduction
strategies in line with national disaster risk reduction strategies
The adoption and implementation of robust disaster risk reduction strategies, which incorporate biological risks such as pandemics, is critical. In order maintain progress on the 2020 deadline for this target, efforts need to be stepped up and drastically accelerated.
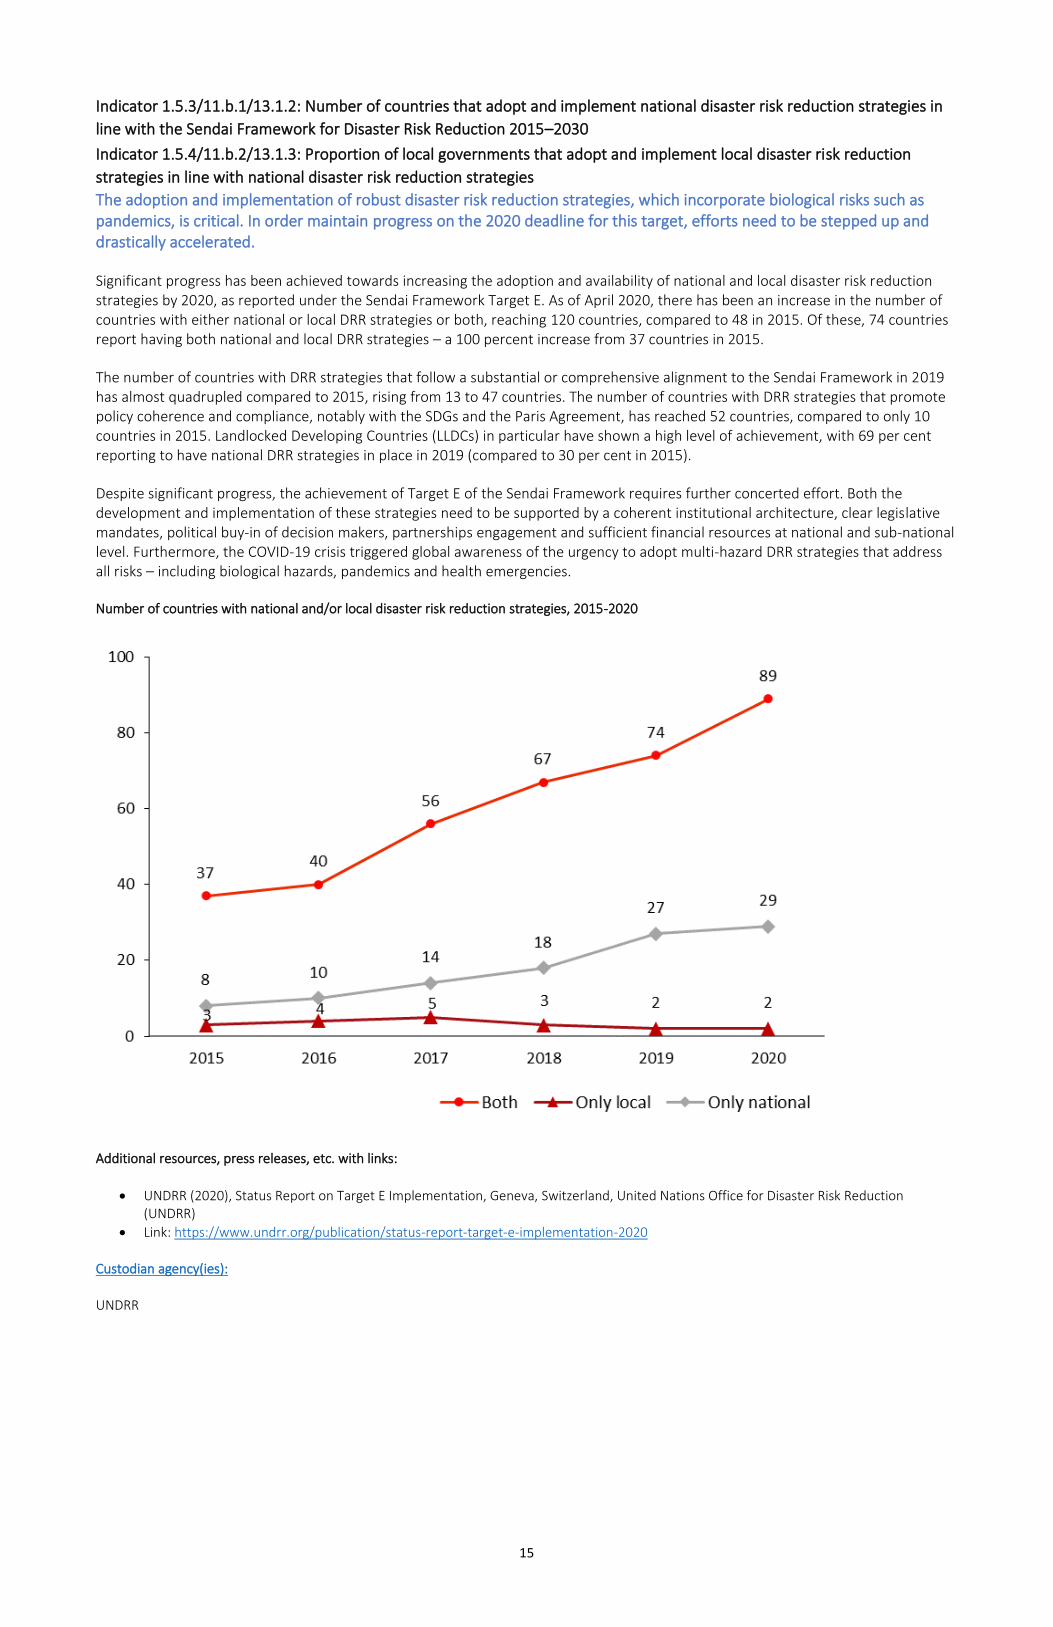
Significant progress has been achieved towards increasing the adoption and availability of national and local disaster risk reduction strategies by 2020, as reported under the Sendai Framework Target E. As of April 2020, there has been an increase in the number of countries with either national or local DRR strategies or both, reaching 120 countries, compared to 48 in 2015. Of these, 74 countries report having both national and local DRR strategies – a 100 percent increase from 37 countries in 2015.
The number of countries with DRR strategies that follow a substantial or comprehensive alignment to the Sendai Framework in 2019 has almost quadrupled compared to 2015, rising from 13 to 47 countries. The number of countries with DRR strategies that promote policy coherence and compliance, notably with the SDGs and the Paris Agreement, has reached 52 countries, compared to only 10 countries in 2015. Landlocked Developing Countries (LLDCs) in particular have shown a high level of achievement, with 69 per cent reporting to have national DRR strategies in place in 2019 (compared to 30 per cent in 2015).
Despite significant progress, the achievement of Target E of the Sendai Framework requires further concerted effort. Both the development and implementation of these strategies need to be supported by a coherent institutional architecture, clear legislative mandates, political buy-in of decision makers, partnerships engagement and sufficient financial resources at national and sub-national level. Furthermore, the COVID-19 crisis triggered global awareness of the urgency to adopt multi-hazard DRR strategies that address all risks – including biological hazards, pandemics and health emergencies.
Number of countries with national and/or local disaster risk reduction strategies, 2015-2020
Additional resources, press releases, etc. with links:
• UNDRR (2020), Status Report on Target E Implementation, Geneva, Switzerland, United Nations Office for Disaster Risk Reduction (UNDRR)
• Link: https://www.undrr.org/publication/status-report-target-e-implementation-2020
Custodian agency(ies):
UNDRR
16
Target 1.a: Ensure significant mobilization of resources from a variety of sources, including through enhanced development cooperation, in order to provide adequate and predictable means for developing countries, in particular least developed countries, to implement programmes and policies to end poverty in all its dimensions
Indicator 1.a.1: Total official development assistance grants from all donors that focus on poverty reduction as a share of
the recipient country’s gross national income Total Official Development Assistance (ODA) grants for basic social services and development food aid, which focus on poverty reduction, represented 0.02 per cent of Development Assistance Committee (DAC) donors’ gross national income in 2019.
From a recipient country’s perspective, this was 0.06 per cent of developing countries’ combined GNI. The following countries received the highest share of grants which focus on poverty reduction: Burundi (5.7 per cent), Malawi (4.7 per cent), Liberia (3.8 per cent), Central African Republic (3.8 per cent) and Kiribati (3.1 per cent).
Custodian agency(ies):
OECD
17
Indicator 1.a.2: Proportion of total government spending on essential services (education, health and social protection) According to the latest data available, which refer to 2019, one year before the COVID-19 outbreak, the proportion of total government expenditure on education varies across countries, with the lowest shares found in sub-Saharan Africa, Eastern and South-Eastern Asia, Latin America and the Caribbean, Northern Africa and Western Asia, and Europe and Northern America. Only 30 per cent of all countries with data for 2015 or later spend between 15 per cent and 20 per cent of total government expenditure on education as recommended in the Education 2030 Framework for Action. By region, the median value of the indicator is 10.4 per cent in Northern Africa and Western Asia, 11.9 per cent in Europe and Northern America, 12.6 per cent in Eastern and South-Eastern Asia, 13.6 per cent in Oceania, 15.7 per cent in Central and Southern Asia, 16.3 per cent in Latin America and the Caribbean, and 16.8 per cent in sub-Saharan Africa. With the outbreak of the COVID-19 pandemic in 2020, and the subsequent economic shock, public sector resources have been globally affected, likely leading to a downturn in the proportion of government spending on essential services, including education. The extent of cuts to national education budgets due to COVID-19 is unknown at this point.
Custodian agency(ies):
Under discussion among agencies (ILO, UNESCO-UIS, WHO)
18
Target 1.b: Create sound policy frameworks at the national, regional and international levels, based on pro-poor and gender-sensitive development strategies, to support accelerated investment in poverty eradication actions
Indicator 1.b.1: Pro-poor public social spending Custodian agency(ies):
UNICEF