Embed Size (px)
Citation preview
© Psychometrics Ltd.
DECISION MAKER
360° EXTENDED REPORT
(ANONYMOUS)
360° APPRAISALAPPRAISAL
360°
Sam Sample

2
© Psychometrics Ltd.
Decision Maker | 360° Extended Report (Anonymous)
Sam Sample | [email protected]
360° appraisals compare an individual's self ratings on a number of behavioural competencies to the ratings
provided by other individuals who regularly interact with them at work. These "raters" are grouped by the
nature of their relationship with the individual being appraised to be a manager a peer, a direct report or other
key stakeholders such as clients.
The results are based on the questionnaires completed by Sam and the various raters involved in the 360°
appraisal. The questionnaires focused on Sam's behaviour in the workplace and the way he performs in relation
to the competencies being measured.
The information contained in this report provides insight into Sam's strengths and weaknesses within the
competencies as well as any differences that might exist between his perception of his behaviour and that of
others. The information can be used to enhance his self-awareness and engage him in his personal and
professional development.
ABOUT THE PSYTECH 360° APPRAISAL
3
© Psychometrics Ltd.
Decision Maker | 360° Extended Report (Anonymous)
Sam Sample | [email protected]
This report focuses on providing a comprehensive summary of the information gained from the 360° appraisal.
REPORT SECTIONS
Sam Sample's results are presented in the following sections:
Overall Summary
Shows Sam's self ratings as well as the ratings provided by others raters according to their relationship to Sam.
Category Overviews
Provides further details regarding the competency categories and behavioural competencies being measured
within each category. These sections also provide the highest and lowest rated items per competency
category.
Perception Gaps
Gives an overall view of the level of agreement between Sam's perception of himself and how he is viewed by
the other rater groups.
SUPPLEMENTARY REPORTS
The information gained from this report can be used in conjunction with other supplementary reports. The
supplementary reports available are:
Feedback Report
This supplementary report is similar to the Standard Report though conceals raters' identities and can be shared
directly with the individual being assessed.
Development Planning Report
Provides a general framework for development as well as development forms. Training and development
experts can work with individuals to explore performance gaps and define development goals based on the
results of the 360° appraisal.
Results Spread Sheet
Presents the group average scores for each of the questionnaire's items as well as the level of rater agreement.
This information is provided in a supplementary spread sheet since it is not intended for general feedback.
The Psytech 360° appraisal is an instrument designed to provide a focus about specific behavioural
competency strengths and development needs. It should not be used as the sole source of information
concerning personnel actions including promotion, salary review, or termination. The authors and
distributors accept no responsibility for decisions made using this tool and cannot be held liable for the
consequences of those decisions.
DISCLAIMER
GUIDE TO USING PSYTECH'S 360° REPORT
4
© Psychometrics Ltd.
Decision Maker | 360° Extended Report (Anonymous)
Sam Sample | [email protected]
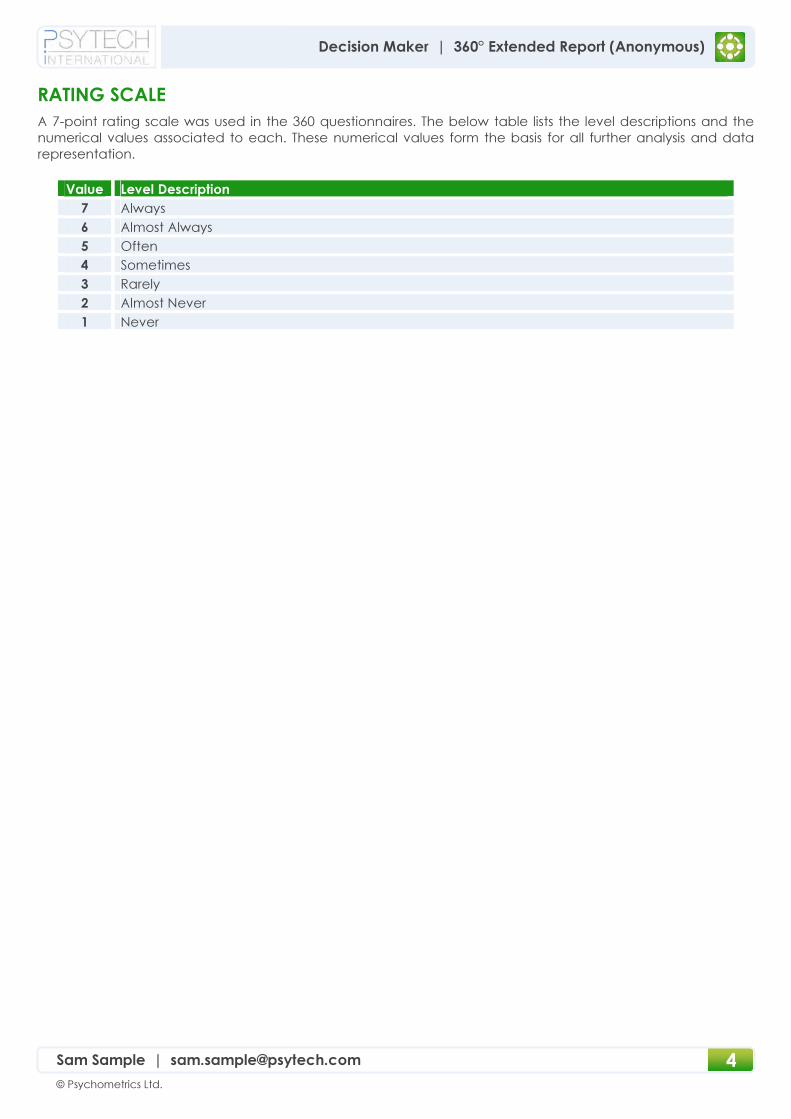
RATING SCALE
A 7-point rating scale was used in the 360 questionnaires. The below table lists the level descriptions and the
numerical values associated to each. These numerical values form the basis for all further analysis and data
representation.
Value Level Description
7 Always
6 Almost Always
5 Often
4 Sometimes
3 Rarely
2 Almost Never
1 Never
5
© Psychometrics Ltd.
Decision Maker | 360° Extended Report (Anonymous)
Sam Sample | [email protected]
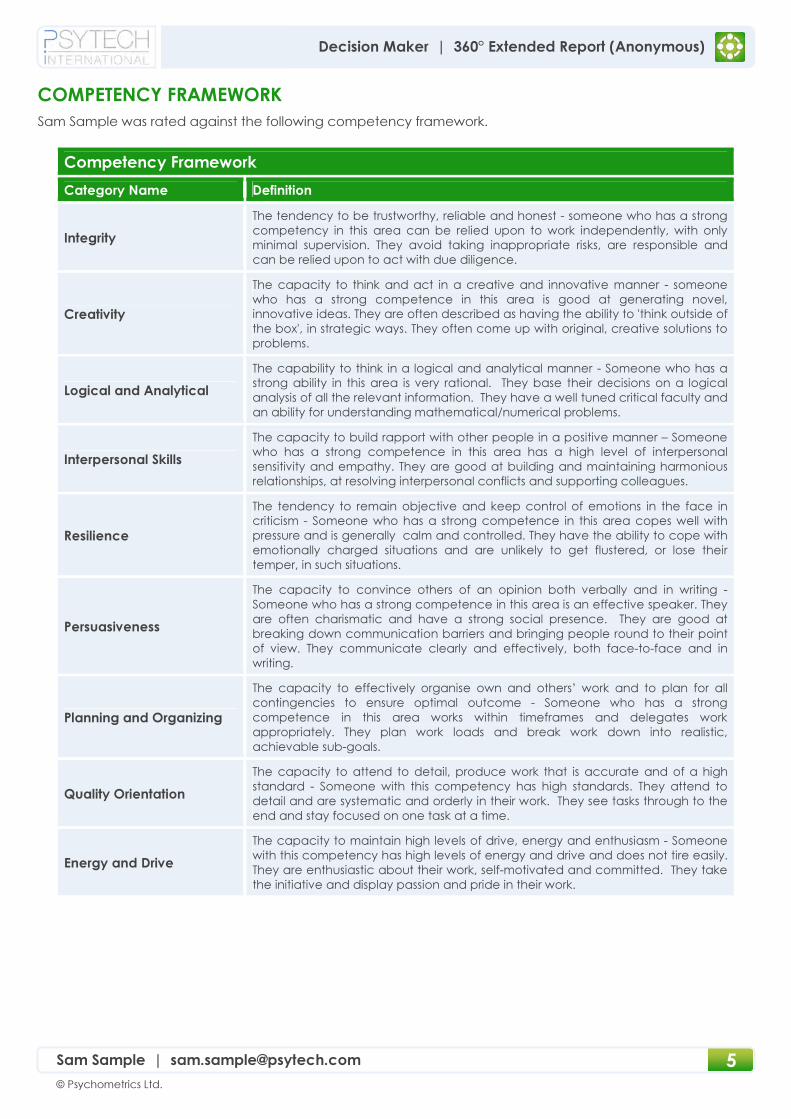
COMPETENCY FRAMEWORK
Sam Sample was rated against the following competency framework.
Competency Framework
Category Name Definition
Integrity
The tendency to be trustworthy, reliable and honest - someone who has a strong
competency in this area can be relied upon to work independently, with only
minimal supervision. They avoid taking inappropriate risks, are responsible and
can be relied upon to act with due diligence.
Creativity
The capacity to think and act in a creative and innovative manner - someone
who has a strong competence in this area is good at generating novel,
innovative ideas. They are often described as having the ability to 'think outside of
the box', in strategic ways. They often come up with original, creative solutions to
problems.
Logical and Analytical
The capability to think in a logical and analytical manner - Someone who has a
strong ability in this area is very rational. They base their decisions on a logical
analysis of all the relevant information. They have a well tuned critical faculty and
an ability for understanding mathematical/numerical problems.
Interpersonal Skills
The capacity to build rapport with other people in a positive manner – Someone
who has a strong competence in this area has a high level of interpersonal
sensitivity and empathy. They are good at building and maintaining harmonious
relationships, at resolving interpersonal conflicts and supporting colleagues.
Resilience
The tendency to remain objective and keep control of emotions in the face in
criticism - Someone who has a strong competence in this area copes well with
pressure and is generally calm and controlled. They have the ability to cope with
emotionally charged situations and are unlikely to get flustered, or lose their
temper, in such situations.
Persuasiveness
The capacity to convince others of an opinion both verbally and in writing -
Someone who has a strong competence in this area is an effective speaker. They
are often charismatic and have a strong social presence. They are good at
breaking down communication barriers and bringing people round to their point
of view. They communicate clearly and effectively, both face-to-face and in
writing.
Planning and Organizing
The capacity to effectively organise own and others’ work and to plan for all
contingencies to ensure optimal outcome - Someone who has a strong
competence in this area works within timeframes and delegates work
appropriately. They plan work loads and break work down into realistic,
achievable sub-goals.
Quality Orientation
The capacity to attend to detail, produce work that is accurate and of a high
standard - Someone with this competency has high standards. They attend to
detail and are systematic and orderly in their work. They see tasks through to the
end and stay focused on one task at a time.
Energy and Drive
The capacity to maintain high levels of drive, energy and enthusiasm - Someone
with this competency has high levels of energy and drive and does not tire easily.
They are enthusiastic about their work, self-motivated and committed. They take
the initiative and display passion and pride in their work.
6
© Psychometrics Ltd.
Decision Maker | 360° Extended Report (Anonymous)
Sam Sample | [email protected]
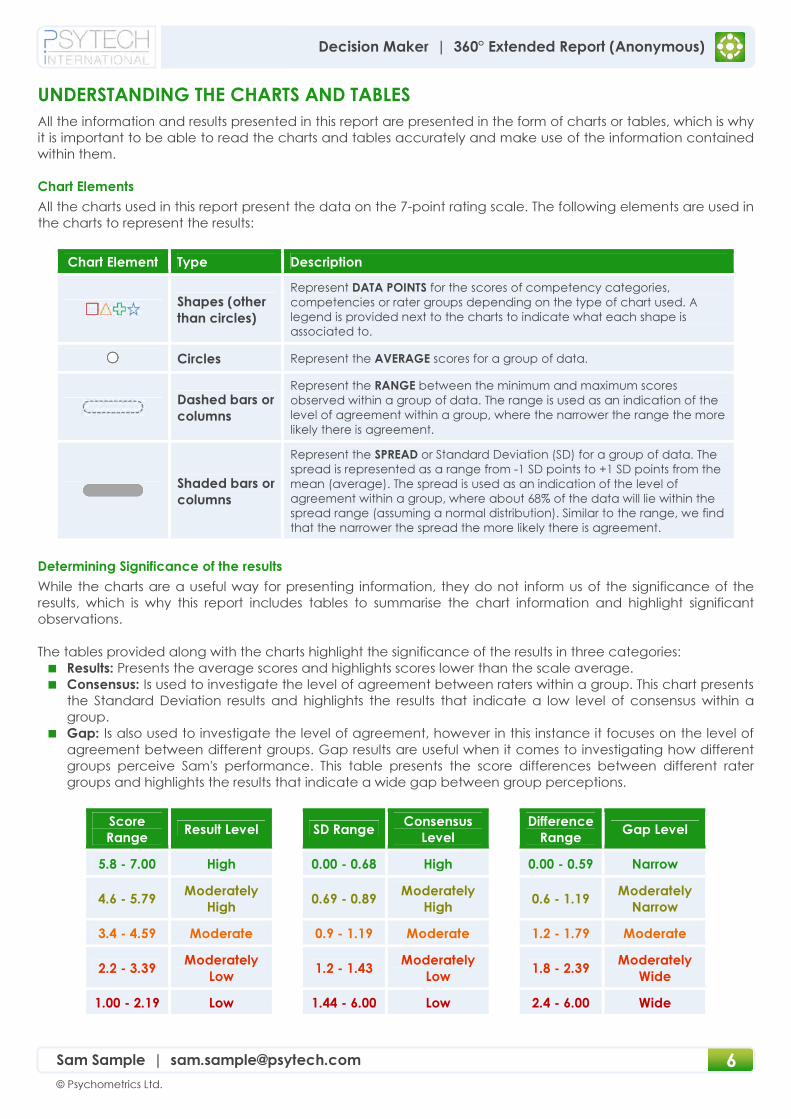
UNDERSTANDING THE CHARTS AND TABLES
All the information and results presented in this report are presented in the form of charts or tables, which is why
it is important to be able to read the charts and tables accurately and make use of the information contained
within them.
Chart Elements
All the charts used in this report present the data on the 7-point rating scale. The following elements are used in
the charts to represent the results:
Chart Element Type Description
Shapes (other
than circles)
Represent DATA POINTS for the scores of competency categories,
competencies or rater groups depending on the type of chart used. A
legend is provided next to the charts to indicate what each shape is
associated to.
Circles Represent the AVERAGE scores for a group of data.
Dashed bars or
columns
Represent the RANGE between the minimum and maximum scores
observed within a group of data. The range is used as an indication of the
level of agreement within a group, where the narrower the range the more
likely there is agreement.
Shaded bars or
columns
Represent the SPREAD or Standard Deviation (SD) for a group of data. The
spread is represented as a range from -1 SD points to +1 SD points from the
mean (average). The spread is used as an indication of the level of
agreement within a group, where about 68% of the data will lie within the
spread range (assuming a normal distribution). Similar to the range, we find
that the narrower the spread the more likely there is agreement.
Determining Significance of the results
While the charts are a useful way for presenting information, they do not inform us of the significance of the
results, which is why this report includes tables to summarise the chart information and highlight significant
observations.
The tables provided along with the charts highlight the significance of the results in three categories:
� Results: Presents the average scores and highlights scores lower than the scale average.
� Consensus: Is used to investigate the level of agreement between raters within a group. This chart presents
the Standard Deviation results and highlights the results that indicate a low level of consensus within a
group.
� Gap: Is also used to investigate the level of agreement, however in this instance it focuses on the level of
agreement between different groups. Gap results are useful when it comes to investigating how different
groups perceive Sam's performance. This table presents the score differences between different rater
groups and highlights the results that indicate a wide gap between group perceptions.
Score
Range Result Level SD Range
Consensus
Level
Difference
Range Gap Level
5.8 - 7.00 High 0.00 - 0.68 High 0.00 - 0.59 Narrow
4.6 - 5.79 Moderately
High 0.69 - 0.89
Moderately
High 0.6 - 1.19
Moderately
Narrow
3.4 - 4.59 Moderate 0.9 - 1.19 Moderate 1.2 - 1.79 Moderate
2.2 - 3.39 Moderately
Low 1.2 - 1.43
Moderately
Low 1.8 - 2.39
Moderately
Wide
1.00 - 2.19 Low 1.44 - 6.00 Low 2.4 - 6.00 Wide
7
© Psychometrics Ltd.
Decision Maker | 360° Extended Report (Anonymous)
Sam Sample | [email protected]
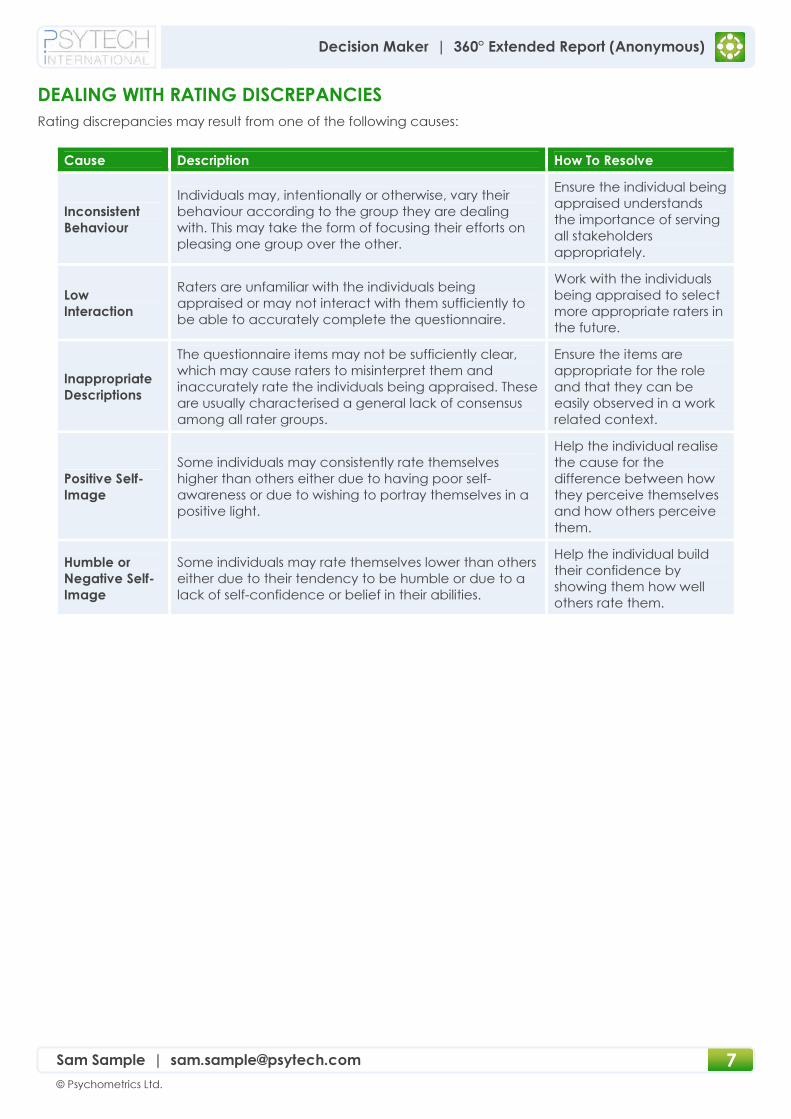
DEALING WITH RATING DISCREPANCIES
Rating discrepancies may result from one of the following causes:
Cause Description How To Resolve
Inconsistent
Behaviour
Individuals may, intentionally or otherwise, vary their
behaviour according to the group they are dealing
with. This may take the form of focusing their efforts on
pleasing one group over the other.
Ensure the individual being
appraised understands
the importance of serving
all stakeholders
appropriately.
Low
Interaction
Raters are unfamiliar with the individuals being
appraised or may not interact with them sufficiently to
be able to accurately complete the questionnaire.
Work with the individuals
being appraised to select
more appropriate raters in
the future.
Inappropriate
Descriptions
The questionnaire items may not be sufficiently clear,
which may cause raters to misinterpret them and
inaccurately rate the individuals being appraised. These
are usually characterised a general lack of consensus
among all rater groups.
Ensure the items are
appropriate for the role
and that they can be
easily observed in a work
related context.
Positive Self-
Image
Some individuals may consistently rate themselves
higher than others either due to having poor self-
awareness or due to wishing to portray themselves in a
positive light.
Help the individual realise
the cause for the
difference between how
they perceive themselves
and how others perceive
them.
Humble or
Negative Self-
Image
Some individuals may rate themselves lower than others
either due to their tendency to be humble or due to a
lack of self-confidence or belief in their abilities.
Help the individual build
their confidence by
showing them how well
others rate them.
8
© Psychometrics Ltd.
Decision Maker | 360° Extended Report (Anonymous)
Sam Sample | [email protected]
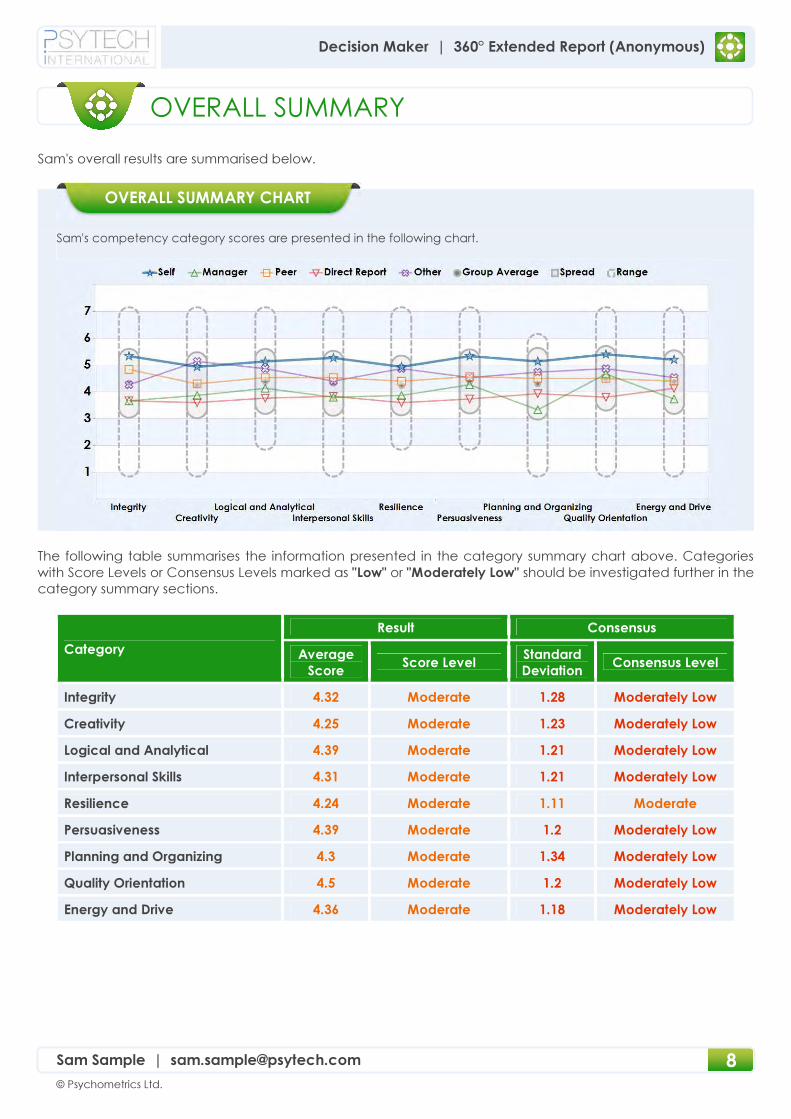
Sam's overall results are summarised below.
Sam's competency category scores are presented in the following chart.
The following table summarises the information presented in the category summary chart above. Categories
with Score Levels or Consensus Levels marked as "Low" or "Moderately Low" should be investigated further in the
category summary sections.
Category
Result Consensus
Average
Score Score Level
Standard
Deviation Consensus Level
Integrity 4.32 Moderate 1.28 Moderately Low
Creativity 4.25 Moderate 1.23 Moderately Low
Logical and Analytical 4.39 Moderate 1.21 Moderately Low
Interpersonal Skills 4.31 Moderate 1.21 Moderately Low
Resilience 4.24 Moderate 1.11 Moderate
Persuasiveness 4.39 Moderate 1.2 Moderately Low
Planning and Organizing 4.3 Moderate 1.34 Moderately Low
Quality Orientation 4.5 Moderate 1.2 Moderately Low
Energy and Drive 4.36 Moderate 1.18 Moderately Low
OVERALL SUMMARY CHART
OVERALL SUMMARY
9
© Psychometrics Ltd.
Decision Maker | 360° Extended Report (Anonymous)
Sam Sample | [email protected]
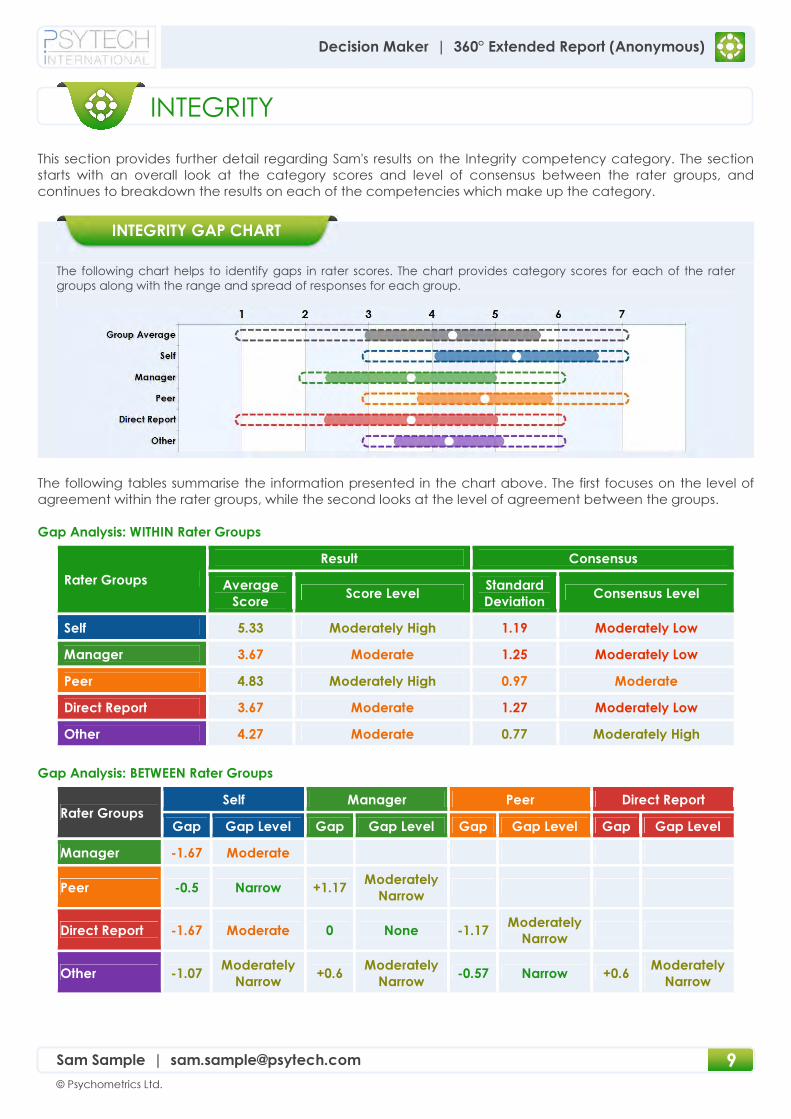
This section provides further detail regarding Sam's results on the Integrity competency category. The section
starts with an overall look at the category scores and level of consensus between the rater groups, and
continues to breakdown the results on each of the competencies which make up the category.
The following chart helps to identify gaps in rater scores. The chart provides category scores for each of the rater
groups along with the range and spread of responses for each group.
The following tables summarise the information presented in the chart above. The first focuses on the level of
agreement within the rater groups, while the second looks at the level of agreement between the groups.
Gap Analysis: WITHIN Rater Groups
Rater Groups
Result Consensus
Average
Score Score Level
Standard
Deviation Consensus Level
Self 5.33 Moderately High 1.19 Moderately Low
Manager 3.67 Moderate 1.25 Moderately Low
Peer 4.83 Moderately High 0.97 Moderate
Direct Report 3.67 Moderate 1.27 Moderately Low
Other 4.27 Moderate 0.77 Moderately High
Gap Analysis: BETWEEN Rater Groups
Rater Groups Self Manager Peer Direct Report
Gap Gap Level Gap Gap Level Gap Gap Level Gap Gap Level
Manager -1.67 Moderate
Peer -0.5 Narrow +1.17 Moderately
Narrow
Direct Report -1.67 Moderate 0 None -1.17 Moderately
Narrow
Other -1.07 Moderately
Narrow +0.6
Moderately
Narrow -0.57 Narrow +0.6
Moderately
Narrow
INTEGRITY GAP CHART
INTEGRITY
10
© Psychometrics Ltd.
Decision Maker | 360° Extended Report (Anonymous)
Sam Sample | [email protected]
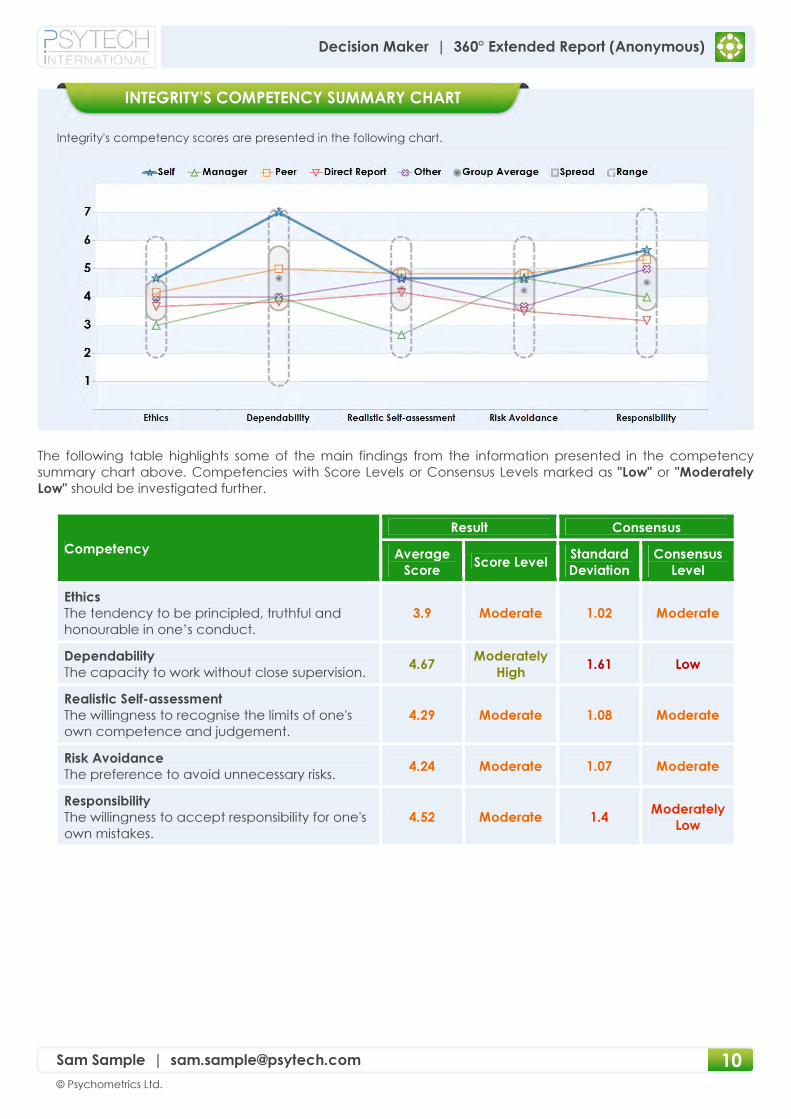
Integrity's competency scores are presented in the following chart.
The following table highlights some of the main findings from the information presented in the competency
summary chart above. Competencies with Score Levels or Consensus Levels marked as "Low" or "Moderately
Low" should be investigated further.
Competency
Result Consensus
Average
Score Score Level
Standard
Deviation
Consensus
Level
Ethics
The tendency to be principled, truthful and
honourable in one’s conduct.
3.9 Moderate 1.02 Moderate
Dependability
The capacity to work without close supervision. 4.67
Moderately
High 1.61 Low
Realistic Self-assessment
The willingness to recognise the limits of one's
own competence and judgement.
4.29 Moderate 1.08 Moderate
Risk Avoidance
The preference to avoid unnecessary risks. 4.24 Moderate 1.07 Moderate
Responsibility
The willingness to accept responsibility for one's
own mistakes.
4.52 Moderate 1.4 Moderately
Low
INTEGRITY'S COMPETENCY SUMMARY CHART
11
© Psychometrics Ltd.
Decision Maker | 360° Extended Report (Anonymous)
Sam Sample | [email protected]
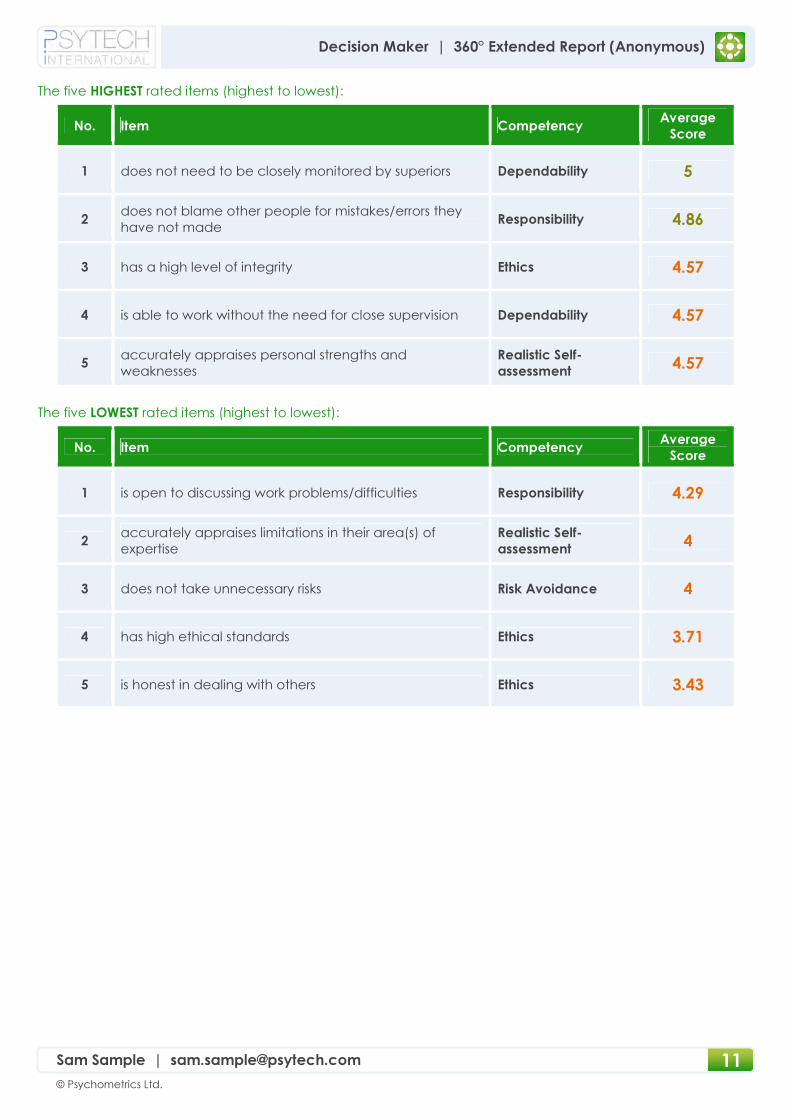
The five HIGHEST rated items (highest to lowest):
No. Item Competency Average
Score
1 does not need to be closely monitored by superiors Dependability 5
2 does not blame other people for mistakes/errors they
have not made Responsibility 4.86
3 has a high level of integrity Ethics 4.57
4 is able to work without the need for close supervision Dependability 4.57
5 accurately appraises personal strengths and
weaknesses
Realistic Self-
assessment 4.57
The five LOWEST rated items (highest to lowest):
No. Item Competency Average
Score
1 is open to discussing work problems/difficulties Responsibility 4.29
2 accurately appraises limitations in their area(s) of
expertise
Realistic Self-
assessment 4
3 does not take unnecessary risks Risk Avoidance 4
4 has high ethical standards Ethics 3.71
5 is honest in dealing with others Ethics 3.43

12
© Psychometrics Ltd.
Decision Maker | 360° Extended Report (Anonymous)
Sam Sample | [email protected]
This section provides further detail regarding Sam's results on the Creativity competency category. The section
starts with an overall look at the category scores and level of consensus between the rater groups, and
continues to breakdown the results on each of the competencies which make up the category.
The following chart helps to identify gaps in rater scores. The chart provides category scores for each of the rater
groups along with the range and spread of responses for each group.
The following tables summarise the information presented in the chart above. The first focuses on the level of
agreement within the rater groups, while the second looks at the level of agreement between the groups.
Gap Analysis: WITHIN Rater Groups
Rater Groups
Result Consensus
Average
Score Score Level
Standard
Deviation Consensus Level
Self 4.93 Moderately High 1 Moderate
Manager 3.87 Moderate 1.15 Moderate
Peer 4.3 Moderate 0.94 Moderate
Direct Report 3.6 Moderate 1.31 Moderately Low
Other 5.13 Moderately High 0.88 Moderate
Gap Analysis: BETWEEN Rater Groups
Rater Groups Self Manager Peer Direct Report
Gap Gap Level Gap Gap Level Gap Gap Level Gap Gap Level
Manager -1.07 Moderately
Narrow
Peer -0.63 Moderately
Narrow +0.43 Narrow
Direct Report -1.33 Moderate -0.27 Narrow -0.7 Moderately
Narrow
Other +0.2 Narrow +1.27 Moderate +0.83 Moderately
Narrow +1.53 Moderate
CREATIVITY GAP CHART
CREATIVITY
13
© Psychometrics Ltd.
Decision Maker | 360° Extended Report (Anonymous)
Sam Sample | [email protected]
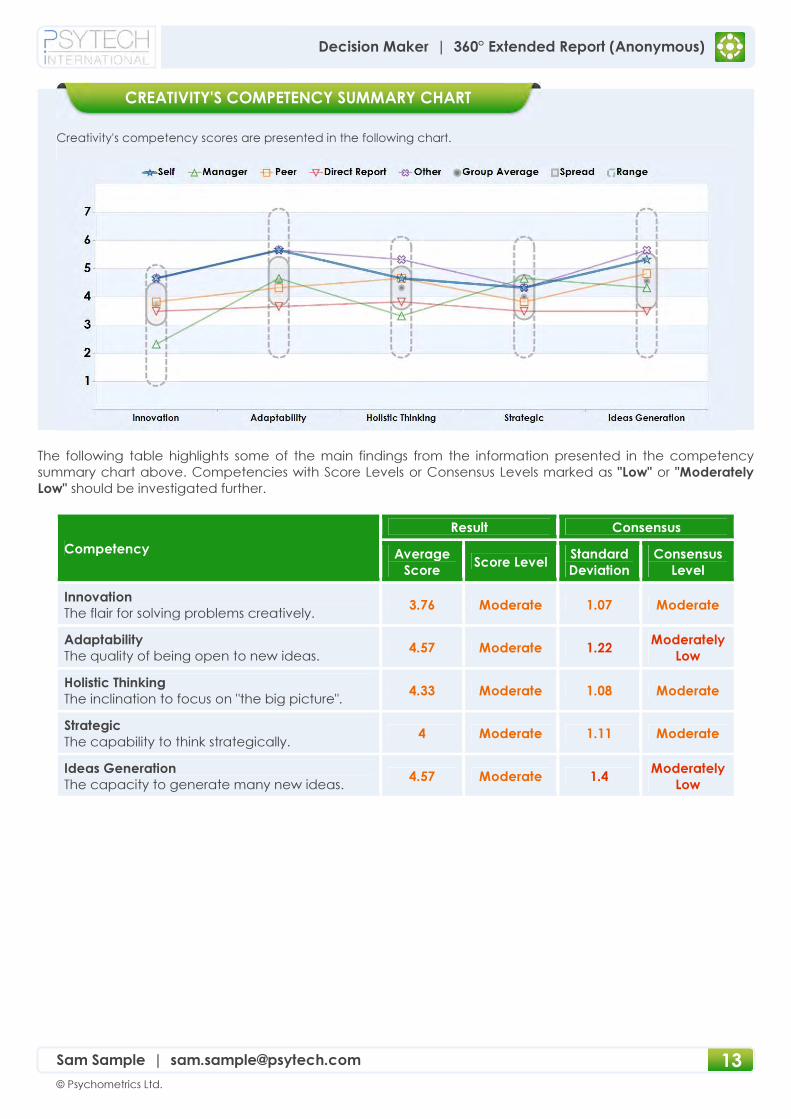
Creativity's competency scores are presented in the following chart.
The following table highlights some of the main findings from the information presented in the competency
summary chart above. Competencies with Score Levels or Consensus Levels marked as "Low" or "Moderately
Low" should be investigated further.
Competency
Result Consensus
Average
Score Score Level
Standard
Deviation
Consensus
Level
Innovation
The flair for solving problems creatively. 3.76 Moderate 1.07 Moderate
Adaptability
The quality of being open to new ideas. 4.57 Moderate 1.22
Moderately
Low
Holistic Thinking
The inclination to focus on "the big picture". 4.33 Moderate 1.08 Moderate
Strategic
The capability to think strategically. 4 Moderate 1.11 Moderate
Ideas Generation
The capacity to generate many new ideas. 4.57 Moderate 1.4
Moderately
Low
CREATIVITY'S COMPETENCY SUMMARY CHART
14
© Psychometrics Ltd.
Decision Maker | 360° Extended Report (Anonymous)
Sam Sample | [email protected]
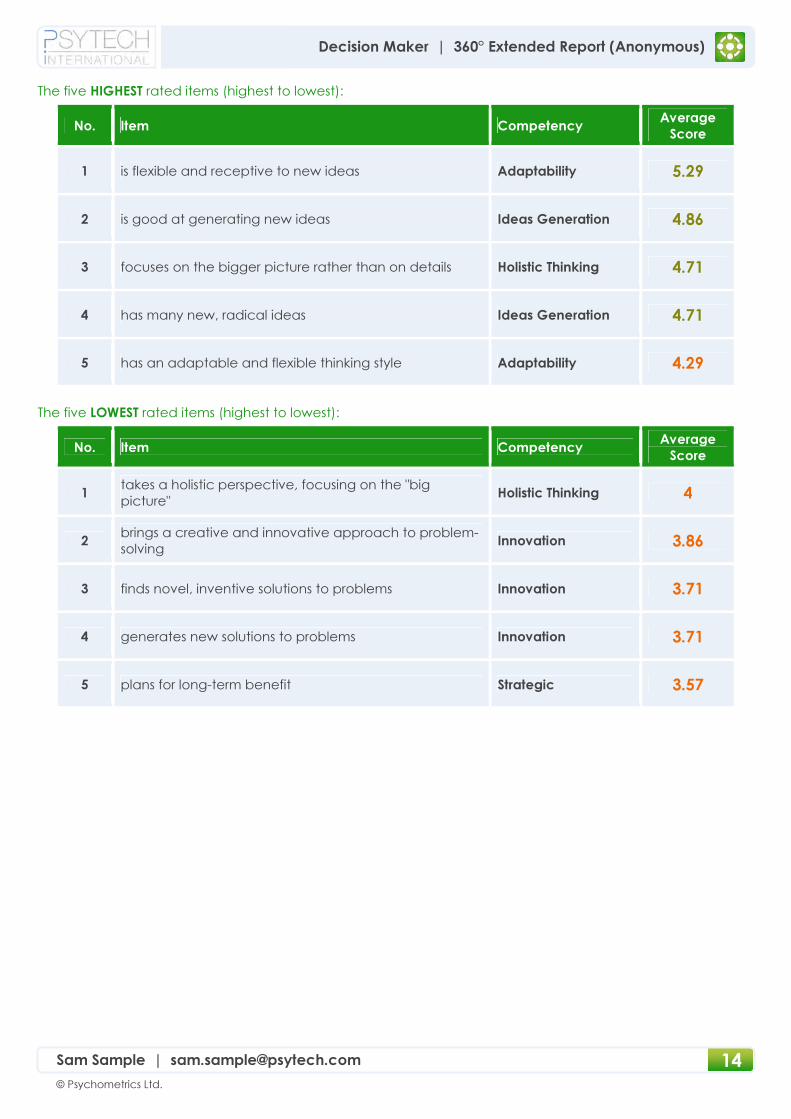
The five HIGHEST rated items (highest to lowest):
No. Item Competency Average
Score
1 is flexible and receptive to new ideas Adaptability 5.29
2 is good at generating new ideas Ideas Generation 4.86
3 focuses on the bigger picture rather than on details Holistic Thinking 4.71
4 has many new, radical ideas Ideas Generation 4.71
5 has an adaptable and flexible thinking style Adaptability 4.29
The five LOWEST rated items (highest to lowest):
No. Item Competency Average
Score
1 takes a holistic perspective, focusing on the "big
picture" Holistic Thinking 4
2 brings a creative and innovative approach to problem-
solving Innovation 3.86
3 finds novel, inventive solutions to problems Innovation 3.71
4 generates new solutions to problems Innovation 3.71
5 plans for long-term benefit Strategic 3.57

15
© Psychometrics Ltd.
Decision Maker | 360° Extended Report (Anonymous)
Sam Sample | [email protected]
This section provides further detail regarding Sam's results on the Logical and Analytical competency category.
The section starts with an overall look at the category scores and level of consensus between the rater groups,
and continues to breakdown the results on each of the competencies which make up the category.
The following chart helps to identify gaps in rater scores. The chart provides category scores for each of the rater
groups along with the range and spread of responses for each group.
The following tables summarise the information presented in the chart above. The first focuses on the level of
agreement within the rater groups, while the second looks at the level of agreement between the groups.
Gap Analysis: WITHIN Rater Groups
Rater Groups
Result Consensus
Average
Score Score Level
Standard
Deviation Consensus Level
Self 5.13 Moderately High 1.09 Moderate
Manager 4.13 Moderate 1.26 Moderately Low
Peer 4.53 Moderate 1.02 Moderate
Direct Report 3.77 Moderate 1.2 Moderately Low
Other 4.87 Moderately High 0.88 Moderate
Gap Analysis: BETWEEN Rater Groups
Rater Groups Self Manager Peer Direct Report
Gap Gap Level Gap Gap Level Gap Gap Level Gap Gap Level
Manager -1 Moderately
Narrow
Peer -0.6 Narrow +0.4 Narrow
Direct Report -1.37 Moderate -0.37 Narrow -0.77 Moderately
Narrow
Other -0.27 Narrow +0.73 Moderately
Narrow +0.33 Narrow +1.1
Moderately
Narrow
LOGICAL AND ANALYTICAL GAP CHART
LOGICAL AND ANALYTICAL

16
© Psychometrics Ltd.
Decision Maker | 360° Extended Report (Anonymous)
Sam Sample | [email protected]
Logical and Analytical's competency scores are presented in the following chart.
The following table highlights some of the main findings from the information presented in the competency
summary chart above. Competencies with Score Levels or Consensus Levels marked as "Low" or "Moderately
Low" should be investigated further.
Competency
Result Consensus
Average
Score Score Level
Standard
Deviation
Consensus
Level
Rationality
The tendency to be logical and analytical. 4.38 Moderate 1 Moderate
Numerical Skills
Having a flair for using number and
mathematics at work.
4.81 Moderately
High 1.29
Moderately
Low
Critical Appraisal
The tendency to critically appraise new
information and ideas.
4 Moderate 0.98 Moderate
Decision making
The capability to make reasoned, sound
decisions.
4.05 Moderate 1.09 Moderate
Analytical
The capacity to identify key issues and
arguments.
4.71 Moderately
High 1.38
Moderately
Low
LOGICAL AND ANALYTICAL'S COMPETENCY SUMMARY CHART
17
© Psychometrics Ltd.
Decision Maker | 360° Extended Report (Anonymous)
Sam Sample | [email protected]
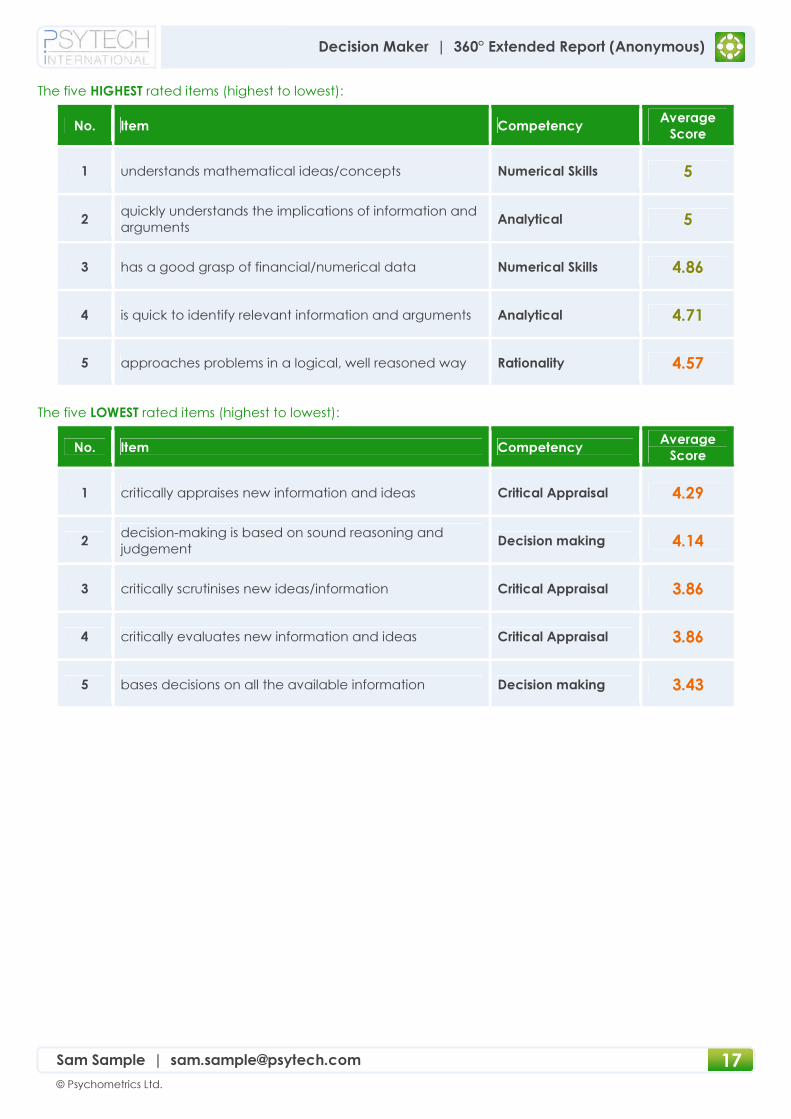
The five HIGHEST rated items (highest to lowest):
No. Item Competency Average
Score
1 understands mathematical ideas/concepts Numerical Skills 5
2 quickly understands the implications of information and
arguments Analytical 5
3 has a good grasp of financial/numerical data Numerical Skills 4.86
4 is quick to identify relevant information and arguments Analytical 4.71
5 approaches problems in a logical, well reasoned way Rationality 4.57
The five LOWEST rated items (highest to lowest):
No. Item Competency Average
Score
1 critically appraises new information and ideas Critical Appraisal 4.29
2 decision-making is based on sound reasoning and
judgement Decision making 4.14
3 critically scrutinises new ideas/information Critical Appraisal 3.86
4 critically evaluates new information and ideas Critical Appraisal 3.86
5 bases decisions on all the available information Decision making 3.43

18
© Psychometrics Ltd.
Decision Maker | 360° Extended Report (Anonymous)
Sam Sample | [email protected]
This section provides further detail regarding Sam's results on the Interpersonal Skills competency category. The
section starts with an overall look at the category scores and level of consensus between the rater groups, and
continues to breakdown the results on each of the competencies which make up the category.
The following chart helps to identify gaps in rater scores. The chart provides category scores for each of the rater
groups along with the range and spread of responses for each group.
The following tables summarise the information presented in the chart above. The first focuses on the level of
agreement within the rater groups, while the second looks at the level of agreement between the groups.
Gap Analysis: WITHIN Rater Groups
Rater Groups
Result Consensus
Average
Score Score Level
Standard
Deviation Consensus Level
Self 5.27 Moderately High 1.24 Moderately Low
Manager 3.8 Moderate 1.33 Moderately Low
Peer 4.53 Moderate 0.81 Moderately High
Direct Report 3.83 Moderate 1.27 Moderately Low
Other 4.4 Moderate 0.88 Moderate
Gap Analysis: BETWEEN Rater Groups
Rater Groups Self Manager Peer Direct Report
Gap Gap Level Gap Gap Level Gap Gap Level Gap Gap Level
Manager -1.47 Moderate
Peer -0.73 Moderately
Narrow +0.73
Moderately
Narrow
Direct Report -1.43 Moderate +0.03 None -0.7 Moderately
Narrow
Other -0.87 Moderately
Narrow +0.6
Moderately
Narrow -0.13 None +0.57 Narrow
INTERPERSONAL SKILLS GAP CHART
INTERPERSONAL SKILLS

19
© Psychometrics Ltd.
Decision Maker | 360° Extended Report (Anonymous)
Sam Sample | [email protected]
Interpersonal Skills's competency scores are presented in the following chart.
The following table highlights some of the main findings from the information presented in the competency
summary chart above. Competencies with Score Levels or Consensus Levels marked as "Low" or "Moderately
Low" should be investigated further.
Competency
Result Consensus
Average
Score Score Level
Standard
Deviation
Consensus
Level
Relationships
The willingness to get on well with colleagues. 4.14 Moderate 1.21
Moderately
Low
Empathic
The quality of having insight into others'
thoughts/feelings.
4.57 Moderate 1.29 Moderately
Low
Interpersonal Support
The willingness to be supportive of colleagues. 4.24 Moderate 0.92 Moderate
Diplomacy
The tendency to be tactful, discreet and
diplomatic.
4 Moderate 1.23 Moderately
Low
Appropriate Assertion
The capacity to assert oneself appropriately. 4.62
Moderately
High 1.25
Moderately
Low
INTERPERSONAL SKILLS'S COMPETENCY SUMMARY CHART

20
© Psychometrics Ltd.
Decision Maker | 360° Extended Report (Anonymous)
Sam Sample | [email protected]
The five HIGHEST rated items (highest to lowest):
No. Item Competency Average
Score
1 is insightful with regard to others' thoughts/feelings Empathic 4.86
2 is assertive in a direct, non-aggressive manner Appropriate
Assertion 4.86
3 has good relationships with colleagues Relationships 4.71
4 is supportive of colleagues Interpersonal
Support 4.71
5 is assertive in an appropriate and constructive manner Appropriate
Assertion 4.71
The five LOWEST rated items (highest to lowest):
No. Item Competency Average
Score
1 shows genuine concern about colleagues' welfare Interpersonal
Support 4
2 is concerned and considerate of colleagues Interpersonal
Support 4
3 is mindful of others' sensibilities Diplomacy 4
4 fosters good working relationships with colleagues Relationships 3.43
5 exercises diplomacy and discretion Diplomacy 3.43

21
© Psychometrics Ltd.
Decision Maker | 360° Extended Report (Anonymous)
Sam Sample | [email protected]
This section provides further detail regarding Sam's results on the Resilience competency category. The section
starts with an overall look at the category scores and level of consensus between the rater groups, and
continues to breakdown the results on each of the competencies which make up the category.
The following chart helps to identify gaps in rater scores. The chart provides category scores for each of the rater
groups along with the range and spread of responses for each group.
The following tables summarise the information presented in the chart above. The first focuses on the level of
agreement within the rater groups, while the second looks at the level of agreement between the groups.
Gap Analysis: WITHIN Rater Groups
Rater Groups
Result Consensus
Average
Score Score Level
Standard
Deviation Consensus Level
Self 4.93 Moderately High 0.93 Moderate
Manager 3.87 Moderate 1.02 Moderate
Peer 4.4 Moderate 0.88 Moderate
Direct Report 3.6 Moderate 1.08 Moderate
Other 4.87 Moderately High 0.96 Moderate
Gap Analysis: BETWEEN Rater Groups
Rater Groups Self Manager Peer Direct Report
Gap Gap Level Gap Gap Level Gap Gap Level Gap Gap Level
Manager -1.07 Moderately
Narrow
Peer -0.53 Narrow +0.53 Narrow
Direct Report -1.33 Moderate -0.27 Narrow -0.8 Moderately
Narrow
Other -0.07 None +1 Moderately
Narrow +0.47 Narrow +1.27 Moderate
RESILIENCE GAP CHART
RESILIENCE
22
© Psychometrics Ltd.
Decision Maker | 360° Extended Report (Anonymous)
Sam Sample | [email protected]
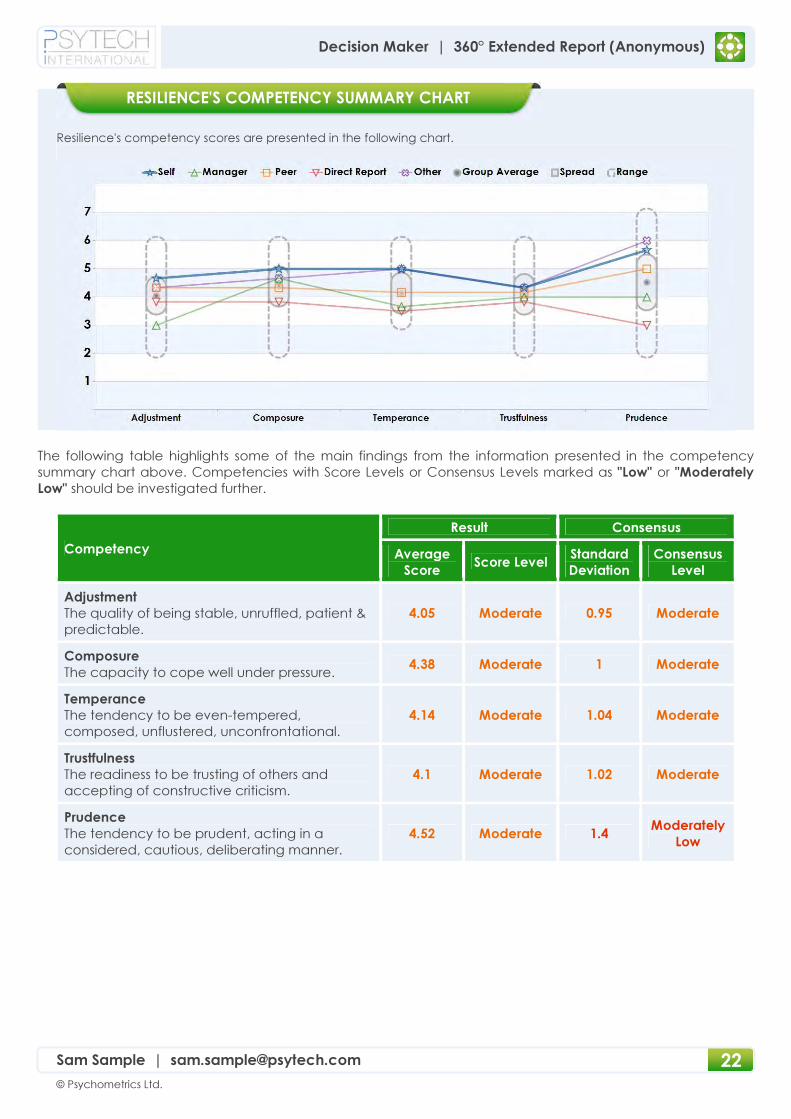
Resilience's competency scores are presented in the following chart.
The following table highlights some of the main findings from the information presented in the competency
summary chart above. Competencies with Score Levels or Consensus Levels marked as "Low" or "Moderately
Low" should be investigated further.
Competency
Result Consensus
Average
Score Score Level
Standard
Deviation
Consensus
Level
Adjustment
The quality of being stable, unruffled, patient &
predictable.
4.05 Moderate 0.95 Moderate
Composure
The capacity to cope well under pressure. 4.38 Moderate 1 Moderate
Temperance
The tendency to be even-tempered,
composed, unflustered, unconfrontational.
4.14 Moderate 1.04 Moderate
Trustfulness
The readiness to be trusting of others and
accepting of constructive criticism.
4.1 Moderate 1.02 Moderate
Prudence
The tendency to be prudent, acting in a
considered, cautious, deliberating manner.
4.52 Moderate 1.4 Moderately
Low
RESILIENCE'S COMPETENCY SUMMARY CHART
23
© Psychometrics Ltd.
Decision Maker | 360° Extended Report (Anonymous)
Sam Sample | [email protected]
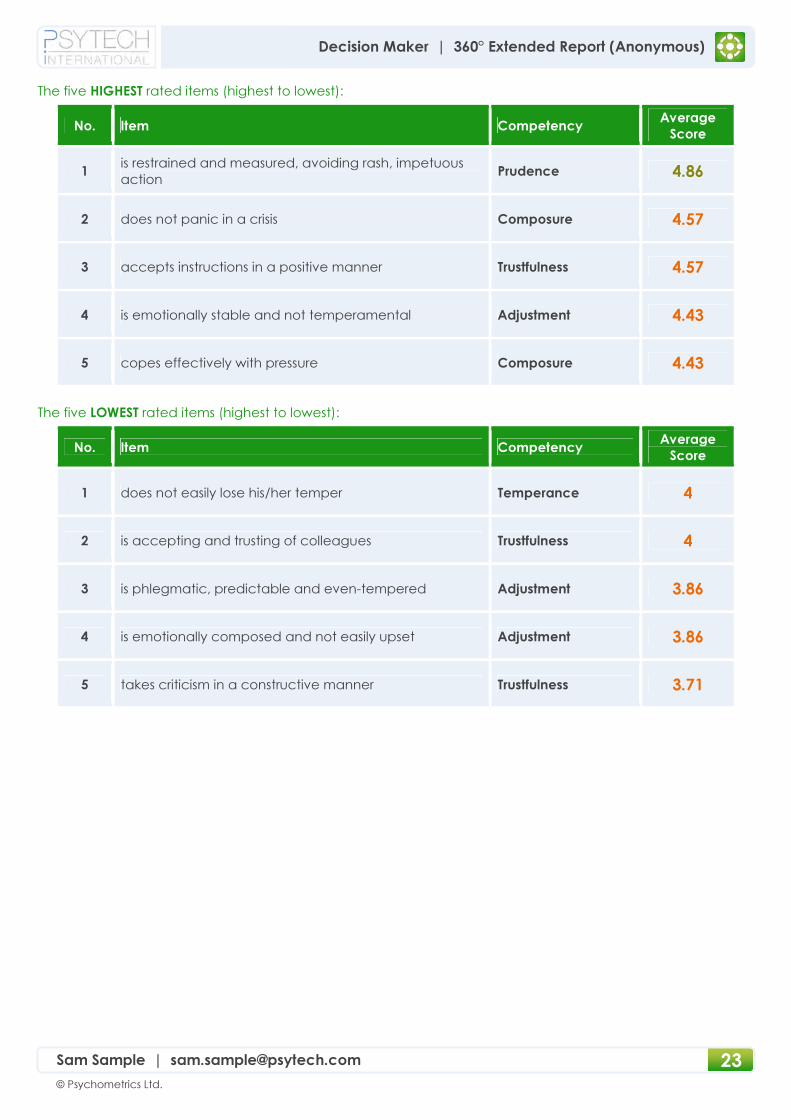
The five HIGHEST rated items (highest to lowest):
No. Item Competency Average
Score
1 is restrained and measured, avoiding rash, impetuous
action Prudence 4.86
2 does not panic in a crisis Composure 4.57
3 accepts instructions in a positive manner Trustfulness 4.57
4 is emotionally stable and not temperamental Adjustment 4.43
5 copes effectively with pressure Composure 4.43
The five LOWEST rated items (highest to lowest):
No. Item Competency Average
Score
1 does not easily lose his/her temper Temperance 4
2 is accepting and trusting of colleagues Trustfulness 4
3 is phlegmatic, predictable and even-tempered Adjustment 3.86
4 is emotionally composed and not easily upset Adjustment 3.86
5 takes criticism in a constructive manner Trustfulness 3.71

24
© Psychometrics Ltd.
Decision Maker | 360° Extended Report (Anonymous)
Sam Sample | [email protected]
This section provides further detail regarding Sam's results on the Persuasiveness competency category. The
section starts with an overall look at the category scores and level of consensus between the rater groups, and
continues to breakdown the results on each of the competencies which make up the category.
The following chart helps to identify gaps in rater scores. The chart provides category scores for each of the rater
groups along with the range and spread of responses for each group.
The following tables summarise the information presented in the chart above. The first focuses on the level of
agreement within the rater groups, while the second looks at the level of agreement between the groups.
Gap Analysis: WITHIN Rater Groups
Rater Groups
Result Consensus
Average
Score Score Level
Standard
Deviation Consensus Level
Self 5.33 Moderately High 1.07 Moderate
Manager 4.27 Moderate 1 Moderate
Peer 4.57 Moderate 1.05 Moderate
Direct Report 3.73 Moderate 1.21 Moderately Low
Other 4.53 Moderate 0.96 Moderate
Gap Analysis: BETWEEN Rater Groups
Rater Groups Self Manager Peer Direct Report
Gap Gap Level Gap Gap Level Gap Gap Level Gap Gap Level
Manager -1.07 Moderately
Narrow
Peer -0.77 Moderately
Narrow +0.3 Narrow
Direct Report -1.6 Moderate -0.53 Narrow -0.83 Moderately
Narrow
Other -0.8 Moderately
Narrow +0.27 Narrow -0.03 None +0.8
Moderately
Narrow
PERSUASIVENESS GAP CHART
PERSUASIVENESS
25
© Psychometrics Ltd.
Decision Maker | 360° Extended Report (Anonymous)
Sam Sample | [email protected]
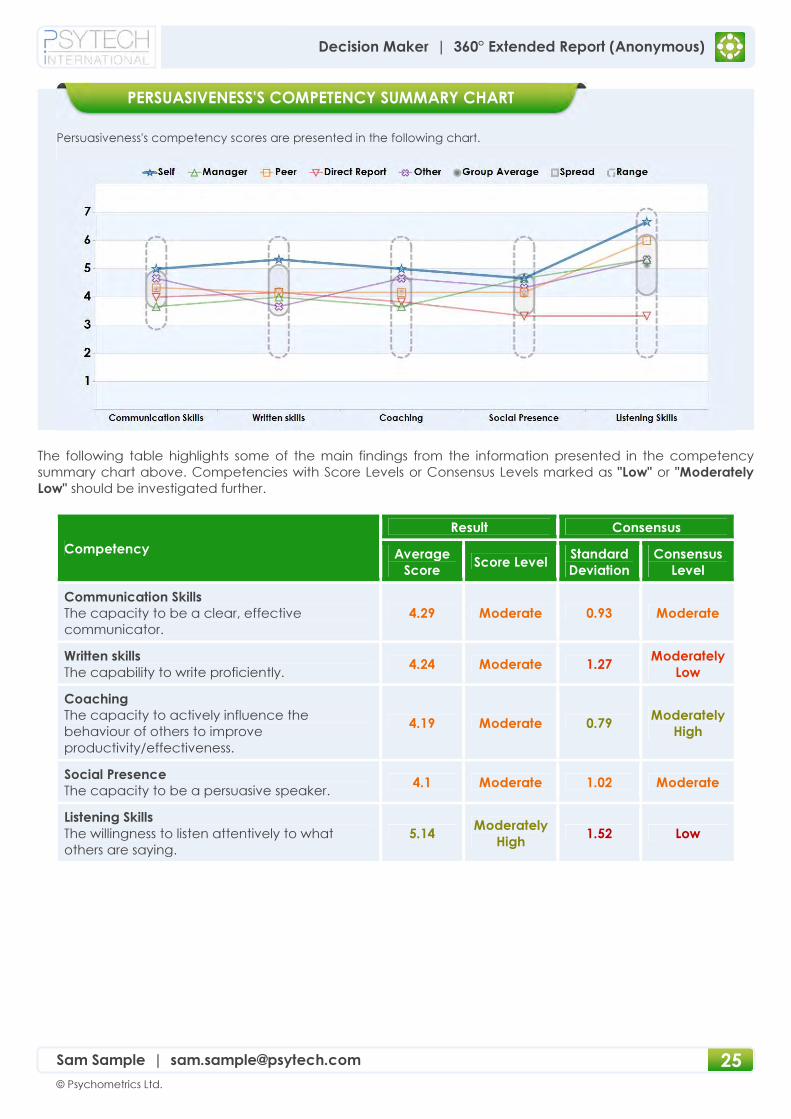
Persuasiveness's competency scores are presented in the following chart.
The following table highlights some of the main findings from the information presented in the competency
summary chart above. Competencies with Score Levels or Consensus Levels marked as "Low" or "Moderately
Low" should be investigated further.
Competency
Result Consensus
Average
Score Score Level
Standard
Deviation
Consensus
Level
Communication Skills
The capacity to be a clear, effective
communicator.
4.29 Moderate 0.93 Moderate
Written skills
The capability to write proficiently. 4.24 Moderate 1.27
Moderately
Low
Coaching
The capacity to actively influence the
behaviour of others to improve
productivity/effectiveness.
4.19 Moderate 0.79 Moderately
High
Social Presence
The capacity to be a persuasive speaker. 4.1 Moderate 1.02 Moderate
Listening Skills
The willingness to listen attentively to what
others are saying.
5.14 Moderately
High 1.52 Low
PERSUASIVENESS'S COMPETENCY SUMMARY CHART
26
© Psychometrics Ltd.
Decision Maker | 360° Extended Report (Anonymous)
Sam Sample | [email protected]
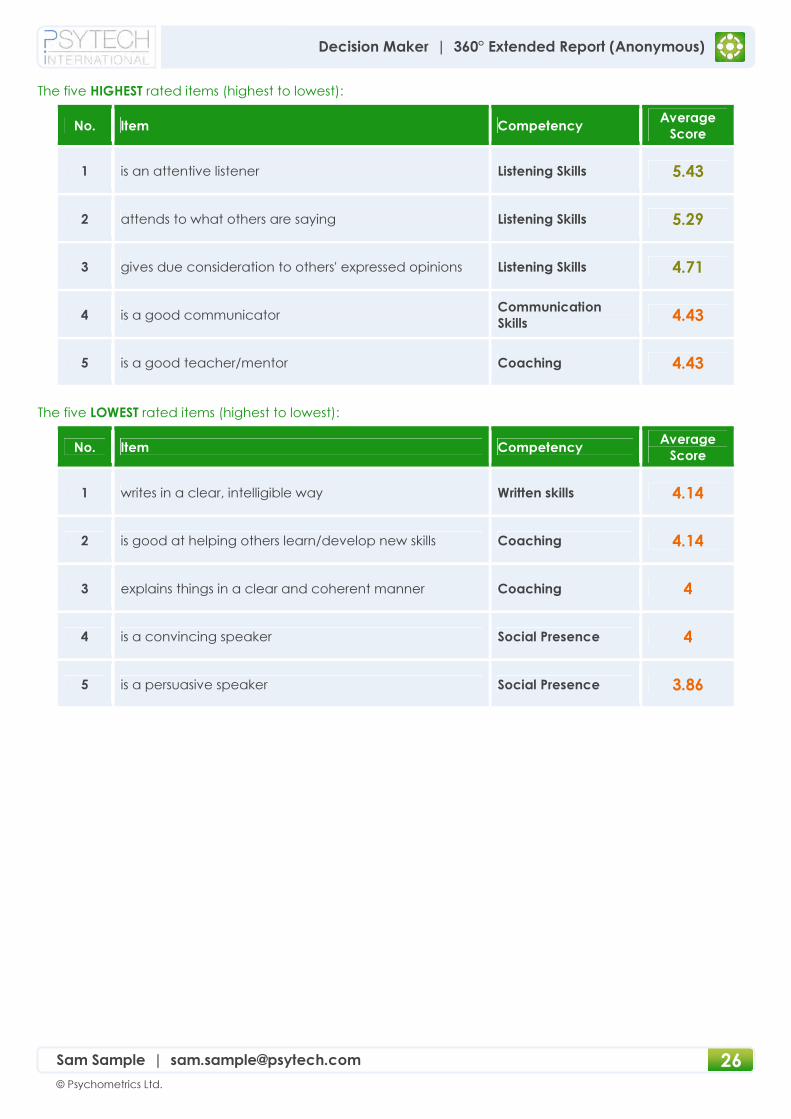
The five HIGHEST rated items (highest to lowest):
No. Item Competency Average
Score
1 is an attentive listener Listening Skills 5.43
2 attends to what others are saying Listening Skills 5.29
3 gives due consideration to others' expressed opinions Listening Skills 4.71
4 is a good communicator Communication
Skills 4.43
5 is a good teacher/mentor Coaching 4.43
The five LOWEST rated items (highest to lowest):
No. Item Competency Average
Score
1 writes in a clear, intelligible way Written skills 4.14
2 is good at helping others learn/develop new skills Coaching 4.14
3 explains things in a clear and coherent manner Coaching 4
4 is a convincing speaker Social Presence 4
5 is a persuasive speaker Social Presence 3.86
27
© Psychometrics Ltd.
Decision Maker | 360° Extended Report (Anonymous)
Sam Sample | [email protected]
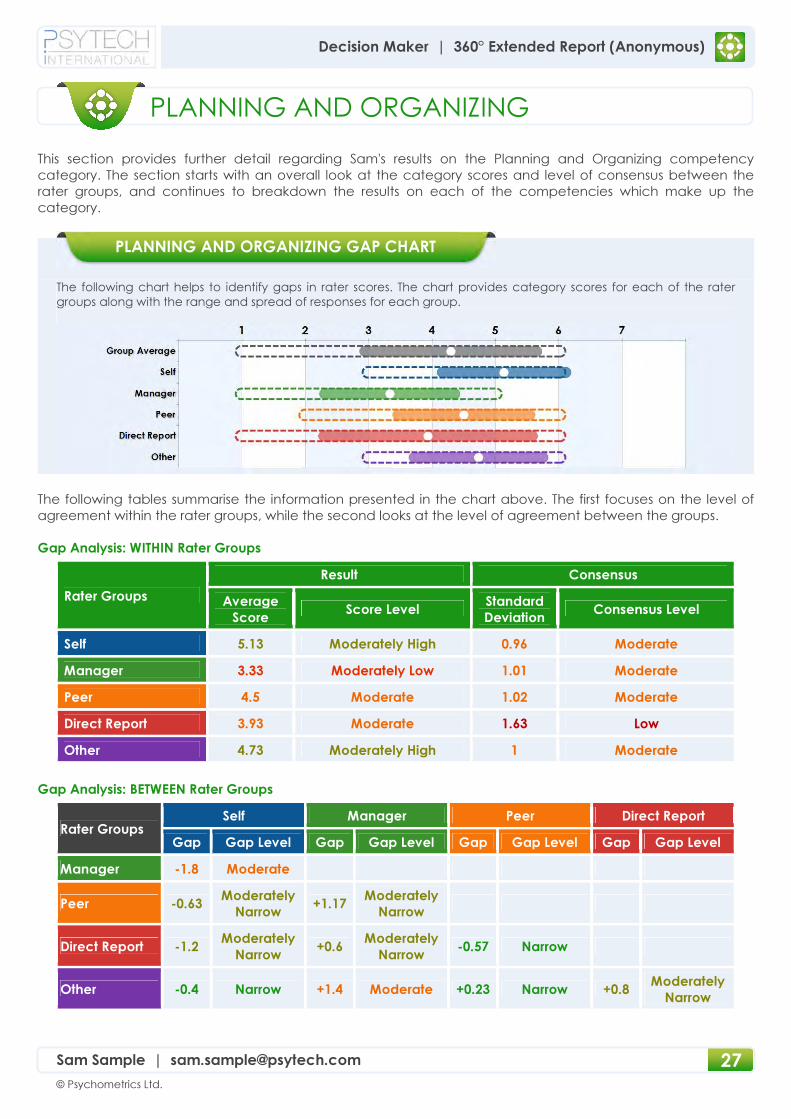
This section provides further detail regarding Sam's results on the Planning and Organizing competency
category. The section starts with an overall look at the category scores and level of consensus between the
rater groups, and continues to breakdown the results on each of the competencies which make up the
category.
The following chart helps to identify gaps in rater scores. The chart provides category scores for each of the rater
groups along with the range and spread of responses for each group.
The following tables summarise the information presented in the chart above. The first focuses on the level of
agreement within the rater groups, while the second looks at the level of agreement between the groups.
Gap Analysis: WITHIN Rater Groups
Rater Groups
Result Consensus
Average
Score Score Level
Standard
Deviation Consensus Level
Self 5.13 Moderately High 0.96 Moderate
Manager 3.33 Moderately Low 1.01 Moderate
Peer 4.5 Moderate 1.02 Moderate
Direct Report 3.93 Moderate 1.63 Low
Other 4.73 Moderately High 1 Moderate
Gap Analysis: BETWEEN Rater Groups
Rater Groups Self Manager Peer Direct Report
Gap Gap Level Gap Gap Level Gap Gap Level Gap Gap Level
Manager -1.8 Moderate
Peer -0.63 Moderately
Narrow +1.17
Moderately
Narrow
Direct Report -1.2 Moderately
Narrow +0.6
Moderately
Narrow -0.57 Narrow
Other -0.4 Narrow +1.4 Moderate +0.23 Narrow +0.8 Moderately
Narrow
PLANNING AND ORGANIZING GAP CHART
PLANNING AND ORGANIZING

28
© Psychometrics Ltd.
Decision Maker | 360° Extended Report (Anonymous)
Sam Sample | [email protected]
Planning and Organizing's competency scores are presented in the following chart.
The following table highlights some of the main findings from the information presented in the competency
summary chart above. Competencies with Score Levels or Consensus Levels marked as "Low" or "Moderately
Low" should be investigated further.
Competency
Result Consensus
Average
Score Score Level
Standard
Deviation
Consensus
Level
Time Management
The capability to manage time effectively. 4.29 Moderate 1.31
Moderately
Low
Future Orientated
The capacity to anticipate future
problems/difficulties.
4.33 Moderate 1.52 Low
Prioritisation
The capacity to prioritise one's own work
effectively.
4.14 Moderate 1.25 Moderately
Low
Delegation
The capability to delegate work appropriately. 4.19 Moderate 1.14 Moderate
Planning
The propensity to plan for all contingencies. 4.52 Moderate 1.4
Moderately
Low
PLANNING AND ORGANIZING'S COMPETENCY SUMMARY CHART
29
© Psychometrics Ltd.
Decision Maker | 360° Extended Report (Anonymous)
Sam Sample | [email protected]
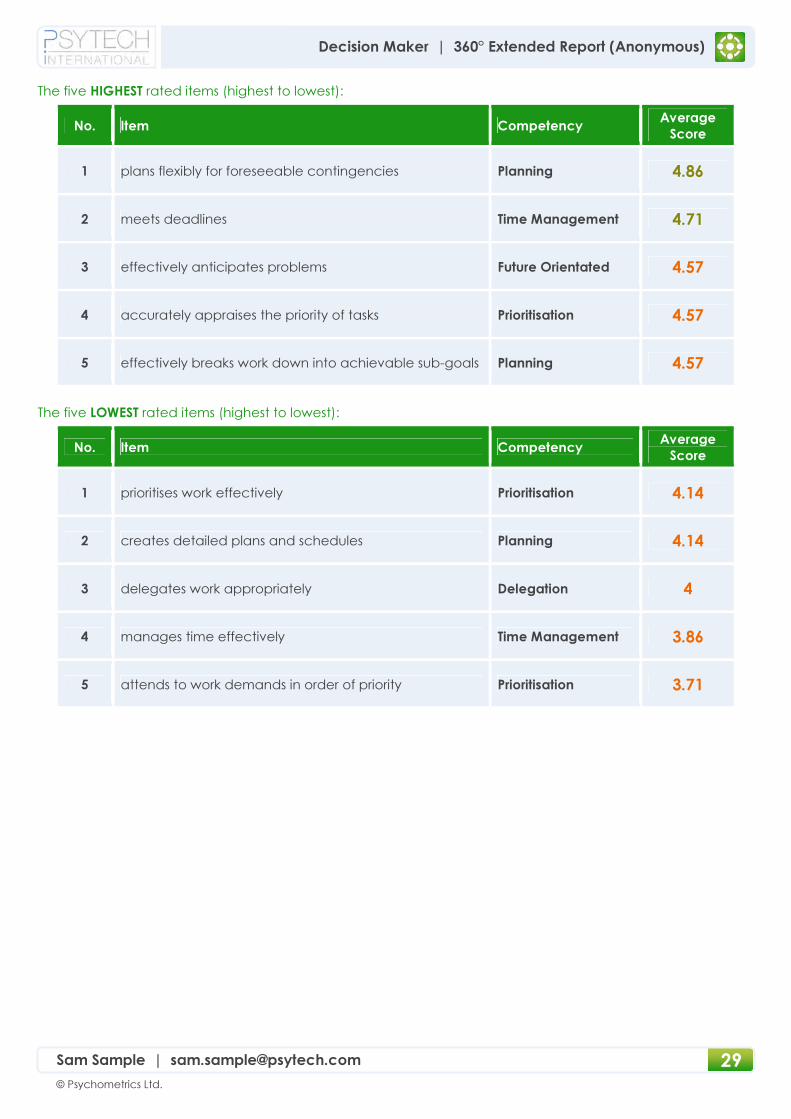
The five HIGHEST rated items (highest to lowest):
No. Item Competency Average
Score
1 plans flexibly for foreseeable contingencies Planning 4.86
2 meets deadlines Time Management 4.71
3 effectively anticipates problems Future Orientated 4.57
4 accurately appraises the priority of tasks Prioritisation 4.57
5 effectively breaks work down into achievable sub-goals Planning 4.57
The five LOWEST rated items (highest to lowest):
No. Item Competency Average
Score
1 prioritises work effectively Prioritisation 4.14
2 creates detailed plans and schedules Planning 4.14
3 delegates work appropriately Delegation 4
4 manages time effectively Time Management 3.86
5 attends to work demands in order of priority Prioritisation 3.71
30
© Psychometrics Ltd.
Decision Maker | 360° Extended Report (Anonymous)
Sam Sample | [email protected]
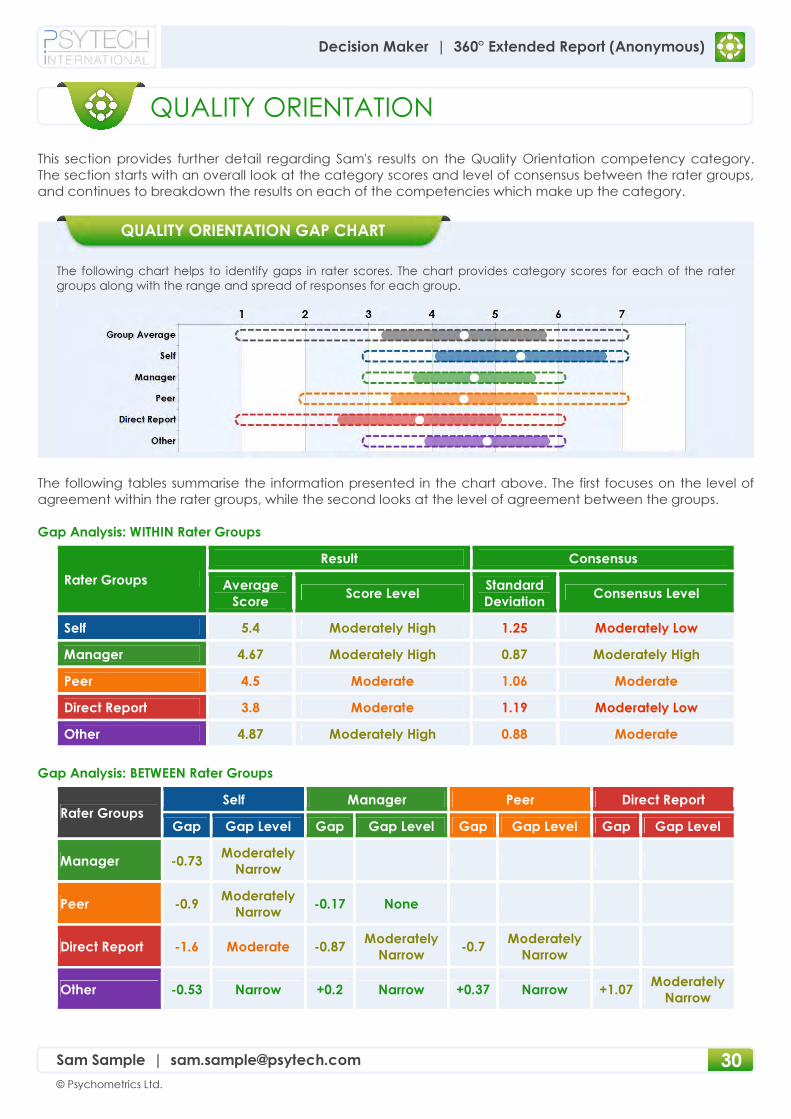
This section provides further detail regarding Sam's results on the Quality Orientation competency category.
The section starts with an overall look at the category scores and level of consensus between the rater groups,
and continues to breakdown the results on each of the competencies which make up the category.
The following chart helps to identify gaps in rater scores. The chart provides category scores for each of the rater
groups along with the range and spread of responses for each group.
The following tables summarise the information presented in the chart above. The first focuses on the level of
agreement within the rater groups, while the second looks at the level of agreement between the groups.
Gap Analysis: WITHIN Rater Groups
Rater Groups
Result Consensus
Average
Score Score Level
Standard
Deviation Consensus Level
Self 5.4 Moderately High 1.25 Moderately Low
Manager 4.67 Moderately High 0.87 Moderately High
Peer 4.5 Moderate 1.06 Moderate
Direct Report 3.8 Moderate 1.19 Moderately Low
Other 4.87 Moderately High 0.88 Moderate
Gap Analysis: BETWEEN Rater Groups
Rater Groups Self Manager Peer Direct Report
Gap Gap Level Gap Gap Level Gap Gap Level Gap Gap Level
Manager -0.73 Moderately
Narrow
Peer -0.9 Moderately
Narrow -0.17 None
Direct Report -1.6 Moderate -0.87 Moderately
Narrow -0.7
Moderately
Narrow
Other -0.53 Narrow +0.2 Narrow +0.37 Narrow +1.07 Moderately
Narrow
QUALITY ORIENTATION GAP CHART
QUALITY ORIENTATION
31
© Psychometrics Ltd.
Decision Maker | 360° Extended Report (Anonymous)
Sam Sample | [email protected]
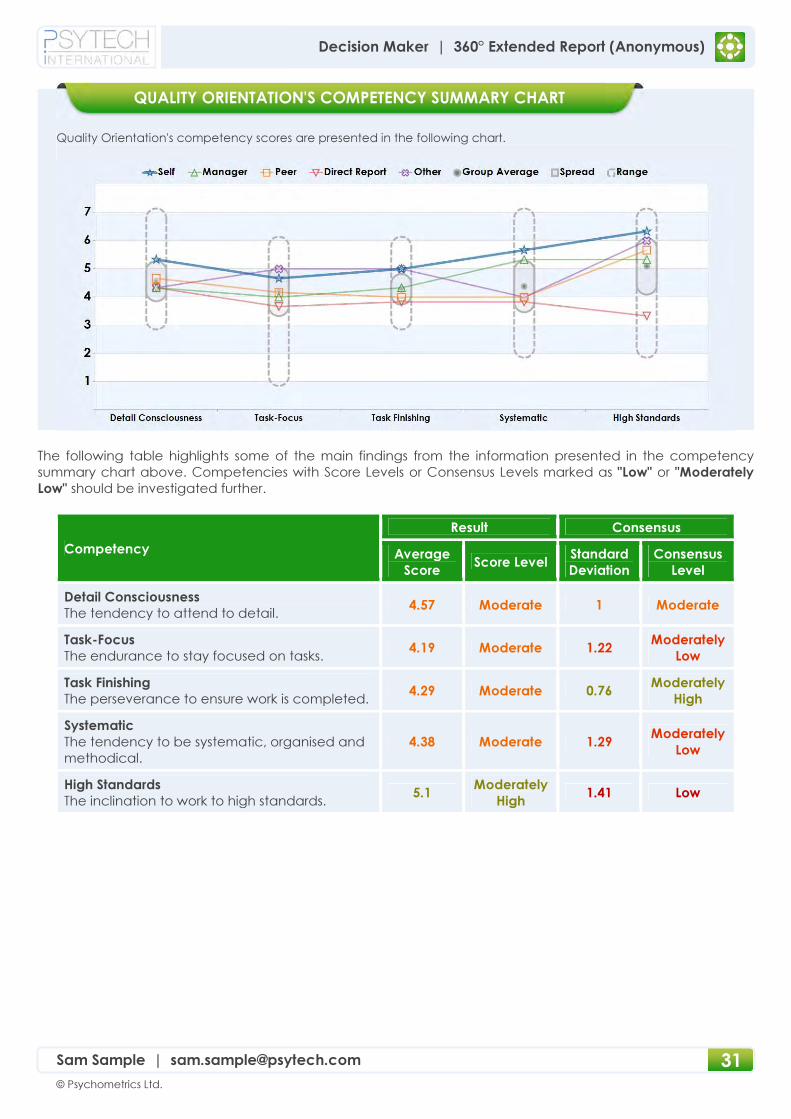
Quality Orientation's competency scores are presented in the following chart.
The following table highlights some of the main findings from the information presented in the competency
summary chart above. Competencies with Score Levels or Consensus Levels marked as "Low" or "Moderately
Low" should be investigated further.
Competency
Result Consensus
Average
Score Score Level
Standard
Deviation
Consensus
Level
Detail Consciousness
The tendency to attend to detail. 4.57 Moderate 1 Moderate
Task-Focus
The endurance to stay focused on tasks. 4.19 Moderate 1.22
Moderately
Low
Task Finishing
The perseverance to ensure work is completed. 4.29 Moderate 0.76
Moderately
High
Systematic
The tendency to be systematic, organised and
methodical.
4.38 Moderate 1.29 Moderately
Low
High Standards
The inclination to work to high standards. 5.1
Moderately
High 1.41 Low
QUALITY ORIENTATION'S COMPETENCY SUMMARY CHART
32
© Psychometrics Ltd.
Decision Maker | 360° Extended Report (Anonymous)
Sam Sample | [email protected]
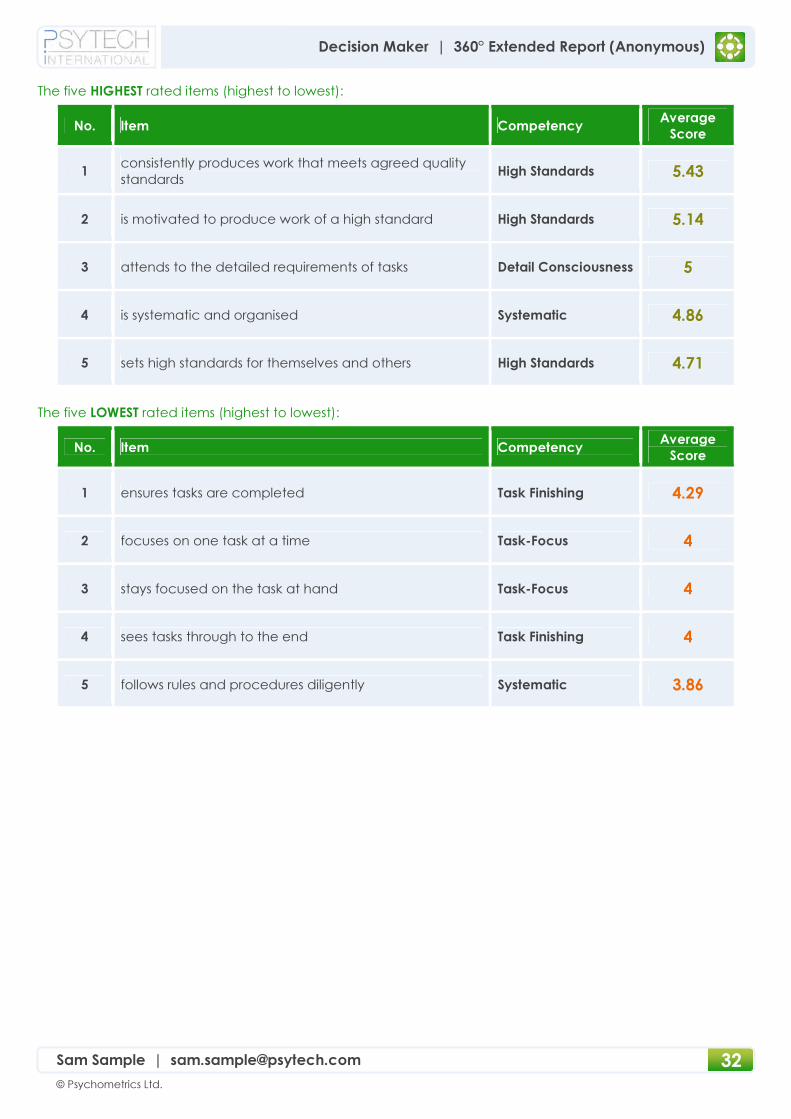
The five HIGHEST rated items (highest to lowest):
No. Item Competency Average
Score
1 consistently produces work that meets agreed quality
standards High Standards 5.43
2 is motivated to produce work of a high standard High Standards 5.14
3 attends to the detailed requirements of tasks Detail Consciousness 5
4 is systematic and organised Systematic 4.86
5 sets high standards for themselves and others High Standards 4.71
The five LOWEST rated items (highest to lowest):
No. Item Competency Average
Score
1 ensures tasks are completed Task Finishing 4.29
2 focuses on one task at a time Task-Focus 4
3 stays focused on the task at hand Task-Focus 4
4 sees tasks through to the end Task Finishing 4
5 follows rules and procedures diligently Systematic 3.86

33
© Psychometrics Ltd.
Decision Maker | 360° Extended Report (Anonymous)
Sam Sample | [email protected]
This section provides further detail regarding Sam's results on the Energy and Drive competency category. The
section starts with an overall look at the category scores and level of consensus between the rater groups, and
continues to breakdown the results on each of the competencies which make up the category.
The following chart helps to identify gaps in rater scores. The chart provides category scores for each of the rater
groups along with the range and spread of responses for each group.
The following tables summarise the information presented in the chart above. The first focuses on the level of
agreement within the rater groups, while the second looks at the level of agreement between the groups.
Gap Analysis: WITHIN Rater Groups
Rater Groups
Result Consensus
Average
Score Score Level
Standard
Deviation Consensus Level
Self 5.2 Moderately High 0.98 Moderate
Manager 3.73 Moderate 1.06 Moderate
Peer 4.4 Moderate 0.76 Moderately High
Direct Report 4.13 Moderate 1.45 Low
Other 4.53 Moderate 1.02 Moderate
Gap Analysis: BETWEEN Rater Groups
Rater Groups Self Manager Peer Direct Report
Gap Gap Level Gap Gap Level Gap Gap Level Gap Gap Level
Manager -1.47 Moderate
Peer -0.8 Moderately
Narrow +0.67
Moderately
Narrow
Direct Report -1.07 Moderately
Narrow +0.4 Narrow -0.27 Narrow
Other -0.67 Moderately
Narrow +0.8
Moderately
Narrow +0.13 None +0.4 Narrow
ENERGY AND DRIVE GAP CHART
ENERGY AND DRIVE
34
© Psychometrics Ltd.
Decision Maker | 360° Extended Report (Anonymous)
Sam Sample | [email protected]
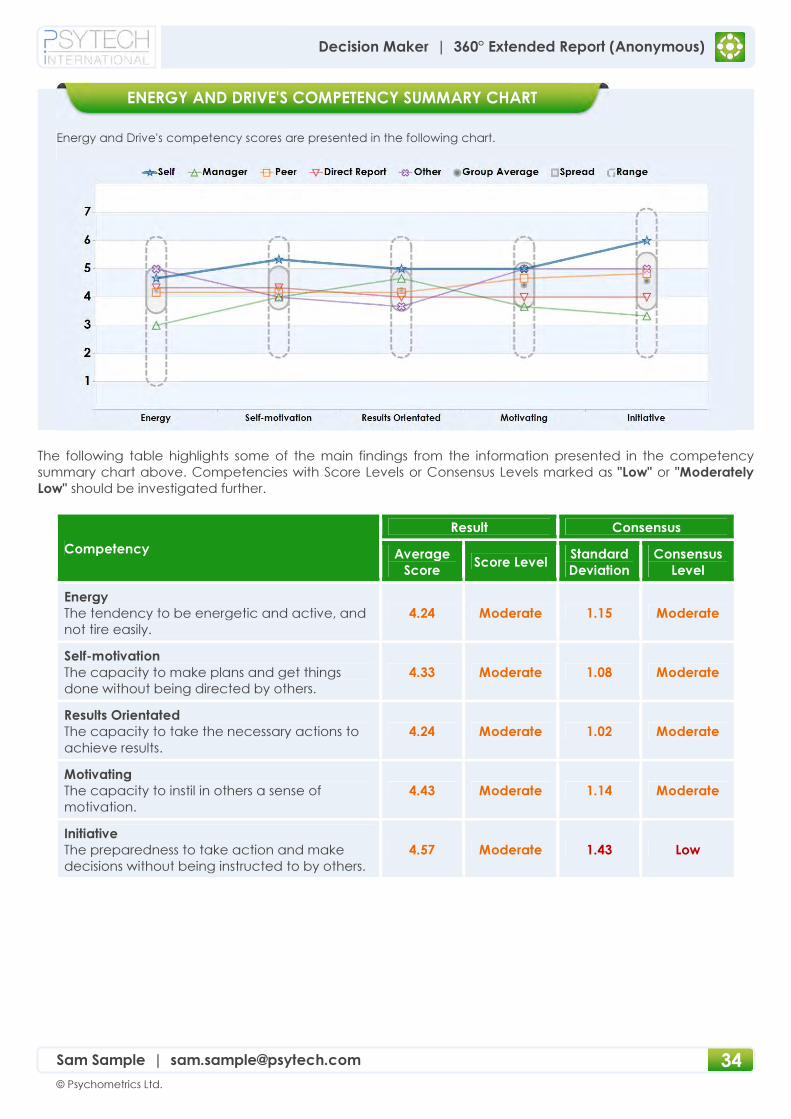
Energy and Drive's competency scores are presented in the following chart.
The following table highlights some of the main findings from the information presented in the competency
summary chart above. Competencies with Score Levels or Consensus Levels marked as "Low" or "Moderately
Low" should be investigated further.
Competency
Result Consensus
Average
Score Score Level
Standard
Deviation
Consensus
Level
Energy
The tendency to be energetic and active, and
not tire easily.
4.24 Moderate 1.15 Moderate
Self-motivation
The capacity to make plans and get things
done without being directed by others.
4.33 Moderate 1.08 Moderate
Results Orientated
The capacity to take the necessary actions to
achieve results.
4.24 Moderate 1.02 Moderate
Motivating
The capacity to instil in others a sense of
motivation.
4.43 Moderate 1.14 Moderate
Initiative
The preparedness to take action and make
decisions without being instructed to by others.
4.57 Moderate 1.43 Low
ENERGY AND DRIVE'S COMPETENCY SUMMARY CHART
35
© Psychometrics Ltd.
Decision Maker | 360° Extended Report (Anonymous)
Sam Sample | [email protected]
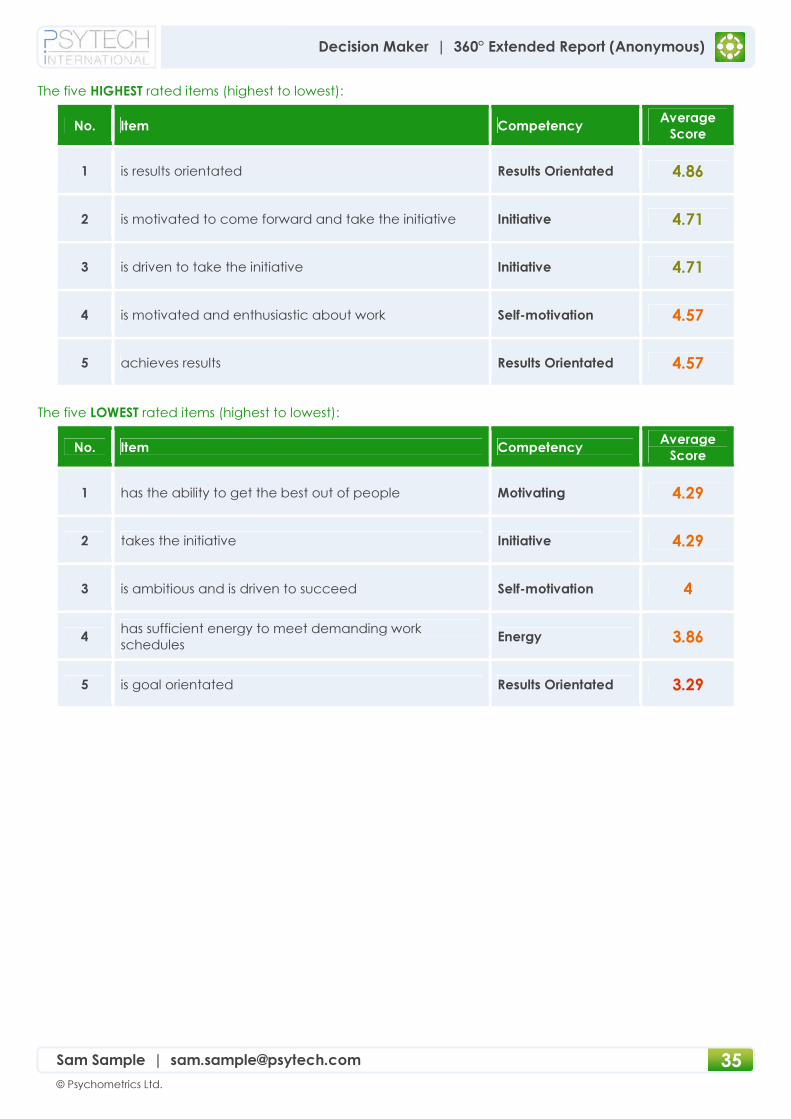
The five HIGHEST rated items (highest to lowest):
No. Item Competency Average
Score
1 is results orientated Results Orientated 4.86
2 is motivated to come forward and take the initiative Initiative 4.71
3 is driven to take the initiative Initiative 4.71
4 is motivated and enthusiastic about work Self-motivation 4.57
5 achieves results Results Orientated 4.57
The five LOWEST rated items (highest to lowest):
No. Item Competency Average
Score
1 has the ability to get the best out of people Motivating 4.29
2 takes the initiative Initiative 4.29
3 is ambitious and is driven to succeed Self-motivation 4
4 has sufficient energy to meet demanding work
schedules Energy 3.86
5 is goal orientated Results Orientated 3.29

36
© Psychometrics Ltd.
Decision Maker | 360° Extended Report (Anonymous)
Sam Sample | [email protected]
This section of the report focuses specifically on the differences between how Sam perceives his performance
and how others view his performance. Exploring perception gaps is essential for gaining insight into the source
for rating discrepancies and how to resolve them.
Competency categories above the middle band: Sam rates himself higher than others.
Competency categories within the middle band: Sam and others rate his performance similarly.
Competency categories below the middle band: Sam rates himself lower than others.
OVERALL SELF PERCEPTION
PERCEPTION GAPS

37
© Psychometrics Ltd.
Decision Maker | 360° Extended Report (Anonymous)
Sam Sample | [email protected]
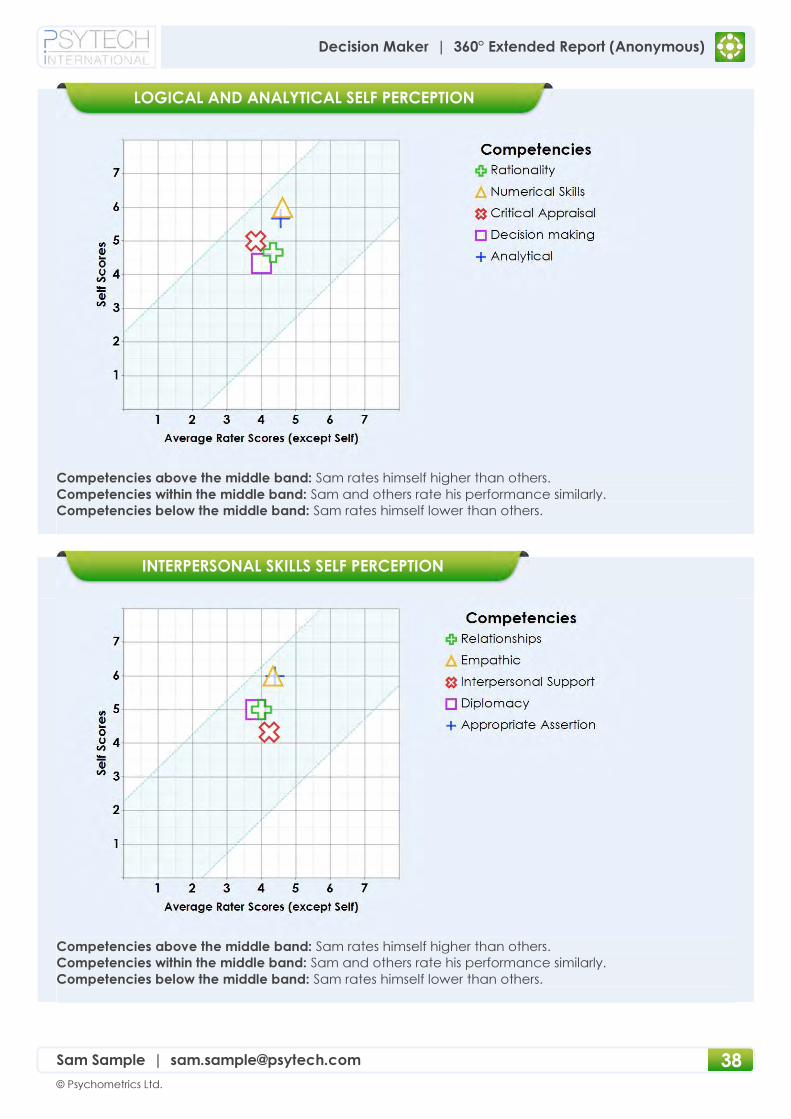
Competencies above the middle band: Sam rates himself higher than others.
Competencies within the middle band: Sam and others rate his performance similarly.
Competencies below the middle band: Sam rates himself lower than others.
Competencies above the middle band: Sam rates himself higher than others.
Competencies within the middle band: Sam and others rate his performance similarly.
Competencies below the middle band: Sam rates himself lower than others.
CREATIVITY SELF PERCEPTION
INTEGRITY SELF PERCEPTION
38
© Psychometrics Ltd.
Decision Maker | 360° Extended Report (Anonymous)
Sam Sample | [email protected]
Competencies above the middle band: Sam rates himself higher than others.
Competencies within the middle band: Sam and others rate his performance similarly.
Competencies below the middle band: Sam rates himself lower than others.
Competencies above the middle band: Sam rates himself higher than others.
Competencies within the middle band: Sam and others rate his performance similarly.
Competencies below the middle band: Sam rates himself lower than others.
INTERPERSONAL SKILLS SELF PERCEPTION
LOGICAL AND ANALYTICAL SELF PERCEPTION
39
© Psychometrics Ltd.
Decision Maker | 360° Extended Report (Anonymous)
Sam Sample | [email protected]
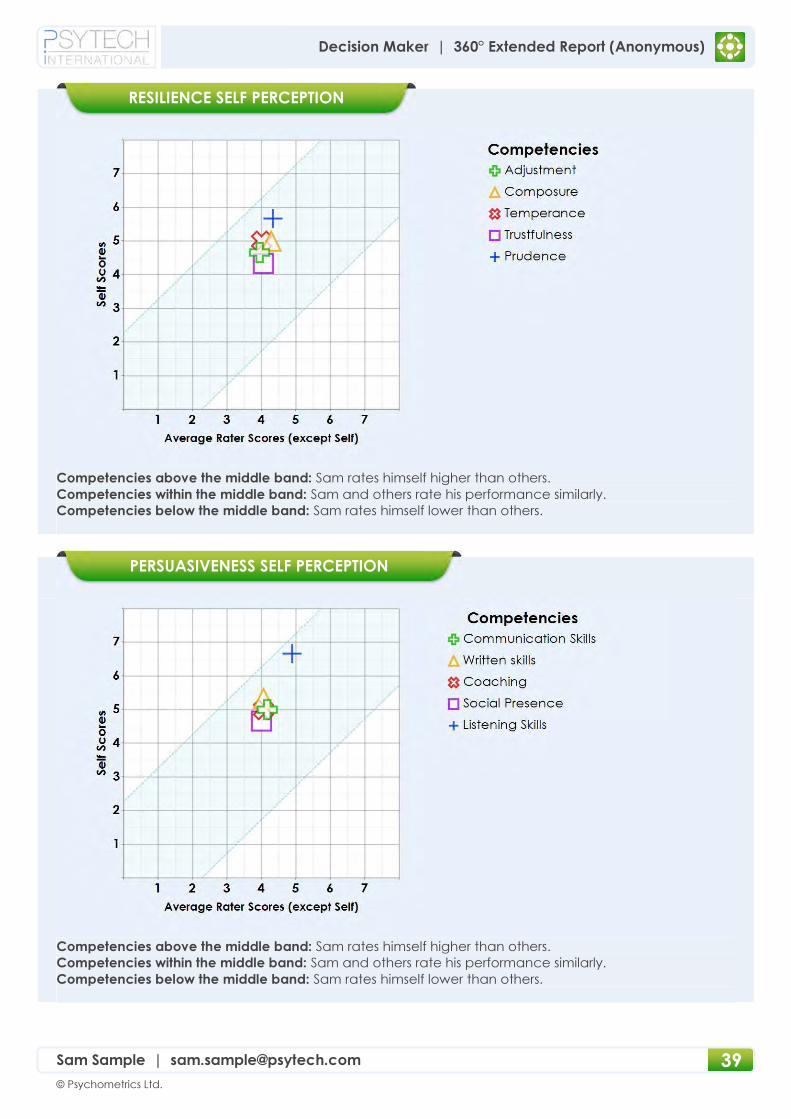
Competencies above the middle band: Sam rates himself higher than others.
Competencies within the middle band: Sam and others rate his performance similarly.
Competencies below the middle band: Sam rates himself lower than others.
Competencies above the middle band: Sam rates himself higher than others.
Competencies within the middle band: Sam and others rate his performance similarly.
Competencies below the middle band: Sam rates himself lower than others.
PERSUASIVENESS SELF PERCEPTION
RESILIENCE SELF PERCEPTION
40
© Psychometrics Ltd.
Decision Maker | 360° Extended Report (Anonymous)
Sam Sample | [email protected]
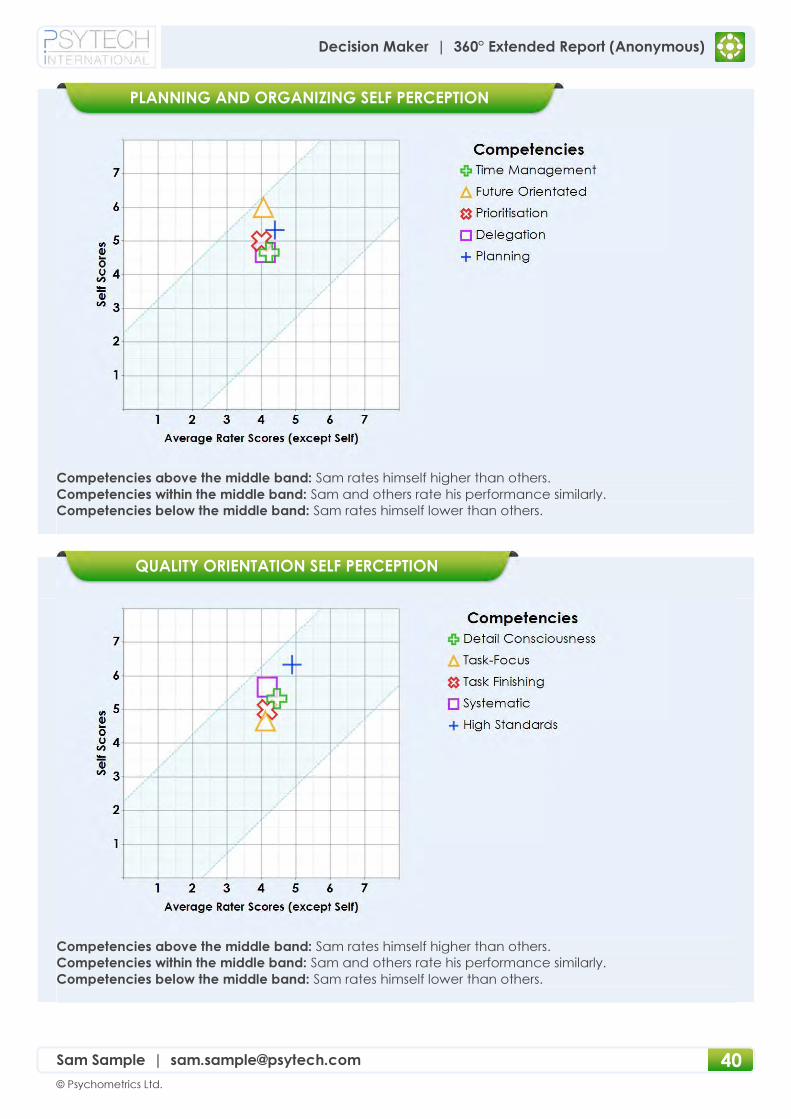
Competencies above the middle band: Sam rates himself higher than others.
Competencies within the middle band: Sam and others rate his performance similarly.
Competencies below the middle band: Sam rates himself lower than others.
Competencies above the middle band: Sam rates himself higher than others.
Competencies within the middle band: Sam and others rate his performance similarly.
Competencies below the middle band: Sam rates himself lower than others.
QUALITY ORIENTATION SELF PERCEPTION
PLANNING AND ORGANIZING SELF PERCEPTION
41
© Psychometrics Ltd.
Decision Maker | 360° Extended Report (Anonymous)
Sam Sample | [email protected]
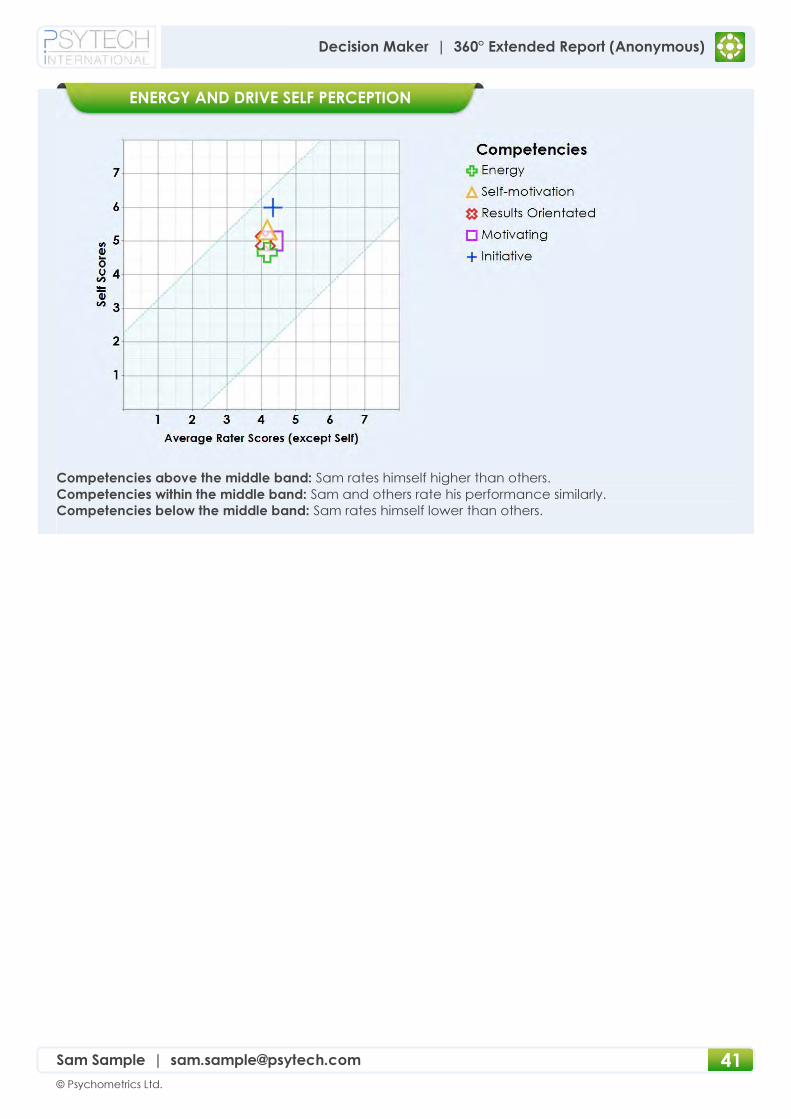
Competencies above the middle band: Sam rates himself higher than others.
Competencies within the middle band: Sam and others rate his performance similarly.
Competencies below the middle band: Sam rates himself lower than others.
ENERGY AND DRIVE SELF PERCEPTION