Embed Size (px)
Citation preview

EXTENDED MISSION TRAJECTORY OPTIONS FOR THE VAN ALLEN PROBESMISSION
Fazle E. Siddique(1) and Justin A. Atchison(2)
(1)Mission Design and Navigation Lead Engineer, Space Exploration Sector, The Johns HopkinsUniversity Applied Physics Laboratory, (443) 778-9270, [email protected]
(2)Mission Design and Navigation Engineer, Space Exploration Sector, [email protected]
Abstract: The Van Allen Probes mission, part of NASA’s Living With a Star Program, successfullylaunched on August 30th, 2012 from the Cape Canaveral Atlas-V Space Launch Complex 41. Thetwo year primary mission consisted of two spin stabilized spacecraft in highly eccentric Earthorbits. The spacecraft provide insight into the dynamics of Earth’s radiation belts by measuring therelevant in-situ environment (magnetic and electric fields) and key parameters of energetic particlesand ions. The two spacecraft have slightly different orbital periods that cause one spacecraft tolap the other approximately four times per year. The difference in orbital elements resulted in anoffset in the natural precession rate induced by Earth oblateness, causing the lines of apsides (orpetals) of the two orbits to deviate. The project, which is currently in a bridge phase, consideredseveral extended mission trajectory options that alter the rate of petal separation and lapping ratein order to study new Prioritized Science Goals for the first extended mission. This paper details thetrajectory adjustment tradespace and subsequent maneuver design for the selected option.
Keywords: Van Allen Probes, Mission Design, Radiation Belts.
1. Introduction
1.1. Background
The Van Allen Probes (formerly the Radiation Belt Storm Probes) Mission is part of NASA’s LivingWith a Star program and was built and currently operated by The Johns Hopkins University AppliedPhysics Laboratory (JHUAPL) in Laurel, MD. The primary purpose of the mission is to studythe creation and evolution of high energy particles in Earth’s magnetosphere to provide a betterunderstanding of the processes that drive changes within the Earth’s radiation belts. The flightsegment of the mission consists of two nearly-identical spin-stabilized spacecraft in similar highlyeccentric, low inclination Earth orbits. Each spacecraft hosts an identical suite of eight instruments,which measure the relevant in-situ environment including magnetic and electric fields, particlecomposition, and wave distributions[1].
The two spacecraft were launched on August 30, 2012 from the Cape Canaveral Atlas-V SpaceLaunch Complex 41 on an Atlas V 401 launch vehicle and began operation on November 1, 2012following a 60 day commissioning period. They completed their primary two year mission onNovember 1, 2014 and are currently operating in a bridge phase. During the Senior Review proposalprocess with NASA headquarters, new Prioritized Science Goals (PSGs) were identified for the firstextended mission. The project considered several extended mission trajectory options that alter theorbital parameters in order to satisfy the new PSGs. The limiting factor on the various options wasfuel consumption, and the selected option balanced the science goals and mission lifetime.
1
1.2. Spacecraft Description
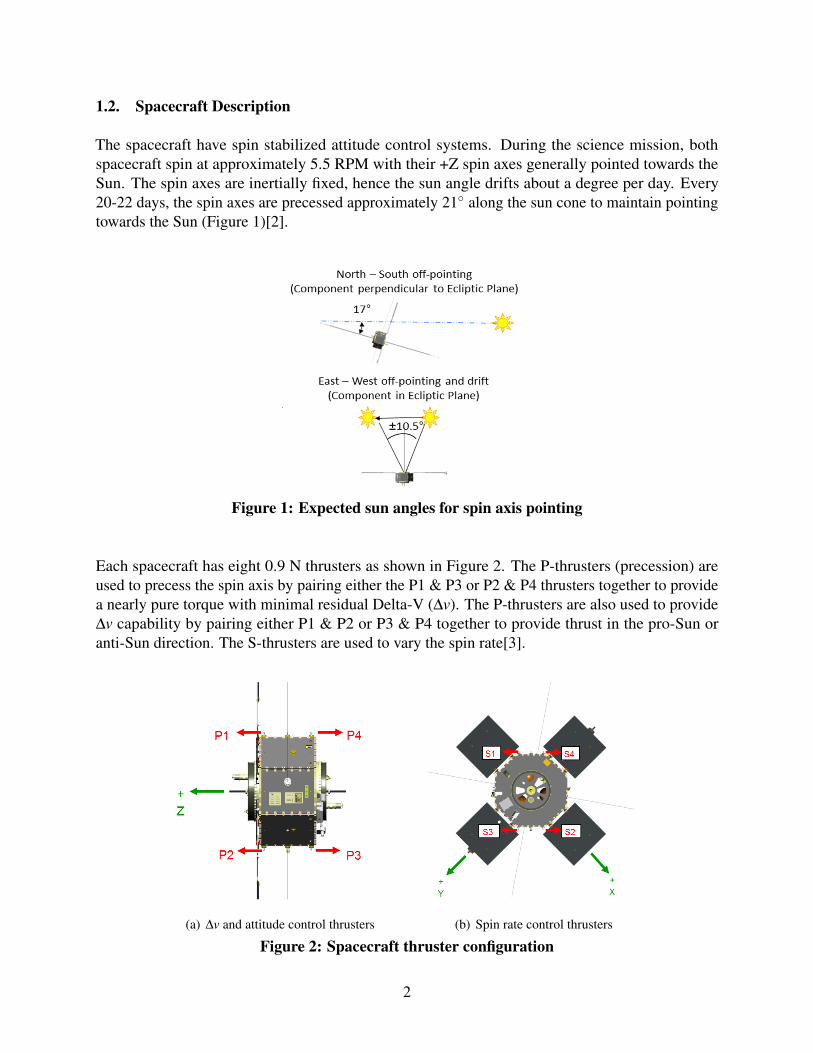
The spacecraft have spin stabilized attitude control systems. During the science mission, bothspacecraft spin at approximately 5.5 RPM with their +Z spin axes generally pointed towards theSun. The spin axes are inertially fixed, hence the sun angle drifts about a degree per day. Every20-22 days, the spin axes are precessed approximately 21 along the sun cone to maintain pointingtowards the Sun (Figure 1)[2].
Figure 1: Expected sun angles for spin axis pointing
Each spacecraft has eight 0.9 N thrusters as shown in Figure 2. The P-thrusters (precession) areused to precess the spin axis by pairing either the P1 & P3 or P2 & P4 thrusters together to providea nearly pure torque with minimal residual Delta-V (∆v). The P-thrusters are also used to provide∆v capability by pairing either P1 & P2 or P3 & P4 together to provide thrust in the pro-Sun oranti-Sun direction. The S-thrusters are used to vary the spin rate[3].
(a) ∆v and attitude control thrusters (b) Spin rate control thrusters
Figure 2: Spacecraft thruster configuration
2

Figure 3: Time History of the Solar Phase of Apsides Angle
1.3. Nominal Mission
The two spacecraft were launched into nearly identical 10 inclined orbits. After launch, thespacecraft were maneuvered to give a 20 km separation in perigee and a 150 km separation inapogee, with Van Allen Probe A (hence forth referred to as RBSPA) in the inner 605x30550 kmorbit and Van Allen Probe B (hence forth referred to as RBSPB) in the outer 625x30700 km orbit.The orbit semi-major axes and inclination were selected to satisfy the science requirement that theline of apsides of the two spacecraft complete a full revolution with respect to the Earth-Sun lineduring the nominal mission. The solar phase of apsides (δSPA) angle is defined as the angle betweenthe line of apsides (pointing towards apogee) projected into the ecliptic plane and the Earth-Sunline. This angle is plotted in Figure 3. The quadrants are specified at left and have relevance to theEarth’s magnetosphere. The angle completed a full revolution between the first day of the nominalmission (Day 60) and Day 709.
The slightly different orbital periods also satisfy the science requirement that the two spacecraft“lap” each other at least twice per solar quadrant. This requirement corresponds to a limit on synodicperiod between the two spacecraft, shown in Figure 4. The period is computed using the long-periodBrouwer mean elements[4], which average perturbations faster that the orbit period. After separatingfrom the launch vehicle, each spacecraft executed two maneuvers to target a specific perigee andapogee separation. This increased separation can be observed in Figure 4 as a steep reductionin synodic period. After these maneuvers, the synodic period remained relatively stable with theexception of collision avoidance maneuvers [5].
3
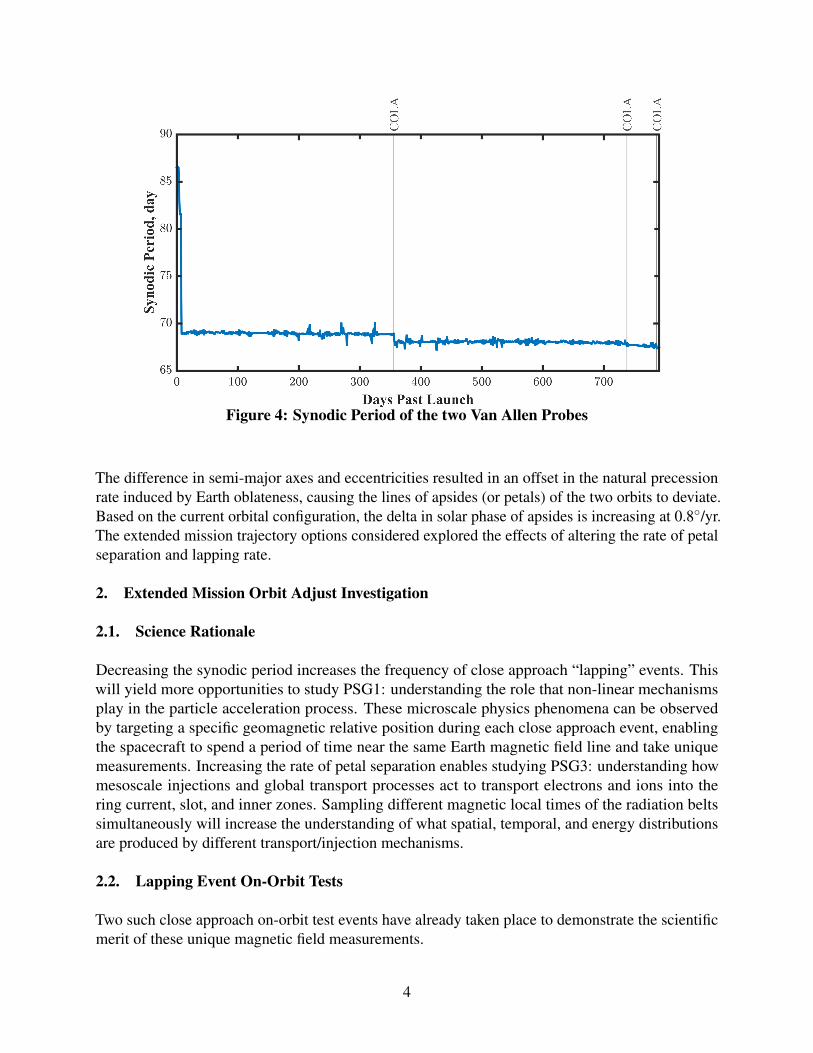
Figure 4: Synodic Period of the two Van Allen Probes
The difference in semi-major axes and eccentricities resulted in an offset in the natural precessionrate induced by Earth oblateness, causing the lines of apsides (or petals) of the two orbits to deviate.Based on the current orbital configuration, the delta in solar phase of apsides is increasing at 0.8/yr.The extended mission trajectory options considered explored the effects of altering the rate of petalseparation and lapping rate.
2. Extended Mission Orbit Adjust Investigation
2.1. Science Rationale
Decreasing the synodic period increases the frequency of close approach “lapping” events. Thiswill yield more opportunities to study PSG1: understanding the role that non-linear mechanismsplay in the particle acceleration process. These microscale physics phenomena can be observedby targeting a specific geomagnetic relative position during each close approach event, enablingthe spacecraft to spend a period of time near the same Earth magnetic field line and take uniquemeasurements. Increasing the rate of petal separation enables studying PSG3: understanding howmesoscale injections and global transport processes act to transport electrons and ions into thering current, slot, and inner zones. Sampling different magnetic local times of the radiation beltssimultaneously will increase the understanding of what spatial, temporal, and energy distributionsare produced by different transport/injection mechanisms.
2.2. Lapping Event On-Orbit Tests
Two such close approach on-orbit test events have already taken place to demonstrate the scientificmerit of these unique magnetic field measurements.
4
2.2.1. February 2015 Test
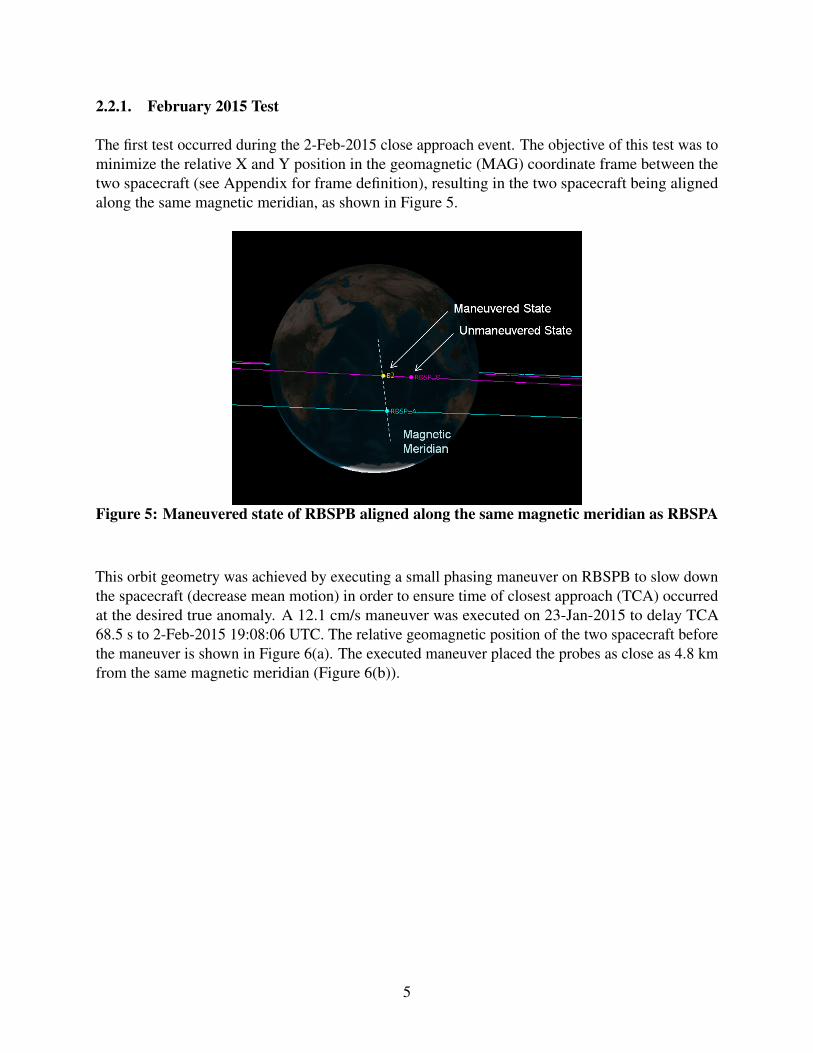
The first test occurred during the 2-Feb-2015 close approach event. The objective of this test was tominimize the relative X and Y position in the geomagnetic (MAG) coordinate frame between thetwo spacecraft (see Appendix for frame definition), resulting in the two spacecraft being alignedalong the same magnetic meridian, as shown in Figure 5.
Figure 5: Maneuvered state of RBSPB aligned along the same magnetic meridian as RBSPA
This orbit geometry was achieved by executing a small phasing maneuver on RBSPB to slow downthe spacecraft (decrease mean motion) in order to ensure time of closest approach (TCA) occurredat the desired true anomaly. A 12.1 cm/s maneuver was executed on 23-Jan-2015 to delay TCA68.5 s to 2-Feb-2015 19:08:06 UTC. The relative geomagnetic position of the two spacecraft beforethe maneuver is shown in Figure 6(a). The executed maneuver placed the probes as close as 4.8 kmfrom the same magnetic meridian (Figure 6(b)).
5

(a) Predicted unmaneuvered relative MAG position
(b) Post ∆v definitive relative MAG position
Figure 6: Range proximity to common magnetic meridian
2.2.2. April 2015 Test
The second test occurred during the 9-Apr-2015 close approach event. The objective of this testwas to place both spacecraft in the vicinity of the same magnetic field line. This orbit geometry wasachieved by minimizing the inter-satellite range given by
∆Lφ =√(LA cosφA−LB cosφB)2 +(LA sinφA−LB sinφB)2 (1)
6

where L is the L-shell value specifying the range of the magnetic field line at the intersection ofEarth’s equatorial plane (in Earth radii) and φ is the magnetic local time (MLT). These values canbe determined using the equations
φ = arctan(
xSM
ySM
)(2)
L =r
(cosλ )2 (3)
r =√
x2SM + y2
SM + z2SM (4)
λ = arctan
zSM√x2
SM + y2SM
(5)
where r is the radial distance of the spacecraft in Earth radii and λ is the geomagnetic latitude.The subscripts (SM) denotes a coordinate in the solar magnetic coordinate frame (see Appendixfor frame definition) and (A,B) refer to the two spacecraft. Proximity to the same magnetic fieldline is guaranteed by minimizing the difference in both L-shell and MLT between both spacecraft.Similar to the previous on-orbit test, this orbit geometry was achieved by executing a small 22.4cm/s phasing maneuver on RBSPB to slow down the spacecraft. The values of inter-satellite rangeand ∆Lφ between the two spacecraft before the maneuver is shown in Figure 7(a). The executedmaneuver placed the probes within 0.5 km from the same magnetic field line (Figure 7(b)).
7

(a) Unmaneuvered proximity to same magnetic field line
(b) Post ∆v definitive range proximity to same magnetic field line
Figure 7: Range proximity to common magnetic field line
2.3. Extended Mission Trajectory Adjust Tradespace
Several trajectory adjust options were investigated in conjunction with the Van Allen Probes ProjectScientist. The considered options included various alterations of apogee and perigee altitudes onboth spacecraft in order to understand the net effect on petal separation and lapping rate. Thelimiting factor was fuel consumption and the subsequent reduction in expected mission lifetime.
8

2.4. Petal Separation
Petal separation rate is predominantly dependent on the difference in nodal precession rate Ω
between each spacecraft caused by Earth’s second order oblateness, given by
Ω =−(3
2
)J2R2
E cos(i)(
np2
)(6)
where J2 is the constant describing the size of Earth’s bulge, RE is the equatorial radius of Earth, i isthe orbit inclination, n is the orbit mean motion, p is the orbit semi-latus rectum. n and p can befound using
n =
√(µ
a3
)(7)
p = a(1− e2) (8)
where a is the orbit semi-major axis, e is the orbit eccentricity, and µ is Earth’s gravitational constant.Substituting the radius of perigee rp and apogee ra for the orbit semi-major axis and eccentricity inn and p, (6) can be written as
Ω =−(3
2
)J2R2
E
õ/2cos(i)
(√ra + rp
r2ar2
p
)(9)
Taking the partial derivative of (9) with respect to rp and ra yields the relationship
∂ Ω/∂ rp
∂ Ω/∂ ra=
ra(4ra +3rp)
rp(3ra +4rp)=
e2 +8e+7e2−8e+7
(10)
As shown in Figure 8, for the highly elliptic orbits of Van Allen Probes, changes in rp are approxi-mately 6 times as effective in changing Ω versus changes in ra.
Figure 8: Ω sensitivity to changes in rp vs. ra
9

2.5. Lapping Rate
The lapping rate, or synodic period between the two spacecraft, is given by
Ts =( 2π
nA−nB
)(11)
Taking the partial derivative of (11) with respect to ra and rp yields the relationship
∂Ts
∂ ra=
∂Ts
∂ rp(12)
hence, changes in ra and rp equally impact lapping rate.
2.6. Fuel Usage
The limiting factor on which options could be pursued was fuel consumption. For the highly ellipticclass of Van Allen Probe orbits, with eccentricity 0.68, the fuel costs associated with changingperigee altitude is more prohibitive than costs associated with an equivalent change apogee altitude.Per the Vis-viva equation, Figure 9 shows the ∆v costs associated for an impulsive maneuver tochange the apse altitude for RBSPA.
Figure 9: ∆v costs for changing apse altitude on RBSPA
2.7. Final Options
The down-selected final options that were presented to the Van Allen Probes Science WorkingGroup (SWG) are shown in Table 1. Even though it was demonstrated that it’s much more effectiveto impact petal separation via changes in perigee altitude, most of the options presented to the SWGwere limited to apogee changes due to ∆v costs associated with changing perigee on highly ellipticorbits. One amenable option investigated was to reduce the perigee altitude of RBSPA. At the endof the mission, the disposal burns on both spacecraft would result in a 190 km perigee altitude, thus,
10
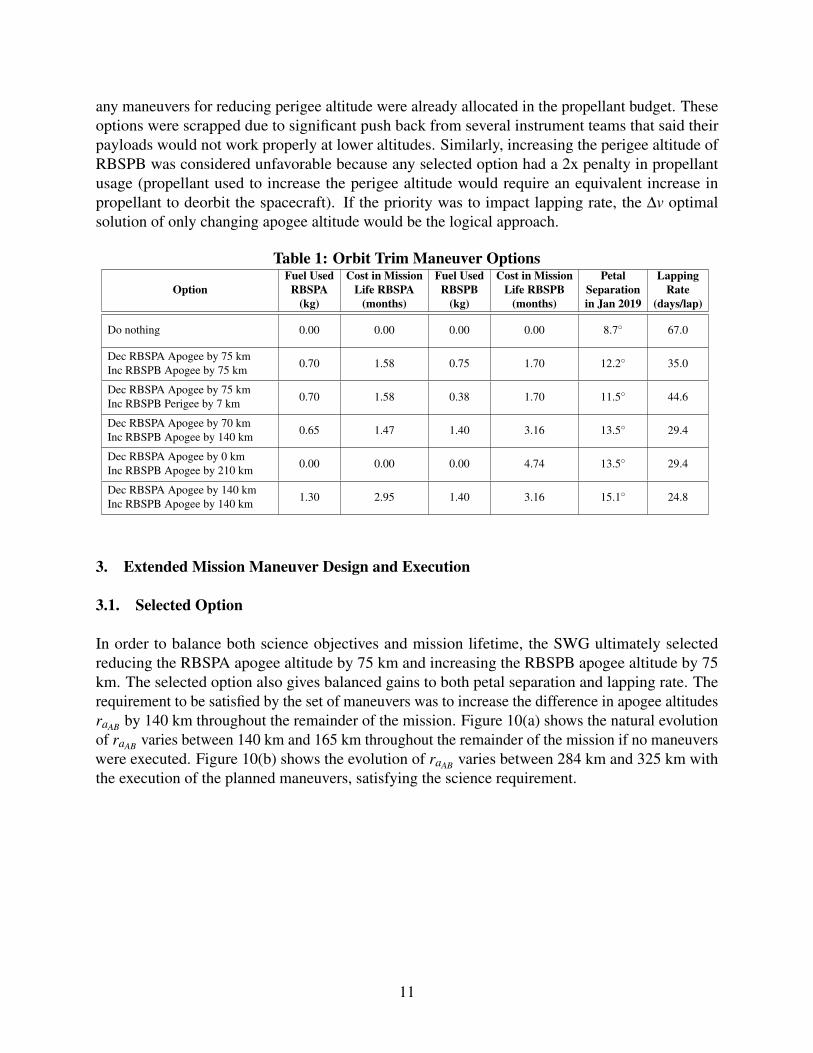
any maneuvers for reducing perigee altitude were already allocated in the propellant budget. Theseoptions were scrapped due to significant push back from several instrument teams that said theirpayloads would not work properly at lower altitudes. Similarly, increasing the perigee altitude ofRBSPB was considered unfavorable because any selected option had a 2x penalty in propellantusage (propellant used to increase the perigee altitude would require an equivalent increase inpropellant to deorbit the spacecraft). If the priority was to impact lapping rate, the ∆v optimalsolution of only changing apogee altitude would be the logical approach.
Table 1: Orbit Trim Maneuver OptionsFuel Used Cost in Mission Fuel Used Cost in Mission Petal Lapping
Option RBSPA Life RBSPA RBSPB Life RBSPB Separation Rate(kg) (months) (kg) (months) in Jan 2019 (days/lap)
Do nothing 0.00 0.00 0.00 0.00 8.7 67.0
Dec RBSPA Apogee by 75 kmInc RBSPB Apogee by 75 km 0.70 1.58 0.75 1.70 12.2 35.0
Dec RBSPA Apogee by 75 kmInc RBSPB Perigee by 7 km 0.70 1.58 0.38 1.70 11.5 44.6
Dec RBSPA Apogee by 70 kmInc RBSPB Apogee by 140 km 0.65 1.47 1.40 3.16 13.5 29.4
Dec RBSPA Apogee by 0 kmInc RBSPB Apogee by 210 km 0.00 0.00 0.00 4.74 13.5 29.4
Dec RBSPA Apogee by 140 kmInc RBSPB Apogee by 140 km 1.30 2.95 1.40 3.16 15.1 24.8
3. Extended Mission Maneuver Design and Execution
3.1. Selected Option
In order to balance both science objectives and mission lifetime, the SWG ultimately selectedreducing the RBSPA apogee altitude by 75 km and increasing the RBSPB apogee altitude by 75km. The selected option also gives balanced gains to both petal separation and lapping rate. Therequirement to be satisfied by the set of maneuvers was to increase the difference in apogee altitudesraAB by 140 km throughout the remainder of the mission. Figure 10(a) shows the natural evolutionof raAB varies between 140 km and 165 km throughout the remainder of the mission if no maneuverswere executed. Figure 10(b) shows the evolution of raAB varies between 284 km and 325 km withthe execution of the planned maneuvers, satisfying the science requirement.
11

(a) Relative apogee altitude evolution without maneuvers
(b) Relative apogee altitude evolution with selected maneuvers
Figure 10: Expected raAB evolution in the nominal and maneuvered case
A cause of concern for the selected option arose when inspecting the evolution of the difference inperigee altitudes (Figure 11). Due to solar and lunar perturbations, there are a few months in themission where perigee altitudes cross. However, upon examination of the actual minimum rangebetween the two spacecraft orbit tracks, the maneuver did not have any direct adverse effects oncollision risk. Due to J2 precession of argument of perigee ω , it can be seen in Figure 12 that in bothcases the orbits cross every 200 days, half the 400 day period for a full ω cycle. The indirect effecton collision risk is due to the increased synodic period. Risk of collision between the two spacecraftis heightened during periods where the orbits cross and close approach events occur simultaneously.Figure 13 highlights the periods where this geometry is realized for the remainder of the mission.
12
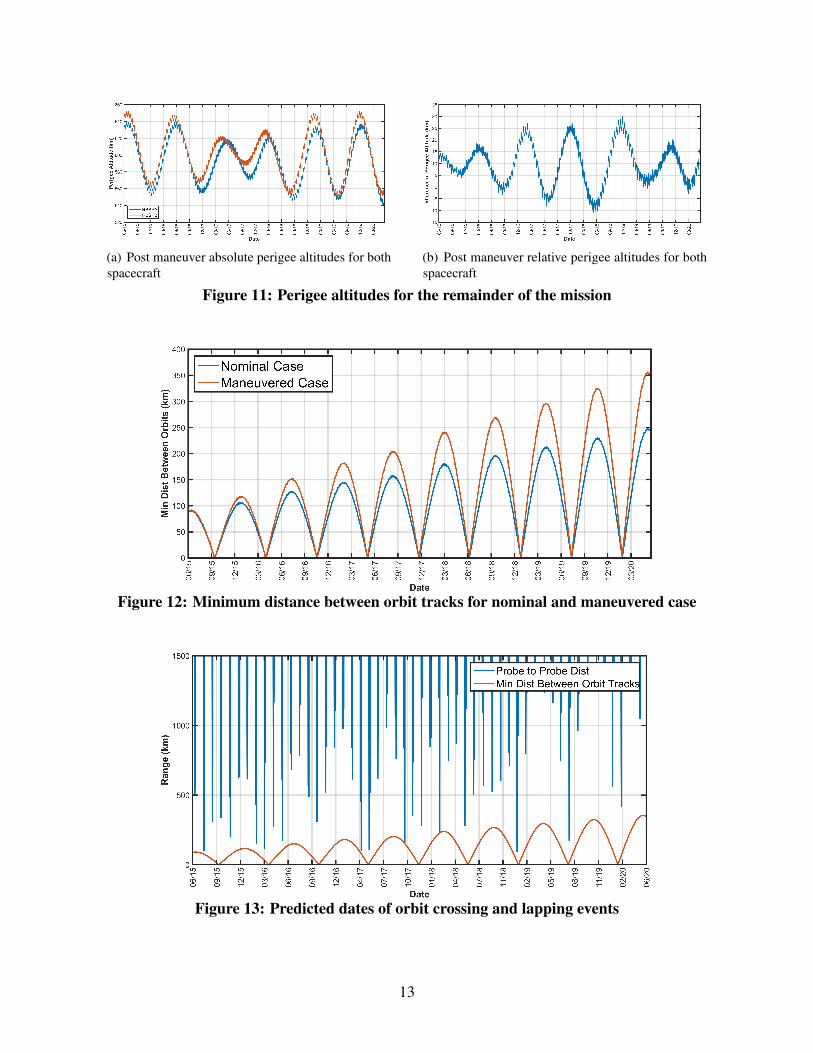
(a) Post maneuver absolute perigee altitudes for bothspacecraft
(b) Post maneuver relative perigee altitudes for bothspacecraft
Figure 11: Perigee altitudes for the remainder of the mission
Figure 12: Minimum distance between orbit tracks for nominal and maneuvered case
Figure 13: Predicted dates of orbit crossing and lapping events
13

3.2. Maneuver Planning
The intended time frame for executing the pair of maneuvers was between March and December2015. As mentioned previously, the P-thrusters that are used to provide ∆v capability are along thespacecraft ±Z axis, with their +Z spin axes pointed in the Sun direction. With thrust limited to onlythe pro-Sun or anti-Sun direction, the optimal time for executing a ∆v is dependent on the solarphase of apsides and declination. Figure 14 shows the values of δSPA during this time period. TheJune 2015 epoch would have been ideal to execute the maneuvers due to a 270 δSPA angle value asthe line of apsides crosses from quadrant III to IV. In this orbit geometry, the sun-pointed spacecraftthrust vector would be tangent to the orbit at perigee. Unfortunately, due to the spacecraft pointed17 below the ecliptic plane, orbit inclination, and the Sun being at its highest declination duringsummer solstice, the minimum value of the angle between the thrust and velocity vector (δTV ) wasabout 50(Figure 14).
δTV became favorable in October 2015. At that time, the δSPA angle diverged from the optimal 270,but still permitted maneuvers of minimum δTV to occur shortly after perigee. To accommodatethe 21-day cadence precession maneuvers, the maneuver date for the extended mission orbit trimmaneuvers was set for 9-Oct-2015.
Figure 14: δSPA and δTV during the maneuver consider time frame
3.3. Maneuver Design
Figure 15 shows the variation in δTV on 9-Oct-2015. In the current orbit geometry (based on δSPA),the minimum values of δTV correspond to perigee passes, where maneuvers to adjust apogee altitudemust be executed. Out of the permissible maneuver times, the 17:15:00 UTC minimum for RBSPAand the 15:30:00 UTC minimum for RBSPB occurred during standard business hours and werepreferred for mission operations. Since the thrust vector is inertially fixed, the larger the orbit arc
14

required to execute the maneuver, the less efficient the maneuver will be. The propellant savingsfrom having several maneuvers over multiple orbits was on the order of a few grams and did notoutweigh the streamlined operations benefits of executing a single maneuver per spacecraft.
Figure 15: Variation in δTV during maneuver epoch
3.3.1. Preliminary Maneuver Specification
The relevant details of the designed maneuvers on each spacecraft can be found in Table 2. Thetargeted apogee altitude is based on the osculating apogee altitude at the subsequent post maneuverapogee passage. Using the latest propulsion system parameters (tank pressure and temperature),estimates of propellant usage were calculated based on maneuver duration. These parameters willbe updated using the latest navigation solution the week of the maneuver.
Table 2: Preliminary Maneuver Details
RBSPA
Pre-Maneuver Apogee Altitude (km) 30512.6Post-Maneuver Apogee Altitude (km) 30437.6Maneuver Start (UTC) 9 Oct 2015 17:00:00.000Duration (sec) 1450∆v (m/s) 2.253Fuel (mg) 686
RBSPB
Pre-Maneuver Apogee Altitude (km) 30675.2Post-Maneuver Apogee Altitude (km) 30750.2Maneuver Start (UTC) 9 Oct 2015 15:22:00.000Duration (sec) 1493∆v (m/s) 2.369Fuel (mg) 740
15

3.3.2. Maneuver Start Time Sensitivity
The Van Allen Probes project exclusively uses the APL18 station in Laurel, MD and the UniversalSpace Network (USN) stations in Hawaii and Australia for ground-based communication. For the10 inclined Van Allen Probe spacecraft, communication from these ground stations isn’t possibleat perigee because of the station latitudes. In order to have timely execution of the maneuvers nearperigee, the maneuvers must be commanded through the Tracking and Data Relay Satellite System(TDRSS). The data link between TDRSS and Van Allen Probes is 1.0 bps. Because of the linklatency and due to common issues resulting in delayed acquisition of signal, delays in the maneuverexecution start time will result in suboptimal maneuver efficiency and falling short of the desiredapogee altitude change. The maneuver baseline objective was to change the altitude by 75 kmfor both spacecraft, with a threshold objective to change the altitude by 70 km. Figure 16 showsthe penalty in achieved altitude change caused by delays in maneuver start time. Based on thesefindings, maneuvers that cannot be initiated within 4 minutes of the prescribed maneuver start timewill be canceled and re-planned for another opportunity.
Figure 16: Effect of delaying the designed maneuver start time
4. Conclusion
The Mission Design and Navigation team has explored several extended mission trajectory options.In order to balance both extended mission Prioritized Science Goals and mission lifetime, theSWG ultimately selected reducing the RBSPA apogee altitude by 75 km and increasing the RBSPBapogee altitude by 75 km. Preliminary maneuver planning and design has been completed andanalysis has shown mission objectives will be achieved. The preliminary maneuver parameters willbe iterated using the latest navigation solution the week of the maneuver.
16

5. References
[1] Mauk, B., Fox, N., Kanekal, S., Kessel, R., Sibeck, D., and Ukhorskiy, A. “Science Objectivesand Rationale for the Radiation Belt Storm Probes Mission.” N. Fox and J. Burch, editors, “TheVan Allen Probes Mission,” pp. 3–27. Springer US, 2014. ISBN 978-1-4899-7432-7.
[2] Kirk, M. N., Rogers, G. D., Fosbury, A. M., Wirzburger, J. H., and Vaughan, R. M. “AttitudeControl and Estimation Activities During Commissioning of the Twin Van Allen ProbesSpacecraft.” AIAA/AAS Spaceflight Mechanics Conference, Kauai Hawaii, Feb. 2013.
[3] Siddique, F. E. and Heyler, G. A. “Mission Design for NASA’s Van Allen Probes Mission.”AIAA/AAS Spaceflight Mechanics Conference, Kauai Hawaii, AAS-13-454, Feb. 2013.
[4] Brouwer, D. “Solution of the problem of artificial satellite theory without drag.” The Astro-nomical Journal, Vol. 64, p. 378, 1959.
[5] Atchison, J. A. and Siddique, F. E. “Review of Mission Design and Navigation for the VanAllen Probes Primary Mission.” AIAA/AAS Spaceflight Mechanics Conference, Vale Colorado,AAS-15-603, Aug. 2015.
Appendix
The geomagnetic coordinate system (MAG) is defined so that its Z-axis is parallel to the magneticdipole axis. The geographic coordinates of the dipole axis from the International GeomagneticReference Field. The Y-axis of this system is perpendicular to the geographic poles such that if D isthe dipole position and S is the south pole Y=DxS. Finally, the X-axis completes a right-handedorthogonal set.
In solar magnetic coordinates (SM) the Z-axis is chosen parallel to the north magnetic pole andthe Y-axis perpendicular to the Earth-Sun line towards dusk. The difference between this systemand the GSM system is a rotation about the Y-axis. The amount of rotation is simply the dipoletilt angle as defined in the previous section. We note that in this system the X-axis does not pointdirectly at the Sun. As with the GSM system, the SM system rotates with both a yearly and dailyperiod with respect to inertial coordinates.
Acknowledgment
The authors wish to acknowledge Gene A. Heyler, who was the Mission Design and NavigationLead for the Van Allen Probes until his passing in March of 2013.
17


![AAE450 Spring 2009 Descent Trajectory Hover Trajectory LD Code Integration John Aitchison March 5 th, 2009 [John Aitchison] [Mission Ops]](https://img.pdfslide.us/doc/110x75/56649d2e5503460f94a04fe7/aae450-spring-2009-descent-trajectory-hover-trajectory-ld-code-integration.jpg)


![ASSESSMENT OF GNC IMPACTS OF CHEMICAL PLUME …issfd.org/ISSFD_2014/ISSFD24_Paper_S9-4_Carnelli.pdf · The Mango spacecraft is part of the PRISMA mission [5] and will be the chaser](https://img.pdfslide.us/doc/110x75/5cde567f88c9930b778ce5fd/assessment-of-gnc-impacts-of-chemical-plume-issfdorgissfd2014issfd24papers9-4.jpg)