Embed Size (px)
Citation preview
1
TRAJECTORY DESIGN OF SOLAR ORBITER
José Manuel Sánchez Pérez ESA-ESOC HSO-GFA, Robert-Bosch-Str. 5, Darmstadt, 64293, Germany, 0049-6151-902494,
Abstract: In the context of the ESA Solar Orbiter mission studies 3 trajectories have been designed, which use unpowered Earth and Venus gravity assist flybys to reach the operational heliocentric orbits with perihelion as close as 0.28 AU (60 solar radii) from which unprecedented Sun observations will be conducted until eventually reaching solar latitudes over 33 deg. This paper presents the design process followed to define the trajectories within the mission requirements and scientific objectives. Keywords: Solar Orbiter, Trajectory Design, Gravity Assists 1. Introduction The ESA Solar Orbiter is one of the approved M-class missions of the ESA’s Cosmic Vision 2015-25 programme. The mission is an international ESA-NASA collaboration on the Sun sciences framed within NASA´s “Living with a Star” programme. ESA leads the mission and spacecraft designs and will be in charge of the operations, while NASA contributes with the launch vehicle and a solid participation in the payload. By approaching the Sun as close as 0.28 AU (60 solar radii) and by reaching an inclination above 33 deg over the Sun equator Solar Orbiter will perform unprecedented science observations of the Sun and the heliosphere including the Sun polar regions. The trajectory design has undergone a consolidation process in the last years. The Solar Orbiter mission now considers 3 launch opportunities leading to similar trajectories in terms of science return. 2 opportunities have been identified for launch in early 2017: the first one opens in January and the second around March. A further launch opportunity in September 2018 offers a mission backup in case of severe programmatic delays. This mission design aims at maximizing the robustness and the probability of success of the Solar Orbiter mission. 2. Requirements Affecting the Trajectory Design The Solar Orbiter mission is devoted to the exploration of the Sun and the heliosphere and will be making observations of the Sun from close-up distances and at high solar latitudes with a 33° goal. To address the scientific objectives (Ref. [1]), the mission profile must allow:
to explore the innermost regions of the solar system using both in situ and remote-sensing instruments
to study the Sun from close distance to fly by the Sun tuned as much as possible to its rotation allowing for observation of the
solar surface and the space above from a near co-rotating point to provide observations of the Sun’s polar regions from out of the ecliptic
2
The spacecraft design presents several challenges due to the operations at very low Sun distances that lead to requirements and constraints affecting the trajectory design:
A heat shield protects the spacecraft from the direct solar flux, thus providing a stable thermal environment and allowing the use of a conventional thermal control subsystem with no need for high temperature tolerant technologies. Solar Orbiter is a 3-axis stabilized spacecraft that will mainly operate in Sun pointing attitude with the heat shield facing the Sun. The AOCS will guarantee that the Sun pointing attitude is maintained within given thresholds, current assumption is a maximum excursions of 6 deg with respect to the spacecraft-Sun line.
The solar array must be able to withstand the extreme solar flux environment at the close perihelions of the science orbits. ESA’s Science Programme Committee identified this in 2009 as a critical technology risk and decided to endorse a “fast-track” approach for Solar Orbiter in order to make maximum re-use of technologies developed for the ESA Bepi-Colombo mission to Mercury. This translates into a strict trajectory requirement of minimum Sun distance above 0.28 AU (60 solar radii).
The maximum distance to the Sun is limited by the capabilities of the spacecraft thermal and power generation systems. The current limit is established at a Sun radius of 1.5 AU, whereas for Sun distances above 1.2 AU it is foreseen to follow a “light hibernation” operational approach in which the spacecraft will switch off non-essential functionalities to reduce the power consumption to a minimum.
In order to minimize the propellant on-board the spacecraft the trajectory shall be completely ballistic, that is, there are no deterministic deep space manoeuvres.
In addition, the launch vehicle considered as baseline option for Solar Orbiter is a NASA provided evolved expendable launch vehicle. The current work assumption is the use of the Atlas V in its lightest version 401, that is capable of injecting the 1800-kg spacecraft separated mass directly into Earth escape orbit with an infinite velocity up to about 4.5 km/s (C3~20.3 km2/s2). Furthermore, operational requirements must be regarded in the trajectory design:
Solar superior conjunctions preventing communication with the spacecraft shall not occur in the proximity of a Gravity Assist Manoeuvre (GAM).
The duration of the periods of solar conjunction should be minimized in order to reduce the autonomy required to the spacecraft.
A safe navigation of the GAMs shall be guaranteed based on the use of radio tracking and Delta-DOR measurements from the ESA Deep Space ground antennas. This leads to constraining the minimum altitude at GAMs to 300 km.
2. Adopted Trajectory Solution Solar Orbiter set of science requirements calls for an operational heliocentric orbit with low perihelion and short period to maximize the number of close-up Sun observations. In order to increase the inclination of the heliocentric orbit without the need of propulsion, an adequate strategy is to perform a series of GAMs in resonance with a planet orbit period. The spacecraft encounters the planet repeatedly at the same location in space and increases progressively the inclination after each GAM. Such strategy favors the use of Venus for the GAMs during the science phase in order to stay closer to the Sun and provide more observation opportunities. A
3
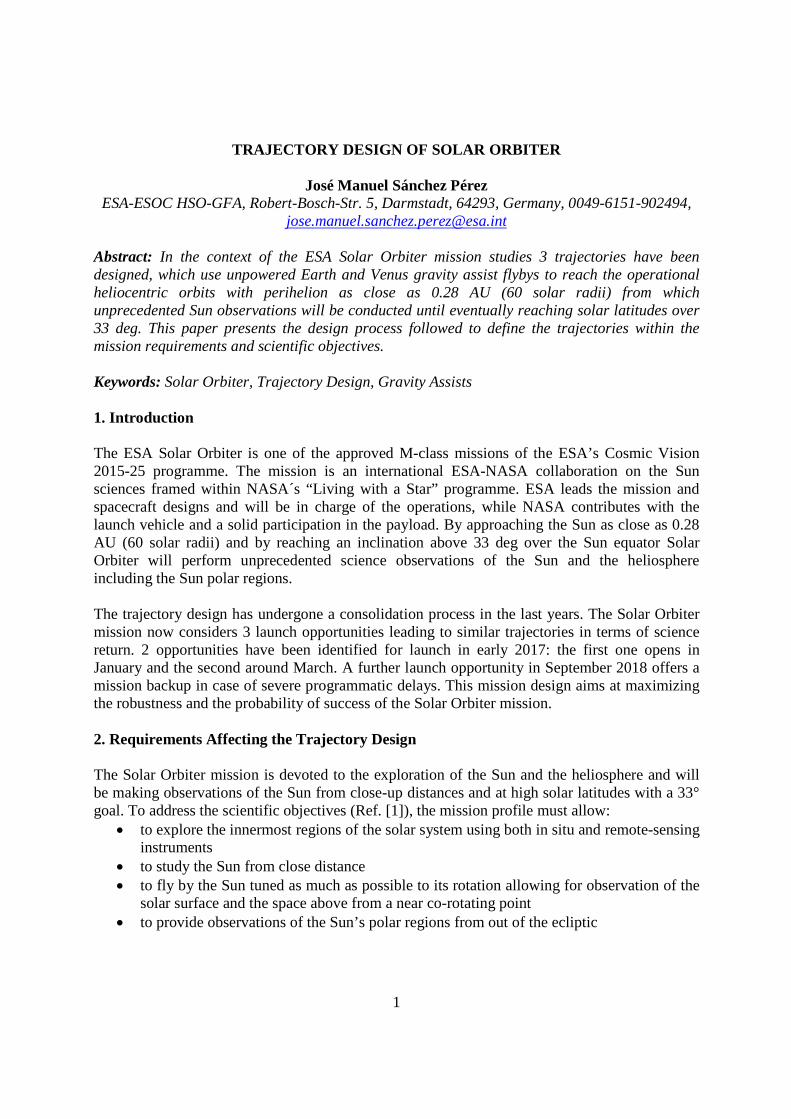
final science orbit with 3:2 resonance ratio (spacecraft revolutions:Venus revolutions) has been identified as a good compromise between number of observations and rate of inclination increase. To maximize the inclination increase Venus has to be reached with high infinite velocity and close to one of the nodes of its orbit on the Sun equator. Previous studies demonstrate that a hyperbolic velocity of at least 18 km/s is necessary to satisfy the mission goal of a final solar inclination over 33 deg (Ref. [3], [7]). 2.1. Analysis of Transfer Strategies The trajectory problem of Solar Orbiter can be divided in two parts: first, the transfer to Venus in order to achieve adequate arriving conditions; and second, the sequence of resonances during the operational science phase. The transfer problem is analyzed first from an energetic point of view by means of the Tisserand graph showing Rp vs. Period in Fig. 1, in which the dynamics are simplified to a plane and planets orbits are assumed circular ([2]). For each planet the isolines of equal relative velocity (blue for the Earth, red for Venus) represent the set of elliptic orbits intersecting the planet orbit with a given relative velocity. These curves are enveloped by a horizontal line representing the orbits tangent at perihelion and an inclined line representing the orbits tangent at aphelion. The two envelopes are crossing at the point representing the planet’s orbit. During an unpowered GAM the hyperbolic velocity vector of the spacecraft is deflected by the gravity of the planet, but the modulus remains constant and thus the pre- and post-GAM heliocentric orbits lie in the same isoline. The effect of a GAM is thus a displacement in the isoline. The deflection obtained from a GAM can be increased flying-by closer to the planet, but there is a limit since the minimum altitude must be higher than the regarded 300 km constraint. From the Tisserand graph it can be concluded that reaching high relative velocities with Venus of the order of 18 km/s requires a relative velocity with the Earth of at least about 9 km/s. Obtaining this escape velocity directly at launch would require a heavy and expensive launcher. Alternatively the Earth escape velocity at launch can be greatly reduced by including a sequence of Venus and Earth GAMs. First a Venus GAM increases the orbit period and allows reaching the Earth with a relative velocity over the required 9 km/s. Then two consecutive Earth GAMs are generally required to deflect the spacecraft velocity in order to reduce the perihelion and orbit period encountering Venus with over 18 km/s. The arc between the two Earth GAMs can be a pure resonance, 1:1 or 3:2 (S/C orbits : Earth orbits) in order not to penalize the travel time, or a so-called pseudo-resonance in which the spacecraft orbit lies in the ecliptic plane encountering the Earth at two different points of its orbit. Figure 1 shows superimposed to the V-infinity isolines the approximated orbits (crosses) and GAMs (dashed lines) of the 3 transfer trajectories currently regarded for Solar Orbiter. The orbit arc from Earth launch to Venus is in all the cases close to the orbits with aphelion at the Earth. The Venus GAM raises the infinite velocity with the Earth and the aphelion radius up to about 1.47 AU for the 2017 March trajectory. Then the first Earth GAM reduces largely the orbit
4
period and perihelion. The 2017 January trajectory makes use of a 3:2 resonance, while the other two trajectories use a pseudo-resonance with an slightly higher period such that the spacecraft describes more than two revolutions while the Earth describes almost 2 revolutions in 22 months. After the second Earth GAM the spacecraft is injected in an orbit with perihelion about 0.3 AU with an infinite velocity of 18-20 km/s with respect to Venus, which is then adequate to start the science phase with the sequence of Venus resonances. This strategy enables the mission with Earth escape velocities as low as 3 to 4 km/s using lighter launch vehicles (Atlas V lightest version 401). However, the drawbacks are an increase of the duration of the cruise phase before reaching the operational orbit and the need to increase the aphelion radius considerably beyond Sun-Earth distance during the Venus-Earth arc.
0.2
0.3
0.4
0.5
0.6
0.7
0.8
0.9
1
1.1
175 200 225 250 275 300 325 350 375 400 425
Per
ihel
ion
Rad
ius
- R
p (A
U)
Period (days)
2
2
3
3
4
4
5
5
6
6
8
8
10
10
12
12
14
14
46
810
1214
1618
2022
Venus
Earth
0.2
0.3
0.4
0.5
0.6
0.7
0.8
0.9
1
1.1
175 200 225 250 275 300 325 350 375 400 425
Per
ihel
ion
Rad
ius
- R
p (A
U)
Period (days)
2017 Jan2017 Mar2018 Sep
0.2
0.3
0.4
0.5
0.6
0.7
0.8
0.9
1
1.1
175 200 225 250 275 300 325 350 375 400 425
Per
ihel
ion
Rad
ius
- R
p (A
U)
Period (days)
1:13:2 4:35:3Earth Resonance (SC:Earth)
1.3 1.4 1.5 1.6 1.7 <- Fixed Ra (AU)
Figure 1. Venus-Earth Tisserand Graph: Rp-T.
2.2. Solution of Transfer Trajectories The previous simplified analysis does not involve the phasing between Earth and Venus and the timing of the planet encounters. This problem has been solved via systematic search of trajectories with launch on the 2017-2018 timeframe. Although the VEEV-GA strategy as described above is the most promising, a more general analysis has been carried out that considered as well VEV-GA and VEVEV-GA transfers. The VEV-GA strategy can lead to short transfer times, but good conditions for the science phase typically require high infinite velocities at launch and reaching high Sun distances. The VEVEV-GA transfers are typically penalized by longer transfer times and an additional GAM that requires extra propellant for the navigation.
5
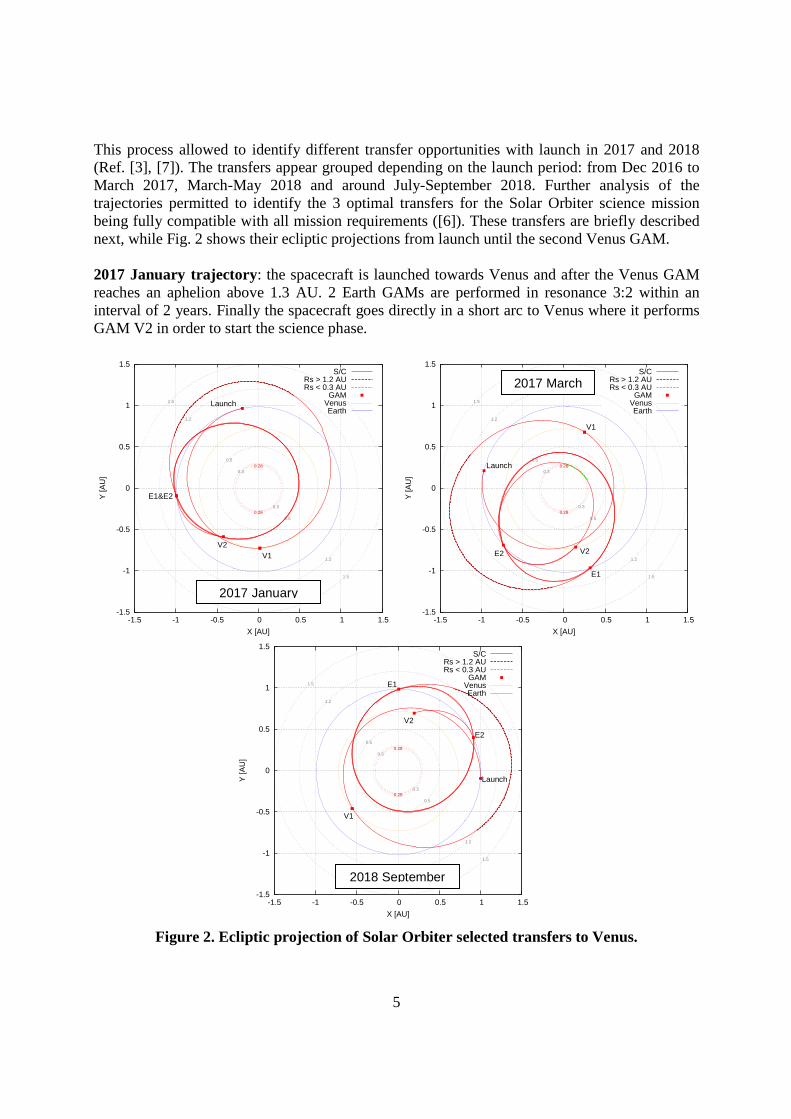
This process allowed to identify different transfer opportunities with launch in 2017 and 2018 (Ref. [3], [7]). The transfers appear grouped depending on the launch period: from Dec 2016 to March 2017, March-May 2018 and around July-September 2018. Further analysis of the trajectories permitted to identify the 3 optimal transfers for the Solar Orbiter science mission being fully compatible with all mission requirements ([6]). These transfers are briefly described next, while Fig. 2 shows their ecliptic projections from launch until the second Venus GAM. 2017 January trajectory: the spacecraft is launched towards Venus and after the Venus GAM reaches an aphelion above 1.3 AU. 2 Earth GAMs are performed in resonance 3:2 within an interval of 2 years. Finally the spacecraft goes directly in a short arc to Venus where it performs GAM V2 in order to start the science phase.
-1.5
-1
-0.5
0
0.5
1
1.5
-1.5 -1 -0.5 0 0.5 1 1.5
Y [A
U]
X [AU]
S/CRs > 1.2 AURs < 0.3 AU
GAMVenusEarth
1.2
1.2
1.5
1.5
0.3
0.3
0.28
0.28
0.5
0.5
-1.5
-1
-0.5
0
0.5
1
1.5
-1.5 -1 -0.5 0 0.5 1 1.5
Y [A
U]
X [AU]
S/CRs > 1.2 AURs < 0.3 AU
GAMVenusEarth
1.2
1.2
1.5
1.5
0.3
0.3
0.28
0.28
0.5
0.5
-1.5
-1
-0.5
0
0.5
1
1.5
-1.5 -1 -0.5 0 0.5 1 1.5
Y [A
U]
X [AU]
S/CRs > 1.2 AURs < 0.3 AU
GAMVenusEarth
1.2
1.2
1.5
1.5
0.3
0.3
0.28
0.28
0.5
0.5
Figure 2. Ecliptic projection of Solar Orbiter selected transfers to Venus.
2018 September
Launch
V1
E1
E2
V2
2017 March
Launch
V1
E1
E2 V2
2017 January
Launch
V1
E1&E2
V2
6
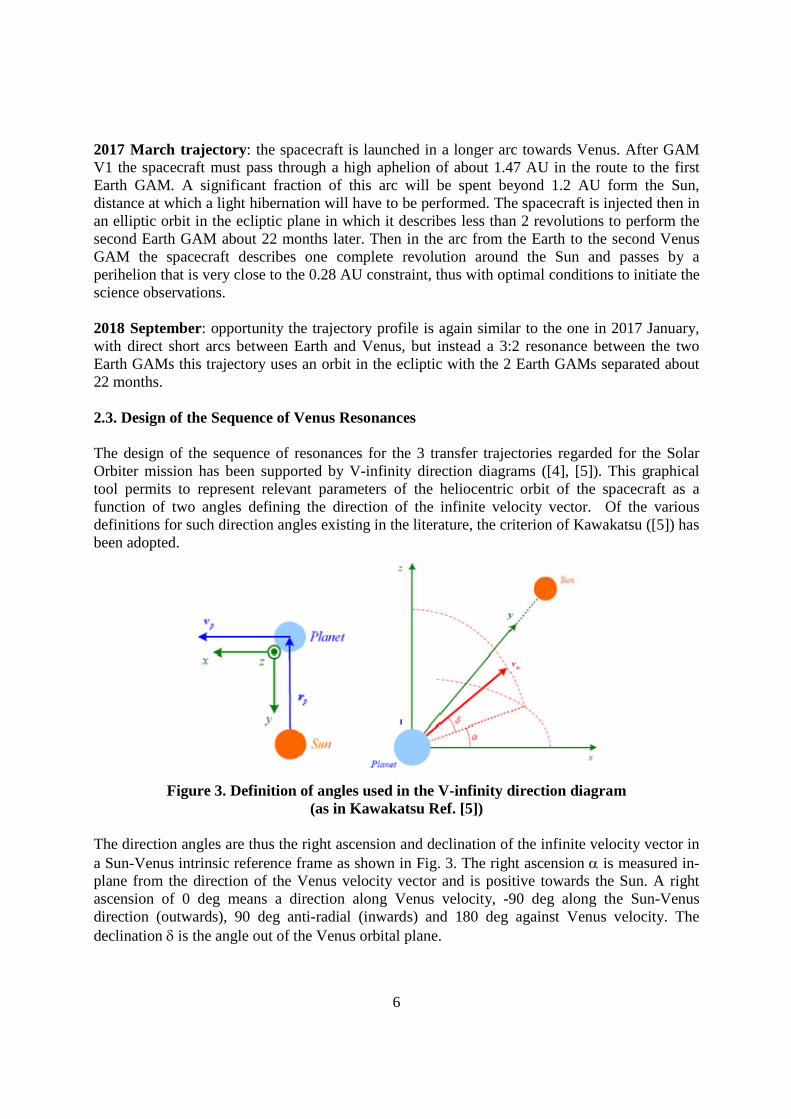
2017 March trajectory: the spacecraft is launched in a longer arc towards Venus. After GAM V1 the spacecraft must pass through a high aphelion of about 1.47 AU in the route to the first Earth GAM. A significant fraction of this arc will be spent beyond 1.2 AU form the Sun, distance at which a light hibernation will have to be performed. The spacecraft is injected then in an elliptic orbit in the ecliptic plane in which it describes less than 2 revolutions to perform the second Earth GAM about 22 months later. Then in the arc from the Earth to the second Venus GAM the spacecraft describes one complete revolution around the Sun and passes by a perihelion that is very close to the 0.28 AU constraint, thus with optimal conditions to initiate the science observations. 2018 September: opportunity the trajectory profile is again similar to the one in 2017 January, with direct short arcs between Earth and Venus, but instead a 3:2 resonance between the two Earth GAMs this trajectory uses an orbit in the ecliptic with the 2 Earth GAMs separated about 22 months. 2.3. Design of the Sequence of Venus Resonances The design of the sequence of resonances for the 3 transfer trajectories regarded for the Solar Orbiter mission has been supported by V-infinity direction diagrams ([4], [5]). This graphical tool permits to represent relevant parameters of the heliocentric orbit of the spacecraft as a function of two angles defining the direction of the infinite velocity vector. Of the various definitions for such direction angles existing in the literature, the criterion of Kawakatsu ([5]) has been adopted.
Figure 3. Definition of angles used in the V-infinity direction diagram
(as in Kawakatsu Ref. [5]) The direction angles are thus the right ascension and declination of the infinite velocity vector in a Sun-Venus intrinsic reference frame as shown in Fig. 3. The right ascension is measured in-plane from the direction of the Venus velocity vector and is positive towards the Sun. A right ascension of 0 deg means a direction along Venus velocity, -90 deg along the Sun-Venus direction (outwards), 90 deg anti-radial (inwards) and 180 deg against Venus velocity. The declination is the angle out of the Venus orbital plane.
7
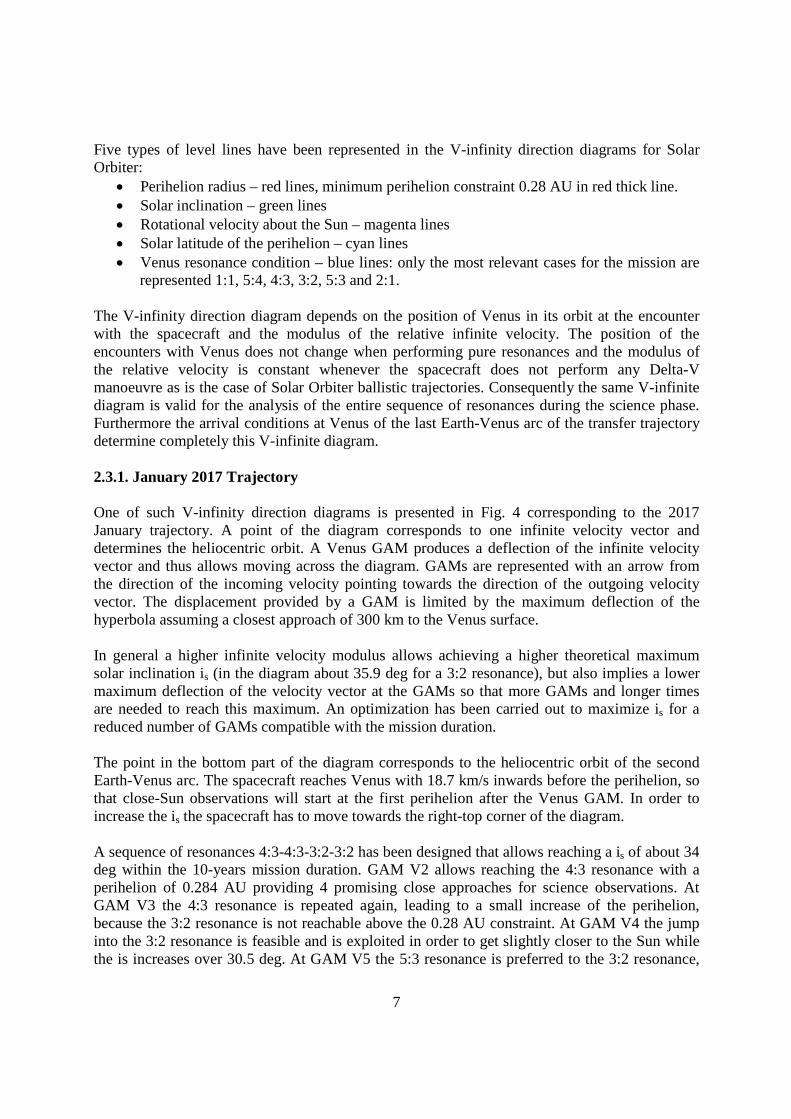
Five types of level lines have been represented in the V-infinity direction diagrams for Solar Orbiter:
Perihelion radius – red lines, minimum perihelion constraint 0.28 AU in red thick line. Solar inclination – green lines Rotational velocity about the Sun – magenta lines Solar latitude of the perihelion – cyan lines Venus resonance condition – blue lines: only the most relevant cases for the mission are
represented 1:1, 5:4, 4:3, 3:2, 5:3 and 2:1. The V-infinity direction diagram depends on the position of Venus in its orbit at the encounter with the spacecraft and the modulus of the relative infinite velocity. The position of the encounters with Venus does not change when performing pure resonances and the modulus of the relative velocity is constant whenever the spacecraft does not perform any Delta-V manoeuvre as is the case of Solar Orbiter ballistic trajectories. Consequently the same V-infinite diagram is valid for the analysis of the entire sequence of resonances during the science phase. Furthermore the arrival conditions at Venus of the last Earth-Venus arc of the transfer trajectory determine completely this V-infinite diagram. 2.3.1. January 2017 Trajectory One of such V-infinity direction diagrams is presented in Fig. 4 corresponding to the 2017 January trajectory. A point of the diagram corresponds to one infinite velocity vector and determines the heliocentric orbit. A Venus GAM produces a deflection of the infinite velocity vector and thus allows moving across the diagram. GAMs are represented with an arrow from the direction of the incoming velocity pointing towards the direction of the outgoing velocity vector. The displacement provided by a GAM is limited by the maximum deflection of the hyperbola assuming a closest approach of 300 km to the Venus surface. In general a higher infinite velocity modulus allows achieving a higher theoretical maximum solar inclination is (in the diagram about 35.9 deg for a 3:2 resonance), but also implies a lower maximum deflection of the velocity vector at the GAMs so that more GAMs and longer times are needed to reach this maximum. An optimization has been carried out to maximize is for a reduced number of GAMs compatible with the mission duration. The point in the bottom part of the diagram corresponds to the heliocentric orbit of the second Earth-Venus arc. The spacecraft reaches Venus with 18.7 km/s inwards before the perihelion, so that close-Sun observations will start at the first perihelion after the Venus GAM. In order to increase the is the spacecraft has to move towards the right-top corner of the diagram. A sequence of resonances 4:3-4:3-3:2-3:2 has been designed that allows reaching a is of about 34 deg within the 10-years mission duration. GAM V2 allows reaching the 4:3 resonance with a perihelion of 0.284 AU providing 4 promising close approaches for science observations. At GAM V3 the 4:3 resonance is repeated again, leading to a small increase of the perihelion, because the 3:2 resonance is not reachable above the 0.28 AU constraint. At GAM V4 the jump into the 3:2 resonance is feasible and is exploited in order to get slightly closer to the Sun while the is increases over 30.5 deg. At GAM V5 the 5:3 resonance is preferred to the 3:2 resonance,
8
because it can still be accommodated within the mission duration and provides another phase with a number of close approaches below 0.3 AU from the Sun and the difference in final inclination is not significant.
0
5
10
15
20
25
30
35
40
45
50
55
60
90 95 100 105 110 115 120 125 130 135 140 145 150 155 160 165 170 175 180
Dec
linat
ion
[deg
]
Right ascension [deg]
X
X
X
X
X
Rp [AU]i [deg]
ResonancesRotvel per. (Uz) [deg/day]
Latitude per. [deg]
0.6
0.5
0.5
0.5
0.4
0.4
0.4
0.3
0.3
0.3
0.2
0.2
0.1
35
30
30
30
25
25
25
20
20
20
15
15
1510
1010
55 5
2:1
2:1
5:3
5:3
3:2
3:2
3:2
4:3
4:3
5:4
5:4
1:1
1:1
1:1
0.28
0.28
0.28
30
20
20
16
16
16
14
14
12
12
10
10
10
8
8
8
6
6
6
4
4
4
4
30
25
25
20
20
20
15
15
15
10
10
10
5
5
5
5
Figure 4. 2017 Jan trajectory: V-infinity direction diagram.
In the design of the sequence of resonances also operational constraints have been considered. Solar conjunctions occurring close to a GAM prevent an appropriate navigation and may represent a risk of mission loss that has to be avoided. A superior conjunction between the Earth and Venus occurs about 4 Venus revolutions after GAM V2. A GAM shall not be planned for this particular time, which prevents starting the science phase with a 5:4 or 1:1-4-3 resonances. 2.3.2. March 2017 Trajectory Figure 5 shows the V-infinity direction diagram for the 2017 Mar trajectory. The point in the bottom part of the plot corresponds to the second Earth-Venus arc and shows that the spacecraft is arriving to Venus with a perihelion located at the 0.28 AU constraint. Contrarily to the other trajectories, in this case the spacecraft gives a complete revolution around the Sun in the Earth-Venus arc and so an optimal opportunity for a close-up Sun observation is provided around this perihelion. Therefore for this case the start of the science phase can be anticipated to GAM V2. Due to the high infinite velocity of 20.38 km/s the theoretical maximum is in a 3:2 Venus resonant orbit is 39.2 deg. A sequence 1:1-1:1-4:3-3:2-3:2 has been designed that is consistent
GAM V2
GAM V4
GAM V5
GAM V3
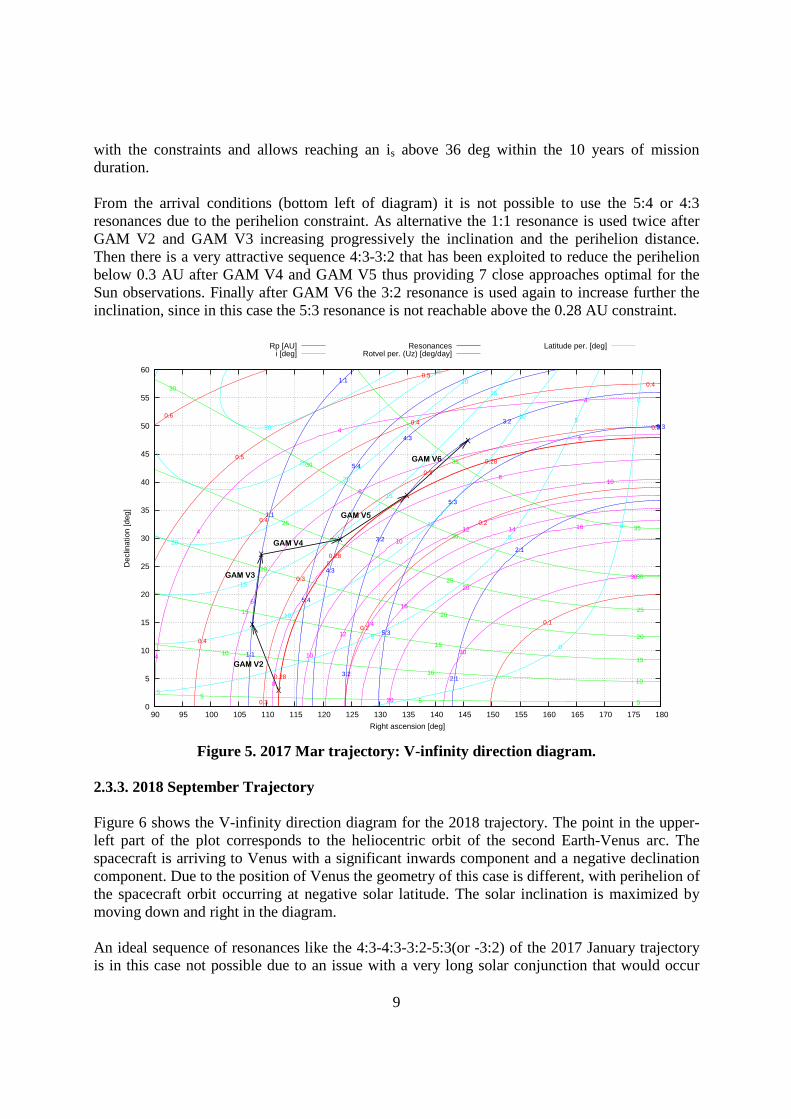
9
with the constraints and allows reaching an is above 36 deg within the 10 years of mission duration. From the arrival conditions (bottom left of diagram) it is not possible to use the 5:4 or 4:3 resonances due to the perihelion constraint. As alternative the 1:1 resonance is used twice after GAM V2 and GAM V3 increasing progressively the inclination and the perihelion distance. Then there is a very attractive sequence 4:3-3:2 that has been exploited to reduce the perihelion below 0.3 AU after GAM V4 and GAM V5 thus providing 7 close approaches optimal for the Sun observations. Finally after GAM V6 the 3:2 resonance is used again to increase further the inclination, since in this case the 5:3 resonance is not reachable above the 0.28 AU constraint.
0
5
10
15
20
25
30
35
40
45
50
55
60
90 95 100 105 110 115 120 125 130 135 140 145 150 155 160 165 170 175 180
Dec
linat
ion
[deg
]
Right ascension [deg]
X
X
X
X
X
X
Rp [AU]i [deg]
ResonancesRotvel per. (Uz) [deg/day]
Latitude per. [deg]
0.6
0.5
0.5
0.4
0.4
0.4
0.4
0.3
0.3
0.3
0.3
0.2
0.20.1
35
35
30
30
30
30
25
25
25
20
20
20
15
15
1510
1010
55 5
2:1
2:1
5:3
5:3
5:3
3:2
3:2
3:2
4:3
4:3
5:4
5:4
1:1
1:1
1:1
0.28
0.28
0.28
30
30
20
20
16
16
14
14
12
12
10
10
10
8
8
8
6
6
6
4
4
4
4
30
25
25
20
20
20
15
15
15
10
10
10
5
5
5
5
0
0
0
Figure 5. 2017 Mar trajectory: V-infinity direction diagram.
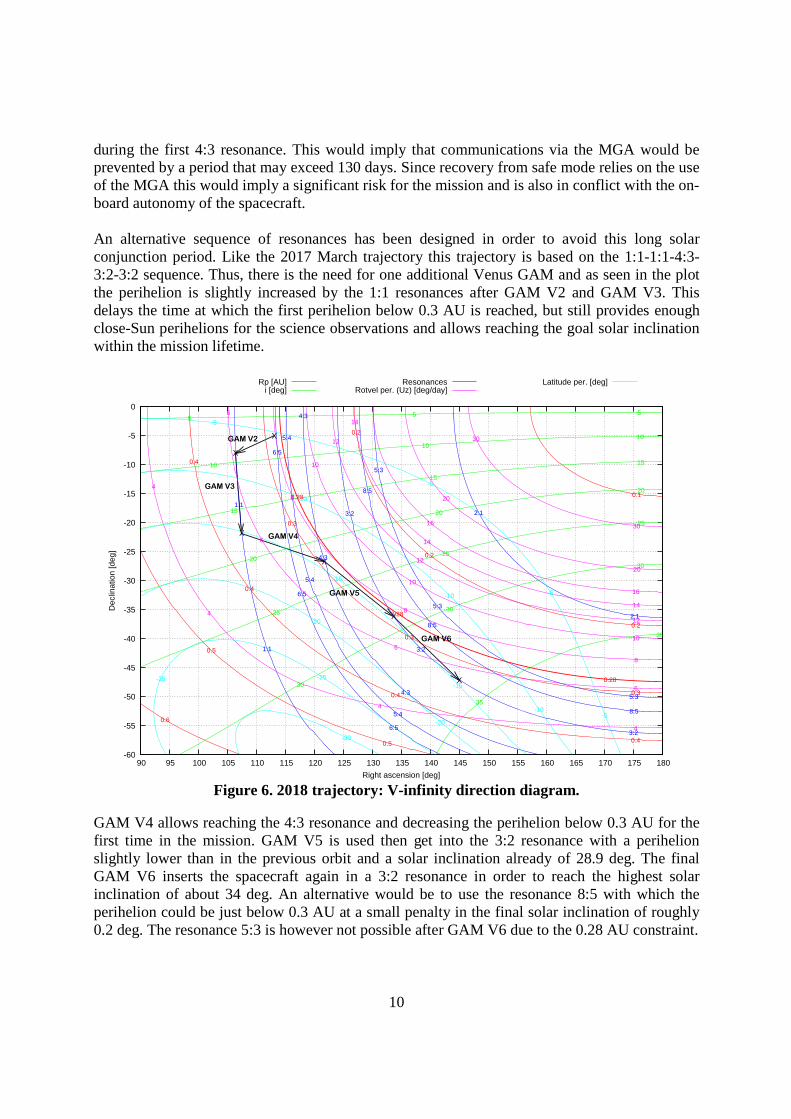
2.3.3. 2018 September Trajectory Figure 6 shows the V-infinity direction diagram for the 2018 trajectory. The point in the upper-left part of the plot corresponds to the heliocentric orbit of the second Earth-Venus arc. The spacecraft is arriving to Venus with a significant inwards component and a negative declination component. Due to the position of Venus the geometry of this case is different, with perihelion of the spacecraft orbit occurring at negative solar latitude. The solar inclination is maximized by moving down and right in the diagram. An ideal sequence of resonances like the 4:3-4:3-3:2-5:3(or -3:2) of the 2017 January trajectory is in this case not possible due to an issue with a very long solar conjunction that would occur
GAM V2
GAM V4
GAM V5
GAM V3
GAM V6
10
during the first 4:3 resonance. This would imply that communications via the MGA would be prevented by a period that may exceed 130 days. Since recovery from safe mode relies on the use of the MGA this would imply a significant risk for the mission and is also in conflict with the on-board autonomy of the spacecraft. An alternative sequence of resonances has been designed in order to avoid this long solar conjunction period. Like the 2017 March trajectory this trajectory is based on the 1:1-1:1-4:3-3:2-3:2 sequence. Thus, there is the need for one additional Venus GAM and as seen in the plot the perihelion is slightly increased by the 1:1 resonances after GAM V2 and GAM V3. This delays the time at which the first perihelion below 0.3 AU is reached, but still provides enough close-Sun perihelions for the science observations and allows reaching the goal solar inclination within the mission lifetime.
-60
-55
-50
-45
-40
-35
-30
-25
-20
-15
-10
-5
0
90 95 100 105 110 115 120 125 130 135 140 145 150 155 160 165 170 175 180
Dec
linat
ion
[deg
]
Right ascension [deg]
X
X
X
X
X
X
Rp [AU]i [deg]
ResonancesRotvel per. (Uz) [deg/day]
Latitude per. [deg]
0.6
0.5
0.5
0.4
0.4
0.4
0.4
0.3
0.3
0.3
0.2
0.2
0.2
0.1
35
35
30
30
30
25
25
25
20
20
20
15
15
1510
1010
55 5
2:1
2:1
5:3
5:3
5:3
8:5
8:5
8:5
3:2
3:2
3:2
4:3
4:3
4:3
5:4
5:4
5:4
6:5
6:5
6:5
1:1
1:1
0.28
0.28
0.28
30
30
20
20
16
16
14
14
14
12
12
12
10
10
10
8
8
8
6
6
6
6
4
4
4
4
-5
-5
-5
-5
-10
-10
-10
-15
-15
-20
-20
-25-25
-30
Figure 6. 2018 trajectory: V-infinity direction diagram.
GAM V4 allows reaching the 4:3 resonance and decreasing the perihelion below 0.3 AU for the first time in the mission. GAM V5 is used then get into the 3:2 resonance with a perihelion slightly lower than in the previous orbit and a solar inclination already of 28.9 deg. The final GAM V6 inserts the spacecraft again in a 3:2 resonance in order to reach the highest solar inclination of about 34 deg. An alternative would be to use the resonance 8:5 with which the perihelion could be just below 0.3 AU at a small penalty in the final solar inclination of roughly 0.2 deg. The resonance 5:3 is however not possible after GAM V6 due to the 0.28 AU constraint.
GAM V2
GAM V4
GAM V5
GAM V3
GAM V6
11
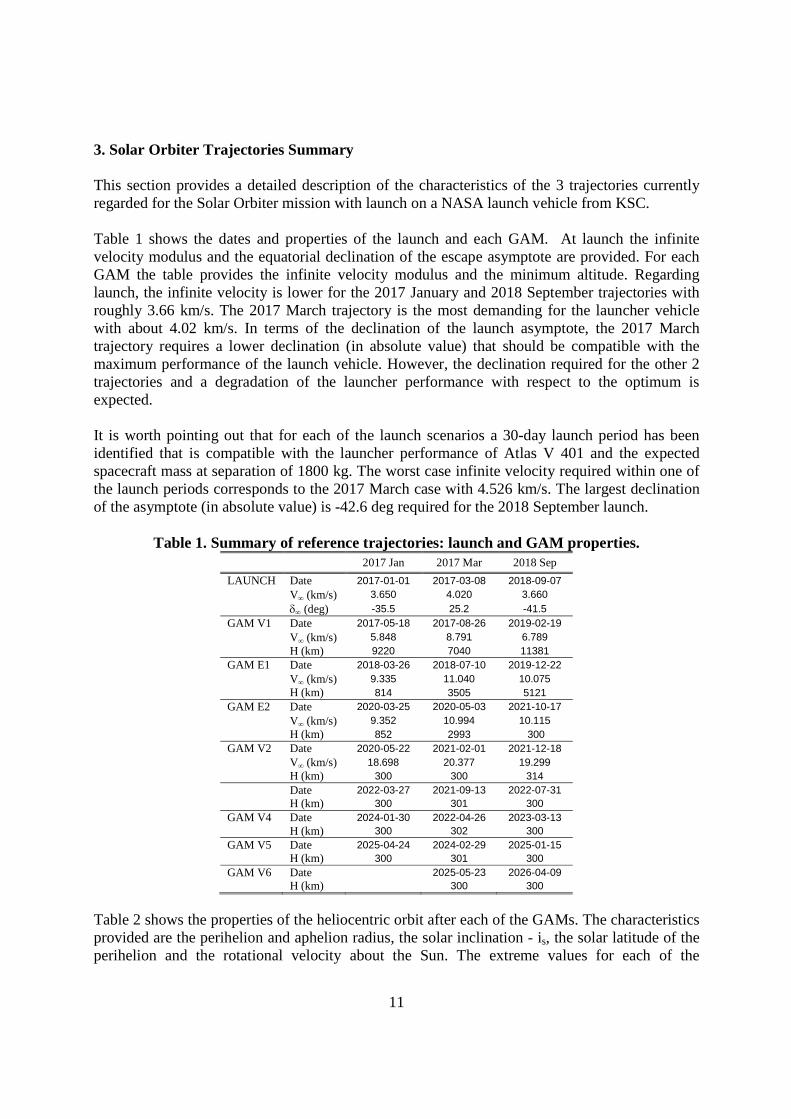
3. Solar Orbiter Trajectories Summary This section provides a detailed description of the characteristics of the 3 trajectories currently regarded for the Solar Orbiter mission with launch on a NASA launch vehicle from KSC. Table 1 shows the dates and properties of the launch and each GAM. At launch the infinite velocity modulus and the equatorial declination of the escape asymptote are provided. For each GAM the table provides the infinite velocity modulus and the minimum altitude. Regarding launch, the infinite velocity is lower for the 2017 January and 2018 September trajectories with roughly 3.66 km/s. The 2017 March trajectory is the most demanding for the launcher vehicle with about 4.02 km/s. In terms of the declination of the launch asymptote, the 2017 March trajectory requires a lower declination (in absolute value) that should be compatible with the maximum performance of the launch vehicle. However, the declination required for the other 2 trajectories and a degradation of the launcher performance with respect to the optimum is expected. It is worth pointing out that for each of the launch scenarios a 30-day launch period has been identified that is compatible with the launcher performance of Atlas V 401 and the expected spacecraft mass at separation of 1800 kg. The worst case infinite velocity required within one of the launch periods corresponds to the 2017 March case with 4.526 km/s. The largest declination of the asymptote (in absolute value) is -42.6 deg required for the 2018 September launch.
Table 1. Summary of reference trajectories: launch and GAM properties. 2017 Jan 2017 Mar 2018 Sep
LAUNCH Date 2017-01-01 2017-03-08 2018-09-07 V (km/s) 3.650 4.020 3.660 (deg) -35.5 25.2 -41.5 GAM V1 Date 2017-05-18 2017-08-26 2019-02-19 V (km/s) 5.848 8.791 6.789 H (km) 9220 7040 11381 GAM E1 Date 2018-03-26 2018-07-10 2019-12-22 V (km/s) 9.335 11.040 10.075 H (km) 814 3505 5121 GAM E2 Date 2020-03-25 2020-05-03 2021-10-17 V (km/s) 9.352 10.994 10.115 H (km) 852 2993 300 GAM V2 Date 2020-05-22 2021-02-01 2021-12-18 V (km/s) 18.698 20.377 19.299 H (km) 300 300 314 Date 2022-03-27 2021-09-13 2022-07-31 H (km) 300 301 300 GAM V4 Date 2024-01-30 2022-04-26 2023-03-13 H (km) 300 302 300 GAM V5 Date 2025-04-24 2024-02-29 2025-01-15 H (km) 300 301 300 GAM V6 Date 2025-05-23 2026-04-09 H (km) 300 300
Table 2 shows the properties of the heliocentric orbit after each of the GAMs. The characteristics provided are the perihelion and aphelion radius, the solar inclination - is, the solar latitude of the perihelion and the rotational velocity about the Sun. The extreme values for each of the
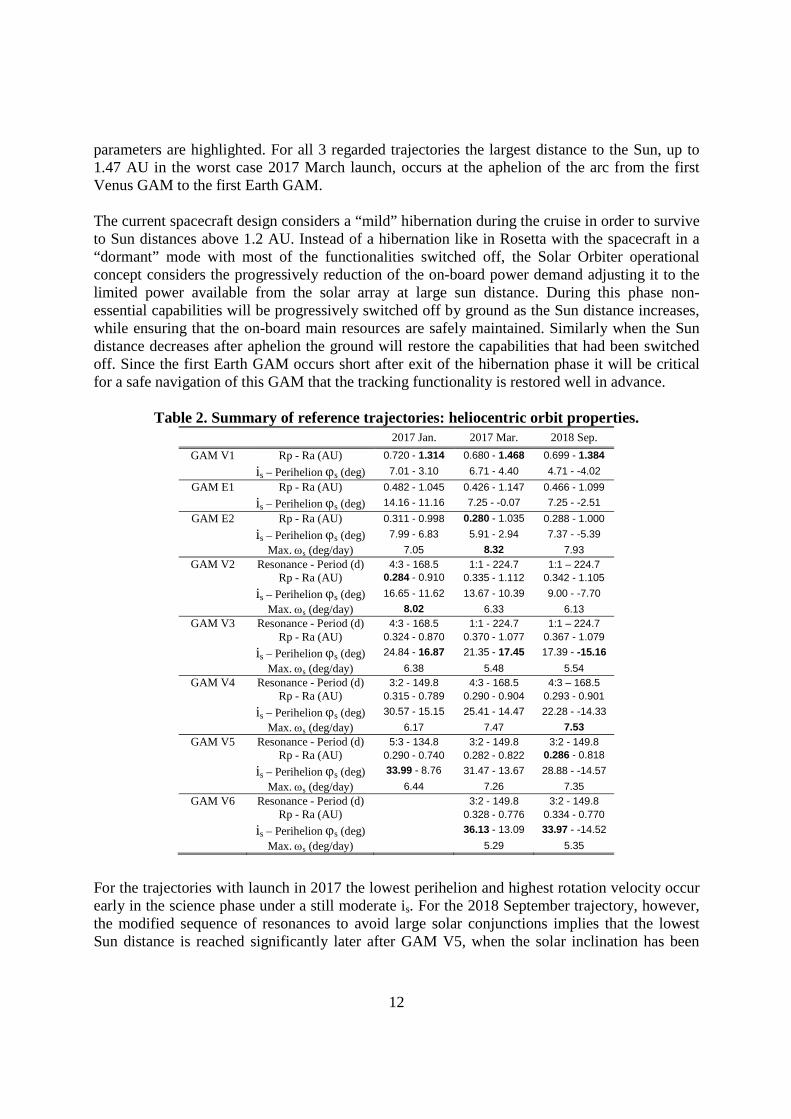
12
parameters are highlighted. For all 3 regarded trajectories the largest distance to the Sun, up to 1.47 AU in the worst case 2017 March launch, occurs at the aphelion of the arc from the first Venus GAM to the first Earth GAM. The current spacecraft design considers a “mild” hibernation during the cruise in order to survive to Sun distances above 1.2 AU. Instead of a hibernation like in Rosetta with the spacecraft in a “dormant” mode with most of the functionalities switched off, the Solar Orbiter operational concept considers the progressively reduction of the on-board power demand adjusting it to the limited power available from the solar array at large sun distance. During this phase non-essential capabilities will be progressively switched off by ground as the Sun distance increases, while ensuring that the on-board main resources are safely maintained. Similarly when the Sun distance decreases after aphelion the ground will restore the capabilities that had been switched off. Since the first Earth GAM occurs short after exit of the hibernation phase it will be critical for a safe navigation of this GAM that the tracking functionality is restored well in advance.
Table 2. Summary of reference trajectories: heliocentric orbit properties. 2017 Jan. 2017 Mar. 2018 Sep.
GAM V1 Rp - Ra (AU) 0.720 - 1.314 0.680 - 1.468 0.699 - 1.384 is – Perihelion s (deg) 7.01 - 3.10 6.71 - 4.40 4.71 - -4.02
GAM E1 Rp - Ra (AU) 0.482 - 1.045 0.426 - 1.147 0.466 - 1.099 is – Perihelion s (deg) 14.16 - 11.16 7.25 - -0.07 7.25 - -2.51
GAM E2 Rp - Ra (AU) 0.311 - 0.998 0.280 - 1.035 0.288 - 1.000 is – Perihelion s (deg) 7.99 - 6.83 5.91 - 2.94 7.37 - -5.39 Max. s (deg/day) 7.05 8.32 7.93
GAM V2 Resonance - Period (d) 4:3 - 168.5 1:1 - 224.7 1:1 – 224.7 Rp - Ra (AU) 0.284 - 0.910 0.335 - 1.112 0.342 - 1.105 is – Perihelion s (deg) 16.65 - 11.62 13.67 - 10.39 9.00 - -7.70 Max. s (deg/day) 8.02 6.33 6.13
GAM V3 Resonance - Period (d) 4:3 - 168.5 1:1 - 224.7 1:1 – 224.7 Rp - Ra (AU) 0.324 - 0.870 0.370 - 1.077 0.367 - 1.079 is – Perihelion s (deg) 24.84 - 16.87 21.35 - 17.45 17.39 - -15.16 Max. s (deg/day) 6.38 5.48 5.54
GAM V4 Resonance - Period (d) 3:2 - 149.8 4:3 - 168.5 4:3 – 168.5 Rp - Ra (AU) 0.315 - 0.789 0.290 - 0.904 0.293 - 0.901 is – Perihelion s (deg) 30.57 - 15.15 25.41 - 14.47 22.28 - -14.33 Max. s (deg/day) 6.17 7.47 7.53
GAM V5 Resonance - Period (d) 5:3 - 134.8 3:2 - 149.8 3:2 - 149.8 Rp - Ra (AU) 0.290 - 0.740 0.282 - 0.822 0.286 - 0.818 is – Perihelion s (deg) 33.99 - 8.76 31.47 - 13.67 28.88 - -14.57 Max. s (deg/day) 6.44 7.26 7.35
GAM V6 Resonance - Period (d) 3:2 - 149.8 3:2 - 149.8 Rp - Ra (AU) 0.328 - 0.776 0.334 - 0.770 is – Perihelion s (deg) 36.13 - 13.09 33.97 - -14.52 Max. s (deg/day) 5.29 5.35
For the trajectories with launch in 2017 the lowest perihelion and highest rotation velocity occur early in the science phase under a still moderate is. For the 2018 September trajectory, however, the modified sequence of resonances to avoid large solar conjunctions implies that the lowest Sun distance is reached significantly later after GAM V5, when the solar inclination has been
13
raised already to almost 29 deg. For this trajectory too the highest rotation velocity occurs later and is slightly smaller than for the other two trajectories. Table 3 presents a summary of properties that are relevant for the mission performance and the scientific goals. In addition, some parameters are added that are relevant for the operations and the spacecraft design. Thus Solar Orbiter will be required to communicate with the Earth at a maximum distance of 2 AU. This largest Earth distance occurs in all the cases about 3.7 years after launch when Solar Orbit is already in the science operational orbit. The longest duration of the solar conjunctions determine the required on-board autonomy of the spacecraft. The HGA will be used for the nominal communications with the spacecraft, while the MGA will act as backup and will be used for re-acquisition during the safe mode recovery. During a solar conjunction different Sun-Earth-Spacecraft and Sun-Spacecraft-Earth threshold angles determine the conditions for HGA and MGA communications blackout. For the HGA this can reach up to 44 days, while for the MGA over 60 days, both worst cases for the 2017 March trajectory. The situation of solar conjunctions for the other two trajectories is significantly more benign. The design of the trajectories has aimed at providing similar performance for the Solar Orbiter science mission. However, for the 2018 September trajectory the mitigation of the solar conjunction duration had to be considered and this has not permitted to fully optimize the trajectory for the science as done for the other 2 trajectories. So in the 2018 September trajectory this consideration delays the first perihelion below 0.3 AU, reduces slightly the number of close Sun approaches below 0.3 and 0.4 AU and reduces the maximum rotational velocity as well. Nevertheless, this trajectory is still regarded an adequate backup in terms of science return.
Table 3. Summary of reference trajectories: mission performance and science properties.
2017 Jan. 2017 Mar. 2018 Sep.
From launch to GAM V2 (y) 3.39 3.90 3.25 Overall Duration (y) 10.2 9.4 8.8 Time to max. is (y) 8.31 8.21 7.56 Max. is (deg) 34.0 36.1 34.0 Max. s (deg/day) 8.02 8.32 7.53 Max. Earth range (AU) 1.909 2.006 2.002 Longest eclipse at GAM (min) 0 18.7 17.0 Longest HGA solar conjunction (d) 7.1 44.0 8.7 Longest MGA solar conjunction (d) 37.9 61.0 38.4 Time to 1st perih. < 0.3 AU (y) 3.50 3.47 4.60 # Perihelions < 0.3 AU 9 8 7 Shortest stay < 0.3 AU (d) 7.5 6.6 5.7 Longest stay < 0.3 AU (d) 8.3 9.2 8.3 Accumulated stay < 0.3 AU (d) 70.7 62.8 47.5 # Perihelions < 0.4 AU 16 13 12 Shortest stay < 0.4 AU (d) 24.0 15.7 16.1 Longest stay < 0.4 AU (d) 28.3 27.1 27.0 Time spent < 0.4 AU (d) 419 321 294
14
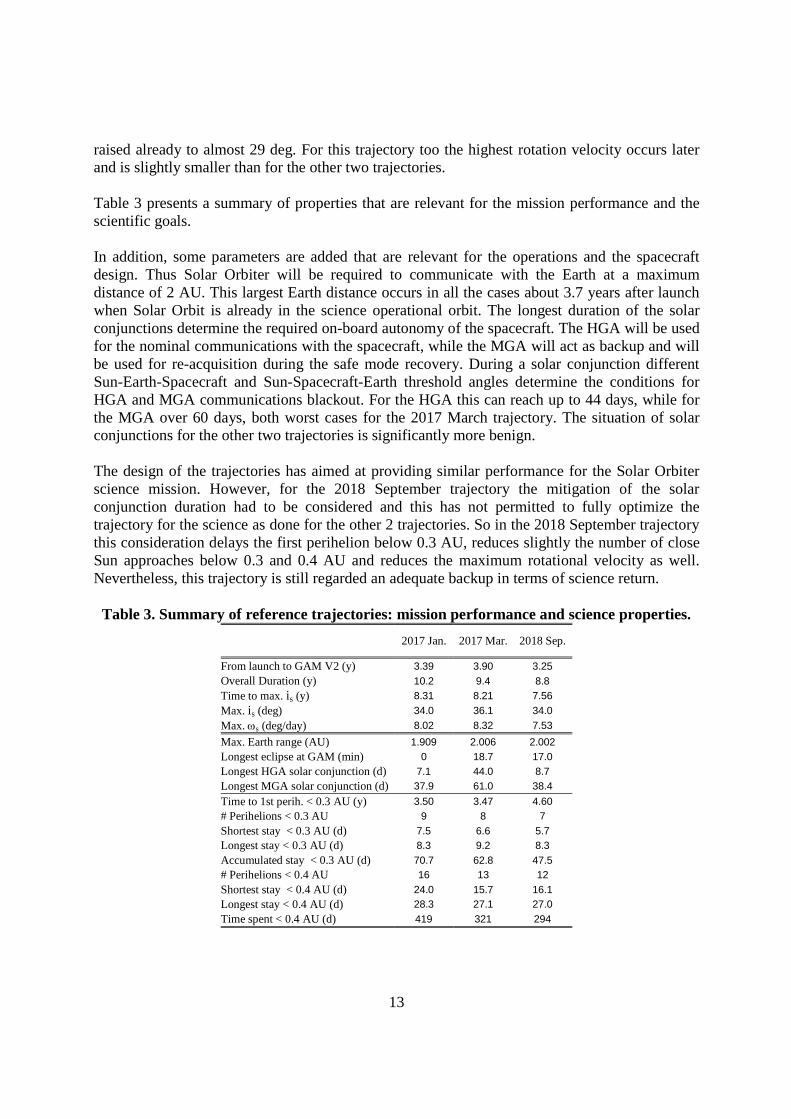
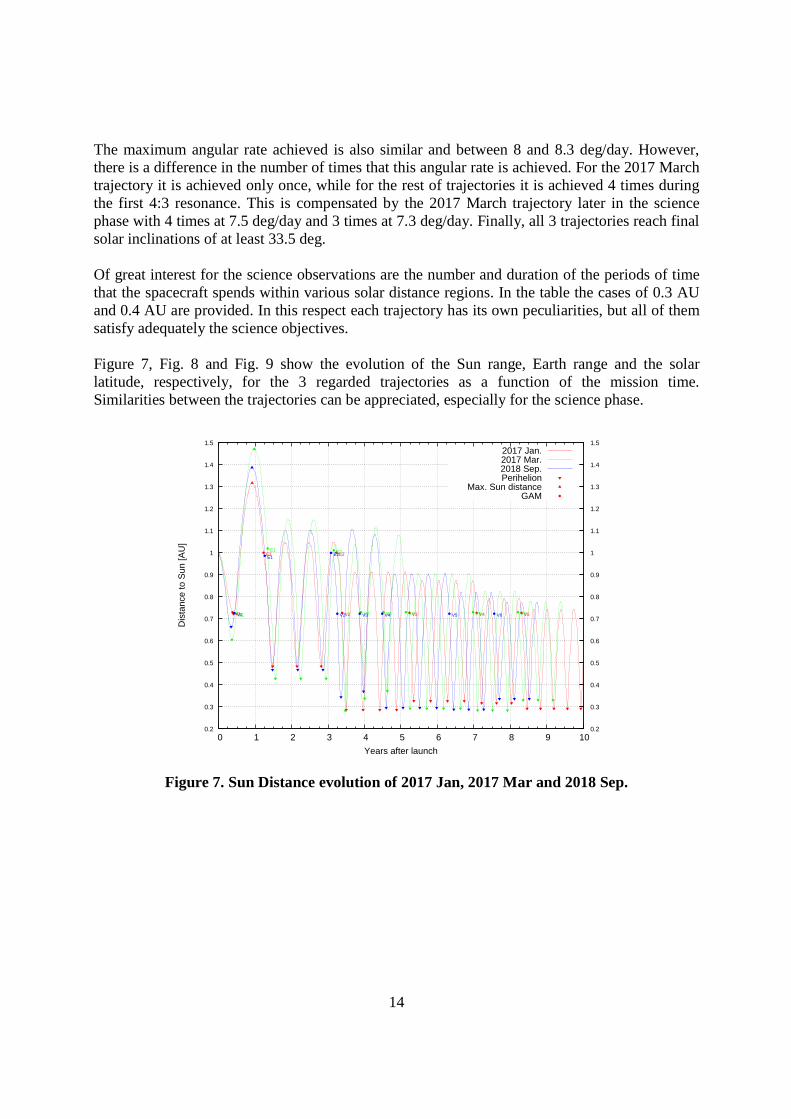
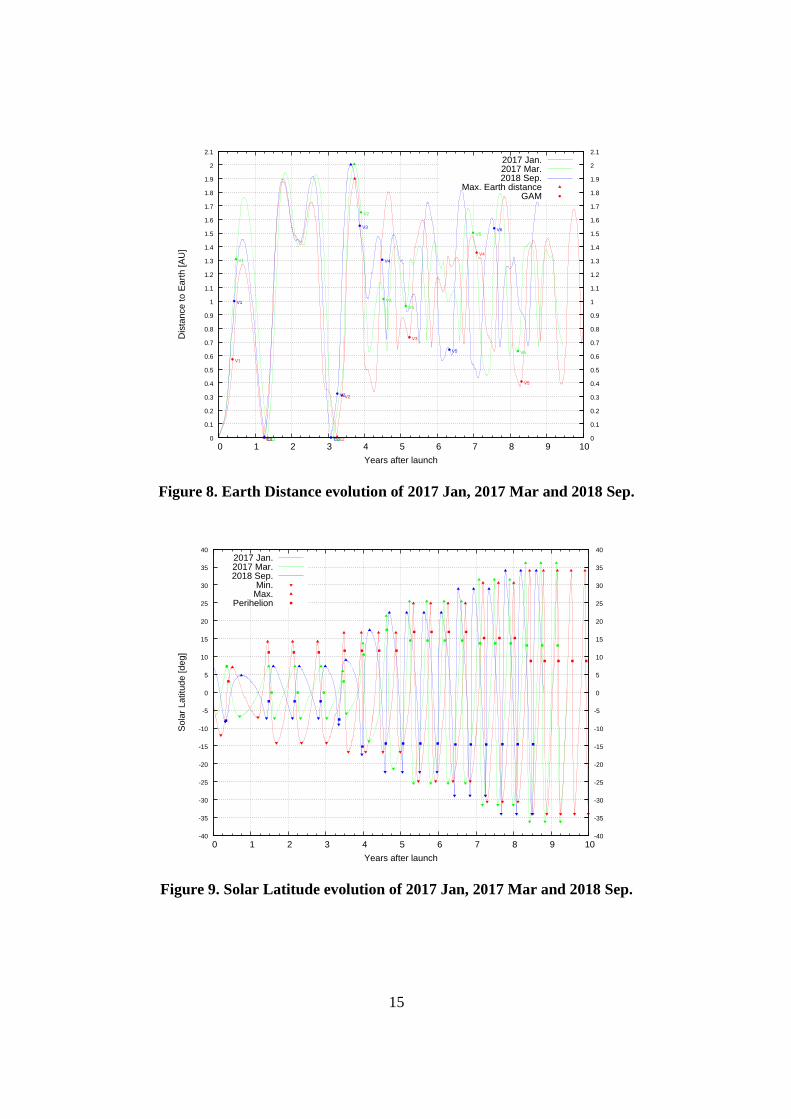
The maximum angular rate achieved is also similar and between 8 and 8.3 deg/day. However, there is a difference in the number of times that this angular rate is achieved. For the 2017 March trajectory it is achieved only once, while for the rest of trajectories it is achieved 4 times during the first 4:3 resonance. This is compensated by the 2017 March trajectory later in the science phase with 4 times at 7.5 deg/day and 3 times at 7.3 deg/day. Finally, all 3 trajectories reach final solar inclinations of at least 33.5 deg. Of great interest for the science observations are the number and duration of the periods of time that the spacecraft spends within various solar distance regions. In the table the cases of 0.3 AU and 0.4 AU are provided. In this respect each trajectory has its own peculiarities, but all of them satisfy adequately the science objectives. Figure 7, Fig. 8 and Fig. 9 show the evolution of the Sun range, Earth range and the solar latitude, respectively, for the 3 regarded trajectories as a function of the mission time. Similarities between the trajectories can be appreciated, especially for the science phase.
0.2
0.3
0.4
0.5
0.6
0.7
0.8
0.9
1
1.1
1.2
1.3
1.4
1.5
0 1 2 3 4 5 6 7 8 9 10 0.2
0.3
0.4
0.5
0.6
0.7
0.8
0.9
1
1.1
1.2
1.3
1.4
1.5
Dis
tanc
e to
Sun
[AU
]
Years after launch
2017 Jan.2017 Mar.2018 Sep.Perihelion
Max. Sun distanceGAM
V1
E1 E2
V2 V3 V4 V5 V1
E1 E2
V2 V3 V4 V5 V6 V1
E1 E2
V2 V3 V4 V5 V6
Figure 7. Sun Distance evolution of 2017 Jan, 2017 Mar and 2018 Sep.
15
0
0.1
0.2
0.3
0.4
0.5
0.6
0.7
0.8
0.9
1
1.1
1.2
1.3
1.4
1.5
1.6
1.7
1.8
1.9
2
2.1
0 1 2 3 4 5 6 7 8 9 10 0
0.1
0.2
0.3
0.4
0.5
0.6
0.7
0.8
0.9
1
1.1
1.2
1.3
1.4
1.5
1.6
1.7
1.8
1.9
2
2.1
Dis
tanc
e to
Ear
th [A
U]
Years after launch
2017 Jan.2017 Mar.2018 Sep.
Max. Earth distanceGAM
V1
E1 E2
V2
V3
V4
V5
V1
E1 E2
V2
V3
V4
V5
V6
V1
E1 E2
V2
V3
V4
V5
V6
Figure 8. Earth Distance evolution of 2017 Jan, 2017 Mar and 2018 Sep.
-40
-35
-30
-25
-20
-15
-10
-5
0
5
10
15
20
25
30
35
40
0 1 2 3 4 5 6 7 8 9 10-40
-35
-30
-25
-20
-15
-10
-5
0
5
10
15
20
25
30
35
40
Sol
ar L
atitu
de [d
eg]
Years after launch
2017 Jan.2017 Mar.2018 Sep.
Min.Max.
Perihelion
Figure 9. Solar Latitude evolution of 2017 Jan, 2017 Mar and 2018 Sep.
16
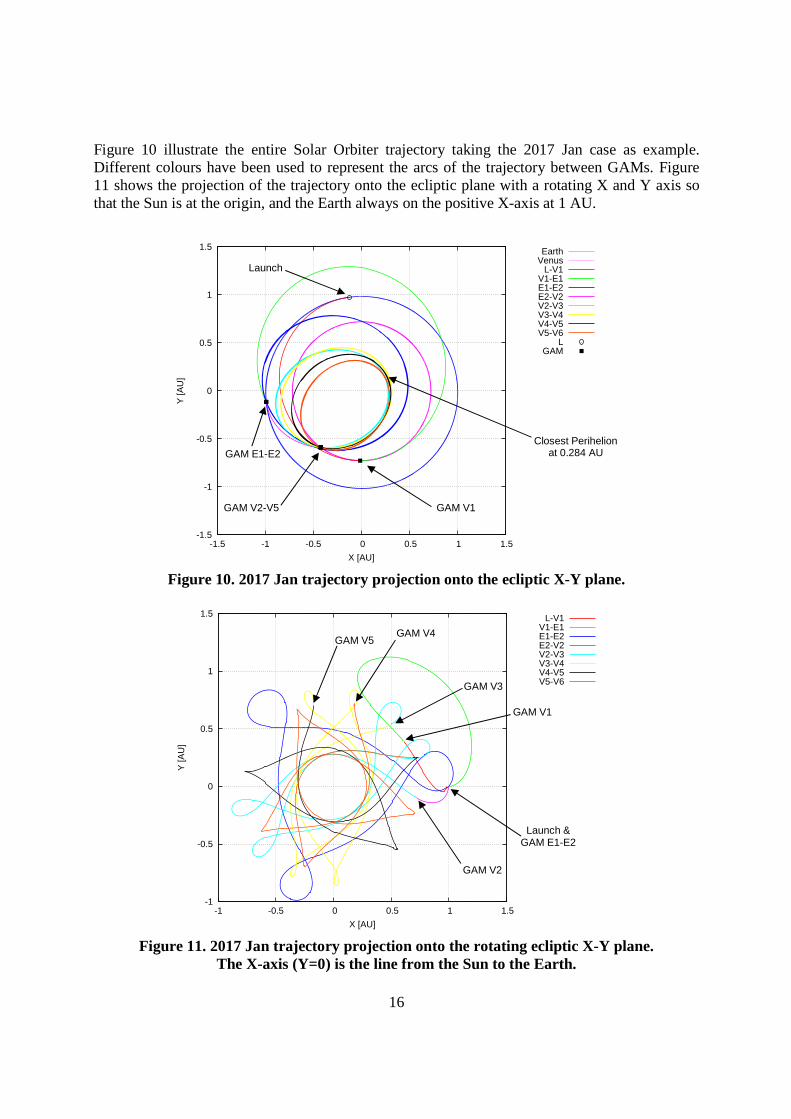
Figure 10 illustrate the entire Solar Orbiter trajectory taking the 2017 Jan case as example. Different colours have been used to represent the arcs of the trajectory between GAMs. Figure 11 shows the projection of the trajectory onto the ecliptic plane with a rotating X and Y axis so that the Sun is at the origin, and the Earth always on the positive X-axis at 1 AU.
-1.5
-1
-0.5
0
0.5
1
1.5
-1.5 -1 -0.5 0 0.5 1 1.5
Y [A
U]
X [AU]
EarthVenus
L-V1V1-E1E1-E2E2-V2V2-V3V3-V4V4-V5V5-V6
LGAM
Figure 10. 2017 Jan trajectory projection onto the ecliptic X-Y plane.
-1
-0.5
0
0.5
1
1.5
-1 -0.5 0 0.5 1 1.5
Y [A
U]
X [AU]
L-V1V1-E1E1-E2E2-V2V2-V3V3-V4V4-V5V5-V6
Figure 11. 2017 Jan trajectory projection onto the rotating ecliptic X-Y plane. The X-axis (Y=0) is the line from the Sun to the Earth.
Launch
GAM V1GAM V2-V5
GAM E1-E2Closest Perihelion
at 0.284 AU
Launch & GAM E1-E2
GAM V1
GAM V2
GAM V3
GAM V4GAM V5
17
4. Conclusion Solar Orbiter has undergone over the years a process of consolidation of the mission design ([6]) that currently relies on 3 trajectory opportunities that are fully compliant with the science objectives and mission requirements. Nominal launch will occur on either of the 2 opportunities on early 2017, January or March, while a backup opportunity on September 2018 will be used in case of severe programmatic delays with the spacecraft. This paper provides an overview of all the regarded trajectories together with a brief description of some methods and techniques used in the trajectory design.
5. Notation
GAM Gravity Assist Manoeuvre H Altitude is Solar Inclination
Ra Radius at aphelion Rp Radius at perihelion Rs Solar Radius
V or Vinf Infinite Velocity V Manoeuvre velocity increment or Delta-V Right Ascension Declination Declination of the asymptote hyperbola s Solar Latitude s Angular velocity with respect to Sun Pole axis
6. References [1] European Space Agency, "Solar Orbiter Exploring the Sun-heliosphere connection – Assessment Study Report", ESA/SRE(2009)5, December 2009.
[2] A.V. Labunsky, O.V. Papkov, K.G.Sukhanov, "Multiple Gravity Assist Interplanetary Trajectories", ESI Book Series, Gordon and breach Science Publishers, 1998.
[3] J.M. Sánchez Pérez, "SolO Mission Design: Transfer Options with Launch in 2017-2018", OPS-GFA WP 546, ESA-ESOC, Issue 2, May 2011.
[4] N. Strange, R. Russel, B. Buffington, "Mapping the V-Infinity Globe", AAS 07-277, AAS/AIAA Astrodynamics Spe-cialist Conference, 19-23 August 2007, Mackinac Island, Michigan.
[5] Y. Kawakatsu, "V Direction Diagram and its Application to Swingby Design", 21st International Symposium on Space Flight Dynamics, September 28-October 2 2009, Toulouse, France.
[6] J.M. Sánchez Pérez, "Solar Orbiter Consolidated Report on Mission Analysis", SOL-ESC-RP-05500, ESA-ESOC, Issue 1, Re. 1, 10 June 2010.
[7] J.M. Sánchez Pérez, "Trajectory Design of Solar Orbiter using Earth and Venus Gravity Assists”, AAS 11-192, 21st AAS/AIAA Space Flight Mechanics Meeting, New Orleans, Feb. 2011.