Embed Size (px)
Citation preview

Ethiopia’s Climate-Resilient Green Economy Green economy strategy
FEDERAL DEMOCRATIC REPUBLIC OF ETHIOPIA
ENVIRONMENTAL PROTECTION AUTHORITY
FEDERAL DEMOCRATIC REPUBLIC OF ETHIOPIA


Contents
Foreword III
Executive summary 1
The vision: Achieve middle-income status by 2025 in a climate-resilient green economy 5
The challenge: Realise economic development goals in a sustainable way 11
The plan: Follow a green growth path that fosters development and sustainability 19
The ambition is to build a green economy 19
The development of a green economy will be based on four pillars 20
Agriculture: Improving crop and livestock production practices for higher food security and farmer income while reducing emissions 22
Forestry: Protecting and re-establishing forests for their economic and ecosystem services, including as carbon stocks 24
Electric Power: Expanding electricity generation form renewable energy for domestic and regional markets25
Transport, industrial sectors and buildings: Leapfrogging to modern and energy efficient technologies 26
Building a green economy offers cost-efficient abatement potential while promoting GTP targets 28
Federal Democratic Republic of Ethiopia I

Making it happen: Ethiopia’s action plan to create a green
economy 45
Appendices 59
Approach and methodology 61
Electric Power 78
Green Cities and Buildings 91
Forestry 101
Livestock 117
Soil 134
Industry 151
Transport 165
List of References 181
Federal Democratic Republic of Ethiopia II

ForewordEthiopia is experiencing the effects of climate change. Besides the direct effects such as an increase in average temperature or a change in rainfall patterns, climate change also presents the necessity and opportunity to switch to a new, sustainable development model. The Government of the Federal Democratic Republic of Ethiopia has therefore initiated the Climate-Resilient Green Economy (CRGE) initiative to protect the country from the adverse effects of climate change and to build a green economy that will help realise its ambition of reaching middle-income status before 2025.
Since February 2011, the CRGE initiative, under the leadership of the Prime Minister’s Office, the Environmental Protection Authority, and the Ethiopian Development Research Institute, has been developing a strategy to build a green economy. Seven sectoral teams involving more than 50 experts from more than 20 leading government institutions have been driving the initiative. The objective is to identify green economy opportunities that could help Ethiopia reach its ambi-tious growth targets while keeping greenhouse gas emissions low. The government intends to attract development partners to help implement this new and sustainable growth model.
This report summarises the findings of the CRGE initiative, and particularly focuses on outlining the plan to develop a green economy. The document does not cover climate resilience, which will be added over the coming months. This strat-egy has been extensively discussed during the previous two months of regional and sectoral consultations to ensure national alignment on priorities, confirm initial findings, create awareness, and join forces. This document reflects the work of the CRGE initiative as well as the outcome of the consultation process.
Addis Ababa, November 2011
Federal Democratic Republic of Ethiopia III


List of abbreviationsAbbreviation Stands for
Federal Democratic Republic of Ethiopia V

Abbreviation Stands for
United Nations Framework Convention on Climate Change
Federal Democratic Republic of Ethiopia VI

Federal Democratic Republic of Ethiopia VII

Technical noteThis strategy is based on the data and sources of information available to the sub-technical committees as of August 2011. The BAU projections and calculation of abatement potential and abatement cost follow a consistent methodology as described in the appendix. As most of the calculations are performed on a sectoral level, they do not necessarily follow specific project-level protocols of setting baseline emission scenarios and abatement outcomes, as is for example done in the context of carbon finance schemes. Rather, the BAU calculations should be understood as a strategic emission projection against which the sectoral mitigation programmes are drafted. The sectoral mitigation initiatives and the associated costs should be understood as an initial identification and estimation of sectoral abatement potential and a base for strategic decisions regarding their implementation and required support. Although they form part of an overall strategy in building a climate-resilient green economy, and the government is committed to creating a supportive environment for them, the individual initiatives should not be understood as immediately mandatory government policies.
Federal Democratic Republic of Ethiopia VIII

Executive summaryEthiopia aims to achieve middle-income status by 2025 while developing a green economy. Following the conventional development path would, among other adverse effects, result in a sharp increase in GHG emissions and unsustainable use of natural resources. To avoid such negative effects, the government has developed a strategy to build a green economy. It is now starting to transform the strategy into action and welcomes collaboration with domestic and international partners.
The vision: Achieve middle-income status by 2025 in a climate-resilient green economy
Both the government and the International Monetary Fund expect Ethiopia’s economy to continue as one of the world’s fastest growing over the coming years. Building on its positive recent development record, Ethiopia intends to reach middle-income status before 2025. As set forth in the Growth and Transformation Plan (GTP), reaching this goal will require boosting agricultural productivity, strengthening the industrial base, and fostering export growth.
As a responsible member of the world, Ethiopia is also aware of the important role that developing countries play in fighting climate change, and has consequently taken on a constructive role in international climate negotiations. Ethiopia’s ambi-tion to become a “green economy front-runner” is an expression of its potential for and belief in a sustainable model of growth.
The challenge: To achieve economic development goals in a sustainable way
If Ethiopia were to pursue a conventional economic development path to achieve its ambitious targets, the resulting negative environmental impacts would follow the patterns observed all around the globe. Under current practices, greenhouse gas (GHG) emissions would more than double from 150 Mt CO2e in 2010 to 400 Mt CO2e in 2030. Its development path could also face resource constraints: for example, it could reach the carrying capacity for cattle. Furthermore, it could lock its economy into outdated technologies.
A conventional development path could also be financially challenging. For example, a significant share of GDP might need to be spent on fuel imports, putting pressure on foreign currency reserves.
Federal Democratic Republic of Ethiopia 1

Finally, according to the GTP, more than USD 50 billion will be needed over the
coming five years for infrastructure development. More than 50% will have to be in foreign currency. Current and projected domestic savings and foreign direct investments, grants, and transfers will not be sufficient to finance these invest-ments, leading to a significant finance gap.
The plan: To follow a green growth path that fosters development and sustainability
The Climate-Resilient Green Economy (CRGE) initiative follows a sectoral approach and has so far identified and prioritised more than 60 initiatives, which could help the country achieve its development goals while limiting 2030 GHG emissions to around today’s 150 Mt CO2e – around 250 Mt CO2e less than esti-mated under a conventional development path. The green economy plan is based on four pillars:
1. Improving crop and livestock production practices for higher food security and farmer income while reducing emissions
2. Protecting and re-establishing forests for their economic and ecosystem services, including as carbon stocks
3. Expanding electricity generation from renewable sources of energy for domestic and regional markets
4. Leapfrogging to modern and energy-efficient technologies in transport, indus-trial sectors, and buildings.
For more than 80% of the abatement potential, abatement costs are less than USD 15 per t CO2e.1 Many of the initiatives offer positive returns on investments, thus directly promoting economic growth and creating additional jobs with high value-added.
Building the green economy requires an estimated total expenditure of around USD 150 billion over the next 20 years. By developing a green economy, we could exchange GHG emissions abatement for climate finance to fund some of the required investment.
Implementing the initiatives would also offer important co-benefits. For example, it would improve public health, through better air and water quality, and would promote rural economic development by increasing soil fertility and food security.
1 USD 15 per t roughly equals the price of carbon credits under the European Trading Scheme in 2011.
Federal Democratic Republic of Ethiopia 2

Making it happen: The action plan to create a green economy
We have developed a strategy for transforming our ambition into reality. Under the leadership of Prime Minister Meles Zenawi, our government has dedicated sig-nificant resources to the inter-ministerial CRGE initiative. More than 50 experts from 20 leading governmental institutions were engaged in seven committees, directed by an inter-ministerial steering group.
As part of the strategy, the government has selected four initiatives for fast-track implementation: exploiting the vast hydropower potential; large-scale promotion of advanced rural cooking technologies; efficiency improvements to the livestock value chain; and Reducing Emissions from Deforestation and Forest Degradation (REDD). These initiatives have the best chances of promoting growth immediately, capturing large abatement potentials, and attracting climate finance for their implementation. To ensure a comprehensive programme, initiatives from all other sectors will also be developed into concrete proposals.
The CRGE initiative also outlines the structure of a permanent institutional setup to drive implementation, and to promote the participation of a broad set of stakeholders.
We are dedicating significant resources to building our green economy. To capture the full potential of our plan, we welcome emerging climate finance schemes, which will compensate developing countries for the provision of environmental services to the world. Bi- and multilateral development partners as well as the private sector can help us achieve our ambitious goals.
Federal Democratic Republic of Ethiopia 3

The vision: Achieve middle-income status by 2025 in a climate-resilient green economyEconomically, Ethiopia is one of the world’s fastest-growing countries. Building on its positive recent development, it intends to reach middle-income status before 2025. It aims to do so by building a green economy.
ECONOMICALLY, ETHIOPIA IS ONE OF THE WORLD’S FASTEST-GROWING COUNTRIES
Despite the challenges of being one of the world’s poorest countries, Ethiopia has good prospects for growth. The International Monetary Fund forecasts for Ethiopia a real gross domestic product (GDP) growth of more than 8% p.a. over the next five years. Among countries with more than 10 million inhabitants, only China and India will grow at a faster pace (Figure 1). The government is even more opti-mistic and it projects a growth rate of 11%.
Federal Democratic Republic of Ethiopia 5

FIGURE 1
Ten fastest-growing economies1 (2011-2015)
Average real GDP growth p.a., percent
1 Excluding countries with less than 10 million population
SOURCE: IMF; The Economist
6,8
6,9
7,0
7,0
7,2
7,2
7,7
8,1
8,2
9,5
Nigeria
Zambia
Ghana
Congo
Vietnam
Tanzania
Mozambique
Ethiopia
India
China
Africa Non-Africa
Over the coming years, Ethiopia will continue to be one of the world’s fastest-growing countries
Ethiopia’s recent track record demonstrates that it can achieve double-digit growth rates. Between 2005 and 2010, the country’s real GDP grew by 11% p.a., with the service sector accounting for the highest growth (15%), agriculture for more than 8%, and industrial development falling slightly short of expectations (the actual growth rate was 10% rather than being in the expected range of 11 to 18%). This economic success has multiple drivers. A 15% expansion of agricultural land and a 40% yield increase account for growth in the agricultural sector over the last five years. Major export products include coffee, sesame-seed, leather, flowers, and gold, and Ethiopia is the 10th largest producer of livestock in the world. Over the same five-year period, Ethiopia managed to significantly improve infrastructure, more than doubling electric power generation capacity, increasing the capacity of the telecommunication network from 0.5 million users to 25 million, opening 40 new federal roads, and adding more than 11,000 kilometres of road to the existing network.
To support its growth, Ethiopia has managed to attract more foreign investment. Foreign investment has increased from less than USD 820 million in 2007/08 to more than USD 2 billion in the first half of the 2010/11 fiscal year. Among other factors, this is a result of a comparably good investment climate as measured by various indicators: the World Bank’s 2011 Doing Business report ranks Ethiopia’s
Federal Democratic Republic of Ethiopia 6

overall business environment as better than that of Brazil or India, for example.
Ethiopia also received higher marks for criteria such as the business tax rate and enforcement of contracts (Figure 2).
Ethiopia must continue to grow: with a GDP per capita of around USD 380, Ethiopia is still one of Africa's poorest countries. Ethiopia’s economy is not diver-sified enough: agriculture and the service sector each contribute more than 40% to GDP, and 80% of employment is still concentrated in agriculture. Because of its small manufacturing sector, the economy is not yet in a position to absorb significant increases in productivity in agriculture. Ethiopia’s trade deficit amounts to almost 20% of GDP: while exports of merchandise account for around 4%, goods worth more than 23% of GDP have to be imported (2009/10). In particular, to sustain its high growth rate, Ethiopia relies heavily on imports of oil, cement, and other primary goods.
FIGURE 2
Good overall business environment
98
79
58
Burundi 181
Djibouti 158
Sudan 154
India 134
Brazil 127
Russia 123
Ethiopia 104
Kenya
China
Rwanda
Overall ranking Doing Business 2011 (1=Singapore; 183=Chad)
Comparison with BRIC and East African countries
Ethiopia provides a favorable environment for investments –even compared with BRIC countries
SOURCE: Doing Business 2011
Low tax rates
Total tax rate (% of profit)
Efficient enforcement of contractsCost to enforce contracts (cost of claim as % of disputed value)
64
63
50
47
39
36
31
31
>100
Brazil >69
China
Burundi
India
Kenya
Russia
Djibouti
Sudan
Rwanda
Ethiopia
79
47
40
39
34
20
17
15
13
11
India
Rwanda
Kenya
Burundi
Djibouti
Sudan
Brazil
Ethiopia
Russia
China
Federal Democratic Republic of Ethiopia 7

ETHIOPIA HAS SET THE TARGET OF REACHING MIDDLE-INCOME
STATUS BEFORE 2025
Building on the positive development of recent years, Ethiopia intends to reach middle-income status (GDP per capita of around USD 1,000)2 within 15 years.
Boosting agricultural productivity and strengthening the industrial base will be essential to reach this goal.
Ethiopia’s Growth and Transformation Plan (GTP) is an ambitious development plan that lays out growth, development, and industrialisation targets up to 2015. It reflects the government’s ambition to lift the country to middle-income status by 2025.
2 World Bank classifies economies according to 2009 gross national income per capita, calculated using the World Bank Atlas method. Lower middle income starts at USD 996. This report uses GDP per capita equaling USD 1000 to define middle income. 2009 GDP per capita and gross national income per capita in Ethiopia differ by 5%.
Federal Democratic Republic of Ethiopia 8

Federal Democratic Republic of Ethiopia 9

To meet the middle-income target, the base case outlined in the GTP sets the
following rates of growth for the period 2010-2015: GDP has to increase by more than 10% p.a., exports need to grow from 14% of GDP to 23%, and the domestic savings rate from 5.5% to 16%. These high rates are based on the following sectoral projections for the same five-year period:
■ Agricultural development will continue to be the basis for economic growth. The overall targeted growth rate for the sector is 8.6%. Production of major food crops (e.g., teff, wheat, maize) is targeted to increase from 19 million tonnes to 27 million tonnes. Fruit and vegetable production is projected to increase fourfold to 5 million tonnes. This implies increasing crop productivity from 19 quintal per hectare to 22. The total value of coffee exports, by far the most important cash crop, is to increase from USD 0.5 billion today to more than USD 2 billion in 2015, while the export of live animals is projected to grow from USD 0.1 billion to USD 1 billion.
■ Development of the industrial sector is crucial to reach the GTP targets. The GTP projects that the industrial sector will grow at a rate of 20% p.a. or twice the annual increase achieved over the last five years. The GTP expects the industry sector’s share of the GDP to rise from 13% to 19% within five years, while the service sector remains at around 45%. To reach these targets, light manufacturing must be significantly scaled up. The GTP assumes foreign currency earnings from textiles to increase from USD 22 million to USD 1 billion in 2015. Over the same period, cement production is to increase by a factor of 10, and the market share of domestically produced pharmaceutical and medical products from 15% to 50%.
To achieve middle-income status before 2025, these five-year growth rates must be sustained for 15 years. The growth will result in a significant shift in GDP shares: In 2025, agriculture would contribute only 29% to the GDP, industry 32%, and services the remaining 39% (Figure 3).
Federal Democratic Republic of Ethiopia 10

FIGURE 3
2010
30
147
2025 projected
39%
32%
29%~10% p.a.
2015 GTP
51
GTP and long-term targets translate into a transition of the Ethiopian economy
Source: GoE GTP; EDRI
GDP, billion USD
Population mln (mid-year)
79 89 116
GDP/cap.In USD
378 565 1.271
▪ Diminishing weight of agriculture from 42% to 29% of GDP
▪ Migration from agriculture jobs to services and industry
▪ Reaching of middle-income status before 2025
Key transitions
Services
Industry
Agriculture
The GTP explicitly addresses the sustainability of growth: “Environmental con-servation plays a vital role in sustainable development. Building a ‘Green Econ-omy’ and ongoing implementation of environmental laws are among the key stra-tegic directions to be pursued during the plan period.” (GTP, 2011: p. 119).
Federal Democratic Republic of Ethiopia 11

The challenge: Realise economic development goals in a sustainable wayIf Ethiopia were to pursue a conventional economic development path to achieve its ambition of reaching middle-income status by 2025, GHG emissions would more than double from 150 Mt CO2e today to 400 Mt CO2e in 2030. Ethiopia’s development could result in unsustainable use of natural resources, in being locked into outdated technologies, and in losing an ever-increasing share of GDP to fuel imports. Ethiopia would lose the opportunity of making its development sustainable.
Regardless of whether the development path is a conventional or sustainable one, Ethiopia faces a critical challenge in attracting the investment needed to support the projected growth. Current and expected domestic savings and foreign direct investments, grants, and transfers will not be sufficient to fund these investments.
CONVENTIONAL ECONOMIC DEVELOPMENT WOULD MORE THAN DOUBLE GHG EMISSIONS
Ethiopia’s contribution to GHG emissions is very low on a global scale. However, the projected environmental impact of conventional economic development in Ethiopia risks following the pattern observed around the globe. If current practices prevail, GHG emissions in Ethiopia will more than double from 150 Mt CO2e to 400 Mt CO2e in 2030. On a per capita basis, emissions are set to increase by more than 50% to 3.0 t CO2e – and will thus exceed the global target to keep per capita emissions between 1 t and 2 t per capita in order to limit the negative effects on climate change.
Current level and sectoral breakdown of emissionsEthiopia’s current contribution to the global increase in GHG emissions since the industrial revolution has been practically negligible. Even after years of rapid eco-nomic expansion, today’s per capita emissions of less than 2 t CO2e are modest compared with the more than 10 t per capita on average in the EU and more than 20 t per capita in the US and Australia. Overall, Ethiopia’s total emissions of around 150 Mt CO2e represent less than 0.3% of global emissions.
Federal Democratic Republic of Ethiopia 12

Of the 150 Mt CO2e in 2010, more than 85% of GHG emissions came from the
agricultural and forestry sectors. They are followed by power, transport, industry and buildings, which contributed 3% each (Figure 4).
FIGURE 4
More than 85% of GHG emissions in Ethiopia come from forestry and agriculture
50%
3%
BuildingsIndustry
3%Power
3%
Forestry37%
Agriculture
3%Transport
Share of GHG emissions, 2010
Total GHG emissions of ~150 Mt CO2e in 2010
Major sources of emissions within agriculture and forestry:
■ In agriculture, GHG emissions are attributable to livestock and crops in that order. The current cattle population is more than 50 million and other livestock nearly 100 million. Livestock generate greenhouse gases mainly in the form of methane emissions arising from digestion processes and nitrous oxide emissions arising from excretions. Livestock emissions are estimated to amount to 65 Mt CO2e in 2010 – more than 40% of total emissions today. The cultivation of crops contributes to the concentration of greenhouse gases mainly by requiring the use of fertiliser (~10 Mt CO2e) as well as by emitting N2O from crop residues reintroduced into the ground (~3 Mt CO2e).
■ In forestry, the impact of human activities is a large source of CO2 emissions amounting to almost 55 Mt CO2e in 2010. Forestry emissions are driven by deforestation for agricultural land (50% of all forestry-related emissions) and
Federal Democratic Republic of Ethiopia 13

forest degradation due to fuelwood consumption (46%) as well as formal and
informal logging (4%).
Minor sources of emissions today are transport, power, industry, and buildings, as described below.
■ In transport, ~75% of the emissions come from road transport, particularly freight and construction vehicles, and to a lesser extent private passenger vehicles. Air transport also contributes a significant share (23% of transport-related emissions). Emissions from inland water transport are minimal.
■ The electric power sector only accounts for very low emissions as it is largely based on renewable energy, with hydro power accounting for more than 90% of total power generation capacity, supplemented by the use of on- and off-grid diesel generators administered by the Ethiopian Electric Power Corporation (EEPCo). Current emissions in the energy sector amount to below 5 Mt CO2e or a share of 3% of the country’s total emissions. (The global average for electric power generation’s share of a country’s GHG emissions is more than 25%.)
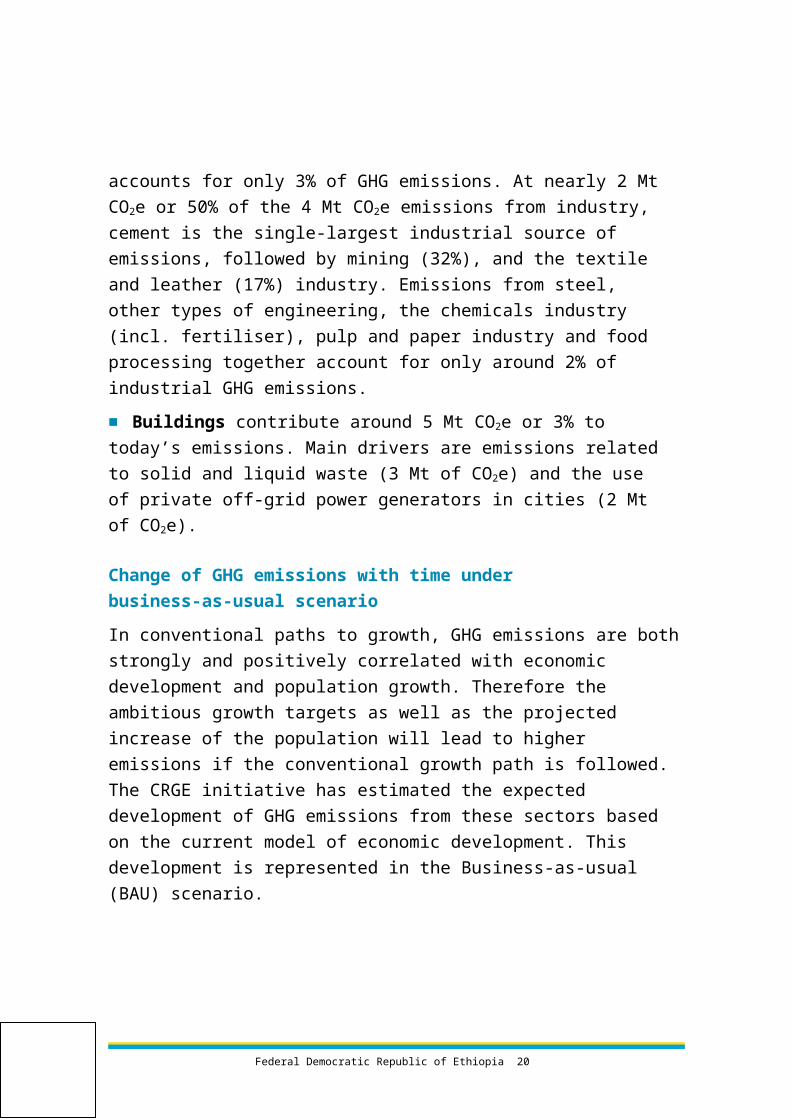
■ Given the comparably small share of organised industrial economic activity overall, industry accounts for only 3% of GHG emissions. At nearly 2 Mt CO2e or 50% of the 4 Mt CO2e emissions from industry, cement is the single-largest industrial source of emissions, followed by mining (32%), and the textile and leather (17%) industry. Emissions from steel, other types of engineering, the chemicals industry (incl. fertiliser), pulp and paper industry and food processing together account for only around 2% of industrial GHG emissions.
■ Buildings contribute around 5 Mt CO2e or 3% to today’s emissions. Main drivers are emissions related to solid and liquid waste (3 Mt of CO2e) and the use of private off-grid power generators in cities (2 Mt of CO2e).
Change of GHG emissions with time under business-as-usual scenarioIn conventional paths to growth, GHG emissions are both strongly and positively correlated with economic development and population growth. Therefore the ambitious growth targets as well as the projected increase of the population will lead to higher emissions if the conventional growth path is followed. The CRGE initiative has estimated the expected development of GHG emissions from these sectors based on the current model of economic development. This development is represented in the Business-as-usual (BAU) scenario.
Federal Democratic Republic of Ethiopia 14

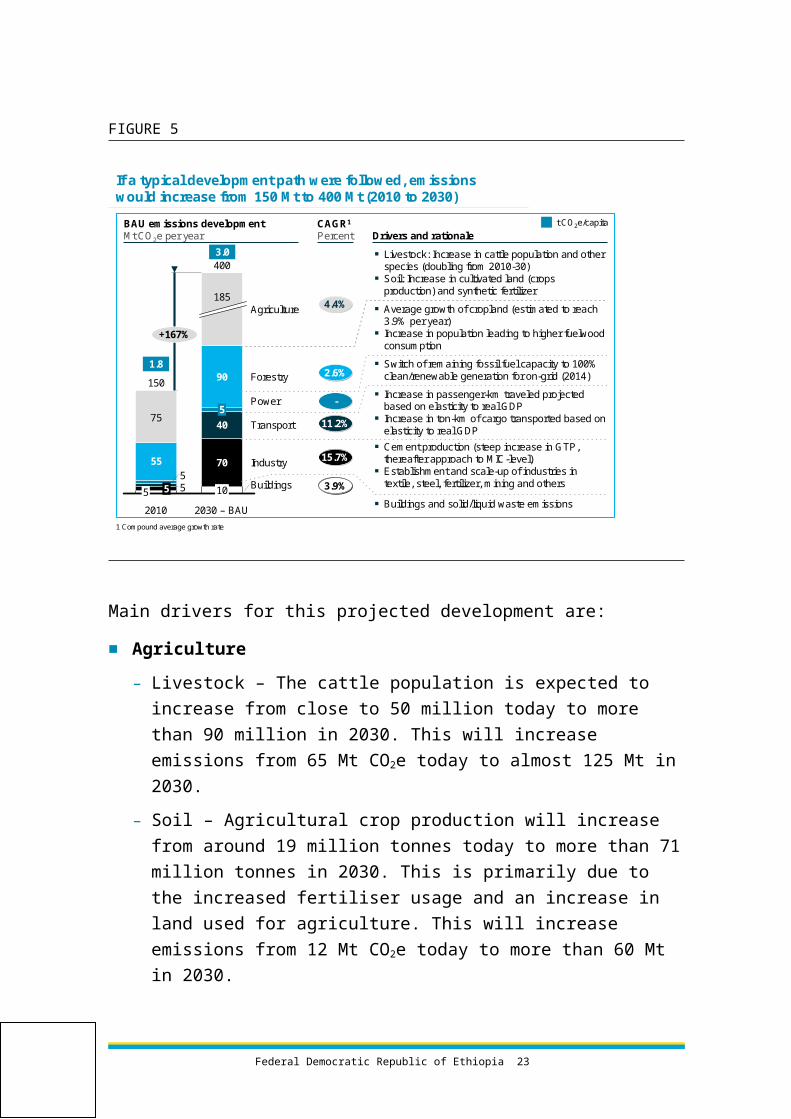
The results of the BAU estimate show that the current pathway for economic development will increase GHG emissions from 150 Mt CO2e today to 400 Mt in 2030 – an increase of more than 150% (Figure 5). On a per capita basis, emissions are projected to increase from 1.8 t today to 3.0 t in 2030. In absolute terms, the highest increase – adding around 110 Mt CO2e in GHG emissions – will come from agriculture, followed by industry at 65 Mt and forestry at 35 Mt. In relative terms, the emerging industrialisation will manifest itself in an annual emission increase of more than 15% from the industrial sector and around 11% from transport. Industry emissions under BAU assumptions are therefore projected to increase more than 12-fold, while transport emissions are projected to increase 7-fold.
FIGURE 5
If a typical development path were followed, emissions would increase from 150 Mt to 400 Mt (2010 to 2030)
55
75
150
5 5
400
+167%
Buildings
Industry
Transport
Forestry
Agriculture
2030 – BAU
10
70
405
90
185
2010
55
1 Compound average growth rate
4.4%
2.6%
-
11.2%
15.7%
3.9%
▪ Average growth of cropland (estimated to reach 3.9% per year)
▪ Increase in population leading to higher fuelwood consumption
▪ Livestock: Increase in cattle population and other species (doubling from 2010-30)
▪ Soil: Increase in cultivated land (crops production) and synthetic fertilizer
▪ Switch of remaining fossil fuel capacity to 100% clean/renewable generation for on-grid (2014)
▪ Increase in passenger-km traveled projected based on elasticity to real GDP
▪ Increase in ton-km of cargo transported based on elasticity to real GDP
▪ Cement production (steep increase in GTP, thereafter approach to MIC-level)
▪ Establishment and scale-up of industries in textile, steel, fertilizer, mining and others
▪ Buildings and solid/liquid waste emissions
t CO2e/capita
1.8
3.0
BAU emissions development Mt CO2e per year
CAGR1
Percent Drivers and rationale
Power
Main drivers for this projected development are:
■ Agriculture
Federal Democratic Republic of Ethiopia 15

– Livestock – The cattle population is expected to increase from close to
50 million today to more than 90 million in 2030. This will increase emissions from 65 Mt CO2e today to almost 125 Mt in 2030.
– Soil – Agricultural crop production will increase from around 19 million tonnes today to more than 71 million tonnes in 2030. This is primarily due to the increased fertiliser usage and an increase in land used for agriculture. This will increase emissions from 12 Mt CO2e today to more than 60 Mt in 2030.
■ Forestry
– Deforestation leads to CO2 emissions, and is mostly caused by the conver-sion of forested areas to agricultural land. Emissions are projected to grow from 25 Mt CO2e in 2010 to almost 45 Mt in 2030.
– Forest degradation leads to CO2 emissions, and is primarily caused by fuel-wood consumption and logging in excess of the natural yield of the forests, with the major driver being population growth. Emissions are projected to grow from around 25 Mt CO2e in 2010 to almost 45 Mt in 2030.
■ Electric power – The power sector in Ethiopia is an exception as it is the only sector in which emissions will stay very low. Emissions are projected to remain below 5 Mt CO2e in the BAU scenario. The total power demand is projected to grow from 4 TWh in 2010 to more than 75 TWh in 2030. EEPCo plans to switch off current diesel power plants and off-grid generators in 2012-2014 (according to its master plan) and to generate power exclusively from clean or renewable sources from 2015 onwards. Residential off-grid fossil fuel based generation in rural areas will account for the only remaining emissions. By basing electricity generation almost exclusively on renewable energy, Ethiopia is avoiding emissions of around 50 Mt CO2e (2030) as compared to the electric power sectors in neighbouring countries.
■ Transport – Emissions from transport are projected to grow from around 5 Mt CO2e in 2010 to 40 Mt CO2e in 2030. The increased emissions are driven first by higher emissions from freight transport (+13% p.a.) and also by higher emissions from passenger transport (+9% p.a.).
■ Industry – Industries are expected to grow at annual rates of up to 20%. Output from the largest industrial GHG emitter, cement production, is projected to increase from 2.7 Mt of cement today to 27 Mt in 2015 and more than 65 Mt in 2030. The industry sector shows the highest emission growth rates of all sectors, as its output is rapidly growing and its processes are very emission
Federal Democratic Republic of Ethiopia 16

intense: Overall industrial emissions are projected to grow by 16% p.a. from 4
Mt CO2e today to 71 Mt in 2030.
■ Buildings – An increasing urban population drives increasing waste genera-tion and (off-grid) energy consumption. Total buildings-related emissions are expected to increase from 5 Mt CO2e today to 10 Mt in 2030, with around 25% of the emissions in 2030 related to off-grid energy consumption, 75% to waste.
CURRENT DEVELOPMENT PATH WOULD LEAD TO FURTHER CHALLENGES
Besides increasing GHG contributions to global emissions, rapid economic growth will lead to other challenges, if not carefully managed and planned.
■ It may jeopardise the very resources it is based on and lead to unsus-tainable levels of use (i.e., preventing the current generation from passing on an equivalent level of resources to the next generation): The combination of growing demand for agricultural products and inefficient agricultural practices may result in an over-exploitation of natural resources. In the period 2001-2009, cropland increased at a ratio of 0.7 ha of deforestation for 1 ha of cropland. Assuming a decrease of this ratio to 0.55 ha by 2030, and a cropland increase from 12.6 million ha today to 27 million ha in 2030, this would require the deforestation of nearly 9 million ha of forest land. Furthermore, with a projected increase in the cattle population from more than 50 million today to more than 90 million in 2030, Ethiopia will reach its overall cattle-carrying capacity within 20 years and put additional pressure on forests for expansion of grazing land.
■ It would bind significant resources and put pressure on foreign currency reserves as fossil fuel demand – already today more than 4% of GDP, which roughly equals the foreign currency and gold reserves3 – would increase to around 7% of GDP in 2030.
■ It would lead to a lock-in into outdated technologies if Ethiopia continues to import technologies that have the lowest upfront investment requirements – for example, outdated second-hand technologies in the cement sector.
Beyond the economic impact, the conventional development path would lead to a lower quality of life and health problems, for example, from air polluting exhaust from old and inefficient vehicles and the inhalation of fuelwood smoke due to inefficient cooking technologies.
3 Source: Economy Watch, foreign currency and gold reserves figure for 31 December 2009
Federal Democratic Republic of Ethiopia 17

FUNDING NOT READILY AVAILABLE FOR INVESTMENTS REQUIRED
TO REACH GROWTH TARGETS
Funding the investments required to support the projected growth will be a chal-lenge. Even in the conventional scenario, the country will need more than USD 50 billion over the coming five years for infrastructure development – more than 50% of which will need to be in foreign exchange. The development of power infra-structure alone will require almost USD 38 billion over the next 20 years, the development of water supply and sanitation infrastructure requires USD 1.2 billion p.a. (World Bank, 2011: p. 18).
Ethiopia’s current savings-investment gap is large. While the country expects to invest 27.5% of GDP over the coming five years, average domestic savings will equal only 11.9%. The projected levels of foreign direct investment, grants, and transfers will not be sufficient to fund the required additional investments. More-over, 55% of the investment will be denominated in foreign currency, requiring a large inflow of international capital.
Consequently, finance mobilisation is identified in the GTP as one of the major constraints on economic development: ‘Low mobilisation of domestic financial resources was another implementation challenge encountered’ (GTP, 2010: p. 19). Mobilising private international capital will play a fundamental role, but public finance – such as climate finance – can also contribute significantly to close the funding gap. Attracting international capital will not be easy. International compe-tition for scarce capital increases the challenges for least-developed countries in accessing such funding.
The capital constraint is also an immediate threat to sustainable growth: Infra-structure development projects required for economic growth, especially for trans-port and power supply infrastructure, have high capital costs and long lives. Many existing carbon-inefficient solutions – such as road transport as opposed to rail transport – often require less upfront investment than their low-carbon alternatives. Capital-constrained developing countries such as Ethiopia are often inclined to invest in low-CAPEX alternatives and thereby lock themselves into solutions that are inefficient and ultimately less sustainable, although more climate-compatible alternatives exist and might offer higher social and economic benefits in the long run.
Federal Democratic Republic of Ethiopia 18

The plan: Follow a green growth path that fosters development and sustainabilityEthiopia has the ambition to develop along a green economic trajectory. It has consequently outlined a strategy to build this green economy. So far, it has identified and prioritised more than 60 initiatives that could help the country to achieve its economic development goals while at the same time limiting net GHG emissions in 2030 to below today’s 150 Mt CO2e – around 250 Mt CO2e less than estimated for the current development path (BAU). Building a green economy will lead to further socio-economic benefits and allow Ethiopia to tap climate finance.
THE AMBITION IS TO BUILD A GREEN ECONOMY
Political leaders worldwide realise the need for immediate and effective action to respond to climate change. These responses include actions to reduce GHG emis-sions as well as adaptation initiatives to reduce the vulnerability of the population and the economy to the effects of climate change. At the same time, leaders – especially in developing countries – have the obligation to promote economic development to improve living standards. Achieving economic development goals requires significant funds and binds a large share of government capacity. If cli-mate change mitigation and adaptation are seen as goals in conflict with economic development, they risk being de-prioritised and under-funded.
It is to avoid such conflicts, that the Climate-Resilient Green Economy (CRGE) initiative was started in 2011, giving the initiative three complementary objectives:
■ Fostering economic development and growth
■ Ensuring abatement and avoidance of future emissions, i.e., transition to a green economy
■ Improving resilience to climate change.
Building a green economy – which is in the focus of this strategy – offers an opportunity to achieve its economic development targets sustainably. It represents the ambition to achieve economic development targets in a resource-efficient way that overcomes the possible conflict between economic growth and fighting
Federal Democratic Republic of Ethiopia 19

climate change. This would be achieved by emphasising good stewardship of
resources and seizing opportunities for innovation based on the latest production platforms (“leapfrogging” to the newest and best technology rather than reproducing each evolutionary stage undergone by already-developed economies). Building a green economy should thus result in the creation of a competitive advantage out of a focus on the sustainable use of resources and a higher productivity growth.
The government is aware of the important role that developing countries play in fighting climate change. They represent a large share of the world’s GHG abatement potential and they can therefore be essential contributors to limiting global warming to 1.5 degrees Celsius compared to the beginning of industrial age. Consequently, Prime Minister Meles Zenawi has taken a leading role in the international climate negotiations. He is co-chairing the High-Level Advisory Group on Climate Change Financing of the United Nations Framework Convention on Climate Change’s (UNFCCC). Addis Ababa is part of the C40, a group of 40 large cities committed to tackling climate change.
The ambition to build a green economy is grounded in the country’s potential for and belief in a sustainable growth model for developing countries. Ethiopia has already followed a relatively green and sustainable development path, and most of the power generated in the country already comes from renewable sources, mainly hydropower.
THE DEVELOPMENT OF A GREEN ECONOMY WILL BE BASED ON FOUR PILLARS
The CRGE initiative follows a sectoral approach and aims at overcoming the challenges of developing a green economy. This strategy focuses on four pillars that will support Ethiopia’s developing green economy:
■ Adoption of agricultural and land use efficiency measures
■ Increased GHG sequestration in forestry, i.e., protecting and re-establishing forests for their economic and ecosystem services including as carbon stocks
■ Deployment of renewable and clean power generation
■ Use of appropriate advanced technologies in industry, transport, and buildings.
Federal Democratic Republic of Ethiopia 20

Establishing these pillars within the relevant parts of the economic development
plan will prevent the economy from being locked into an unsustainable pathway and can help to attract the investment required for their development (Figure 6).
The CRGE initiative analysed 150 potential green economy initiatives across seven sectors, taking into account their potential to simultaneously enable/support the country in reaching its GTP targets and reduce/avoid GHG emissions in a cost-efficient way. Current development practices were compared and contrasted with alternatives that have proven successful elsewhere as well as with green economy options newly developed and adapted to the Ethiopian situation. The long list of initiatives that was generated has been rigorously assessed to select and prioritise those that can form a green economy programme for Ethiopia.
FIGURE 6
Developing a green economy requires the integration of economic development and GHG abatement/avoidance
Resilienceinitiatives
Green economy can help to avoid lock-in in old technologies, unsustainable growth and land use
Combining eco-nomic growth with low GHGemissions, e.g.
▪ Sustainable land use via efficient agriculture
▪ Sequestration in forests
▪ Expansion of renewable energy
▪ Resource efficient advanced technologies
Abatement/ avoidanceinitiatives
Developmentinitiatives
Green economy
CRGE
Resilienteconomy
For an initiative to be retained as a ‘prioritised measure’ within the green economy plan, the following criteria had to be met:
■ Pass an initial assessment of relevance and feasibility to be implemented in the local context,
Federal Democratic Republic of Ethiopia 21
■ Enable a positive contribution to reaching the targets of the GTP,
■ Provide significant abatement potential at reasonable cost for the respective sectors.
More than 60 priority initiatives, split across the seven different sectors passed this test based on the analyses made by the CRGE initiative. For each sector, at least three initiatives are available (Figure 7).
FIGURE 7
Long list of potential green growth initiatives –150+ initiatives
Abatement/ avoidance potential –GHG emissions in case of implementation as compared to BAU
Effects on GTP – potential to contribute to reaching targets as outlined in GTP
Cost effec-tivenesschecked –costs to reduce or avoid one t of CO2e
Feasibility in local context –technical and institutional implementability
Prioritized measures for inclusion in CRGE plan –>60 initiatives
150 potential green growth initiatives were screened, >60 have been shortlisted for inclusion in the CRGE strategy
Each of these initiatives will support one or several of the four pillars of the green economy mentioned above, and will complement existing programmes and policy measures aiming at increasing resource efficiency.
The following sections give an overview of all four pillars. A detailed account of each of the individual initiatives is given in the appendix.
Federal Democratic Republic of Ethiopia 22

Agriculture: Improving crop and livestock production
practices for higher food security and farmer income while reducing emissionsWell into the foreseeable future, agriculture will remain the core sector of the economy and provide employment for the vast majority of. Sustained high growth rates of the agricultural sector – the GTP projects more than 8% over the next five years – are needed not only to increase household income of most families, but also to provide food security for a growing population and support the growth of direct exports of agricultural products and/or the establishment of more light manufacturing, which often requires agricultural input.
The traditional economic development path could deliver the required growth, but at the cost of significant agriculture land expansion (inducing pursuing and accel-erating deforestation), soil erosion, and higher emissions as well as at the risk of reaching the limits to further development, e.g., by exceeding the carrying capacity for cattle of Ethiopia.
Building a green economy will require an increase the productivity of farmland and livestock rather than increasing the land area cultivated or cattle headcount. In order to offer a viable alternative to the conventional development path without foregoing growth in the short term and significant advantages thereafter, a set of initiatives has been identified that can provide the required increase in agricultural productivity and resource efficiency.
The CRGE initiative has prioritised the following initiatives to limit the soil-based emissions from agriculture and limit the pressure on forests from the expansion of land under cultivation:
■ Intensify agriculture through usage of improved inputs and better residue management resulting in a decreased requirement for additional agricultural land that would primarily be taken from forests,
■ Create new agricultural land in degraded areas through small-, medium-, and large-scale irrigation to reduce the pressure on forests if expansion of the cul-tivated area becomes necessary,
■ Introduce lower-emission agricultural techniques, ranging from the use of car-bon- and nitrogen-efficient crop cultivars to the promotion of organic fertilizers. These measures would reduce emissions from already cultivated areas.
To increase the productivity and resource efficiency of the Livestock sector, the following initiatives have been prioritised:
Federal Democratic Republic of Ethiopia 23

■ Increase animal value chain efficiency to improve productivity, i.e., output
per head of cattle via higher production per animal and an increased off-take rate, led by better health and marketing,
■ Support consumption of lower-emitting sources of protein, e.g., poultry. An increase of the share of meat consumption from poultry to up to 30% appears realistic and will help to reduce emissions from domestic animals,
■ Mechanise draft power, i.e., introduce mechanical equipment for ploughing/tillage that could substitute around 50% of animal draft power, which – despite burning fuels – results in a net reduction of GHG emissions.
■ Manage rangeland to increase its carbon content and improve the productivity of the land.
These initiatives offer the combined benefit of supporting economic growth, increasing farmers’/pastoralists’ income and limiting emissions and should be integrated into the plan of activities for implementing the transformation plan under development by the Ministry of Agriculture.
Forestry: Protecting and re-establishing forests for their economic and ecosystem services, including as carbon stocksDeforestation and forest degradation must be reversed to support the continued provision of economic and ecosystem services and growth in GDP. Fuelwood accounts for more than 80% of households’ energy supply today – particularly in rural areas. Furthermore, forests contribute an estimated 4% to GDP through the production of honey, forest coffee, and timber. They also provide significant and precious eco-system services: they protect soil and water resources by controlling the discharge of water to streams and rivers, preserve biodiversity, function as a carbon sink, clean the air to create important health benefits, and boost land fertility.
Despite their economic and environmental value, Ethiopian forests are under threat. The growing population requires more fuelwood and more agricultural pro-duction, in turn creating needs for new farmland – both of which accelerate defor-estation and forest degradation. Projections indicate that unless action is taken to change the traditional development path, an area of 9 million ha might be defor-ested between 2010 and 2030. Over the same period, annual fuelwood consump-tion will rise by 65% – leading to forest degradation of more than 22 million tonnes of woody biomass.
Federal Democratic Republic of Ethiopia 24
Besides the agricultural initiatives to reduce the pressure on forests (see above),
the CRGE initiative has prioritised two strategies that could help to develop sus-tainable forestry and reduce fuelwood demand:
■ Reduce demand for fuelwood via the dissemination and usage of fuel-effi-cient stoves and/or alternative-fuel cooking and baking techniques (such as elec-tric, LPG, or biogas stoves) leading to reduced forest degradation,
■ Increase afforestation, reforestation, and forest management to increase car-bon sequestration in forests and woodlands. These initiatives would result in an increased storage of carbon in Ethiopia’s forests, provide a basis for sustainable forestry, and even allow the forestry sector to yield negative emissions, i.e., store more carbon in growing forests than are emitted from deforestation and forest degradation.
■ Promoting area closure via rehabilitation of degraded pastureland and farmland, leading to enhanced soil fertility and thereby ensuring additional carbon sequestration (above and below ground).
Electric Power: Expanding electricity generation form renewable energy for domestic and regional marketsElectricity is a fundamental enabler of modern economic development, from powering cities and fuelling industrial activity to pumping water for irrigation purposes in agriculture. If not adequately scaled up to support economic development, it also risks becoming a fundamental bottleneck to growth. To support economic development at an annual growth rate of more than 10% that the government aspires to, it is necessary to expand electric power supply at a rate of more than 14% per year.
Ethiopia is endowed with ample natural resources to meet this demand, primarily by exploiting its vast potential for hydro, geothermal, solar and wind power – all of which would deliver electricity at virtually zero GHG emissions. If adequately captured, the projected power supply could even exceed the growing domestic demand: while the demand is projected to be nearly 70 TWh in 2030, energy effi-ciency measures exists to decrease the demand by 19 TWh. Hence, increasing the supply and at the same time maximizing energy efficiency offers the possibility to export clean energy to neighbouring countries. These exports, in turn, provide the opportunity to replace electric power generated from fossil fuels, which has significantly higher average costs and significantly higher emissions.
Federal Democratic Republic of Ethiopia 25

Developing the necessary electric power capacity from renewable energy will be
an enormous challenge as the pace of growth required is high. The total investment in expanding electric power generation capacity through 2030 would be approximately USD 38 billion over 20 years or around USD 2 billion annually. This requires a doubling of the current expenditure of USD 1 billion, which could be achieved via a combination of tariff adjustments and the attraction of private capital, climate finance and sovereign wealth funds. The latter could be obtained by exporting clean energy to neighbouring countries and capturing a share of the monetisation of their reduced emissions or by mobilising international assistance in the form of grants.
Taken together, the generation of clean and renewable electric power also allows for green development of other sectors of the economy, such as the replacement of trucks by electric rail or diesel pumps by electric pumps for irrigation. Moreover, via electricity exports, Ethiopia can share its green development to other countries in the region while contributing positively to its trade balance. By basing electricity generation almost exclusively on renewable energy, Ethiopia is avoiding emissions of around 50 Mt CO2e (2030) as compared to the electric power sectors in neighbouring countries.
Transport, industrial sectors and buildings: Leapfrogging to modern and energy efficient technologies A short planning horizon as well as the lack of required funds for expensive tech-nologies often lead to the adoption of technologies that require the lowest upfront investment. However, these technologies are usually less resource efficient, hence offering lower economic, social, and environmental benefits than alternative tech-nologies in the medium to long term.
The transport sector is a prime example of this. The total cost for export ship-ments, for example, could be significantly reduced by revamping the railway con-necting Addis Ababa with the seaport of neighbouring Djibouti. However, main-taining the road connecting both cities in good condition requires much less capital investment than revamping the railway. Shifting transport from road to rail would not only decrease transport costs and improve the trade balance through reduced import of fossil fuels (economic benefits), but would also lower emissions, con-gestion, air pollution, and traffic accidents (social and environmental benefits).
The government sees the opportunity to gear the development of the transport sector to contribute to a sustainable development pathway. Therefore, it plans to:
Federal Democratic Republic of Ethiopia 26

■ Introduce stricter fuel efficiency standards for passenger and cargo transporta-
tion and promote the purchase of hybrid and electric vehicles to counter the low efficiency of the existing vehicle fleet
■ Construct an electric rail network – powered by renewable energy – to substi-tute road freight transport
■ Improve urban transport in Addis Ababa by introducing urban electric rail, and enabling fast and efficient bus transit
■ Substitute imported fossil fuels with domestically produced biodiesel and bio-ethanol.
The urban population is expanding at 4.4% annually, and will surpass 30 million people by 2030. Rapid growth of cities will require large scale investment in urban infrastructure, including the development of management systems for solid and liquid waste, two of the largest sources of emissions in this sector. Off-grid fossil fuel energy use (e.g., diesel generators, kerosene lamps) is the largest source of GHG emissions in the buildings sector in 2010, but the rise of inexpensive elec-tricity generated from renewable energy will help to curtail the growth of this emissions source. The three major green economy initiatives identified in this sector are:
■ Accelerated transition to high efficiency light bulbs for residential, commer-cial, and institutional buildings
■ Use of landfill gas management technologies (e.g., flaring) to reduce emis-sions from solid waste
■ Reduction of methane production from liquid waste.
Among the industrial sub-sectors, cement will be one of the fastest growing, also causing the vast majority of GHG emissions from the industry sector. Output will increase tenfold from 2.7 Mt in 2010 to 27 Mt in 2015. Some cement factories use outdated technology that is not only energy inefficient, but also causes high emissions from the production process. The CRGE initiative has identified a series of initiatives that could help to increase the competitiveness of the cement industry by reducing production cost and – at the same time – would yield significant environmental and health benefits:
■ Improved energy efficiency of the process by converting the technology used from dry to precalciner kilns and from rotary to grate coolers and by introducing computerized energy management and control systems, which can decrease the energy demand and hence the cost of and emissions from cement production
Federal Democratic Republic of Ethiopia 27

■ Substitution of clinker by increasing the pumice content leading to a decrease
in both variable production costs and emissions
■ Increased share of biomass in the mix of energy for production in cement factories, potentially decreasing costs and emissions
Although the cement sub-sector has been highlighted in this report because it represents the most GHG emitting industry and its GHG abatement initiatives have high chances of implementation, the government will take action to put the other industrial sub-sectors also on a sustainable economic development path. The textile, leather, and fertiliser industries are important parts of the envisaged economic development model. The government aims to promote – among other initiatives – energy efficiency and the usage of alternative fuels in these sub-sectors. Further initiatives have also been identified for the steel, chemicals, and mining sub-sectors.
Federal Democratic Republic of Ethiopia 28

BUILDING A GREEN ECONOMY OFFERS COST-EFFICIENT ABATEMENT POTENTIAL WHILE PROMOTING GTP TARGETS
Ethiopia’s green economy offers GHG abatement potential of nearly 250 Mt domestically. Of the total abatement opportunities, more than 80% cost less than 15 USD per ton. Adopting the green economy path promotes socio-economic targets such as rural development, health, and the creation of employment in high value-added production.
Ethiopia’s green economy offers GHG abatement potential of 250 Mt to the global communityThe priority initiatives that form the foundation of the green economy concept could help to curb the increase in the global emissions projected in the BAU scenario. While contributing to reaching economic and social development targets, we have the domestic potential to contribute to the global effort by abating around 250 Mt CO2e in 2030 as compared to conventional development practices – this equals a decrease in GHG emissions of up to 64% compared to BAU in 2030.4 Given the projected population growth, emissions on a per capita basis would decrease from 1.8 t of CO2e to 1.1 – a decrease of around 35% – while multiplying GDP per capita from USD 380 to more than USD 1,800.
Ethiopia and the global community have finite human, technological, and financial resources. The CRGE strategy must make choices about the levers not only to capture a large share of the abatement potential but also to boost economic and social development at the same time.
Two sectors – agriculture and forestry – should receive particular attention: they contribute around 45% and 25% respectively to projected GHG emission levels under business-as-usual assumptions and together account for around 80% of the total abatement potential (Figure 8).
4 More GHG abatement available beyond the one of the initiatives considered in the low carbon scenario through afforestation, reforestation and forest management on additional land. However, this comes with incremental costs and more stringent requirements on land use management across the different needs through the country.
Federal Democratic Republic of Ethiopia 29

FIGURE 8
CRGE implementation could ensure a low-carbon economic development pathway, decreasing per capita emissions by 60%
Additional abatement potential of ~19 Mt CO2efrom exporting green power to regional markets
90
400
-64%
GreenEconomy2030
145
Buil-dings
5
Industry
20
Trans-port
10
Forestry
130
Agri-culture
75
55
2030BAU
400
1070
405
90
185
2010
150
5 555
Emissions per year1, Mt CO2e AgricultureForestry
PowerTransport
IndustryOthers
1 Rounded numbers2 Currently estimated emissions form buildings and waste
t CO2e/capita
1.8 3.0 1.1
The magnitude and relative importance of the initiatives identified to reduce GHG emissions vary significantly. The following section gives a brief overview of the abatement potential identified (in Mt CO2e abatement potential in 2030 as com-pared to the BAU level of emission). Table 1 and Table 2 display the key assumptions that were taken to project the abatement potential in each sector. A more detailed account on assumptions and calculations can be found in the appendix.
Federal Democratic Republic of Ethiopia 30

TABLE 1
Core assumptions for abatement initiatives (1/2)
Sectors
Grossabatement potential, Mt CO2eAbatement levers Core assumptions (2030)
Forestry1
▪ Fuelwood-efficient stoves ▪ Household reach2 (million): 15.7/0.3 34.3▪ LPG stoves ▪ Household reach2 (million): 0/0.3 0.6▪ Biogas stoves ▪ Household reach2 (million): 1.0/0.1 2.3▪ Electric stoves and mitads ▪ Household reach2 (million): 1.0/up to 4.9 14.0▪ Afforestation/Reforestation ▪ Area in million ha: 2 (A) and 1 (R) 32.3▪ Forest Management (forest/woodland) ▪ Area in million ha: 2 (F) and 2 (W) 9.7
1 Initiatives for reduced deforestation (agricultural intensification and irrigation) stated under soil-based levers2 Household reach for rural / urban households3 Abatement potential from reduced deforestation (agricultural intensification and irrigation) counted under forestry sector
Soil3
▪ Lower-emitting techniques 40.1▪ Yield increasing techniques 27.2
▪ Irrigation
▪ Household reach2: 13.2/0.0▪ Only 1.7% growth in cropland needed
under intensification to achieve 9.5% crops GDP growth due to 3.5% yield growth and 4.0% crops value growth
▪ Area in million ha: 1.4 (large scale); 0.3 (small scale)
10.6
Live-stock
▪ Value chain efficiency
▪ Household reach2 : 13.2/0.0
▪ Enhancing diversification of animal mix
▪ Mechanisation▪ Pastureland improvement
▪ Household reach2 : 19.5/0.0
▪ Target share of chicken: 30%
▪ Area in million ha: 5
16.117.711.23.0
■ Forestry in 5 million ha of forest and 2 million ha of woodland alone represents around 50% of the total domestic abatement potential (or 130 Mt CO2e) and, as a sector, can even yield ‘negative emissions’ via sequestration, i.e., storage of carbon in the form of wood, at a level that surpasses emissions from deforestation and forest degradation. The single most important lever is to reduce demand for fuelwood through fuelwood efficient stoves, offering a potential of almost 35 Mt CO2e reduction, while other advanced cooking and baking technologies (electric, biogas, and LPG stoves) offer an additional combined potential of more than 15 Mt CO2e. Capturing this abatement potential requires the switch of more than 20 million households to more efficient stoves. In addition, afforestation (2 million ha), reforestation (1 million ha), and forest management (2 million ha of forests and 2 million ha of woodlands) can help to increase sequestration by more than 40 Mt CO2e and hence even surpass any remaining emissions from the forestry sector. Pressure from agriculture on forests can be reduced by agriculture intensification on existing land or unlocking degraded land thanks to irrigation, with the potential to lower deforestation and thus the associated emissions by nearly 40 Mt CO2e in 2030.
Federal Democratic Republic of Ethiopia 31

■ The agriculture sector has a total abatement potential for soil- and livestock-
related emissions of 90 Mt CO2e, representing around 35% of the total domestic abatement potential
– Soil. The introduction of lower-emitting techniques, such as conservation agriculture (including applying zero or minimum tillage), watershed man-agement, and nutrient and crop management, could reduce emissions by 40 Mt CO2e in 2030. The introduction and enhancement of these lower-emitting techniques will form a priority for the soil sector in the coming years and the initiative will target 75% of rural households by 2030. Moreover, through agricultural intensification and capture of new agricultural land in arid areas through irrigation, techniques from crop production help to increase the abatement potential from saved forests. In fact, these initiatives increase the sequestration from forests by 38 MT CO2e in 2030.
– Livestock. There is ample potential to increase the efficiency of the cattle value chain via higher productivity of cattle (for both meat and milk) and an increased off-take rate (decreasing the age at which livestock are sold). Several initiatives would fall underneath this umbrella, including improving the market infrastructure, health facilities, and feeding for livestock. This could reduce emissions by more than 15 Mt CO2e in 2030. Furthermore, a partial shift towards lower-emitting sources of protein – e.g., poultry – could yield another emission reduction of nearly 20 Mt CO2e, assuming the share of chicken in the protein mix will change from 15 to 30%. Finally, the mechanisation of draft power, i.e., the introduction of mechanical equipment for ploughing/tillage, could help to substitute about 50% of animal draft power and lower emissions by more than 10 Mt CO2e in 2030, while the improvement of pastureland lowers emissions by 3 Mt CO2e in 2030.
Federal Democratic Republic of Ethiopia 32

TABLE 2
Core assumptions for abatement initiatives (2/2)
Power
Sectors
Buil-dings & Green cities
Grossabatement potential, Mt CO2e
▪ Clean power exports
Abatement levers
▪ High-efficiency lighting
▪ Domestic surplus capacity: 28 TWh▪ Substitution of power generation at
carbon intensity of 0.7 kg CO2e/kWh
Core assumptions (2030)
▪ Efficiency improvement: 60-77%
19.31
5.12
▪ Improved landfill gas management ▪ Adoption in all towns above 20,000 inhabitants (271) up to 2030
0.9
▪ Improved liquid waste management ▪ Adoption in all towns above 100,000 inhabitants (34) up to 2030
0.91 Not counted as domestic abatement potential 2 Accounted in power
Industry(cementonly)
▪ Clinker substitution (e.g. by pumice) ▪ Share of additives: 32% to 55%▪ Share grade IV cement: 36%
5.2
▪ Biomass (agri-residues) usage ▪ Share of energy substituted: 20% 4.3▪ Energy efficiency equipment
(Precalciner kiln; grate cooler; computerized process control)
▪ Energy reduction potential of 12%; 8%; 4.5%
5.3
▪ Waste heat recovery ▪ Energy reduction potential: 4.5% 1.0
Trans-port
▪ Electric rail ▪ Total km of track: 5,196 8.9▪ Fuel efficiency standards ▪ Programme reach: 30% for passenger
vehicles; 10% for freight vehicles3.1
▪ Light rail and bus rapid transit ▪ Shift in passenger-km: 7% for LRT; 3% for BRT
0.2
▪ Hybrid and electric vehicles ▪ Decreasing cost of ownership 0.1▪ Mixing ethanol and biodiesel ▪ Maximum blends: 15% and 5% 1.0
■ The electric power sector projects below 5 Mt CO2e domestic emissions for 2030. However, one important initiative can be identified: If the installed electric power generation capacity exceeds domestic demand as planned, Ethiopia will have capacity to export electricity generated from renewable energy to countries in the region (up to 28 TWh). This will substitute for their conventional electric power generation and hence decrease GHG emissions by nearly 20 Mt CO2e (which could come on top of the around 250 Mt CO2e identified in other sectors).
■ Of the identified industry abatement potential, around 70% is concentrated in the cement industry. The main lever, clinker substitution, would increase the share of additives in cement, particularly pumice (5 Mt CO2e of abatement). The upgrade to more energy efficient technologies and waste heat recovery can reduce up to 6 Mt CO2e in 2030, while the usage of biomass (mainly agri-residues) will help to reduce GHG emissions by 4 Mt CO2e. All other industrial sectors that were analysed (e.g., chemicals, fertiliser, textile, leather, paper and pulp) account for an abatement potential of around 6 Mt CO2e in 2030.
■ Transport offers various opportunities to decrease emissions. All of these opportunities achieve their abatement potential through increased efficiency or a
Federal Democratic Republic of Ethiopia 33

shift to lower-emitting fuel sources. The largest initiatives with the greatest
abatement potential are the construction of an electric rail network (9 Mt CO2e) followed by the introduction of fuel efficiency standards for all vehicles (3 Mt CO2e). This assumes the construction of more than 5000 km of rail tracks and new fuel efficiency standards for 30% of passenger vehicles and 10% of freight vehicles by 2030. Although the abatement potential is not as large, the introduction of bio-fuels will also form a priority. The combined abatement potential of increasing the use of ethanol and biodiesel in the fuel mix is 1 Mt CO2e.
■ The main abatement levers identified for buildings will result in an acceler-ated transition to high efficiency light bulbs (leading to increased power export potential reducing around 5 Mt CO2e abroad) and an improved handling of solid and liquid waste. The total abatement potential of improved waste handling (for liquid and solid waste) amounts to around 2 Mt CO2e.
More than 80% of the abatement opportunities cost less than USD 15 per tonLike many other developing countries who have not yet ‘locked in’ their fast growing economy into carbon intensive infrastructure, Ethiopia could provide to the international community a cost efficient contribution to the global effort to abate GHG emissions: More than 80% of the green economy initiatives’ abate-ment potential is priced at less than USD 15 per t CO2e (before potential carbon revenue), i.e., more cost competitive than most abatement initiatives in developed economies, and 16 initiatives have zero or negative costs of abatement, i.e., eco-nomically attractive initiatives albeit a significant initial investment often difficult to bear by the entity responsible for its implementation.
The CRGE initiative has conducted a quantitative assessment of the economics of the prioritised abatement opportunities, including estimating the abatement cost to be incurred for the measures within each sector (expressed in USD/t CO2e abate-ment).5 (The text box at the end of this section provides a description of the method for determining GHG emission abatement cost curve.)
The outcome of the cost analysis for the prioritised green economy initiatives testi-fies to a good starting position for establishing a green economy: more than 45% of the abatement potential (16 initiatives) comes at zero or negative costs – these initiatives would not only lead to lower emissions, but would also save costs as
5 Understanding the costs of GHG mitigation is a critical step in the development of a green economy plan as it helps to identify and prioritise the most cost-efficient ways to reduce GHG emissions
Federal Democratic Republic of Ethiopia 34

compared to their conventional alternatives (i.e., the net present value of their cash
flows is positive). Of the remaining 12 initiatives that have been costed, 5 have abatement costs lower than USD 15 per ton, i.e., abatement costs would still be lower than the average market price for CO2 emission certificates traded via the European Trading Scheme (ETS). Although these initiatives come at higher costs than the traditional development pathway, they might offer the possibility to fully fund the incremental costs via a monetisation of the emission reduction. In a global comparison, many of Ethiopia’s initiatives are comparatively inexpensive – which can be crucial in giving the country a competitive advantage in attracting climate finance. The majority of abatement potential is concentrated on few initiatives – about 55% of the total abatement potential can be captured by 5 initiatives: lower emitting techniques in agriculture, fuelwood efficient stoves, afforestation/ reforestation, yield increasing and power exports (Figure 9).
The total abatement potential as displayed on the horizontal axis of the cost curve in Figure 9 (264 Mt CO2e) is not equivalent to the total abatement potential dis-played in Figure 8. This is due to three reasons: first, the non-domestic abatement potential from power exports is displayed in the cost curve, but not shown as a part of the total domestic abatement potential in Figure 8; second, the total abatement potential of all initiatives is not equal to the sum of the abatement potential of each individual initiative, e.g., introducing fuel-efficiency standards in the absence of hybrid cars has a higher abatement potential than if both initiatives are introduced at the same time. The total net potential of the initiatives included in the cost curve after accounting for non-additivities is around 261 Mt CO2e. Last, some initiatives with very small abatement potential have not been evaluated with regard to their cost and are hence not included in the cost curve.
Federal Democratic Republic of Ethiopia 35

FIGURE 9
2008060
Abatement potential1MtCO2e per year
-30
-80
-90
-230
240
Abatement costUSD per tCO2e
40
120
280
15
26022020
30
-20
-10
0
10
20
100 120 140 160 1800 40
Most green growth initiatives are economically viable and could reduce GHG emissions at relatively low cost
1 Represents total identified gross potential, some measures are not additive (total net potential is less than sum of all gross potentials)2 Non-domestic potential (will arise only in importing countries) 3 Assuming full implementation of all levers where cost has been evaluated (excluding buildings/green cities and industry other than cement)
Ethiopia’s abatement opportunities cost curve
Net potential afteraccounting for non-additive levers3
261
86% of abatement potential below 15 USD per tCO2e
Fuelwood efficient stoves
Power exports2
Agricultural intensification
Shift of animal mix
Lower emitting techniques
Afforestation/ reforestation
AgricultureForestry
PowerTransport
Industry
Electric rail
FIGURE 10
Abatement Cost Curve: General overview of methodology
4
2
1
Abatement costUSD per tCO2e of reduced emissions in 2030
Each option for reducing emissions is represented by a bar on the cost curve.
The width of each bar shows the abatement potential – the tons of annual emissions that would be reduced in 2030 if we implemented this option fully.
The sum of the width of all bars shows the sum of the abatement potential of all initiatives – in reality the aggregated abatement potential will be lower than the sum of each initiatives as it might not be feasible to implement some initiatives at the same time
The height of each bar shows the abatement cost – the cost of implementing this option fully in terms of dollars per ton of reduced annual emissions.
The bars on the right represent costly options, while the bars that face downward represent options that actually have negative cost: they save money as well as emissions.
The Abatement Cost Curve allows us to view and compare all the available options for reducing emissions along two key dimensions at once: How much can each option contribute to emissions abatement, and at what cost does it do so?
2
1
4
Abatement potentialReduced emissions in 2030, Mt CO2e
3
3
Federal Democratic Republic of Ethiopia 36

Method for calculating the GHG emission abatement cost curve – The cost curve describes green economy initiatives based on two characteristics: the annual potential of abating GHG emissions in a given year and the costs per tonne abated (Figure 10). The underlying assumption is full implementation of the initiative; the reference year is 2030. The abatement cost curve visualises two important pieces of information concerning each initiative:
■ What is the cost of abatement? The answer is reflected in column height, sorted by the most cost efficient, from the left
■ What is the potential volume of GHG abatement? The answer is displayed as column width – the wider the column, the more potential the initiative offers.
The abatement cost of each initiative is defined as the incremental cost (positive if more expensive, negative if more cost economical) of a low-emission path compared to the required cost or benefits of the conventional alternative under-lying the BAU scenario. Costs are measured in USD/t CO2e of abated emissions in a given year in the future (here always referring to year 2030). It includes both the incremental capital expenditure (investment) required for the implementation of the abatement lever compared with the BAU scenario, the incremental operating cost required for the abatement lever and potential benefits (e.g., lower costs or higher revenues) compared with the BAU scenario. The capital expenditure is taken into account in the form of an annualised investment cost. The annualised cost is calculated with an economic amortisation period (usually between 20 and 50 years, depending on type of investment) and a real capital cost of 6%. Costs and benefits are estimated from a societal perspective, i.e., irrespective of who bears costs or who benefits. The costs do not include any subsidies, taxes, or external costs that are incurred indirectly and that largely depend on the exact form of implementation, such as communication cost and transaction cost.
The columns that extend upwards represent measures with a cost higher than USD 0 per tonne of reduced emissions, while the columns that extend downwards represent measures that have a negative cost per tonne of reduced emissions: they save money as well as emissions. Therefore, initiatives with a negative abatement cost are economically advantageous in any case.
Federal Democratic Republic of Ethiopia 37

Green economy will unlock economic growth, create
employment, and provide additional socio-economic benefitsMoving our economy forward on the green pathway will require a trans-formational shift in current economic development practices, will touch most sec-tors of its economy, will contribute to the welfare of the population and to the increased quality of our environment, and will stimulate economic benefits in several sectors.
The CRGE effort has estimated that its selected initiatives would reach up to two-thirds of the whole economy (by 2030) and move them onto a more sustainable pathway (Figure 11). Some of the initiatives also support the creation and growth of new business opportunities, e.g., the local production of efficient stoves. The initiatives have the highest reach within agriculture by creating a green agricultural sector that generates increased output originating from higher yields rather than from an expansion of agricultural land or the cattle population. As initiatives have been identified for most of the industrial sub-sectors, a high share of these sub-sectors is also likely to be positively affected by the green economy. In addition, a smaller part of the service sector will also be reached by the green economy through initiatives identified in transportation and buildings.
Adopting a green economy development path would have benefits for the population, the environment, and the economy: it would improve public health through better air and water quality and accelerate rural development by increasing soil fertility, food security, and rural employment. Households would benefit from higher energy efficiency – especially from more efficient cooking/baking and transport – with savings worth up to 10% of household income (particularly in rural areas). This would lead to an increase in domestic savings and hence result in an enhanced investment capacity.
From a macroeconomic perspective, green economy initiatives would also improve the balance of payments by reducing dependency on imports of, e.g., fos-sil fuels, and create a more secure power supply, an essential prerequisite for sus-tainable economic development. This effect alone could improve the balance of payments by several billion USD (in 2030). The low-carbon supply of goods and services (e.g., manufactured goods, power) can easily be marketed as a major competitive advantage for Ethiopia’s exports. Moreover, the decision to commit to sustainable economic development opens the door to different sources of international environmental funding, such as “Fast Start” funding, CDMs, and voluntary markets, that could complement the funds earmarked for development.
Federal Democratic Republic of Ethiopia 38

FIGURE 11
Up to two-thirds of the economy would be affected by moving to a green growth path
23%
28%(Services)
4% (Industry)4% (Agriculture)
Services
11% Industry30%
Agriculture
Share of GDP affected (2030) and examples of economic impact/benefits from green economy
Total share of theeconomy affectedby green economy
~64%
Share of GDP not affected
Agriculture and forestry
▪ Creating USD 1 bn yearly savings from fuelwood expenditure for rural population
▪ Increasing productivity of up to 40 million head of livestock
Industry
▪ Total fuel cost savings of more than USD 1 bn p.a. in 2030
▪ Enabling renewable power generationof more than 67 TWh, opening high potential for power exports
Service
▪ Savings of around 1/3 of fuel importsfor transportation
BUILDING A GREEN ECONOMY REQUIRES MORE THAN USD 150 BILLION OVER 20 YEARS, BUT PROVIDES ACCESS TO CLIMATE FINANCE
Developing the green economy will require an estimated expenditure of around USD 150 billion over the coming 20 years – around USD 80 billion of which is capital investment and the remaining USD 70 billion operating and programme expenses. Of the total expenditure, almost USD 30 billion are projected to occur in the short term up to 2015, with almost USD 22 billion of this being capital expenditure (Figure 12). These figures underline the significant funding needed to build a green economy despite the overall low average cost of abatement, and the need to mobilize capital investment in the early years of the development of the green economy. However, not all of this expenditure is necessarily additional to current investment plans – rather, a large part of this expenditure, e.g., for power generation infrastructure or transport infrastructure, would also occur in a conventional growth scenario.
Federal Democratic Republic of Ethiopia 39

FIGURE 12
Building a green economy requires around USD 150 billion up to 2030 Billion USD
Short-term: 2011-2015 Long-term 2011-2030
CAPEX1 additional
OPEX additional(excl. programme cost)
Programme cost
Savings
Abatement expenditure(without carbon revenue)
13.7
-3.4
12.3
2.2
5.6
7.9
12.0
37.5
124.8
14.0
57.9
40.9
314922722
1 Full capital expenditure, not amortized2 Aggregated abatement potential; expenditure per t CO2e not equivalent to abatement cost in cost curve, as the CAPEX abatement expenditure is not
annualized via amortization (rather: cash-flow perspective)
Mt CO2e total aggregated abatement potential
Also required for CRGE: Baseload (BAU) CAPEX(e.g. hydropower)
The largest share of the total investment of USD 80 billion will be required for the development of power generation and transmission infrastructure (48%), followed by the transport sector (29%) and financial requirements for the transformation of the agricultural sector (2% for soil and 3% for livestock) as well as the forestry sector (12%, including agricultural intensification and irrigation initiatives that ultimately create GHG abatement in the forest sector). Upgrading technology in the cement sector will require investments equal to nearly USD 5 billion over the next 20 years – or 6% of the total estimated green economy capital investment.
The power generation investment, however, has to be considered as part, not as an addition, of the ‘conventional development path’ because the renewables-based development of the electric power sector is part of the existing development path. Indeed, the scale-up of renewable energy infrastructure builds on existing competitive advantages and represents the most viable pathway economically, socially, and environmentally, and the Ministry of Water and Energy through the Ethiopian Electric Power Corporation has consequently built its development
Federal Democratic Republic of Ethiopia 40

master plan very strongly on hydro, solar, geothermal, and wind power. Hence,
this expenditure is displayed as a BAU expenditure in Figure 12.
In order to analyse the required type of financing for the respective initiatives, their expenditure is grouped into 3 distinct categories (Figure 13):
FIGURE 13
More than 50% of expenditure will have positive returns −out of that, more than 20% in the short to medium term
53.3
Category CNo positive return,
grants/performance pay requirement
Category BPositive return, but long term financing
requirement
34.5
Category APositive return,
short term financingrequirement
25.0
AgricultureForestry
PowerTransport
IndustryBillion USD, total cost1
1 Including additional CAPEX, additional OPEX, and programme cost (not containing baseload/BAU expenditure)2 NPV calculated with 6% discount rate; societal perspective, the implementing agency might face higher net expenditure when benefits
(i.e. savings or revenues) are captured by different parties
Definition Positive NPV2 of first five years of cash flow (from start of initiative)
Positive NPV2 of overall initiative (from start of initiative up to 2030), but not after first five years
Negative NPV2 of overall initiative (from start of initiative up to 2030)
Percent of total cost
22% 31% 47%
■ Category A: Expenditure for initiatives that have positive return and only require short-term financing. These are defined as yielding a positive Net Present Value (NPV6) from the first five years of cash-flow (from start of implementation of the initiative).
■ Category B: Expenditure for initiatives that have a positive return, but require long-term financing. These are defined as yielding a positive NPV from the overall initiative (from start of implementation of the initiative) up to 2030, but not during the first five years.
6 The NPV is calculated with 6% discount rate (real, derived according to usual market-based risk-free interest rate and risk premium) and takes into account all expenditure and benefits (taking the societal perspective). It should be noted that the implementing agency might face higher net expenditure when benefits (i.e., savings or income) are captured by different parties.
Federal Democratic Republic of Ethiopia 41

■ Category C: Expenditure for initiatives that do not yield a positive (financial)
return, hence they require grants or performance payments for GHG abatement. These are defined as yielding a negative NPV from the overall initiative from start of implementation of the initiative up to 2030. This does, however, not necessarily mean that the initiative does not yield a positive NPV at all. The construction of electric rail, for example, has been calculated with a much longer depreciation period and generates positive returns from the initial investment even beyond 2030, which can eventually make the overall return positive.
This categorization shows that more than half of the expenditure of the proposed initiatives will have positive returns, i.e., the green economy initiatives are less expensive – over the 20-year horizon – than the conventional alternatives (Figure 13). This also translates into negative GHG abatement cost as displayed in the cost curve in Figure 9.
More than 20% of the expenditure for green economy initiatives will already have positive returns and pay back in the short run (i.e., five years or less after start of the implementation). However, the profile of expenditure of the green initiatives typically has a bulge at the beginning due mainly to upfront capital investment. Upfront investments for green economy initiatives are usually higher due to the higher investment required in modern and efficient technology, compared to the one of the traditional path, as well as the investment required to set up the different scale-up programmes. On the other hand, the medium- to long-term running costs are typically lower due to the combined effects of fuel savings and efficient use of other resources. This effect is reflected in a large part of the expenditure only paying off in the long run.
On the one hand, the green path for 2010 to 2030 is more capital intensive. For some initiatives, accounting for 47% of the expenditure, the green path could be even more expensive than the conventional development path.7 The implementa-tion of these green economy initiatives will require the support of international funding. On the other hand, potential support from climate-related sources of funding comes as a complement and hence helps to fund initiatives that would otherwise not be financed. They provide the additional support required to steer the economy towards sustainable growth instead of developing along a traditional path, and will reinforce the robustness of many sectors, especially in agriculture.
A funding pool of at least USD 20 billion annually should be obtained from various climate finance schemes set up to foster the green economy initiatives of developing countries like Ethiopia (Figure 14). These funds are typically available 7 This is not necessarily the case; please refer to description of category C expenditure.
Federal Democratic Republic of Ethiopia 42

only for initiatives that reduce GHG emissions, i.e., only if the receiving party
proves reduced GHG emissions as compared with BAU development. In the short term, support from climate finance can take the following forms:
■ Bi-/multilateral grants primarily for project setup, capacity building, technol-ogy development, and dissemination
■ Bi-/multilateral pay-for-performance deals, i.e., payments linked to verified GHG abatement
■ Trading schemes or offset markets, i.e., emission reduction, for example result-ing from Clean Development Mechanisms (CDMs), sold to companies (in ETS) or committed countries (cap and trade) or via voluntary carbon markets.
At the 2009 Conference of Parties in Copenhagen, developed countries formally committed “Fast Start Funding” of USD 30 billion for 2010-2012, half of which is to be spent on GHG abatement. Beyond 2020, the same countries have pledged USD 100 billion p.a. for abatement and adaptation, but the sources of these funds have not yet been specified. Trading of emission certificates offers an additional USD 10 billion to USD 20 billion p.a. under the Kyoto Protocol or the European Trading Scheme (ETS).
Ethiopia will divide all prioritised green economy initiatives into three categories:
■ Own initiatives that are planned and fully funded by the government
■ Supported initiatives that are planned by the government but require support in implementation
■ Market-based initiatives for which Ethiopia might be able to monetise car-bon credits in exchange for GHG abatement.
Federal Democratic Republic of Ethiopia 43
FIGURE 14
Ethiopia can have access to a vast pool of climate funds resources totalling at least USD 20 billion p.a.
2020 Total 1001
Total 20-31
Others 1
Norway 1
Japan 5
EU 3
ETS 8-11
Cap and trade 2-10Pledged bilateral funds (grantsand pay for performance)
Trading schemes/offset markets
Climate fund resources Billion USD, annual average 2010–20 (rounded)
ESTIMATION
Shor
t-ter
m (u
p to
201
2)20
20
▪ Formal commitment of USD 30 billion for 2010-12 by developed countries
▪ 50% for mitigation
▪ Focus so far on REDD
▪ Large funds are available from climate finance schemes that could help to finance green growth initiatives
▪ These funds are available only for initiatives that reduce GHG emissions, i.e. if receiving party proves reduced GHGemissions as compared with business-as-usual development
▪ Goal of USD 100 bn p.a. by 2020
▪ Sources not yet specified
1 Bilateral and multilateral funding pledge, does not include carbon markets
All of the prioritised green economy initiatives could potentially be candidates to access the emerging climate finance pool in exchange for GHG abatement. The value given to each tonne of GHG abated differs with the ‘monetisation’ scheme. For example, existing bilateral deals targeted at reducing and avoiding emissions as well as increasing sequestration in the forestry sector were valued at around USD 5 per t of CO2e abated while the average market price of a t of CO2e in the European Trading Scheme (ETS) is three times higher, at USD 15 per t. If fully monetised, the total technical abatement potential of Ethiopia’s green economy of around 250 Mt CO2e by 2030, using these reference prices, could be worth between USD 1.2 billion and USD 3.6 billion p.a. by 2030. However, due to the uncertainty concerning the future of the global climate finance regime (particularly the extension of the Kyoto Protocol), there is uncertainty about how much of this potential can indeed be monetised.
While it is not realistic for Ethiopia to capture the full technical abatement poten-tial, nor to monetise every single initiative, the indicative market value of its abatement potential reflects the importance for the nation to deploy all its effort to embrace the green economy plan.
Federal Democratic Republic of Ethiopia 44

Making it happen: Ethiopia’s action plan to create a green economyWe are starting to put in place the building blocks necessary to implement its green economy initiative. The government has developed an action plan to set up a permanent financial mechanism, initiate the stakeholder engagement process, and set priorities for implementation of initiatives. Four initiatives have been selected for fast-track implementation: attracting the investment required to exploit hydropower potential; promoting advanced rural cooking technologies on a large scale; improving the efficiency of the livestock value chain; and Reducing Emissions from Deforestation and Forest Degradation (REDD).
The government is using significant resources to build and implement its green economy, but to capture the full potential of the plan, it welcomes the partnership with bilateral and multilateral development partners as well as contributions by the private sector.
GEARING UP: PERMANENT COMMITMENT, AN EMERGING INSTITUTIONAL SETUP, AND STAKEHOLDER MOBILISATION
To achieve the Climate-Resilient Green Economy (CRGE) vision, the government can draw on its demonstrated track record of commitment to developing a green economy.
Strong commitmentEthiopia has repeatedly demonstrated its commitment to developing a green econ-omy. Besides Prime Minister Meles Zenawi’s leadership role in international cli-mate negotiations, we have launched the CRGE initiative, which is led by the Prime Minister’s Office, the Environmental Protection Authority (EPA), the Ethiopian Development Research Institute (EDRI), and six ministries.
These institutions and the relevant ministries have dedicated significant resources and have organised a robust and participatory process to develop the green economy initiative.
As shown in Figure 15, seven sectoral sub-technical committees (STCs) have been established to work on these plans and see them through to successful implemen-
Federal Democratic Republic of Ethiopia 45

tation. Since February 2011, more than 50 experts from about 20 leading govern-
mental institutions have dedicated time, effort, and resources to developing sec-toral plans and an integrated federal plan. The results of this work have been dis-cussed in the biweekly Technical Committee meetings that have been chaired and administered by the Environmental Protection Authority. The Ministerial Steering Committee – chaired by H.E. Ato Newai Gebre-ab and composed of the State Ministers and senior officials from the participating institutions – represents the most senior body in the CRGE effort and has decided on the overall direction of the work as well as discussed and approved the sectoral and overall results.
As its first major deliverable, the CRGE initiative has conducted a comprehensive investigation of the current development path and options for building a green economy as outlined in this report. The government has thereby started a process that will be pursued and improved in the coming years.
In addition to the green economy initiative, which is oriented to GHG mitigation, the economy will be made climate resilient. As part of the CRGE initiative, the threats related to climate change have been identified and a cost effective adaptation programme has been developed.
FIGURE 15
PM’s office’s leadership and inter-ministerial approach ensure national commitment and alignment across government
1 Not operative, yet
Sub-Technical Committees
Technical Committee (chair: Ato Dessalegne Mesfin, EPA)
Environmental Council
Building & green cities
SoilElectric power supply
Forestry Live-stock
Trans-port Industry Health1
Agriculture
Ministerial Steering Committee(chair: Ato Newai Gebre-ab, EDRI)
Federal Democratic Republic of Ethiopia 46

Emerging institutional setup
The current setup outlined above has proved instrumental to kick-start the CRGE initiative – however, responsibility for further development and implementation of this crucial undertaking ought to be transformed into a permanent setting. To establish this lasting platform, the government has started to develop a permanent setup and to identify the required personnel capacity.
Overall responsibility and oversight lies with Ethiopia’s Environmental Council. The council is chaired by the Prime Minister and comprises members drawn from Federal Ministries, Presidents of National Regional States, and representatives of non-governmental bodies, the private sector, and trade unions. The Environmental Council is responsible for recommending laws and regulations for approval by the Council of Ministers. The Environmental Council can approve environmental standards and directives independently. It is envisaged that the Environmental Council installs a subsidiary body to directly oversee the CRGE initiative. This subsidiary body will be the already established Ministerial Steering Committee, granted the required legal status of a permanent public institution. The appoint-ment of its chair would then be under the responsibility of the Environmental Council.
The government plans to govern the CRGE initiative under the co-responsibility of the EPA and the Ministry of Finance and Economic Development (MoFED), with the following roles and responsibilities:
The EPA supervises and regulates implementation of the technical components of the CRGE initiative. To this end, it will have a team of experts working on each economic sector to monitor projects so as to ensure their effectiveness, measure, report, and verify (MRV) project outcomes, and provide appropriate access to information on projects and outcomes to the public. It will maintain close links with all relevant ministries including by fostering the establishment of environ-mental units within those ministries and other relevant sectoral agencies that do not already have them. The EPA is accountable to the Environmental Council and will collaborate under the Council’s direction with all institutions relevant for the CRGE process – such as the MSC and the TC that are responsible for the alignment and approval of technical content.
Specifically, the EPA will be responsible for (a) deciding on proposals to be sub-mitted for financial support or carbon credit; (b) organising and conducting inde-pendent measurement, review and verification; and (c) adopting guidelines, procedures; and templates. The latter includes, inter alia, templates and guidelines
Federal Democratic Republic of Ethiopia 47

for preparing proposals for financial support or access to carbon credit as well as
monitoring reports of their implementation. The EPA will develop procedures for the review of green economy initiatives as well as provide relevant methodological guidance on determining geographical and sectoral boundaries, on setting baselines for the quantification of credits, and on measuring GHG emissions. Addressing – among others – the confidentiality of information, the EPA will develop a code of conduct and procedures. For transparency, the EPA will maintain and upload on a web-site a register with up-to-date information on decisions on and implementation of all green economy initiatives.
The MoFED, in collaboration with the EPA, will solicit financial support from international sources and channel the available funds in the form of advance sup-port or ex-post payment. The MoFED will ensure transparency, objectivity, con-sistency, and professionalism in its operations in compliance with international agreements. The UNDP has offered its support in establishing a Multi-Donor Trust Fund within this ministry through which funds could be channelled. The govern-ment will eventually fully and independently run the facility – regardless of the concrete organisational design.
At the federal level, ministries and other sectoral agencies will participate and en-courage the participation of other entities in their respective sectors in the formu-lation and implementation of the components of the green economy. These ministries and other sectoral agencies are responsible for:
■ Formulating proposals of green economy initiatives for financial support or carbon credit
■ Coordinating the implementation of sectoral or sub-sectoral green economy initiatives
■ Preparing and submitting monitoring reports
■ Designing, establishing and staffing their respective environmental units.
National regional states – in collaboration with the relevant federal level institu-tions – are responsible for implementing the majority of the initiatives outlined in the CRGE strategy. The coordination between regional and federal levels will be under the responsibility of the respective environmental agencies of the national regional states. This collaboration has proved efficient in numerous other undertakings.
Federal Democratic Republic of Ethiopia 48

A key design principle for the permanent institutional setup is to use existing
institutions and responsibilities in order to minimize requirements for funding and organisational reform. The EPA plans to largely deploy people who are already involved in the CRGE initiative today. This shortens the time needed for recruiting and ensures the high quality and fit of the staff.
Stakeholder mobilisationTo kick-start implementation and build widespread awareness and support, the initiative has conducted and will continue to conduct extensive stakeholder con-sultation. Around 300 stakeholders have already been identified and consulted by the STCs. Consultation was conducted under the co-responsibility of the STCs/ ministries and the EPA between July and September 2011 and primarily focused on governmental and public stakeholders.
■ Sectoral consultation was organised and conducted by the STCs/ministries. These events focused on the presentation, discussion, and improvement of the sectoral work on green economy initiatives. Consultation events focused on workshops involving experts from ministries and other public sector organisations as well as selected experts from academia.
■ In addition to this sectoral consultation, a national consultation was led and organised by the EPA and the EDRI. National consultation involved regional governments, standing committees of the parliament, and workshops with selected researchers.
PROVIDING A FOCUS FOR ACTION: CRGE HAS ALREADY FAST-TRACKED FOUR INITIATIVES FOR IMMEDIATE IMPLEMENTATION
Four initiatives have been fast-tracked for implementation: attracting financing to exploit Ethiopia’s vast hydropower potential, promoting advanced cooking technolo-gies on a large scale, monetising reduced emissions from livestock, and Reducing Emissions from Deforestation and Forest Degradation (Table 3). Each of these ini-tiatives offers the chance to immediately promote growth, capture large abatement potential, and attract available climate finance for implementation. Moreover, they are important enablers for the country’s economic development, and their implementation is feasible and considered as a priority by the government.
The following subchapters outline each of these four initiatives – highlighting key findings from the detailed analyses and describing the tactical plan developed to
Federal Democratic Republic of Ethiopia 49
translate them into investment-ready projects that attract finance and get imple-
mented.
To ensure a comprehensive programme, initiatives from all other sectors will be developed into concrete proposals. These initiatives will be detailed over the coming months. The main criteria for selection as a priority initiative are the initiatives’ effect on reaching GTP targets, their abatement potential, and their ease of implementation.
TABLE 3
STCs have started to translate green economy opportunities into investment-ready projects in 4 sectors
Efficient livestock sector
▪ Livestock accounts for around 11% of the formal GDP and is also the largest source of GHG emissions in the country
▪ Sectoral growth can be achieved while reducing the projected emissions of the sector by up to 45 Mt CO2e per year in 2030
▪ Ethiopia could possibly monetise these reduced emissions to support GDP growth in Livestock
Rationale for importance of green economy initiative▪ Electric power generation is a critical component to realize growth and
economic development and a condition for green growth in other sectors– Fundamental to meet growing domestic demand – Offers significant export potential
▪ Securing the financing enables scale-up of clean/renewable power generation capacity
Power infrastructure financing
Rural energy-efficient stoves
▪ Fuelwood usage is the largest source of rural energy supply and one of the largest contributors to GHG emissions
▪ Efficient stoves can have massive benefits by increasing rural household income, health, women’s empowerment, and education while decreasing emissions by around 50 Mt CO2e in 2030
REDD▪ Forests account for 1/3 of total emissions today and offer huge abatement
potential through less deforestation and less forest degradation▪ In addition, already today Ethiopia has the second-largest afforestation
and reforestation programme in the world
Initiative 1 – Electric power financingElectric power generation has been identified as one of the most critical components to capture growth and economic development and a condition for building a green economy in other sectors. Making use of the vast renewable energy potential (particularly in hydropower), is not only fundamental to meeting growing domestic demand but also offers significant export potential. Securing appropriate financing has been identified as one of the major challenges to the scale-up in power generation capacity (Figure 16):
Federal Democratic Republic of Ethiopia 50

FIGURE 16
Electric power financing – preparing a roadmap for tapping external financing for power infrastructure development
Huge financing need over the coming years creates a significant gap
Total investment and finance,Billion USD, real
18
20
Financinggap
Availablefinance1
Total
38Hydro
Wind
Geothermal
Transmission
1 Assuming constant domestic tariffs; projections assume that financing from existing debt and equity sources remains roughly constant
30%
max24%1
46%
45%
max9%
46%
▪ Required, as cost reduction and increased tariffs not sufficient to close the financing gap
28%
up to24%1
48%
up to>52%
48%
▪ Not necessarily required, if cost reduction and increased tariffs fully implemented
External funding will be required, at least in intermediate years
Several opportunities to reduce the funding gap exist – tapping external funding sources will be required
Funding 2010-20 Funding 2021-30
Costoptimization
Tariffincrease for internalfinancing
1
2
External fundingsources
3
Available Decrease in gap Remaining gap
In order to build the power generation and transmission infrastructure necessary to fulfil the supply projections for the electric power sector, a financing need of USD 38 billion in capital expenditures over the coming 20 years has been forecasted. If the current sources of financing remain constant, however, there will be a financing gap of more than 50% (around USD 20 billion). To close the financing gap, the deep-dive analysis on power sector financing identified and analysed three options:
■ Cost optimization
■ Increasing internal funding capability through tariff adjustments
■ Tapping external funding sources.
While cost optimization and an increase in internal funding capability can partly close the financing gap, they will not be sufficient, making it vital to obtain fund-ing from external sources (e.g., from the private sector, sovereign wealth funds), particularly in the early years. To tap external funding sources, it will be necessary to offer a convincing proposal for project financing. A first version of this proposal
Federal Democratic Republic of Ethiopia 51

has already been drafted in the deep-dive work, leading into both the return and
the risk elements of electric power generation investments.
Initiative 2 – Rural energy and efficient stoves
Fuelwood usage – by far the largest source of rural energy and the second-largest contributor to GHG emissions – can be reduced with efficient stoves. With a sufficiently large scale-up, the use of efficient stoves will have a massive impact on the green economic development by increasing rural household income by 10%, creating an industry worth USD 15 million in gross value added (GVA), decreasing GHG emissions by 50 Mt CO2e8 in 2030, and increasing health and gender equality (Figure 17).
FIGURE 17
Rural energy – reducing emissions from fuelwood consumption through efficient stovesAs fuelwood is largest source of rural energy, efficient stoves can have massive benefits …TWh
1 Only rural areas
… that can be captured through a massive scale-up programme
65
74
296
Required household usage of fuels
Ruralelectrifi-cation(off-grid)
5
Rural electrifi-cation(grid)
25
Rural energydemand 2030
460
In order to capture the benefits of efficient stoves, several dissemination models are analyzed to define a scale-up programme containing ▪ Technology choice▪ Dissemination approach▪ Financing (incl. role of climate finance)
Technology
Fuelwood effi-cient stoves
30Up to 80 15.5 (80)
Alternative fuel stoves
6Up to 10 2 (10)
Total 36Up to 90 17.5 (90)
Households (people)Millions
Rural penetration Percent
Abatement potential1Mt CO2e
Cooking/baking
Other residential purposes
Commercial
The analysis conducted in the deep-dive work on rural energy has focused on both the impact of improved cooking/baking technologies on rural energy and on the choice of technology, current and improved dissemination approaches, and financing options.
8 Referring to abatement potential in both rural and urban areas, Figure 17 focuses on rural areas only.
Federal Democratic Republic of Ethiopia 52

For the required scale-up to 9 million stoves in 2015, the current dissemination value
chain is inefficient and will lead to a very high programme cost of USD 300 million – equalling 10-15 times current budgets for this purpose, for which there is currently no appropriate financing mechanism available.
Nevertheless, we can achieve the required scale-up by using best-practice approaches to reduce the scale-up cost to USD 170 million and by mobilizing international climate funds to obtain the necessary financing. The tactical plan, which foresees the start of the implementation of the programme for the beginning of 2012, has already been drafted. Its full execution is necessary to get the required support and ensure timely implementation.
Initiative 3 – RELS: Reduced emissions from livestockLivestock accounts for about 11% of the formal GDP, and is also the largest source of GHG emissions in the country. We have identified initiatives that help to achieve sectoral growth while reducing the projected emissions of the sector by up to 45 Mt CO2e per year in 2030. While doing so, we also aim at establishing a mechanism to monetise these reduced emissions from the Livestock sector (RELS) – which could be based on existing mechanisms like REDD and unlock funds for implementing the initiatives (Figure 18).
Therefore, the deep-dive analysis has focused on the prerequisites for establishing such a mechanism and the steps to follow in order to eventually monetise the reduced GHG emissions. Briefly, it will be necessary to:
■ Prove the feasibility of reducing GHG emissions from the Livestock sector through research and pilot projects
■ Set up the necessary institutional framework, including a system for meas-uring, reporting, and verifying (MRV) livestock-related GHG emissions
■ Identify and engage development partners and investors to finance the implementation.
A more detailed description of each of the tasks has been developed in the deep-dive work that will enable us to push forward on this topic and establish us as a thought leader on abating GHG emissions from livestock.
Federal Democratic Republic of Ethiopia 53

FIGURE 18
Livestock – preparing a REDD-like mechanism for reduced emissions from the livestock sector
STCs identified initiatives to increase the GDP of the livestock sector and reduce emissions at the same time
GHG emissions from livestockMt in CO2e, 2030
Ethiopia aims at establishing a REDD-like mechanism to monetise reduced emissions from livestock, which could unlock climate funds for implementation of initiatives
Green growth
80
Abatement initatives
45
BAU
125 Mechanization
Animal mix
Productivity
Monetisation of reduced emissions requires▪ To prove feasibility of efficiency
initiatives and effect on GHGemissions via research and pilot projects
▪ To set up the necessary institutional framework including a system for measurement, reporting and verification of livestock related GHGemissions
▪ To identify and engage development partners and investors to finance the implementation of the efficiency initiatives
Initiative 4 – Reducing Emissions from Deforestation and Forest DegradationDeforestation and forest degradation account for one third of total emissions today. However, the forestry sector also offers huge abatement potential through reduced deforestation and forest degradation. In addition, it holds large potential for sequestration – which is underlined by the fact that already today Ethiopia has one of the largest afforestation and reforestation programmes in the world.
REDD+ offers the opportunity to implement forestry abatement levers and monetise the respective abatement potential in a structured way. Hence, we have already prepared a Readiness Preparation Proposal (R-PP) that lays out its plan to prepare for REDD+ implementation. This R-PP has been accepted and we are now ready for its REDD+ preparation. The preparation phase will include the setup of an organisational structure, the definition of a REDD+ strategy, as well as the preparation for implementation of concrete mitigation actions within REDD+.
The development of the REDD+ strategy builds on the existing experience and structures developed locally, and will enable a broader learning experience for all
Federal Democratic Republic of Ethiopia 54

affected stakeholders. It will target to leverage the assessments of the main initia-
tives to mitigate deforestation and forest degradation, to identify implementing options, and to define the key enablers required at regulatory and institutional level.
The mitigation levers identified based on the work carried out by the CRGE initia-tive focus on addressing the main two drivers of deforestation and degradation (conversion to agricultural land and unsustainable fuelwood consumption), through a combination of proposed measures to increase agricultural yields, manage soils and forests better, and adopt alternative energy sources and energy-efficient cooking technologies (Table 4). Particularly for the latter initiative, REDD+ will strongly interact with initiative 2 (rural energy).
TABLE 4
REDD+ – Identified levers for GHG mitigation
▪ Reduce demand for fuelwood
▪ Increase sequestration
▪ Reduce pressure from agriculture on forests
▪ Decrease requirements for new agricultural land by increasing yield and value of crops
▪ Agriculture intensification on existing land
▪ Shift of new agricultural land from forest to degraded land brought into production due to irrigation and use of natural fertiliser
▪ Prepare new land for agriculture through medium-and large-scale irrigation
▪ Shift of new agricultural land from forest to degraded land brought into production due to irrigation and use of natural fertiliser
▪ Prepare new land for agriculture through small-scale irrigation
▪ Reduce wood requirements thanks to efficient stoves (mostly in rural areas)
▪ Fuelwood efficient stoves
▪ Switch to electric stoves (in urban areas mostly)
▪ Electric stoves
▪ Switch to LPG stoves▪ LPG stoves
▪ Switch to biogas stoves (in rural areas)▪ Biogas stoves
▪ Large-scale afforestation and reforestation of degraded areas
▪ Afforestation and reforestation
▪ Large-scale forest management programmes
▪ Forest management
Macro levers DescriptionLevers
Based on the previous work conducted in the field and the assessment of the miti-gation levers, a series of REDD+ pilots will be identified. This could range from Participatory Forest Management and Conservation approaches, which support strengthened local user rights and sustainable forest management, to various ini-tiatives designed to take pressure off the forest resources; including better man-
Federal Democratic Republic of Ethiopia 55

agement of previous plantations, and support for bamboo growth and use as well
as intensified agro-forestry. All pilots will be assessed at the end of the R-PP implementation according to various criteria, including effectiveness, efficiency, and social justice. The better-performing strategies will be selected for scale up. Other key activities of this work are the development of a REDD+ learning net-work and a REDD+ good-governance project that supports the development of good governance around REDD+ pilots.
Main changes in the regulatory environment to enable the proposed mitigation mechanisms to be implemented should, according to the consultations made in the preparation phase, focus on local people’s rights, develop a dedicated forestry institution, and better coordinate land-use planning.
Taken together, REDD+ and the associated activities are intended to help capture the mitigation potential from forestry that has been estimated to be up to 130 Mt CO2e in 2030. The REDD+ initiative will help not only to put an institutional structure in place that supports the implementation of abatement levers in forestry, but also to finance these levers, e.g., by monetising abatement potential and put-ting in place the necessary prerequisites such as a reference scenario and an MRV (monitoring, review, and verification) system.
WE WELCOME GLOBAL COLLABORATION TO TACKLE CLIMATE CHANGE
Our resources commitment to building its green economy has been described. To capture the full potential of our green economy plan, we welcome emerging climate finance programmes designed to compensate developing countries for the provision of environmental services to the world. Gaining support from international partners is essential to prepare and implement our green economy. Addressing the technology, expertise, and financial needs is a fundamental element of such support. Bi- and multilateral development partners as well as the private sector can help us achieve our ambitious goals and inspire other green economy efforts around the world at the same time.
WE ARE PLANNING AHEAD TO IMPLEMENT THE GREEN ECONOMY STRATEGY
The CRGE initiative has developed an action plan for the coming years that details the next steps to be taken in order to put the green economy strategy into motion:
Federal Democratic Republic of Ethiopia 56

■ Institution and capacity building. As outlined under the heading ‘Emerging
institutional setup’, the government has started to develop a permanent institutional setup in order to establish a lasting platform for CRGE. The focus over the coming months will be on finalising an organisational structure, identifying the additional required personnel, and building up institutional capacity.
■ Getting started on early action. Fast-tracked implementation of the priori-tised initiatives will help us to rapidly capture some of the biggest green economy opportunities and demonstrate its example of the alternative green economy growth path. These initiatives will also provide lessons that we can quickly apply to design and roll out further green economy initiatives in all other sectors.
■ Completing sectoral green economy programmes. When the formulation of the CRGE strategy has been completed and estimates verified as far as possible, green economy programmes for all relevant sectors will be developed to ensure that the programme is comprehensive. This work will include piloting and policy design in accordance with the initiatives and goals of the strategy, at both federal and regional levels.
■ MRV and benefit sharing: We will develop the enablers required to monetise carbon credits. This includes primarily the setup of appropriate measuring, reporting, and verification (MRV) systems, which are needed to provide proof of GHG abatement. It also includes a definition of benefit sharing, i.e., specification of the stakeholders who will benefit from the proceedings of the sale of carbon credits.
■ Funding: To implement green economy initiatives, the government will commit the country’s own funds, but it will be also necessary to gain support of international private and public partners. The CRGE initiative will therefore systematically engage in discussions with targeted development partners. This also requires establishing the appropriate funding mechanisms for receiving and distributing funds.
♦ ♦ ♦
Our vision of a Climate-Resilient Green Economy does represent a major shift away from conventional development approaches and will require significant international support. We are eager to take up this challenge and have created the CRGE initiative in order to identify sustainable and climate-resilient paths to
Federal Democratic Republic of Ethiopia 57

economic growth. It builds on our strengths and has the potential to deliver high
returns to its people, its economy, and its environment. In the short term, immediate action on financing hydropower production, implementing efficient stoves, reducing emissions from livestock, and REDD+ can noticeably improve the quality of life and create the momentum and funding streams necessary to see the other CRGE initiatives through to successful completion. By aspiring to – and achieving – a constructive contribution to the green economy, we are also laying the longer-term foundation for reaching middle-income status by or before 2025.
Federal Democratic Republic of Ethiopia 58

Appendices


Approach and methodology
OVERALL APPROACH
The development of a green economy strategy starts from an assessment of a country’s economic and growth targets. In our case, these are explicitly written down up to 2015 in the Growth and Transformation Plan (GTP). Beyond 2015, the plans are much less detailed, but the ambition of reaching middle-income status before 2025 is clearly stated by the government and guides the forecast of growth rates beyond 2015.
The attractiveness of developing a green economy plan lies in the substantial con-tributions it can make to economic advancement by offering a new organising principle for identifying opportunities, by laying the foundations of a new and sustainable model of development, and by mobilising international capital to fund the necessary investments and projects.
Because the immediate monetisation of building a green economy depends on verified emissions reductions, the Ministerial Steering Committee and the Techni-cal Committee (described in the chapter ‘Making it happen’) have focused the analytic work of developing a green economy strategy on initiatives that contribute to reducing emissions. Other parts of the climate-resilient green economy strategy, specifically ‘climate resilience’ initiatives, will be incorporated subsequently.
The Sub-Technical Committees (STCs) – inter-ministerial working groups focusing on specific sectors such as power, agriculture, and forestry, amongst others – have been tasked with the core analytic work. The STCs followed a four-step process to determine the preliminary green economy strategy (Figure 19).
1. On the basis of the GTP targets and long-term economic objectives, the STCs developed a BAU projection of economic growth and associated emissions for their respective sectors. This projection extends to 2030 to allow enough time to include long-term infrastructural investments and achieve the middle-income status the country aspires to.
2. The second step was to identify and analyse the potential of green economy initiatives or levers. It was understood from the outset that potential initiatives have to contribute to growth and development targets as well as to the reduc-tion of GHG emissions as compared with BAU development. Abatement
Federal Democratic Republic of Ethiopia 61

potential was chosen as a main criterion for selecting the green growth initia-
tives as it is a prerequisite for tapping funds available in the context of the international negotiations on climate change.
3. The third step was to evaluate the initiatives in terms of abatement cost (expressed in USD/t CO2e), investment and finance requirements, feasibility, and other implementation requirements. The initiatives were then prioritised accordingly.
4. The last step was to document and summarise the findings as well as to daft the preliminary green economy strategy, which ultimately resulted in this report.
FIGURE 19
2030 Green growth
#4#3#2#1
Process used to develop preliminary green economy strategy
2030 BAU
2010
Forestry
Crops
PowerOther
Livest.
GE strategy
Estimate current emission level and BAU 2030
Evaluate cost, feasibility, etc.
Develop preliminary GE strategy
▪ Lower-emitting techniques
▪ Higher animal productivity
▪ Change in animal mix
▪ Agriculture intensification
▪ Introduction of efficient stoves
▪ Power exports
March JuneApril May
Analyse the potential of green economy initiatives
GE initiatives Evaluation
1 2 3 4
METHODOLOGY OF THE ANALYSIS
The analytic backbone of the project was a sectoral analysis of GHG emissions, of initiatives (potential impact and cost), and implementation requirements, including financing. The CRGE initiative identified seven sectors with high relevance for the sustainability of Ethiopia’s growth model. One STC working group was set up for each of these sectors.
Federal Democratic Republic of Ethiopia 62

Identification of relevant sectors
The CRGE initiative selected seven sectors for detailed investigation based on the GTP and findings of previous studies on the sustainability of Ethiopia’s develop-ment path – in particular the ‘Green Growth’ study conducted by EDRI and the Global Green Growth Institute (GGGI). The two criteria for the selection of these sectors were (a) the importance of the sector for the economy and (b) the sector’s current/expected future GHG emissions. The following sectors were selected:
Agriculture-related sectors
■ Forestry. Avoiding deforestation is an important development objective, as it will preserve the natural ecosystem endowment and also contribute to a sustainable development of agriculture. Potential measures in this category include the improvement in efficiency and productivity of existing cultivated land and land to be cultivated to reduce the pressure on forests, as well as the substitution of traditional cooking techniques with efficient appliances, thus reducing fuelwood consumption and increasing carbon sequestration by forests.
■ Soil. Ethiopia has over thirty million hectares of cultivable land and over eleven million hectares of cultivated land. Historical practices, rapid expansion, and inappropriate agricultural techniques have resulted in poor soil quality. Soil management is therefore a fundamental component of the country’s agricultural strategy and, because of the carbon content of land, can also be an important initiative to control and manage carbon emissions as the country grows. Additionally, careful soil management can stem the growth of cropland needed and avoid further deforestation.
■ Livestock. At over 140 million head today, livestock are a critical part of the economy, both commercial and subsistence: livestock are an important source of livelihood for over ten million pastoralists and millions of farmers. Livestock are also the principal source of GHG emissions in the country and a significant contributor to emissions globally. Because livestock management is also a high priority for the GTP, the adoption of green economy initiatives in this area is highly compatible with the country’s agricultural strategy and its broader development strategy. Measures here include improving the productivity of the herds, reducing headcount, and establishing mechanisms to monetise the abatement potential in livestock with the help of development partners.
Other sectors
■ Electric power. Ethiopia has ample potential in renewable energy generation, most prominently in hydroelectric power, as well as other renewables such as
Federal Democratic Republic of Ethiopia 63

wind and geothermal power generation. It also has significant export potential
into the Eastern African Power Pool and further regional markets. These initiatives are obviously important from a green economy perspective because they can significantly de-carbonise the regional energy profile as well as contribute to Ethiopia’s capital stock formation, a critical enabler of industrial and urban growth and a key priority for the growth and transformation programme through rural electrification.
■ Buildings/Green Cities. This category includes all the initiatives that contrib-ute to the creation of new more sustainable urban environments. They range from the adoption of efficient lighting in urban settings and efficient appliances in the domestic sector to improved waste management of the growing cities. There are significant energy and carbon emissions savings available in the built environment as well as important development targets, including the health of the urban population. An additional point of relevance is that Addis Ababa is not just the capital of Ethiopia but the political capital of Africa, the seat of the African Union, and a recognised cultural and economic centre in Eastern Africa. Urban development that successfully leapfrogs traditional forms of development of metropolitan cities and their associated problems could be an important element of sustainability.
■ Transport. The improvement of Ethiopia’s transport networks is an important part of the country’s growth plans. As a vast and landlocked country with a large share of the economy dependent on perishable agricultural products, and given the critical role exports will play in the growth and development of the economy, Ethiopia needs efficient and reliable transportation networks. Multiple initiatives are considered in this category, including the expansion of the electric rail freight capacity, the adoption of fuel efficiency standards, and the adoption of cleaner fuel mixes such as the use of biodiesel and ethanol.
■ Industry. The economy is on an agriculturally led development path. However, the development of an industrial sector, both to serve domestic demand and to support exports, is a stated priority of the GTP. Green economy initiatives in this sector represent an opportunity to create an industrial base that is more sustainable than the ones that have evolved from the industrial revolution in Europe and the US. In order to take this opportunity, the Industry STC considered a number of initiatives ranging from changes to products and tech-nologies in key sectors such as cement, to the adoption of energy efficiency, alternative fuels, and alternative production processes in manufacturing and other industrial sub-sectors.
Federal Democratic Republic of Ethiopia 64

For each of these sectors, the respective STCs worked on establishing an accurate
‘business-as-usual’ baseline, identifying a set of green growth initiatives, and car-rying out their evaluation and prioritisation.
Forecasting economic development and related emissions in the ‘business-as-usual’ scenarioThe forecasting of the ‘business-as-usual’ (BAU) scenario is based on two steps. The first step is to forecast the country’s economic development; the second step is to compute the associated emissions. This section explains both steps and gives an overview of the methodology that was used for the forecast.
Using the GTP targets, past performance, and the ambition to reach middle-income status before 2025, the CRGE initiative developed a realistic forecast for economic development over the next 20 years. The development of this forecast involved the following steps:
■ Analysing GTP forecasts and PASDEP performance regarding contributions of different sectors to GDP and employment; compiling information on population growth, urbanisation, and other potential drivers of emissions such as cattle population and deforestation.
■ Prioritising on those sectors with largest contribution to both GDP and current emissions for the CRGE strategy.
■ Combining different data sources to identify and compile a base case for development of economic drivers (of growth and GHG emissions) and other relevant variables; matching projections with the growth ambitions outlined by the government (i.e., reaching middle-income status before 2025).
■ Reviewing the BAU scenario with the Ministry of Finance and Economic Development as well as comparing it with development path of other countries for robustness of estimation.
In a second step, the projected economic growth was translated into the business-as-usual development of GHG emissions. The BAU estimation of GHG emis-sions forms the baseline for the development of a green economy strategy. The estimation answers the questions: how would domestic GHG emissions develop if no actions were taken to limit emissions? The BAU is thus not the most likely or even desired scenario, but a theoretical case assuming a country would act as if there was no need to develop a sustainable growth agenda, either because of the absence of economic interest or funding. The main assumption in developing a
Federal Democratic Republic of Ethiopia 65

BAU baseline is that a country (or its government) is acting in its economic self-
interest. Actions to reduce or prevent emissions are therefore only included in the BAU baseline if they already are under development or if they represent the eco-nomically most viable and feasible future options without the need to secure extra funding. Therefore, the BAU assumes that electricity generation will continue to be largely based on hydropower and other renewable energy sources.
CRGE follows a sectoral approach: each STC first developed a sectoral BAU, which was then combined with the BAUs of other sectors into a national BAU.
Selection of green economy initiativesHaving developed a baseline for both economic development and a BAU emissions trajectory, the next step was to identify appropriate initiatives to divert from the conventional development path to a low GHG-emitting growth model that combines both economic growth and the reduction of GHG emissions. This involved the selection of appropriate green economy initiatives out of a long list of initiatives that have proved successful elsewhere as well as options newly developed and adapted to the Ethiopian situation – around 150 potential initiatives in total. The long list of initiatives that was generated has meanwhile been rigor-ously assessed to select and prioritise those that can be used to form our comprehensive green economy programme.
For an initiative to be retained as a ‘prioritised initiative’ within the green econ-omy plan, the following criteria had to be met:
■ Pass an initial assessment of relevance and feasibility to be implemented in the local context
■ Provide a positive contribution to reaching the targets of the GTP
■ Provide significant abatement potential at a reasonable cost for the respective sectors.
More than 60 initiatives, split across the seven different sectors, have been classi-fied as priority levers based on the analyses made in the CRGE effort. For each sector, at least three initiatives have been chosen (Figure 20). The sectoral STCs conducted the selection of appropriate initiatives independently, but discussed them across sectors to ensure alignment and avoid duplication of effort.
Federal Democratic Republic of Ethiopia 66

FIGURE 20
Long list of potential green growth initiatives –150+ initiatives
Abatement/ avoidance potential –GHG emissions compared with BAU if initiative isimplemented
Effects on GTP – potential to contribute to reaching targets as outlined in GTP
Cost effec-tivenesschecked –costs to reduce or avoid one t of CO2e
Feasibility in local context –technical and institutional implementability
Prioritised measures for inclusion in CRGE plan –>60 initiatives
150 potential green growth initiatives were screened, >60 have been shortlisted for inclusion in the CRGE strategy
Criteria for initiative assessmentThe assessment of green growth initiatives needs to reflect the breadth of concerns that guides the development of the green economy plan. Hence, the criteria to con-sider must take into account of both the medium-term objectives of the Growth and Transformation Plan and the long-term objectives of reaching middle-income status before 2025. Therefore, the individual initiatives were evaluated against the following criteria:
■ Abatement potential. Given that the scope of this project is focused on the green economy, abatement potential is a critical characteristic and provides an opportunity for monetisation of a country’s contribution to curtailing GHG emissions. It is therefore a critical component of the evaluation of the initiatives.
■ Cost and funding requirements. Financial sustainability and cost are para-mount for our financial situation. The cost and, in particular, the funding requirements of individual initiatives are an important element for evaluation.
■ Suitability to GTP. The Growth and Transformation Plan describes detailed targets for multiple sectors and sub-sectors. In some cases, the targets are specific and numeric and refer to outcomes. In other cases, they refer to inputs such as
Federal Democratic Republic of Ethiopia 67

investments. Individual targets number in the hundreds. The STCs developed a
set of main criteria to evaluate the initiatives. These criteria are:
– Impact on poverty reduction – Ethiopia still remains one of the Least Developed Countries, with a GDP per capita of less than 300 dollars per year. Furthermore, over 80% of the population is employed in agriculture, and the issue is a lack of alternatives. Having an impact on poverty reduction is thus a critical strategic objective of the initiatives for the country.
– Food security – According to the GTP, over 7 million people are still food insecure. The drought of 2003 showed once again how vulnerable the population is in an agricultural system that is primarily rainfed in an area that is drought prone. Hence, food security is a critical objective for the government.
– Increase in real GDP – GDP growth is a necessary objective for the development of the country. In the coming years, large amounts of produc-tive investments are expected in business infrastructure. Labour productivity is expected to grow, and the population is also growing – by 2030 another 50 million people are expected to be added to the population. In this context, inflation has been a recurring challenge despite the proactive management by the government. Achieving the ambitious targets of growth in real GDP is hence a key objective.
– Increase in domestic capital formation – We still have most of the invest-ments in basic infrastructure ahead of us. In the coming 20 years, tens of billions of USD are expected to be spent on capital formation, to enable the increase of labour and land productivity. This serves as a necessary pre-requisite for sustained economic growth.
– Increase in exports – Export-led growth is the rapid-growth paradigm of the twentieth century and one that we – with a currently small domestic market – expect to follow. Because the trade balance today is still negative and enters negatively into the balance of payments, increased exports, par-ticularly of agricultural and related products, is a key priority.
– Benefit to public finance – With low levels of savings and limited domestic income, the government’s fiscal position is not strong. Foreign reserves are limited. At the same time, the investment requirements are very high and are partly to be financed by public money. It is therefore critical that initiatives not only benefit the wider economy of the country, but also support the
Federal Democratic Republic of Ethiopia 68

operations and investments of the state (at federal as well as regional and
local levels).
– Increase in employment – With an increasing young population, productive employment is a crucial objective for the government, particularly because generating additional employment outside of the agricultural sector is critical to enable the targeted increase in mechanisation. Moreover, new employment opportunities need to be created for the rapidly growing population.
■ Feasibility. In a country with limited implementation capacity, criteria of feasibility are crucial. That is not to say that feasibility is necessarily a reason for exclusion, but it is an important factor in assessing initiatives as it influences the sequencing, timing, and resourcing of the implementation. Feasibility has been evaluated with regard to technical as well as institutional barriers and additional hindrances to implementation.
Methodology for initiative assessmentEach initiative was assessed against the above criteria. The STCs have drawn on their own expertise and that of their departments as well as external experts to work through all of the initiatives. In doing so, they have employed the following methodologies:
Emissions abatement
The abatement potential was calculated using a comparison with the BAU projec-tion. The STCs reviewed individual sectoral projections and created BAU emis-sions projections which served as the basis for all abatement potential calculations.
The level of detail of the business-as-usual projection constrains the level of detail at which the initiatives can be calculated. For this reason, the STCs went to the highest possible level of detail for those sources of emissions that represent the majority of the carbon footprint of the country. In the case of methane emissions from cattle, for example, the STCs had to estimate the current cattle population, including the split between indigenous cattle and cross-breed cattle. These were then projected out to 2030 based on assumptions and data on growth rates and, where possible, associated with GTP targets. The resulting projection was then converted into a CO2 equivalent emission (in this case using the conversion factor for methane) based on international methodology (e.g., IPCC) and based on domestic expertise and knowledge.
Federal Democratic Republic of Ethiopia 69
Abatement initiatives were then quantified assuming an emissions reduction per
unit and the scaling up over time. These assumptions allowed the STCs to calcu-late an abatement potential from each of the initiatives for each of the years under consideration (Figure 21). They were calculated using the best available data, government estimates, and international benchmarks.
FIGURE 21
Time
GHG emissions after implementa-tion of abatement options
Explanation
CONCEPTUAL
2010 2020 2030
▪ “BAU” reference scenario as a basis for assessment of mitigation levers and carbon finance negotiations
▪ BAU is not the most likely scenario, but a theoretical case assuming a country acts in its economic self-interest only
▪ Does not include additional action for avoiding GHGemissions (e.g., renewablesare only added if cost competitive with fossil fuels)
BAU GHG emissions baseline serves as the basis for building the green economy growth scenario and seeking carbon finance
Business-as-usual reference scenario
Business-as-usual reference scenario
GHG emissionsMt CO2e per year
Abatement cost
The abatement cost of each initiative is defined as the incremental cost (positive if more expensive, negative if more cost economical) of a low-emission path com-pared with the required cost or benefits of the conventional alternative underlying the BAU scenario. Costs are measured in USD/t CO2e of abated emissions in a given year in the future (here always referring to year 2030). That is, the abate-ment costs for a given year are divided by the abatement potential in that year to arrive at the actual abatement cost. The abatement cost includes both the incre-mental capital expenditure (investment) required for the implementation of the abatement initiatives compared with the BAU scenario, the incremental operating cost required for the abatement lever, and potential benefits (e.g., lower costs due
Federal Democratic Republic of Ethiopia 70

to increased fuel efficiency or higher revenues) compared with the BAU scenario.
The capital expenditure is taken into account in the form of an annualised invest-ment cost. The annualised cost was calculated with an economic amortisation period (usually between 20 and 50 years, depending on the type of investment) and a capital cost of 6% (real). The operational expenditure is taken into account in the respective year of occurrence. For initiatives that create a carbon stock effect but also running operating expenditure (e.g., avoided deforestation), the perpetuity of operating expenditure is taken into account alongside the capital expenditure of the respective year in which the effect is created.
Costs and benefits are estimated from a societal perspective, i.e., irrespective of who bears costs or benefits. The costs do not include any subsidies, taxes, or external costs that are caused indirectly and that largely depend on the exact form of implementation, such as communication cost or transaction cost.
Abatement costs can be displayed in an abatement cost curve. This cost curve describes green economy initiatives based on two characteristics: the annual potential of abating GHG emissions in a given year and the costs per tonne abated in a given year (Figure 22). The underlying assumption is full implementation of the initiative (i.e., the cost curve displays full technical potential); the reference year is 2030. Taken together, the abatement cost curve visualises two important pieces of information concerning each initiative:
■ What is the cost of abatement? The answer is reflected in column height, sorted by the most cost efficient, from the left.
■ What is the potential volume of GHG abatement? The answer is displayed as column width – the wider the column, the more potential the initiative offers.
The columns that extend upwards represent measures with a cost higher than USD 0 per tonne of reduced emissions, while the columns that extend downwards represent measures that have a negative cost per tonne of reduced emissions: they save money and reduce emissions. Therefore, initiatives with a negative abatement cost are economically advantageous in any case.
Federal Democratic Republic of Ethiopia 71

FIGURE 22
Abatement Cost Curve: General overview of methodology
4
2
1
Abatement costUSD per t CO2e of reduced emissions in 2030
Each option for reducing emissions is represented by a bar on the cost curve.
The width of each bar shows the abatement potential – the tonnes of annual emissions that would be reduced in 2030 if we implemented this option fully.
The sum of the width of all bars shows the sum of the abatement potential of all initiatives – in reality the aggregated abatement potential will be lower than the sum of each initiatives as it might not be feasible to implement some initiatives at the same time
The height of each bar shows the abatement cost – the cost of implementing this option fully in terms of dollars per ton of reduced annual emissions.
The bars on the right represent costly options, while the bars that face downward represent options that actually have negative cost: they save money as well as emissions.
The Abatement Cost Curve allows us to view and compare all the available options for reducing emissions along two key dimensions at once: How much can each option contribute to emissions abatement, and at what cost does it do so?
2
1
4
Abatement potentialReduced emissions in 2030, Mt CO2e
3
3
Suitability to the GTP
The assessment of the suitability of the initiatives to the Growth and Transforma-tion Plan (GTP) is a more delicate matter, as few models exist for macroeconomic impacts and some of the criteria are difficult to quantify analytically.
The STCs decided to conduct a qualitative multiple criteria assessment to assess suitability to the GTP. Each element of the suitability to GTP was rated according to whether the initiative increases the chances of achieving the GTP objectives, decreases them, or is neutral. Given this simplification, it is natural to expect some contradictions. This also included relevant considerations of cross-benefits with other initiatives (see example in Table 5).
Federal Democratic Republic of Ethiopia 72

TABLE 5
1 Not explicitly in Economic Growth targets of GTP
Assessment of economic impact – Clinker substitution by pumice as an example
▪ No direct impact on decreasing poverty▪ But: making cement more affordable to population
=
▪ Making cement more affordable for small-/medium-scale irrigation (scale-up of irrigation)
Increase food securityII = / +
▪ Availability of cement at lower price will encourage construction industry
Increase real GDPIII = / +
▪ Indirect via stimulating capital formation in the form of construction
Increase domestic capital formation
IV = / +
▪ No impact as long as domestic demand unfulfilled▪ Thereafter, increasing price-competitiveness
Increase exportsV = / +
▪ No direct impactIncrease public finance (revenue as % of GDP)
VI =
▪ Availability of cement at lower price will encourage construction industry
Increase employment1VII = / +
I Decrease poverty (percentage of citizens living below poverty line)
GTP targets RationaleImpact
Positive None Negative
Feasibility
The assessment of feasibility was done as a rapid assessment to point out the potential implementation barriers and to understand whether there were critical issues that needed to be addressed or that could disrupt implementation. The assessment was primarily conducted around technical barriers – for example, the availability, applicability, or accessibility of the technology required – and institu-tional/organisational barriers – for example, the existence of pilot programmes, the support by stakeholders and others.
Each feasibility category was evaluated through discussion, expert interviews, and feedback from existing pilots. A detailed evaluation was reported along the dimen-sions of the framework and a partly quantitative ranking was provided.
Funding requirements
The assessment of expenditure (and benefits) for the green economy initiatives is largely based on the aggregation of the data used for the calculation of abatement cost. The expenditure (and benefits) can be systematically split into its components and aggregated on a yearly or periodical (e.g., 2011-2030) basis:
Federal Democratic Republic of Ethiopia 73
■ Additional CAPEX (capital expenditure) required to implement the respective
green economy initiative
■ OPEX (operating expenditure) required to implement the respective green economy initiative
■ Programme cost to implement the respective green economy initiative
■ Benefits (savings or income) incurred from green economy initiative (regarding the societal effect, not necessary implementer‘s savings)
Taken together, these components form the total net expenditure (incl. benefits) for the respective green economy initiative (N.B.: not including carbon revenues).
In order to analyse the required type of financing for the respective initiatives, they are grouped into three distinct categories based on net present value (NPV). The NPV of an initiative shows the current value of the return of that initiative over a number of years taking into account the time value of money. A positive NPV means that the benefits outweigh the costs for a specified number of years, while a negative NPV means that the costs outweigh the benefits for a specified number of years:
■ Category A: Initiatives that have positive return and only require short term financing. These are defined as yielding a positive NPV in the first five years of cash-flow (from start of implementation of the initiative).
■ Category B: Initiatives that have a positive return, but require long term financing. These are defined as yielding a positive NPV of the overall initiative (from start of implementation of the initiative) up to 2030, but not during the first five years.
■ Category C: Initiatives that do not yield a positive (financial) return, hence they require grants or performance payments. These are defined as yielding a negative NPV of overall initiative (from start of implementation of the initiative up to 2030).
The NPV is calculated with 6% discount rate and takes into account all expendi-tures and benefits (from a societal perspective as defined above). It should be noted that the implementing agency might face higher net expenditure when benefits (i.e., savings or income) are captured by different parties.
Sources of data
As many institutions are building up their capacity, collection of high-quality data is sometimes a challenge in Ethiopia. For many of the sectors included in the pre-
Federal Democratic Republic of Ethiopia 74

liminary CRGE strategy, data were not readily available or were of poor quality.
As a result, the STCs had to take a pragmatic approach to compiling the fact base required to support the process, combining domestically available data with inter-national benchmarks, experiences from other countries, expert interviews, and making own assumptions. In general, the data were taken from official sources such as the CSA, the GTP, or MoFED as well as the statistical departments at the respective ministries and research institutes. International methodology on GHG emissions (e.g., IPCC) was used wherever possible and appropriate. A detailed description of the data sources can be found in the sectoral chapters in the follow-ing appendices.
IMPLEMENTING THE GREEN ECONOMY STRATEGY
The green economy strategy provides the base for the development of a concrete action plan. Since implementation is very likely to be constrained by existing financial, institutional, and technical capacities, the initiatives need to be sequenced. This section explains the criteria for sequencing. Moreover, it outlines the process that needs to be followed in the overall effort on the green economy to make sure that the strategy and its individual initiatives are implemented.
Sequencing and fast-tracked initiativesAlthough we are planning to implement all prioritised initiatives, given capacity and financial constraints, it is imperative to sequence them. The government has therefore selected some initiatives for fast-tracked implementation as they offer the chance to accomplish several important goals:
■ Immediately promote growth
■ Capture large abatement potential
■ Attract available climate finance for implementation.
Moreover, they are important enablers for the country’s economic development, and their implementation is feasible and considered as a priority by the govern-ment.
The government has selected the following initiatives (detailed description and analyses are available in the main body of the document and in the respective appendices):
■ Developing a financing strategy for the electric power sector
Federal Democratic Republic of Ethiopia 75

■ Promoting advanced cooking technologies on a large scale
■ Increasing efficiency of livestock handling, including upgrading of the meat value chain and mechanisation of draught power
■ Reducing Emissions from Deforestation and forest Degradation
Responsibilities have already been assigned for the fast-tracked initiatives and detailed planning for implementation is underway.
Process for Implementation of the strategyThe green economy strategy covers the projection of a business-as-usual scenario, the calculation of abatement potential and abatement cost, and evaluation of feasibility and economic impact for each sector and initiative respectively. These steps were completed successfully by the STCs between March and June 2011. Afterwards, the results were subjected to consultation with regional and sectoral institutional stakeholders to ensure the accuracy of the numbers and to gain national support for the strategy from relevant stakeholders. Sectoral consultation focused on the presentation, discussion, and improvement of the sectoral work on green economy initiatives in collaboration with sectoral experts. Regional consultation involved regional governments, standing committees of parliament, and workshops with selected leading regional researchers. This process was completed in August 2011. Following consultation, the STCs – under the guidance of the Ministerial Steering Committee and the Technical Committee – implemented the input to upgrade and complement their original assumptions and calculations.
In order to ensure the successful implementation of the strategy, the following steps are scheduled to be taken over the coming months:
■ Inclusion in sectoral development plans – In order to integrate the green economy initiatives into the development policies of the government, the respective ministries will include them in their sectoral development plans.
■ Identification and selection of priority initiatives – The STCs will select some of their initiatives for immediate implementation in addition to those already chosen. These will serve as fast-track initiatives to gain and demonstrate immediate impact. The main criteria for selection as a priority initiative for implementation are the initiatives’ effect on reaching GTP targets, their abatement potential, and their ease of implementation.
Federal Democratic Republic of Ethiopia 76

■ Preparation of implementation, resource, and investment plans –
To ensure a comprehensive programme, fast-track initiatives and additional ini-tiatives from all other sectors will be developed into concrete proposals. These proposals will contain implementation plans, resource requirements (including financial, human and technical resources), investment plans, and the assignment of responsibilities. A suggestion of potential development partners and investors should complement the proposals.
By completing these tasks, we aim to lay the best foundation possible for the successful implementation of the CRGE strategy.
Federal Democratic Republic of Ethiopia 77

Electric PowerIn the business-as-usual (BAU) scenario, Ethiopia will use hydropower and renewable sources of energy to create a near-zero GHG emission electric power supply by 2030. While all on-grid power generation capacity is planned to be from renewable sources (i.e., zero emissions), there are still some off-grid power generation facilities that create GHG emissions. Most of the emissions from off-grid electric power generation are taken into account in other sectors9 with the exception of rural residential fossil-fuel-based generation, which is accounted for in the Electric Power sector and causes the emissions to be slightly above zero. Taken together, the Electric Power sector represents an exception in the usual pattern of emissions development, as the BAU scenario already presents the characteristics of a green growth plan.
On the other hand, the planned scaling up of domestic power production capacity, combined with a successful implementation of energy efficiency measures, offers opportunities for electric power exports. These exports could reduce neighbouring countries’ emissions with clean electric power generated in Ethiopia and represent the single most important abatement lever compared with BAU for the Electric Power sector. The projected domestic supply-and-demand balance indicates an average export potential of around 25 TWh p.a. between 2011 and 2030, which would result in an annual abatement potential of 17 Mt CO2e on average and nearly 20 Mt CO2e in 2030.
To materialise the supply potential projected, the most significant barrier to be overcome is potentially the financing of the incremental electric power generation, alongside the need to gain neighbouring countries’ support for importing power from Ethiopia at the right price.
SCOPE AND INSTITUTIONAL SETUP
The expected electric power demand and supply in Ethiopia as well as of the sector’s potential GHG emissions were reviewed and calculated by the Electric Power STC (Table 6). The STC is composed of experts from the Ministry of
9 The emissions from commercial power generation are accounted for in the Industry and Agriculture sectors. With regard to residential energy consumption, the Green Cities sector takes into account GHG emissions from urban power generation by fossil fuels and the Forestry sector accounts for all emissions from power generation from woody biomass (urban and rural).
Federal Democratic Republic of Ethiopia 78

Water and Energy, EEPCo, the Ethiopian Energy Agency, the Ministry of Mines,
and the Central Statistics Agency.
The scope of this chapter is particularly focused on electric power generation and consumption.10
In the business-as-usual (BAU) scenario, Ethiopia will use its available natural resources (mainly hydropower and, to a lesser extent, wind and geothermal) to cre-ate an electric power supply infrastructure with zero GHG emissions by 2030. The Electric Power sector thus represents an exception from the usual pattern of emissions development, as its BAU scenario is already on a green growth path.
TABLE 6
10 Emissions from water supply and irrigation have also been checked. According to the research by the STC, water works and distribution in most areas (particularly urban) are either electricity powered or electricity will be used for all water works by 2020 (when 100% area coverage by the grid is planned). As grid electricity approaches zero emissions by 2015, water supply will not constitute a significant source of emissions for the year 2030. As for irrigation schemes, medium- and large-scale schemes use mostly gravity and hydropower (multipurpose) and hence do not represent a major emission source. Small-scale irrigation consumes partly electricity, partly fossil fuels (mostly diesel), and these emissions are accounted for in the Agriculture sector.
Federal Democratic Republic of Ethiopia 79

GHG EMISSIONS BASELINE IN 2010 AND BAU UP TO 2030
Drivers of GHG emissions and evolution of the Electric Power sectorThe GHG emissions from the Electric Power sector are determined by the growing demand and supply of electricity as well as by the source of power generation.
As shown in Figure 23, total electric power demand is projected to grow from 4 TWh in 2010 to a maximum of nearly 77 TWh in 2030. This forecast is based on projections for energy demand by the different sectors contributing to the economic growth (based on GTP data until 2015 and projection to reach middle-income status by 2022), intensity of energy use and projections of increase in energy efficiency for each of these sectors contributing to the demand.
FIGURE 23
Electric power generation is essential to meet demand and create export potential
Demand
Supply Hydro
Supply Wind & GeothermalSupply Diesel
Maximumexport potential
73
2056
4 1
Add. ge-nerationcapacity1
2010 supply
067
67
101
Totalsupply2030
831
74
100
Export potential
28
28
Total demand 2030
Energy efficiency
BAU demand growth
2010 demand
1 Current EEPCo masterplan plus additional capacity estimation (based on economic potential and building capacity) by Power STC; not including up to 450 MW cogeneration capacity from coal plants (fertilizer production)
TWh (2030)
▪ Due to strong economic growth (esp. industry), power demand will grow almost 20 times by 2030
▪ Increased energy efficiency can help to decrease domestic demand in 2030 by almost 30%
▪ Ethiopia has potential to produce >80 TWh from renewable energy in 2030
▪ Power can become an export-oriented sector and therefore a source of foreign exchange
Power demand and supply in 2030
According to this reference scenario, the steep increase in demand, reaching 77 TWh by 2030, reflects both the growing electrification – the target for 2020 is to expand access to grid connection to nearly 100% of the country (measured by area, not by households) – and rapid growth of electricity-intensive industries –
Federal Democratic Republic of Ethiopia 80

projected at a rate of more than 16% a year, outpacing by far the overall GDP
growth rate and the growth of other sectors.
Even if we can capture the entire energy efficiency potential that has been identi-fied, the increase in demand will be reduced to 56 TWh by 2030. This would still represent a more than a tenfold increase over today’s demand.
EEPCo’s master plan and an extrapolation based on the total energy generation potential and capability to build generation capacity have been used to project the development of the supply capacity. All major existing power infrastructure projects have been taken into account. According to these forecasts – also depicted in Figure 23 – the supply capacity will increase from 7 TWh in 2010 to more than 80 TWh in 2030. According to EEPCo’s master plan, the current diesel power plants and off-grid diesel generators will be switched off between 2012 and 2014. From 2015 onwards, EEPCo plans to generate power exclusively from clean or renewable sources11 (on average around 90% from hydro, 6% geothermal and 4% wind) – while retaining some diesel generators as standby solutions. However, since the plan is to establish a more reliable and stable power supply throughout the country, the use of such standby facilities is expected to decrease dramatically to reach virtually 0% by 2030.
While these are the grid-related power demand and supply projections, the Electric Power sector also accounts for off-grid rural residential fossil-fuel-based generation.12 Figure 24 depicts this generation as well as the on-grid power generation from non-renewable sources under conventional power generation, which is the major GHG emission driver for the Electric Power sector as defined in this strategy and projected to grow from 8.5 to 9.8 TWh in 2030. In addition, it also shows the renewable power generation, which is forecasted to increase to 98 TWh in 2030.
While EEPCo’s conventional power generation is less than 1 TWh in 2010, it is planned to be decreased to zero after 2014. On the other hand, off-grid rural resi-dential fossil-fuel-based generation will increase from 7.8 TWh to 9.8 TWh – the effect of a growing population and consecutively higher power demand is partly offset by rural electrification and households switching to on-grid power supply.
11 There is a plan to include capacity from cogeneration plants (e.g., power generation from coal in fertiliser plants). These emissions are accounted for in the respective industry segments.
12 The emissions from commercial power generation are accounted for in the Industry and Agriculture sectors. With regard to residential energy consumption, the Green Cities sector takes into account GHG emissions from urban power generation by fossil fuels and the Forestry sector accounts for all emissions from power generation from woody biomass (urban and rural).
Federal Democratic Republic of Ethiopia 81

FIGURE 24
Clean/renewable power generation1
TWh
Electric power – Estimation of changes with time of the main emission drivers
Output overview
2030
9.8
2020
8.5
2010
8.5
Key emissions drivers Projected change with time Rationale
98
62
8
203020202010
1 Total generation (before T&D losses)2 Includes rural domestic off-grid fossil fuel based generation
Conventional power generation1
(fossil fuel)2
TWh
▪ Includes all on-grid power generation and rural residential off-grid fossil fuel based generation (in conventional power generation)
▪ Current and future generation capacity according to EEPCogeneration capacity masterplan and economically viable potential
▪ EEPCo: Plan to switch off diesel generation capacity (grid/off-grid) after 2014
GHG emissions baseline and BAU projection for 2030 The Electric Power sector as defined in this strategy currently emits around 3 Mt CO2e per year, mainly caused by electricity production from fossil fuel facilities. In the BAU scenario, annual emissions will stay at around 3 Mt CO2e, as the EEPCo conventional power generation is switched off, but rural households with increasing population continue to use fossil-fuel-based generation (Figure 25). Current emission estimates are based on EEPCo’s generation and consumption data (which includes grid and off-grid diesel generators) as well as an assessment of existing standby diesel generators and off-grid rural residential fossil-fuel-based generation. The emissions are calculated with the general emission factors of diesel power generation provided by EEPCo and adjusted against international benchmarks. By basing electricity generation almost exclusively on renewable energy, Ethiopia is avoiding emissions of around 50 Mt CO2e (2030) as compared to the electric power sectors in neighbouring countries.
Federal Democratic Republic of Ethiopia 82

FIGURE 25
Electric power – Current level of GHG emissions of 3 Mt CO2e is projected to stay at a similar level up to 2030
Mt CO2e/ year
3
Electric power generation(all on-grid electric power generation and rural residential off-grid fossil fuel based generation)
BAU2030
31
BAU2020
21
Baseline2010
BAU emissions estimations
1 Not including emissions from up to 450 MW cogeneration capacity from coal plants (fertilizer production, emissions from coal consumption accounted for in Industry emissions)
ABATEMENT LEVERS – POTENTIAL AND COST CURVE
By 2030 (and even before), the Electric Power sector could even have a negative net contribution to GHG emissions. The surplus power supply could be exported, not only generating income for Ethiopia but also helping neighbouring countries to reduce emissions from conventional power generation. The opportunity to reduce neighbouring countries’ emissions by substituting their electric power generation from fossil fuel with clean electric power generated in Ethiopia represents the single most important abatement lever for the Ethiopian Electric Power sector.13
Figure 26 shows the resulting GHG abatement from capturing the full export potential, which will be around 19 Mt CO2e in 2030 – one of the largest individual abatement levers across all sectors. This export potential is calculated assuming full capture of energy efficiency levers identified by the STC.
13 The construction of the necessary supply capacity of clean and renewable electric power – although a challenging task in itself – is not counted as an abatement lever in this regard because it is already part of Ethiopia’s business-as-usual scenario as it is economically the most appropriate option for the country’s power sector development (as well as being ecologically sound).
Federal Democratic Republic of Ethiopia 83

As there is only one lever that has been identified in the Electric Power sector, the
estimated abatement costs from electric power exports are negative. This indicates that each metric tonne of CO2e abatement realised through electric power exports reducing emissions in neighbouring countries will have a net benefit of around 5 USD for Ethiopia. This figure does not include any potential revenues from climate funds that might be paid for the reduction of emissions in importing countries (potentially indirectly through benefit-sharing agreements with importers or rent-capturing by increased export tariffs).
The total investment cost that is required for the power generation capacity build-up has been calculated based on average unit capital cost (around 1,100 USD/kW for hydro, 2,000 USD/kW for wind, and 4,600 USD/kW for geothermal) and on transmission and distribution infrastructure costs. The total sum amounts to USD 38 billion up to 2030. A more detailed account of the investment cost and potential financing options is given in the deep-dive analysis on power financing.
FIGURE 26
19 Power exports1
Mt CO2e reductionpotential in 2030
BAU After abatement
Electric power – Average abatement potential is estimated to be around 19 Mt CO2e p.a.
1 Emission reductions will occur outside of Ethiopia
Abatement measures1
Mt CO2e/ year in 2030BAU and abatement potentialMt CO2e/ year
BAU emissions: 3 Mt in 2030
-30
-25
-20
-15
-10
-5
0
5
20302025202020152010
Federal Democratic Republic of Ethiopia 84

Electric power lever 1 – Electric power exports
The opportunity of power exports faces some constraints. As shown in Figure 27, which is based on data provided and analysed by EEPCo and regional power organisations, the total potential for power exports has been analysed for the period 2010 to 2030 against three constraints:
■ Domestic export capacity, which is determined by the surplus of electric power generation capacity over domestic demand (net of energy efficiency). In the period 2020 to 2030, the need to satisfy exponentially growing domestic demand will impose some constraints on the volume of possible exports.
■ Interconnection capacity, reflecting the technical limits of the cross-border transmission line capacity to regional markets. The construction of intercon-nection capacity will impose a constraint on power exports up to around 2020.
■ Foreign demand, which is determined by planned imports of neighbouring countries, any still existing electric power generation deficit, and the amount of conventional electric power generation that comes at generation costs that are higher than the potential cost for imports of Ethiopian electric power. This theoretical foreign demand is not expected to represent a binding constraint at any point in time.
The abatement potential is calculated from the export potential and the average GHG emissions from conventional power generation in neighbouring countries. The average carbon intensity of avoided capacity is assumed to be 0.7 kg CO2e/kWh (based on the average carbon intensity of electricity generation in neighbouring countries). An average export potential of nearly 25 TWh p.a. between 2011 and 2030 results in an annual abatement potential of 17 Mt CO2e on average, while the 2030 export potential of nearly 28 TWh results in the abatement potential of around 19 Mt CO2e.
The abatement cost is composed of average generation cost (0.051 USD/kWh, taking account of the production-capacity-weighted average of hydro, wind, and geothermal) plus average transmission cost (0.006 USD/kWh, based on the East-ern Nile Power Trade Programme study and Ethio-Kenya interconnection study) as positive costs as well as export income (0.06 USD/kWh) as negative cost. The export price (i.e., income to Ethiopia from electric power exports) is conserva-tively assumed to be relatively low in order to make it attractive to markets in the region, which are currently producing electric power at an average cost of 0.06 to 0.16 USD/kWh.
Federal Democratic Republic of Ethiopia 85

FIGURE 27
Total electric power exports determined by three constraints – Average abatement potential is 17 Mt CO2e p.a.
Export potential and CO2e abatement
Average annual export potential (TWh)Average annual abatement potential (Mt CO2e)
Source: EEPCO; EAPP
1 Assuming avg. carbon intensity of avoided capacity to be 0.7 kg CO2e/kWh
343935
6
444428
3
151
109
85
63
2021-20252016-20202011-2015 2026-2030
Export capacity
Interconnection capacityForeign demandAbatement potential p.a.1 Binding constraint
Interconnectionconstrained
Domestic surplusconstrained
2 19 27 23
ABATEMENT LEVERS – FEASIBILITY AND ECONOMIC IMPACT ASSESSMENT
In general, capturing the impact of power exports appears to be a viable lever. With regard to technical feasibility, the build-up of the power generation potential should not represent a major barrier. Ethiopia is already running major power gen-eration infrastructure sites of high capacity and is currently developing more. As far as the technical potential of the country and the build-up capacity of EEPCo are concerned, it remains to be seen whether the projected pace can be realised. The transmission lines required for exports are currently planned or are already under construction and do not represent a particular technical challenge. However, EEPCo needs to implement rigorous demand- and supply-side management and particularly a peak-capacity planning system to avoid domestic instability of supply when exporting surplus power.
On balance, financing the projected electric power generation scale-up has so far proved to be very challenging and potentially presents the most significant barrier to be overcome in realising the ambitious plans for the Electric Power sector. A
Federal Democratic Republic of Ethiopia 86

finance gap of around USD 20 billion has been projected (given that current
financing can be extended) – resulting in a gap of around USD 1 billion per year on average. For this reason, a dedicated detailed analysis has been conducted on this issue, a summary of which can be found in the main part of this report.
Political willingness of neighbouring countries to support Ethiopia’s electric power scale-up or to trade power could remain a question mark. At minimum, an effort is needed to align important regional players behind Ethiopia’s plans and win their support. However, political unpredictability might pose a potential challenge –particularly to long-term power purchase agreements.
Yet, although question marks remain, there are no overt barriers to exporting sur-plus power. The scope of Ethiopia’s future power growth plans goes beyond past experience, and the actual demand from neighbouring countries as well as the out-come of negotiations remains to be seen. Nevertheless, EEPCo has proved its institutional ability to accomplish major generation capacity extensions. Moreover, hydropower generation is not only clean but also affordable in the regional context, and the forum and institutions for implementing regional power trade do already exist, e.g., in the form of the East African Power Pool.14 Since the question of how Ethiopia can monetise the GHG mitigation as done in other countries is still open, a suitable mechanism needs to be drafted (e.g., benefit-sharing agree-ment).
With regard to its socio-economic impact, the export of power to neighbouring countries – and, more broadly, the build-up of power generation capacity – would have a significant additional positive impact on our economic development plans. Electric power exports would not only directly increase Ethiopia’s exports and generate additional foreign income, they would also contribute to the economic viability of the plans to build power generation capacity, hence helping to build up (and eventually finance) the power generation potential, increase employment, and contribute to GDP growth. Besides, such exports might also increase public finance directly via increased tax revenue as well as indirectly via revenue increases for publicly owned EEPCo. However, there might be adverse environ-mental and social impacts, e.g., population displacement, which need to be evalu-ated and properly addressed through rigorous assessment of the environmental and social impacts. The usage of land and natural resources needs to be subject to an integrated land planning effort to determine the best of alternative land uses. Also, the implementation of an integrated catchment management system is necessary to
14 There are very positive signs, e.g., an agreement on the Ethio-Sudan export line seems very likely as the line is already under construction by both parties to the arrangement.
Federal Democratic Republic of Ethiopia 87

prevent adverse effects to the generation potential from hydropower, e.g., by
sedimentation of hydropower facilities.
ABATEMENT LEVERS – IMPLEMENTATION TIMELINE AND RESOURCE REQUIREMENTS
Implementation timeline As described above, the export of power from Ethiopia to its neighbouring coun-tries and the wider region is bound by three constraints: surplus generation capac-ity, interconnection capacity, and demand. Since it has been evaluated that inter-connection capacity and surplus generation capacity will constitute the binding constraints in earlier and later years respectively, the implementation of power exports very much depends on the construction and opening of interconnections to neighbouring countries and regional markets. Figure 28 depicts the three important interconnectors. The Djibouti interconnector is already in operation and used for power supply to the neighbour. The Ethio-Sudan-Egypt as well as the Ethio-Kenya interconnectors will follow and start operations in the coming years so that power exports to these countries can be started as soon as a surplus of power is generated and contracts are negotiated.
Resource requirements and existing projectsWhile the generation and transmission of electric power for export purposes will require a significant investment, the generated export price is envisaged to overcompensate that expenditure and lead to a net income. While this might not materialise in the short term, the long-run projection (i.e., up to 2030) is that the electric power exports will have a positive net contribution of around USD 1.8 billion (Figure 29).
The total capital expenditure for power generation and transmission infrastructure to support this initiative has been calculated to be more than USD 37.5 billion. This capital expenditure (CAPEX) will be utilized for all power generation and transmission capacity, i.e., it will also contribute to satisfying the growing domestic demand. As stated above, financing this high required capital expenditure is envisaged to constitute one of the major challenges for the Power sector expansion.
Federal Democratic Republic of Ethiopia 88

FIGURE 28
Electric power – Overview of timeline for implementation of initiatives
2012 2013 2014 2015 2016 2017
Ethio-Kenya interconnector
(1000 MW)
Djiboutiinterconnector
(150 MW)
Ethio-Sudan-Egyptinterconnector
(200 MW; up to 3400 MW from 2018)
Activity
Electricpowerexports
Selected as priority initiative
FIGURE 29
Electric power – Financial overview of power exportsMillion USD
Short-term: 2011-2015 Long-term 2011-2030
-13,710
-10
500
0
510
0
1 Full capital expenditure, not amortised2 Aggregated abatement potential; expenditure per t CO2e not equivalent to abatement cost in cost curve, as the CAPEX abatement expenditure is not
annualised via amortisation (rather: cash-flow perspective)
Mt CO2e total aggregated abatement potential
CAPEX1 additional
OPEX additional(cost of power generation and export)
Programme cost
Income from power export
Abatement expenditurebefore carbon revenue 62
0
-37,540
1,810
29,580
0
27,770
3452Mt CO2eabatement potential
For comparison: Underlying CAPEX
Federal Democratic Republic of Ethiopia 89

Due to high upfront expenditure and attractive returns, power exports will pay back, but only in the long run. Hence, this expenditure requires long-term financ-ing (Figure 20).
The implementation of the power generation and transmission capacity expansion is led by the MoWE, the EEA, and EEPCo. Strategic plans for the expansion exist, and these institutions also carry the overall responsibility for their implementation.
FIGURE 30
Electric power – Electricity exports will have a positive return
Category CNo positive return,
grants/performance pay requirement
0
Category BPositive return, but long term financing
requirement
27,770
Category APositive return,
short term financingrequirement
0
Million USD, total cost1 Percent of total cost
0% 100% 0%
1 Including additional CAPEX, additional OPEX, and programme cost2 NPV calculated with 6% discount rate
Definition Positive NPV2 of first five years of cash flow (from start of initiative)
Positive NPV2 of overall initiative (from start of initiative up to 2030), but not after first five years
Negative NPV2 of overall initiative (from start of initiative up to 2030)
Federal Democratic Republic of Ethiopia 90

Green Cities and BuildingsUnder the BAU scenario, emissions from cities will increase from 4.7 Mt CO2e in 2010 to 10.2 Mt CO2e 2030. Adopting new technologies in lighting and waste management offers an abatement potential of up to 6.9 Mt CO2e in 2030. The major initiatives proposed by the STC are: reduction of electricity demand through efficient lighting, improved landfill gas management (capture gas for flaring), and liquid waste emissions management (capture gas for flaring). Of these three initia-tives, efficient lighting has the largest abatement potential: 5.1 Mt CO2e in 2030.
SCOPE AND INSTITUTIONAL SETUP
The Green Cities and Buildings sector covers emissions from three primary cate-gories: solid waste, liquid waste, and off-grid fossil fuel use (e.g., kerosene lamps, diesel generators, construction vehicles). Other sources of emissions in cities (e.g., transport, industry, grid electricity) are accounted for in other STCs. The Green Cities and Buildings STC (Table 7) calculated current and future emissions and analysed three abatement levers. The STC is composed of members from the Ministry of Urban Development and Construction and the Environmental Protec-tion Agency.
TABLE 7
Federal Democratic Republic of Ethiopia 91

GHG EMISSIONS BASELINE IN 2010 AND BAU UP TO 2030
Emissions in the scope of the Green Cities and Buildings sector are split evenly between solid waste, liquid waste, and off-grid fossil fuel energy. Under the BAU scenario, emissions from cities will increase from 4.7 Mt CO2e in 2010 to 10.2 Mt CO2e in 2030 (Figure 31).
Main drivers of GHG emissionsThe main drivers of GHG emissions in the Green Cities and Buildings sector as well as the main assumptions about their impact and development with time are detailed below (Figure 32)
■ Increase in urban population. The urban population will grow rapidly over the next 20 years. This growth will be driven by a high fertility rate and strong rural to urban migration. Together these trends produce an annual urban population growth rate of 4.41% between 2010 and 2030 according to CSA. This will result in the urban population growing from 13.5 million people in 2010 to 32 million people in 2030. Growth of the urban population drives emissions as the expanding population generates more waste and consumes more energy; also because per capita solid waste generation and energy consumption rates of urban populations exceed waste generation and energy consumption of rural popula-tions.
■ Increase in number of towns and cities. The same forces driving the expan-sion in population will also increase the number of population centres categorised as towns and cities. The number of urban centres with at least 20,000 people will increase from 86 in 2010 to 237 in 2030, according to the STC analysis of data from CSA and the MoUDC. The transition of small population centres into larger towns and cities – as indicated above – drives emissions through the higher per capita solid waste generation and energy consumption rates of populations in larger towns and cities.
■ Increase in per capita GDP. Per capita GDP is projected to grow at around 8.5% annually between 2010 and 2030, reaching USD 1,846 in 2030 from a base of USD 380 in 2010 based on the GTP and STC analyses. The increase in per capita GDP drives emissions due to the higher rates of energy consumption and solid waste generation associated with higher per capita GDP.
Federal Democratic Republic of Ethiopia 92

FIGURE 31
Green cities – In a business-as-usual scenario, emissions will more than double to 10.2 Mt CO2e per year until 2030
BAU emissions estimationsMt CO2e/ year
2.1
2010
4.7
1.9
1.6
1.2
Off-grid energy
Liquid waste
Solid waste
2030
10.21
2.7
3.9
3.7
2020
6.9
2.3
2.5
1 Subcomponents do not add up due to rounding up
FIGURE 32
Source: CSA 2010; MoUDC
Output overview
2030
32.0
2020
21.0
2010
13.5
852378
2030
1,846
20202010
Per capita GDP (USD/person)
Key emissions drivers
Urban population(pop. in millions)
Projected change Rationale
▪ Larger population creates more waste and consumes more energy
▪ Growing per capita GDP increases per capita solid waste generation and per capita energy consumption
Green cities – Estimation of changes with time of the main emission drivers
Source
▪ CSA
▪ GTP growth rate extrapolated to 2030
237
14186
203020202010
Towns and cities (number of towns and cities with at least 20,000 inhabitants)
▪ Higher per capita waste generation and energy consumption of urban population
▪ CSA
▪ MoUDC
Federal Democratic Republic of Ethiopia 93
GHG emissions baseline and BAU projection for 2030 The emissions estimated by the Green Cities and Buildings STC will increase from 4.7 Mt CO2e in 2010 to 10.2 Mt CO2e in 2030 (see Figure 31), driven equally by emissions from solid waste, liquid waste, and use of off-grid fossil fuel energy.
■ Solid waste. As the population grows and per capita GDP increases, the rate of per capita solid waste generation will increase from 0.33 kg/person/day in 2010 to 0.44 kg/person/day in 2030, based on the 2009 Ethiopia Solid Waste Study and IPCC benchmarks for waste generation in sub-Saharan Africa. This will result in the generation of 1.5 million tonnes of solid waste annually in urban areas by 2030. Emissions from solid waste will consequently grow from 1.2 Mt CO2e in 2010 to 3.7 Mt CO2e in 2030.
■ Liquid waste. Although per capita liquid waste generation is projected to remain constant between 2010 and 2030, the expansion of the urban population will cause an increase in total liquid waste. Emissions from urban liquid waste will rise from 1.6 Mt CO2e in 2010 to 3.9 Mt CO2e in 2030.
■ Off-grid fossil fuel. The STC projects an urban off-grid fossil fuel use growth rate of 1.7% between 2010 and 2030 based on statistics from EEPCo and the Ethiopian Forestry Action Programme. This rate is significantly lower than the urban population growth rate due to the expected substitution of off-grid diesel generators with renewable electricity from the grid. Consequently, the increase in off-grid fossil fuel use will be driven primarily by kerosene for lamps and gas for cooking. Emissions from off-grid fossil fuel are expected to increase from 1.9 Mt CO2e in 2010 to 2.7 Mt CO2e in 2030. Here it is important to note that the Electric Power and Industry STCs have accounted for the emissions from electricity generated by fossil fuels and distributed via electric power grids as well as the emissions from fossil fuel used by the industry.
ABATEMENT LEVERS – POTENTIAL
The Green Cities and Buildings sector includes three abatement levers: reduction of electricity demand through efficient lighting, improved landfill gas management (capture gas for flaring), and liquid waste emissions management (capture gas for flaring). In total, an abatement potential of up to 6.9 Mt CO2e in 2030 has been identified (Figure 33). Raising public awareness and encouraging public participa-tion are crucial in realizing this abatement potential.
Federal Democratic Republic of Ethiopia 94

■ Reducing electricity demand through efficient lighting in the urban resi-
dential and commercial sectors would free up power supply capacity and enable the export of more electricity to neighbouring countries, where Ethiopia’s renewable electricity would displace electricity generated from fossil fuels. This initiative has an abatement potential of approximately 5.1 Mt CO2e, and is the largest abatement lever in the Green Cities and Buildings sector. Because the emissions reduction takes place through increased power exports, the abatement potential from this initiative is accounted for primarily by the Electric Power STC.
■ Landfill gas management can be improved through the capture of gas for flaring, thus reducing the amount of landfill greenhouse gases that are to be released into the atmosphere. This initiative, which is to be implemented at landfills in towns and cities larger than 20,000 inhabitants, has an abatement potential of 0.9 Mt CO2e in 2030.
■ Emissions from liquid waste can be captured and used for flaring. Imple-menting this technology would nearly eliminate emissions from liquid waste at waste disposal lagoons. If implemented in cities with a population larger than 100,000, this lever has an abatement potential of 0.9 Mt CO2e in 2030.
FIGURE 33
Abatement measuresMt CO2e/ year in 2030
BAU and abatement potentialMt CO2e/ year
0.9 Landfill gas management
Green cities – Abatement and sequestration potential reaches 1.9 Mt CO2e per year in 2030
0
2
4
6
8
10
12
2015 203020252020
0.9 Liquid waste emissions reduction
Σ1.8
BAU emissions: 10.2 Mt
Green Cities CO2 abatement accounted for by Power STC
5.1 Efficient lighting
Federal Democratic Republic of Ethiopia 95

Green Cities and Buildings lever 1 – High-efficiency lighting (residential and commercial/institutional)Improvements in light bulb technology have greatly increased the efficiency of bulbs while simultaneously lowering the lifetime costs of bulbs. As many coun-tries are already doing, it is now possible to completely transition from incandes-cent bulbs to compact florescent lights (CFLs) in the residential sector, and from a mix of low-efficiency bulbs (e.g., incandescent, conventional florescent) to higher-efficiency bulbs (e.g., light-emitting diodes (LEDs), high-efficiency fluorescents) in commercial and institutional buildings. This initiative builds on the existing activities related to the promotion of high-efficiency light bulbs (e.g., EEPCo’s bulb exchange campaign). Although the Green Cities and Buildings STC has only included urban areas in its analysis, this initiative could be expanded to rural areas.
By switching to higher-efficiency bulbs, buildings could achieve the same level of lighting while greatly reducing electricity consumption. The abatement potential of this initiative in 2030 was calculated to be approximately 5.1 Mt CO2e. These abatement potential calculations are based on the following data and assumptions:
■ Demand for lighting. The STC estimates annual electricity consumption for lighting in 2030 of 8.3 TWh in residential buildings and 2.0 TWh in commer-cial/institutional buildings. The STC estimates an average of 1.5 bulbs per room, and an average bulb use of 3.5 hours per 24 hours based on UNFCCC benchmarks.
■ Lighting efficiency. Based on international lighting benchmarks, the STC estimates an efficiency improvement of 77% by switching from incandescent bulbs to compact florescent lights (CFL), and an efficiency improvement of 60% by switching from the current inefficient mix of bulbs in commercial/ institutional buildings to high-efficiency bulbs (e.g., LED, high-efficiency fluorescents). These efficiency improvements would result in annual electricity savings of 6.4 TWh in the residential sector and 0.9 TWh in the commer-cial/institutional sector by 2030.
■ Penetration. The STC proposes a programme start date of 2012, building on EEPCo’s ongoing promotion of efficient light bulbs. The STC assumed 100% CFL usage in the residential sector by 2030, and 75% efficient light technology adoption in the commercial/institutional sector by 2030, although a more rapid
Federal Democratic Republic of Ethiopia 96

transition could be possible with appropriate policy support (e.g., with banning
sales of conventional bulbs).
■ Emissions reduction from electricity export. By exporting more power to neighbouring countries, electricity generated from fossil fuels would be displaced by Ethiopia’s renewable energy. The STC used an estimate of 0.7 kg CO2e/KWh exported, based on the Electric Power STC’s estimates of the carbon intensity of energy produced in neighbouring countries.
Green Cities and Buildings lever 2 – Improved landfill gas management (flaring)Ethiopia has ambitious landfill construction goals that would bring improved municipal solid waste services to 364 towns and cities by 2015, as stated in the GTP. Implementing improved landfill gas management techniques such as flaring would reduce the amount of greenhouse gases released into the atmosphere. Implementing these technologies has an annual abatement potential of 0.9 Mt CO2e by 2030.
■ Programme reach. Based on the scale of similar projects implemented in sub-Saharan Africa, the STC proposes that landfill gas flaring be implemented for all cities with a population of at least 20,000 people. The STC proposes to phase in the technology beginning in 2014 with 13% of towns and cities (17) and gradually expanding to 100% of towns and cities by 2030 (237 total sites).
■ Waste collection rates. The STC estimates that 40% of solid waste is depos-ited at landfills in cities with populations from 20,000 to 100,000 people, and that 70% is deposited at cities with over 100,000 people based on the Ethiopia Solid Waste Study (2009).
■ Technical details. The STC assumes a gas capture rate of 60% based on the Australia Landfill Status Report (2009), and 0.756 kg CO2e per kg of waste based on IPCC benchmarks for sub-Saharan Africa and STC analysis. Emissions from the CO2 released during gas flaring/combustion are disregarded in accordance with IPCC methodological guidelines for solid waste.
Green Cities and Buildings levers 3 – Liquid waste emissions management (flaring)Liquid waste is a major source of emissions within the scope of the Green Cities and Buildings sector, but technologies exist that enable very high capture rates of gas (CH4 and CO2) from liquid waste lagoons. This initiative would implement
Federal Democratic Republic of Ethiopia 97

improved liquid waste management from waste lagoons used by networked
municipal sanitation systems and vacuum trucks servicing non-networked sanita-tion facilities (e.g., pit latrines). This abatement lever has an annual abatement potential of 0.9 Mt CO2e in 2030. The abatement potential of this lever was esti-mated using the following calculations:
■ Programme reach. Based on the scale of similar projects implemented in sub-Saharan Africa, the STC proposes that liquid waste gas capture be implemented in all cities with a population greater than 100,000. The STC proposes a phase-in of the technology beginning in 2014 with 23% of cities (3 sites) and gradually expanding to 100% of cities by 2030 (34 total sites).
■ Waste collection rate. The STC estimates that 60% of liquid waste in cities will be deposited in lagoons during the period of 2010-2030 based on MoUDC statistics.
■ Technical details. The STC assumes a gas capture rate of 90% based on the IPCC default value for liquid waste gas capture, and a carbon intensity of 0.121 Mt CO2e/year from liquid waste generated by one million people based on IPCC default values for liquid waste emissions and its own analysis. Emissions from the CO2 released during gas flaring/combustion are disregarded in accordance with IPCC methodological guidelines for liquid waste.
ABATEMENT LEVERS – FEASIBILITY AND ECONOMIC IMPACT ASSESSMENT
The three abatement levers in the Green Cities and Buildings sector have moderate to high feasibility, but only one – efficient lighting – also has high impact. The ultimate attractiveness of each initiative will depend on its implementation cost.
Feasible levers with high impactThe efficient lighting initiative offers both a large impact (5.1 Mt CO2e in 2030) and relatively straightforward and feasible implementation. The technology for this lever (efficient bulbs) already exists and is in use in Ethiopia, the cost of effi-cient bulbs continues to fall, and the steps needed for implementation (e.g., regula-tion of bulb imports to prohibit inefficient bulbs) are relatively easy to enact. Furthermore, this initiative has significant financial benefits to consumers (building owners, tenants, and households), since most types of efficient bulbs have a lower total cost of use than inefficient bulbs, i.e., the higher purchase price of efficient bulbs is more than outweighed by their lower operating cost (lower
Federal Democratic Republic of Ethiopia 98

electricity consumption) and longer lifespan. With all of this in mind, the STC
recommends prioritisation of this highly attractive initiative.
Other leversAlthough they have a smaller abatement potential (combined total of 1.8 Mt CO2e in 2030), the two waste-related levers investigated by the STC are also attractive and should be pursued. Their benefit is magnified by their socio-economic benefits (improved safety at landfills, reduced air pollution, etc.). Depending on the avail-ability of technology, efficient waste management could be complemented by electricity generation techniques that would provide further benefits for the green economy.
In addition to these levers, the STC also conducted a preliminary assessment of other promising levers that should be further investigated: recycling raw materials (e.g., metal, paper, plastic) and separation of waste; urban greenery and integrated infrastructure planning; energy-efficient design of new buildings; reuse, compost-ing, and biogas generation from liquid and solid waste; and a shift to high-effi-ciency appliances.
ABATEMENT LEVERS – IMPLEMENTATION TIMELINE AND RESOURCE REQUIREMENTS
Implementation timeline The Green Cities and Buildings STC has selected high-efficient lighting as a pri-ority initiative based on the large abatement potential and the positive outcome of the feasibility assessment. This initiative will receive particular attention and, building on EEPCo’s ongoing promotion of efficient light bulbs, the STC has determined a programme start date within 2012 (Figure 34).
The implementation of the two other levers, improved landfill gas management and liquid waste emissions management, will start in 2014. Based on the ambitious GTP goal to bring improved municipal solid waste services to 364 towns and cities by 2015, solid waste technology will be phased in for 13% of towns and cities in 2014 and gradually expanded until 2030. Liquid waste technology will also start in 2014 with 23% of the cities and expanding to 100% of cities by 2030. It is important to mention that these dates mark the start of the implementation, which for some initiatives is staged across several years, includes some required preparatory work (e.g., development of investment plans), and is subject to
Federal Democratic Republic of Ethiopia 99

approval by the respective authorities. Hence, the full impact of the initiatives will
only occurs later in most cases.
In addition, several other levers with limited abatement potential − such as recycling or energy-efficient design of buildings − could be considered.
FIGURE 34
Green cities – Overview of timeline for implementation of initiatives
2012 2013 2014Q1 Q2 Q3 Q4 Q1 Q2 Q3 Q4 Q1 Q2 Q3 Q4
High-efficient lighting
Improved landfill gas management
Other levers currently under consideration
Activity
Liquid waste emissionsmanagement
Selected as priority initiative
Other initiatives
Resource requirements and existing projectsThe cost and resource requirements of the Green Cities and Buildings abatement levers have not yet been estimated. However, consultations have indicated that the implementation of the suggested abatement levers will be an attractive investment.
There are several initiatives already in implementation status that are interlinked with the work of the Green Cities and Buildings STC. A Green City Strategy is under development that addresses many of the STC’s propositions. Furthermore, work has been conducted to develop a CDM for solid waste management. In
Federal Democratic Republic of Ethiopia 100

addition, several Nationally Appropriate Mitigation Actions (NAMAs) on waste
management have been developed by the Ethiopian government.
Federal Democratic Republic of Ethiopia 101

ForestryThe Forestry sector is a significant contributor of GHG emissions, but it also offers a high abatement potential that even surpasses the estimated increase in emissions by 2030.
SCOPE AND INSTITUTIONAL SETUP
The Forestry STC (Table 8) calculated current and future emissions and analysed abatement levers for several segments of the Forestry sector. Team members were sector experts from the Environmental Protection Authority, the Ministry of Agriculture, as well as the Forestry Research Centre.
TABLE 8
Before addressing the business-as-usual (BAU) calculations and abatement potential, however, it is important to reiterate that these estimates have a degree of uncertainty, given the current lack of reliable and consistent data on land use and projected carbon stocks. Best available data have been used and improving the quality of these data will be part of the suggested strategy.
GHG EMISSIONS BASELINE IN 2010 AND BAU UP TO 2030
Emissions from the Forestry sector are mainly caused by human beings, and are driven by deforestation for agriculture and forest degradation from fuelwood con-sumption and logging. Under the BAU scenario, emissions from forestry will increase from 53 Mt CO2e in 2010 to 88 Mt CO2e in 2030 (Figure 35).
Federal Democratic Republic of Ethiopia 102

FIGURE 35
Forestry – Level of GHG emissions will be increasing by more than 50% up to 2030 under a business-as-usual scenario
Output overview
Mt CO2e/ year
37
31
1
1 1
Deforestation foragricultural land
Baseline2010
53
26
24
Degradation from fuelwoodconsumption
Formal loggingInformal logging
Business-as-usual2030
88
44
41
1 2
Business-as-usual2020
712
Main drivers of GHG emissionsThe main drivers of GHG emissions as well as their assumed impacts are mainly the increase in cropland and the increase in the cutting of fuelwood to meet the needs of a growing population, as detailed below (Figure 36).
■ Deforestation for agricultural land. Deforestation rates in Ethiopia histori-cally correlate with the expansion of agricultural land. Based on STC calculations for soil-based emissions, total cropland is projected to gradually reach 27 million hectares by 2030, with an annual BAU growth rate of 3.9% between 2010 and 2030. This is the land expansion needed for the crop growth target of 9.5% p.a. in the GTP, which is essential to ensure food security and poverty alleviation in the face of demographic pressure. This 3.9% p.a. growth rate in agricultural land will be necessary to reach the 9.5% target, assuming that Ethiopia makes no significant progress in increasing crop yield and the value of yield beyond historically observed rates of improvement.15 As a consequence, the annual amount of land taken from forests for agriculture will need to increase gradually over the next 20 years, which will lead to a higher deforestation rate and more CO2 emissions. Without any additional intervention, this agricultural expansion
15 Which are discounted to reflect the impact of major investments that were necessary to achieve them.
Federal Democratic Republic of Ethiopia 103

will affect the high woodland more than in the past, while the high forests will be
less affected.16 However, it has been assumed that the proportion of new land for agriculture that is taken from forests will decrease from 70% to 55% (of the total new land for agriculture) in 2030, also as a result of current government policies, which are assumed to continue under the BAU scenario. As its main input sources, the Forestry STC used the GTP, the WBISPP report, and CSA cropland data as well as IPCC guidelines and benchmarks.
FIGURE 36
PopulationMillion people
Forestry – Estimation of changes with time of the main emission drivers
Output overview
2030
27.0
2020
18.5
2011
12.6
Key emissions drivers Projected change with time Rationale
134103
80
2020 20302011
▪ Average growth of cropland estimated to reach 3.9% p.a., enabling it to reach GTP targets if no significant investment is made to find new ways to increase agricultural yields
Increase in cropland areaMillion hectares
▪ Growth based on CSA projections, 2010-2030; average growth rate 2.62%
▪ Population is direct driver of fuelwood consumption and logging (formal and informal)
556269
203020202011
▪ Average 2000-08 share of agricultural land taken from forest areas, assumed to decrease under government policies in BAU (Sources: WBISPP and CSA)
Share taken from forests Percent of new land
■ Degradation from fuelwood consumption. Ethiopia’s rural energy needs are predominately satisfied by biomass (>90%). This includes traditional energy sources such as fuelwood, charcoal, and branches, leaves, and twigs. The development of fuelwood consumption is primarily influenced by population increase, unless a significant change in the energy mix takes place. The main sources used for projections were the WBISPP report (on current levels of degradation due to fuelwood consumption) and CSA population forecasts used for projecting future fuelwood demand.
16 Assumption made by STC to reflect new government policies.
Federal Democratic Republic of Ethiopia 104

■ Logging. Authorised and unauthorised logging is currently a relatively minor
driver of forest degradation. The STC used the 2010 FAO report that estimates the total amount of industrial logging (authorised) as well as the research work by Demel Teketay from 2002 that details unauthorised as compared with authorised logging volumes. To project the BAU development, the STC assumes that logging will increase on average at the same rate as population growth (2.6 % per year), reflecting the increasing demographic pressure on forest resources and experiences made in other developing economies.
GHG emissions baseline and BAU projection for 2030 The increase of emissions to 88 Mt CO2e in 2030 (see Figure 37) will mainly be driven by deforestation for agricultural use and degradation from fuelwood con-sumption.
■ Deforestation for agricultural land. Due to a growing need for agricultural land fuelled by demographic pressure and development needs as described above, the deforestation rate will progressively increase from around 280,000 hectares in 2010 to around 550,000 hectares in 2030. Emissions will go up from 26 Mt CO2e in 2010 to 44 Mt CO2e in 2030.
■ Degradation from fuelwood consumption. In line with population growth, the total amount of woody biomass degradation is projected to increase from around 14 million tonnes in 2010 to 23 million tonnes in 2030. This will lead to a rise in GHG emissions from 24 Mt CO2e to 41 Mt CO2e in 2030.
■ Logging. Formal and informal logging has been projected to undergo a simi-lar growth (i.e., following the needs of a growing population), increasing GHG emissions from around 2 Mt CO2e in 2010 to 3.5 Mt CO2e in 2030.
ABATEMENT LEVERS – POTENTIAL AND COST CURVE
Thanks to levers such as afforestation and reforestation, the Forestry sector boasts an abatement potential even higher than the projected increase in emissions under the BAU scenario. In total, nine levers have been identified with an abatement potential of up to 131 Mt CO2e (Figure 37). These levers are clustered into three groups:
■ Reduced deforestation. This includes lowering the pressure that the need for agricultural land exerts on existing forests. These levers range from agricultural intensification and preparation of new land by means of small-scale irrigation to medium- and large-scale irrigation schemes. In total, they account for an
Federal Democratic Republic of Ethiopia 105

abatement potential of nearly 38 Mt CO2e. Since these levers are mainly related
to agricultural practices, a more detailed discussion can be found in the chapter on Soil in this appendix.
■ Reduced forest degradation. This focuses mainly on reducing the demand for fuelwood through dissemination of a wide range of efficient cooking and baking technologies. With a total abatement potential of around 50 Mt CO2e, this is the largest set of levers identified across all sectors.
■ Increased sequestration: This contains mainly large- and small-scale affore-station/reforestation/area closures and forest management of woodlands and forests. Covering an area of 7 million ha in total (by 2030), this set of levers promises an abatement potential of 42 Mt CO2e. Today, several projects to increase the forest cover by afforestation or reforestation are already ongoing. In addition to afforestation/reforestation, sustainable agro-forestry and protected-area management can provide additional levers to increase sequestration.
FIGURE 37
Mt CO2e reductionpotential up to 2030
Abatement measuresMt CO2e/ year in 2030
BAU and abatement potentialMt CO2e/ year
BAU emissions: 88 Mt34 Fuelwood efficient stoves
Forestry – Abatement and sequestration potential reaches 131 Mt CO2e per year in 2030
-60
-40
-20
0
20
40
60
80
100
202520202015 2030
1 LPG stoves
2 Biogas stoves
14 Electric stoves
32 Afforestation/reforestation
10 Forest management
27 Agriculture intensification
New land through irrigation11
Σ 131
Federal Democratic Republic of Ethiopia 106

FIGURE 38
Forestry – Most of the abatement potential has a cost below 5 USD/t CO2e, more than half of it has a negative abatement cost
Abatement opportunities cost curve
Abatement potentialMtCO2eper year
Reduce deforestation Reduce forest degradation Increase sequestration
Output overview
30
20
10
Irrigation small-scale
-13
Electric stoves
-14
Biogas stoves
-19
Intensification
-21
Fuelwood efficient stoves
-21
5
Afforestation/reforestation
47
Irrigation large-scale
120
LPG stoves
0 10
2
20 30
Forest management
1
40 50 60 70 80 90
Abatement costUSD per tCO2e
Woodlands management
110 120 130 140100
-20
-10
0
120
40
-30
INCLUDES SOCIETAL COSTS
The cost curve depicted in Figure 38 shows a wide range of abatement costs, which extend across both the negative and the positive areas.
■ Most of the levers aiming at reducing forest degradation and reducing deforestation by shifting into more efficient stove technologies and intensified, i.e., higher-yield, agriculture have a negative societal cost: The benefits (e.g., reduced costs for purchasing or collecting fuelwood) surpass the cost of implementing and operating these technologies.17
■ All levers aiming at increasing sequestration have a positive cost. For some levers, the costs are exceptionally high due to the investments needed for setting them up.
The total investment cost for all levers adds up to about USD 10 billion by 2030. This includes the initiatives to curtail deforestation, i.e., agricultural intensification and irrigation (which are discussed in more detail in the chapter on Soil-based emissions) that require the major part of this investment at over USD 6 billion.
17 One exception to this is LPG stoves, as the technology and fuel cost required by far surpass the savings from reduced fuelwood consumption. A more detailed evaluation of this can be found in the section “Forest levers 1-4 – Reduced forest degradation from improved cooking/baking technologies.
Federal Democratic Republic of Ethiopia 107

Climate finance can play an important contributing role if the abatement potential
is appropriately monetised, e.g., in a REDD+ arrangement.
Levers reducing deforestationSince these levers are mainly related to agricultural practices, they are described in more detail in the Soil chapter of this appendix.
Forestry levers 1-4 – Reduced forest degradation from improved cooking/baking technologiesFuelwood consumption is the main source of GHG emissions in Ethiopia. The wood is mainly used for residential baking and cooking purposes. As most of the households, particularly in rural areas, use highly energy-inefficient technologies (e.g., open fire or three-stone technology), the improvement potential here is huge. The dissemination of technologies leading to a reduction in fuelwood consump-tion, either by making more efficient use of it or by shifting to other, less carbon-intense fuels, can be a major lever for GHG abatement. The STC analysed different technologies:
■ Fuel-efficient stoves
– Baking stoves, such as the mirt for baking injera bread
– Cooking stoves, such as the tekikil for cooking
■ Fuel-shift stoves
– LPG stoves (mostly for cooking)
– Biogas stoves (mostly for cooking)
– Electric stoves and electric mitad (both cooking and baking – in rural areas without grid access, this can also include off-grid solar-powered stoves).
The pattern of stove usage varies between regions and according to cooking/ baking traditions. One common feature, however, is that most households need both a stove for cooking (sauces, coffee, etc.) and a stove for baking (injera). This is reflected in scale-up plans.
The total abatement potential has been calculated for each stove type based on the following information:
■ Maximum scale-up. In order to reflect differences in access and cost of alternative fuels/energy sources, the team distinguished between rural and urban
Federal Democratic Republic of Ethiopia 108

populations. The rates are based on a projection of GTP plans (particularly the
National Energy Network sectoral GTP review plan), several expert discussions, and cross-checks with other countries that have successfully disseminated efficient stoves. For 2030, the following scale-up targets were estimated (in percentage of rural/urban households respectively):
– Fuelwood-efficient stoves: 80% rural/5% urban (both cooking and baking)
– LPG stoves: 0%/5%
– Biogas stoves: 5%/1%
– Electric stoves: 5%/61% (weighted for cooking and baking).
The distribution between the different types of stoves will be refined during the phase of work detailing the implementation plan for this initiative.
■ Efficiency improvement. This indicates the percentage of fuelwood that can be saved by employing different technologies. The calculation is based on efficiency evaluations and testing data of the Ministry of Water and Energy as well as donor organisations active in the promotion of efficient stoves (e.g., GIZ). The potential savings are as follows:
– Fuelwood-efficient stoves: 50% (average for both cooking and baking)
– LPG stoves: 100% (cooking only)
– Biogas stoves: 100% (cooking only)
– Electric stoves: 100% (cooking and baking).
■ Emissions from alternative fuels. This takes into account the GHG emis-sions from alternative fuels used to substitute fuelwood.
– LPG stoves: Emission reduction of 89% due to the higher efficiency of LPG stoves (comparison of fuelwood emissions and LPG emissions based on IPCC combustion emission factors).
– Fuelwood-efficient biogas and electric stoves: Hardly any emissions (assum-ing that electricity will have near zero emissions from 2015 onwards when all electricity in the grid will be from renewable sources).
Introducing efficient stoves has two distinct effects on GHG emissions. First of all, it reduces forest degradation, with an impact of around 0.9 t biomass/year per household. Secondly, woody biomass acts as carbon sink, amounting to 2.1 t/year per household (if it is not burned). The effect of reduced degradation can be counted in at 100% (resulting in an abatement potential of 1.6 t CO2e/stove/year
Federal Democratic Republic of Ethiopia 109

under the assumption that reduced consumption first decreases direct degradation
before it affects the carbon sink). The reduction of emissions through the carbon sink effect does, however, need to be discounted by an adjustment factor to cap the total carbon sink potential of all stoves to the maximum estimated forest regeneration potential (and the gradual realisation of this potential over time). Employing this factor yields an additional abatement potential of 0.6 – 1.4 t CO2e/stove/ year, depending on the stove type.
The total abatement potential of stoves is nearly 51 Mt CO2e in 2030. At 34.3 Mt CO2e, the scale-up of fuelwood-efficient stoves contributes the largest share of this total potential, 14.0 Mt CO2e can be achieved from electric stoves, 2.3 Mt CO2e from biogas stoves, and 0.6 Mt CO2e from LPG stoves.
The abatement cost calculation also differentiates among stove types:
■ Stove cost. Stove cost varies by model and has been calculated using average prices of different quotes from disseminating agencies (e.g., MoWE, GIZ, and World Vision). The stove cost is accounted for as a capital expenditure and amortised over the average period of usage, depending on the model as well (based on experiences in Ethiopia and other countries). Costs and period of usage were calculated as follows:
– Fuelwood efficient stoves: USD 6 – 8; with an average durability of 5 years
– LPG stoves: USD 107; average durability 7 years
– Biogas stove (including digester infrastructure): USD 912; average dura-bility of 20 years (of the expensive and more robust digester infrastructure)
– Electric stove and electric mitad: USD 20 – 63; with an average durability of 7 years.
■ Programme cost. The team estimated the cost of the programme on a per stove basis. The calculation includes costs for product development and testing, training of manufacturers, promotion of the technology, administrative overhead, programme evaluation, and follow-up. The actual costs have been evaluated based on the experience of implementing organisations such as the Ministry of Water and Energy and GIZ and set at nearly USD 30 per stove on average.18 The programme costs have been accounted for as operating costs.
18 Although there is a significant cost reduction potential (to around USD 17 per stove), it has not been included in the evaluation since it has not been captured, yet. A detailed analysis has been carried out on the cost reduction and is contained in the detailed discussion document on rural energy.
Federal Democratic Republic of Ethiopia 110
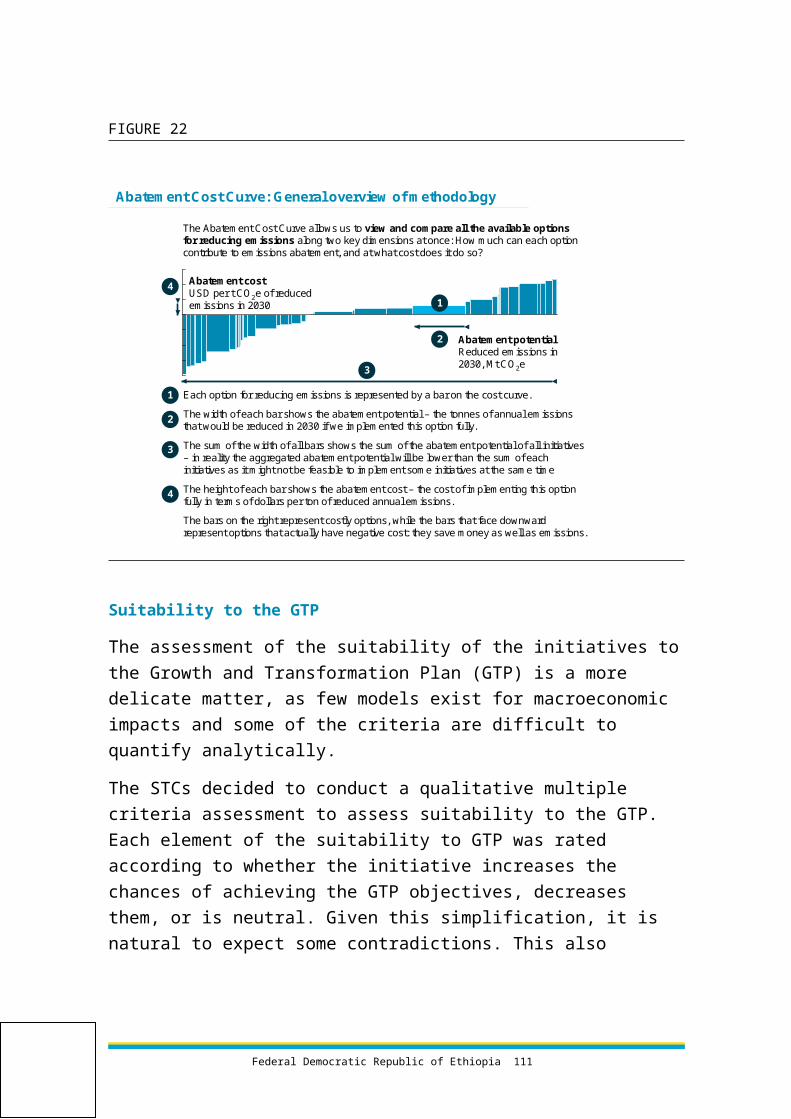
■ Fuel cost savings. In order to determine fuel cost savings, the team compared
average fuel expenditure before and after a technology change. The savings have been accounted for as (negative) cost.
Without accounting for the potential benefits for users of more efficient stoves, the cost of implementing the stove scale-up would be positive, e.g., around 8 USD/t CO2e for fuelwood-efficient stoves. Including the benefits, however, the cost becomes negative (money-saving over their lifetime) for most stoves types, with the figures ranging from USD -21 to USD -14. The only notable exception is the abatement cost for LPG stoves, which remains positive at USD 120, due to the (currently) more expensive fuel.
The cost estimate also confirmed the maximum scale-up assumptions ex-post: the stoves that deliver the highest negative cost, i.e., net savings, were estimated to have the highest scale-up rates (e.g., fuelwood-efficient stoves) and stoves with positive cost the lowest rate of scale-up (e.g., LPG stoves).
Since efficient stoves are such a significant abatement lever, the STC conducted a detailed analysis of their potential, the implementation cost, and dissemination models. For the most important results, please refer to the summary of the detailed analysis in the concluding chapter of the main part of this report.
Forestry lever 5 – Large- and small-scale afforesta-tion/reforestation and area closureAfforestation, reforestation, and area closure measures provide additional seques-tration opportunities. The total abatement potential for the year 2030 comes to around 32.3 Mt CO2e, with afforestation contributing 21.5 Mt CO2e and refores-tation 10.8 Mt CO2e.
The calculation of this potential is based on the following data and assumptions:
■ Afforestation/reforestation area. Based on consultations with forestry experts, existing afforestation/reforestation projects, and discussions in the STC, it was assumed that 2 million hectares of pastureland will be afforested up to 2030. At the same time, Ethiopia will reforest 1 million hectares of degraded areas.
■ Sequestration rate. The sequestration rate for both afforestation and refor-estation was set at 10.75 t CO2e/ha/year, a number directly taken from the afforestation/reforestation CDM project in Humbo.
Abatement cost adds up to around 5 USD/t CO2e:
Federal Democratic Republic of Ethiopia 111
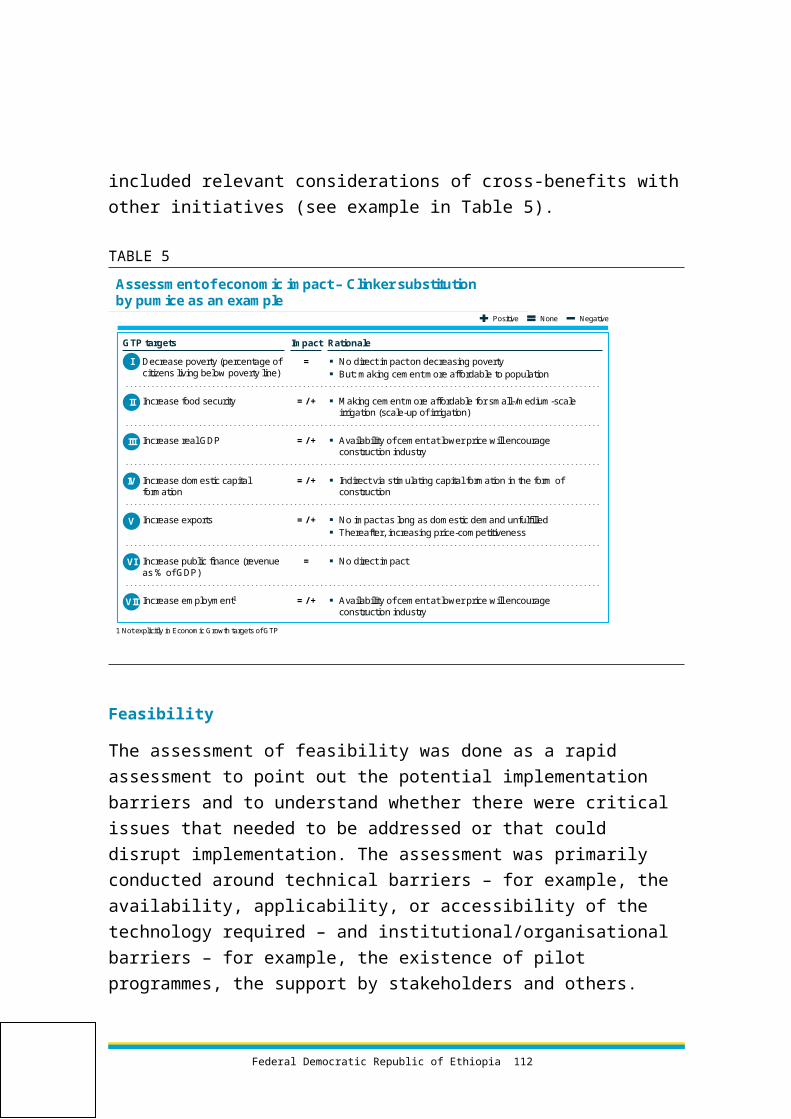
■ Planting material. Planting material costs 300 USD/hectare and is accounted
for as CAPEX with an amortisation period of 30 years (based on GHG standard methodology for afforestation/reforestation).
■ Nurseries. The team assumed that one nursery, costing USD 50,000, will be needed for every 5,000 hectares. Since a total of 30 nurseries will be needed, this amounts to a CAPEX investment of USD 1.5 million that will amortise over 30 years. A nursery also has operating costs of USD 10,000 per year. In addition, the team estimated USD 1 million in operating expenditures for annual research and development activities.
■ Operating cost for afforested/reforested areas. The management and care for afforested/reforested areas is – in consultation with experts – assumed to cost around 30 USD/ha/year.
■ Programme cost and additional operating expenditure. A programme cost of around 9 USD/ha/year is incurred over the first three years of afforesting/ reforesting. Other operating expenditures include monitoring costs (around 3 USD/ha/year) for all afforestation/reforestation areas, which was computed based on experiences from the Bale project.
■ Economic income effect. Sustainable forestry creates an income from timber and non-timber products, which has been estimated to be around 7 USD/ha per year (based on a possible value of 14 USD/ha/year as evaluated by forestry experts and a realisation factor of 50%).
Forestry lever 6 – Forest managementForest management boasts an abatement potential of nearly 10 Mt CO2e in 2030, with management of forests contributing 6.5 Mt CO2e and management of wood-lands 3.2 Mt CO2e. The abatement potential of these two levers was calculated in a very similar way, albeit using different assumptions on the following parameters:
■ Projected area coverage. Based on interviews with experts, experience from existing forest management projects, and discussions in the STC, the area for the management of forests and for the management of woodlands was set at 2 million hectares each.
■ Sequestration rate. Management of forests has a sequestration potential of 3.24 t CO2e/ha/year as international benchmarks indicate. Assuming that the management of woodlands has about 50% of that impact, the potential for this activity is around 1.62 t CO2e/ha/year.
Federal Democratic Republic of Ethiopia 112

These assumptions result in an abatement potential of 6.5 Mt CO2e from the man-
agement of forests and 3.2 Mt CO2e from the management of woodlands.
Abatement costs are around 1 and 2 USD/t CO2e for the management of forests and woodlands respectively:
■ Planting material. The direct cost of planting material will amount to around 30 USD/hectare. It is accounted for as CAPEX with an amortisation period of 50 years (based on standard GHG methodology for forest management).
■ Nurseries. Here it is assumed that one nursery, at the cost of USD 50,000, is needed for every 50,000 hectares. For a gradual scale-up, four nurseries will be needed, amounting to a CAPEX investment of USD 200,000. A nursery also incurs an operating cost of USD 10,000 per year. In addition, operating expenditures of USD 1 million were taken into account for annual research and development activities.
■ Operating cost for afforested/reforested areas. The management and care for project coverage areas cost 2 USD/ha/year.
■ Programme cost and additional operating expenditure. A programme cost of around 4 USD/ha/year is incurred over the first three years for the management of forests (50% of the cost for afforestation/reforestation) and 3 USD/ha per year for woodlands (total programme cost of 10 USD/hectare). Other operating expenditures include monitoring (1 - 2 USD/ha/year) for all areas.
■ Economic income effect. Sustainable forestry creates an income from timber and non-timber products, which has been estimated to be about 3.50 USD/ha per year (50% of benefits assumed in afforestation/reforestation).
ABATEMENT LEVERS – FEASIBILITY AND ECONOMIC IMPACT ASSESSMENT
Feasible levers with high impactThe initiatives that reduce forest degradation as well the ones that increase sequestration have comparably low implementation barriers:
■ Initiatives to reduce forest degradation. Most of the efficient cooking-stove technologies are readily available, have already been tested for applicability, and have been deployed on a large scale in Ethiopia. A number of governmental and donor organisations as well as the private sector have already been active in the dissemination of such stoves. This existing institutional infrastructure and
Federal Democratic Republic of Ethiopia 113

experience, as well as the grassroots level organisation of the governmental
institutions involved, can prove instrumental in scaling up the production and distribution effort. There are, however, potential barriers to the adoption of some of the technologies, for cultural reasons or for costs (particularly for LPG and biogas stoves), and the production of large volumes of high-quality stoves needs to be ensured.
■ Initiatives to increase sequestration. From a technical point of view, both afforestation/reforestation and forest management are highly feasible: They do not require any complicated technologies and have already been successfully tried in Ethiopia. In fact, there are several large projects for afforesta-tion/reforestation (e.g., Humbo CDM) and forest management (e.g., Participatory Forest Management projects) already ongoing – making the country one of the largest afforestation/reforestation areas on the continent. Large pilot projects for REDD+ are in the preparatory stages. A continuing forest data inventory might be helpful to ensure long-term success. In general, there appear to be no cultural or social barriers to implementation.
In addition, reducing forest degradation and increasing sequestration have a neu-tral or even positive impact on overall economic development.
■ Reduced forest degradation. Efficient stoves increase the available income of the relatively poor rural population, create employment, and improve health and gender equality. As the only potential socio-economic disadvantage, LPG stoves may increase dependence on imports of technology and fuel.
■ Increased sequestration. Afforestation/reforestation as well as forest man-agement levers might both lead to additional economic benefits by creating employment, income from sustainable forestry for the managing communities, a stronger link between forest industry and forest development, and eventually even increasing exports and public revenues. Additional benefits such as erosion control and other ecosystem services also speak for the implementation of these measures.
Taken together, the suggested forestry abatement levers not only appear to be without major barriers to implementation, but also seem to have strong socio-eco-nomic benefits beyond GHG abatement. The initiatives discussed should therefore not only be a prime focus of the CRGE strategy, but also amongst the first initia-tives for which implementation can start quickly and achieve fast success.
Federal Democratic Republic of Ethiopia 114

Other levers
The levers related to reduced deforestation (i.e., agricultural intensification (yield-increasing and emission-reducing techniques and new land through irrigation) are discussed in the chapter on Soil. They are evaluated as being highly feasible (yield-intensifying techniques and small-scale irrigation) to moderately feasible (large-scale irrigation).
ABATEMENT LEVERS – IMPLEMENTATION TIMELINE AND RESOURCE REQUIREMENTS
Implementation timeline On the basis of the abatement potential and feasibility assessment, the Forestry STC has selected three priority initiatives for particular attention and immediate implementation efforts. These initiatives are the scale-up of fuelwood-efficient stoves, afforestation/reforestation, and forest management (Figure 39). Significant scale-up of these initiatives is envisaged to start already at the beginning of 2012.
FIGURE 39
Forestry – Overview of timeline for implementation of initiatives
2012 2013 2014Q1 Q2 Q3 Q4 Q1 Q2 Q3 Q4 Q1 Q2 Q3 Q4
Implementation by Soil STC
Implementation by Soil STC
Activity
Irrigation
Agriculturalintensification
Forestmanagement
Afforestation/Reforestation
LPG stoves
Biogas stoves
Electric stoves
Fuelwoodefficient stoves
Selected as priority initiative
Other initiatives
Federal Democratic Republic of Ethiopia 115

In addition, the scale-up programmes for other stoves will also start in the course
of 2012. An exception is the programme for the scale-up of LPG stoves, which is envisaged to start only in 2013/14 in order to explore the availability of sufficient amounts of LPG within the country and thereby ideally avoid an increase of costly fuel imports. The initiatives summarised under agricultural intensification as well as large-, medium- and small-scale irrigation, that are described in more detail in the Soil chapter, also have planned starting dates in 2012. It is important to mention that these dates mark the start of the implementation, which for some initiatives is staged across several years (e.g., afforestation/ reforestation is staged across all 20 years up to 2030). The estimated project time includes some required preparatory work (e.g., development of investment plans), and is subject to approval by the respective authorities and the availability of funding. Hence, the full impact of the initiatives only occurs later in most cases.
Resource requirements The forestry initiatives (excluding agricultural intensification and irrigation pro-jects that are accounted for in the Soil chapter of this appendix) will require a total expenditure of nearly USD 7.9 billion in the long run (i.e., up to 2030). Out of this total amount, about USD 3.4 billion is capital expenditure and USD 4.5 billion is operating and programme expenditure. Around USD 1.2 billion of the expenditure will be necessary in the short term, i.e., up to 2015 (Figure 40). If the initiatives that reduce deforestation (agricultural intensification and irrigation) would be included in the cost estimation, the total expenditure would rise to more than USD 35 billion, USD 9 billion of which would be initial investments (up to 2015).
Federal Democratic Republic of Ethiopia 116

FIGURE 40
Forestry – Financial overview of all initiatives(not including soil initiatives)Million USD
Short-term: 2011-2015 Long-term 2011-2030
CAPEX1 additional
OPEX additional(excl. programme cost)
Programme cost
Savings/income
Abatement expenditurebefore carbon revenue 230
1,420
420
90
680
7,770
15,640
3,410
1,100
3,360
▪ Particularly efficient stoves yield returns higher than cost▪ Af-/Reforestation and forest management with high cost
9832702
1 Full capital expenditure, not amortized2 Aggregated abatement potential; expenditure per t CO2e not equivalent to abatement cost in cost curve, as the CAPEX abatement expenditure is not
annualized via amortization (rather: cash-flow perspective)
Mt CO2e total aggregated abatement potential
Mt CO2eabatement potential
On the other hand, since most of the initiatives, particularly the scale-up of fuel-efficient and fuel-shift stoves, entail high savings for the targeted population, the savings and/or additional income is expected to overcompensate this expenditure from a societal perspective. More precisely, this means that more than USD 1.4 billion savings/additional income can be generated in the short run up to 2015 and nearly USD 16 billion of savings/additional income can be achieved by 2030.
Classifying the initiatives by their return profiles (Figure 41), the fuel-efficient and fuel-shift stove initiatives (with the exception of biogas stoves) fall into the cate-gory of expenditure that yields a positive return (from a societal perspective) after less than five years. Due to the high upfront investment cost for the biogas digest-ers, biogas stoves yield a positive return, but only in the longer run. Although they might increase income from forestry for rural communities, the afforestation/ reforestation as well as forest management initiatives will not yield a positive return in the long run due to high investment and operating expenditure. Hence, these initiatives need to be supported by grant or pay-for-performance schemes.
As a range of programmes is already in progress in the Forestry sector, the scale-up initiatives should be able to build on a solid experience base.
Federal Democratic Republic of Ethiopia 117

FIGURE 41
Forestry – 68% of cost will have positive returns in the short or long run, but 32% will need grants or performance pay
Category CNo positive return,
grants/performance pay requirement
2,470
Category BPositive return, but long term financing
requirement
980
Category APositive return,
short term financingrequirement
4,400
Million USD, total cost1 Percent of total cost
56% 12% 32%
1 Including additional CAPEX, additional OPEX, and programme cost; not including soil initiatives (intensification and irrigation)2 NPV calculated with 6% discount rate
Definition Positive NPV2 of first five years of cash flow (from start of initiative)
Positive NPV2 of overall initiative (from start of initiative up to 2030), but not after first five years
Negative NPV2 of overall initiative (from start of initiative up to 2030)
Federal Democratic Republic of Ethiopia 118

LivestockLivestock are a significant contributor to the GDP of Ethiopia and are the main source of income for a large part of the society. Simultaneously, a large share of GHG emissions originates in the Livestock sector, and the sector is expected to expand even faster than population growth. To prevent the projected doubling of livestock-related emissions to 124 Mt CO2e by 2030, the Livestock STC identified five main levers that offer an abatement potential of 45 Mt CO2e to which climate finance projects could make a major contribution. These abatement levers are: enhancing and intensifying animal mix diversification (e.g., poultry, sheep, goats, fish, etc), improving value-chain efficiency for livestock belonging to farmers and pastoralists through regionally appropriate techniques, and increasing the use of mechanisation (small-scale and tractors) through techniques tailored to each type of terrain. A sixth, non-costed lever, rangeland management, provides an additional abatement potential of 3 Mt CO2e, resulting in a total abatement potential of 48 Mt CO2e in the Livestock sector.
SCOPE AND INSTITUTIONAL SETUP
The Livestock sector is a significant contributor of GHG emissions, with its contri-bution nearly doubling over the next 20 years if no measures are taken. The Livestock STC (Table 9) calculated current and future emissions and analysed abatement levers for several segments of the Livestock sector. The STC is composed of sectoral experts from the Environmental Protection Authority, the Ministry of Agriculture, the IBC, and the EWCA as well as the Ethiopian Institute of Agricultural Research.
Federal Democratic Republic of Ethiopia 119

TABLE 9
GHG EMISSIONS BASELINE IN 2010 AND BAU UP TO 2030
Livestock contribute to the livelihoods of 70% of Ethiopians, and the growth of this emissions source is thus tightly linked to population growth. Under the BAU scenario, emissions from livestock will increase from 65 Mt CO2e in 2010 to 124 Mt CO2e in 2030 (Figure 42).
Federal Democratic Republic of Ethiopia 120
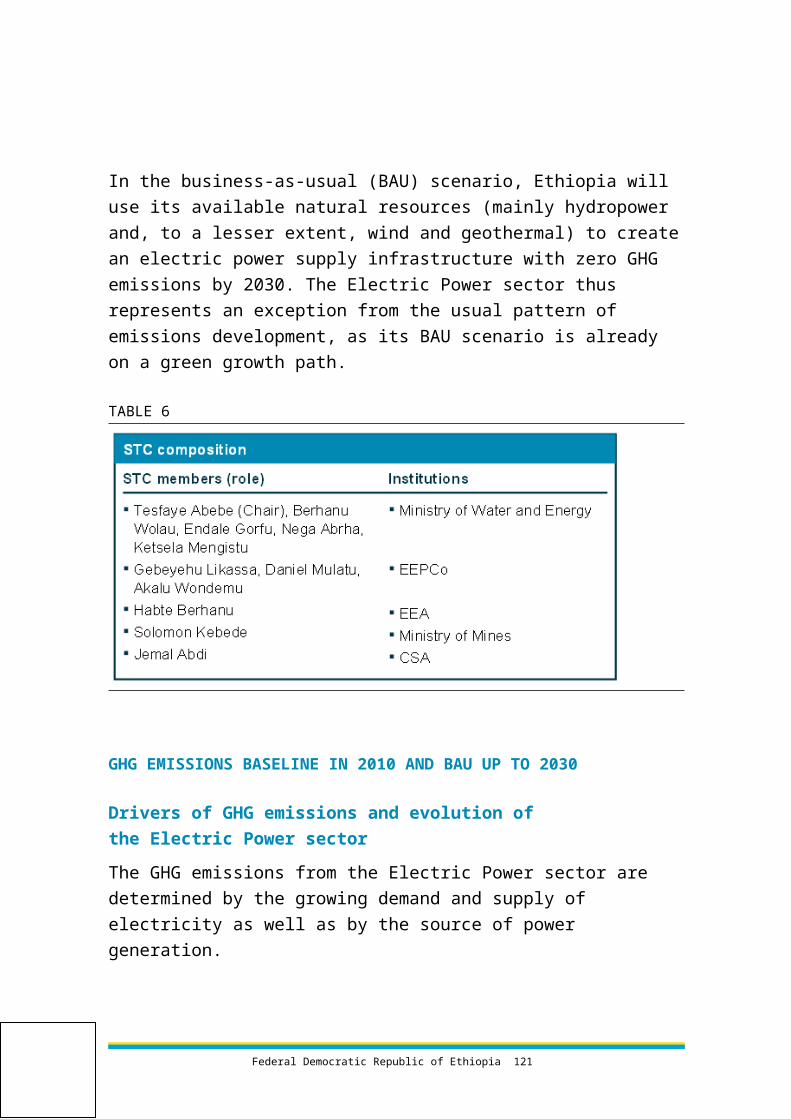
FIGURE 42
Livestock – CH4 emissions from livestock are projected to grow by over 100% by 2030 in the BAU scenario
BAU emissions estimationsMt CO2e/ year
N2O from manure left on pasture and range
CH4 from enteric fermentationand manure
BAU2030
124
12
112
BAU2020
94
11
83
Baseline2010
65
9
57
1 The emissions from manure used as fertiliser are accounted for in the Soil-based emissions STC
Main drivers of GHG emissionsThe main drivers of GHG emissions from the Livestock sector as well as the main assumptions about their impact and development are detailed below (Figure 43).
The STC separates the cattle population from other livestock populations as 84% of GHG emissions originates from cattle.
Federal Democratic Republic of Ethiopia 121

FIGURE 43
Increase in other species populationMillion tropical livestock units
Livestock – Estimation of changes with time of the main emission drivers
Output overview
6850
36
203020202010
Key emissionsdrivers Projected change Rationale
24
1511
203020202010
Increase in cattle populationMillion tropical livestock units
▪ 2008-11 growth rates from CSA projected until 2030
▪ Growth projected based on 2008-11 growth rates from CSA, progressively reduced to the rate of human population increase until 2030
■ Increase in cattle population. Over the last decades, the cattle population has grown at an even faster rate than the expansion of the human population. The CSA projects the latter to grow at a rate of 2.62% annually, which will add 54 million people to the population by 2030. The demand from this growing population is likely to cause the cattle population to almost double over the next 20 years from 36 to 68 million tropical livestock units (a common ratio used to compare different species of livestock against each other) or 51 to 95 million head of cattle, leading to higher GHG emissions.
■ Increase in population of other livestock. The population of other species of livestock is growing at a slightly faster rate than the cattle population. The STC included the following species in its analysis: sheep, goats, horses, mules, asses, poultry, and camels. The combined population of other livestock is expected to grow from 11 million tropical livestock units in 2010 to 24 million tropical livestock units in 2030.
Federal Democratic Republic of Ethiopia 122

GHG emissions baseline and BAU projection for 2030
Emissions from livestock are projected to increase from 65 Mt CO2e in 2010 to 124 Mt CO2e in 2030, mainly driven by an increase in methane released during digestion, called enteric fermentation, and the decomposition of manure in storage – which are likely to account together for 90% of livestock emissions in 2030. Nitrous oxide released during decomposition of manure left on pasture range and paddock account for only 10% of livestock emissions in 2030.
■ Enteric fermentation and manure management. Driven primarily by a growing cattle population (84% of emissions in this category), emissions from enteric fermentation and decomposition of manure in storage will grow from 57 Mt CO2e in 2010 to 112 Mt CO2e in 2030.
■ Manure left on pasture range and paddock. Driven by an increase in the livestock population and dominated specifically by the increase in cattle, GHG emissions from manure left on pasture range and paddock will increase from around 8.6 Mt CO2e to 12 Mt CO2e in 2030.
ABATEMENT LEVERS – POTENTIAL AND COST CURVE
In total, an abatement potential of up to 48 Mt CO2e in 2030 has been identified in six abatement levers (Figure 44). These levers can be clustered into four groups:
■ Enhancing and intensification of animal mix diversification. Low-emitting animals (poultry, sheep, goat and fishery) are high feed converters and low GHG emitters as compared to large ruminants (including cattle and camels). These animals are high protein suppliers as well as high sources of income for the rural population. This initiative supports the increase in production and consumption of lower-emitting species by acting both on supply and demand aspects. The primary element of the animal mix lever is increasing poultry to 30% of meat consumption by 2030. This initiative has the largest abatement potential in the Livestock sector, amounting to 17.7 Mt CO2e in 2030.
■ Value chain efficiency improvements (pastoralists and farmers). These two levers aim to increase efficiency across the animal value chain for pastor-alists and farmers. Increased productivity should be obtained by introducing more productive breeds, providing high-quality feed and other essential inputs, improved technology and public infrastructure, and a higher off-take rate (decreasing the age at which livestock is sold). Currently, Ethiopia's livestock suffer from low production levels and poor reproductive performance. This is exemplified by poor feed conversion efficiency, poor daily weight gain, low milk
Federal Democratic Republic of Ethiopia 123

and meat yield, low off-take rates, low conception and calving rates, longer
calving intervals, and high mortality. Value chain efficiency improvements aim to improve this performance. These levers have a combined abatement potential of 16.1 Mt CO2e in 2030.
■ Mechanisation (small scale and large scale). These two levers will intro-duce and promote mechanical equipment (e.g., manual tools and tractors) for ploughing/tillage to partially substitute for animal draught power among farmers in the highland plains. New techniques and improved tools will be introduced to increase work efficiency and thereby reduce demand for oxen. These levers have a combined abatement potential of 11.2 Mt CO2e in 2030.
■ Rangeland and pastureland management. This lever is aimed at introducing and promoting appropriate techniques to increase soil carbon content and the productivity of pastureland in highland areas and rangeland within pastoral areas. The main activities here include bush clearing, reseeding, paddocking, rotational grazing, improving and adoption of traditional ways of managing rangelands, and water point development. This lever has an abatement potential of 3 Mt CO2e.
FIGURE 44
Livestock – Abatement potential until 2030 is 48 Mt CO2e per year
0
20
40
60
80
100
120
140
2010 20252020 20302015
Expected emissions after abatement
Mt CO2e reductionpotential up to 2030
Abatement measuresMt CO2e/year in 2030
BAU and abatement potentialMt CO2e/ year
BAU emissions: 124 Mt5
Pastoralist animalvalue chain efficiency
18 Enhancing animal mix
11Farmer value chainefficiency improvement
4 Large-scale mechanisation
7 Small-scale mechanisation
Σ 48
3 Rangeland and pasturelandmanagement
Federal Democratic Republic of Ethiopia 124

FIGURE 45
Livestock – Most of the initiatives have positive costs, but enhancing animal mix is below the USD 15 mark
19.8
7.6
453525155 40
20.0
10
Abatement potentialMt CO2e per year
30
25
20
15
10 300
20
Abatement costUSD per tCO2e
0
26.0
29.4
5
Enhancing animal mix (poultry)
Value chain efficiency (pastoralists)
Mechanisation (small scale)
Mechanisation (tractors)Value chain efficiency
(farmers)
Value chain efficiency Diversify animal mix (poultry) Mechanisation of draught power
Output overview
Abatement opportunities cost curve
The cost curve in Figure 45 depicts the range of abatement costs for livestock ini-tiatives.
The total investment cost that is required for all initiatives in the Livestock sector up to 2030 is about USD 17.5 billion, to which climate finance can make an important contribution.
Livestock lever 1 – Enhancing and intensification of diversifying animal mixBeef is the primary meat consumed in Ethiopia, and the demand for beef is a major driver of the size of the cattle population. Beef production is far more carbon intensive than the production of other types of meat. Poultry – specifically chicken meat – offer a particularly attractive lower-carbon alternative to beef. However, at only 15% of total meat consumption, chicken consumption is currently low compared with other countries. The STC estimates that this share could be increased to 30% by 2030 through both supply- and demand-side activities to
Federal Democratic Republic of Ethiopia 125

promote poultry, resulting in an abatement potential of 17.7 Mt CO2e in 2030.
This figure is based on the following considerations:
■ Programme coverage. The STC proposes a programme covering 17.6 mil-lion households by 2030.
■ Meat consumption. Meat consumption is expected to be 20 kg/person/year in 2030 based on the elasticity of meat consumption to per capita GDP according to analysis conducted by the STC using FAO statistics on per capita meat consumption and World Bank statistics on per capita income.
■ Emissions from meat production. The STC calculated emissions from cattle and chickens using the following assumptions:
– Emissions per animal (tonnes of CO2e per year): 1.08 (cattle), 0.0056 (chickens).
– Annual off-take rate from population held for meat production: 20% (cattle), 300% (chickens).
– Average weight of meat per animal (kg): 120 (cattle), 2 (chickens).
■ Animal substitution. To increase the chicken share of meat consumption to 30% by 2030, the chicken population would need to increase by 70 million. This would substitute for nearly 17 million head of cattle. The additional emissions in 2030 from the increased chicken population will amount to 0.4 Mt CO2e, which has been factored into the abatement potential of this initiative.
The abatement cost of this initiative is approximately 8 USD/t CO2e, based on the following assumptions:
■ Supporting costs include investments in the following areas:
– Feed processing plants: USD 12,500 per plant, on average five plants per region (45 in total).
– Mini-hatcheries: capacity of 10,000 eggs at a time, costing USD 31,250 per facility, on average five facilities per region (45 in total).
– Grandparent farm (farm that produces parent chickens for other farms): one farm at the national level costing USD 1 million to establish.
– Poultry slaughter and processing units: USD 500,000 per unit, on average five units per region (45 in total).
■ Programme costs of USD 10 million to establish the programme, USD 6 per household annually to operate the extension programme, USD 1 million annually
Federal Democratic Republic of Ethiopia 126
to run poultry production and consumption promotion to convince the population
to produce and consume poultry products, and USD 1 per household annually to maintain and monitor the programme.
■ Research expenses of USD 1 million annually.
■ Economic benefits based on new job creation related to poultry of 1,800 full-time employees by 2030, valued at USD 400 per job/year.
Livestock lever 2 – Value chain efficiency improve-ments (pastoralists)This initiative reduces headcount and lowers per animal emissions in pastoralist herds through higher productivity and off-take rates at early ages. Sub-components include commercialisation, improved health services, improving market efficiency and infrastructure, strengthening linkages to neighbouring medium-highlands feedlot systems, promoting the sale of animals when they are young, improved early-warning systems for extreme weather conditions, breed improvement through selection, and improved feed and feeding systems for a sub-group of pastoralists. This programme will build on the existing government plans to strengthen the livestock extension system. The abatement potential from this ini-tiative comes from two sources: the reduced cattle population and lower emissions per animal due to better feeding, health, and management. The total abatement potential that has been calculated for the year 2030 is around 4.9 Mt CO2e. The calculation of this potential is based on the following information:
■ Programme coverage. The proposed productivity-improving programme would reach 1.95 million households by 2030 (100% of the pastoralist popu-lation), aside from better feeding techniques, such as improving forage quality and supplementation, which would reach 20% of pastoralists. This 20% takes into account the costs and implementability issues related to improved feed and feeding systems.
■ Programme impact. The proposed programme would increase annual productivity growth to 4.5%, and product value growth due to quality improvements to 4.0%, thus reaching the target GDP growth rate of 11.1% annually with a smaller cattle population (reduction of approximately 4 million head by 2030). Better feeding techniques introduced to 20% of the pastoralist herd would increase per animal productivity and reduce emissions from cattle reached by a further 10% per animal.
The abatement cost is calculated at around 20 USD/t CO2e, incorporating:
Federal Democratic Republic of Ethiopia 127

■ Direct costs related to cattle (e.g., feed, health services) totalling USD
10/head/year, and distribution and marketing costs amounting to USD 0.50/head/year.
■ Supporting costs include investments in:
– Abattoirs: USD 1 million per facility, 16 facilities in total.
– Animal Health Facilities: USD 1 million per facility, 32 facilities in total.
■ Programme costs of USD 10 million to set up the programme, USD 3 per head of cattle/year in ongoing programme expenses, and USD 0.40 per head of cattle/year in monitoring and programme management costs.
■ Research expenses to establish four research centres at USD 1.8 million each, and USD 638,000 in annual research costs per centre.
■ Economic benefits based on the reduction of cattle due to the improved productivity and value growth rates of cattle (4.5% and 4.0% per year respectively), an average animal sales price of USD 350, and an average animal lifespan of 10 years.
Livestock lever 3 – Value chain efficiency improve-ments (farmers)This initiative reduces headcount and lowers per animal emissions for cattle belonging to farmers through higher production (e.g., milk, meat) per animal and will increase off-take rates of non-dairy cattle at an early age. Example sub-com-ponents include improved feedlots, indigenous livestock cross-breeding (mainly using artificial insemination techniques), improved health services, improved market efficiency through the establishment of milk collection and processing centres in strategically selected milk shed areas, increased dairy value chain efficiency through aggregation of smallholder production in cooperatives, as well as supply of improved feed and feeding systems for a sub-group of farmers. This programme will build on the existing government plans to strengthen the livestock extension system. The abatement potential from this initiative comes from two sources: a reduced cattle population and lower emissions per animal due to better productivity and production. The total abatement potential that has been calculated for 2030 is around 11.2 Mt CO2e. The calculation of this potential is based on the following programme coverage and impact assumptions:
■ Programme coverage. The proposed productivity-improving programme would reach 17.6 million households by 2030 (90% of the rural population), and
Federal Democratic Republic of Ethiopia 128

25% of farmers with full impact from better feeding techniques (quality feed,
treatment of crop residue used for feeding, supplementary feed, and forage crop production). This 25% takes into account the costs and implementability issues related to improved feed and feeding systems. Among the farmers to be addressed, the main focus group is business-oriented farmers near market areas.
■ Programme impact. The proposed programme would increase annual productivity growth to 4.5%, and value growth to 4.0%, thus reaching the target GDP growth rate of 11.1% annually with a smaller cattle population (reduction of approximately 13.5 million head by 2030). Although best practices in feeding (e.g., feedlots, supplementation) may increase daily methane emissions per animal, emissions per kilogram of product (e.g., meat and milk) are reduced. The STC estimates that such better feeding techniques would reduce emissions from cattle reached by 10% through improved per animal productivity.
The abatement cost is calculated at around 26 USD/t CO2e, incorporating:
■ Direct costs related to cattle (e.g., feed, health, and artificial insemination services) totalling USD 10/head/year, and distribution and marketing costs amounting to USD 0.50/head/year.
■ Supporting costs include investments in:
– Abattoirs and refrigerated storage: USD 1 million per facility, 37 facilities in total by 2030.
– Health facilities: USD 1 million per facility, 73 facilities in total by 2030.
– Artificial insemination centres, including liquid nitrogen production facili-ties: USD 1.5 million per facility, 73 facilities in total by 2030.
■ Programme costs of USD 10 million to set up the programme, USD 3 per head of cattle/year in ongoing programme expenses, and USD 0.40 per head of cattle/year in monitoring and programme management costs.
■ Research expenses to establish 20 research centres at USD 1.8 million per facility, and USD 3.2 million in total annual research costs.
■ Economic benefits based on the reduction of cattle due to the improved productivity and value growth rates of cattle (4.5% and 4.0% per year), an average animal selling price of USD 350, and an average animal lifespan of 10 years.
Federal Democratic Republic of Ethiopia 129

Livestock lever 4 – Mechanisation (small scale)
This initiative introduces techniques to increase work efficiency so that the demand for oxen is reduced, and has an abatement potential of 7.3 Mt CO2e in 2030. Small-scale mechanisation (techniques and improved tools) can reduce the need for animal draught power, thereby lowering the oxen population and reducing emissions from livestock. The abatement potential of this lever was calculated using the following assumptions:
■ Programme coverage. This initiative will target 50% of total farmer house-holds, including a large portion of farmers in highland areas.
■ Programme impact. The STC estimated that 77% of farmers hold cattle, and 50% of draught power can be substituted by small-scale mechanisation. Households are assumed to hold an average of two oxen. This leads to a total number of oxen substituted of 6.7 million by 2030. Emissions per head of cattle are estimated at 1.08 t CO2e per year.
The abatement cost is calculated to be around 20 USD/t CO2e. This abatement cost incorporates:
■ Household expenses, including a one-time capital expenditure of USD 188 per household, USD 9 per household/year for distribution, and USD 19 per household /year for maintenance and replacement.
■ Supporting costs include the following investments:
– Training centres for manufacturers. USD 10,000 to establish each centre, USD 4,000 per centre per year in operating costs, one centre per 100,000 households.
– Production facilities. Initial investment of USD 1,000 per facility to kick-start production, USD 400 per facility per year in operating costs, one facility per 1,000 households.
– Advertisement. USD 1 million per year.
■ Programme costs of USD 1 million for programme setup, USD 6 per house-hold/year in operating costs, and USD 1 per household/year in programme management and monitoring.
■ Economic benefits based on the reduced need for animal draught power of 4 million oxen by 2030, an average animal selling price of USD 350, and an average ox lifespan of 10 years.
Federal Democratic Republic of Ethiopia 130

Livestock lever 5 – Mechanisation (large scale)
This initiative introduces techniques to increase work efficiency so that the demand for oxen is reduced, and has an abatement potential of 3.9 Mt CO2e in 2030. Large-scale mechanisation (tractors) can reduce the need for animal draught power, thereby lowering the oxen population and reducing emissions from livestock. The abatement potential of this lever was calculated using the following assumptions:
■ Programme coverage area. This initiative will target 25% of total farmer households (4.4 million households), drawn primarily from the highlands where the oxen ownership rate is high, and the topography enables the use of tractors.
■ Programme impact. The STC estimated that 77% of farmers hold cattle, and 60% of total draught power can be substituted by large-scale mechanisation. Households are assumed to hold an average of two oxen. This leads to a total number of oxen substituted of 4.0 million by 2030. Emissions per head of cattle are estimated at 1.08 t CO2e per year, while emissions per tractor are estimated to be 10.31 t CO2e per year.
The abatement cost is calculated to be around 29 USD/t CO2e, incorporating four main components:
■ Household expenses, including a one-time capital expenditure of USD 10,000/unit (100 households per unit), 500/unit/year in distribution costs (5 households per unit), 2,000/unit/year for running costs including fuel, insur-ance, etc. (20 households per unit), and 1,500/unit/year for maintenance and replacement (15 households per unit).
■ Supporting costs, including investments in tractor maintenance centres, at USD 50,000 to establish each centre, and one centre per 500 tractors.
■ Programme costs of USD 1 million for programme setup, USD 12/house-hold/year in operating costs, and USD 2/household/year in programme management.
■ Economic benefits based on the reduced need for animal draught power of 4 million oxen by 2030, an average animal selling price of USD 350, and an average ox lifespan of 10 years.
Federal Democratic Republic of Ethiopia 131
Livestock lever 6 – Rangeland and pastureland
managementThis initiative aims to introduce techniques to increase soil carbon content and improve productivity of pastureland in highland areas and rangeland within pastoral areas. The main activities include bush clearing, reseeding, paddocking, rotational grazing, improving and adoption of traditional ways of managing rangelands, and water point development. The total abatement potential for this lever is 2.7 Mt CO2e in 2030.
■ Programme coverage area. The initiative aims to reach 5 million hectares of rangeland and pastureland in total, i.e., 2.5 million hectares of pastureland will be reached in the highlands, while 2.5 million hectares of rangeland will be reached in the lowlands. Programme coverage will be developed linearly over the years.
ABATEMENT LEVERS – FEASIBILITY AND ECONOMIC IMPACT ASSESSMENT
Feasible levers with high impactThree of the levers in the Livestock sector were evaluated to have comparably low barriers to implementation. These levers fall into the following two categories:
■ Enhancing and intensification of animal mix diversification. The technologies related to this initiative are readily available and most have been tested for applicability in Ethiopia. Feed processing plants are expanding beyond Addis Ababa, and vaccines are produced locally for most epidemic diseases. Also, from the institutional perspective, there is a relatively strong capacity within and support from the extension system, the commercial poultry sector, and research institutions. Poultry-raising also requires a small initial investment by producers and therefore entails limited financial risk. One key barrier is the lack of a chicken grandparent farm in Ethiopia. Another potential barrier is cultural practices around chicken consumption, which is currently quite low, especially due to the long preparation time of traditional chicken recipes. National consumption promotion may overcome this, but the feasibility of this will have to be tested.
■ Value chain efficiency (pastoralists and farmers). The two initiatives related to improving animal value chain efficiency (for pastoralists and farmers) are both generally feasible. Most technologies related to these initiatives are available and can be transferred easily to households through the existing
Federal Democratic Republic of Ethiopia 132
government agricultural extension system. These abatement levers also enjoy
strong institutional support, including a prioritisation of the sector at the federal government level. Key barriers include the need to improve local supporting institutions (animal health posts and clinics, regional labs, etc.) and reluctance among pastoralists to switch to improved breeds or reduce herd size.
There are some additional challenges with regard to value chain efficiency implementation for pastoralists. There will need to be a system in place to increase their awareness of the programme. Existing extension and service deliv-ery systems to pastoralists may be leveraged to ensure their participation. Exist-ing government programmes such as the Pastoral Community Development Pro-gramme can also be used.
Regarding socio-economic impact, all three of these levers have been evaluated to have a positive contribution to overall economic development.
Other leversThe small-scale mechanisation and large-scale mechanisation (tractors) initiatives were both judged to be moderately feasible due to the lower availability of tech-nology, the ability of farmers to afford this technology, and the suitability of the technologies to the land use in Ethiopia. Rangeland management is considered to be technically feasible but is challenged by relatively low direct economic bene-fits. Other abatement levers that were considered but not quantified due to limited expected abatement potential or implementability include:
■ Improved manure management using a wide range of activities, including proper drying to avoid methane emissions related to aerobic fermentation and use as fertiliser or biofuel.
■ Improved rumen ecology to lower per animal emissions (via use of additives, manipulation of rumen flora, and vaccination against methane-producing organisms). This abatement lever would change the internal digestion process of the animal. Vaccinations against methane-producing organisms have been successfully implemented in other countries, and a research budget is available to observe the local potential in Ethiopia.
■ Switching to lower-emitting cattle breeds.
■ Reduced emissions from equines due to better road networks.
■ Small-scale processing plants/ technologies that could improve livestock pro-ductivity.
Federal Democratic Republic of Ethiopia 133
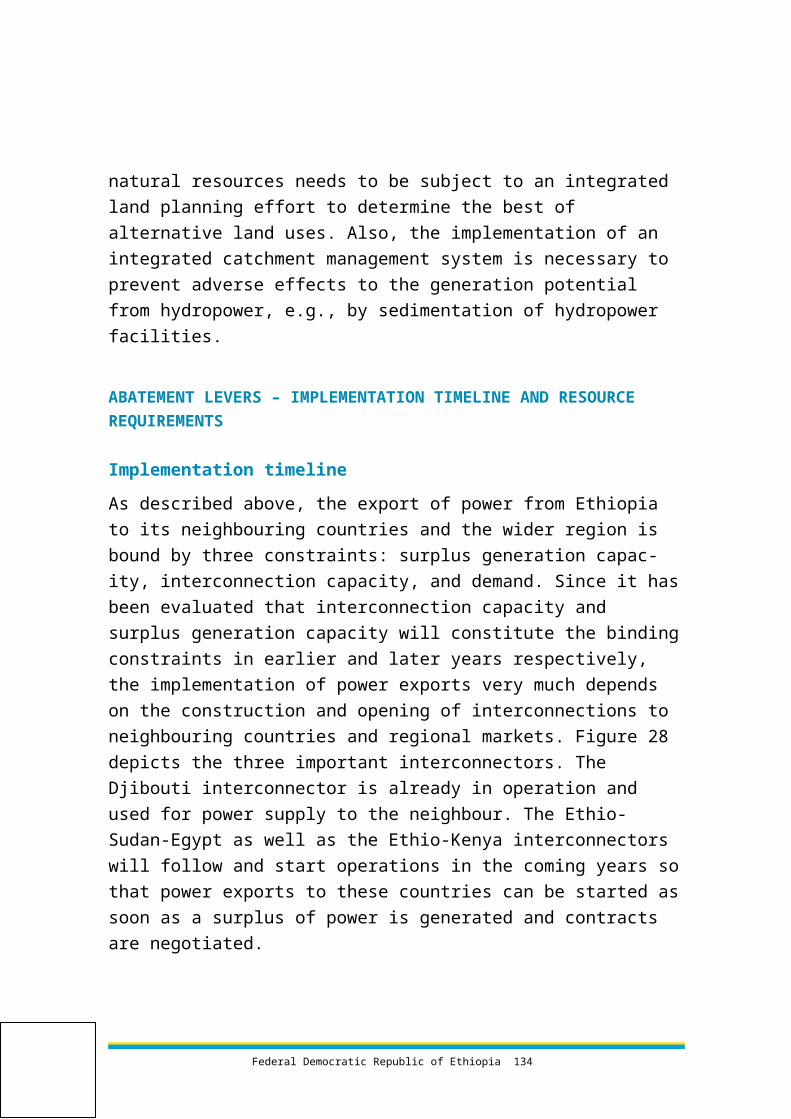
■ Value chain efficiency and productivity improvements in other livestock,
such as sheep, goats, and camels. These initiatives would be similar to the cattle initiatives above.
ABATEMENT LEVERS – IMPLEMENTATION TIMELINE AND RESOURCE REQUIREMENTS
Implementation timelineThe STC has determined five prioritised levers based on abatement potential and implementability. These levers are enhancing and intensification of diversifying the animal mix, value chain efficiency improvements for pastoralists and farmers, and large-scale and small-scale mechanisation (Figure 46). All the initiatives are envisaged for implementation in the near future. Rangeland management is envisaged to take off simultaneously. The implementation of the levers is assumed to follow a phased approach, with the programme reach developing linearly over the years. While technically feasible, the immediate start of the initiatives is dependent on sufficient available funds. It is also important to keep in mind that these dates mark the start of the implementation, which includes some required preparatory work (e.g., development of investment plans), and is subject to approval by the respective authorities. Hence, the full impact of the initiatives only occurs later in most cases.
Federal Democratic Republic of Ethiopia 134

FIGURE 46
Livestock – Overview of timeline for implementation of initiatives
2012 2013 2014 2015Q1 Q2 Q3 Q4 Q1 Q2 Q3 Q4 Q1 Q2 Q3 Q4 Q1 Q2 Q3 Q4Activity
Small-scale mechanisation
Rangeland/pasturelandmanagement
Large-scale mechanisation
Farmer value chain efficiency
Pastoralist animal value chain efficiency
Enhancing animal mix
Selected as priority initiative
Other initiatives
Resource requirements and existing projectsThe livestock initiatives will cost USD 17.5 billion in the period from 2011 to 2030. Most of this is operating expenditure (USD 10.6 billion) and programme costs (USD 4.4 billion). The expenditure until 2015 is USD 1.8 billion, with all of the costs occurring after 2011 when all the initiatives are started (Figure 47).
Federal Democratic Republic of Ethiopia 135
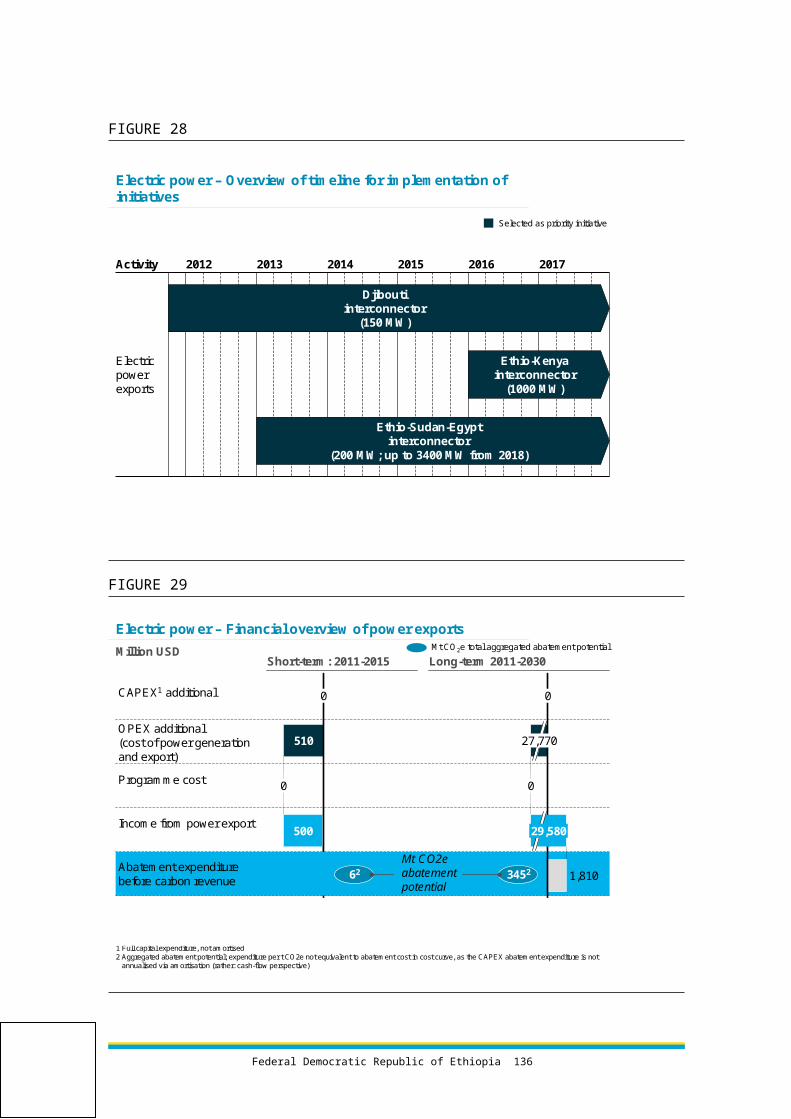
FIGURE 47
Livestock – Financial overview of all initiativesMillion USD
Short-term: 2011-2015 Long-term 2011-2030
CAPEX1 additional
OPEX additional(excl. programme cost)
Programme cost
Savings/income
Abatement expenditurebefore carbon revenue -944
814
344
775
640
-7,566
9,968
4,401
10,590
2,543
▪ The expenditure for all the livestock levers outweighs the savings; external financing is needed
4752352
1 Full capital expenditure, not amortised2 Aggregated abatement potential for the given period; expenditure per t CO2e here is not equivalent to the abatement cost in the cost curve as the CAPEX
abatement expenditure is not annualised via amortisation (the analysis here takes the cash-flow perspective)
Mt CO2e total aggregated abatement potential
Mt CO2eabatement potential
The societal cost savings amount to USD 0.8 billion in the period from 2011 to 2015 and USD 10 billion in the period from 2011 to 2030. Even though these cost savings are quite large, they do not finance the total expenditures. Long-term financing will be vital to get these initiatives off the ground as will be clear in the following classification.
Figure 48 shows a categorisation of the different initiatives. None of the initiatives within the Livestock sector has a positive net present value (category C). This means that they cannot be financed by normal loans or other forms of market-based long-term financing. Instead, they require carbon finance and/or perform-ance-based grants (similar to those currently considered for the REDD scheme).
There are currently multiple programmes in place to tackle sustainable develop-ment and related issues in the Livestock sector. The suggested initiatives can build on the positive outcome of these programmes.
Federal Democratic Republic of Ethiopia 136

FIGURE 48
Livestock – All of the initiatives require carbon finance and other forms of performance-based grants
Category CNo positive return,
grants/performance pay requirement
17,534
Category BPositive return, but long-term financing
requirement
0
Category APositive return,
short-term financingrequirement
0
Million USD, total cost1 Percent of total cost
0% 0% 100%
1 Including additional CAPEX, additional OPEX, and programme cost2 NPV calculated at 6% discount rate
Definition Positive NPV2 of first five years of cash flow (from start of initiative)
Positive NPV2 of overall initiative(from start of initiative up to 2030), but not after first five years
Negative NPV2 of overall initiative(from start of initiative up to 2030)
Federal Democratic Republic of Ethiopia 137

SoilSoil-based GHG emissions are significant and come from three main sources: 58% from using synthetic fertilisers; the rest from applying manure to cropland and reintroducing crop residues into the soil. In the business-as-usual (BAU) scenario, emissions from soil will increase to 61 Mt CO2e in 2030. A 9.5% annual growth rate of crop GDP will be necessary to sustain population growth, provide food security, and help achieve middle-income status by 2025. Both the business-as-usual and green growth emission scenarios take this growth in crop GDP as an assumption. The Soil STC identified an abatement potential of 78 Mt CO2e in 2030 from four levers, which require a total estimated investment of USD 30.5 billion. Two of the soil levers will be implemented jointly: promotion of lower-emitting techniques for crop cultivation and crop-yield-increasing techniques. The abatement potential of the third and fourth levers will be achieved through reduced deforestation by creating new agricultural land from non-forested areas through small- and large-scale irrigation. The two levers amount to a total of 38 Mt CO2e in abatement potential, all of which is accounted for in the forestry chapter.
SCOPE AND INSTITUTIONAL SETUP
The Soil sector is a significant contributor of GHG emissions, with its role set to further increase if no measures are taken. The Soil STC (Table 10) calculated current and future emissions from growing crops and analysed four abatement levers. Emissions from deforestation due to agricultural land expansion have been accounted for by the Forestry STC. The Soil STC is composed of several sectoral experts from the Environmental Protection Authority, the Ministry of Agriculture, and the Ethiopian Institute of Agriculture Research.
Federal Democratic Republic of Ethiopia 138

TABLE 10
Federal Democratic Republic of Ethiopia 139

GHG EMISSIONS BASELINE IN 2010 AND BAU UP TO 2030
The Soil sector includes three sources of emissions: crop reintroduction, synthetic fertiliser use (direct and indirect emissions), and manure applied to cropland. The Soil STC projected emissions from these sources based on four main emission drivers, including growth in total crop production, growth in synthetic fertiliser
used per hectare, growth in hectares cultivated, and growth in the population of livestock (to estimate the manure applied to cropland). The GDP from crops will need to grow at 9.5% annually to sustain population growth, provide food security, and help achieve middle-income status by 2025. This growth rate was used in both the BAU and the green growth scenarios, but with varying constituent growth rates for total cultivated area, yield, and value (USD/t of crops). In the BAU scenario, yield and value growth rates were projected using historical trends in Ethiopia. Under the BAU scenario, soil-based emissions will increase from 12 Mt CO2e in 2010 to 61 Mt CO2e in 2030 (Figure 49).
FIGURE 49
Soil – Emission levels are projected to increase up to 2030 by 508% under a business-as-usual scenario
Output overviewMt CO2e/ year
5
10
BAU2020
N2O from manure used as fertiliser
N2O from syntheticfertilisers
N2O from cropsresidue
BAU2030
61
16
35
Baseline2010
32
10
12
54
18
3
Federal Democratic Republic of Ethiopia 140

Main drivers of GHG emissions
The main drivers of GHG emissions from the Soil sector as well as the main assumptions about their impacts and development are detailed below (Figure 50). Other emission drivers that could have been included in the Soil sector are wet-lands, which are a significant source of methane, and tillage practices, which might form a large source of emissions as well. Due to the nature of the abatement levers, these emission drivers were excluded from the BAU calculations for the moment.
FIGURE 50
Synthetic fertiliser/hectarekg/hectare
Soil – Estimation of changes with time of the main emission drivers
Output overviewKey emissions drivers Projected change Rationale
▪ Crop production projection based on report by Dorosh(2007)
Total crop productionMillion tonnes
▪ Fertiliser/hectare targets based on similar land in India (World Bank data)
Hectares cultivatedMillion hectares
▪ Growth rate based on GTP, extrapolated to 2030 assuming no measures taken to increase agricultural yield/hectare
20302010 2020
7136
19
247155
65
203020202010
271913
2010 20302020
926547
2010 2020 2030
Increase in livestock populationMillion tropical livestock units
▪ 2008-11 growth rates from CSA projected until 2030
■ Total cereal crop production is expected to increase from 19 million tonnes in 2010 to 71 million tonnes in 2030. Cereal crops residues are regularly reintroduced in the soil (composting) and therefore form a good proxy for what drives the total amount of residue reintroduction into the soil. The growth rate is based on the average of 2011-2015 GTP growth rates for total cereal crop production. Based on IPCC methodology, the reintroduction factor for each crop included in the total cereal crop production was determined to be around 75% resulting in an estimate for total residue reintroduction. This 75% does not take into account local conditions and will need to be refined over the coming
Federal Democratic Republic of Ethiopia 141
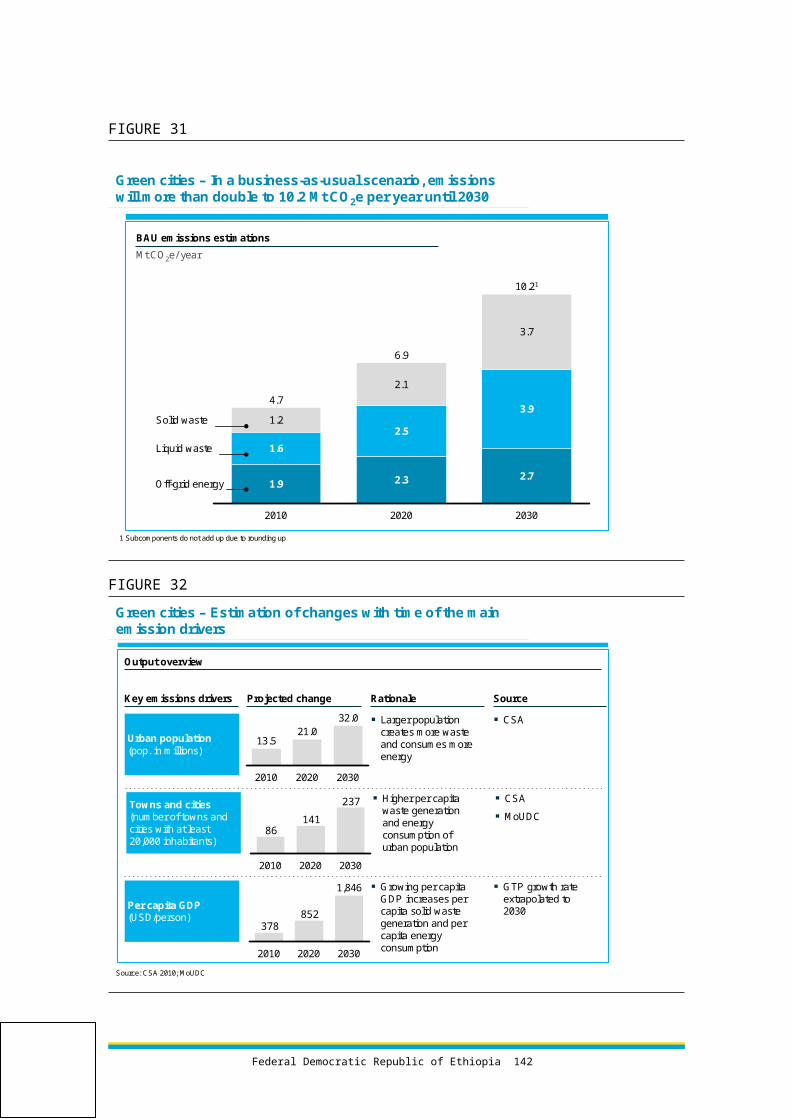
years to incorporate local practices, such as feeding crop residues to livestock.
Total emissions from crop reintroduce-tion were then calculated using relevant emission factors for each crop.
■ Synthetic fertiliser per hectare and hectares cultivated drive the emissions from synthetic fertilisers used. Synthetic fertiliser per hectare will grow from 65 kg/ha in 2010 to 247 kg/ha in 2030. Synthetic fertiliser use in 2010-2015 was projected based on GTP targets, and usage growth until 2030 was estimated based on the World Bank 2015 fertiliser application estimate for India (247 kg/ha).
■ Hectares cultivated will grow at 4% over the years based on projections from the GTP, which already includes programmes such as improved seeds and fertiliser use. This will raise the area cultivated from 13 million hectares in 2010 to 27 million hectares in 2030.
■ Livestock population mainly drives the emissions from manure used on land. As projected in the Livestock chapter, the population of livestock will grow from 47 million tropical livestock units in 2010 to 92 million tropical livestock units in 2030. These figures are based on projections by the CSA.
GHG emissions baseline and BAU projection for 2030 In the BAU scenario, emissions from soil will increase from 12 Mt CO2e in 2010 to 61 Mt CO2e in 2030 (see Figure 49), mainly driven by an increase in the use of synthetic fertiliser. The use of synthetic fertiliser is considered not to stifle the growth of crop reintroduction and manure application as the use of fertiliser on land is expected not to reach the saturation level in the years up to 2030, meaning that the use of crop residue, synthetic fertiliser and manure will all grow along with their emission drivers.
■ Emissions from crop residue reintroduction were estimated based on IPCC methodology and CSA crops data on the crop mix in Ethiopia, and will increase from 2.6 Mt CO2e in 2010 to 10 Mt CO2e in 2030. A different percentage for reintroduction of crop residue was considered for every type of crop based on IPCC data.
■ Emissions from synthetic fertiliser constitute the largest source of soil-based emissions (58% in 2030), and will increase from 4.3 Mt CO2e in 2010 to 35 Mt CO2e in 2030. They were calculated based on fertiliser use and amount of hectares cultivated.
Federal Democratic Republic of Ethiopia 142

■ Emissions from manure applied to agricultural land were projected based on
IPCC methodology and CSA livestock population data, and will increase from 5.3 Mt CO2e in 2010 to 16 Mt CO2e in 2030.
ABATEMENT LEVERS – POTENTIAL AND COST CURVE
In total, the Soil STC identified an abatement potential in 2030 of 40 Mt CO2e of soil-based emissions and 38 Mt CO2e through agriculture abatement levers that reduce deforestation, thereby achieving a combined abatement potential of 78 Mt CO2e (Figure 51). The abatement potential of the crops-related initiatives that reduce emissions through deforestation is accounted for in the Forestry STC. The four Soil sector initiatives can be grouped into three categories:
■ Enhancing of lower-emitting techniques for agriculture: By speeding up the introduction of low-emission techniques and sustainable land management practices, emissions would be reduced while maintaining production levels. These techniques include agronomic best soil practices to increase carbon storage, optimal nutrient management to improve nitrogen use efficiency, effective tillage and residue management practices, terracing and other water-harvesting techniques, and agro-forestry practices to prevent soil erosion and degradation. Within this lever, massive community-based soil conservation activities on watershed development and natural resources management through different interventions are highly important. The adoption of lower-emitting techniques has an abatement potential of 40 Mt CO2e.
■ Enhancing of yield-increasing techniques for agriculture: This initiative would promote and introduce best practices aimed at increasing agricultural yield and value per tonne, thereby reducing the need for new agricultural land created from forest areas. Ethiopia’s farmers could dramatically increase crop yields by using improved seeds (new varieties and higher quality) and basic, low-cost irrigation systems, increasing the use of fertiliser and manure, and adopting agronomic best practices (e.g., harvest and post-harvest management). The adoption of yield improving techniques has an abatement potential of 27.2 Mt CO2e in 2030 through reduced deforestation, which has been accounted for by the Forestry STC.
■ Creation of new agricultural land in arid areas through irrigation: Through the use of small, medium, and large-scale irrigation schemes, new agricultural land could be created from un-cultivated non-forest areas, thereby reducing emissions from the expansion of total cropland. The creation of new
Federal Democratic Republic of Ethiopia 143

agricultural land in arid areas through irrigation has an abatement potential of
10.6 Mt CO2e in 2030, which is also accounted for by the Forestry STC.
FIGURE 51
Abatement potential in Mt CO2e/ year achieved through Programme promoting lower-emitting techniques
0
10
20
30
40
50
60
70
20302025202020152010
Expected emissions after abatement
40
Additional CO2 abatement potential (accounted for by REDD+ STC)
27
Σ 30
11
Agriculture intensification on existing cropland
Irrigation initiatives
Soil – Abatement and sequestration potential of 40 Mt per year in 2030 (in addition to the 30 Mt accounted for in forestry)
Abatement measuresMt CO2e/ year in 2030
BAU and abatement potentialMt CO2e/ year
BAU emissions: 60.9 Mt in 2030
Mt CO2ereductionpotential up to 2030
Σ 40
Federal Democratic Republic of Ethiopia 144

FIGURE 52
Soil – Most abatement potential has either negative costs or is below the average carbon price
5
0
-5
-10
-15
-20
-25
Abatement potentialMtCO2e per year
80757065605550454035
50
2520155050
Large-scale irrigation
46.58
30
6.18
Small-scale irrigation
-12.56
Yield-increasing techniques
-20.89
Abatement costUSD per tCO2e
45
10
Lower-emitting techniques
Abatement opportunities cost curve
The cost curve depicted in Figure 52 shows a wide range of abatement costs, both in the negative and positive areas.
■ Three of the four Soil sector initiatives have a cost below USD 10/t. This low cost is due to the substantial economic benefits from preserving forestland for productive use and increasing the economic return per hectare of cropland.
■ The higher cost of large-scale irrigation (USD 47/ton) is due to the significant infrastructure investment required by the initiative.
The total investment cost that is required for all levers up to 2030 is about USD 30.5 billion, to which climate finance projects could make an important contribu-tion.
Soil lever 1– Enhance lower-emitting techniques for agricultureEmissions from crops are set to grow rapidly over the next 20 years due to carbon-intensive crop residue and tillage management practices, and the increasing usage of manure and synthetic fertiliser. The introduction of lower-emitting techniques
Federal Democratic Republic of Ethiopia 145

for agriculture offers an opportunity to check this increase while maintaining pro-
duction levels. This initiative includes improved agronomic practices that increase soil carbon storage, nutrient management to more efficiently use carbon/nitrogen, improved tillage and soil management, integrated systems (mixed crop-livestock-agri-forest), and water management (irrigation, terracing, and other water-harvest-ing techniques). This programme would build on the existing government plans to strengthen the agriculture extension system.
■ Soil nutrient and crop management. Improved agronomic practices can lead to increased soil carbon storage. Examples of such practices include: using improved crop varieties responsive to optimum external inputs (fertilizers and pesticides); sowing forage legumes in growing cereal crops; adopting cropping systems with reduced reliance on external inputs such as green manuring of legume crops, double cropping of cereals, and use of beneficial microorganisms and earthworms in compost making. Nitrogen management should also be considered. Nitrogen causes significant leaching and emissions. Employing techniques that could maximize the efficient use of nitrogen on crops reduces N2O emissions. Examples of such practices include adjusting application rates to crop needs and soil test-based nitrogen application; applying nitrogen at times when loss is minimal; splitting application rates between crop establishment and critical vegetative growth periods and manipulating soil chemical properties (such as liming) to release immobilised nutrients by raising soil pH to a neutral range.
■ Tillage/residue management. Soil disturbance tends to hasten decomposition and erosion whereas reduced tillage results in soil carbon gain and reduction of CO2 emissions. To achieve the latter effect, conservation agriculture will be promoted, including the use of zero and minimum tillage through the application of non-selective herbicides. The level of organic matter in the soil depends on the inputs from plant growth by reducing the losses due to erosion, harvesting, and microbial respiration. Even though returning crop residues into the soil is one of the main emissions drivers, reintroduction of an increased amount can maintain or enhance soil quality and productivity through favourable effects on soil properties and life-supporting processes. While emissions result from the practice, reintroduction of crop residues increases the carbon stock of soil and, on balance, causes a reduction of greenhouse gases into the atmosphere as compared with other uses of crop residues. For example, avoiding burning and over-exploitation as animal feed may help reduce organic matter loss in soils under cultivation.
Federal Democratic Republic of Ethiopia 146

■ Watershed-based integrated farming systems. Combining the production of
livestock and food crops on land that also grows trees for timber, firewood, or other tree products would increase the standing stock of carbon above ground relative to equivalent land use without trees. Examples of practices of this type include shelterbelts, introduction of high-value tree crops such as fruit trees, agri-silvopasture practices like growing fodder trees within crop fields as source of livestock feeds, live fences, and multi-story crop production.
■ Water management: This category includes the promotion of terracing, particularly in hilly regions with high soil erosion hazards, and the improve-ment of water harvesting and irrigation structures, such as providing supple-mentary irrigation by focusing on increased water use efficiency, which can enhance carbon storage in soils through enhanced yields and residue returns.
The lower-emitting techniques programme proposed by the STC would target 75% of farmers, reaching over 13 million households by 2030 through the government extension system. Through a combination of lower-emitting techniques tailored to local soil conditions, weather, and crop-livestock mixes (i.e., different practices in the highlands than in the lowlands), this initiative would lower emissions per hec-tare by an average of 3 tonnes of CO2e per year and have an abatement potential of 40 Mt CO2e in 2030. The estimate of the abatement potential of this initiative is based on the UNIQUE 2010 study ‘Carbon Finance Opportunities in Ethiopia’s Agricultural Sector’.
The abatement cost calculations for a programme introducing lower-emitting tech-niques are based on the following set of assumptions:
■ Programme implementation in combination with a programme promoting yield-increasing techniques (see Soil Lever 2) through the Ministry of Agriculture extension service.
■ Household expenses totalling USD 62/household to bring households into the programme, followed by USD 6 per household annually for running costs. Estimates are based on the Sustainable Land Management project, discounted by 50% to account for the joint implementation of the lower-emitting techniques and yield-increasing techniques.
■ Supporting investments including nurseries (one per 20,000 households), costing USD 50,000 each to set up,
■ Programme expenses amounting to USD 10 million for programme setup, USD 17/household/year for the first three years that a household is in the
Federal Democratic Republic of Ethiopia 147

programme, and USD 5/household/year for monitoring and programme
management.
■ Research expenses of USD 11 million annually for federal and regional research, based on the annual budget of EIAR.
These assumptions result in a cost of around USD 6 per Mt CO2e.
Soil lever 2 – Enhance yield-increasing techniques for agricultureThere is significant potential to increase agricultural productivity. By boosting yield per hectare and value per tonne of crops, it is possible to achieve the crop GDP target of 9.5% per year without rapid expansion of the total land under culti-vation. Through this initiative, it would be possible to achieve an annual yield growth rate of 3.5% (as opposed to 2% in the BAU) and a value growth rate of 4% (as opposed to 3.3% with BAU), thereby reducing the need for expansion of crop-land to 1.7% per year (compared to 3.9% under BAU). These numbers are based on averages for lowland and highland areas. The Soil STC estimated yield and value growth rates under a yield-increasing programme using historical trends for yield (CSA data) and value (Dorosh and Ahmed cereal price index). This initiative would reduce the need for new cropland from 14.3 million additional hectares under the BAU scenario to only 5.1 million additional hectares by 2030. The proposed yield-increasing techniques include:
■ Improved seeds. Introduction of tissue culture, new varieties and high-quality seeds to lower the incidence of pests and diseases and increase yield
■ Irrigation. Introduction of basic/low-cost irrigation systems to allow con-tinuity of production, especially in the dry season, reduce variability of output, and enable a shift to higher-value crops
■ Organic and inorganic fertiliser. Increase usage of slow-release fertilisers and manure, thereby replenishing soil nutrients to ensure sustainable soil fertility
■ Best agronomic practices. Introduction of planting, harvest, and post-harvest management best practices to lower the incidence of pests and disease, improve quality, and decrease spoilage.
The yield-increasing techniques programme proposed by the STC would target 75% of farmers, reaching over 13 million households by 2030. The programme would build on the existing government plans to strengthen the agriculture exten-
Federal Democratic Republic of Ethiopia 148

sion system. This initiative would lower emissions by reducing the need for new
agricultural land by 9.1 million hectares. Given an average carbon sequestration rate per hectare preserved of 53.5 tonnes of CO2e, this initiative has an abatement potential of 27.2 Mt CO2e in 2030. This calculation is a conservative estimate of the abatement potential as it does not count the reduction in soil-based emissions from crop growing that would have occurred on land cultivated in the BAU scenario but not in the scenario where this lever is implemented.
The abatement cost calculations for a programme introducing yield-increasing techniques are based on the following assumptions:
■ Programme implementation in combination with a programme promoting lower-emitting techniques (see Soil Lever 1) through the Ministry of Agriculture extension service
■ Household expenses totalling USD 233 per hectare to bring land into the programme, followed by USD 90 per hectare annually for running costs.
■ Supporting investments including:
– Seed production: six facilities costing USD 2,200,000 each to set up
– Fertiliser manufacturing plants: two facilities costing USD 100 million each to set up
– Irrigation equipment production plants (pumps, agriculture equipment, etc.): seven facilities costing USD 44.7 million each to set up
– Herbicide/pesticide/fungicide formulation plants: two plants costing USD 5 million each to set up
– Tissue culture labs: 42 labs costing USD 3 million each to set up
■ Programme expenses amounting to USD 10 million for programme setup, USD 50/household/year for the first year that a household is in the programme, USD 25/household/year for the second and third year a household is in the programme, and USD 10/household/year for monitoring and programme management
■ Research expenses of USD 11 million annually for federal and regional research, based on the annual budget of EIAR
■ Economic benefits are based on forestland preserved and improved productivity from labour on the newly intensified land. First of all, savings on forestland conserved are USD 7/ha/year. This estimate was discounted from USD 14/ha/year to account for incomplete monetisation (original estimate from
Federal Democratic Republic of Ethiopia 149

‘Ethiopian Forestry at the Crossroads’ report). The value is based on GDP
generated from forestland through foraging and gathering (i.e., gathering honey). Labour savings result from higher productivity of labour per hectare of land and a reduced amount of hectares needed to achieve the same production. In fact, the labour costs for intensified land might be slightly higher (222 USD as compared to 192 USD per hectare) due to a higher share of high value crops, but 4.69 times less land is needed when land is intensified instead of using deforested areas. This factor is based on such changes as a shift to higher value crops, better techniques, increased irrigation, and having several harvests a year. Reduced savings from unsold timber are minor due to the practice of burning forestland to acquire new land. Alternatively, the wood is used as personal fuelwood, in which case the costs of cutting the timber weighs up against the savings of using it as fuel. Together, this leads to USD 91.3 million a year in cost savings from the intensification programme.
These assumptions result in a cost of USD -21 per Mt CO2e.
Soil lever 3-4 – Creation of new agricultural land in arid areas through irrigation (small scale and large scale)These two initiatives reduce emissions by creating new agricultural land out of uncultivated non-forest arid areas, thereby reducing the need for deforestation and avoiding the associated emissions. The STC estimates that a total area of 1.7 million hectares of new agricultural land could be created through small- and large-scale irrigation projects in arid areas based on estimates of total irrigable land from the Bekele 2009 Irrigation Report and a feasibly factor for irrigation projects of 64% based on the historic performance of irrigation projects. Irrigation increases output from the land and avoids deforestation, both of which constitute economic benefits. The main sources used by the STC include surface irrigation potential estimates from Bekele 2009 Irrigation Report, expert interviews, and statistics from MoWE, MoARD, and IWMI.
Given an average carbon sequestration rate per hectare preserved of 53.5 tonnes of CO2e, the abatement potential in 2030 is 2 Mt CO2e for small-scale irrigation and 9 Mt CO2e for large-scale irrigation.
The abatement cost calculations for these initiatives were based on the following set of assumptions:
■ Household expenses totalling USD 233 per hectare in capital expenditure for watershed/irrigation for small-scale schemes and USD 3,552 for large-scale
Federal Democratic Republic of Ethiopia 150

systems, followed by USD 23/ha in annual operating costs for small-scale and
USD 178/ha for large-scale.
■ Supporting investments, including equipment production (pumps, irrigation equipment, etc.): setup costs of USD 250,000 and annual operating costs of USD 100,000 for small-scale irrigation, and setup costs of USD 5 million plus USD 2 million per year in irrigation equipment/system operating costs for large-scale systems.
■ Programme expenses amounting to USD 5 million for programme setup of small-scale irrigation and USD 10 million for programme setup of large-scale irrigation, extension programme operating expenses of USD 17/ha/year for the first three years that the small-scale programme is introduced and USD 724/ha for the first three years that the large-scale programme is introduced, and monitoring and management costs per household of USD 5 and USD 72 for small- and large-scale systems, respectively.
■ Research expenses of USD 2 million annually for small-scale irrigation research and USD 10 million annually for large-scale irrigation research.
■ Economic benefits are based on both the deforestation that is avoided as well as reduced labour costs due to improved output from the land. The savings from deforestation are based on a value of forestland conserved of USD 7/ha/ year as specified in the yield-increasing lever above. The output from the irrigated land improves by a factor of 2.29, reducing labour costs per hectare. Together, these factors constitute USD 19 million per year in savings for large-scale irrigation and USD 4 million per year in savings for small-scale irrigation.
These assumptions result in a negative cost of USD -13 per Mt CO2e for small-scale irrigation but a positive cost of USD 47 per Mt CO2e for large-scale irrigation.
Without a doubt, small-scale irrigation has immediate benefits when implemented and can be considered a profitable short-term investment. As alluded to before, large-scale irrigation requires significant upfront capital as well as programme expenditure. The option should only be considered in combination with other initiatives to improve crop productivity, such as seed and extension programmes, in order to make the investment more attractive and achieve positive returns in the long run.
Federal Democratic Republic of Ethiopia 151

ABATEMENT LEVERS – FEASIBILITY AND ECONOMIC IMPACT
ASSESSMENT
Feasible levers with high impactThree of the four Soil sector abatement levers (lower-emitting techniques, yield-increasing techniques, and small-scale irrigation) were evaluated as being highly feasible, though only the first two had substantial abatement potential.
Lower-emitting and yield-increasing techniques. These abatement levers were deemed highly feasible due to the necessary technologies’ general availability, suitability, and track record of success in pilots. In addition to carbon reduction benefits, the yield-increasing initiative would have substantial socio-economic benefits (increased household income, greater food security) as it would achieve the crop GDP while preserving valuable forestland for other economically beneficial uses (forest ecosystem services and sustainable logging). The key challenges of implementing these initiatives would be to strengthen the grassroots agricultural extension system and the regional and federal crops-related institutional setup, provide financing to farmers for improved inputs and equipment, overcoming farmer reluctance to change certain longstanding agricultural practices (e.g., use of undirected flood irrigation, use of unblended fertiliser), and fragmented land use in the highlands, which hampers community-level adoption of technologies. Despite these obstacles, the Soil STC evaluated this high-potential initiative as highly feasible.
Small-scale irrigation has a modest abatement potential (2 Mt CO2e in 2030), but the abatement lever’s strong socio-economic benefits (increased farmer household income, greater food security, etc.) make it an attractive initiative.
Other leversLarge-scale irrigation was evaluated by the STC as being only moderately feasi-ble due to substantial technical and institutional implementation challenges – similar to the challenges faced by large-scale irrigation projects in Ethiopia in the past. The technical requirements for large-scale irrigation may be an issue in some scantly visited areas and there are significant equity issues related to the benefits created by irrigation. The expenditure required for large-scale irrigation may also be prohibitive. Nevertheless, large-scale irrigation’s abatement potential of 9 Mt CO2e in 2030 and sizeable socio-economic benefits (increased farmer household income, greater food security, etc.) also make it an attractive abatement lever.
Federal Democratic Republic of Ethiopia 152

Additional levers that may be considered in future include indigenous agroforestry
practices as well as wetland management. Agroforestry practices may prove to be a more sustainable form of farming than traditional land exploitation practices. Wetlands form a great source of methane, which, if it can be captured, would offer another great source for GHG abatement. These additional levers may also generate numerous other societal benefits.
ABATEMENT LEVERS – IMPLEMENTATION TIMELINE AND RESOURCE REQUIREMENTS
Implementation timeline The Soil STC has selected two priority initiatives based on implementability, abatement potential, and cost attractiveness. Yield-increasing and lower-emitting techniques seem to outscore the other initiatives on these criteria (Figure 53). All of the initiatives are envisaged to have a kick-off in the near future. The levers will be implemented in phases with the programme reach developing linearly over the years. While technically feasible, the immediate start of the initiatives is dependent on sufficiently available funds. It is also important to mention that these dates mark the start of the implementation, which includes some required preparatory work (e.g., development of investment plans), and is subject to approval by the respective authorities. Hence, the full impact of the initiatives will only occur later in most cases.
Federal Democratic Republic of Ethiopia 153

FIGURE 53
Soil – Overview of timeline for implementation of initiatives
2012 2013 2014 2015Q1 Q2 Q3 Q4 Q1 Q2 Q3 Q4 Q1 Q2 Q3 Q4 Q1 Q2 Q3 Q4
Lower-emittingcrops
Yield-increasingtechniques
Large-scaleirrigation
Small-scaleirrigation
Activity
Selected as priority initiative
Other initiatives
Resource requirements and existing projectsThe soil initiatives will require an investment of USD 30.5 billion if it is to start being implemented immediately. Of the total, the largest expenditure is the running operating costs per year. The expenditure for the period until and including 2015 is USD 7.4 billion (Figure 54). Operating expenditure dominates for this period as well. The programme costs are quite significant for each of the periods as compared to the capital expenditure. Existing programmes may be leveraged to limit these costs.
The cost savings in both the periods of 2011-2015 and 2011-2030 are quite sig-nificant as well. In fact, because of these cost savings, the initiatives have a posi-tive return in the short and the long run on average. These cost savings can be attributed almost entirely to the yield increasing initiative which has benefits of USD 600 million each year. These benefits both cover the significant costs of yield increasing as well as large-scale irrigation.
Federal Democratic Republic of Ethiopia 154

FIGURE 54
Soil – Financial overview of all initiativesMillion USD
Short-term: 2011-2015 Long-term 2011-2030
CAPEX1 additional
OPEX additional(excl. programme cost)
Programme cost
Savings/income
Abatement expenditurebefore carbon revenue 360
7,710
1,390
4,120
1,840
310
30,850
6,190
17,130
7,220
▪ Yield intensification accounts for most of the overall savings
108221482
1 Full capital expenditure, not amortised2 Aggregated abatement potential; expenditure per t CO2e not equivalent to abatement cost in cost curve, as the CAPEX abatement expenditure is not
annualised via amortisation (rather: cash-flow perspective)
Mt CO2e total aggregated abatement potential
Mt CO2eabatement potential
Figure 55 shows a categorisation of the different initiatives.
Category A represents investments that achieve a positive net present value in the first five years. This category includes both the yield increasing and the small-scale irrigation initiatives. The bulk of the investment is for yield increases, namely USD 11.9 billion. The USD 17.7 billion in category C has no positive net present value. These large-scale irrigation and lower-emitting crop initiatives will need to be financed through performance-based grants, CDMs, or similar forms of financing. At USD 14.3 billion, most of the investment in this category is needed for the large-scale irrigation initiative.
There are currently several programmes running in the Soil sector already, including the GTP and the Agricultural Growth Plan, which promote the implementation of irrigation and other soil-related initiatives.
Federal Democratic Republic of Ethiopia 155

FIGURE 55
Soil – 42% of cost will have positive returns in the short run, but 58% will need some form of performance-based financing
Category CNo positive return,
grants/performance pay requirement
17,740
Category BPositive return, but long term financing
requirement
0
Category APositive return,
short term financingrequirement
12,800
Million USD, total cost1 Percent of total cost
42% 0% 58%
1 Including additional CAPEX, additional OPEX, and programme cost2 NPV calculated with 6% discount rate
Definition Positive NPV2 of first five years of cash flow (from start of initiative)
Positive NPV2 of overall initiative (from start of initiative up to 2030), but not after first five years
Negative NPV2 of overall initiative (from start of initiative up to 2030)
Federal Democratic Republic of Ethiopia 156

IndustryIndustry is the sector with the highest growth in GHG emissions up to 2030. Under BAU assumptions, emissions will rise from 4 Mt CO2e in 2010 to 71 Mt CO2e in 2030. The Industry STC has identified and evaluated 37 abatement levers for 12 industry segments, with a total gross abatement potential of 22 Mt CO2e in 2030. The vast majority of the emissions growth and abatement potential is in the cement industry, which has a gross abatement potential of 16 Mt CO2e.
SCOPE AND INSTITUTIONAL SETUP
The Industry STC (Table 11) is composed of experts from industries and related institutes of the Ministry of Industry that focus on particular industries and from the Ministry of Mines. The STC focused on calculating current and future emis-sions and analysed abatement levers for five sub-sectors.
TABLE 11
The following five sub-sectors comprise 12 individual industries that make up the major part of Ethiopia’s industrial activities (and hence account for industrial the country’s GHG emissions) as planned in the GTP:
■ Cement
■ Textile and leather
■ Steel and engineering
■ Chemicals (including fertilizer), paper and pulp, and food processing
■ Mining (including gold, coal, potash and others)
Federal Democratic Republic of Ethiopia 157
GHG EMISSIONS BASELINE IN 2010 AND BAU UP TO 2030
Under BAU assumptions, GHG emissions caused by the Industry sector will increase from around 4 Mt CO2e in 2010 to 71 Mt CO2e in 2030. The single most important driver is the cement industry, followed by the chemical industry and steel/engineering (Figure 56).
FIGURE 56
Industry – GHG emissions are projected to rapidly increase from 4 Mt CO2e in 2010 to 71 Mt CO2e in 2030
Baseline and BAU overviewMt CO2e/ year
Cement
Steel/Engineering
MiningOthers1
Textile/Leather
BAU2030
71
BAU2020
38
Baseline2010
4
1 Chemicals (including fertiliser), food processing, paper and pulp industry
Main drivers of GHG emissionsThe emissions of the industry sector are essentially driven by the volume of production in each industry and the emission factors per unit of production (Figure 57).
Federal Democratic Republic of Ethiopia 158

FIGURE 57
Industry – Estimation of changes with time of the main emission drivers
Output overview
65.837.7
2.7
359.4124.343.0
30.010.4
0.4
10,1009,1443,907
Steel and engineer-ing productionBillion USD
Key emissions drivers Projected change Rationale
▪ Projection based on GTP up to 2015
▪ After 2015 growth to middle-income country level of cement consump-tion per capita (0.5t) up to 2030
Cement productionMillion tonnes
▪ Projection based on data from GTP and Textile Institute planning
Gold mining and processingKg
▪ Projection based on GTP ▪ Growth forecast in GTP to 2015▪ After 2015 1% growth p.a. (naturally
constrained growth)
Textile productionThousand tonnes
▪ Projection based on GTP up to 2015
▪ After 2015 growth of 11.2% (in line with assumed economic growth)
Fertiliser productionMillion tonnes
▪ Baseline estimated with data from Metal and Engineering Corporation1
▪ Forecast based on total domestic fertiliser demand203020202010
6.72.4
0
1 Assumption: Actual production starts at 2/3 of production capacity
■ The development of the production volume of major industries is displayed in Figure 57. Most of the industries are expected to increase their production volumes significantly between 2010 and 2030. Production in the cement industry, as the major industrial driver of emissions, is projected to grow more than 20-fold in 20 years, while steel and engineering as well as fertiliser production are forecast to grow from a very small or non-existent base to significant volumes. The data for the volume of production in each industry came from the CSA and the GTP as well as from different departments of the Ministry of Industry and related institutes. For production forecasts, the team used growth rates indicated in the GTP whenever possible as well as growth rates for the industry sector as a whole and extrapolated these based on the assumptions outlined below. Selected expert estimates for maximum production volumes in 2030 were also considered.
■ Emission factors per unit of production are assumed to be constant in the BAU scenario, which does not include replacement of current technologies with lower-emitting techniques. Data for the emission factors were provided by the IPCC or drawn from international benchmarks (e.g., US Economics and Statistics Administration emission factors, scientific studies), and from studies in Ethiopia (e.g., on emissions of the leather production process).
Federal Democratic Republic of Ethiopia 159

GHG emissions baseline and BAU projection for 2030
In the business-as-usual (BAU) scenario, the expected development of the industry sectors analysed and the main assumptions for these sectors are as follows:
■ The cement sector is the most important driver of emissions. Its contribution will increase significantly from nearly 2 Mt CO2e in 2010 to over 45 Mt CO2e in 2030. Major emission sources are the clinker production process, which releases significant amounts of CO2 in preparing the input materials for use, and the fuel (mainly coal) that is consumed during clinker production.19 According to the GTP, cement production will have grown by 10 times or more by 2015. Thereafter, cement production is assumed to increase up to a per capita level of cement use typical for a middle-income country (around 500 kg per capita) by 2030. In total, annual cement production will rise from nearly 3 Mt in 2010 to more than 65 Mt in 2030.
■ Though the textile and leather sector plays a less important role, its volume of GHG emissions is projected to rise from 0.6 Mt CO2e in 2010 to almost 5 Mt CO2e in 2030. The main drivers of emissions here are the furnace oil used in the production process and the effluents being discharged. A detailed evaluation of the processing steps in leather production shows that leather is responsible for only a minor share of the emissions. The major share is attributable to the textile industry, which, according to GTP projections, will initially expand rapidly (increasing the value of production fivefold to more than USD 2.5 billion by 2015) and will then grow thereafter in line with overall economic growth.
■ The steel and engineering sector in Ethiopia, while relatively small today, is expected to emit more than 5 Mt CO2e in 2030. The GTP forecasts that this industry will have grown by 15 times or more by 2015 and will increase after that in line with overall economic growth. The team calculated expected emissions based on the value of output and international benchmark data for emission factors.
■ Other sectors include the chemical sector (typical products are caustic soda, soda ash, and fertilizers), food processing, and the paper and pulp industry. Although these industries individually contribute only a relatively small share of GHG emissions, (mainly from chemical processes and energy input, e.g., fuel oil or coal), they collectively constitute a significant source of emissions. Overall, GHG emissions from the chemical sector are expected to increase from 0.1 Mt
19 Both of these major emission sources have been estimated conservatively; depending on the weighted average of the cement factories’ efficiency, the emissions related to cement dust and CaCo3 caused in the production process could be higher.
Federal Democratic Republic of Ethiopia 160

CO2e in 2010 to 11 Mt CO2e in 2030, with the fertiliser industry accounting for
the bulk (around 9 Mt CO2e in 2030).
■ For the mining sector, the team evaluated several products and processes such as gold mining and processing, tantalum, potash, and coal. Taken together, emissions are projected to grow from nearly 1.5 Mt CO2e in 2010 to almost 4 Mt CO2e in 2030.
ABATEMENT LEVERS – POTENTIAL AND COST CURVE
The Industry STC has identified and evaluated 37 abatement levers for 12 industry sub-sectors, with a total gross abatement potential of 22 Mt CO2e in 2030 (Figure 58). The vast majority of this potential comes from the cement industry, which has a gross abatement potential of 16 Mt CO2e.
FIGURE 58
69
Industry – Identified abatement potential until 2030 is up to 22 Mt CO2e p.a.
Mt CO2e reductionpotential in 2030
1 Represents total identified gross potential, some measures are not additive2 Chemicals (including fertiliser), food processing, paper and pulp industry3 Assuming full implementation of all levers
0
10
20
30
40
50
60
70
80
20302025202020152010
Expected emissions after abatement
Σ 22
Abatement measures1
Mt CO2e/ year in 2030BAU and abatement potentialMt CO2e/ year
BAU emissions: 71 Mt in 2030
Textile/Leather2
Others2/Mining4
Cement16
Net potential afteraccounting for non-additive levers3
20
Federal Democratic Republic of Ethiopia 161

The majority of the abatement levers falls under the following headings:
■ Energy efficiency (e.g., retrofitting factories with modern production tech-nologies; improving insulation, recovering waste heat, and using cogeneration)
■ Alternative fuels (e.g., switching from coal/furnace oil to biomass/biofuels or electricity)
■ Alternative production processes (e.g., replacing chemicals with enzymes, clinker substitution)
■ Carbon capture and supply to other industries which use carbon as an input into their production process; mineralisation.
It should be mentioned that some of the levers are not fully mutually exclusive. Hence, the total net potential (i.e., after accounting for non-additivity) for full implementation of all levers is 20 Mt CO2e.
As the cement industry offers the largest abatement potential, the Industry STC concentrated on evaluating the levers in this industry segment. Hence, the cost curve depicted in Figure 59 displays abatement levers from the cement industry only. The net potential of all cement initiatives – if they are all fully implemented – is around 14 Mt CO2e in 2030. In addition to cement, the chemicals sector (including fertiliser), food processing, and paper and pulp provide abatement potential of another 4 Mt CO2e in 2030, while the textile and leather industry can mitigate nearly 2 Mt CO2e in 2030.
As most of the levers are related to energy efficiency or reduction of relatively expensive input materials, they have a negative abatement cost, i.e., the cost of installing and operating the respective technologies is more than offset by the savings (e.g., on fuel), resulting in a net gain for the implementing cement pro-ducer. However, since most of the levers require some upfront capital investment, they have not been widely adopted so far.
The total investment cost that is required for all levers – i.e., for a complete green retrofitting of the cement sector up to 2030 – is about USD 4.9 billion. In the long run, this will be more than offset by the savings incurred, but this amount emphasizes the challenge that lies ahead if we want to capture all our emissions abatement potential.
The following sections describe the six cement levers in more detail, explaining both the technical rationale as well as the assumptions for the calculation of abatement potential and abatement cost.
Federal Democratic Republic of Ethiopia 162

FIGURE 59
Industry – All currently feasible abatement levers have a negative abatement cost, making them attractive to implement
-100
0
Abatement costUSDper tCO2e
-20
-40
-60
-80
-34
1614121086420
Increase biomass (agri-residues)content
-1
Energy-efficiency equipment (grate cooler)
Energy-efficiency equipment (computerized energy management)
-35
Energy-efficiency equipment(precalciner kiln)
-75
Waste heat recovery
-94
Clinkersubstitution(e.g. pumice)2
-97
Abatement potential1MtCO2e per year
1 Represents total identified gross potential, some measures are not additive (total net potential is less than sum of gross potentials, ~24 Mt)2 Production cost only; does not include potential price decrease for grade IV cement
Abatement opportunities cost curve (cement levers only)
Cement lever 1 – Clinker substitutionGHG emissions in the production of cement are caused not only by the energy that is used in production but also by the emissions from the clinker production proc-ess. Reducing the ingredient share of clinker by replacing it with other additives (e.g., fly ash, pumice) can significantly reduce these emissions. Pumice is poten-tially the most readily available additive in Ethiopia. With a shift to coal as the major fuel for the cement industry, fly ash might also become readily available (as it is a byproduct of burning coal).
For the calculation of the abatement potential, the following assumptions were made:
■ Of the total cement production, 20% is OPC (no additives), 80% PPC (with additives). Currently, PPC cement has a clinker content of around 68%, the rest consists of additives (32% of total volume, composed of around 5% gypsum and 27% pumice).
Federal Democratic Republic of Ethiopia 163
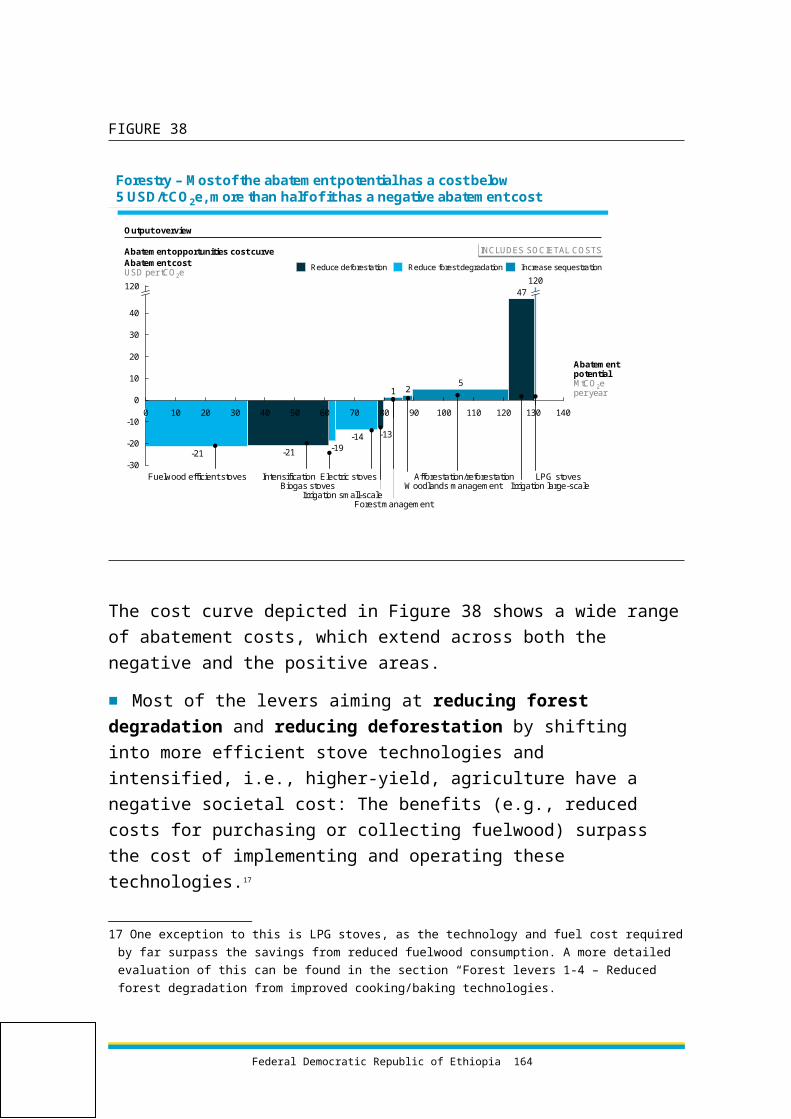
■ Ethiopian standards for cement (ES1177-1; in line with common European
standards) allow companies to increase additives (for PPC) to up to 55% (incl. gypsum) for grade IV (CEM IV/B) cement, leaving an incremental 23% of total volume to be substituted by additives such as pumice. This cement can be used for lower-cost construction (e.g., residential construction), which is assumed to constitute 45% of total cement consumption.
■ The team calculated the abatement potential by using the same process emis-sion factors for the clinker production process that were used to compute BAU (0.51 t CO2e/t clinker). In addition, the energy requirements of the clinker production process were counted towards the abatement potential (4.5 GJ/t clinker).
The substitution of clinker is implementable from 2012 onwards, starting with an annual gross abatement potential of around 1 Mt CO2e. The potential rises to nearly 5 Mt CO2e in 2030 (in line with the overall projected increase in cement production).
The cost of this lever is composed of the initial capital expenditure (per t of pro-duction capacity), which is depreciated over 50 years, as well as operating and maintenance costs. Fuel costs, on the other hand, are expected to decline. As total savings are higher than the investment and operating costs, this lever has a negative abatement cost of -97 USD/t CO2e.20
In addition to the substitution of clinker by additives, the substitution of conven-tional limestone as an input material for the production of clinker (e.g., by limestone with a low carbon content) could be considered to increase the abate-ment potential.
Cement lever 2 – Waste heat recoverySince the cement production process is very energy intensive, waste heat recovery can have a significant effect. The team estimated a potential reduction of (thermal) energy needed of 0.2 GJ/t, i.e., from 4.5 to 4.3 GJ/t of clinker. This lever can be put in place starting in 2013 and would reach its full potential (i.e., providing retrofits to existing cement works and covering all new production capacity) in 2014. The gross abatement potential will grow in line with projected cement industry growth from 0.1 Mt CO2e in 2013 to around 1 Mt CO2e in 2030.
Initial capital expenditure needed for technology and retrofits (per t of production capacity) will amortise over 30 years. Annual operation and maintenance are esti-20 The savings in increasing additives might have to be passed on to consumers (not separately regarded)
Federal Democratic Republic of Ethiopia 164

mated to incur costs of 10% of capital expenditure. Since the energy savings far
exceed the investment and operating costs, this lever offers a negative cost of -94 USD/t CO2e.
Cement levers 3, 4, 5 – Energy efficiency equipmentThe Industry STC evaluated three distinct technologies that increase energy effi-ciency in the cement production process:
■ Converting from preheaters to precalciner kilns, which can reduce energy requirements by up to 12%
■ Converting from rotary to grate coolers, which can reduce energy require-ments by up to 8%
■ Introducing computerised process control and energy management, which can reduce energy requirements by up to 4.5%
Implementation of all three technologies can start in 2012 or 2013 – with a ramp-up over two years and covering all new cement production capacity thereafter. The total gross abatement potential is projected to increase in line with cement indus-try growth from 0.8 Mt CO2e in 2012 to more than 5 Mt CO2e in 2030.
As far as the abatement costs are concerned, all three of these abatement levers have been attributed capital expenditure that is depreciated over 25 years minus the savings in energy consumption (in the case of grate coolers, the higher cost for electricity usage has been included as well). For all technologies, the savings more than offset the cost in the long run, leading to a negative abatement cost of -75 USD/t CO2e (precalciner kiln), -35 USD/t CO2e (computerised energy manage-ment), and -34 USD/t CO2e (grate cooler).
Cement lever 6 – Increase biomass (agri-residues) contentAn increase in the content of biomass has been projected to generate an abate-ment potential of up to 4.2 Mt CO2e in 2030, based on the following assumptions:
■ Up to 20% of the energy needed for cement production can be generated from biomass instead of conventional fuels (mainly coal).
■ Increased biomass-fuelled energy can be implemented in the cement industry from 2014 onwards, with a ramp-up to the full 20% potential within three years.
Federal Democratic Republic of Ethiopia 165
■ The biomass to be used for the replacement of conventional fuels will come
only from agricultural/wood residues (agri-residues). New areas of land for biomass production will therefore not be required (although the soil might decrease in fertility if the biomass was used as an organic fertiliser before and animal feed might be reduced – hence, the impact needs to be tested during the further development of the initiative).
■ The same emission factors for conventional fuel are used as in the BAU calculations (0.1 t CO2e/GJ).
The total abatement potential is projected to increase from around 0.3 Mt CO2e in 2014 to 4.2 Mt CO2e in 2030 (in line with cement industry growth).
The abatement cost has been calculated based on a detailed study by UNDP at Mugher Cement on using biomass in the cement industry. The total cost is -1 USD/t CO2e. The CAPEX includes all the equipment necessary to make bio-mass usable (i.e., choppers, briquettors, etc.) and is amortised over 20 years. The operational cost includes the transport and delivery cost (which is adjusted upwards from the UNDP report to represent a more conservative collection cost of more than 5 USD/t) and is netted out against the savings achieved from the decrease in conventional fuel usage.
ABATEMENT LEVERS – FEASIBILITY AND ECONOMIC IMPACT ASSESSMENT
Feasible levers with high impactAll abatement levers related to changing cement composition, fuel usage, and energy efficiency equipment (1 to 6) are generally technically feasible, but need to be optimized for our context and the existing technical standards. However, since they require very high capital expenditures as well as decisions by several public/private cement producers, the barriers to implementation should be further clarified. A concerted effort seems necessary to convince cement producers of the economic and ecological benefits of the measures and to offer financing instru-ments supporting the required investments (e.g., by supporting CDM proposals). A further feasibility prerequisite, particularly for the clinker substitution initiative, is the existence of a strong standardization and regulatory policy governing the production and application of the different types of cement. The current regulatory setup should be complemented to prevent misuse of the standards or wrong appli-cation of the respective cement types.
Federal Democratic Republic of Ethiopia 166

In addition, some capability building will be required, particularly for technically
more advanced measures, such as computerised energy management. Moreover, more detailed evaluation is needed, particularly of the initiative on increasing biomass, with regard to availability, the collection process and competing with the use of residues as fertiliser and animal feed to ensure that the initiative is implemented in a feasible and sustainable way.
If these barriers to implementation can be overcome, the six abatement levers evaluated by the Industry STC support the targets of economic development and might even prove a catalyst in surpassing them in several different ways:
■ The reduction in production cost of PPC cement with a higher additives con-tent, for example, might be partly passed on to the consumer by reducing the market price for this type of cement. This might in turn stimulate construction, also in the residential market or by relatively less wealthy consumers, leading to employment, value added, and capital formation.
■ Besides this effect, the substitution and decrease of the required amount of fossil fuels (coal and furnace oil) will significantly reduce the otherwise nec-essary imports and save valuable foreign currency.
■ In addition, selling biomass to cement factories might increase the income of farmers (although it might reduce soil fertility or animal feed if the biomass were otherwise used as an organic fertiliser or feed for livestock).
In terms of sequencing the individual initiatives, it makes sense from the point of view of the cement factories involved to start with clinker substitution and then sequentially build the more CAPEX-intensive energy efficiency equipment. However, for all newly built production capacity (which will soon represent the major part of the capacity), it makes sense to build in this upgraded equipment straight away, if the necessary financing is available. Increased biomass usage can be implemented in a ramp-up over several years.
Other leversCarbon capture and storage (CCS) technologies are still at a nascent stage and are assumed to represent little or no significant abatement potential for Ethiopian industry. Also, the cost that is typically found in international benchmarks – regu-larly estimated to be around 50 USD/t CO2e – is much higher than the cost that has been computed for other industry-related levers. Hence, carbon capture and storage was excluded from detailed study.
Federal Democratic Republic of Ethiopia 167

ABATEMENT LEVERS – IMPLEMENTATION TIMELINE AND RESOURCE
REQUIREMENTS
Implementation timeline On the basis of the abatement potential and feasibility assessment, the Industry STC has selected initiatives for particular attention and immediate implementation efforts, including substituting pumice for clinker and the several energy efficiency levers (Figure 60). Scale-up of all of these measures is envisaged for 2012 – with the exception of the energy-efficient grate coolers that are scheduled to start implementation in 2013. The scale-up of these initiatives is assumed to be staged over two years for existing facilities and to immediately affect any newly built capacity. Hence, it is important to mention that the starting dates only mark the beginning of the implementation, which for some initiatives is staged across several years, includes some required preparatory work (e.g., development of investment plans), and is subject to approval by the respective authorities and the availability of funding. Thus, the full impact of the initiatives will only occur later in most cases. The other initiatives in the cement industry are currently envisaged for implementation from 2013 (waste heat recovery) and 2014 (increase of biomass content) onwards.
Federal Democratic Republic of Ethiopia 168

FIGURE 60
Industry – Overview of timeline for implementation of initiatives
2012 2013 2014Q1 Q2 Q3 Q4 Q1 Q2 Q3 Q4 Q1 Q2 Q3 Q4
Starting at various times between 2012 and 2017Initiatives inother sectors
Increase biomass(agri-residues)
Waste heatrecovery
Energy efficiency(precalciner)
Energy efficiency(grate cooler)
Energy efficiency(energy mgmt)
Clinkersubstitution
Activity
Selected as priority initiative
Other initiatives
Implementation of initiatives in other sub-sectors needs to be started at several points in time from 2012 onwards (a detailed sequencing of these – around 30 – initiatives has been conducted by the STC).
Resource requirements and existing projectsThe cement industry initiatives (i.e., initiatives for which cost has been evaluated) will require a total expenditure of around USD 6.2 billion in the long run (i.e., up to 2030). Of this total, about USD 4.9 billion is capital expenditure and USD 1.3 billion is operating expenditure. Around USD 2.1 billion of the total expenditure will already be required in the short term, i.e., up to 2015 (Figure 61).
Federal Democratic Republic of Ethiopia 169

FIGURE 61
Industry – Financial overview of all cement initiativesMillion USD
Short-term: 2011-2015 Long-term 2011-2030
CAPEX1 additional
OPEX additional(excl. programme cost)
Programme cost
Savings
Abatement expenditurebefore carbon revenue -710
1,400
0
110
2,000
9,630
15,840
0
1,340
4,870
▪ Initiatives only start in 2012/13 with high upfront invest▪ Fuel savings will overcompensate cost after 5-7 years
1772132
1 Full capital expenditure, not amortised2 Aggregated abatement potential; expenditure per t CO2e not equivalent to abatement cost in cost curve, as the CAPEX abatement expenditure is not
annualised via amortisation (rather: cash-flow perspective)
Mt CO2e total aggregated abatement potential
Mt CO2eabatement potential
Most of the initiatives offer substantial reduction of energy consumption and hence of operating expenditure for the implementing cement producers; these savings are expected to more than offset the initial expenditure. Around USD 1.4 billion in savings will be generated in the short run up to 2015 and more than USD 15.8 billion of savings can be generated up to 2030.
The expenditures will have positive returns for all initiatives (Figure 62). Due to the high upfront investment cost for the energy efficiency technologies, most of the expenditures – particularly for the energy efficiency levers and waste heat recovery – only pay back in the long run. Hence, most of the expenditure can be classified in category B – i.e., have a positive return, but only in the long run and therefore need long-term financing. The remaining levers do not have very high upfront CAPEX and will pay back in less than five years.
Federal Democratic Republic of Ethiopia 170

FIGURE 62
Industry – 100% of cost will have positive return, but more than 90% will need long-term financing
Industry(all cementInitiatives,excludingCCS)
Category CNo positive return,
grants/performance pay requirement
0
Category BPositive return, but long term financing
requirement
5,710
Category APositive return,
short term financingrequirement
500
Million USD, total cost1 Percent of total cost
8% 92% 0%
1 Including additional CAPEX, additional OPEX, and programme cost2 NPV calculated with 6% discount rate
Definition Positive NPV2 of first five years of cash flow (from start of initiative)
Positive NPV2 of overall initiative (from start of initiative up to 2030), but not after first five years
Negative NPV2 of overall initiative (from start of initiative up to 2030)
Because the initiatives target corporate cement factories’ operations, most of them will have to be driven by the public and private sectors working together. Several of the levers are currently being evaluated or being proposed for CDMs. As several donor organisations are also actively evaluating green economy levers for the Ethiopian industry, the scale-up initiatives for efficient technologies may be able to build on the experience of pilots.
Federal Democratic Republic of Ethiopia 171

TransportUnder the BAU scenario, emissions from the Transport sector will increase from 5 Mt CO2e in 2010 to 41 Mt CO2e in 2030. Leapfrogging to new technologies in transport offers an abatement potential of up to 13.2 Mt CO2e in 2030. The major initiatives proposed by the STC are improving Addis Ababa public transit by building a light-rail transit system and a bus rapid transit system; improving vehicle efficiency by applying fuel efficiency standards, promoting clean fuel blends (biodiesel and ethanol), adopting hybrid and plug-in electric vehicles, and shifting freight transport from road to an electric rail network. Shifting freight to electric rail is the single largest abatement lever in the Transport sector, with a potential of 8.9 Mt CO2e.
SCOPE AND INSTITUTIONAL SETUP
The Transport sector includes passenger and cargo transport by road, air, sea, and rail. The Transport STC (Table 12) calculated current and future emissions for all transport segments and analysed abatement levers. The STC is composed of mem-bers from the Ministry of Transport, the Ministry of Water and Energy, the Ministry of Agriculture, the Environmental Protection Authority, the Addis Ababa City Administration, and the Ministry of Urban Development and Construction.
TABLE 12
▪ Yetmyet Birhanu (Chair)▪ Robel Meseret▪ Dinberu Girma▪ Tesfaye Abebe▪ Dereje Abebe▪ Gebreselassie Gebreamiak▪ Fetiya Ahimed▪ Sebsibe Tadesse
▪ MoT▪ MoT▪ MoT▪ MoWE▪ MoA▪ EPA▪ Addis Ababa city admin▪ MoUDC
STC members (role) Institution
▪ Yetmyet Birhanu (Chair)▪ Robel Meseret▪ Dinberu Girma▪ Tesfaye Abebe▪ Dereje Abebe▪ Gebreselassie Gebreamiak▪ Fetiya Ahimed▪ Sebsibe Tadesse
▪ MoT▪ MoT▪ MoT▪ MoWE▪ MoA▪ EPA▪ Addis Ababa city admin▪ MoUDC
STC members (role) Institution
Federal Democratic Republic of Ethiopia 172

GHG EMISSIONS BASELINE IN 2010 AND BAU UP TO 2030
Emissions from the Transport sector are mainly from road transport, particularly freight and passenger vehicles, and, to a lesser extent, construction vehicles. Air transport also contributes a significant share (1.1 Mt CO2e or 23% of transport-related emissions in 2010). Under the BAU scenario, emissions from transport will increase from 4.9 Mt CO2e 2010 to 40.7 Mt CO2e 2030 (Figure 63).
FIGURE 63
Transport – Level of GHG emissions increases eightfold until 2030 under the business-as-usual scenario
Output overviewMt CO2e/ year
Passenger: Intra-cityPassenger: Inter-cityPassenger: International
Freight: Dry cargo
Freight: Construction and mining
Freight: Liquid cargoFreight: International
BAU2030
41
Baseline2010
5
BAU 2020
14
Main drivers of GHG emissionsThe main drivers of GHG emissions from the Transport sector as well as the main assumptions about their impacts and development are detailed below (Figure 64).
Federal Democratic Republic of Ethiopia 173

FIGURE 64
Tonne-km of cargo transported/ year1
Billion tonne-km
Transport – Estimation of changes with time of the main emission drivers
Output overview
220
9540
203020202010
Key emissions drivers Projected change Rationale
313
9126
203020202010
▪ Increase in passenger-km travelled projected based on elasticity of passenger-km to real GDP, using GTP’sGDP target extrapolated to 2030
Passenger-km travelled/yearBillion passenger-km
▪ Increase in tonne-km of cargo transported based on elasticity of passenger-km to real GDP, using GTP GDP target extrapolated to 2030
1 Includes construction and mining transport activity
■ Increase in tonne-kilometres of freight transported. Inland freight is trans-ported almost exclusively by road due to the poor condition of the rail network. Emissions from dry cargo road transport constitute the majority of all transport emissions (20.7 Mt CO2e) in 2030. International air and sea freight, and inland ship-based cargo transport each account for a small share of emissions. The STC estimates an annual growth rate ranging from 12.4%-13.7% in tonne-km of freight transported. This estimate was calculated using the elasticity of diesel imports to real GDP based on National Bank of Ethiopia’s statistics and GDP growth rates as projected by the GTP and by EDRI/MOFED.
■ Increase in passenger-kilometres travelled. Passenger transport emissions are driven primarily by international air travel, followed by inter-city and intra-city road transport. Growth in air travel was forecast using Ministry of Transport statistics. Passenger road transport emissions are driven by an old and inefficient fleet composed of 240,000 vehicles, with an average age of 15 years. The passenger fleet consumed 0.6 billion litres of imported fossil fuel in 2010. The increase in road passenger-km travelled was forecast at an annual growth rate of 8.3%-9.1%. This estimate was calculated using the elasticity of passenger-km to
Federal Democratic Republic of Ethiopia 174
real GDP based on the Ministry of Transport’s statistics for the past ten years and
GDP growth rates as projected by the GTP and by EDRI/ MOFED.
■ Increase in construction and mining transport. Emissions from construc-tion and mining were accounted for using Ministry of Transport statistics. Their annual growth rate was projected at 12.4%-13.7% based on the elasticity of diesel imports to real GDP, which was calculated using the National Bank of Ethiopia’s statistics and GDP growth rates as projected by EDRI/MOFED.
GHG emissions baseline and BAU projection for 2030 Emissions from transport will increase from 5 Mt CO2e in 2010 to 41 Mt CO2e in 2030 (see Figure 63), mainly driven by a rapid increase in dry freight road transport and international passenger transport.
■ Freight transport. The rapidly growing economy will bring with it a strong need for freight transport, leading to steep growth in tonne-km of freight transported from 23 billion in 2010 to 279 billion in 2030. This will result in emissions rising from 2.0 Mt CO2e in 2010 to 24.1 Mt CO2e in 2030. The BAU scenario assumes that the average fuel efficiency of the freight vehicle fleet will improve by 3.3% from 2010 to 2030.
■ Passenger transport. Driven by an increasing population, a strong urbanisation trend, and a growing per capita GDP, total travel measured in passenger-km will rise from 40 billion in 2010 to 220 billion in 2030. This will lead to an increase in GHG emissions from 2.5 Mt CO2e to 13.1 Mt CO2e in 2030. The BAU scenario assumes that the average fuel efficiency of the passenger vehicle fleet will improve by 10% from 2010 to 2030.
■ Mining and construction. Mining and construction transport activity will grow from 3 billion tonne-km to 34 billion tonne-km, increasing GHG emissions from 0.3 Mt CO2e in 2010 to 3.5 Mt CO2e in 2030. The BAU scenario assumes that the average fuel efficiency of the mining and construction vehicle fleet will improve by 3.3% from 2010 to 2030.
ABATEMENT LEVERS – POTENTIAL AND COST CURVE
The Transport sector’s eight abatement levers fall into four categories: improving the public transport system in Addis Ababa, improving vehicle efficiency, chang-ing the fuel mix, and constructing an electric rail network for efficient freight transport. A total abatement potential has been identified of up to 12.2 Mt CO2e in 2030 (Figure 65). This is lower than the sum-total of the abatement potential of all
Federal Democratic Republic of Ethiopia 175

the levers added up individually due to the interaction between the levers. For
example, when electric rail is implemented, the savings from applying fuel efficiency standards to lorries are lower. The abatement potential of four of the Transport sector’s green growth initiatives has been calculated as follows:
■ Improving Addis Ababa public transit by building a light rail transit system and a bus rapid transit system has an abatement potential of approximately 0.1 Mt CO2e.
■ Improving vehicle efficiency by enacting fuel efficiency standards has an abatement potential of approximately 3.1 Mt CO2e.
■ Changing the fuel mix using a combination of adding biodiesel to the diesel mixture, increasing the amount of ethanol in the gasoline mixture, and promoting the adoption of hybrid and plug-in electric vehicles has a combined abatement potential of nearly 1.0 Mt CO2e.
■ Shifting freight transport from road to an electric rail network would eliminate emissions from the largest source of transport emissions. Shifting freight from road transport using diesel vehicles to rail transport powered by renewable electricity has an abatement potential of 8.9 Mt CO2e, and is the largest abatement lever in the transport sector.
Federal Democratic Republic of Ethiopia 176
FIGURE 65
Transport – Abatement potential reaches 13.3 Mt CO2e per year in 2030
Business-as-usualMt CO2e/ year
BAU emissions: 41 Mt in 2030
0
10
20
30
40
50
2015 2020 2025 20302010
8.9 Electric rail
0.1 Light rail transit (LRT)
0.04 Bus rapid transit (BRT)
0.1 Hybrid vehicles
0.04 Plug-in electric vehicles
Fuel efficiency standards
0.2 E15 fuel blend
0.7 B5 fuel blend
3.1
Σ 13.2 Net potential afteraccounting for non-additive levers2
1 Represents total identified gross potential, some measures are not additive2 Assuming full implementation of all levers
Abatement measures1
Mt CO2e/ year in 2030
12.2
Mt CO2e reductionpotential in 2030
FIGURE 66
78
Transport – All abatement potential has negative or zero costs
-80
-100
-120
11
-200
-220
-240
Abatement potentialMt CO2e per year
1312
-140
-160
-180
Abatement costUSD per t CO2e
0
-20
-40
-223.3
Fuel efficiency standards
-91.4
-60
Electric rail
0109876543210
0
E15 B5
Output overview
Abatement opportunities cost curve
Federal Democratic Republic of Ethiopia 177

The cost curve shown in Figure 66 shows a wide range of abatement costs. Fuel efficiency standards seem to generate a lot of cost savings (USD 220 per t of CO2e) as does electric rail (USD 91 per t of CO2e). Introducing ethanol and biofuel is relatively cost neutral and has lower abatement potential.
Implementing all the transport levers up to 2030 will require investments totalling about USD 22.9 billion.
Transport levers 1-2 – Improved public transit in Addis Ababa: Light Rail Transit and Bus Rapid TransitThe existing public transport network in Addis Ababa consists primarily of mini-buses and full-length buses running on a mix of gasoline and diesel fuel. Small taxis and three-wheelers comprise a small share of passenger transport. The STC identified two public transit improvements – light rail transit (LRT) and bus rapid transit (BRT) using electric trolley buses.
Both of these abatement levers would reduce road congestion, air pollution, traffic accidents, and passenger travel times. Their annual abatement potential in 2030 was calculated to be approximately 0.1 Mt CO2e and 0.04 Mt CO2e respectively. These abatement potential calculations are based on the following data and assumptions:
■ Passenger-kilometres shifted to LRT and BRT. From the STC’s projection of total passenger-km demanded as well as the Transport Master Plan and the existing Addis Ababa LRT and BRT proposals, the STC estimated that of the over 60 billion passenger-km travelled within Addis Ababa in 2030, 7% (4.4 billion) could be shifted to LRT and 3% (1.9 billion) could be shifted to BRT. The LRT combined route length (35 km) was taken from the Addis Ababa LRT feasibility study. The BRT combined route length (32 km) was taken from the BRT feasibility study.
■ Construction timing and passenger mix. Based on planned route locations and travel patterns, the STC assumed that the passengers shifted to LRT would be drawn from mini-, midi-, and maxi-buses, while the passengers shifted to BRT would be drawn from midi- and maxi-buses. The STC assumed the routes will be completed by 2015, based on the LRT and BRT Addis Ababa proposals under consideration by the Ministry of Transport.
Federal Democratic Republic of Ethiopia 178

■ Emissions from LRT and BRT. Due to the expected availability of renew-
able energy for power, the LRT and BRT were assumed to have zero emissions.
Transport lever 3 – Fuel efficiency standards for all vehicle typesThe existing vehicle stock is old and highly inefficient, and no fuel efficiency standards exist for vehicles entering the country. This presents a major opportunity to reduce transport emissions through fuel efficiency standards (FES), which has an abatement potential of 3.1 Mt CO2e in 2030. FES would be applied to new and used vehicles imported into the country after the standards are enacted. The abatement potential for this lever was estimated using the following assumptions:
■ Vehicle fleet efficiency improvement due to FES. Based on FES pro-grammes in South Africa and China, STC discussions, and a FES phase-in start date of 2015, the fleet efficiency improvement by 2030 due to FES was assumed to be 30% for passenger vehicles and 10% for freight vehicles (instead of 10% and 3.3% respectively in the BAU scenario).
■ Vehicle stock growth. Based on the growth forecast for passenger-km and on historic vehicle import data from the Customs Authority, the STC assumed the vehicle stock would grow from 240,000 passenger, 70,000 freight, and 10,000 construction and mining vehicles to 1,350,000 passenger, 820,000 freight, and 140,000 construction and mining vehicles in 2030. This growth projection is based on a 20-year average vehicle use after importation and 14% and 18.4% annual imports of passenger and freight/construction vehicles based on Import Authority data.
■ The abatement cost is calculated to be -223 USD/t CO2e. This abatement cost incorporates the following elements:
– Vehicle costs. The STC assumed that more efficient vehicles meeting the FES would have a price 15% higher relative to the less efficient vehicles that would have been imported in the absence of FES. Baseline vehicle costs are based on the average cost of vehicles imported in 2010, namely: USD 9,500 (passenger) and USD 40,500 (freight). The STC assumed that vehicle prices would erode at a rate of -1% annually. Vehicles were assumed to have an average age of 10 years at time of importation, and an additional 20 years of use in Ethiopia.
Federal Democratic Republic of Ethiopia 179

– Fuel cost savings. Fuel cost savings have been computed based on a
comparison of average fuel expenditure before and after the change of vehicle fleet efficiency and have been accounted for as (negative) cost. The STC calculations used 2011 prices. The price of fuel was assumed to increase at the rate of 2.2% per year from the following 2010 figures.
□ Price of gasoline in 2010: USD 0.83/litre.
□ Price of diesel in 2010: USD 0.70/litre.
– Programme cost and additional operating expenditure. Total programme setup costs are USD 5 million. Ongoing programme costs, including FES enforcement, total USD 500,000 per year.
Transport levers 4-5 – Biodiesel and ethanol in fuel mixturesIncorporating 5% biodiesel into the national diesel fuel mixture has an abatement potential of 0.7 Mt CO2e in 2030. Increasing the ethanol content of the gasoline from 10% in the Addis Ababa fuel mix to 15% nationally – the maximum feasible ethanol mix that does not require mechanical alteration to vehicles – has an abate-ment potential of 0.2 Mt CO2e in 2030. These initiatives would require about 486,000 hectares of arable land to support bio-diesel and 25,000 hectares of arable land for ethanol. However, the government plan is to produce biofuels entirely from crops on marginal land and by-products/residue of crop processing. Increasing the ethanol mix to 85% is technically feasible but was rejected in this case due to the high level of infrastructure investments needed in the fleet, storage, and pumping facilities. The abatement potential of these levers was estimated using the following calculations:
■ Fuel consumption projections. The amount of fossil fuel that would be sub-stituted by biodiesel and ethanol was based on the STC’s demand forecast for passenger-km and freight-km, and on the Ministry of Water and Energy’s biofuel production forecasts. Imports of diesel are expected to increase from 1.1 billion litres in 2010 to 11.1 billion litres in 2030, while gasoline imports are expected to increase from 0.3 billion litres in 2010 to 1.2 in 2030. Due to the lower caloric value of ethanol, increasing the ethanol content of the fuel blend to 15% was assumed to lower vehicle fuel efficiency by 10%.
■ Biofuel production. In accordance with the Ethiopian Biofuel Development and Utilisation Strategy, ethanol would be produced from sugarcane, and bio-diesel primarily from jatropha as well as from castor oil and palm oil. Imple-
Federal Democratic Republic of Ethiopia 180

menting 5% biodiesel and 15% ethanol blends would substitute for 0.28 billion
litres of diesel and 0.09 billion litres of gasoline in 2030.
■ Emissions from fuel. The following fuel emissions factors were used:
– Diesel: 2.67 kg CO2e/litre.
– Gasoline: 2.42 kg CO2e/litre.
■ Fleet modification. The STC assumed that all vehicles in the existing stock could be used with the new fuel mixtures (5% biodiesel and 15% ethanol) without a need for user-initiated vehicle modification.
The abatement cost of biodiesel and ethanol blends is calculated to be around USD 0 per USD/t CO2e and –USD 0 per USD/t CO2e respectively. These abate-ment costs incorporate the following elements:
■ Fuel cost savings. Fuel prices for biodiesel and ethanol were assumed to be at price parity with diesel and gasoline (adjusted for caloric content). This as-sumption was based on the equivalence of prices for diesel and gasoline imports. Part of the production of ethanol and biodiesel may take place inside the country, in which case the fuel price may slightly differ.
■ Programme cost and additional operating expenditure. Implementing changes to the fuel blend would entail a programme setup cost of USD 5 million. Operating costs, including programme management and monitoring, were estimated at USD 500,000/year. Because the costs are so low relative to the abatement potential, they appear as zero in the cost curve.
Transport levers 6-7 – Hybrid and plug-in electric vehiclesThe low fuel efficiency of the vehicle fleet could be improved through the promo-tion of hybrid and plug-in electric vehicles. Increasing the fleet share of hybrid and electric vehicles to 13.0% and 2.2%, respectively, by 2030 would significantly reduce annual gasoline consumption. These initiatives have a combined abatement potential of approximately 0.09 Mt CO2e in 2030. The abatement potential of these levers was estimated using the following assumptions:
■ Fuel efficiency of hybrid and plug-in electric vehicles. The STC assumed a hybrid vehicle fuel efficiency improvement of 60% relative to existing private automobiles. The STC estimated the fuel efficiency of private automobiles in the existing fleet to be 12 litres per 100 km based on the African Public Transport
Federal Democratic Republic of Ethiopia 181

Association Study for Addis Ababa. The efficiency of plug-in electric vehicles
was assumed to be 21 kWh per 100 km.
■ Penetration rate of hybrid and plug-in electric vehicles. The STC’s pro-posed import shares for standard internal combustion engine (ICE) vehicles, hybrid vehicles, and plug-in electric vehicles was determined by the total cost of ownership (TCO) of each vehicle type corresponding to a particular distance driven per year. TCO was calculated based on vehicle purchase price, maintenance, and fuel costs. Vehicle purchase price was assumed to be a one-off cost, while maintenance and fuel costs were assumed to recur over the years and progress linearly with the amount of kilometres driven per year. Maintenance and fuel costs in the years subsequent to purchase were discounted using a 35% discount rate per year to reflect local purchase capacity. Based on these assumptions, the total cost of ownership was calculated for each vehicle type in 2010, 2020 and 2030. Subsequently, the optimal share of each vehicle type in imports was calculated for 2010, 2020 and 2030 based on these TCO figures and assuming a normal distribution of kilometres driven per year with an average of 16,000 km. If the average turnover rate of vehicles is 20 years, it is possible to calculate the penetration rate of each vehicle type in the vehicle population in 2030 assuming a linear increase in import shares of the vehicle types over the years.
The resultant fleet composition is 100% ICE until 2014 and 84.8% ICE, 13.0% hybrid, and 2.2% plug-in electric in 2030 (with import rates of 57.9%, 34.0% and 8.1%, respectively). The 2030 import rates reflect 2020 world production under the radical scenario that a pollution cap of 10 g CO2/km would be set in 2050. This assumes progressive action by the government to build the right infrastructure and promote the usage of the new types of vehicles. The penetration rate could be even higher if domestic production of hybrid and electric vehicles takes off, but this would require the attraction of automobile manufacturers to Ethiopia. Figure 67 shows the TCO for the different vehicle types in 2030 based on different distances driven per year.
Federal Democratic Republic of Ethiopia 182

FIGURE 67
Transport – Hybrid has the lowest TCO for middle distances; electric cars for longer distances
24.000
26.000
28.000
30.000
32.000
34.000
36.000
38.000
40.000
14000 16000 18000 20000 22000 24000 26000
23000 km
17000 km
HybridICE
Electric
Total cost of ownershipUSD
TCO1 for different vehicle types
Km drivenKm/year
1 TCO = Total cost of ownership
Transport lever 8 – Electric rail network for freight transportThe STC’s proposed electric rail network consists of seven lines totalling 5,196 km, with the first and primary line of Addis Ababa – Djibouti opening in 2015. The information sources for this initiative were the Ethiopian Railway Corporation transport plan, the Transport Sector Nationally Appropriate Mitigation Actions Plan, Ministry of Transport data, and statistics from the National Bank of Ethiopia. The abatement potential of shifting freight to electric rail reaches 8.9 Mt CO2e per year in 2030. The abatement potential was calculated using the following assump-tions:
■ Fuel efficiency of freight transport by rail and road. The STC expects the electric rail network to be powered by renewable energy. Thus, freight trans-ported by rail would produce zero emissions. Road cargo was assumed to be transported by vehicles with the following 2010 fuel efficiencies:
– 5-19 quintals: 40 litres per 100 tonne-km
– 20-34 quintals: 8.3 litres per 100 tonne-km
Federal Democratic Republic of Ethiopia 183

– 35-69 quintals: 6 litres per 100 tonne-km
– 70+ quintals: 5.7 litres per 100 tonne-km
These rates of fuel efficiency were assumed to improve by 3.3% between 2010 and 2030 due to gradual improvement of the freight vehicle stock through imports.
■ Amount of freight to be shifted to electric rail. The electric rail network was assumed to transport 50% of dry and liquid cargo by 2030.
The abatement cost is calculated to be around -91 USD/t CO2e. This abatement cost incorporates:
■ Savings from substitution away from road transport. The STC assumed a road cargo transport cost of USD 0.09 per tonne-km based on a transport master plan for rail. The STC conservatively assumed an electric rail cargo transport cost of USD 0.06 per tonne-km based on the expected cost of the electric rail network. This amounts to a savings of USD 0.03 per tonne-km applied to the 61.3 billion tonne-km shifted from road to rail. This amounts to more than USD 1.8 billion in annual savings in 2030.
■ Investment cost of electric rail network. Based on total electric rail project cost estimates and per-km track cost estimates from the Ethiopian Rail Corpo-ration, the STC estimates the total cost of the electric rail network to be USD 15.6 billion USD for 5,196 km of track. Total track length was taken from the Transport Sector Nationally Appropriate Mitigation Actions.
ABATEMENT LEVERS – FEASIBILITY AND ECONOMIC IMPACT ASSESSMENT
Feasible levers with high impactThe Transport sector contains two initiatives with high impact and moderate feasi-bility: fuel efficiency standards for all vehicle types and construction of an electric rail network for freight transport.
■ Fuel efficiency standards for all vehicle types. This policy-based initiative offers a highly feasible opportunity to realise other environmental and socio-economic benefits while also saving drivers’ money over the lifetime of their vehicles’ utilisation. Fuel economy standards would reduce air and noise pollution, improve the balance of payments through reduced fossil fuel imports, and lower the lifetime cost of vehicle ownership, since the higher price of
Federal Democratic Republic of Ethiopia 184

incrementally more efficient vehicles would be more than outweighed by fuel
cost savings. Fuel efficiency standards have been successfully implemented in other developing countries. The key challenges in Ethiopia would be related to building the institutional capacity needed to enforce the standards and monitor the implementation. Lowering import duties for fuel-efficient cars may be considered to speed up implementation.
■ Electric rail network for freight transport. In addition to having a large abatement potential, shifting 50% of freight transport to electric rail would have significant socio-economic benefits. Key amongst these are: improved balance of payments by reducing the need for imported fossil fuel, improved industry international competitiveness through lower transport costs, improved road safety, reduced air and noise pollution, and increased employment. The large infrastructure required by this initiative (5,196 km of track) poses a significant but achievable challenge. Extensive technical assistance would be needed from abroad, and careful planning would need to be carried out to keep possible population displacement by the network at a minimum. The large financing requirement (USD 15.6 billion) also poses a hurdle, but these requirements are largely offset by the significant economic benefits in the future.
Other leversAll the other Transport sector abatement levers were evaluated as being moder-ately to highly feasible, but their abatement potential is much smaller (combined value of 1.2 Mt CO2e in 2030). Despite their lower greenhouse gas abatement potential, these other levers have substantial co-benefits (reduced air and noise pollution, improved balance of payments through reduced imports of fossil fuel, improved road safety, improved public transit, reduced road congestion) and are attractive initiatives in their own right, albeit at a smaller scale.
In addition to the above levers, more ideas for carbon abatement in the Transport sector are under discussion and could possibly be implemented in the future. Ideas include changing roads from gravel to asphalt, establishing dry ports, encouraging the use of telecommunication as well as promoting scooters and bicycles. These additional possible levers were not quantified as of yet due to limited expected abatement potential or current constraints in implementability. Nonetheless, they should be considered for future implementation as the initiatives may have significant societal benefits.
Federal Democratic Republic of Ethiopia 185

ABATEMENT LEVERS – IMPLEMENTATION TIMELINE AND RESOURCE
REQUIREMENTS
Implementation timeline The Transport STC has selected three initiatives based on abatement potential and implementability as priorities for rapid implementation. These initiatives are the electric rail network, fuel efficiency standards (FES), and ethanol (Figure 68). The implementation of electric rail is envisaged to commence at the end of 2012, while its utilization will commence in 2015. The other initiatives will kick off in 2015 to provide time for approval procedures and required capacity building. It is important to mention that these dates mark the start of the implementation, which for some initiatives is staged across several years, includes some required pre-paratory work (e.g., development of investment plans), and is subject to approval by the respective authorities and availability of funding. Hence, the full impact of the initiatives will only occur later in most cases.
FIGURE 68
Transport – Overview of timeline for implementation of initiatives
2012 2013 2014 2015 2016Q1 Q2 Q3 Q4 Q1 Q2 Q3 Q4 Q1 Q2 Q3 Q4 Q1 Q2 Q3 Q4 Q1 Q2 Q3 Q4
Plug-in electric
Hybrid
Bus rapidtransit
Light rail
B5
E15
Fuel economystandards
Electric rail
Activity
Selected as priority initiative
Other initiatives
Federal Democratic Republic of Ethiopia 186
In addition, the non-prioritised initiatives are envisaged to start in 2015 consecu-
tively with the FES initiative. The targets are set at 2015 to allow sufficient time for appropriate technologies to develop and research to be conducted.
Resource requirements and existing projectsTogether, the transport initiatives will cost USD 22.9 billion until 2030. This cost is comprised almost entirely of capital expenditure. The expenditure for the period until and including 2015 is USD 2.8 billion, mostly representing the capital expen-diture for the electric rail network starting in 2013 (Figure 69).
FIGURE 69
Transport – Financial overview of all initiativesMillion USD
Short-term: 2011-2015 Long-term 2011-2030
CAPEX1 additional
OPEX additional(excl. programme cost)
Programme cost
Savings/income
Abatement expenditurebefore carbon revenue -2,370
420
0
0
2,790
10
22,920
10
0
22,900
▪ FES accounts for most of the savings in the first period; electric rail contributes significantly in the second
87212
1 Full capital expenditure, not amortised2 Aggregated abatement potential for the given period; expenditure per t CO2e here is not equivalent to the abatement cost in the cost curve, as the CAPEX
abatement expenditure is not annualised via amortisation (the analysis here takes the cash-flow perspective)
Mt CO2e total aggregated abatement potential
Mt CO2eabatement potential
The cost savings in the period 2011-2030 are significant as well, while the savings are less significant in the period from 2011-2015. The societal costs savings in the period until and including 2015 is USD 420 million, which leaves the country with a net cost of USD 2.4 billion. For the 20-year period of 2011-2030, these savings are even larger at USD 22.9 billion, resulting in a net societal saving of USD 10 million.
Federal Democratic Republic of Ethiopia 187

Figure 70 shows a categorisation of the different initiatives. Category A represents
investments that achieve a positive net present value within the first five years. This category is comprised of the FES initiative and requires a total investment of USD 4.1 billion. The USD 15.6 billion in category C has no positive net present value over the first 20 years. This category includes the electric rail, biodiesel, and ethanol initiatives. These initiatives will need to be financed with performance-based grants or other forms of climate finance. It should be noted; however, that the rail network will have a positive net present value in the long run and will thus pay back for itself over the course of its investment. The other initiatives still represent significant societal benefits in the form of improved air quality and avoided emissions.
FIGURE 70
Transport – 32% of costs will have positive returns in the short run
Category CNo positive return,
grants/performance pay requirement
15,590
Category BPositive return, but long-term financing
requirement
0
Category APositive return,
short-term financingrequirement
7,320
Million USD, total cost1 Percent of total cost
32% 0% 68%
1 Including additional CAPEX, additional OPEX, and programme cost2 NPV calculated at 6% discount rate
Definition Positive NPV2 of first five years of cash flow (from start of initiative)
Positive NPV2 of overall initiative(from start of initiative up to 2030), but not after first five years
Negative NPV2 of overall initiative(from start of initiative up to 2030)
At present, two initiatives are already in the planning phase, namely the light rail transit in Addis Ababa and the electric rail for freight. The Ministry of Transport plays a leading role in both. The ministry aims to play a leading role in the implementation of the other levers as well.
Federal Democratic Republic of Ethiopia 188

List of References
LITERATURE, RESEARCH PAPERS, AND PRESENTATIONS
Addis Ababa City (2009): Overview of SWM of Addis Ababa, presentation to the delegation of Ethiopian cities, Addis Ababa, October 2009.
BDA Group (2009): The full cost of landfill disposal in Australia, report prepared for the Department of the Environment, Water, Heritage and the Arts, Melbourne.
Bekele, Seleshi; Hagos, Fitsum; Makombe, Godswill; Namara, Regassa (2009): Importance of Irrigated Agriculture to the Ethiopian Economy: Capturing the Direct Net Benefits of Irrigation, IWMI Research Report 128, Colombo: IWMI.
Blackburn, R.S. (2009): Sustainable Textiles, Life Cycle and Environmental Impact, Cambridge.
Bracmort, K.; Ramseur, J.; McCarthy, J.; Folger, P. and Maples, D. (2011): Methane Capture: Options for Greenhouse Gas Emission Reduction, Congressional Research Service, CRS Report for Congress, Washington, DC.
Buttazzoni, M. (2009): GHG Emissions Reductions With Industrial Biotechnology: Assessing the Opportunities, Palmetto.
Canning, D. and Pedroni, P. (2004): The Effect of Infrastructure on Long Run Economic Growth, Boston.
CDM Executive Board (2011): Tool to calculate project or leakage CO2 emissions from fossil fuel combustion, Version 02, EB 28, Meeting Report, Annex 13.
CDM Executive Board (2008): Tool to calculate project or leakage CO2 emissions from fossil fuel combustion, Version 02, EB 41, Annex 11.
CDM Executive Board (2010): Indicative simplified baseline and monitoring methodologies for selected small-scale CDM project activity categories, Type II: Energy Efficiency improvement projects, Version 04, EB 54, Sectoral Scope 03.
Federal Democratic Republic of Ethiopia 189

CDM Executive Board (2010): Indicative simplified baseline and monitoring
methodologies for selected small-scale CDM project activity categories, III.H./Version 15, EB 55, Sectoral Scope 13.
CDM Executive Board (2011): Tool to determine methane emissions avoided from disposal of waste at a solid waste disposal site, Version 05.1.0, EB 61, Annex 10.
CDM Executive Board (2010): Consolidated Baseline Methodology for Increasing the Blend in Cement Production, ACM0005, EB 50.
City Government of Addis Ababa (October 2010): Addis Ababa Bus Rapid Transit Line Feasibility Study, Addis Ababa.
Danish Co-operation for Environment in Eastern Europe (2004): Methane Gas Capture and Electricity Production at Chisinau Wastewater Treatment Plant, Moldova, Draft CDM Project Design Document, Danish Ministry of Environment.
Demissie, Y. (2009): CDM Project opportunities on Landfills Methane Recovery and Power Generation for Energy Utilization in Seven Cities of Ethiopia Urban Solid Waste Management, Ethiopia Ministry of Works and Urban Development, Addis Ababa, 27-28 October 2009.
Dikshita, A.K. and Birthal, Pratap S. (2010), Environmental Value of Draught Animals: Saving of Fossil-fuel, and Prevention of Greenhouse Gas Emission, Agricultural Economics Research Review, Vol. 23, pp 227-232.
Dorosh (2007): Agricultural Production, Not published.
East African Power Pool (2011): Master Plan Studies, Dar es Salaam.
Ethiopian Electric Power Corporation (2007, updated 2011): Power System Master Plan, Addis Ababa.
Ethiopian Railways Corporation (March 2011): Transport Planning for BFS of Addis Ababa-Djibouti Railway Project Final Report, Civil Engineering Dept., Addis Ababa University.
Ethiopian Railways Corporation (July 2009): Addis Ababa E-W & N-S (PHASE I) Light Rail Transit Project Feasibility Study, Addis Ababa.
Ethiopian Rural Development and Promotion Center (2007): Solar and Wind Energy Utilization and Project Development Scenarios, Addis Ababa.
Federal Democratic Republic of Ethiopia 190
Ethio Resource Group (2009): Diversity and Security for the Ethiopian Power
System, Addis Ababa.
European Cement Research Academy (2009): Development of State of the Art Techniques in Cement Manufacturing: Trying a Look Ahead, Düsseldorf.
Fedderke, J.W. and Bogetic, Z. (2010): Infrastructure and Growth in South Africa: Direct and Indirect Productivity Impacts of 19 Infrastructure Measures, Cape Town.
Federal Democratic Republic of Ethiopia (2011): Forest Carbon Partnership Facility, Readiness Preparation Proposal, Addis Ababa.
Figueres, C. and Bosi, M. (2006): Achieving greenhouse gas emission reductions in developing countries through energy efficient lighting projects in the clean development mechanism (CDM), The Carbon Finance Unit, World Bank, Washington, D.C.
Forum for Environment (2009): Ethiopian Forestry at the Crossroads: The Need for Strengthened Institutional Setup, Addis Ababa: Forum for Environment.
Foster, V. and Morella, E. (2011): Ethiopia’s Infrastructure – A Continental Perspective, Policy Research Working Paper 5595, World Bank, Washington, D.C.
Gaul, M. (2009): Subsidy Schemes for the Dissemination of Improved Stoves – Experiences of GTZ HERA and Energising Development, Eschborn.
GIZ Energy Coordination Office Ethiopia (2011): The Energy Development Intervention in Ethiopia, March 2011.
Gruenspecht, H. (2010): International Energy Outlook 2010 with Projections to 2035, Center for Strategic and International Studies, Washington, D.C.
GTZ (2010): Energising Development – Report on Impacts, Eschborn.
GTZ Information and Advisory Service on Appropriate Technology (ISAT) (2009): Biogas – Costs and Benefits and Biogas – Programme Implementation, Biogas Digest, Volume III.
Hongyang He, O.; Gallagher, K. S.; Donglian, T. and Jinhua, Z. (2009): China’s Fuel Economy Standards for Passenger Vehicles: Rationale, Policy Process, and Impacts, Discussion Paper 2009-03, Belfer Center for Science and International Affairs, Harvard University.
Federal Democratic Republic of Ethiopia 191
Hussain, I. (2005): Pro-poor Intervention Strategies in Irrigated Agriculture in
Asia, International Water Management Institute, Colombo, Sri Lanka.
Hydrovision (2008): Hydro Finance Handbook, Kansas City.
International Finance Corporation (2011): Doing Business 2011: Making a Difference for Entrepreneurs, Washington: The World Bank Group.
Intergovernmental Panel on Climate Change (2006): 2006 IPCC Guidelines for National Greenhouse Gas Inventories, Volume 4: Agriculture, Forestry and Other Land Use, Geneva.
Intergovernmental Panel on Climate Change (2007): Mitigation of Climate Change, Fourth Assessment Report, Working Group III.
Intergovernmental Panel on Climate Change (2006): 2006 IPCC Guidelines for National Greenhouse Gas Inventories, Volume 4: Agriculture, Forestry and Other Land Use, Geneva.
Intergovernmental Panel on Climate Change (2001): IPCC Good Practice Guidance and Uncertainty Management in National Greenhouse Gas Inventories, Geneva.
International Energy Agency (2009): Cement Technology Roadmap 2009, Carbon Emissions Reductions up to 2050, Paris.
International Hydropower Association (2010): Hydropower Sustainability Assessment Protocol.
International Water Management Institute (2009): Small-scale irrigation in the Ethiopian highlands. What potential for poverty reduction and climate adaptation?, Addis Ababa.
Kennedy/Jenks Consultants (2008): City of San Rafael and Central Marin Sanitation Agency Methane Capture Feasibility Study, KJ 0868015.
Kinfu, M. (2009): Landfill Methane Recovery and Power Generation-CDM Projects in Ethiopia, HoAREC-AAU, Addis Ababa, 27-28 October 2009.
Masera, O.R.; Saatkamp, B.D. and Kammen, D.M. (2000): From Linear Fuel Switching to Multiple Cooking Strategies: A Critique and Alternative to the Energy Ladder Model, World Development, Vol. 28 (12), pp. 2083-2103.
Federal Democratic Republic of Ethiopia 192

Megen Power (2008): Impact Assessment of Mirt Improved Biomass Injera Stoves
Commercialization, Final Report submitted to MoARD/GTZ SUN Energy Programme, Addis Ababa.
Mekuriaw, A. and Jembere, K. (2008): Assessment of capacity building needs of small to medium sized utilities in the water and sanitation sector in Ethiopia, Final Report submitted to Cap-Net, Addis Ababa.
Ministry of Agriculture, Federal Democratic Republic of Ethiopia (2004): Woody Biomass Inventory and Strategic Planning Project Phase 2, Final Report, Addis Ababa.
Ministry of Agriculture, Federal Democratic Republic of Ethiopia (2004): Woody Biomass Inventory and Strategic Planning Project – Forest Resources of Ethiopia, Addis Ababa.
Ministry of Finance and Economic Development, Federal Democratic Republic of Ethiopia (2010): Growth and Transformation Plan, Addis Ababa.
Ministry of Mines, Federal Democratic Republic of Ethiopia (2007): The Biofuel Development and Utilization Strategy of Ethiopia, Addis Ababa.
Ministry of Transport and Communication, Federal Democratic Republic of Ethiopia (2008): Annual Statistical Bulletin 2007/2008, Transport Services Summary, Addis Ababa.
Ministry of Transport and Communication, Federal Democratic Republic of Ethiopia (2007): National Transport Master Plan Study, Vol. 2. Action Plan, Addis Ababa.
Nwoboshi, L. C. (1981): Soil productivity aspects of agri-silviculture in the West African rain forest zone, University of Ibadan, Nigeria.
OECD and IEA (2010): Projected Costs of Generating Electricity, Paris.
Quality and Standards Authority of Ethiopia (2005): Ethiopian Standard ES1177-1:2005, Cement – Composition, specifications and conformity criteria for common cements, Addis Ababa.
Rayner, S. (2010): Fuel economy/CO2 labeling and taxation: South African Motor Industry experience, National Association of Automobile Manufacturers of South Africa/Ford Motor Company.
Federal Democratic Republic of Ethiopia 193

Regassa, N.; Sundaraa, R. D. and Seboka, B. B. (2011): Challenges and
Opportunities in Municipal Solid Waste Management: The Case of Addis Ababa City, Central Ethiopia, J Hum Ecol, Vol. 33 (3), pp.: 179-190.
Rural Electrification Executive Secretariat (2006): Off-grid Rural Electrification Master Plan Study, Addis Ababa.
Sarkar, A. (2008): The Role of Carbon Finance, World Bank, Lighting Africa 2008, Accra, 7 May 2008.
Sarkar, A. (2008): Large scale CFL deployment programs: mainstreaming carbon finance and clean development mechanism (CDM), World Bank, Shanghai, 13 May 2008.
Scottish Environment Protection Agency and UK Environment Agency (2002): Guidance on Landfill Gas Flaring.
Seyoum, T. (2007): GHG Emission in the Leather Industry, Addis Ababa University Department of Chemical Engineering, M.Sc. Thesis, Addis Ababa.
Smith, K.R. et al. (1993): One Hundred Million Improved Cookstoves in China: How Was it Done?, World Development, Vol. 21 (6), pp. 941-961.
Takeshi, T. et al. (2011): Will African Consumers Buy Cleaner Fuels and Stoves? Research Report, Stockholm Environment Institute, Stockholm.
Tennigkeit, T.; Kahrl, F.; Woelcke, J. and Newcombe, K. (2009): Agricultural carbon sequestration in Sub-Saharan Africa: Economics and institutions, World Bank, Washington, DC.
The Economist (2011): Africa's Impressive Growth, January 6, London: The Economist Group.
The Federal Democratic Republic of Ethiopia (2010): Growth and Transformation Plan, Addis Ababa.
UNDP (2009): Bio-carbon opportunities in Eastern and Southern Africa, Harnessing Carbon Finance to Promote Sustainable Forestry, Agro-Forestry and Bio-Energy, New York.
UNDP (2009): Biomass Energy for Cement Production: Opportunities in Ethiopia, New York.
Federal Democratic Republic of Ethiopia 194

UNEP and EcoSecurities (2007): Guidebook to Financing CDM Projects,
The Hague.
UNFCCC (2010): CDM Methodology Booklet, Information including EB 56.
UNIQUE (2010): Carbon Finance Opportunities in Ethiopia’s Agricultural Sector, Freiburg: UNIQUE.
U.S. Energy Information Administration (2010): International Energy Outlook, Washington, D.C.
Van Benthem, A. and Romani, M. (2009): Fuelling Growth: What Drives Energy Demand in Developing Countries?, The Energy Journal, Vol. 30 (3), pp. 91-114.
Vanderschuren, M. and Jobanputra, R. (July 2005): Fuel Efficiency Measures for South Africa, Proceedings of the 24th Southern African Transport Conference, Pretoria, South Africa.
Wölcke, J. and Tennigkeit, T. (2009): Harvesting agricultural carbon in Kenya, The International Journal for Rural Development, Vol. 43 Nr. 1.
Wood, S. and Cowie, A. (2004): A Review of Greenhouse Gas Emission Factors for Fertiliser Production, New South Wales.
World Bank and ECON (2008): Costing Power Infrastructure Investment Needs in Southern and Eastern Africa, Oslo.
World Bank (2007): Second Electricity Access Rural Expansion Project, Washington, D.C.
World Health Organization (2007): Indoor Air Pollution: National Burden of Disease Estimates, Geneva.
Worrell, E., Galitsky, C., and Price, L. (2008): Energy Efficiency Improvement Opportunities for the Cement Industries, Berkeley.
INTERNET SOURCES
All Africa (2009): Establish a Fertilizer Manufacturing Plant, http://allafrica.com/stories/200910190826.html (August 2011).
Central Statistical Agency, Federal Democratic Republic of Ethiopia, www.csa.gov.et (August 2011).
Federal Democratic Republic of Ethiopia 195
Economy Watch (2011): Foreign Exchange Reserves,
http://www.economywatch.com/economic-statistics/economic-indicators/Foreign_Exchange_Reserves/
FAO (2009), the State of Food and Agriculture, http://www.fao.org/docrep/012/i0680e/i0680e00.htm, (August 2011).
Nonor, D. (21 July 2010): Ghana: Fund to Invest in Improved Seed Production for Smallholder Farmers, http://allafrica.com/stories/201007210757.html (August 2011).
Mutumweno, N. (12 August 2010): NCZ, The sleeping giant, http://www.shout-africa.com/?p=2066 (August 2011).
U.S. Economics and Statistics Administration (2011): U.S. Carbon Dioxide Emissions and Intensities Over Time: A Detailed Accounting of Industries, Government and Households, http://www.esa.doc.gov/Reports/u.s.-carbon-dioxide (August 2011).
World Bank: GDP Per Capita, http://data.worldbank.org/indicator/NY.GDP.PCAP.CD (August 2011).
Federal Democratic Republic of Ethiopia 196