Embed Size (px)
Citation preview
CASCADED CROSS ENTROPY-BASED
SEARCH RESULT DIVERSIFICATION
A THESIS
SUBMITTED TO THE DEPARTMENT OF COMPUTER ENGINEERING
AND THE GRADUATE SCHOOL OF ENGINEERING AND SCIENCE
OF BİLKENT UNIVERSITY
IN PARTIAL FULLFILMENT OF THE REQUIREMENTS
FOR THE DEGREE OF
MASTER OF SCIENCE
By
Bilge Köroğlu
September, 2012

i
I certify that I have read this thesis and that in my opinion it is fully adequate, in
scope and in quality, as a thesis for the degree of Master of Science.
Prof. Dr. Fazlı Can (Advisor)
I certify that I have read this thesis and that in my opinion it is fully adequate, in
scope and in quality, as a thesis for the degree of Master of Science.
Prof. Dr. Özgür Ulusoy
I certify that I have read this thesis and that in my opinion it is fully adequate, in
scope and in quality, as a thesis for the degree of Master of Science.
Asst. Prof. Dr. Seyit Koçberber
Approved for the Graduate School of Engineering and Science:
Prof. Dr. Levent Onural
Director of Graduate School of Engineering and Science
ii
ABSTRACT
CASCADED CROSS ENTROPY-BASED SEARCH
RESULT DIVERSIFICATION
Bilge Köroğlu
M.S. in Computer Engineering
Supervisor: Prof. Dr. Fazlı Can
September, 2012
Search engines are used to find information on the web. Retrieving relevant
documents for ambiguous queries based on query-document similarity does not
satisfy the users because such queries have more than one different meaning. In
this study, a new method, cascaded cross entropy-based search result
diversification (CCED), is proposed to list the web pages corresponding to
different meanings of the query in higher rank positions. It combines modified
reciprocal rank and cross entropy measures to balance the trade-off between
query-document relevancy and diversity among the retrieved documents. We
use the Latent Dirichlet Allocation (LDA) algorithm to compute query-
document relevancy scores. The number of different meanings of an ambiguous
query is estimated by complete-link clustering. We construct the first Turkish
test collection for result diversification, BILDIV-2012. The performance of
CCED is compared with Maximum Marginal Relevance (MMR) and IA-Select
algorithms. In this comparison, the Ambient, TREC Diversity Track, and
BILDIV-2012 test collections are used. We also compare performance of these
algorithms with those of Bing and Google. The results indicate that CCED is the
most successful method in terms of satisfying the users interested in different
meanings of the query in higher rank positions of the result list.
Keywords: Ambiguous Query, Cross Entropy, IA-Select, Latent Dirichlet
Allocation (LDA), MMR, Reciprocal Rank, Search Engine, Search Result
Diversification (SRD), Test Collection, TREC Diversity Track.
iii
ÖZET
ÇAPRAZ ENTROPİ TABANLI KADEMELİ ARAMA
SONUÇ ÇEŞİTLENDİRMESİ
Bilge Köroğlu
Bilgisayar Mühendisliği Bölümü Yüksek Lisans
Tez Yöneticisi: Prof. Dr. Fazlı Can
Eylül, 2012
Arama motorları internet üzerinden bilgi aramak için yararlanılır. Çok anlamlı
sorgular için ilgili dökümanların sorgu-doküman benzerliğine göre gelmesi
kullanıcıyı memnun etmez; çünkü sorgunun birbirinden farklı birçok anlamı
vardır. Bu çalışmada, yeni geliştirilen çapraz entropi tabanlı kademeli arama
sonuç çeşitlendirmesi (CCED) yöntemi, sorgunun farklı anlamlarını içeren
dokümanları arama sonuç listesinde üst sıralara yerleştirir. Değiştirilmiş ters
sıralama ve çapraz entropi ölçümlerini birleştirerek sorgu-doküman benzerliği
ile doküman-doküman çeşitliliği arasındaki ilişkiyi dengeler. Sorgu-doküman
benzerliğini hesaplamak için Latent Diriclet Allocation (LDA) kullanılmıştır.
Çok anlamlı sorgunun anlam sayısı, tam bağlı kümeleme tekniği ile tahmin
edilmiştir. İlk Türkçe arama sonuç çeşitlendirme deney derlemi, BILDIV-2012,
oluşturulmuştur. CCED’in başarısı iki yöntem ile karşılaştırılmıştır, Maximum
Marginal Relevance (MMR) ve IA-Select. Bu karşılaştırmada Ambient, TREC
Diversity Track ve BILDIV-2012 deney derlemleri kullanılmıştır. Bu
algoritmaların başarısı Bing ve Google ile karşılaştırılmıştır. Sonuçlar, CCED’in
sorgunun çeşitli anlamlarıyla ilgilenen kullanıcılara en ilgili dokümanları üst
sıralarda getirmesi açısından diğer yöntemlere göre daha başarılı olduğunu
göstermektedir.
Anahtar Kelimeler: Çok anlamlı sorgu, Çapraz Entropi, Latent Dirichlet
Allocation (LDA), MMR, IA-Select, Ters Sıralama, Arama Motoru, Arama
Sonuç Çeşitlendirmesi, Deney derlemi, TREC Diversity Track.
iv
Acknowledgements
First and foremost, I would like to express my sincerest gratitude to my
supervisor, Prof. Fazlı Can. I thank him to introduce me how to make research
in an exciting and enjoyable way. Without his invaluable guidance and support,
this study would not been completed.
I also thank my jury members, Prof. Dr. Özgür Ulusoy and Assist. Prof. Dr.
Seyit Koçberber for reading and reviewing my thesis.
I am grateful to David A. Pane of Carnegie Mellon University and Assist.
Prof. Dr. B. Taner Dinçer of Muğla University for their help to conduct the
experiments of my thesis.
I am indebted to the annotators who contribute the construction of Turkish
search result diversity test collection, BILDIV-2012.
I would like to thank the members of Bilkent Information Retrieval Group,
Çağrı Toraman and Hayrettin Erdem for their friendship and contribution in
BILDIV-2012.
Besides, I acknowledge the financial support of TÜBİTAK under the grant
number 109E006, and Bilkent University Computer Engineering Department.
Finally, an honorable mention goes to my beloved parents Ümran and Erdal
for their understanding and patience when I am frustrated. Also, I am thankful to
my brother, Kaan, for his contribution during construction of BILDIV-2012 and
morale support throughout my thesis.

v
To all women who face
discrimination, oppression, and violence.
vi
Contents
1. INTRODUCTION ...................................................................................................... 1
1.1 MOTIVATIONS OF THE STUDY ............................................................................... 3
1.2 CONTRIBUTIONS OF THE STUDY ............................................................................ 5
1.3 OVERVIEW OF THE STUDY .................................................................................... 6
2. RELATED WORK ..................................................................................................... 7
2.1BACKGROUND ...................................................................................................... 7
2.2 INTENT-BASED DIVERSIFICATION METHODS ........................................................ 8
2.2.1 Diversification with Query Meanings ............................................................ 8 2.2.2 Personalization of Diversification ............................................................... 10
2.3 OBJECTIVE FUNCTION-BASED DIVERSIFICATION METHODS ................................ 11
2.3.1 Combining Relevancy and Novelty: A trade-off problem ............................. 11 2.3.2 Objective functions designed for optimizing evaluation metrics ................... 13
2.4 DIVERSIFICATION WITH MACHINE LEARNING TECHNIQUES ................................. 13
3. PRE-CCED OPERATIONS ..................................................................................... 15
3.1 CONTENT EXTRACTION WITH HTML PARSERS ................................................... 16
3.2 CONTENT TOKENIZATION AND STEMMING .......................................................... 17
3.3 NUMBER OF MEANING ESTIMATION ................................................................... 19
3.4 ASSIGNING MEANING PROBABILITIES TO DOCUMENTS ....................................... 21
3.4.1 The Notation of LDA ................................................................................... 22 3.4.2 Components of LDA Models........................................................................ 23 3.4.3 Learning Process in LDA ............................................................................ 23 3.4.4 Employing LDA in CCED ........................................................................... 27
4. CASCADED CROSS ENTROPY-BASED SEARCH RESULT
DIVERSIFICATION: THE ALGORITHM ........................................................... 29
4.1 COMPUTING RECIPROCAL RANKS WITH SOM VALUES ....................................... 30
4.2 A DIVERSITY METRIC: CROSS ENTROPY ............................................................. 34
4.3 RANKING WITH MONO-OBJECTIVE MINIMIZATION FUNCTION USING CASCADED
FRAME .................................................................................................................................. 37
5. AN AXIOMATIC APPROACH TO CCED ............................................................ 41
vii
6. EXPERIMENTAL ENVIRONMENT ..................................................................... 50
6.1 BILDIV-2012 TURKISH SRD TEST COLLECTION ................................................ 50
6.1.1 The Structure of BILDIV-2012 .................................................................... 51 6.1.2 Annotation Process ..................................................................................... 52
6.2 AMBIENT AND TREC TEST COLLECTIONS .......................................................... 55
6.3 COMPARISON OF COLLECTIONS .......................................................................... 56
7. PERFORMANCE EVALUATION MEASURES ................................................... 60
8. EXPERIMENTAL RESULTS ................................................................................. 65
8.1 AN OVERVIEW OF MMR AND IA-SELECT ALGORITHMS ..................................... 66
8.2 THE DIVERSIFICATION RESULTS ON AMBIENT .................................................... 66
8.3 THE DIVERSIFICATION RESULTS ON TREC COLLECTIONS ................................... 69
8.4 THE DIVERSIFICATION RESULTS ON BILDIV-2012 ............................................. 72
8.4.1 Diversification of Bing Results .................................................................... 73 8.4.2 Diversification of Google Results ................................................................ 75 8.4.3 Diversification of Whole BILDIV-2012 Results ........................................... 78
9. CONCLUSION AND FUTURE WORK ................................................................. 80
viii
List of Figures
Figure 1.1 Search result list of Bing for the query, “bent” on September 9th
,
2011. ............................................................................................................. 3
Figure 3.1. The flow of execution in the preparation phase of CCED. .............. 16
Figure 3.2 Sample raw and extracted content of a web page. ............................ 18
Figure 3.3. Term by document binary occurrence matrix which is employed in
CCED preparation phase. ........................................................................... 19
Figure 3.4. The correlation between boundary values and total intra-cluster
values in number of meaning estimation for the query “acil servis.” ........ 21
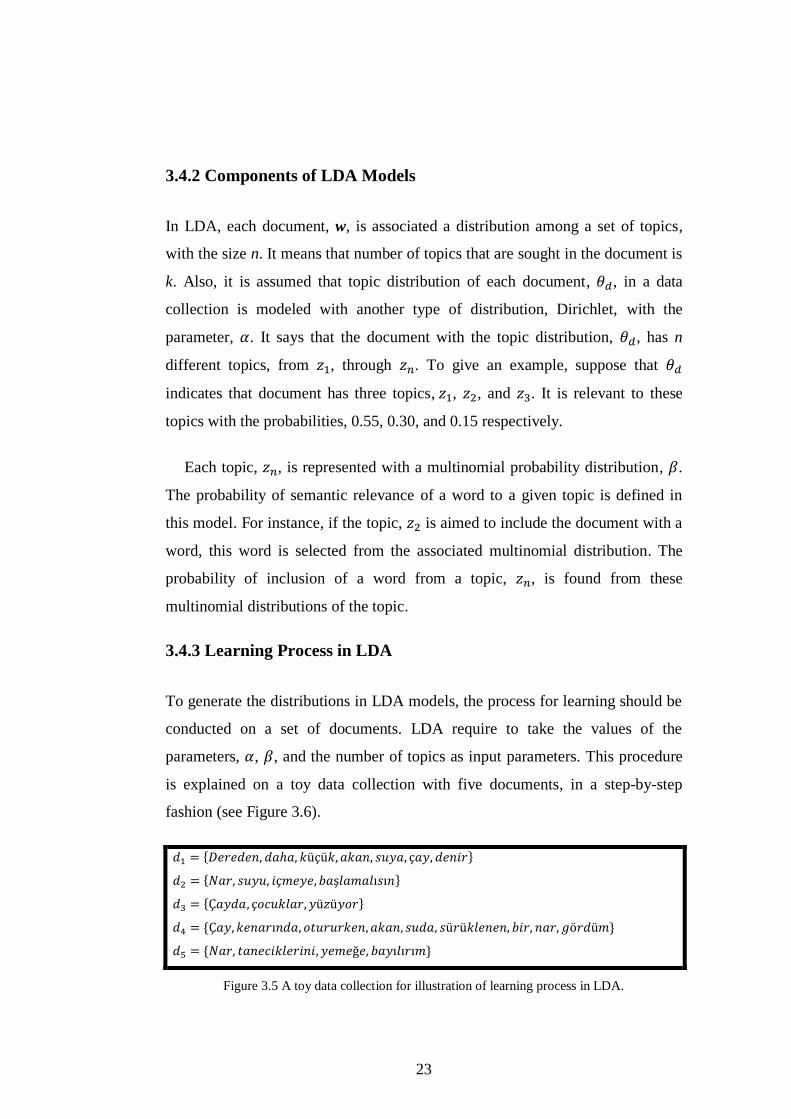
Figure 3.5 A toy data collection for illustration of learning process in LDA. ... 23
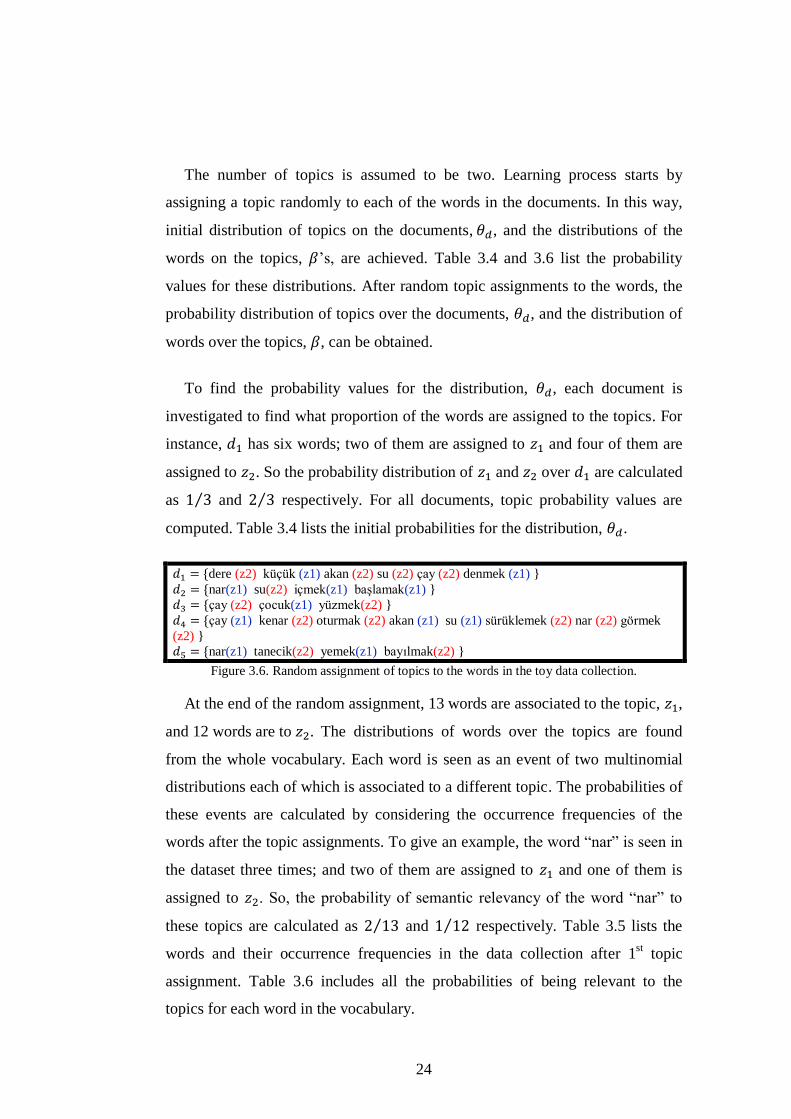
Figure 3.6. Random assignment of topics to the words in the toy data collection.
.................................................................................................................... 24
Figure 3.7 Topic assignments of the words after 1st iteration in the toy data
collection. ................................................................................................... 26
Figure 4.1. The flow of execution in CCED. ..................................................... 30
Figure 4.2. The square matrix that includes the diversity values computed
between the documents in . ................................................................ 36
Figure 4.3 The illustration of cascaded frame (sliding frame) idea in CCED. ... 40
Figure 6.1 The flow of construction of test collection, BILDIV-2012. ............. 52
Figure 6.2 A screenshot from the web annotation program, developed to label
BILDIV-2012. ............................................................................................ 53
Figure 6.3 The difference between real and random annotations. ..................... 55
Figure 6.4 Investigation of the correlation between the number of words and the
number of meaning of the queries in test collections. ................................ 59
Figure 7.1 ERR-IA computation among top five documents on the toy
diversified list. ............................................................................................ 64
Figure 8.1 S-recall values on Ambient. .............................................................. 67
ix
Figure 8.2 Precision-IA values on Ambient. ...................................................... 68
Figure 8.3 ERR-IA values on Ambient. ............................................................. 69
Figure 8.4 S-recall values on TREC Collections................................................ 70
Figure 8.5 Precision-IA values on TREC Collections........................................ 71
Figure 8.6 ERR-IA values on TREC Collections. .............................................. 72
Figure 8.7 S-Recall values on Bing. ................................................................... 73
Figure 8.8 Precision-IA values on Bing. ............................................................ 74
Figure 8.9 ERR-IA values on Bing. ................................................................... 75
Figure 8.10 S-Recall values on Google. ............................................................. 76
Figure 8.11 Precision-IA values on Google. ...................................................... 77
Figure 8.12 ERR-IA values on Google. ............................................................. 78
x
List of Tables
Table 3.1 The distance boundary values and associated cluster numbers for the
query, “acil servis” ..................................................................................... 20
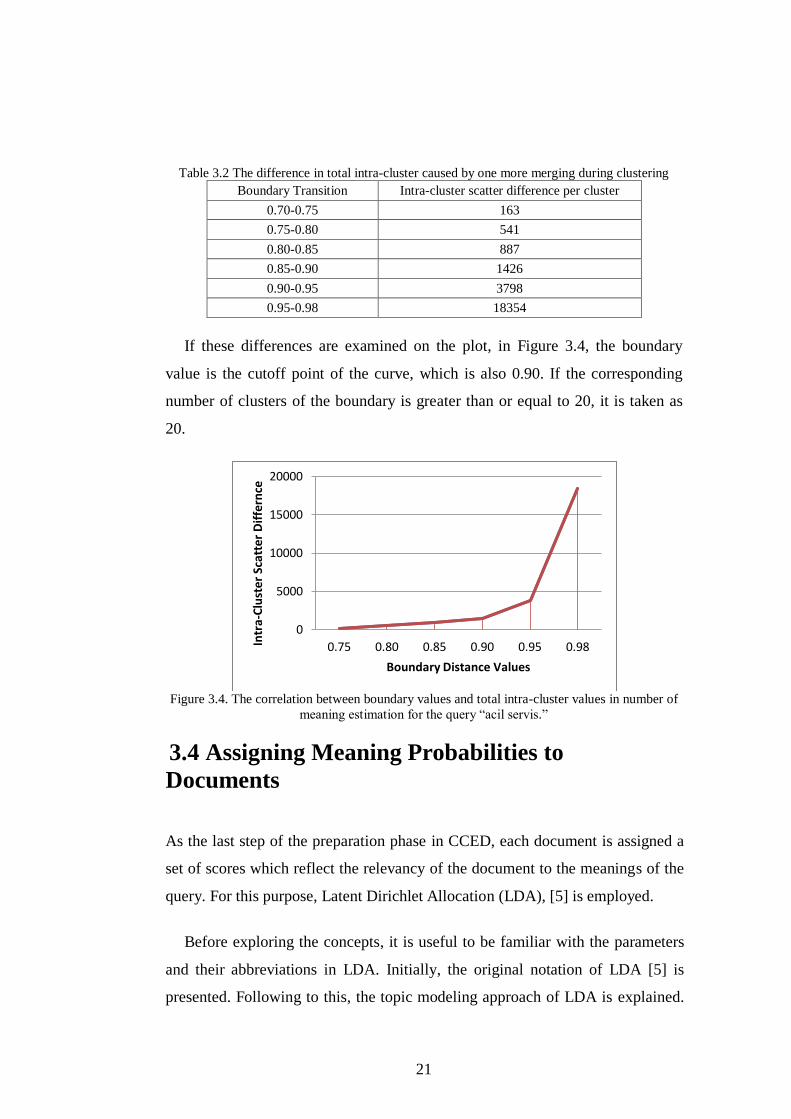
Table 3.2 The difference in total intra-cluster caused by one more merging
during clustering ......................................................................................... 21
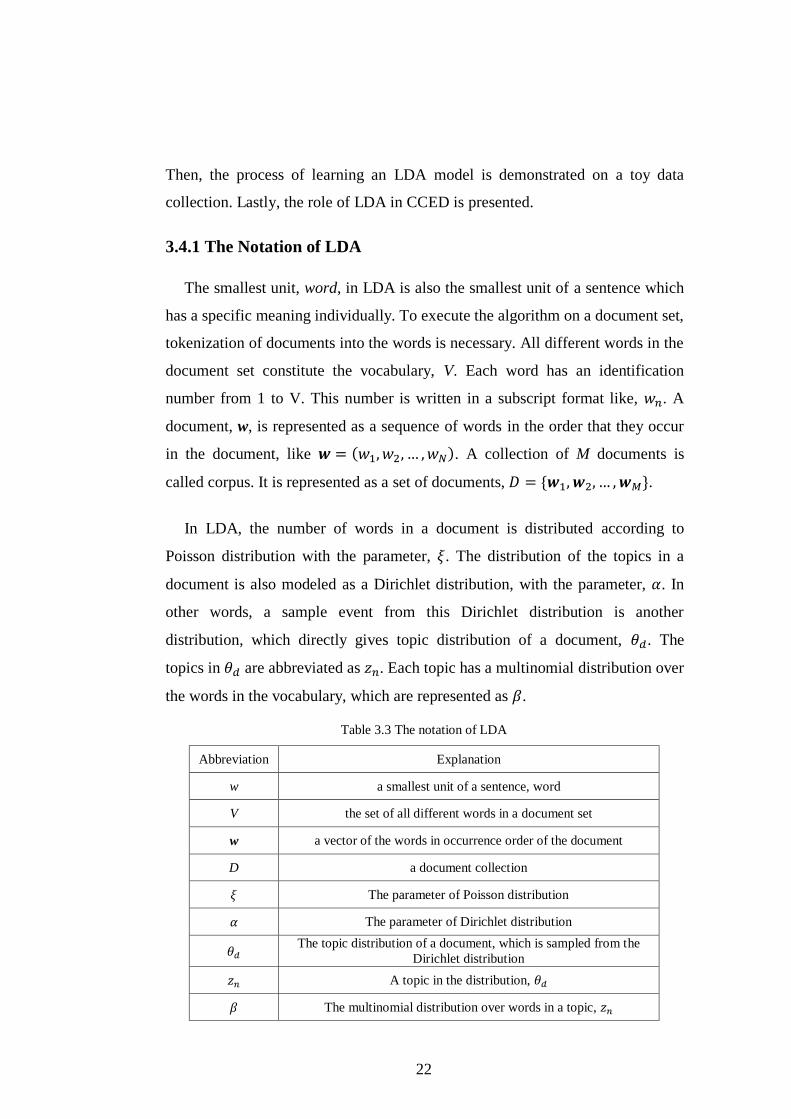
Table 3.3 The notation of LDA .......................................................................... 22
Table 3.4 The probabilities of topics over the documents in the toy data
collection .................................................................................................... 25
Table 3.5 Initial random topic assignment for learning an LDA model ............ 25
Table 3.6 The initial probabilities of words to be semantically relevant to the
topics in the toy data collection .................................................................. 26
Table 3.7 The probabilities of topics over the documents after first iteration in
the toy data collection ................................................................................. 27
Table 3.8 The probabilities of words to be semantically relevant to the topics
after first iteration in the toy data collection .............................................. 27
Table 4.1 An example of SOM computation in CCED ...................................... 33
Table 4.2 Illustration of correspondence between different retrieval systems ... 33
Table 4.3. An example of score computation in CCED .............................. 34
Table 4.4 LDA generated probabilities of the documents .................................. 37
Table 4.5 Diversity scores of the documents...................................................... 37
Table 6.1 Comparison of test collections according to the number of words in
queries ........................................................................................................ 57
Table 6.2 Comparison of test collections according to the number of meanings
of the queries .............................................................................................. 58
Table 6.3 Spearman correlation coefficient between the number of words and
the number of meanings of queries in test collections ............................... 59
xi
Table 7.1 A toy diversified search result list, with covered meanings by the
documents ................................................................................................... 61
Table 7.2 Precision-IA is computed by taking ................................................... 62
Table 8.1 S-Recall Values on BILDIV-2012 test groups ................................... 79
Table 8.2 Precision-IA values on BILDIV-2012 test groups ............................. 79
Table 8.3 ERR-IA values on BILDIV-2012 test groups .................................... 79
1
Chapter 1
Introduction
In the last two decades, web search engines have undertaken a crucial role in
satisfying information needs. A typical user utilizes web search engines to do
research about a specific topic from online sources, find the answer to a
question, and seek the websites of individuals and organizations within a short
amount of time.
The user usually clicks a set of web pages by deciding the relevancy of them
using snippets. To list the relevant pages, the query must include words that
represent the information need. Listing relevant web pages in earlier ranks of
search result list is a crucial aim of search engines. As a result, the user
satisfaction is increased.
The queries, which are sent to the search engines, are classified by Bhatia [1]
as ambiguous, unambiguous but underspecified, information gathering, and
miscellaneous.
Ambiguous queries are associated with different unrelated meanings. A
well-known example for ambiguous queries is “jaguar.” It means “an
animal,” “a car brand,” “a cocktail,” “an operating system,” etc. So, the
user probably interested in only one of these meanings.
Underspecified queries have more than one meaning. They are somewhat
related to each other. For instance, for the query, “Frank Sinatra,” it is
2
not known if the user seeks his songs, biography, or videos, etc. In other
words, the user’s intend is unclear.
Information gathering queries are written to find online sources on a
specific topic, like “military power of Turkey” or “how to cook duck.”
Miscellaneous queries are aimed to find the specific products, like
movies on the internet.
The queries, which are ambiguous and underspecified, have more than one
different meaning or interpretation. For such queries, the search engines may not
be successful to retrieve the relevant results to the actual intend of the user. For
instance, the user submits a Turkish query, “bent” to the search engine. This
query has many different meanings, like “unit of a Divan poem,” “section of a
book,” “a film,” “a music band,” “law,” “newspaper article”, “surname of a
famous footballer,” “names of different corporations,” “levee,” and “name of a
song,” etc. As these possible meanings are unrelated to each other, the user is
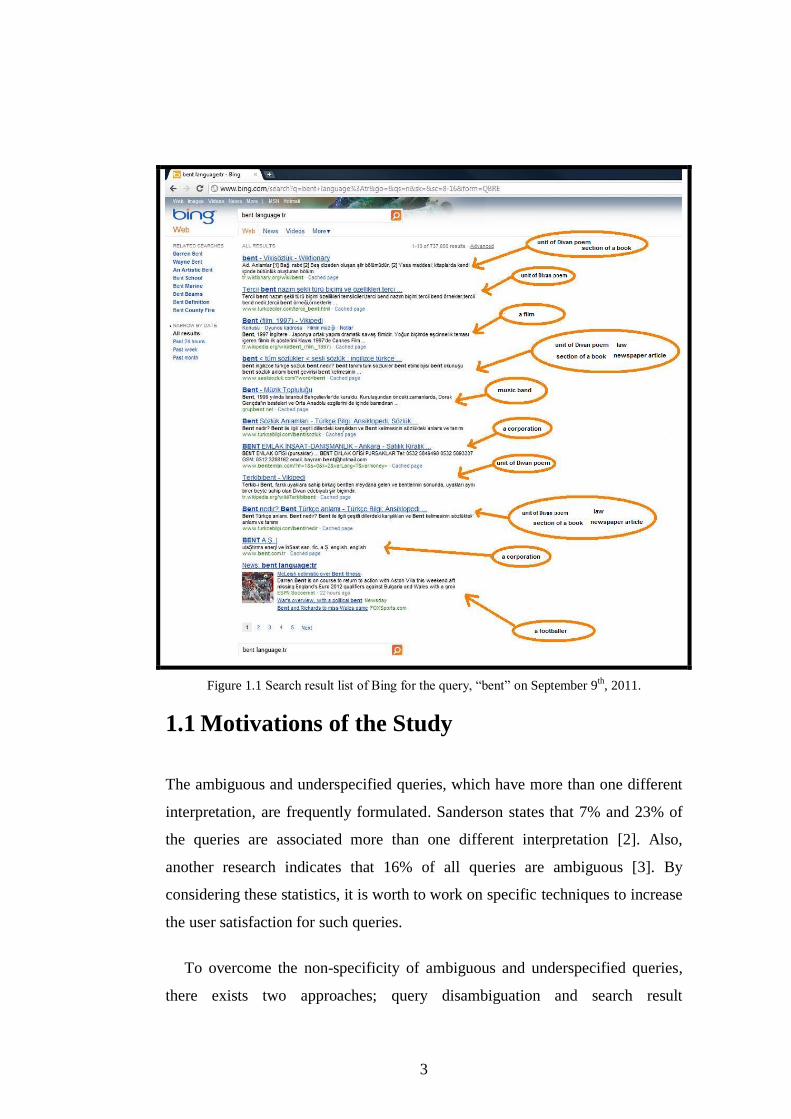
probably only interested in one of these interpretations. Figure 1.1 illustrates a
search result list of the search engine Bing for the Turkish query, “bent” on
September 9th
, 2011. It is nearly impossible to predict which one of these
meanings of the query is intended by the user.
3
Figure 1.1 Search result list of Bing for the query, “bent” on September 9th, 2011.
1.1 Motivations of the Study
The ambiguous and underspecified queries, which have more than one different
interpretation, are frequently formulated. Sanderson states that 7% and 23% of
the queries are associated more than one different interpretation [2]. Also,
another research indicates that 16% of all queries are ambiguous [3]. By
considering these statistics, it is worth to work on specific techniques to increase
the user satisfaction for such queries.
To overcome the non-specificity of ambiguous and underspecified queries,
there exists two approaches; query disambiguation and search result
4
diversification (SRD). In the former approach, the intended meaning of the
query is discerned by investigating previous queries and user clicks [4]. It
requires saving the profile of each user in the search engine side. The issues of
privacy and space complexity should also be considered. Auto completion of
queries seems a method for query disambiguation. However, suggested queries
do not reflect different interpretations of the query. Instead, they are longer
phrases, which contain the words of original query formulated by the user
instantly. So, query auto completion cannot be considered as a solution for
ambiguous queries.
The methods of search result diversification aim to include the documents
each of which covers a different interpretation of the query in the search result
list. The methods employ some techniques to estimate which web page is
relevant to which meaning of the query. In this way, it is more probable to
present at least one relevant web page to the user. Search result diversification is
a long-term solution as compared to query disambiguation, because it is not
needed to save and process user profiles. This study focuses on search result
diversification as it is more suitable method for ambiguous queries and it can be
worked without the access of huge search engine logs.
While composing the search result list, the ranking of the meanings in which
the document reflect, is another important factor. The document, which is
related to widely used meaning, like “levee” for the query “bent,” should be
ranked as the first result in the result list. On the other hand, the web document,
which is related to the “newspaper article,” should be positioned lower than the
one which mentions more common meanings, like “unit of Divan poem”. So, in
our study, the meanings of the query are examined whether they are dominant or
rarely used one.
The performance of these algorithms can be measured using language
specific test collections. To the best of our knowledge, there is no Turkish test
collection for the evaluation of search result diversification algorithms. In our
5
work, Turkish search result diversification test collection, Bilkent SRD Test
Collection 2012 (BILDIV-2012), is constructed. Different diversification
algorithms can be objectively compared by measuring their performance on
BILDIV-2012. This test collection, which we aim to share with other
researchers, would promote and support research in this area.
1.2 Contributions of the Study
In this thesis, we
Design a new technique to estimate the number of meanings of an
ambiguous query using complete-link clustering.
Use the Latent Dirichlet Allocation (LDA) [5] algorithm to compute
query-document relevancy scores.
Introduce cross entropy [6] as a diversity score between the documents,
Propose a new method for search result diversification, cascaded search
result diversification (CCED), by merging the modified reciprocal rank
score and cross entropy to balance the trade-off between query-document
relevancy and diversity among the retrieved documents.
Examine CCED in the axiomatic framework of result diversification [7],
Show the characteristics of an SRD test collection, BILDIV-2012
(Bilkent SRD Test Collection 2012), which was constructed using a
web-based search result annotation tool. BILDIV-2012 contains 47
Turkish queries and their associated relevant documents. It is available
for other researchers as the first test collection prepared for SRD studies
in Turkish.
Assess CCED by comparing its performance with a state-of-the-art SRD
algorithm, IA-Select; and the most commonly used baseline SRD
algorithm, MMR. In our assessment, we use the Ambient [8], TREC
Diversity Track [9, 10], and BILDIV-2012 SRD test collections,
It is shown that CCED is more succesful when the whole content of web
pages can be processed rather than the snippets. Although the coverage
6
of different meanings cannot be completed in higher ranks, CCED
satisfies the average user in earlier ranks than MMR and IA-Precision.
1.3 Overview of the Study
The rest of this study is organized as follows. In the next chapter, a literature
review on search result diversification is provided. In Chapter 3, the preparation
phase of CCED is introduced. In Chapter 4, we present our diversification
approach in terms of computation of similarity and diversity metrics and the
ranking scores. An investigation of CCED within the framework of eight
diversification axioms is provided in Chapter 5. Then, the evaluation metrics of
SRD methods are introduced. In Chapter 7, we present the characteristics of the
first Turkish SRD test collection, BILDIV-2012 (Bilkent SRD Test Collection
2012), which was constructed using a web-based search result annotation tool.
Also, in the same chapter, we describe the Ambient and TREC Diversity Track
test collections. The experimental results based on the comparison of CCED
with MMR and IA-Select are provided in Chapter 8. Finally, we conclude the
study with a summary of findings and future research pointers.
7
Chapter 2
Related Work
In this chapter, the background information about SRD algorithms is given. The
basic components of an SRD algorithm are presented. The approach, which
SRD algorithms follow, can be categorized into intent-based, objective function-
based, and the algorithms with machine leaning techniques. Next, an overview
of SRD algorithms is presented for each category of the algorithms.
2.1Background
The search result lists rank the relevant documents with the snippets according
to their similarities to the query. For the queries, which have multiple meanings,
the search result lists are composed so that they reflect different meanings of the
query. These lists are called diversified search result list. Such queries are
named as multi-intent queries. Each intent is associated to different meanings of
the query. In TREC, the queries are referred to as topics and the meanings are
subtopics. In addition, they are classified as ambiguous or under-represented
according to the relatedness of the meanings with each other as explained in
Chapter 1. In this study, we use the name, meaning, instead of subtopic or intent.
Also, the queries are mentioned as ambiguous and under-represented.
8
To include the documents, which reflect different meanings of the query, the
SRD algorithms use diversification metrics. The relevancy of document to the
actual query is still important while composing the diversified search result list.
However, it is obtained that while the diversified list is being included more
diverse documents, the relevancy of the documents are decreased. Most of the
diversification algorithms consider this trade-off between relevancy of
documents and diversity among the documents. They propose solutions to give
more diverse results while preserving the query-document relevancy in
reasonable values.
2.2 Intent-Based Diversification Methods
The methods in this category employ the techniques to present at least one
document which are relevant to each meaning of the query. They estimate the
relevancy of each subtopic to the documents.
2.2.1 Diversification with Query Meanings
The first study, in which the diversification problem is presented as the
disambiguation of meanings associated to each query [11]. They mention about
difficulty of learning with search engines for an unfamiliar research topic. To
give a coherent understanding of searched topic, it is proposed that the contents
of web pages, which are retrieved for an ambiguous query, are processed to
discover all possible subtopics. It is called mining topic-specific concepts. Three
effective methods are presented to retrieve the more relevant web pages for
ambiguous queries. The first method is presented by defining the important
phrase, which is a set of up to three words associated to a subtopic of the query.
The second one is also an effective method for the web pages which are
prepared in an organized way around all subtopics of the query. The last method
requires us to expect that web pages include some useful hints about subtopics
and concepts in braces “()”. From this point of view, the sentences, which
include the terms of ambiguous query and also braces, are worth to investigate
9
using some heuristics. Liu et al. also point out the problem of ambiguity of
extracted subtopics. To resolve the ambiguity, searching the web for the queries
that are formulated by combining the query and the subtopic phrases is proposed
as a solution.
Zhang et al. propose new ranking scheme, affinity ranking, which employs
two metrics, diversity and information richness [12]. By computing the diversity
metric, a set of documents is evaluated to find the number of different aspects of
the query included in this document set. Information richness of a document is
directly related to the quality of the context. Better information richness, wider
coverage of different query topics. The method combines relevancy and re-
ranking procedure with two tunable parameters, α and β. In this way, the
importance of relevancy and novelty can be weighted and changeable according
to the system needs. The traditional trade-off between relevancy and novelty is
tried to be solved by this way through this diversification algorithm. In the
affinity graph, the documents are represented as nodes and the weights of edges
are the affinity values between the documents. A group of documents, which are
linked with high affinity values, are considered as they are related to a specific
subtopic of the query. To model the flow of information, Markov Chain is
employed. The issue of redundant documents is solved with a greedy algorithm.
The aim in this method is to decrease the rank of less informative and similar
documents. In this way, redundant documents are put down in the search result
list. Moreover, the pioneer documents from each topic can be detected and
ranked in higher ranks. Still, there is a blurred part of the algorithm, which is
relevancy.
IA-Select, satisfy the average user for ambiguous query searching by
presenting at least one relevant document to intended aspect(s) of the query [13].
From this point of view, they justify that if a subtopic of the query is dominantly
mentioned in the relevant documents of the query; it tends to retrieve more
number of documents from this dominant subtopic. As a result, it takes the risk
of ranking the documents from other minor subtopics in lower ranks or not
10
including some of documents from such minor subtopics in the search result list.
This technique is differentiated from the common idea of diversification
technique, which is covering as many subtopics of the query as possible in the
search result list. IA-Select generates a diversified ranked list of documents by
finding the document which has the maximum marginal utility with a greedy
approach. This directly corresponds to the basic fact of the algorithm, MMR.
Both of the algorithms include the document which is decided as the most
different one from the set of documents that are waited to be included in the
search result list. However, they employ different heuristics and strategies to
find such documents. In practice, it usually composes the diversified list by
including one document per subtopic. Such a short list probably may not satisfy
the users.
2.2.2 Personalization of Diversification
Personalization of web search result becomes a host research topic for
diversification, which is firstly introduced by Radlinski et al. [14]. As profiling
of search engine user experiences is not a practical solution for daily usage of
search results due to the diversity of information need of a typical user. It is
proposed to find probable intents of the query that a user can search for. Query
reformulations in 30-minute log sessions are assumed to be candidate subtopics
of the query. Radlinski et al. state that the number of times of formulating a
query, being followed by another query, and the probability of following a query
by another query are used in three subtopic extraction method: Most Frequent
method, Maximum Result Variety, and Most Satisfied method. The first one
includes the queries that are mostly seen in the search sessions. The last one
filters these metrics with some threshold values. The queries, which satisfy these
requirements, are included in Most Satisfied method. The middle one,
Maximum Result Variety method, combines the probability and similarity
metric of the queries in equal proportions in equal proportions with the
parameter, λ.
11
2.3 Objective Function-Based Diversification
Methods
The methods in this category introduce an objective function. Finding the
optimum solution is designed to give the most diversified search result list. Such
an objective function is constructed with the components of a typical SRD
problem, query-document relevancy and diversity among the documents.
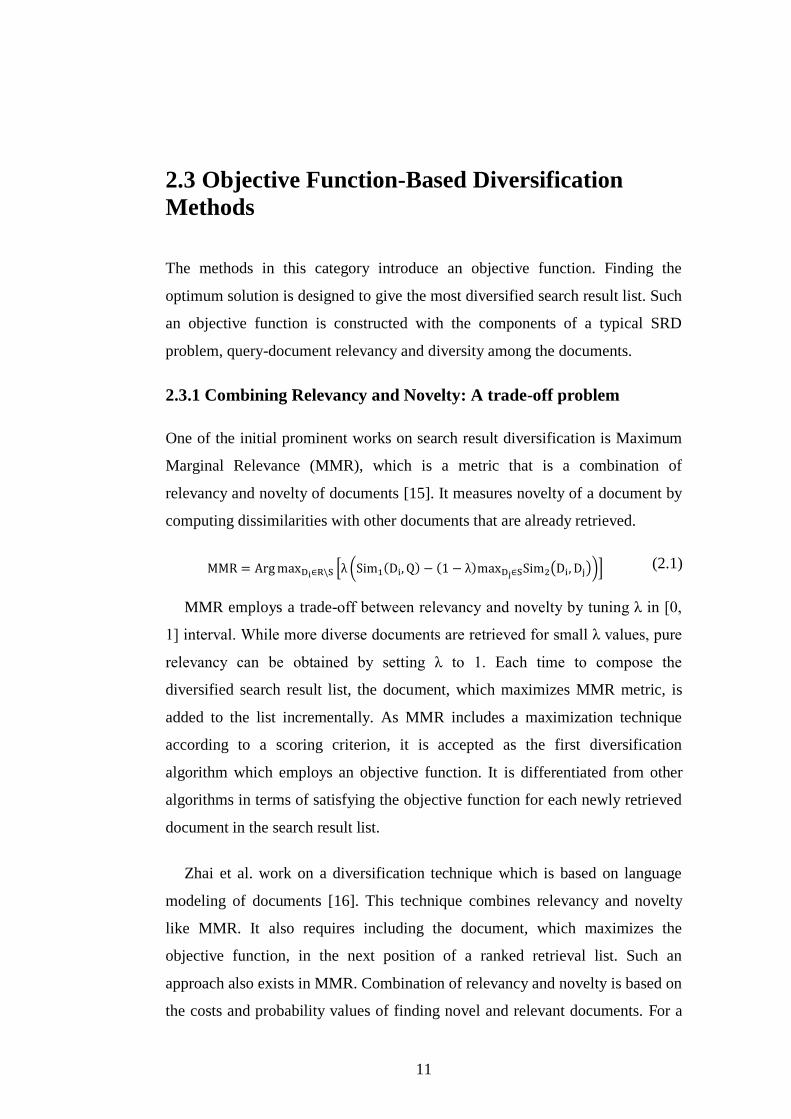
2.3.1 Combining Relevancy and Novelty: A trade-off problem
One of the initial prominent works on search result diversification is Maximum
Marginal Relevance (MMR), which is a metric that is a combination of
relevancy and novelty of documents [15]. It measures novelty of a document by
computing dissimilarities with other documents that are already retrieved.
(2.1)
MMR employs a trade-off between relevancy and novelty by tuning λ in [0,
1] interval. While more diverse documents are retrieved for small λ values, pure
relevancy can be obtained by setting λ to 1. Each time to compose the
diversified search result list, the document, which maximizes MMR metric, is
added to the list incrementally. As MMR includes a maximization technique
according to a scoring criterion, it is accepted as the first diversification
algorithm which employs an objective function. It is differentiated from other
algorithms in terms of satisfying the objective function for each newly retrieved
document in the search result list.
Zhai et al. work on a diversification technique which is based on language
modeling of documents [16]. This technique combines relevancy and novelty
like MMR. It also requires including the document, which maximizes the
objective function, in the next position of a ranked retrieval list. Such an
approach also exists in MMR. Combination of relevancy and novelty is based on
the costs and probability values of finding novel and relevant documents. For a
12
newly added document to the ranked list, the probabilities of each word in the
new document are found on both general English language model, the average
of all language models that are ranked higher than this document.
The trade-off between relevancy and diversity is also studied in [17]. In this
work, it is preferred not to use additional sources, like subtopic coverage of
documents, a list of meanings of the query, or any click-through data, etc.,
because it is stated that in reality such information cannot be found to use for
diversification of the search result list. Therefore, they focus on formulating an
objective function to diversify the result set. Two new max-sum diversification
algorithm are proposed by Vieira et al., Greedy Marginal Contribution(GMC)
and Greedy Randomized with Neighborhood Expansion (GNE).
The method, GMC, selects the document, which has the maximum value of
is selected to include in the diversified list. The metric, , includes the
similarity, which is a cosine metric and complement of the cosine value is
accepted as the function to find the diversity between two documents.
GNE is differentiated from GMC by including the document to the result set
by randomly selecting from top ranked ones. It mainly has two steps: GNE-
construction and GNE-LocalSearch. These two steps are iterated many times to
compensate the randomization part of the algorithm. To account for the trade-off
between similarity of documents to the query and diversity among the
documents, the parameter, λ, is used. From this point of view, it is the first
approach, which employs the randomization in the diversification. Because of
randomization, ten iterations are decided to run the algorithm while comparing
its success to the other ones.
Agrawal et al. propose a diversification algorithm, which is based on an
objective function. In this work, a greedy solution is presented by retrieving the
documents, which are from different branches of a predefined taxonomy [13].
Relevancy is directly computed by using the standard ranking of the original
13
query. Vee et al. introduces two objective functions that are also solved by a
greedy method to be used for online shopping applications [18]. Also, a new and
efficient query processing technique to guarantee composing diversified search
results.
2.3.2 Objective Functions Designed for Optimizing Evaluation
Metrics
Chen et al. approach to the problem of retrieving relevant documents to
ambiguous query is maximizing the expected value of a newly proposed binary
evaluation metric, by employing a greedy algorithm [19]. In a
ranked retrieval list, is defined as it is one if number of
documents from top documents is relevant to the query; otherwise it is zero.
The basic idea behind the proposed method is to include the document into the
search result list successively. This document is selected as the one which
maximizes it with already retrieved documents. This procedure does not take
into consideration of whether any previous document is relevant to the actual
intent of the user. From the subtopic retrieval perspective, 1-call at n is desired
to be 1 for each subtopic of the query in the rank.
2.4 Diversification with Machine Learning
Techniques
The approach, which is followed by Yue et al. is that more number of distinct
word coverage, more subtopic coverage for retrieved documents [20]. From this
point of view, word frequencies are found as valuable features for diversity. It is
the first method that employs training with SVM for subtopic retrieval. The
discriminant function to be used in SVM is defined to use two criteria: coverage
of documents for a word and deciding whether the document significantly
includes the word. For each document, the pairs are constructed with associated
feature vector and the list of subtopics, which are mentioned in the document.
These pairs are named as training instances. Also, the subtopics are assigned a

14
weight to indicate their importance for the context of the query. Loss function is
specified as the weighted percentage of subtopics that are not covered in the
result list.
User clicking behaviors are used to learn a diversified ranking model [21].
Online learning approach is followed to maximize the clickthrough. However,
the extracted models cannot be used to diversify previously unknown queries. A
learning problem is formulated, which is predicting diverse subsets from a set of
documents. Structural SVM is also employed in this method.
15
Chapter 3
Pre-CCED Operations
In this chapter, the preparation phase for the diversification algorithm, CCED, is
presented. The aim of this phase is to produce necessary data to proceed with
CCED.
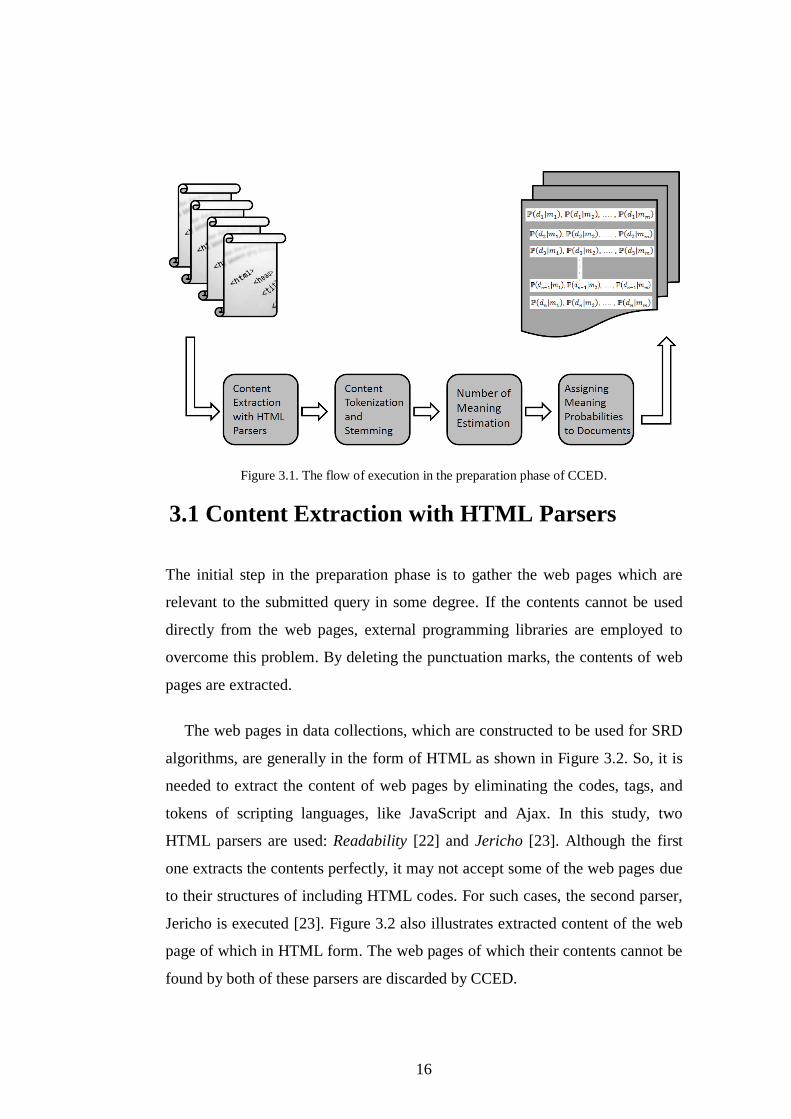
Figure 3.1 illustrates the preparation phase of CCED. The preparation
involves the following steps:
Content extraction with HTML parsers from web pages,
Removal of any punctuation marks from the contents of web pages,
Elimination of the words of which their frequency is under a certain
threshold in the data collection,
Content tokenization and word stemming,
Construction of term by document binary occurrence matrix,
Estimation of number of different meanings of the query using complete
link clustering algorithm,
Generating the probabilities for relevancy of the documents to each of
these meanings with Latent Dirichlet Allocation method [5].
16
Figure 3.1. The flow of execution in the preparation phase of CCED.
3.1 Content Extraction with HTML Parsers
The initial step in the preparation phase is to gather the web pages which are
relevant to the submitted query in some degree. If the contents cannot be used
directly from the web pages, external programming libraries are employed to
overcome this problem. By deleting the punctuation marks, the contents of web
pages are extracted.
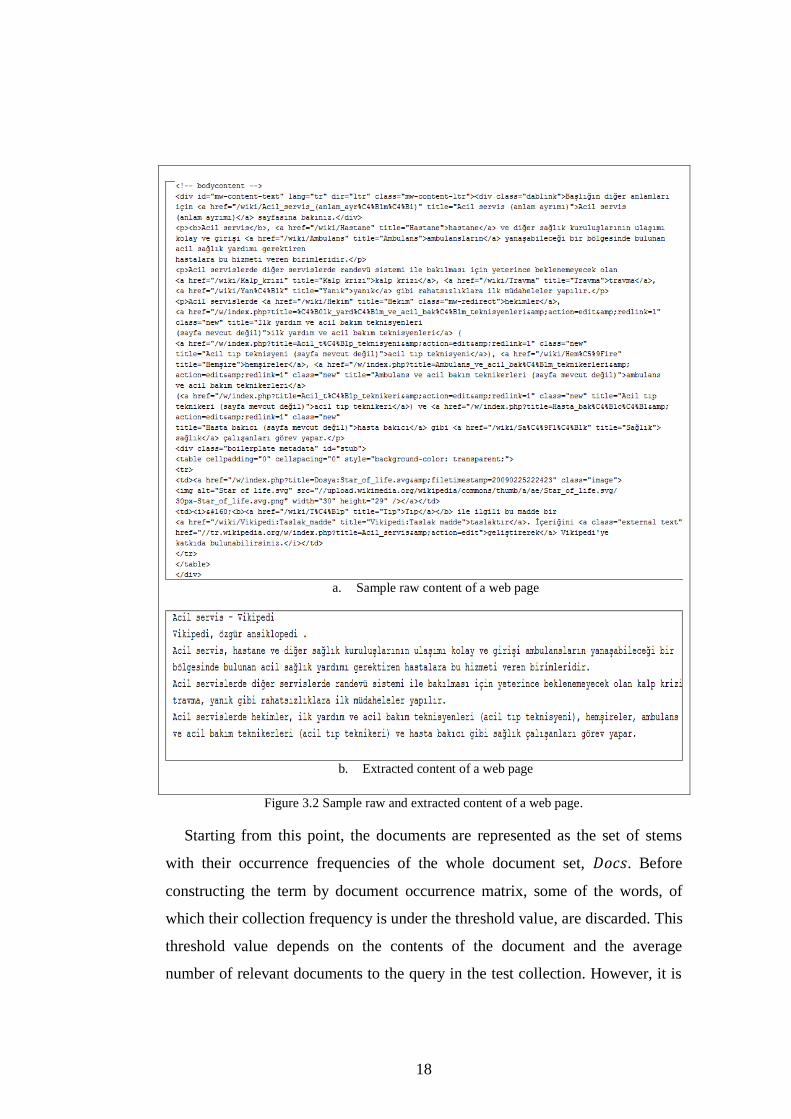
The web pages in data collections, which are constructed to be used for SRD
algorithms, are generally in the form of HTML as shown in Figure 3.2. So, it is
needed to extract the content of web pages by eliminating the codes, tags, and
tokens of scripting languages, like JavaScript and Ajax. In this study, two
HTML parsers are used: Readability [22] and Jericho [23]. Although the first
one extracts the contents perfectly, it may not accept some of the web pages due
to their structures of including HTML codes. For such cases, the second parser,
Jericho is executed [23]. Figure 3.2 also illustrates extracted content of the web
page of which in HTML form. The web pages of which their contents cannot be
found by both of these parsers are discarded by CCED.
17
After finishing the content extraction, the punctuation marks are also
removed from the contents of web pages. This removal operation is done by
writing a bash script in Linux environment. From now on, the contents are
referred as the documents; because they are directly usable in CCED operations.
The set of all documents, all of which are relevant to the submitted query, are
referred as throughout the thesis.
3.2 Content Tokenization and Stemming
After the content extraction, the words of the documents are found. The words,
which exist in stopword list, are taken out from the documents. Then, F5
stemming is applied to all the remaining words. Following to this, the stems, of
which the collection frequency is under a certain threshold, are also discarded.
Lastly, the occurrence matrix is constructed with the remaining stems.
The words are tokenized by tracking the whitespaces in the documents. The
stopwords are also eliminated from the documents. The list for English
stopwords is directly taken from the work of a research paper [24]. For the
Turkish list, two different sources are used. One of them is another research
paper which is about new event detection and tracking and the other one is from
a research group in Fatih University [25, 26]. The Turkish stopword list is
constructed by merging these two lists. It is advantageous for CCED because
they do not have a role to affect the meaning of a document.
Following to stopword elimination, the stems of the words are found. The
method, F5 stemming, is used due to the easy computation. In this method, the
words, of which the length is equal or smaller than five, are remained as the
stems without any change. Longer words are truncated so that the first five
letters are kept as the stems.
18
a. Sample raw content of a web page
b. Extracted content of a web page
Figure 3.2 Sample raw and extracted content of a web page.
Starting from this point, the documents are represented as the set of stems
with their occurrence frequencies of the whole document set, . Before
constructing the term by document occurrence matrix, some of the words, of
which their collection frequency is under the threshold value, are discarded. This
threshold value depends on the contents of the document and the average
number of relevant documents to the query in the test collection. However, it is
19
observed that the optimal threshold value is greater than one and less than 5% of
the average number of relevant documents for each query in the test collection.
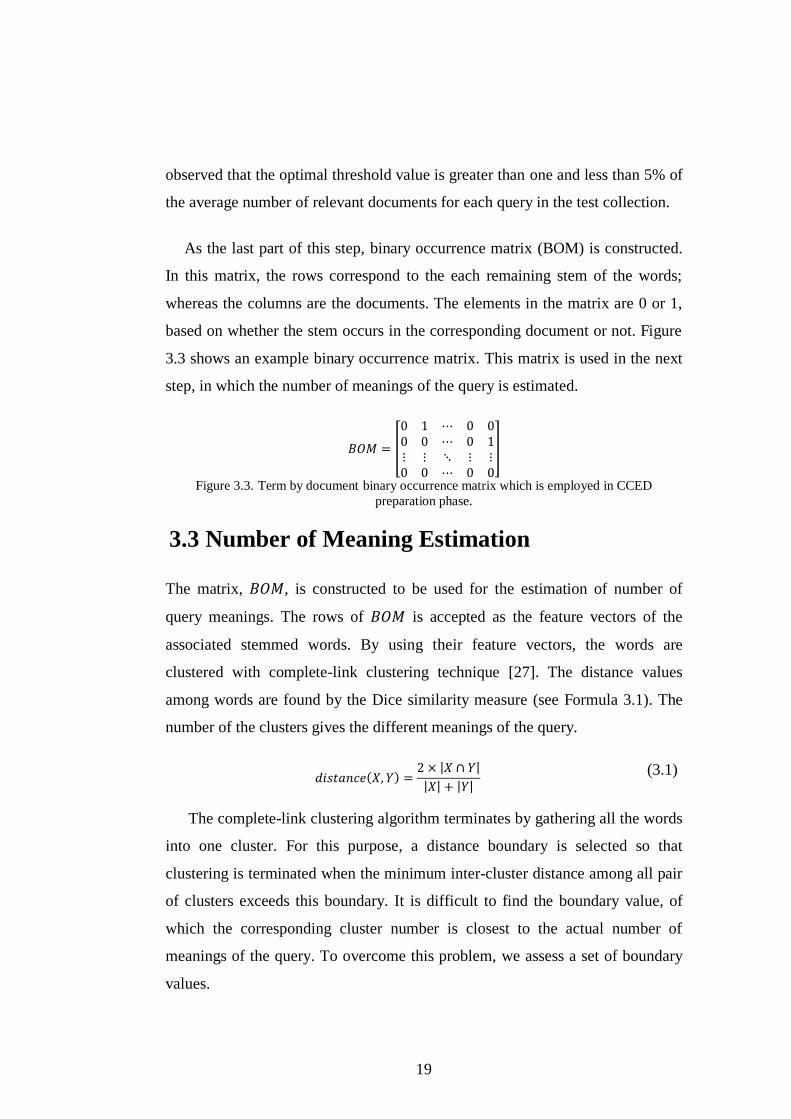
As the last part of this step, binary occurrence matrix (BOM) is constructed.
In this matrix, the rows correspond to the each remaining stem of the words;
whereas the columns are the documents. The elements in the matrix are 0 or 1,
based on whether the stem occurs in the corresponding document or not. Figure
3.3 shows an example binary occurrence matrix. This matrix is used in the next
step, in which the number of meanings of the query is estimated.
Figure 3.3. Term by document binary occurrence matrix which is employed in CCED
preparation phase.
3.3 Number of Meaning Estimation
The matrix, , is constructed to be used for the estimation of number of
query meanings. The rows of is accepted as the feature vectors of the
associated stemmed words. By using their feature vectors, the words are
clustered with complete-link clustering technique [27]. The distance values
among words are found by the Dice similarity measure (see Formula 3.1). The
number of the clusters gives the different meanings of the query.
(3.1)
The complete-link clustering algorithm terminates by gathering all the words
into one cluster. For this purpose, a distance boundary is selected so that
clustering is terminated when the minimum inter-cluster distance among all pair
of clusters exceeds this boundary. It is difficult to find the boundary value, of
which the corresponding cluster number is closest to the actual number of
meanings of the query. To overcome this problem, we assess a set of boundary
values.
20
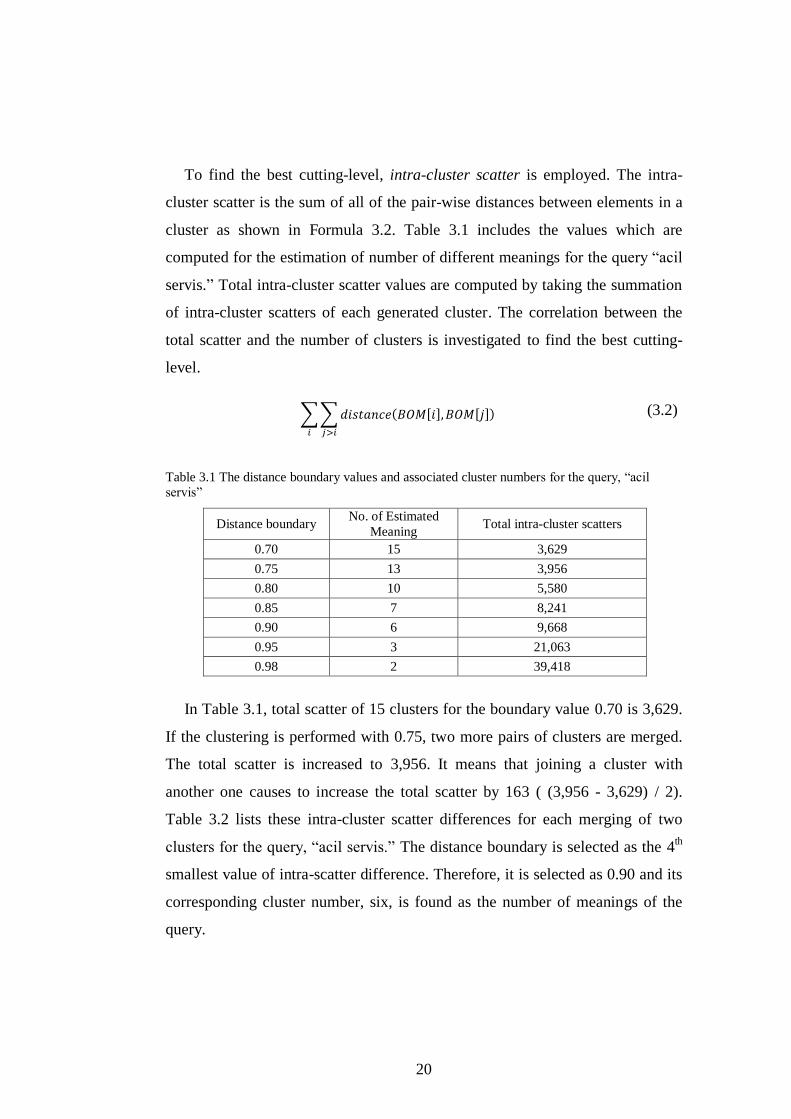
To find the best cutting-level, intra-cluster scatter is employed. The intra-
cluster scatter is the sum of all of the pair-wise distances between elements in a
cluster as shown in Formula 3.2. Table 3.1 includes the values which are
computed for the estimation of number of different meanings for the query “acil
servis.” Total intra-cluster scatter values are computed by taking the summation
of intra-cluster scatters of each generated cluster. The correlation between the
total scatter and the number of clusters is investigated to find the best cutting-
level.
(3.2)
Table 3.1 The distance boundary values and associated cluster numbers for the query, “acil
servis”
Distance boundary No. of Estimated
Meaning Total intra-cluster scatters
0.70 15 3,629
0.75 13 3,956
0.80 10 5,580
0.85 7 8,241
0.90 6 9,668
0.95 3 21,063
0.98 2 39,418
In Table 3.1, total scatter of 15 clusters for the boundary value 0.70 is 3,629.
If the clustering is performed with 0.75, two more pairs of clusters are merged.
The total scatter is increased to 3,956. It means that joining a cluster with
another one causes to increase the total scatter by 163 ( (3,956 - 3,629) / 2).
Table 3.2 lists these intra-cluster scatter differences for each merging of two
clusters for the query, “acil servis.” The distance boundary is selected as the 4th
smallest value of intra-scatter difference. Therefore, it is selected as 0.90 and its
corresponding cluster number, six, is found as the number of meanings of the
query.
21
Table 3.2 The difference in total intra-cluster caused by one more merging during clustering
Boundary Transition Intra-cluster scatter difference per cluster
0.70-0.75 163
0.75-0.80 541
0.80-0.85 887
0.85-0.90 1426
0.90-0.95 3798
0.95-0.98 18354
If these differences are examined on the plot, in Figure 3.4, the boundary
value is the cutoff point of the curve, which is also 0.90. If the corresponding
number of clusters of the boundary is greater than or equal to 20, it is taken as
20.
Figure 3.4. The correlation between boundary values and total intra-cluster values in number of
meaning estimation for the query “acil servis.”
3.4 Assigning Meaning Probabilities to
Documents
As the last step of the preparation phase in CCED, each document is assigned a
set of scores which reflect the relevancy of the document to the meanings of the
query. For this purpose, Latent Dirichlet Allocation (LDA), [5] is employed.
Before exploring the concepts, it is useful to be familiar with the parameters
and their abbreviations in LDA. Initially, the original notation of LDA [5] is
presented. Following to this, the topic modeling approach of LDA is explained.
0
5000
10000
15000
20000
0.75 0.80 0.85 0.90 0.95 0.98 Intr
a-C
lust
er S
catt
er D
iffe
rnce
Boundary Distance Values
22
Then, the process of learning an LDA model is demonstrated on a toy data
collection. Lastly, the role of LDA in CCED is presented.
3.4.1 The Notation of LDA
The smallest unit, word, in LDA is also the smallest unit of a sentence which
has a specific meaning individually. To execute the algorithm on a document set,
tokenization of documents into the words is necessary. All different words in the
document set constitute the vocabulary, V. Each word has an identification
number from 1 to V. This number is written in a subscript format like, . A
document, w, is represented as a sequence of words in the order that they occur
in the document, like . A collection of M documents is
called corpus. It is represented as a set of documents, .
In LDA, the number of words in a document is distributed according to
Poisson distribution with the parameter, . The distribution of the topics in a
document is also modeled as a Dirichlet distribution, with the parameter, . In
other words, a sample event from this Dirichlet distribution is another
distribution, which directly gives topic distribution of a document, . The
topics in are abbreviated as . Each topic has a multinomial distribution over
the words in the vocabulary, which are represented as .
Table 3.3 The notation of LDA
Abbreviation Explanation
w a smallest unit of a sentence, word
V the set of all different words in a document set
w a vector of the words in occurrence order of the document
D a document collection
The parameter of Poisson distribution
The parameter of Dirichlet distribution
The topic distribution of a document, which is sampled from the
Dirichlet distribution
A topic in the distribution,
The multinomial distribution over words in a topic,
23
3.4.2 Components of LDA Models
In LDA, each document, w, is associated a distribution among a set of topics,
with the size n. It means that number of topics that are sought in the document is
k. Also, it is assumed that topic distribution of each document, , in a data
collection is modeled with another type of distribution, Dirichlet, with the
parameter, . It says that the document with the topic distribution, , has n
different topics, from , through . To give an example, suppose that
indicates that document has three topics, , , and . It is relevant to these
topics with the probabilities, 0.55, 0.30, and 0.15 respectively.
Each topic, , is represented with a multinomial probability distribution, .
The probability of semantic relevance of a word to a given topic is defined in
this model. For instance, if the topic, is aimed to include the document with a
word, this word is selected from the associated multinomial distribution. The
probability of inclusion of a word from a topic, , is found from these
multinomial distributions of the topic.
3.4.3 Learning Process in LDA
To generate the distributions in LDA models, the process for learning should be
conducted on a set of documents. LDA require to take the values of the
parameters, , , and the number of topics as input parameters. This procedure
is explained on a toy data collection with five documents, in a step-by-step
fashion (see Figure 3.6).
Figure 3.5 A toy data collection for illustration of learning process in LDA.
24
The number of topics is assumed to be two. Learning process starts by
assigning a topic randomly to each of the words in the documents. In this way,
initial distribution of topics on the documents, , and the distributions of the
words on the topics, ’s, are achieved. Table 3.4 and 3.6 list the probability
values for these distributions. After random topic assignments to the words, the
probability distribution of topics over the documents, , and the distribution of
words over the topics, , can be obtained.
To find the probability values for the distribution, , each document is
investigated to find what proportion of the words are assigned to the topics. For
instance, has six words; two of them are assigned to and four of them are
assigned to . So the probability distribution of and over are calculated
as and respectively. For all documents, topic probability values are
computed. Table 3.4 lists the initial probabilities for the distribution, .
dere (z2) küçük (z1) akan (z2) su (z2) çay (z2) denmek (z1) }
nar(z1) su(z2) içmek(z1) başlamak(z1) }
çay (z2) çocuk(z1) yüzmek(z2) }
çay (z1) kenar (z2) oturmak (z2) akan (z1) su (z1) sürüklemek (z2) nar (z2) görmek
(z2) }
nar(z1) tanecik(z2) yemek(z1) bayılmak(z2) }
Figure 3.6. Random assignment of topics to the words in the toy data collection.
At the end of the random assignment, 13 words are associated to the topic, ,
and 12 words are to . The distributions of words over the topics are found
from the whole vocabulary. Each word is seen as an event of two multinomial
distributions each of which is associated to a different topic. The probabilities of
these events are calculated by considering the occurrence frequencies of the
words after the topic assignments. To give an example, the word “nar” is seen in
the dataset three times; and two of them are assigned to and one of them is
assigned to . So, the probability of semantic relevancy of the word “nar” to
these topics are calculated as and respectively. Table 3.5 lists the
words and their occurrence frequencies in the data collection after 1st topic
assignment. Table 3.6 includes all the probabilities of being relevant to the
topics for each word in the vocabulary.
25
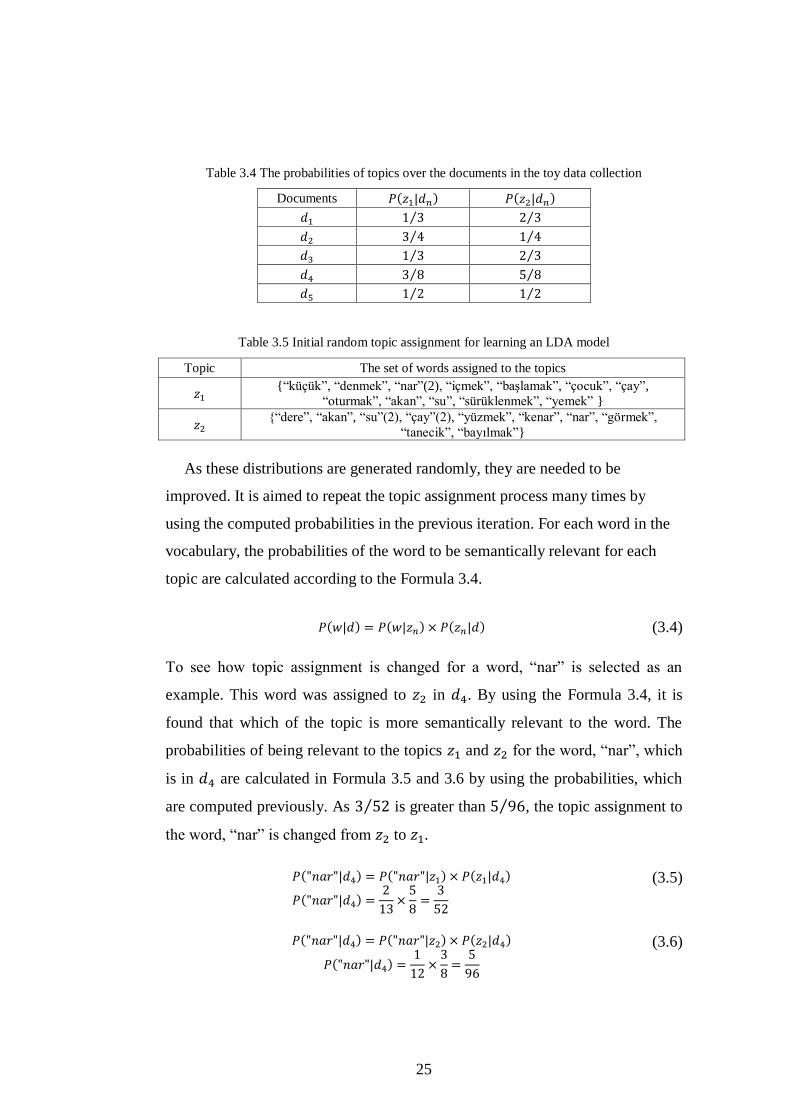
Table 3.4 The probabilities of topics over the documents in the toy data collection
Documents
Table 3.5 Initial random topic assignment for learning an LDA model
Topic The set of words assigned to the topics
{“küçük”, “denmek”, “nar”(2), “içmek”, “başlamak”, “çocuk”, “çay”,
“oturmak”, “akan”, “su”, “sürüklenmek”, “yemek” }
{“dere”, “akan”, “su”(2), “çay”(2), “yüzmek”, “kenar”, “nar”, “görmek”,
“tanecik”, “bayılmak”}
As these distributions are generated randomly, they are needed to be
improved. It is aimed to repeat the topic assignment process many times by
using the computed probabilities in the previous iteration. For each word in the
vocabulary, the probabilities of the word to be semantically relevant for each
topic are calculated according to the Formula 3.4.
(3.4)
To see how topic assignment is changed for a word, “nar” is selected as an
example. This word was assigned to in . By using the Formula 3.4, it is
found that which of the topic is more semantically relevant to the word. The
probabilities of being relevant to the topics and for the word, “nar”, which
is in are calculated in Formula 3.5 and 3.6 by using the probabilities, which
are computed previously. As is greater than , the topic assignment to
the word, “nar” is changed from to .
(3.5)
(3.6)
26
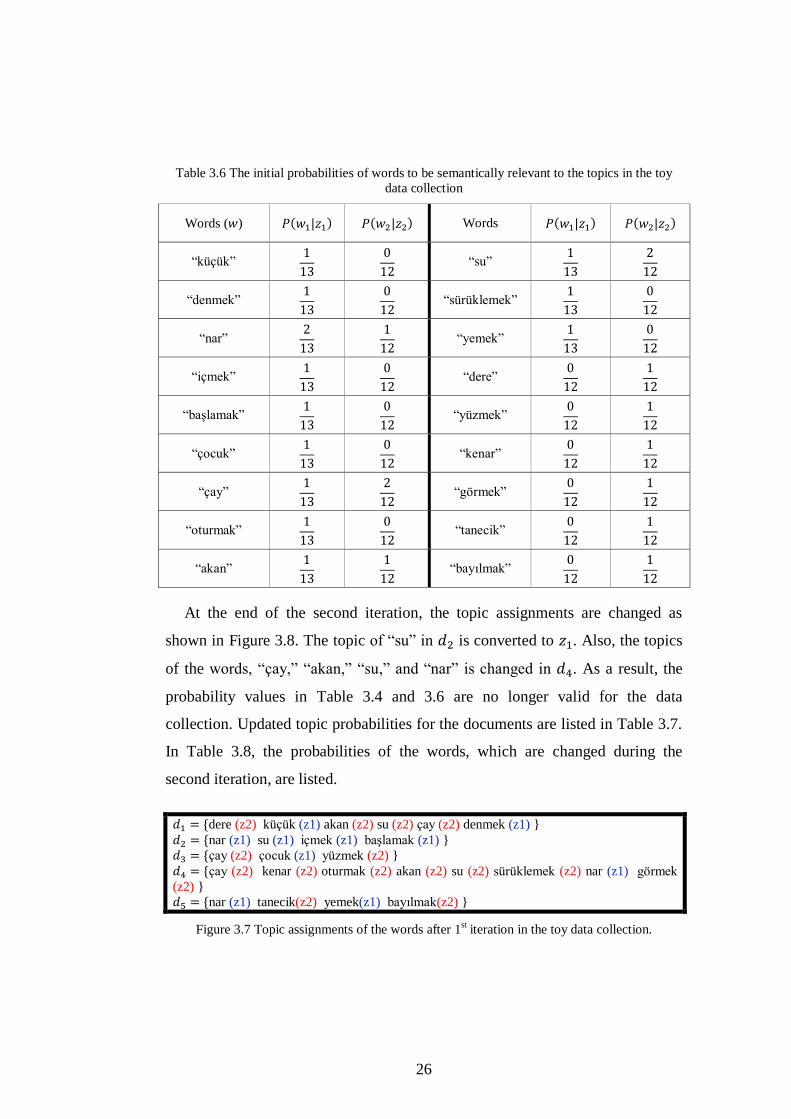
Table 3.6 The initial probabilities of words to be semantically relevant to the topics in the toy
data collection
Words ( ) Words
“küçük”
“su”
“denmek”
“sürüklemek”
“nar”
“yemek”
“içmek”
“dere”
“başlamak”
“yüzmek”
“çocuk”
“kenar”
“çay”
“görmek”
“oturmak”
“tanecik”
“akan”
“bayılmak”
At the end of the second iteration, the topic assignments are changed as
shown in Figure 3.8. The topic of “su” in is converted to . Also, the topics
of the words, “çay,” “akan,” “su,” and “nar” is changed in . As a result, the
probability values in Table 3.4 and 3.6 are no longer valid for the data
collection. Updated topic probabilities for the documents are listed in Table 3.7.
In Table 3.8, the probabilities of the words, which are changed during the
second iteration, are listed.
dere (z2) küçük (z1) akan (z2) su (z2) çay (z2) denmek (z1) }
nar (z1) su (z1) içmek (z1) başlamak (z1) }
çay (z2) çocuk (z1) yüzmek (z2) }
çay (z2) kenar (z2) oturmak (z2) akan (z2) su (z2) sürüklemek (z2) nar (z1) görmek
(z2) }
nar (z1) tanecik(z2) yemek(z1) bayılmak(z2) }
Figure 3.7 Topic assignments of the words after 1st iteration in the toy data collection.
27
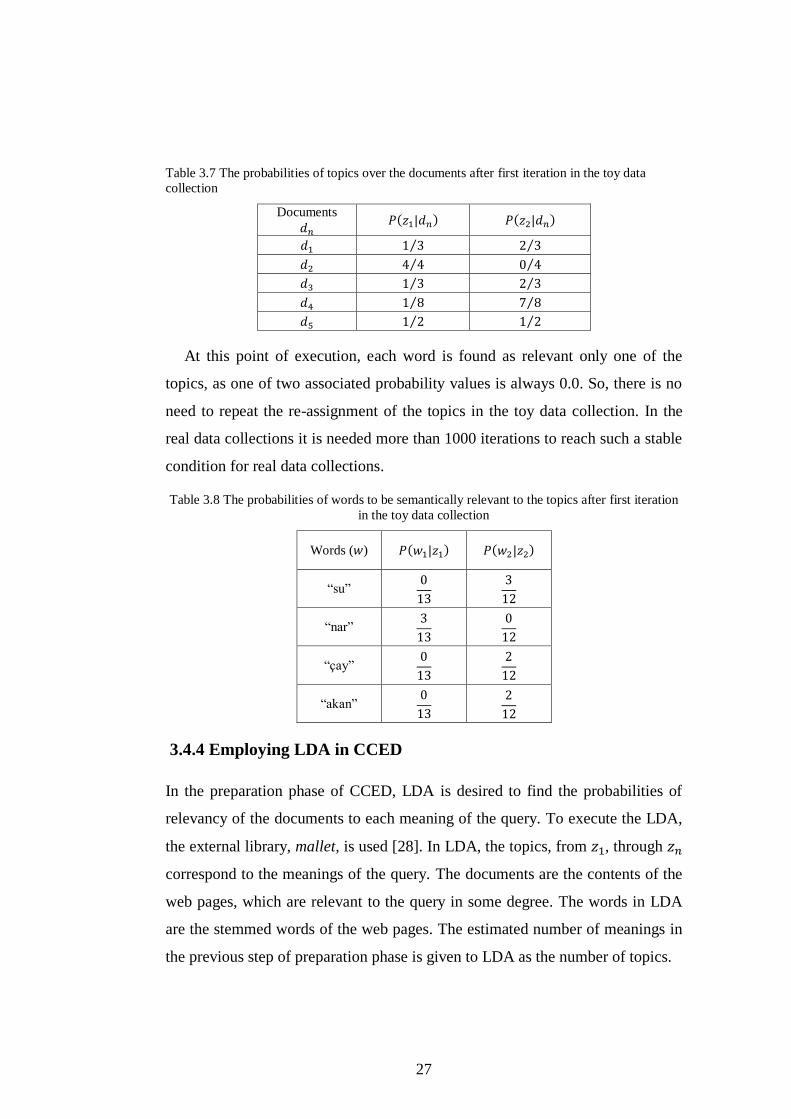
Table 3.7 The probabilities of topics over the documents after first iteration in the toy data
collection
Documents
At this point of execution, each word is found as relevant only one of the
topics, as one of two associated probability values is always 0.0. So, there is no
need to repeat the re-assignment of the topics in the toy data collection. In the
real data collections it is needed more than 1000 iterations to reach such a stable
condition for real data collections.
Table 3.8 The probabilities of words to be semantically relevant to the topics after first iteration
in the toy data collection
Words ( )
“su”
“nar”
“çay”
“akan”
3.4.4 Employing LDA in CCED
In the preparation phase of CCED, LDA is desired to find the probabilities of
relevancy of the documents to each meaning of the query. To execute the LDA,
the external library, mallet, is used [28]. In LDA, the topics, from , through
correspond to the meanings of the query. The documents are the contents of the
web pages, which are relevant to the query in some degree. The words in LDA
are the stemmed words of the web pages. The estimated number of meanings in
the previous step of preparation phase is given to LDA as the number of topics.
28
The parameters of the Poisson and Dirichlet distributions, , are both set to
0.01 as they are suggested by mallet. To decide on the value of the number of
iteration, some manual experiments are conducted. It is observed that the higher
the number of iteration, higher probabilities is assigned to common meanings in
all documents. As CCED aims to list the documents, which are related to rarely
used meanings of the query, it is not suitable to allow high number of iterations
of LDA. As a result, LDA is executed on the documents with 100 iterations. In
this work, LDA is executed so that the summation of all topic probabilities for a
document is equal to 1.00 in LDA models. The final topic probabilities of the
documents are used as the relevancy scores of each meaning of the query in
CCED.
29
Chapter 4
Cascaded Cross Entropy-Based
Search Result Diversification: The
Algorithm
In the last step of the preparation phase, LDA produces the probabilities for each
document to be relevant to the different meanings of the query. The flow of the
work continues with taking CCED to the stage by setting the number of
document to be included in the diversified search result list. CCED starts its
execution by computing the significance values of the meanings (SOM) for the
query. In this way, both dominant and rarely used meanings can be investigated
from the contents of the relevant web pages to the query. By using SOM values
and probabilities of documents, the similarity metric of CCED, , is
computed for each document. The probabilities, which are generated for the
documents, are also used to find the semantic distance between the documents.
This distance is referred as diversity in this context. To measure the diversity
between the documents in the set, cross entropy is used. Cross entropy measures
the difference between two probability distributions. As the probabilities of each
document constitute a probability distribution among the meanings, it is suitable
to employ this metric to find the diversity between the documents. The
reciprocal rank and the cross entropy are combined to formulate a mono-
30
objective diversification function. By finding the optimal document for each
rank, the diversified search result list is composed.
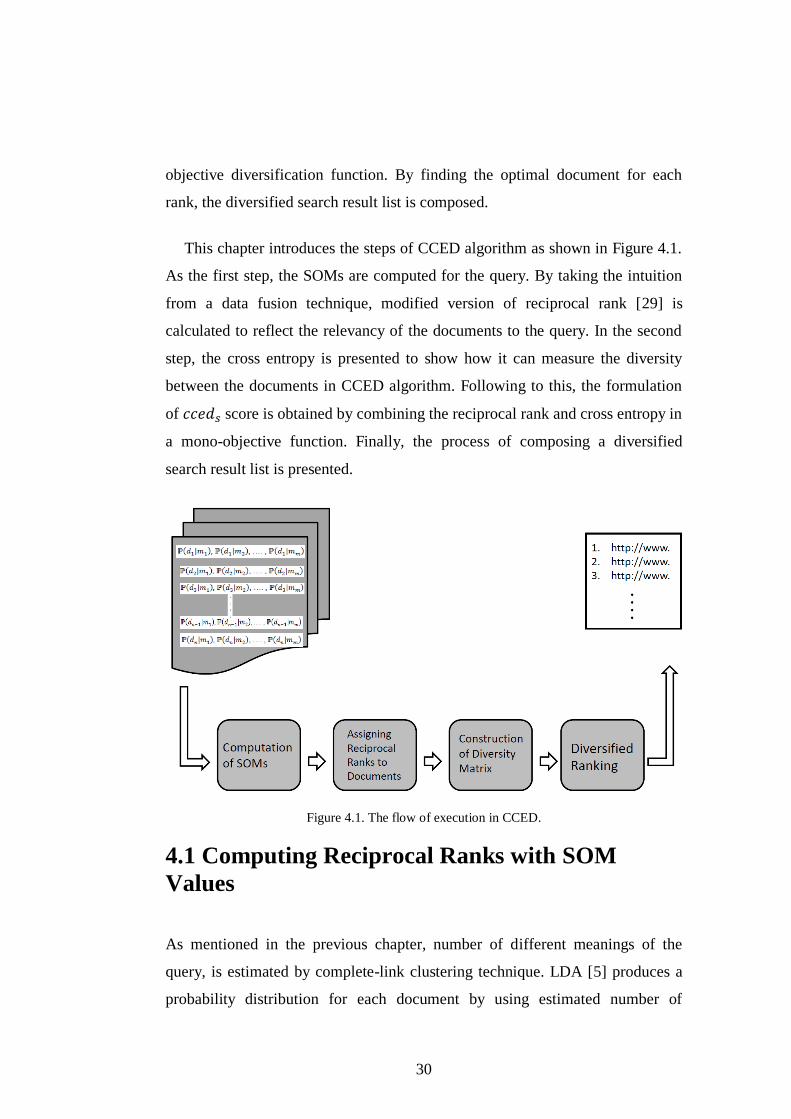
This chapter introduces the steps of CCED algorithm as shown in Figure 4.1.
As the first step, the SOMs are computed for the query. By taking the intuition
from a data fusion technique, modified version of reciprocal rank [29] is
calculated to reflect the relevancy of the documents to the query. In the second
step, the cross entropy is presented to show how it can measure the diversity
between the documents in CCED algorithm. Following to this, the formulation
of score is obtained by combining the reciprocal rank and cross entropy in
a mono-objective function. Finally, the process of composing a diversified
search result list is presented.
Figure 4.1. The flow of execution in CCED.
4.1 Computing Reciprocal Ranks with SOM
Values
As mentioned in the previous chapter, number of different meanings of the
query, is estimated by complete-link clustering technique. LDA [5] produces a
probability distribution for each document by using estimated number of
31
different meanings of the query and the documents. A probability value in the
distribution indicates the chance of being relevant to the associated meaning of
the query for the document. In this step, it is aimed to extract the query-
document relevancy, which is one of the essential parts of the diversification
algorithms. In this work, this relevancy measurement is done with the modified
formula of reciprocal rank. In addition, it is desired to find the common
(dominant) and rarely used meanings of a query. Therefore, a new method,
significance of meaning (SOM), is proposed. In this way, CCED gives more
importance to the documents, which heavily mention about a dominant meaning,
as compared to the ones about a rarely used meaning of the query.
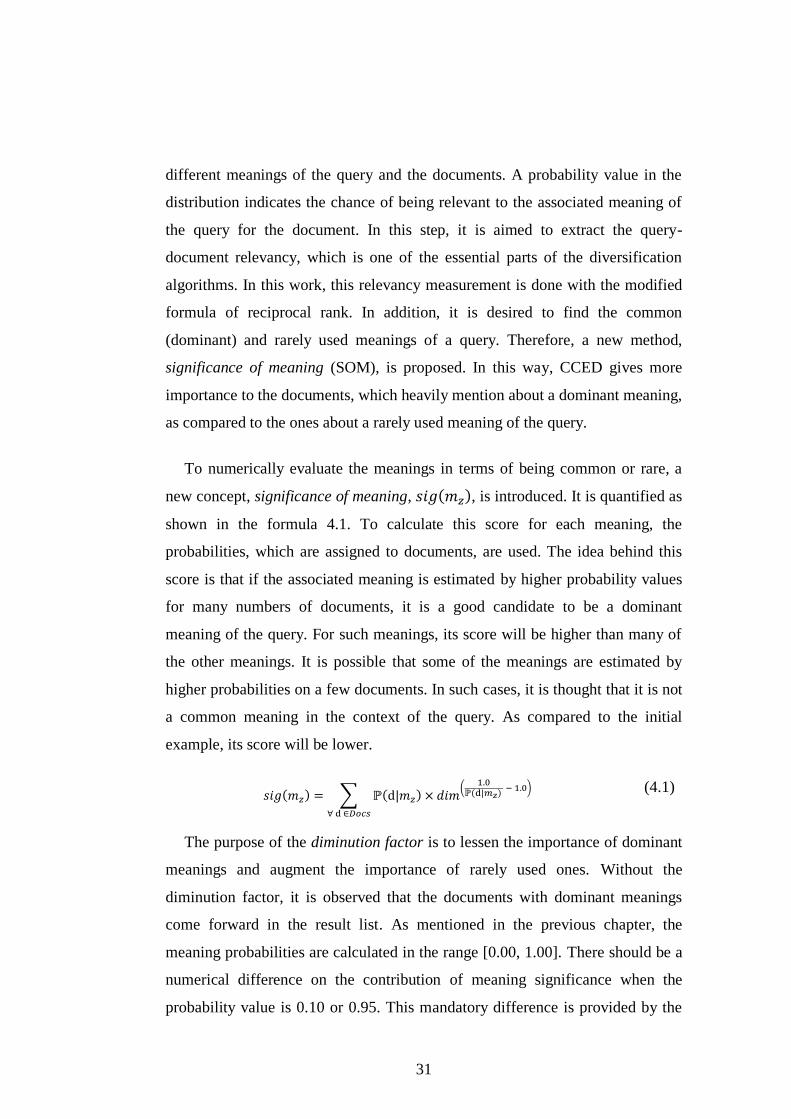
To numerically evaluate the meanings in terms of being common or rare, a
new concept, significance of meaning, , is introduced. It is quantified as
shown in the formula 4.1. To calculate this score for each meaning, the
probabilities, which are assigned to documents, are used. The idea behind this
score is that if the associated meaning is estimated by higher probability values
for many numbers of documents, it is a good candidate to be a dominant
meaning of the query. For such meanings, its score will be higher than many of
the other meanings. It is possible that some of the meanings are estimated by
higher probabilities on a few documents. In such cases, it is thought that it is not
a common meaning in the context of the query. As compared to the initial
example, its score will be lower.
(4.1)
The purpose of the diminution factor is to lessen the importance of dominant
meanings and augment the importance of rarely used ones. Without the
diminution factor, it is observed that the documents with dominant meanings
come forward in the result list. As mentioned in the previous chapter, the
meaning probabilities are calculated in the range [0.00, 1.00]. There should be a
numerical difference on the contribution of meaning significance when the
probability value is 0.10 or 0.95. This mandatory difference is provided by the
32
diminution factor. Intuitively, it can be thought that if the probability of a
meaning in a document is 0.70, this document has ten different imaginary
information segments and seven of them are related to the same meaning. As
compared to the ideal case in which the document has seven segments and all of
them are related to the same meaning, the loss due to the deviation from the
ideal case can arguably be measured by subtracting 1.00 from the inverse of the
probability value, . For each meaning of the query, the SOM values are
calculated as shown in Table 4.1. For this example, the diminution parameter,
dim, is set to 0.95. Decreasing the dim reduces the contribution of meaning
probabilities to the value of sig.
The computation of significance values for each meaning is required to find
the relevancy of each document to the query. As the query-document relevancy
cannot be taken from the search engine side, it is needed to seek another way to
measure the relevancy. In this work, this measurement is done by the modified
version of reciprocal rank, [29] which is a data fusion technique. When there
are n number of retrieval systems all of which ranks the documents for the same
query, it is possible to merge these ranking lists into one list with this method.
The final ranking is desired to reflect individual ranking lists of different
retrieval systems.
The intuition behind reciprocal rank can be applicable to query-document
relevancy in subtopic retrieval such that each retrieval system ranks the
documents according to one meaning of the query. However, rather than the
taking inverse of individual rankings, this time, the actual probability values are
incorporated into the formula. Moreover, as each meaning has different SOM
value, it means that each retrieval system should not be represented equally in
the final ranking. To reflect the relative importance of meanings while merging
the ranking lists, the probabilities are multiplied by the associated SOM values.
In the light of these modifications on the formula, CCED computes the
reciprocal rank, , of each document according to the Formula 4.2.
33
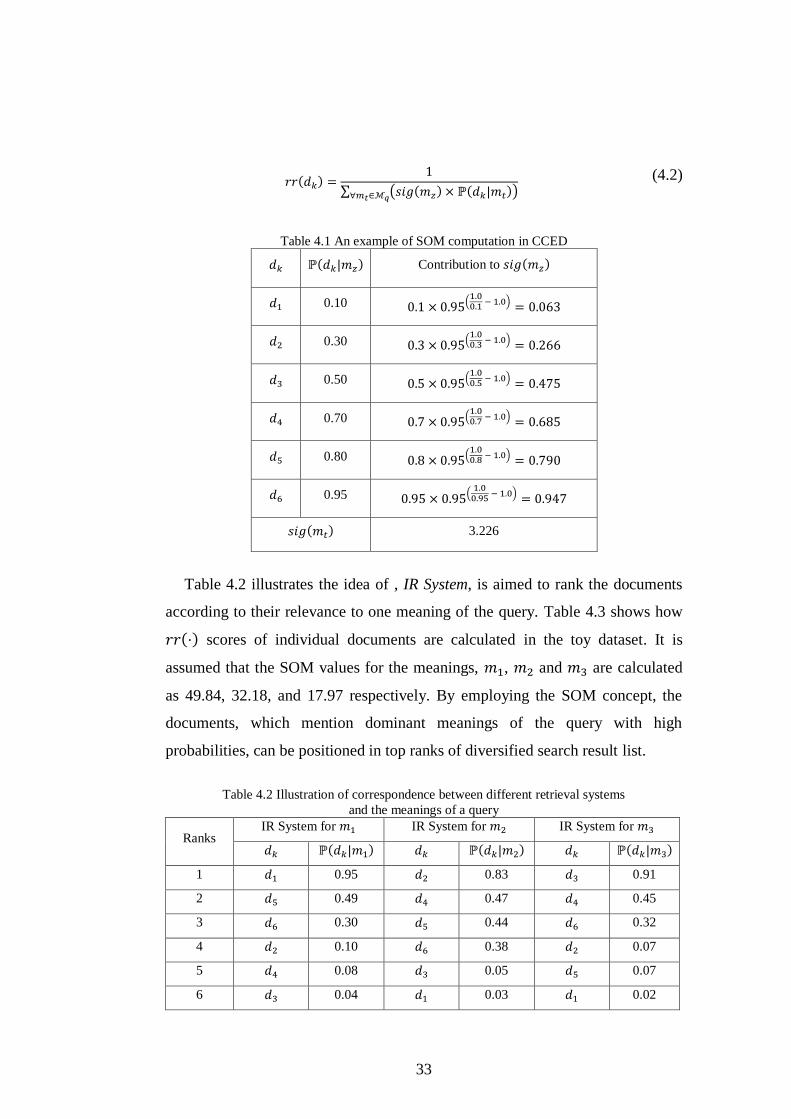
(4.2)
Table 4.1 An example of SOM computation in CCED
Contribution to
0.10
0.30
0.50
0.70
0.80
0.95
3.226
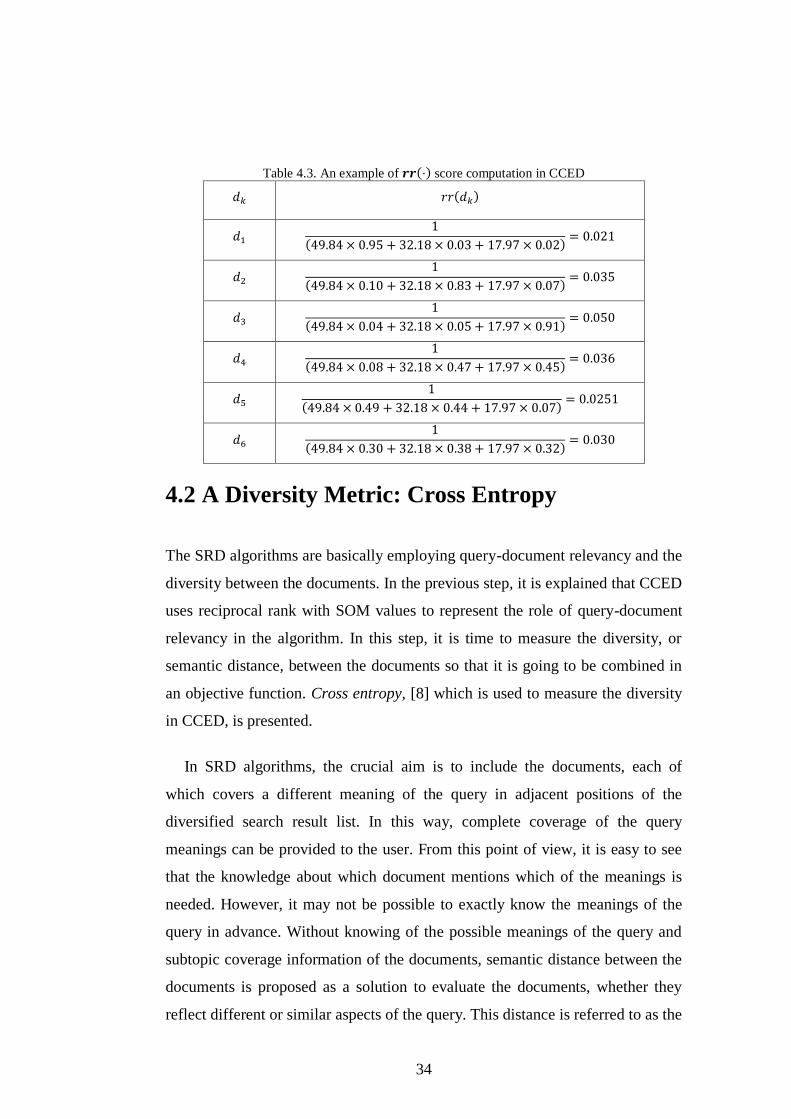
Table 4.2 illustrates the idea of , IR System, is aimed to rank the documents
according to their relevance to one meaning of the query. Table 4.3 shows how
scores of individual documents are calculated in the toy dataset. It is
assumed that the SOM values for the meanings, , and are calculated
as 49.84, 32.18, and 17.97 respectively. By employing the SOM concept, the
documents, which mention dominant meanings of the query with high
probabilities, can be positioned in top ranks of diversified search result list.
Table 4.2 Illustration of correspondence between different retrieval systems
and the meanings of a query
Ranks IR System for IR System for IR System for
1 0.95 0.83 0.91
2 0.49 0.47 0.45
3 0.30 0.44 0.32
4 0.10 0.38 0.07
5 0.08 0.05 0.07
6 0.04 0.03 0.02
34
Table 4.3. An example of score computation in CCED
4.2 A Diversity Metric: Cross Entropy
The SRD algorithms are basically employing query-document relevancy and the
diversity between the documents. In the previous step, it is explained that CCED
uses reciprocal rank with SOM values to represent the role of query-document
relevancy in the algorithm. In this step, it is time to measure the diversity, or
semantic distance, between the documents so that it is going to be combined in
an objective function. Cross entropy, [8] which is used to measure the diversity
in CCED, is presented.
In SRD algorithms, the crucial aim is to include the documents, each of
which covers a different meaning of the query in adjacent positions of the
diversified search result list. In this way, complete coverage of the query
meanings can be provided to the user. From this point of view, it is easy to see
that the knowledge about which document mentions which of the meanings is
needed. However, it may not be possible to exactly know the meanings of the
query in advance. Without knowing of the possible meanings of the query and
subtopic coverage information of the documents, semantic distance between the
documents is proposed as a solution to evaluate the documents, whether they
reflect different or similar aspects of the query. This distance is referred to as the
35
diversity in the context of SRD. As a semantic distance, CCED employs cross
entropy by using the probability assignment to the documents for each meaning
of the query. Before explaining the formulation of cross entropy, entropy will be
introduced. Then, by making the connection between entropy, the cross entropy
is detailed. Lastly it is defined how cross entropy is proper to diversify the
search result lists.
In information theory, entropy is defined as the minimum number of bits that
should be used to encode the events of a probability distribution for a random
variable [30]. Also, this metric is used to measure the randomness of a
probability distribution of a set. For instance, a document set with positive and
negative labeled elements is a good candidate on which the entropy can be
measured. The entropy of a probability distribution, associated with a random
variable, , can be computed by Formula 4.3. There are number of different
events, , associated with the random variable.
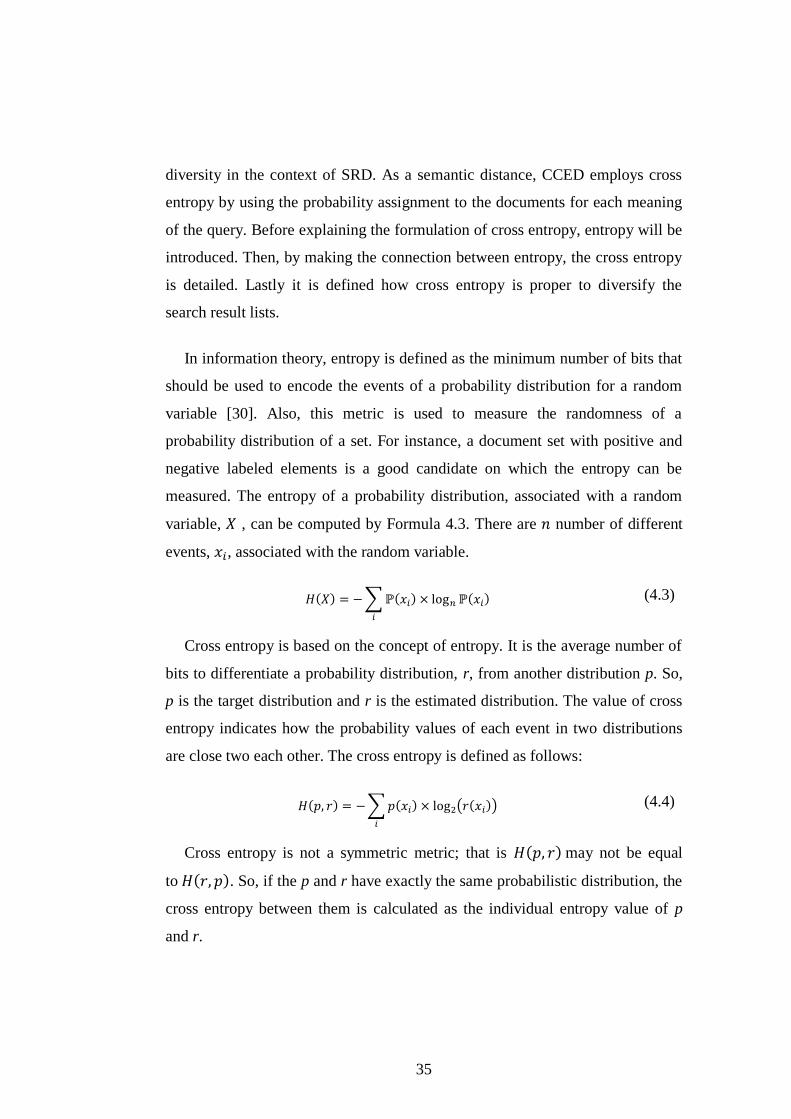
(4.3)
Cross entropy is based on the concept of entropy. It is the average number of
bits to differentiate a probability distribution, r, from another distribution p. So,
p is the target distribution and r is the estimated distribution. The value of cross
entropy indicates how the probability values of each event in two distributions
are close two each other. The cross entropy is defined as follows:
(4.4)
Cross entropy is not a symmetric metric; that is may not be equal
to . So, if the p and r have exactly the same probabilistic distribution, the
cross entropy between them is calculated as the individual entropy value of p
and r.
36
Using cross entropy as a diversity metric between documents is suitable for
CCED because probability events of the documents directly correspond to the
meanings of the query. As the probabilities are summed to 1.0 on each
document, there exists a meaning probability distribution over each document.
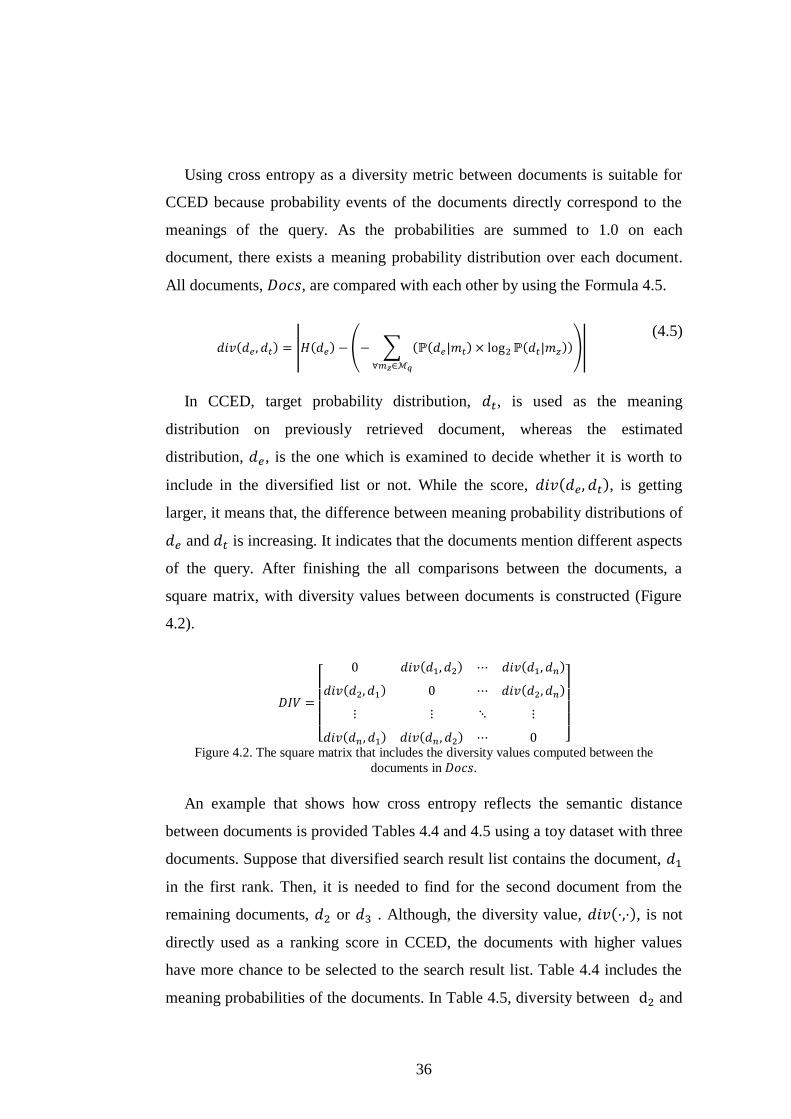
All documents, , are compared with each other by using the Formula 4.5.
(4.5)
In CCED, target probability distribution, , is used as the meaning
distribution on previously retrieved document, whereas the estimated
distribution, , is the one which is examined to decide whether it is worth to
include in the diversified list or not. While the score, , is getting
larger, it means that, the difference between meaning probability distributions of
and is increasing. It indicates that the documents mention different aspects
of the query. After finishing the all comparisons between the documents, a
square matrix, with diversity values between documents is constructed (Figure
4.2).
Figure 4.2. The square matrix that includes the diversity values computed between the
documents in .
An example that shows how cross entropy reflects the semantic distance
between documents is provided Tables 4.4 and 4.5 using a toy dataset with three
documents. Suppose that diversified search result list contains the document,
in the first rank. Then, it is needed to find for the second document from the
remaining documents, or . Although, the diversity value, , is not
directly used as a ranking score in CCED, the documents with higher values
have more chance to be selected to the search result list. Table 4.4 includes the
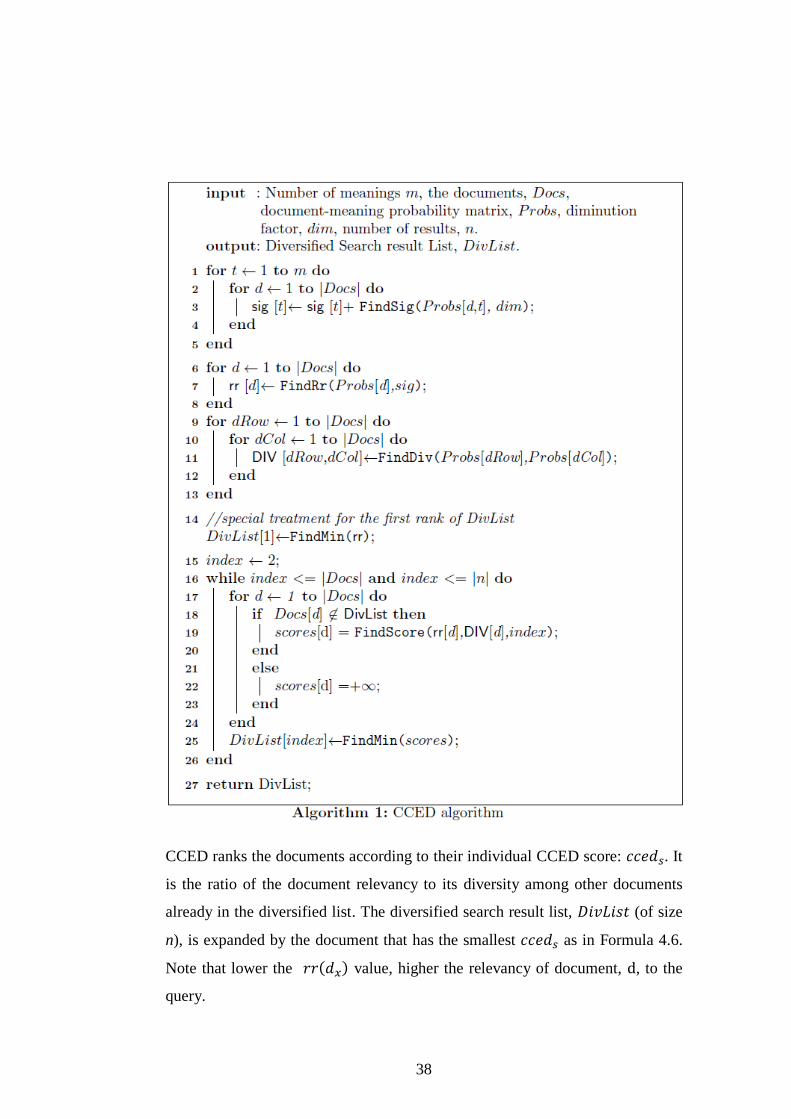
meaning probabilities of the documents. In Table 4.5, diversity between and
37
is calculated as 1.794 whereas diversity between and is 0.141. So, it
can be said that and are related to different meanings of the query.
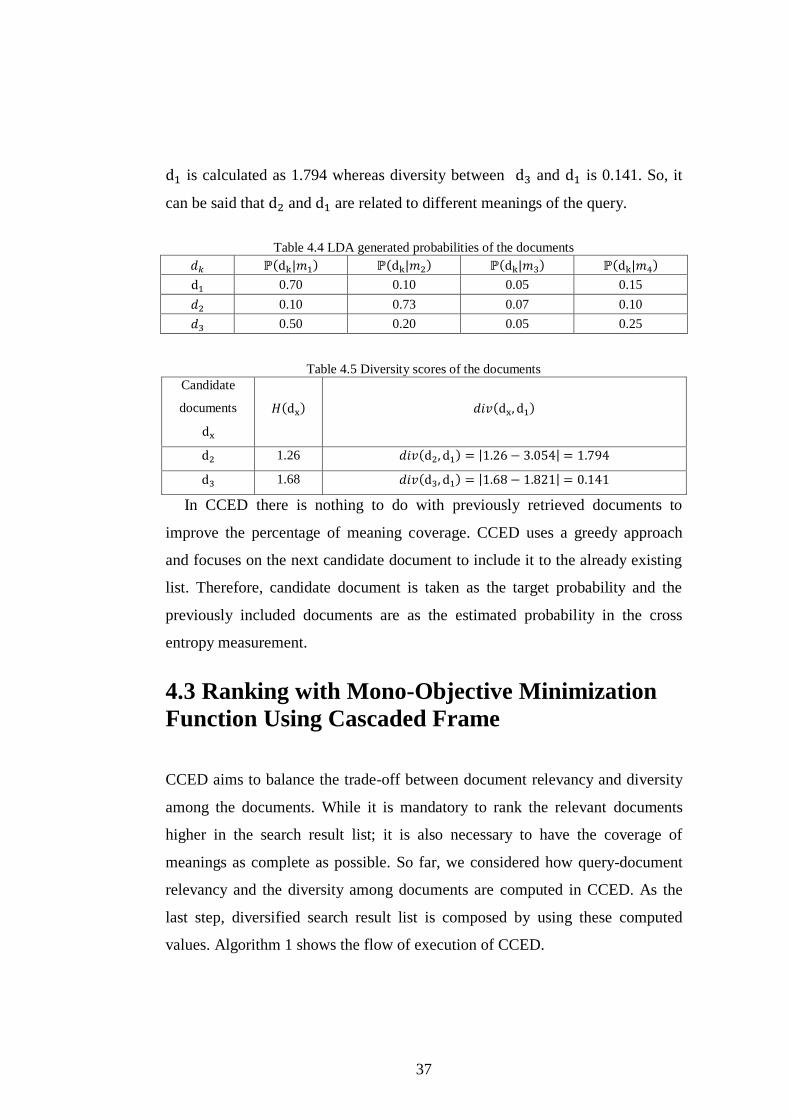
Table 4.4 LDA generated probabilities of the documents
0.70 0.10 0.05 0.15
0.10 0.73 0.07 0.10
0.50 0.20 0.05 0.25
Table 4.5 Diversity scores of the documents
Candidate
documents
1.26
1.68
In CCED there is nothing to do with previously retrieved documents to
improve the percentage of meaning coverage. CCED uses a greedy approach
and focuses on the next candidate document to include it to the already existing
list. Therefore, candidate document is taken as the target probability and the
previously included documents are as the estimated probability in the cross
entropy measurement.
4.3 Ranking with Mono-Objective Minimization
Function Using Cascaded Frame
CCED aims to balance the trade-off between document relevancy and diversity
among the documents. While it is mandatory to rank the relevant documents
higher in the search result list; it is also necessary to have the coverage of
meanings as complete as possible. So far, we considered how query-document
relevancy and the diversity among documents are computed in CCED. As the
last step, diversified search result list is composed by using these computed
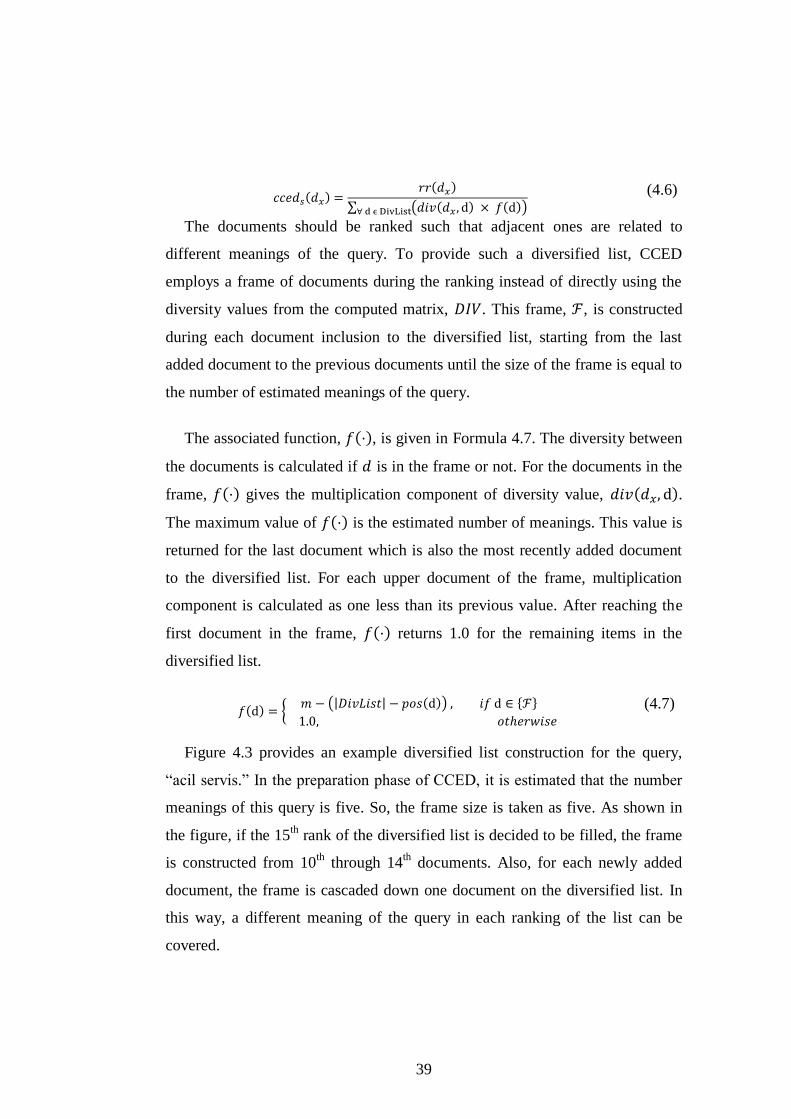
values. Algorithm 1 shows the flow of execution of CCED.
38
CCED ranks the documents according to their individual CCED score: . It
is the ratio of the document relevancy to its diversity among other documents
already in the diversified list. The diversified search result list, (of size
n), is expanded by the document that has the smallest as in Formula 4.6.
Note that lower the value, higher the relevancy of document, , to the
query.
39
(4.6)
The documents should be ranked such that adjacent ones are related to
different meanings of the query. To provide such a diversified list, CCED
employs a frame of documents during the ranking instead of directly using the
diversity values from the computed matrix, . This frame, , is constructed
during each document inclusion to the diversified list, starting from the last
added document to the previous documents until the size of the frame is equal to
the number of estimated meanings of the query.
The associated function, , is given in Formula 4.7. The diversity between
the documents is calculated if is in the frame or not. For the documents in the
frame, gives the multiplication component of diversity value, .
The maximum value of is the estimated number of meanings. This value is
returned for the last document which is also the most recently added document
to the diversified list. For each upper document of the frame, multiplication
component is calculated as one less than its previous value. After reaching the
first document in the frame, returns 1.0 for the remaining items in the
diversified list.
(4.7)
Figure 4.3 provides an example diversified list construction for the query,
“acil servis.” In the preparation phase of CCED, it is estimated that the number
meanings of this query is five. So, the frame size is taken as five. As shown in
the figure, if the 15th
rank of the diversified list is decided to be filled, the frame
is constructed from 10th
through 14th
documents. Also, for each newly added
document, the frame is cascaded down one document on the diversified list. In
this way, a different meaning of the query in each ranking of the list can be
covered.
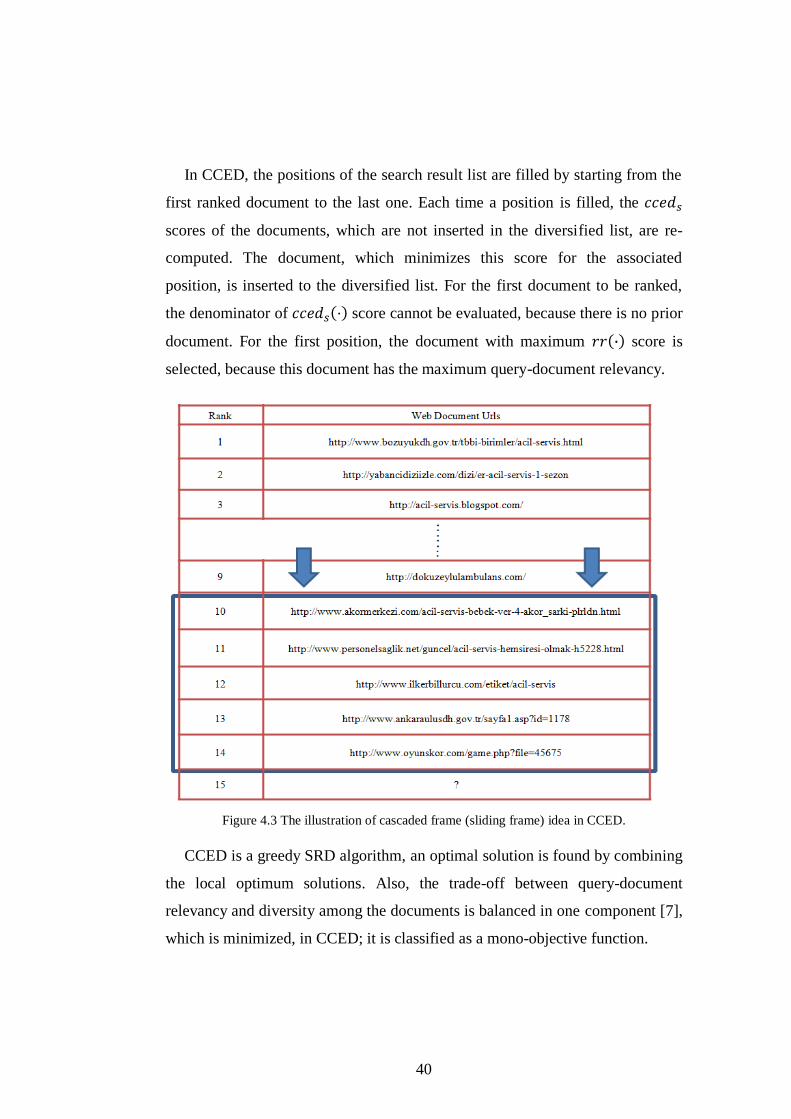
40
In CCED, the positions of the search result list are filled by starting from the
first ranked document to the last one. Each time a position is filled, the
scores of the documents, which are not inserted in the diversified list, are re-
computed. The document, which minimizes this score for the associated
position, is inserted to the diversified list. For the first document to be ranked,
the denominator of score cannot be evaluated, because there is no prior
document. For the first position, the document with maximum score is
selected, because this document has the maximum query-document relevancy.
Figure 4.3 The illustration of cascaded frame (sliding frame) idea in CCED.
CCED is a greedy SRD algorithm, an optimal solution is found by combining
the local optimum solutions. Also, the trade-off between query-document
relevancy and diversity among the documents is balanced in one component [7],
which is minimized, in CCED; it is classified as a mono-objective function.
41
Chapter 5
An Axiomatic Approach to CCED
The SRD algorithms employ different metrics for query-document relevancy
and diversity between the documents. The way of combining these metrics in an
objective function is also unique for each algorithm. To distinguish the SRD
algorithms from each other, a framework with eight axioms, is provided [7]. In
this framework, each axiom is associated with a possible feature of an SRD
algorithm. By this framework, valid comparisons can be made between different
SRD algorithms.
These axioms are proposed for the algorithms of which the approaches to
diversification are selecting the optimal subset from a set of the documents.
Although CCED generates a ranked list, it can be studied under this framework
because of its incremental environment. For each position of the diversified list,
k, CCED selects the document which minimizes the ranking score. So, the set of
already retrieved documents is also the optimal set among all possible subsets
with size k. Therefore, CCED can be examined whether it satisfies the axioms
under this framework.
The notation, which is used in the axiomatic framework, is as follows:
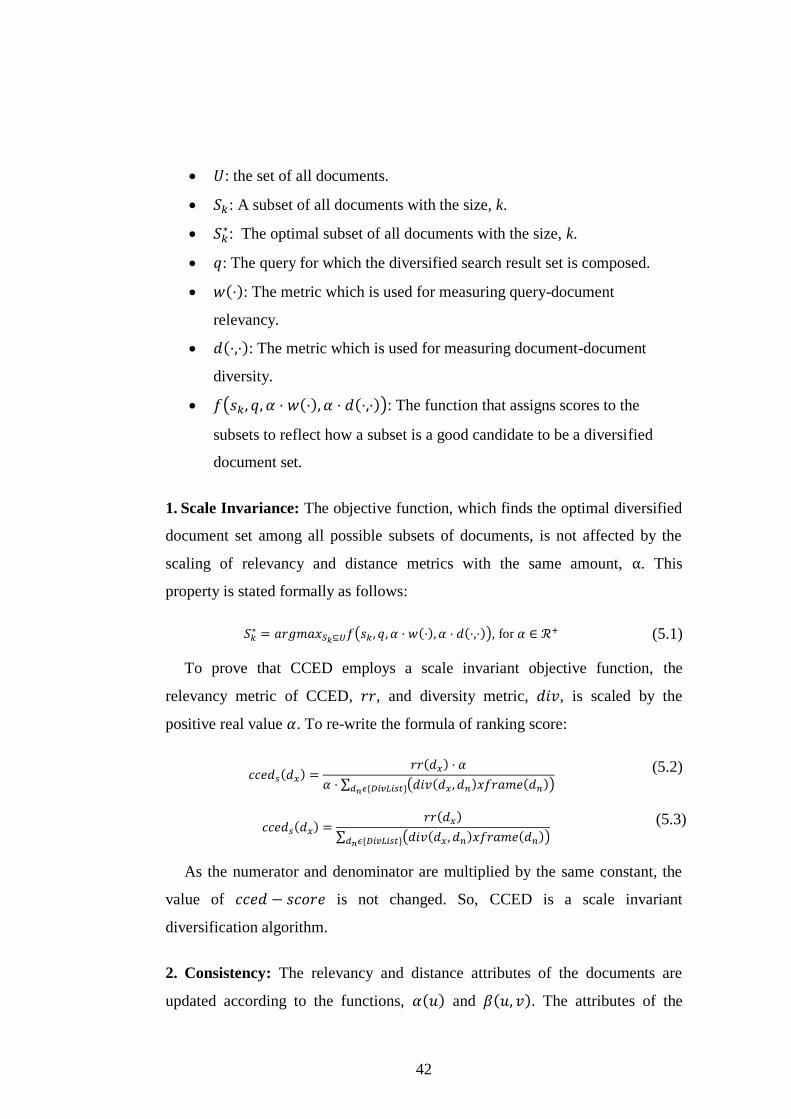
42
: the set of all documents.
: A subset of all documents with the size, k.
: The optimal subset of all documents with the size, k.
: The query for which the diversified search result set is composed.
: The metric which is used for measuring query-document
relevancy.
: The metric which is used for measuring document-document
diversity.
: The function that assigns scores to the
subsets to reflect how a subset is a good candidate to be a diversified
document set.
1. Scale Invariance: The objective function, which finds the optimal diversified
document set among all possible subsets of documents, is not affected by the
scaling of relevancy and distance metrics with the same amount, . This
property is stated formally as follows:
, for (5.1)
To prove that CCED employs a scale invariant objective function, the
relevancy metric of CCED, , and diversity metric, , is scaled by the
positive real value . To re-write the formula of ranking score:
(5.2)
(5.3)
As the numerator and denominator are multiplied by the same constant, the
value of is not changed. So, CCED is a scale invariant
diversification algorithm.
2. Consistency: The relevancy and distance attributes of the documents are
updated according to the functions, and . The attributes of the
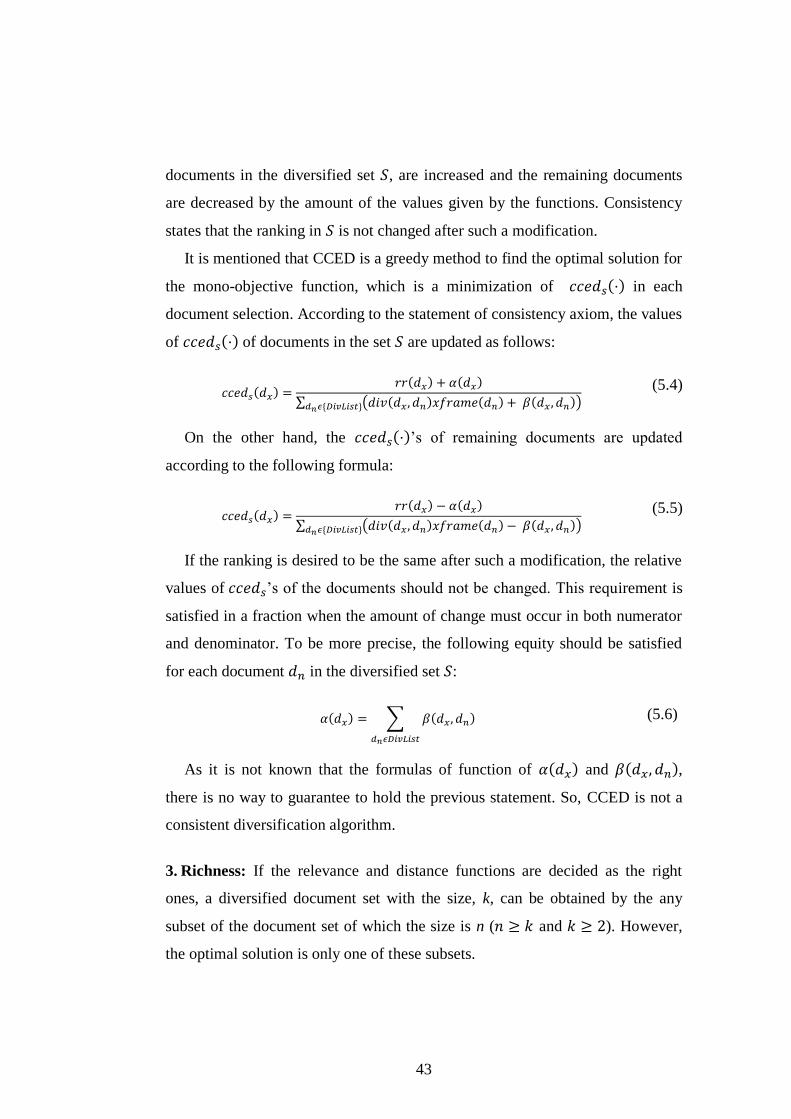
43
documents in the diversified set , are increased and the remaining documents
are decreased by the amount of the values given by the functions. Consistency
states that the ranking in is not changed after such a modification.
It is mentioned that CCED is a greedy method to find the optimal solution for
the mono-objective function, which is a minimization of in each
document selection. According to the statement of consistency axiom, the values
of of documents in the set are updated as follows:
(5.4)
On the other hand, the ’s of remaining documents are updated
according to the following formula:
(5.5)
If the ranking is desired to be the same after such a modification, the relative
values of ’s of the documents should not be changed. This requirement is
satisfied in a fraction when the amount of change must occur in both numerator
and denominator. To be more precise, the following equity should be satisfied
for each document in the diversified set :
(5.6)
As it is not known that the formulas of function of and ,
there is no way to guarantee to hold the previous statement. So, CCED is not a
consistent diversification algorithm.
3. Richness: If the relevance and distance functions are decided as the right
ones, a diversified document set with the size, k, can be obtained by the any
subset of the document set of which the size is n ( and ). However,
the optimal solution is only one of these subsets.
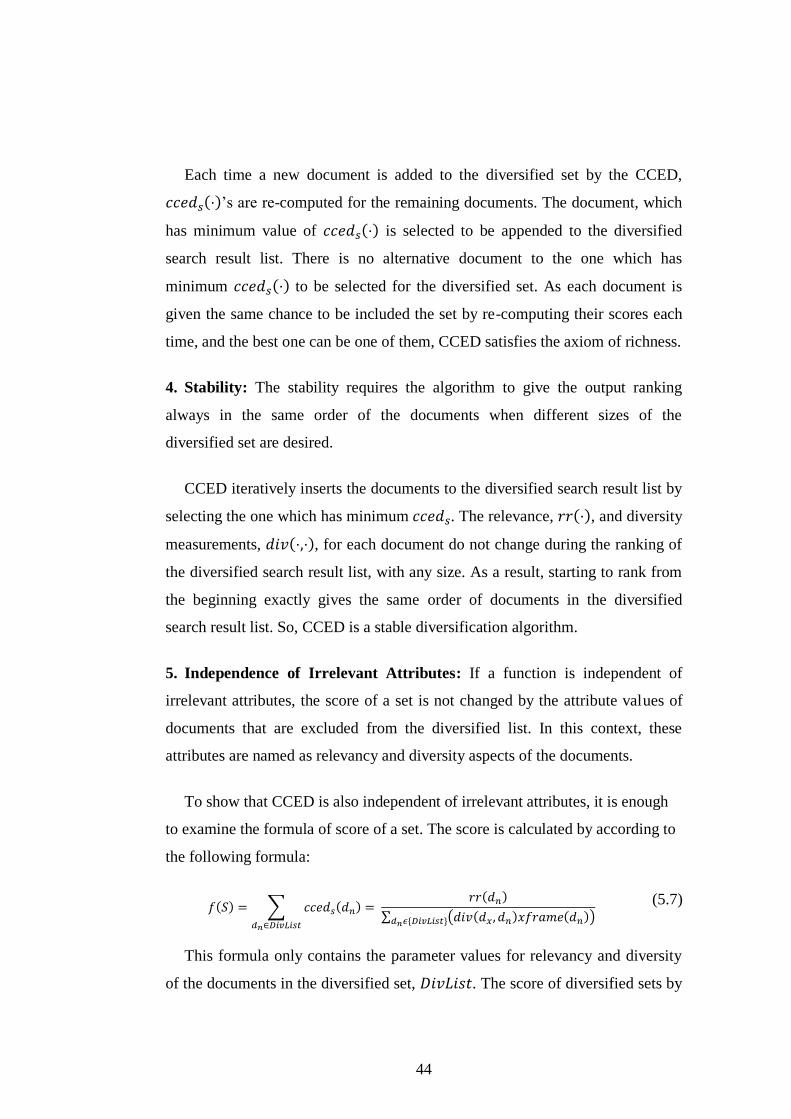
44
Each time a new document is added to the diversified set by the CCED,
’s are re-computed for the remaining documents. The document, which
has minimum value of is selected to be appended to the diversified
search result list. There is no alternative document to the one which has
minimum to be selected for the diversified set. As each document is
given the same chance to be included the set by re-computing their scores each
time, and the best one can be one of them, CCED satisfies the axiom of richness.
4. Stability: The stability requires the algorithm to give the output ranking
always in the same order of the documents when different sizes of the
diversified set are desired.
CCED iteratively inserts the documents to the diversified search result list by
selecting the one which has minimum . The relevance, , and diversity
measurements, , for each document do not change during the ranking of
the diversified search result list, with any size. As a result, starting to rank from
the beginning exactly gives the same order of documents in the diversified
search result list. So, CCED is a stable diversification algorithm.
5. Independence of Irrelevant Attributes: If a function is independent of
irrelevant attributes, the score of a set is not changed by the attribute values of
documents that are excluded from the diversified list. In this context, these
attributes are named as relevancy and diversity aspects of the documents.
To show that CCED is also independent of irrelevant attributes, it is enough
to examine the formula of score of a set. The score is calculated by according to
the following formula:
(5.7)
This formula only contains the parameter values for relevancy and diversity
of the documents in the diversified set, . The score of diversified sets by
45
the CCED ignore the remaining documents. So, CCED is totally independent of
irrelevant attributes.
6. Monotonicity: Given a diversified set of documents, relevance and distance
metrics and objective function, adding a new document cannot decrease the
value of the score of the set.
Suppose that CCED compose a ranked list of diversified documents,
. The set of documents in the initial ranking is . The score of
is computed as follows:
(5.8)
When new document, , is added to , the score of the new set is calculated
as follows:
(5.9)
(5.10)
As is always non-zero, . So, CCED is a monotonic
diversification algorithm.
7. Strength of Relevance: This property requires the objective functions to
employ relevance metric. Given a set of documents, relevance and distance
metrics and objective function, the following two properties should be satisfied
by the diversification algorithm for each document in the set .
a. Let’s suppose that relevance function is modified; so that new relevancy
attribute of the document from the set , , are higher than the previous one, i.e.
, where . Then, the following condition should be
satisfied:
, where . (5.11)
46
Relevance metric in this framework directly corresponds to the, score in
CCED. If the of a document, , in is increased, then the score of
this list is increased. In addition, the difference in score of the ranking, ,
equals the difference in the relevancy of this document.
(5.12)
(5.13)
(5.14)
(5.15)
(5.16)
b. If , let’s suppose that relevance function is modified; so
that new relevancy attribute of the document from the set , , are lower than
the previous one, i.e. , where . Then, the following
condition should be satisfied:
, where . (5.17)
As stated previously, CCED employs a monotonic objective function.
Therefore, this part of the condition should also be examined. If the of a
document, , in is decreased, then the score of this list is also
decreased. In addition, the difference in score of the ranking, , equals the
difference in the relevancy of this document.
(5.18)
(5.19)
47
(5.20)
(5.21)
(5.22)
Satisfying both of two conditions state that CCED reflects the strength of
relevance.
8. Strength of Similarity: This property requires the objective functions to
employ a distance metric. Given a set of documents, relevance and distance
metrics and objective function, the following two properties should be satisfied
by the diversification algorithm for each document in the set .
a. Let’s suppose that distance metric is modified; so that minimum distance of
the document, , to other documents in the set , is where . The
original distances, which are less is updated. Then, the following condition
should be satisfied:
, where . (5.23)
Distance metric in this framework directly corresponds to the diversity
measure of CCED, which is the absolute value of calculated cross entropies
between the documents, . If the diversity attribute of a document, ,
are updated so that all of the values are greater than or equal to ; then
the score of this list should be decreased.
(5.24)
48
(5.25)
(5.26)
For the above equation, the denominator of the right hand side is less than the
denominator of the left hand side. Therefore, of the right hand side is less
than the corresponding score on the left hand side. Hence, there is no such
that
b. If , let’s suppose that distance metric is modified; so that
maximum distance of the document, , to other documents in the set , is settled
to be where . The original distances, which are greater than is
updated. Then, the following condition should be satisfied:
, where . (5.27)
As stated previously, CCED employs monotonic objective function.
Although the first condition is not held in CCED, this part is also examined.
(5.28)
(5.29)
(5.30)

49
The denominator of the left hand side is less than or equal to the denominator
of right hand side. As a result, of the right hand side is less than or equal
to the corresponding score on the left. Hence, there is no , such that
CCED does not reflect the axiom, strength of similarity.
50
Chapter 6
Experimental Environment
SRD test collections are composed of a) a set of ambiguous or under-specified
queries, b) list of meanings of for individual queries, c) set of web page contents
that arre relevant to these queries and d) the relevancy information of web page
to query meanings. In this study the first Turkish SRD test collection, BILDIV-
2012, is constructed. We first explain the construction and annotation process of
BILDIV-2012. Then we present the characteristics of two other SRD test
collections: the Ambient [8] and TREC 2009 [9] and 2010 [10] Diversity Track
test collections. They are both for English. Following these the test collections
are compared according to the number of words in queries, average number of
different meanings per query, and the relationship between the number of words
and the number of meanings of queries.
6.1 BILDIV-2012 Turkish SRD Test Collection
In this study, a new Turkish SRD test collection, BILDIV-2012 is constructed.
The intuition to construct the collection is taken from [31]. To the best of our
knowledge, it is the first Turkish SRD test collection. By using this collection,
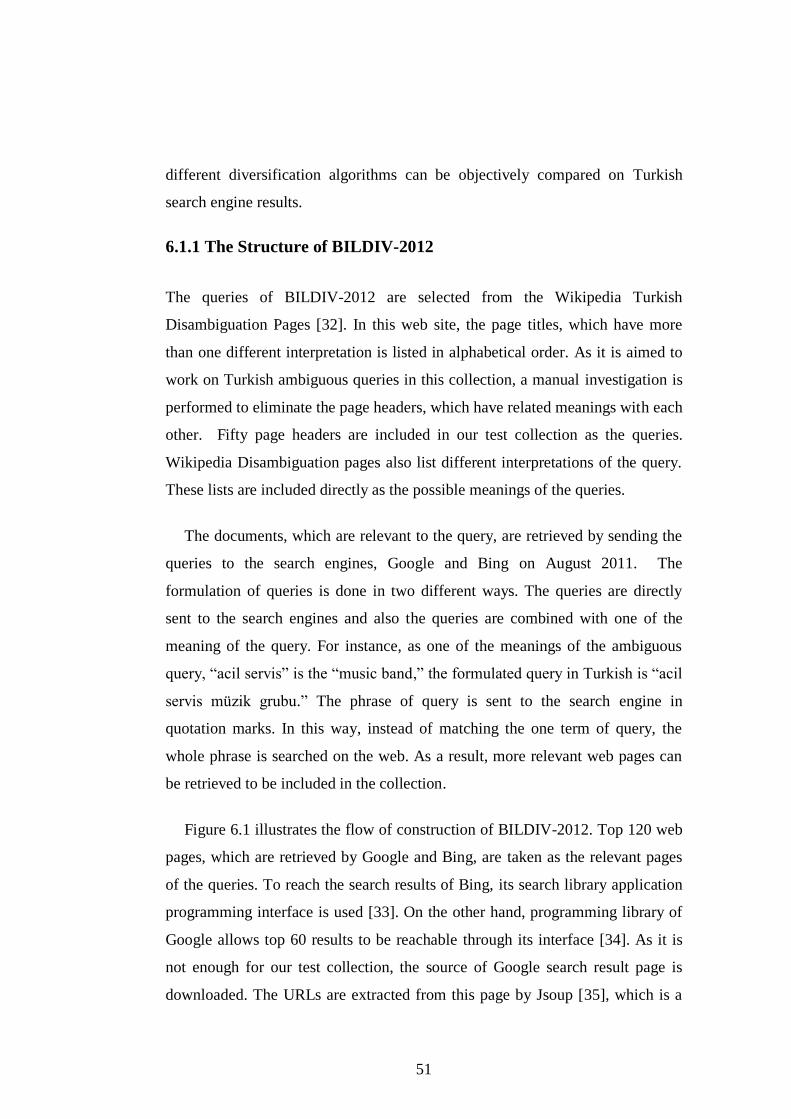
51
different diversification algorithms can be objectively compared on Turkish
search engine results.
6.1.1 The Structure of BILDIV-2012
The queries of BILDIV-2012 are selected from the Wikipedia Turkish
Disambiguation Pages [32]. In this web site, the page titles, which have more
than one different interpretation is listed in alphabetical order. As it is aimed to
work on Turkish ambiguous queries in this collection, a manual investigation is
performed to eliminate the page headers, which have related meanings with each
other. Fifty page headers are included in our test collection as the queries.
Wikipedia Disambiguation pages also list different interpretations of the query.
These lists are included directly as the possible meanings of the queries.
The documents, which are relevant to the query, are retrieved by sending the
queries to the search engines, Google and Bing on August 2011. The
formulation of queries is done in two different ways. The queries are directly
sent to the search engines and also the queries are combined with one of the
meaning of the query. For instance, as one of the meanings of the ambiguous
query, “acil servis” is the “music band,” the formulated query in Turkish is “acil
servis müzik grubu.” The phrase of query is sent to the search engine in
quotation marks. In this way, instead of matching the one term of query, the
whole phrase is searched on the web. As a result, more relevant web pages can
be retrieved to be included in the collection.
Figure 6.1 illustrates the flow of construction of BILDIV-2012. Top 120 web
pages, which are retrieved by Google and Bing, are taken as the relevant pages
of the queries. To reach the search results of Bing, its search library application
programming interface is used [33]. On the other hand, programming library of
Google allows top 60 results to be reachable through its interface [34]. As it is
not enough for our test collection, the source of Google search result page is
downloaded. The URLs are extracted from this page by Jsoup [35], which is a
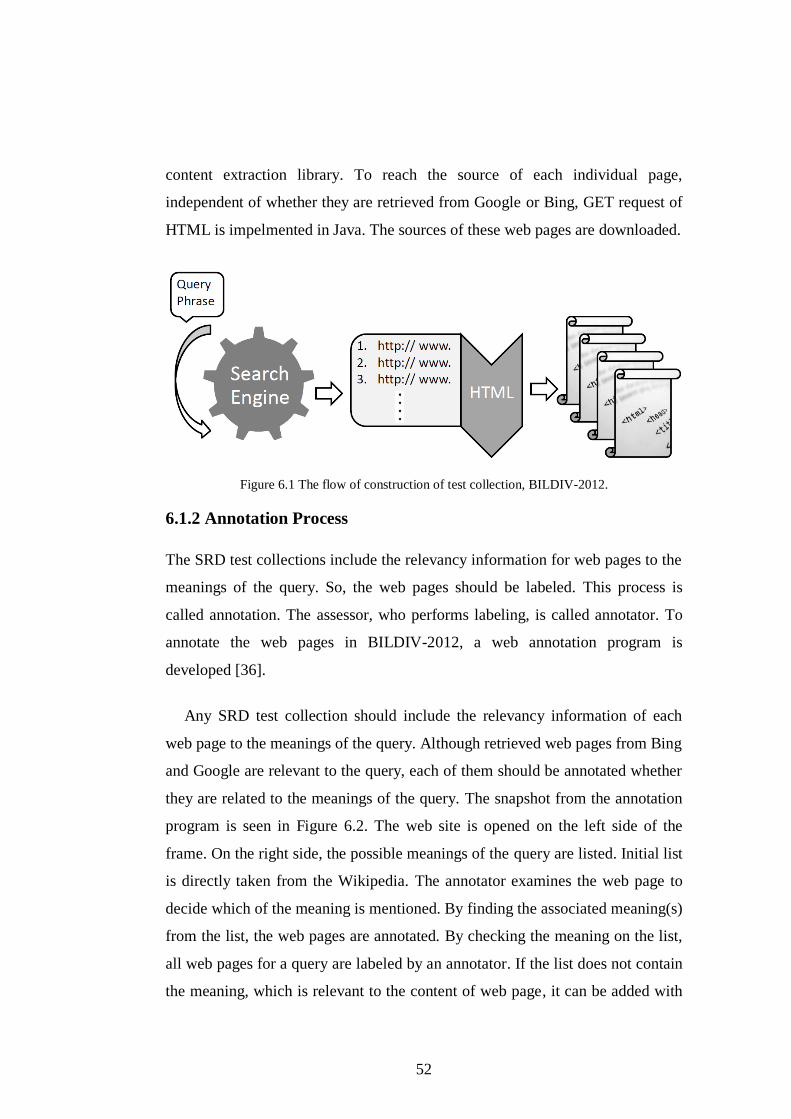
52
content extraction library. To reach the source of each individual page,
independent of whether they are retrieved from Google or Bing, GET request of
HTML is impelmented in Java. The sources of these web pages are downloaded.
Figure 6.1 The flow of construction of test collection, BILDIV-2012.
6.1.2 Annotation Process
The SRD test collections include the relevancy information for web pages to the
meanings of the query. So, the web pages should be labeled. This process is
called annotation. The assessor, who performs labeling, is called annotator. To
annotate the web pages in BILDIV-2012, a web annotation program is
developed [36].
Any SRD test collection should include the relevancy information of each
web page to the meanings of the query. Although retrieved web pages from Bing
and Google are relevant to the query, each of them should be annotated whether
they are related to the meanings of the query. The snapshot from the annotation
program is seen in Figure 6.2. The web site is opened on the left side of the
frame. On the right side, the possible meanings of the query are listed. Initial list
is directly taken from the Wikipedia. The annotator examines the web page to
decide which of the meaning is mentioned. By finding the associated meaning(s)
from the list, the web pages are annotated. By checking the meaning on the list,
all web pages for a query are labeled by an annotator. If the list does not contain
the meaning, which is relevant to the content of web page, it can be added with
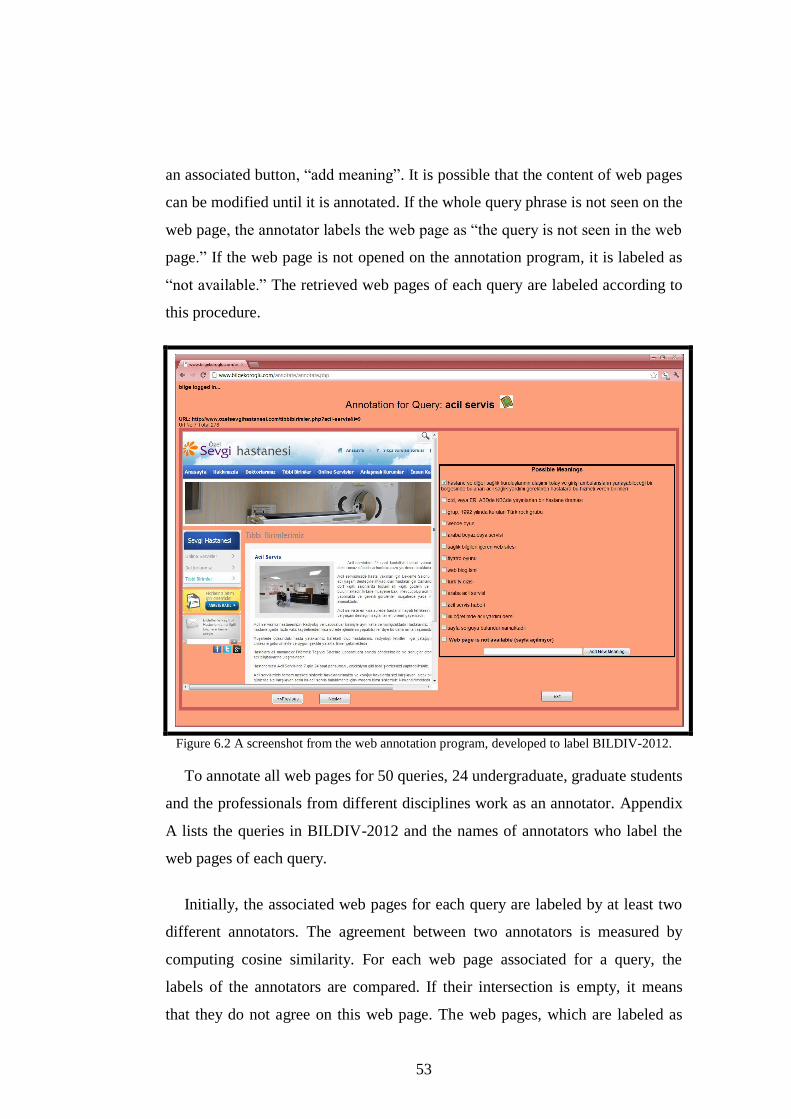
53
an associated button, “add meaning”. It is possible that the content of web pages
can be modified until it is annotated. If the whole query phrase is not seen on the
web page, the annotator labels the web page as “the query is not seen in the web
page.” If the web page is not opened on the annotation program, it is labeled as
“not available.” The retrieved web pages of each query are labeled according to
this procedure.
Figure 6.2 A screenshot from the web annotation program, developed to label BILDIV-2012.
To annotate all web pages for 50 queries, 24 undergraduate, graduate students
and the professionals from different disciplines work as an annotator. Appendix
A lists the queries in BILDIV-2012 and the names of annotators who label the
web pages of each query.
Initially, the associated web pages for each query are labeled by at least two
different annotators. The agreement between two annotators is measured by
computing cosine similarity. For each web page associated for a query, the
labels of the annotators are compared. If their intersection is empty, it means
that they do not agree on this web page. The web pages, which are labeled as
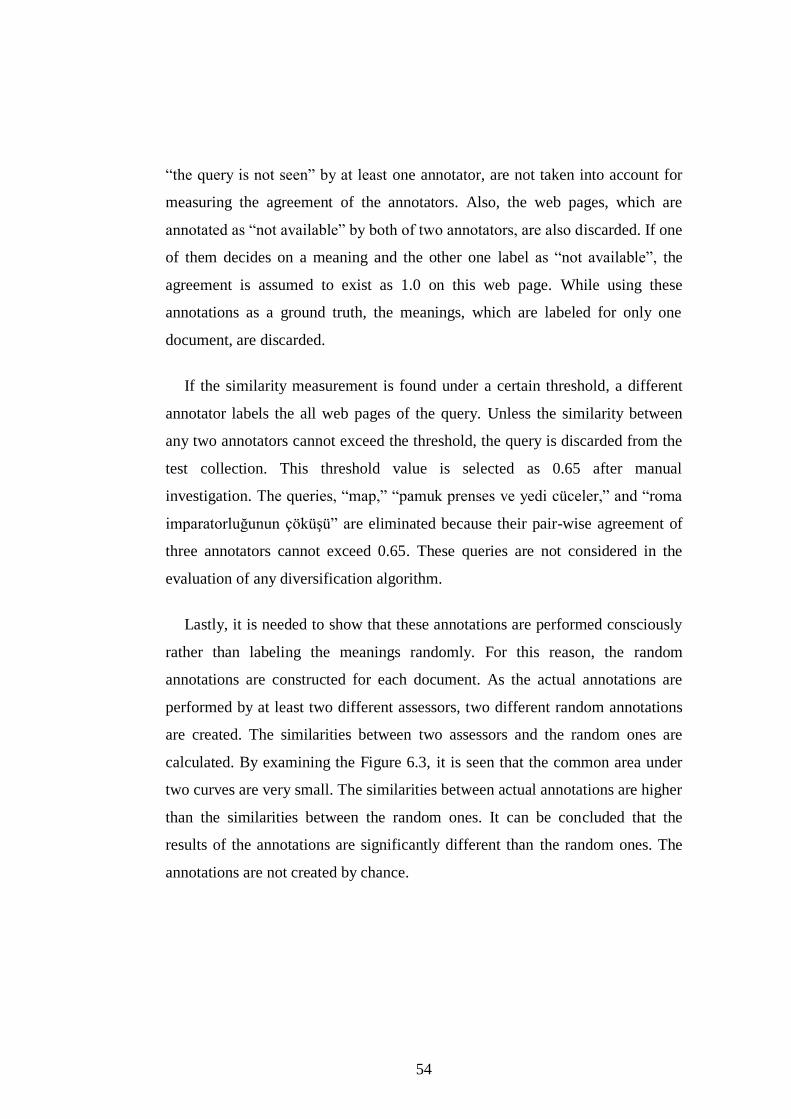
54
“the query is not seen” by at least one annotator, are not taken into account for
measuring the agreement of the annotators. Also, the web pages, which are
annotated as “not available” by both of two annotators, are also discarded. If one
of them decides on a meaning and the other one label as “not available”, the
agreement is assumed to exist as 1.0 on this web page. While using these
annotations as a ground truth, the meanings, which are labeled for only one
document, are discarded.
If the similarity measurement is found under a certain threshold, a different
annotator labels the all web pages of the query. Unless the similarity between
any two annotators cannot exceed the threshold, the query is discarded from the
test collection. This threshold value is selected as 0.65 after manual
investigation. The queries, “map,” “pamuk prenses ve yedi cüceler,” and “roma
imparatorluğunun çöküşü” are eliminated because their pair-wise agreement of
three annotators cannot exceed 0.65. These queries are not considered in the
evaluation of any diversification algorithm.
Lastly, it is needed to show that these annotations are performed consciously
rather than labeling the meanings randomly. For this reason, the random
annotations are constructed for each document. As the actual annotations are
performed by at least two different assessors, two different random annotations
are created. The similarities between two assessors and the random ones are
calculated. By examining the Figure 6.3, it is seen that the common area under
two curves are very small. The similarities between actual annotations are higher
than the similarities between the random ones. It can be concluded that the
results of the annotations are significantly different than the random ones. The
annotations are not created by chance.
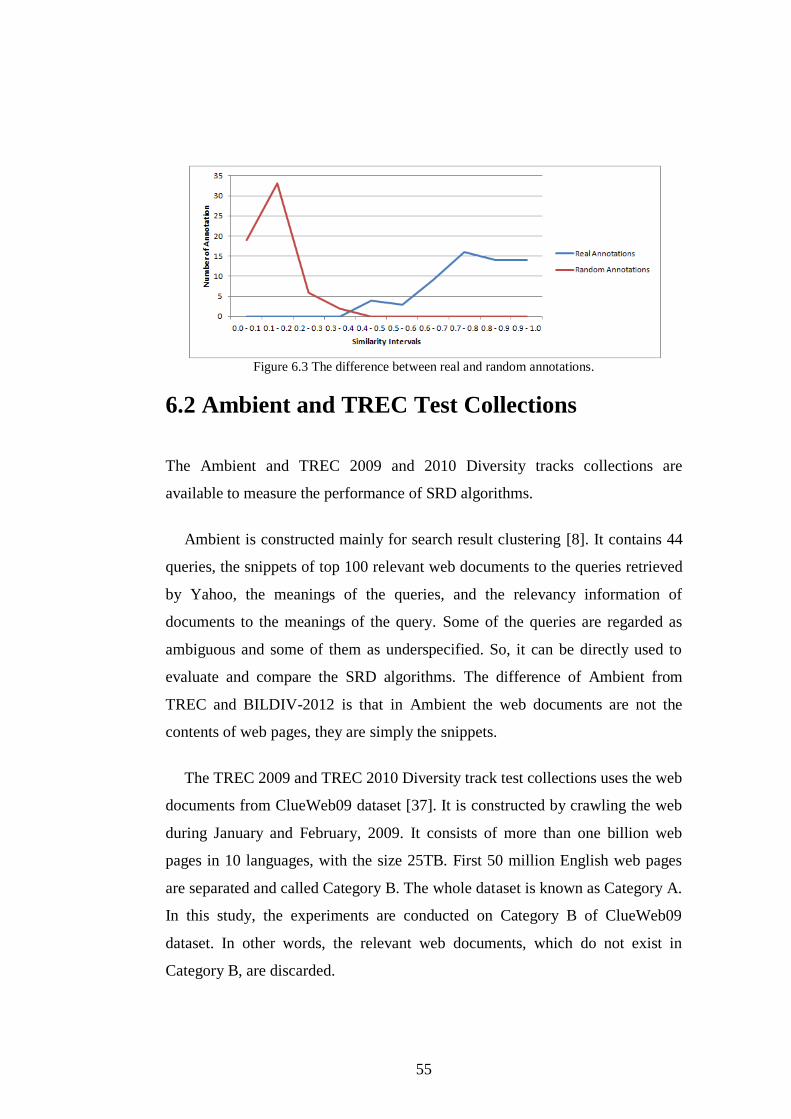
55
Figure 6.3 The difference between real and random annotations.
6.2 Ambient and TREC Test Collections
The Ambient and TREC 2009 and 2010 Diversity tracks collections are
available to measure the performance of SRD algorithms.
Ambient is constructed mainly for search result clustering [8]. It contains 44
queries, the snippets of top 100 relevant web documents to the queries retrieved
by Yahoo, the meanings of the queries, and the relevancy information of
documents to the meanings of the query. Some of the queries are regarded as
ambiguous and some of them as underspecified. So, it can be directly used to
evaluate and compare the SRD algorithms. The difference of Ambient from
TREC and BILDIV-2012 is that in Ambient the web documents are not the
contents of web pages, they are simply the snippets.
The TREC 2009 and TREC 2010 Diversity track test collections uses the web
documents from ClueWeb09 dataset [37]. It is constructed by crawling the web
during January and February, 2009. It consists of more than one billion web
pages in 10 languages, with the size 25TB. First 50 million English web pages
are separated and called Category B. The whole dataset is known as Category A.
In this study, the experiments are conducted on Category B of ClueWeb09
dataset. In other words, the relevant web documents, which do not exist in
Category B, are discarded.
56
The TREC 2009 and 2010 Diversity track collections also include ambiguous
and underspecified queries, the meaning list of queries, the id numbers of
relevant web documents in ClueWeb09, the relevancy information of the
documents to the meanings of the query [9, 10, 38]. There are 50 queries in both
of the collections. As query numbering is continued from 51 in TREC 2010, and
the contents of web pages are taken from ClueWeb09 [37] dataset in both of
them, we merge these two into one collection. We refer to this collection as
TREC SRD test collection, or simply the TREC collection. Although the queries
are released for TREC 2011 Diversity track, they cannot be used in our study,
because the relevancy information of the web documents to the meanings is not
available.
The SRD test collections, BILDIV-2012, Ambient, and TREC are exactly the
same in terms of structure and the aspects of them. The only difference, as
indicated above, is that Ambient contains the snippets rather than the contents of
web pages as web documents. It can be considered as a disadvantage of Ambient
for the SRD algorithms which process the contents of web pages to diversify the
search results. As a snippet is a subset of the words from the content, which
contain the query, it may be more difficult to diversify the search results with
such a short data.
6.3 Comparison of Collections
In this section, BILDIV-2012, Ambient, and TREC collections are compared
according to the number of words in queries and average number of different
meanings per query. Also they are analyzed to find a relationship between the
number of words and the number of meanings of queries
Table 6.1 lists the number of words in queries. BILDIV-2012 is similar to
TREC 2009 and 2010 collections in terms of average and standard deviation of
number of words in the queries. Ambient contains shorter queries as compared
to BILDIV-2012 and TREC collections.
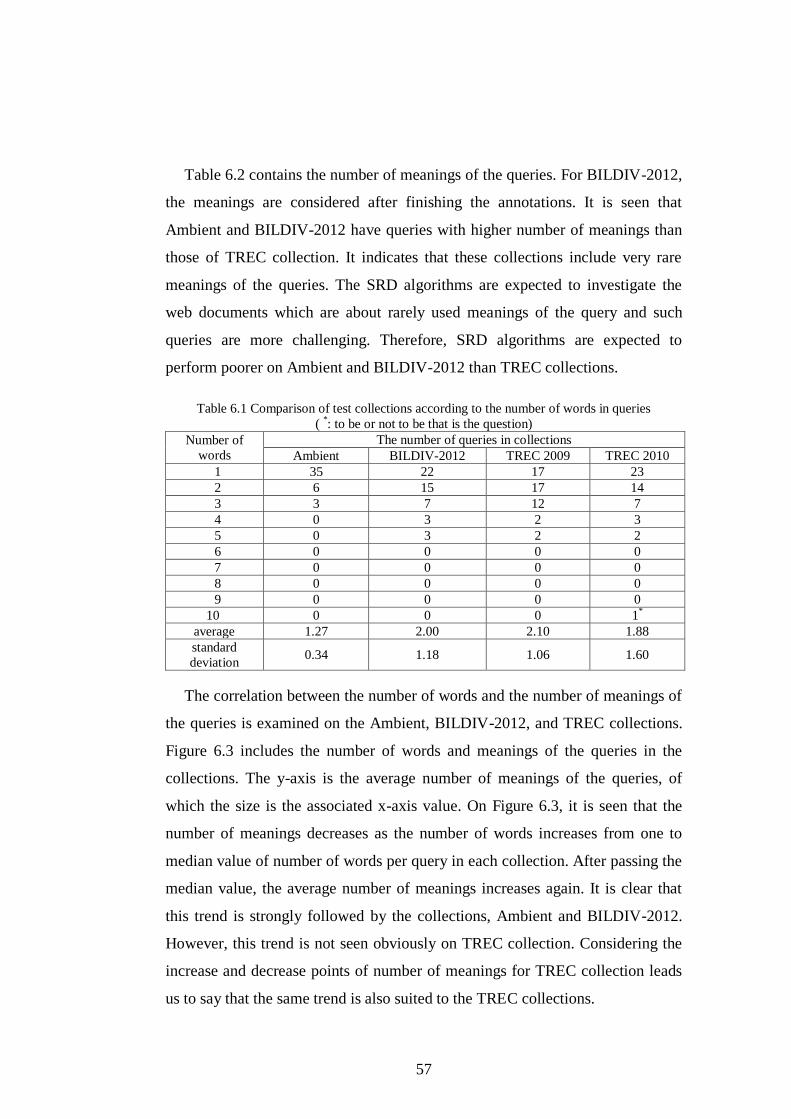
57
Table 6.2 contains the number of meanings of the queries. For BILDIV-2012,
the meanings are considered after finishing the annotations. It is seen that
Ambient and BILDIV-2012 have queries with higher number of meanings than
those of TREC collection. It indicates that these collections include very rare
meanings of the queries. The SRD algorithms are expected to investigate the
web documents which are about rarely used meanings of the query and such
queries are more challenging. Therefore, SRD algorithms are expected to
perform poorer on Ambient and BILDIV-2012 than TREC collections.
Table 6.1 Comparison of test collections according to the number of words in queries
( *: to be or not to be that is the question)
Number of
words
The number of queries in collections
Ambient BILDIV-2012 TREC 2009 TREC 2010
1 35 22 17 23
2 6 15 17 14
3 3 7 12 7
4 0 3 2 3
5 0 3 2 2
6 0 0 0 0
7 0 0 0 0
8 0 0 0 0
9 0 0 0 0
10 0 0 0 1*
average 1.27 2.00 2.10 1.88
standard
deviation 0.34 1.18 1.06 1.60
The correlation between the number of words and the number of meanings of
the queries is examined on the Ambient, BILDIV-2012, and TREC collections.
Figure 6.3 includes the number of words and meanings of the queries in the
collections. The y-axis is the average number of meanings of the queries, of
which the size is the associated x-axis value. On Figure 6.3, it is seen that the
number of meanings decreases as the number of words increases from one to
median value of number of words per query in each collection. After passing the
median value, the average number of meanings increases again. It is clear that
this trend is strongly followed by the collections, Ambient and BILDIV-2012.
However, this trend is not seen obviously on TREC collection. Considering the
increase and decrease points of number of meanings for TREC collection leads
us to say that the same trend is also suited to the TREC collections.
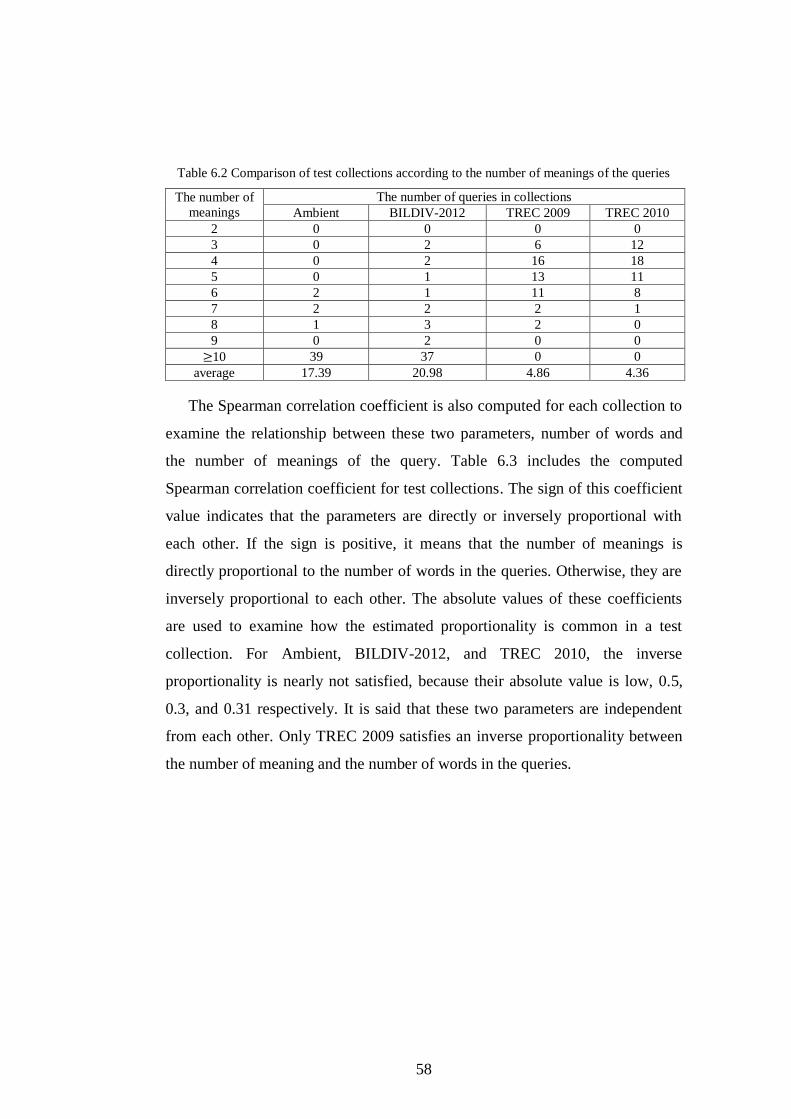
58
Table 6.2 Comparison of test collections according to the number of meanings of the queries
The number of
meanings
The number of queries in collections
Ambient BILDIV-2012 TREC 2009 TREC 2010
2 0 0 0 0
3 0 2 6 12
4 0 2 16 18
5 0 1 13 11
6 2 1 11 8
7 2 2 2 1
8 1 3 2 0
9 0 2 0 0
10 39 37 0 0
average 17.39 20.98 4.86 4.36
The Spearman correlation coefficient is also computed for each collection to
examine the relationship between these two parameters, number of words and
the number of meanings of the query. Table 6.3 includes the computed
Spearman correlation coefficient for test collections. The sign of this coefficient
value indicates that the parameters are directly or inversely proportional with
each other. If the sign is positive, it means that the number of meanings is
directly proportional to the number of words in the queries. Otherwise, they are
inversely proportional to each other. The absolute values of these coefficients
are used to examine how the estimated proportionality is common in a test
collection. For Ambient, BILDIV-2012, and TREC 2010, the inverse
proportionality is nearly not satisfied, because their absolute value is low, 0.5,
0.3, and 0.31 respectively. It is said that these two parameters are independent
from each other. Only TREC 2009 satisfies an inverse proportionality between
the number of meaning and the number of words in the queries.
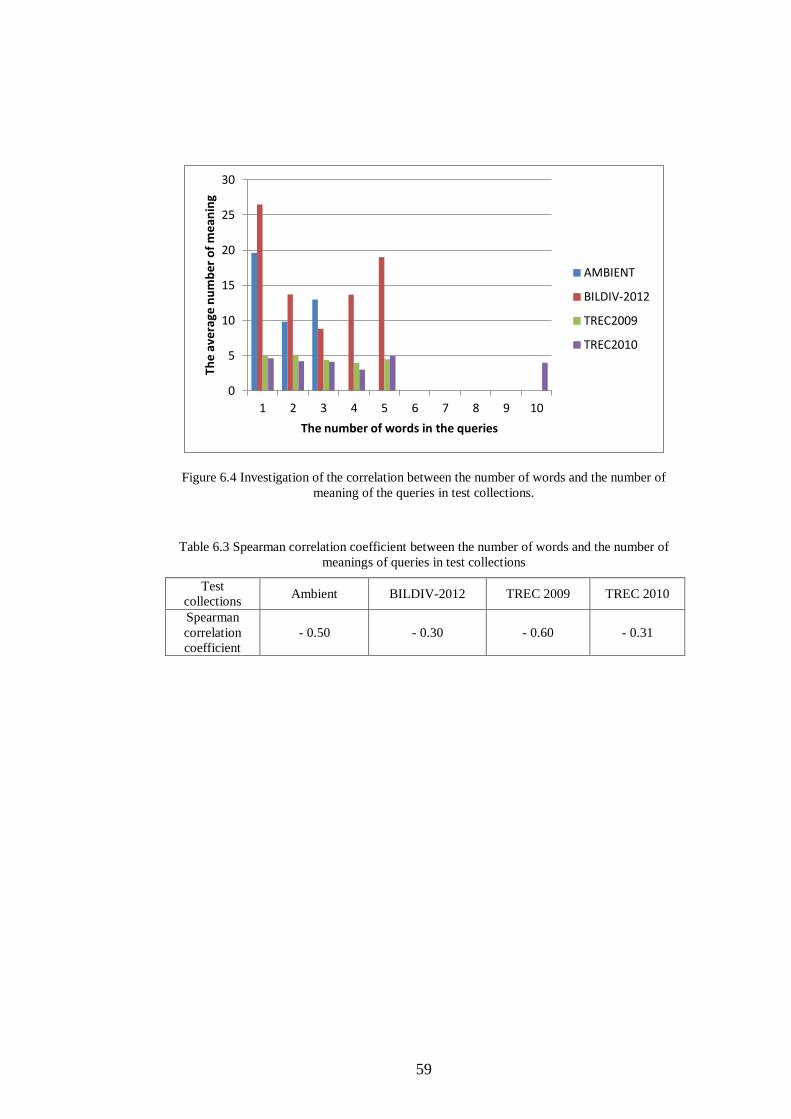
59
Figure 6.4 Investigation of the correlation between the number of words and the number of
meaning of the queries in test collections.
Table 6.3 Spearman correlation coefficient between the number of words and the number of
meanings of queries in test collections
Test
collections Ambient BILDIV-2012 TREC 2009 TREC 2010
Spearman
correlation
coefficient
- 0.50 - 0.30 - 0.60 - 0.31
0
5
10
15
20
25
30
1 2 3 4 5 6 7 8 9 10
Th
e a
vera
ge n
um
be
r o
f m
ea
nin
g
The number of words in the queries
AMBIENT
BILDIV-2012
TREC2009
TREC2010
60
Chapter 7
Performance Evaluation Measures
In this chapter, the performance metrics, S-recall, IA-Precision, and ERR-IA are
explained. By computing these metrics, the performance of CCED can be
compared with other frequently used SRD algorithms, MMR and IA-Select. To
see the way of computation of these metrics on a diversified search result list, an
example search result list is composed. By calculating these evaluation
measurements on this list, the intuition behind the metrics is going to be more
understandable.
Suppose that a diversified search result list has 10 documents and it is
composed for an ambiguous query with six different meanings. The ranking of
the web documents in the ranked list is shown in Table 7.1. Note that any
document, which is related to m6, is not included in toy diversified list.
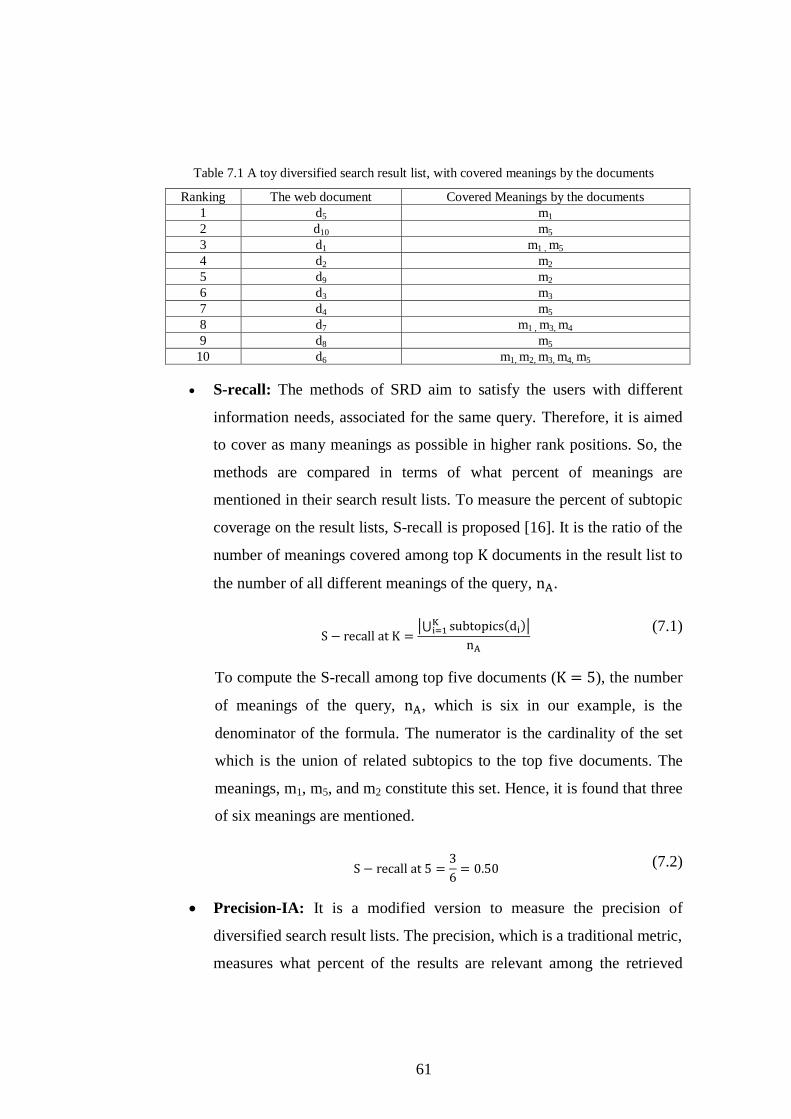
61
Table 7.1 A toy diversified search result list, with covered meanings by the documents
Ranking The web document Covered Meanings by the documents
1 d5 m1
2 d10 m5
3 d1 m1 , m5
4 d2 m2
5 d9 m2
6 d3 m3
7 d4 m5
8 d7 m1 , m3, m4
9 d8 m5
10 d6 m1, m2, m3, m4, m5
S-recall: The methods of SRD aim to satisfy the users with different
information needs, associated for the same query. Therefore, it is aimed
to cover as many meanings as possible in higher rank positions. So, the
methods are compared in terms of what percent of meanings are
mentioned in their search result lists. To measure the percent of subtopic
coverage on the result lists, S-recall is proposed [16]. It is the ratio of the
number of meanings covered among top documents in the result list to
the number of all different meanings of the query, .
(7.1)
To compute the S-recall among top five documents ( ), the number
of meanings of the query, , which is six in our example, is the
denominator of the formula. The numerator is the cardinality of the set
which is the union of related subtopics to the top five documents. The
meanings, m1, m5, and m2 constitute this set. Hence, it is found that three
of six meanings are mentioned.
(7.2)
Precision-IA: It is a modified version to measure the precision of
diversified search result lists. The precision, which is a traditional metric,
measures what percent of the results are relevant among the retrieved
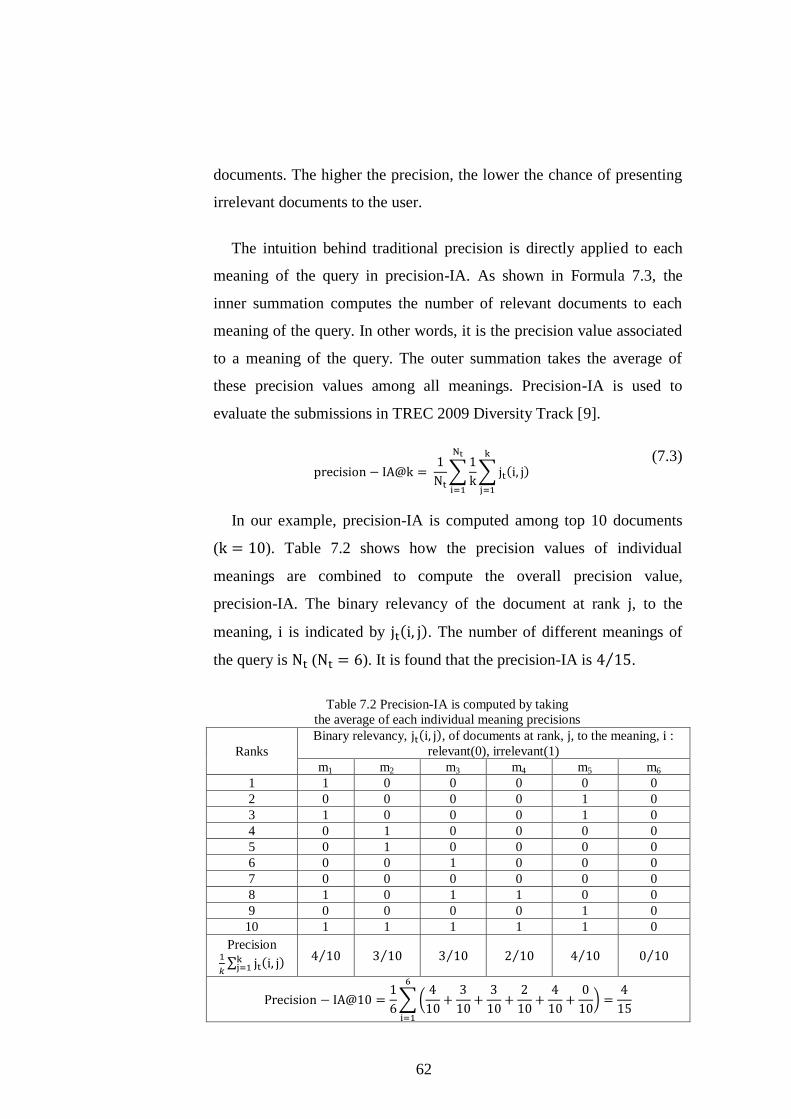
62
documents. The higher the precision, the lower the chance of presenting
irrelevant documents to the user.
The intuition behind traditional precision is directly applied to each
meaning of the query in precision-IA. As shown in Formula 7.3, the
inner summation computes the number of relevant documents to each
meaning of the query. In other words, it is the precision value associated
to a meaning of the query. The outer summation takes the average of
these precision values among all meanings. Precision-IA is used to
evaluate the submissions in TREC 2009 Diversity Track [9].
(7.3)
In our example, precision-IA is computed among top 10 documents
( ). Table 7.2 shows how the precision values of individual
meanings are combined to compute the overall precision value,
precision-IA. The binary relevancy of the document at rank , to the
meaning, is indicated by . The number of different meanings of
the query is ( ). It is found that the precision-IA is .
Table 7.2 Precision-IA is computed by taking
the average of each individual meaning precisions
Ranks
Binary relevancy, , of documents at rank, , to the meaning, : relevant(0), irrelevant(1)
m1 m2 m3 m4 m5 m6
1 1 0 0 0 0 0
2 0 0 0 0 1 0
3 1 0 0 0 1 0
4 0 1 0 0 0 0
5 0 1 0 0 0 0
6 0 0 1 0 0 0
7 0 0 0 0 0 0
8 1 0 1 1 0 0
9 0 0 0 0 1 0
10 1 1 1 1 1 0
Precision
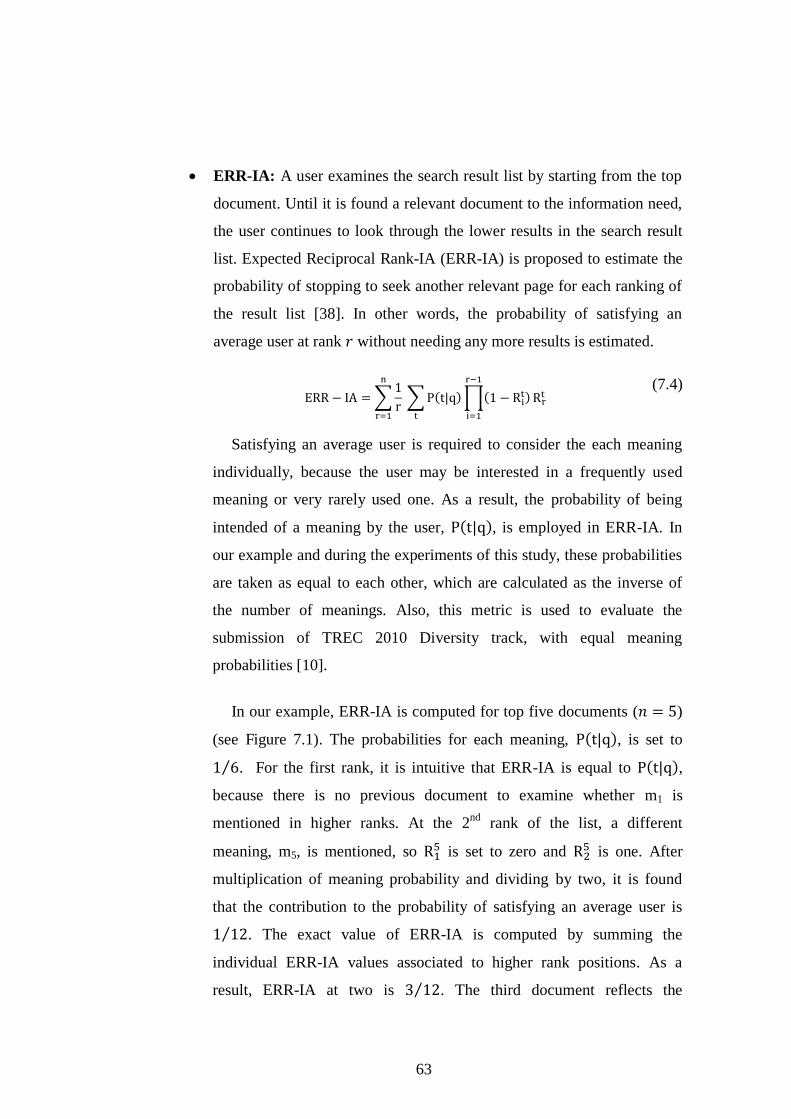
63
ERR-IA: A user examines the search result list by starting from the top
document. Until it is found a relevant document to the information need,
the user continues to look through the lower results in the search result
list. Expected Reciprocal Rank-IA (ERR-IA) is proposed to estimate the
probability of stopping to seek another relevant page for each ranking of
the result list [38]. In other words, the probability of satisfying an
average user at rank without needing any more results is estimated.
(7.4)
Satisfying an average user is required to consider the each meaning
individually, because the user may be interested in a frequently used
meaning or very rarely used one. As a result, the probability of being
intended of a meaning by the user, , is employed in ERR-IA. In
our example and during the experiments of this study, these probabilities
are taken as equal to each other, which are calculated as the inverse of
the number of meanings. Also, this metric is used to evaluate the
submission of TREC 2010 Diversity track, with equal meaning
probabilities [10].
In our example, ERR-IA is computed for top five documents ( )
(see Figure 7.1). The probabilities for each meaning, , is set to
. For the first rank, it is intuitive that ERR-IA is equal to ,
because there is no previous document to examine whether m1 is
mentioned in higher ranks. At the 2nd
rank of the list, a different
meaning, m5, is mentioned, so is set to zero and
is one. After
multiplication of meaning probability and dividing by two, it is found
that the contribution to the probability of satisfying an average user is
. The exact value of ERR-IA is computed by summing the
individual ERR-IA values associated to higher rank positions. As a
result, ERR-IA at two is . The third document reflects the
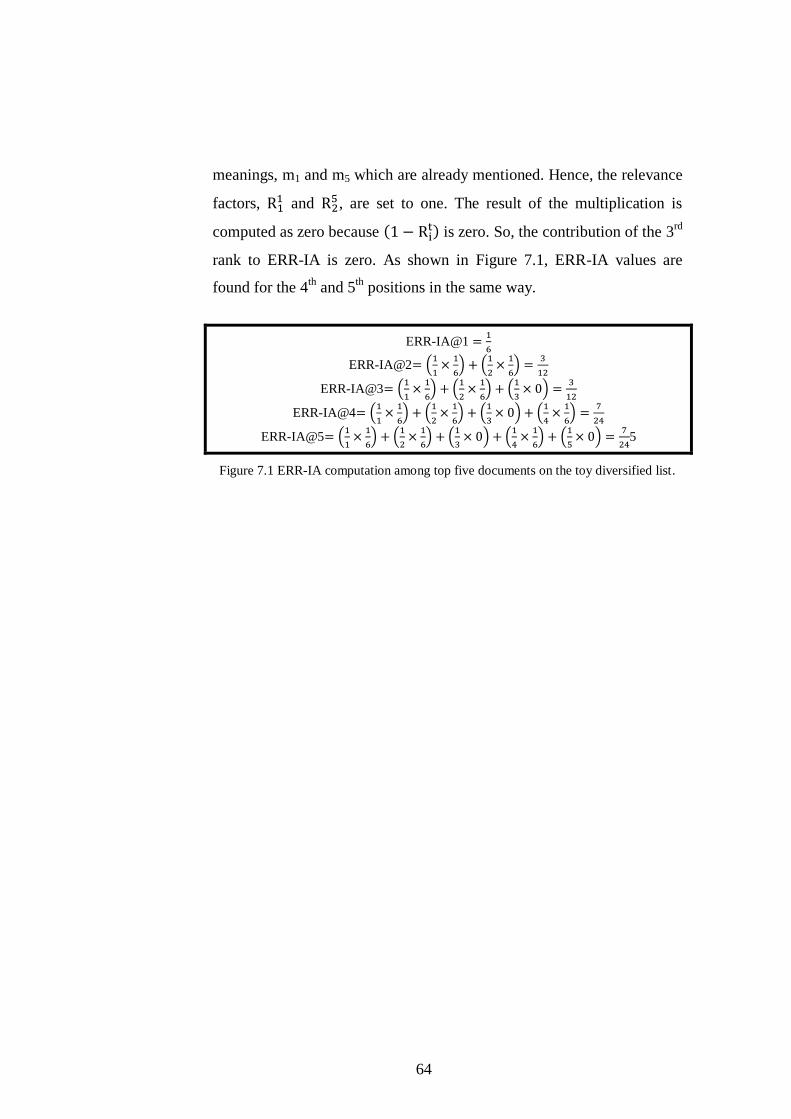
64
meanings, m1 and m5 which are already mentioned. Hence, the relevance
factors, and
, are set to one. The result of the multiplication is
computed as zero because is zero. So, the contribution of the 3
rd
rank to ERR-IA is zero. As shown in Figure 7.1, ERR-IA values are
found for the 4th
and 5th
positions in the same way.
ERR-IA@1
ERR-IA@2
ERR-IA@3
ERR-IA@4
ERR-IA@5
5
Figure 7.1 ERR-IA computation among top five documents on the toy diversified list.
65
Chapter 8
Experimental Results
In this section, the performance of CCED is compared with other frequently
used diversification algorithms, MMR and IA-Select. To show the success of
estimation of number of meanings in CCED is evaluated in two different ways,
both estimating the number of meanings and setting to the size of annotated list
for the associated queries. In all experiments, MMR performs nearly the same
with parameters, 0.2, 0.5, and 0.8. For simplicity, only the results with the
parameter, 0.5, are given. Also, pure search engine results and random ranking
of relevant documents to each meaning are included in the experiments.
The comparison is performed on the diversified search result lists, which are
composed by these algorithms. By measuring their meaning coverage with S-
recall, the precision with Precision-IA, and expected rank to satisfy an average
user with ERR-IA, the algorithms are evaluated. Ambient, TREC 2009-2010
Diversity Tracks and BILDIV-2012 are used as test collections. Also, the effects
of the aspects of collections on the experiments are explained.
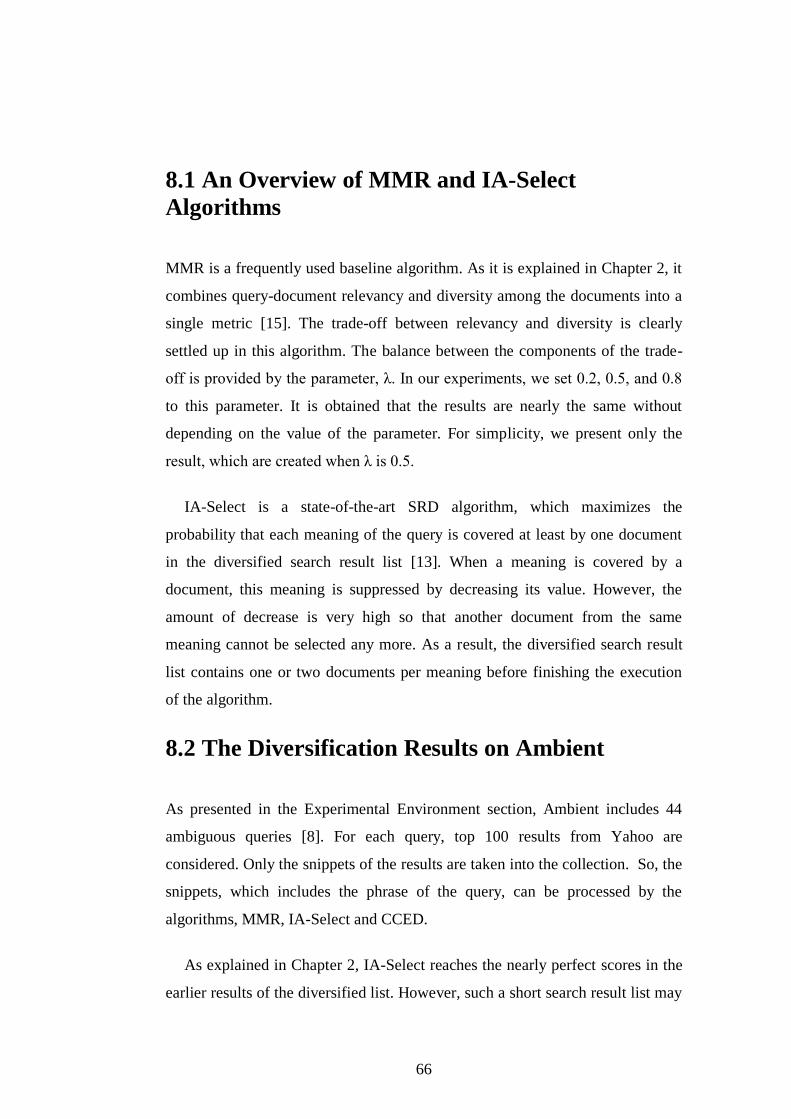
66
8.1 An Overview of MMR and IA-Select
Algorithms
MMR is a frequently used baseline algorithm. As it is explained in Chapter 2, it
combines query-document relevancy and diversity among the documents into a
single metric [15]. The trade-off between relevancy and diversity is clearly
settled up in this algorithm. The balance between the components of the trade-
off is provided by the parameter, λ. In our experiments, we set 0.2, 0.5, and 0.8
to this parameter. It is obtained that the results are nearly the same without
depending on the value of the parameter. For simplicity, we present only the
result, which are created when λ is 0.5.
IA-Select is a state-of-the-art SRD algorithm, which maximizes the
probability that each meaning of the query is covered at least by one document
in the diversified search result list [13]. When a meaning is covered by a
document, this meaning is suppressed by decreasing its value. However, the
amount of decrease is very high so that another document from the same
meaning cannot be selected any more. As a result, the diversified search result
list contains one or two documents per meaning before finishing the execution
of the algorithm.
8.2 The Diversification Results on Ambient
As presented in the Experimental Environment section, Ambient includes 44
ambiguous queries [8]. For each query, top 100 results from Yahoo are
considered. Only the snippets of the results are taken into the collection. So, the
snippets, which includes the phrase of the query, can be processed by the
algorithms, MMR, IA-Select and CCED.
As explained in Chapter 2, IA-Select reaches the nearly perfect scores in the
earlier results of the diversified list. However, such a short search result list may
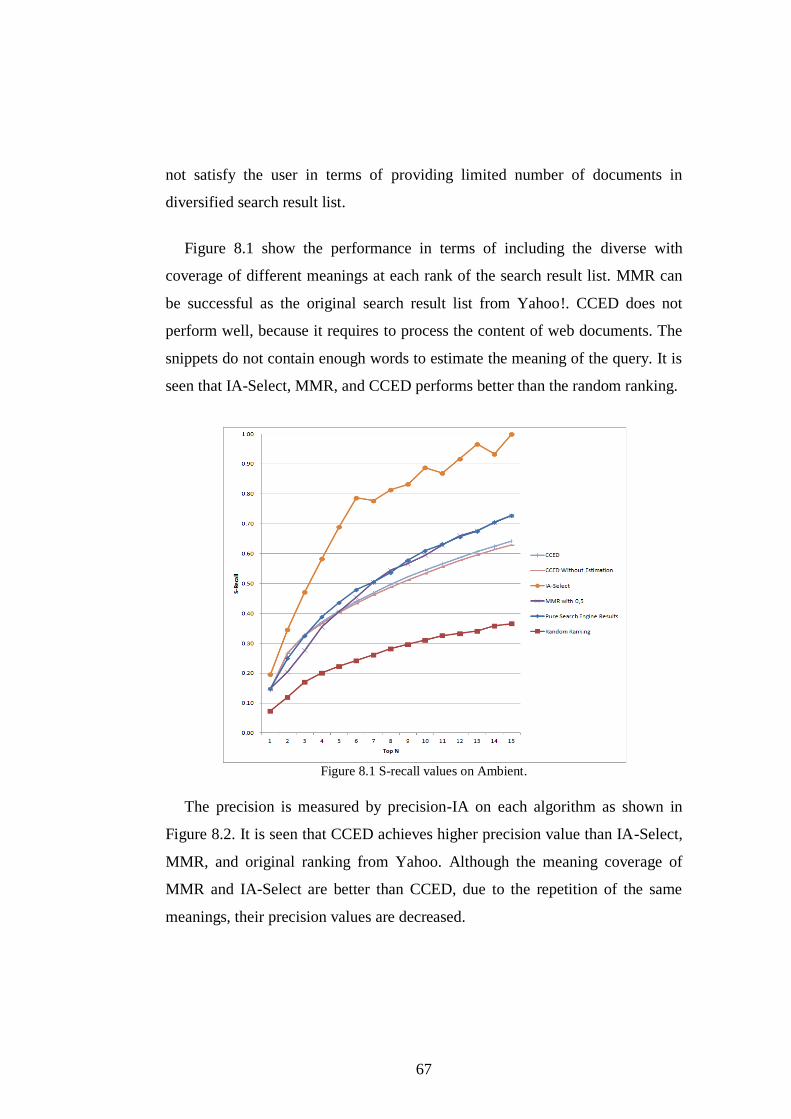
67
not satisfy the user in terms of providing limited number of documents in
diversified search result list.
Figure 8.1 show the performance in terms of including the diverse with
coverage of different meanings at each rank of the search result list. MMR can
be successful as the original search result list from Yahoo!. CCED does not
perform well, because it requires to process the content of web documents. The
snippets do not contain enough words to estimate the meaning of the query. It is
seen that IA-Select, MMR, and CCED performs better than the random ranking.
Figure 8.1 S-recall values on Ambient.
The precision is measured by precision-IA on each algorithm as shown in
Figure 8.2. It is seen that CCED achieves higher precision value than IA-Select,
MMR, and original ranking from Yahoo. Although the meaning coverage of
MMR and IA-Select are better than CCED, due to the repetition of the same
meanings, their precision values are decreased.
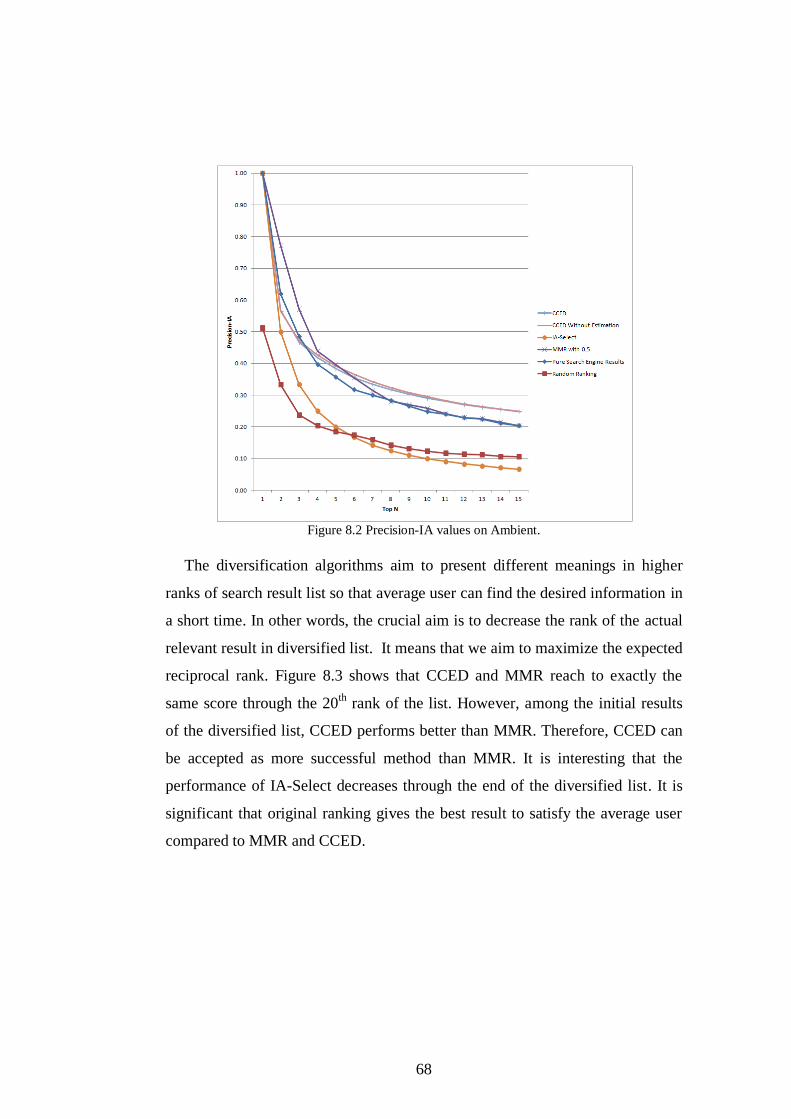
68
Figure 8.2 Precision-IA values on Ambient.
The diversification algorithms aim to present different meanings in higher
ranks of search result list so that average user can find the desired information in
a short time. In other words, the crucial aim is to decrease the rank of the actual
relevant result in diversified list. It means that we aim to maximize the expected
reciprocal rank. Figure 8.3 shows that CCED and MMR reach to exactly the
same score through the 20th
rank of the list. However, among the initial results
of the diversified list, CCED performs better than MMR. Therefore, CCED can
be accepted as more successful method than MMR. It is interesting that the
performance of IA-Select decreases through the end of the diversified list. It is
significant that original ranking gives the best result to satisfy the average user
compared to MMR and CCED.
69
Figure 8.3 ERR-IA values on Ambient.
8.3 The Diversification Results on TREC
Collections
In this study, TREC 2009 and 2010 Diversity Tracks datasets are merged
because the relevant documents are taken from the same collection, ClueWeb09.
After conducting the experiments on TREC collections, it is found that the test
collection has sufficient number of documents related to each meaning of the
query. So, it can be concluded that it is reasonable to diversify the result list by
random ranking of the documents.
Figure 8.4 illustrates the aspect of meaning coverage of the methods. MMR
and CCED has nearly the same performance on TREC collections in terms of
covering nearly the same percent of meanings among top 20 documents. It is
investigated that random ranking is found as successful as the other methods and
also the original ranking. It means that the set of web documents has equal
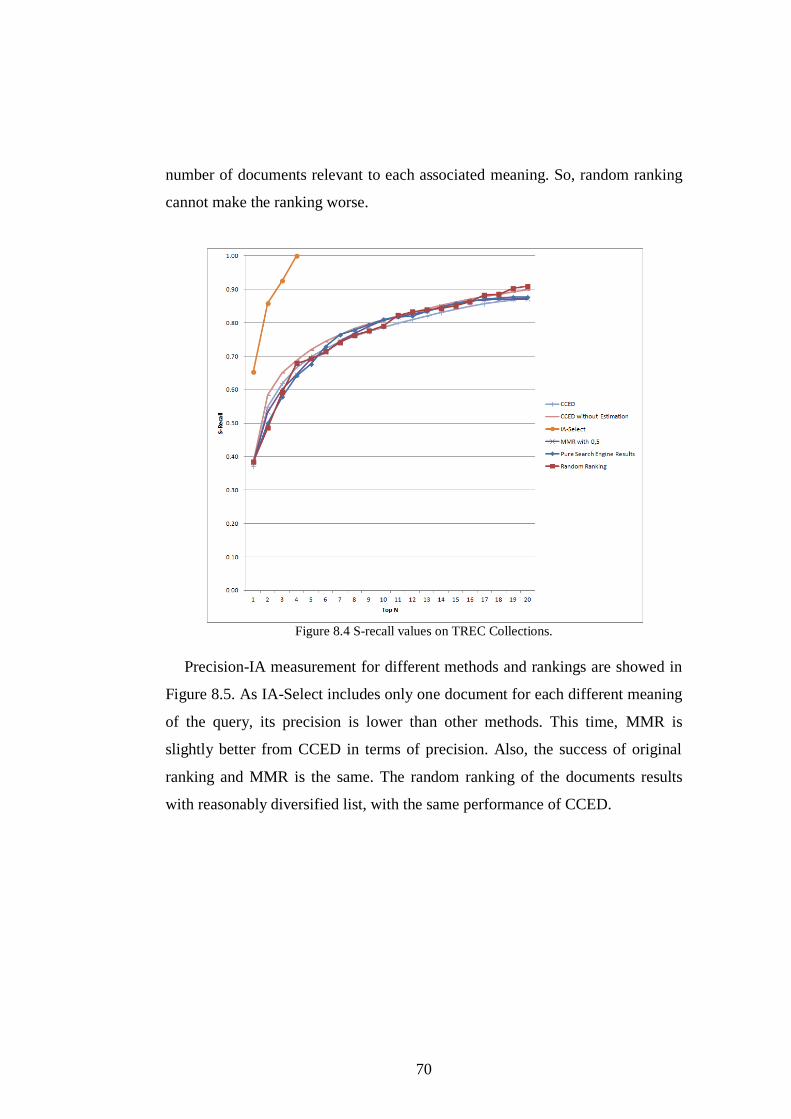
70
number of documents relevant to each associated meaning. So, random ranking
cannot make the ranking worse.
Figure 8.4 S-recall values on TREC Collections.
Precision-IA measurement for different methods and rankings are showed in
Figure 8.5. As IA-Select includes only one document for each different meaning
of the query, its precision is lower than other methods. This time, MMR is
slightly better from CCED in terms of precision. Also, the success of original
ranking and MMR is the same. The random ranking of the documents results
with reasonably diversified list, with the same performance of CCED.
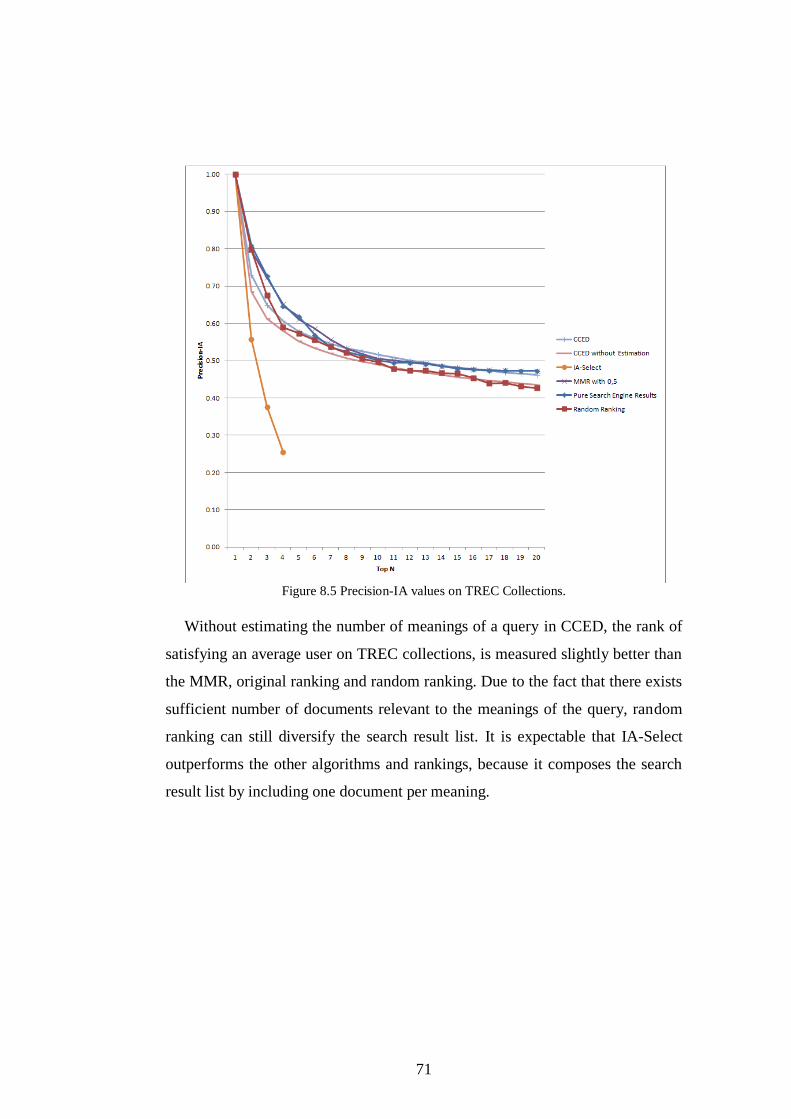
71
Figure 8.5 Precision-IA values on TREC Collections.
Without estimating the number of meanings of a query in CCED, the rank of
satisfying an average user on TREC collections, is measured slightly better than
the MMR, original ranking and random ranking. Due to the fact that there exists
sufficient number of documents relevant to the meanings of the query, random
ranking can still diversify the search result list. It is expectable that IA-Select
outperforms the other algorithms and rankings, because it composes the search
result list by including one document per meaning.
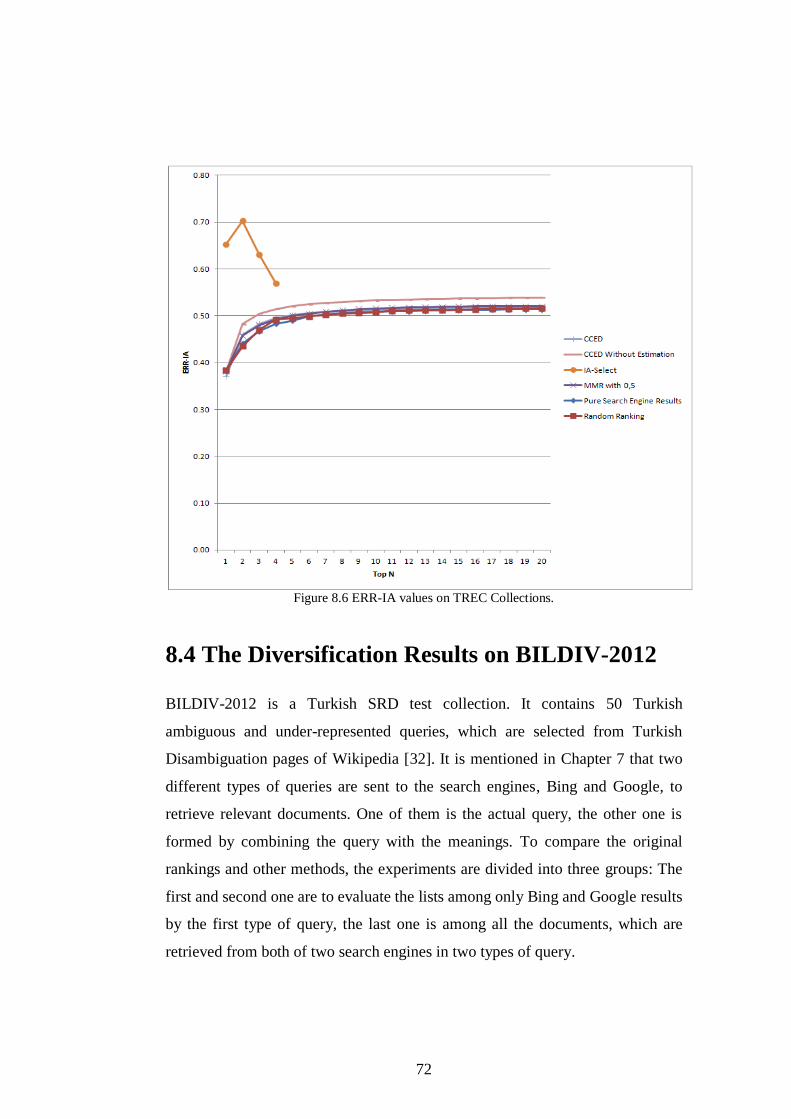
72
Figure 8.6 ERR-IA values on TREC Collections.
8.4 The Diversification Results on BILDIV-2012
BILDIV-2012 is a Turkish SRD test collection. It contains 50 Turkish
ambiguous and under-represented queries, which are selected from Turkish
Disambiguation pages of Wikipedia [32]. It is mentioned in Chapter 7 that two
different types of queries are sent to the search engines, Bing and Google, to
retrieve relevant documents. One of them is the actual query, the other one is
formed by combining the query with the meanings. To compare the original
rankings and other methods, the experiments are divided into three groups: The
first and second one are to evaluate the lists among only Bing and Google results
by the first type of query, the last one is among all the documents, which are
retrieved from both of two search engines in two types of query.
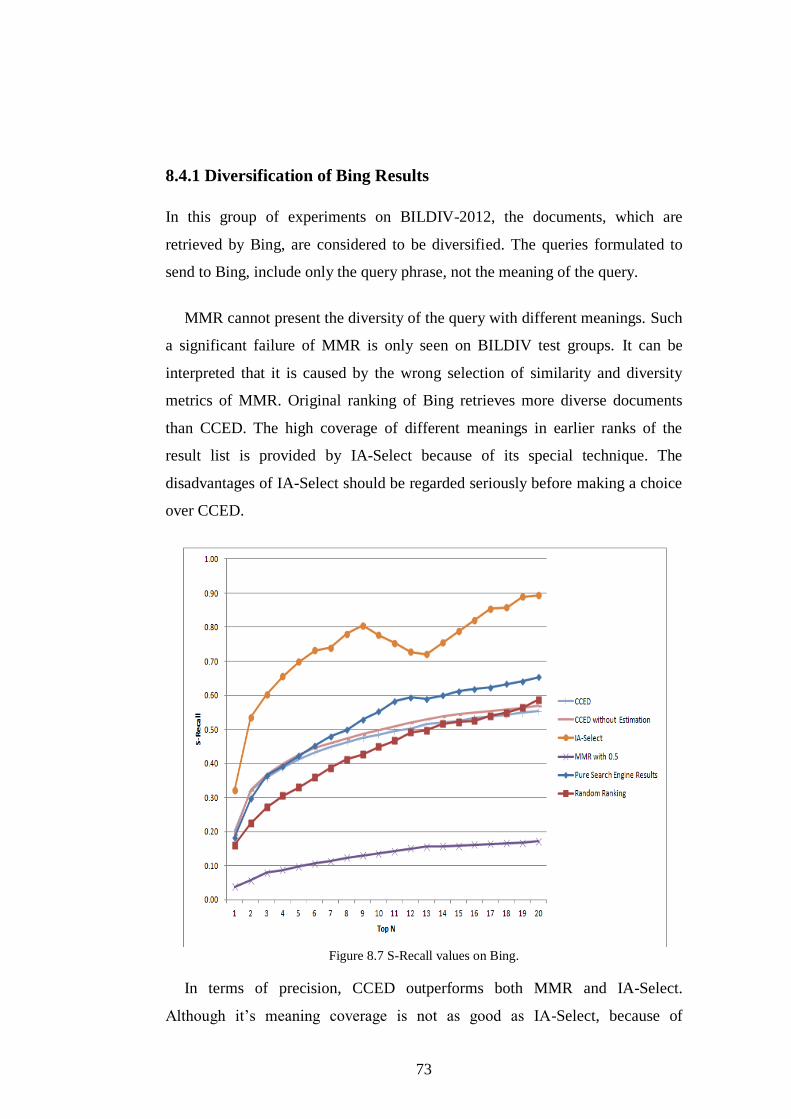
73
8.4.1 Diversification of Bing Results
In this group of experiments on BILDIV-2012, the documents, which are
retrieved by Bing, are considered to be diversified. The queries formulated to
send to Bing, include only the query phrase, not the meaning of the query.
MMR cannot present the diversity of the query with different meanings. Such
a significant failure of MMR is only seen on BILDIV test groups. It can be
interpreted that it is caused by the wrong selection of similarity and diversity
metrics of MMR. Original ranking of Bing retrieves more diverse documents
than CCED. The high coverage of different meanings in earlier ranks of the
result list is provided by IA-Select because of its special technique. The
disadvantages of IA-Select should be regarded seriously before making a choice
over CCED.
Figure 8.7 S-Recall values on Bing.
In terms of precision, CCED outperforms both MMR and IA-Select.
Although it’s meaning coverage is not as good as IA-Select, because of
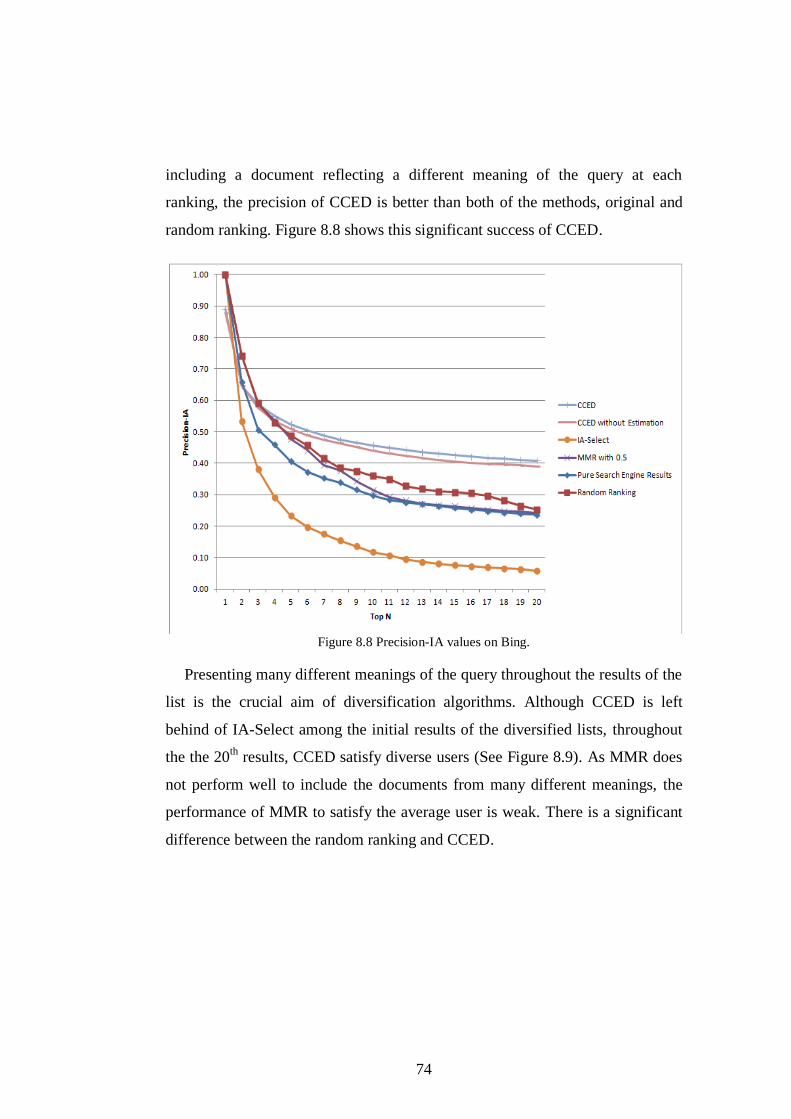
74
including a document reflecting a different meaning of the query at each
ranking, the precision of CCED is better than both of the methods, original and
random ranking. Figure 8.8 shows this significant success of CCED.
Figure 8.8 Precision-IA values on Bing.
Presenting many different meanings of the query throughout the results of the
list is the crucial aim of diversification algorithms. Although CCED is left
behind of IA-Select among the initial results of the diversified lists, throughout
the the 20th
results, CCED satisfy diverse users (See Figure 8.9). As MMR does
not perform well to include the documents from many different meanings, the
performance of MMR to satisfy the average user is weak. There is a significant
difference between the random ranking and CCED.
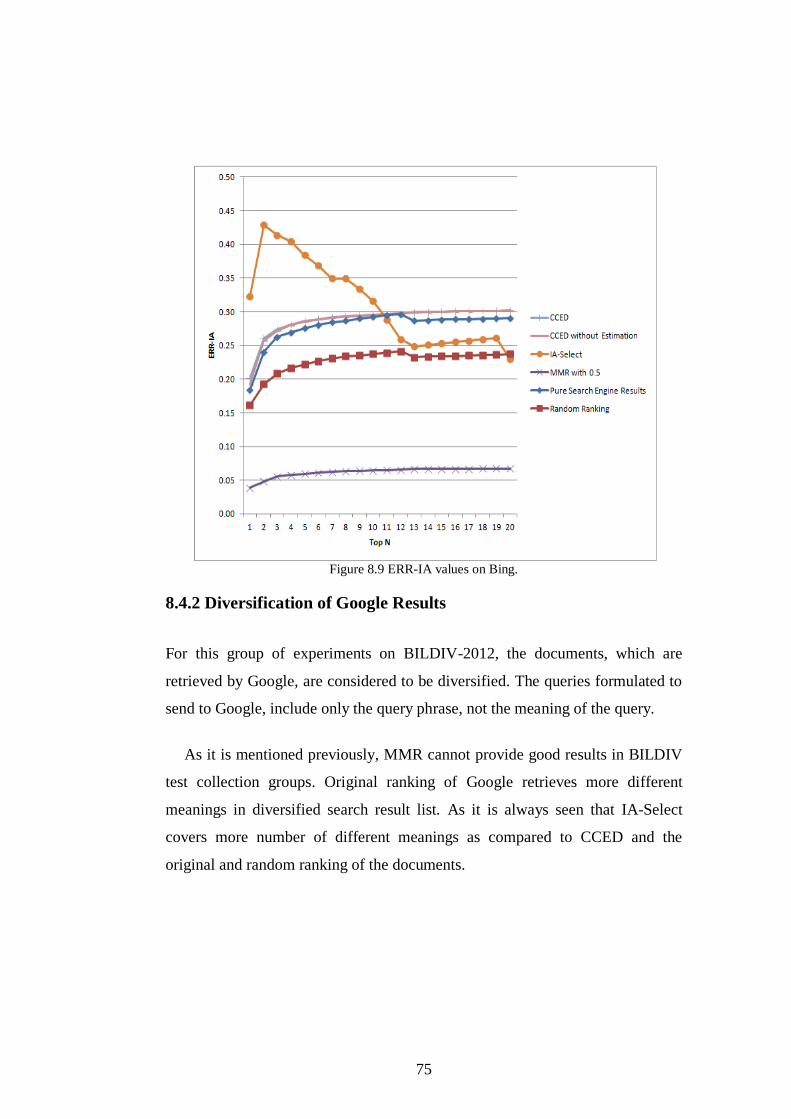
75
Figure 8.9 ERR-IA values on Bing.
8.4.2 Diversification of Google Results
For this group of experiments on BILDIV-2012, the documents, which are
retrieved by Google, are considered to be diversified. The queries formulated to
send to Google, include only the query phrase, not the meaning of the query.
As it is mentioned previously, MMR cannot provide good results in BILDIV
test collection groups. Original ranking of Google retrieves more different
meanings in diversified search result list. As it is always seen that IA-Select
covers more number of different meanings as compared to CCED and the
original and random ranking of the documents.
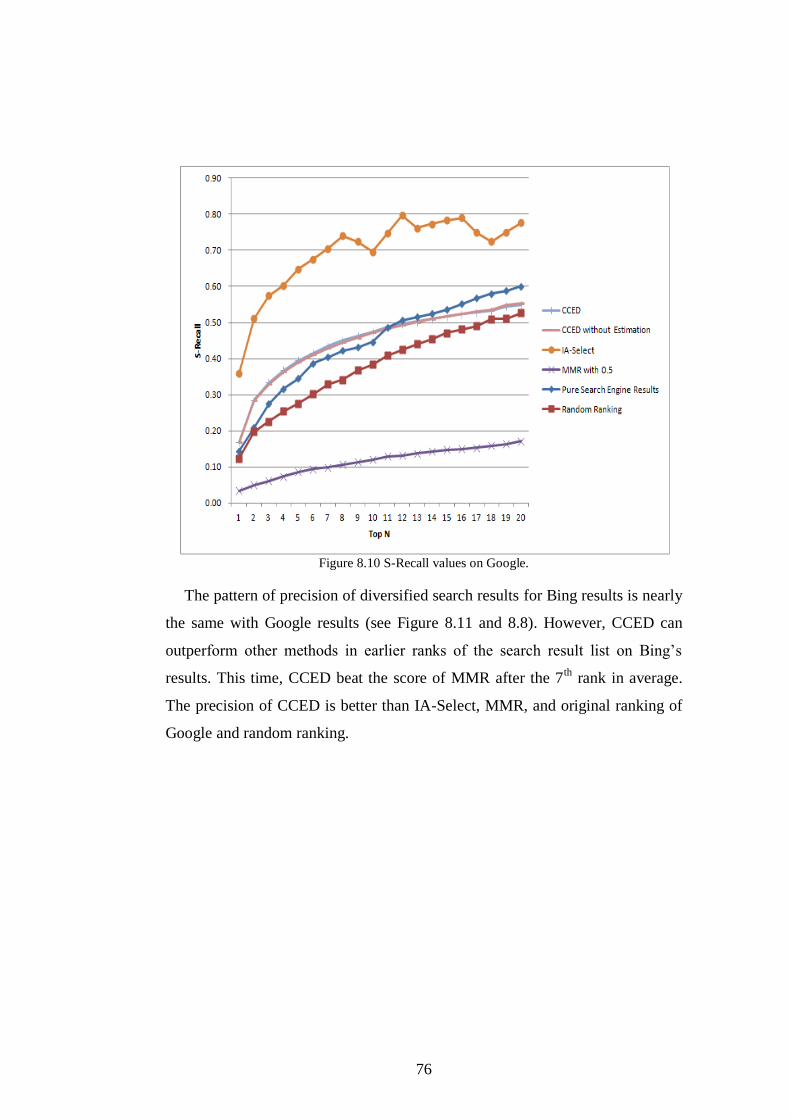
76
Figure 8.10 S-Recall values on Google.
The pattern of precision of diversified search results for Bing results is nearly
the same with Google results (see Figure 8.11 and 8.8). However, CCED can
outperform other methods in earlier ranks of the search result list on Bing’s
results. This time, CCED beat the score of MMR after the 7th
rank in average.
The precision of CCED is better than IA-Select, MMR, and original ranking of
Google and random ranking.
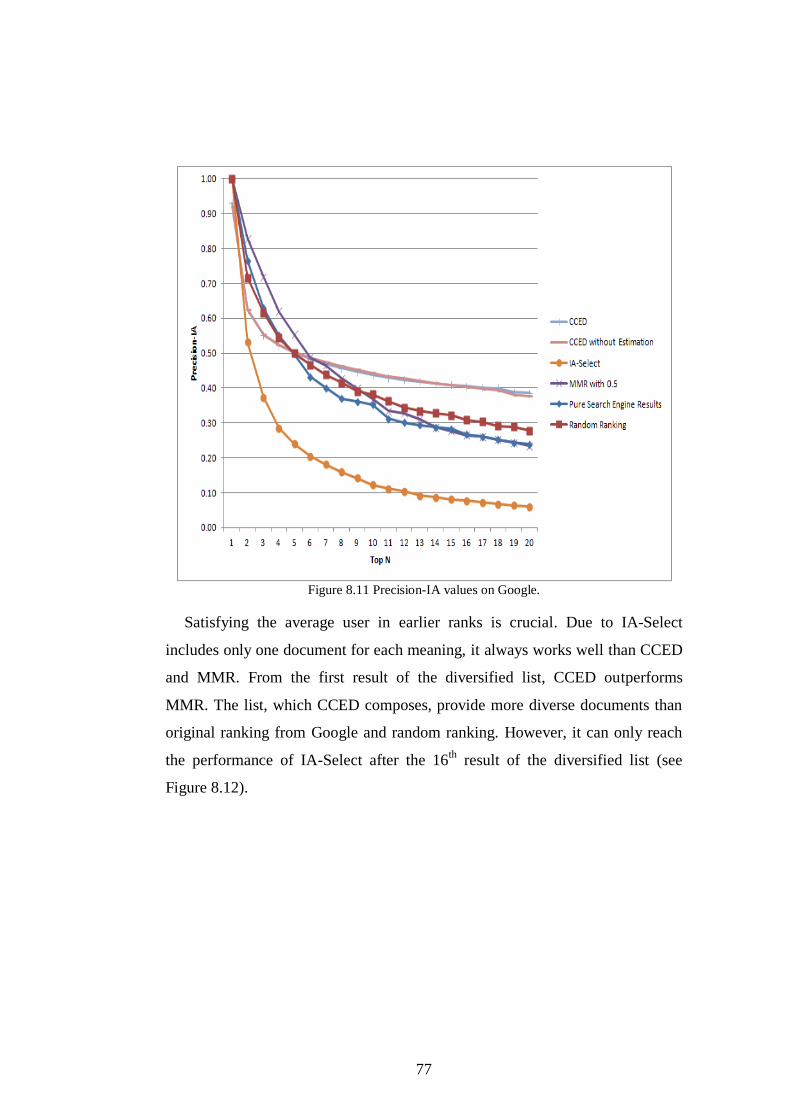
77
Figure 8.11 Precision-IA values on Google.
Satisfying the average user in earlier ranks is crucial. Due to IA-Select
includes only one document for each meaning, it always works well than CCED
and MMR. From the first result of the diversified list, CCED outperforms
MMR. The list, which CCED composes, provide more diverse documents than
original ranking from Google and random ranking. However, it can only reach
the performance of IA-Select after the 16th
result of the diversified list (see
Figure 8.12).
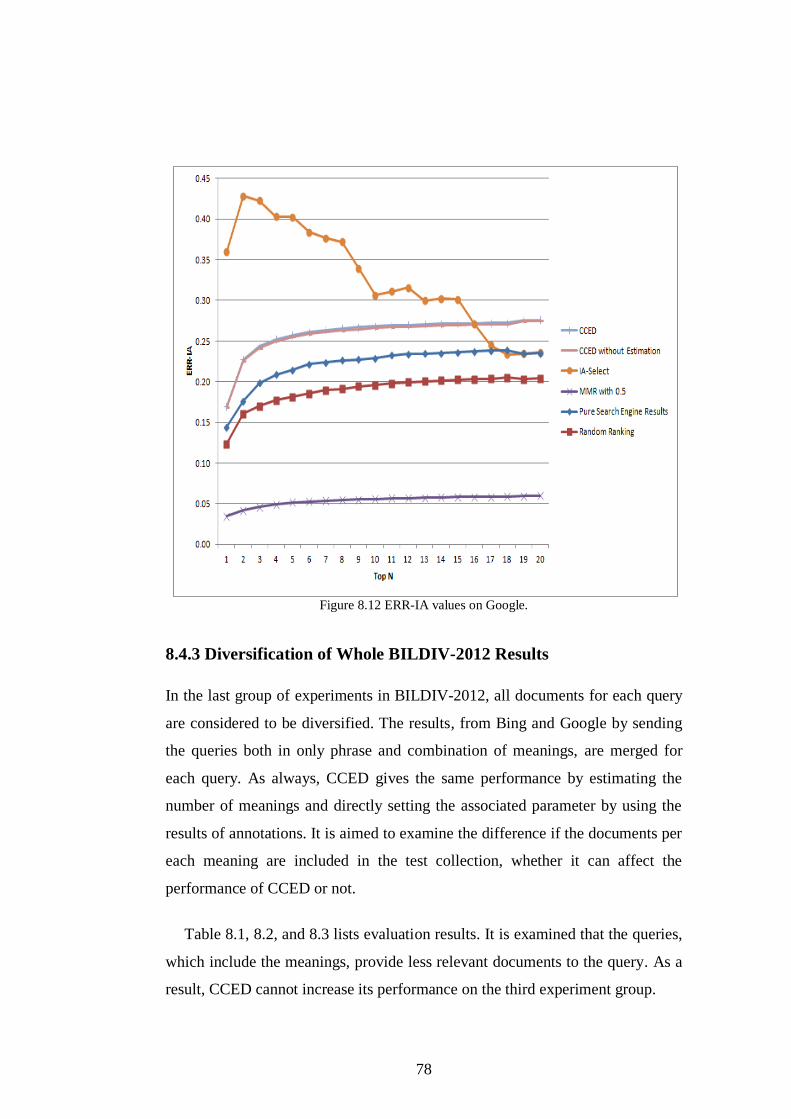
78
Figure 8.12 ERR-IA values on Google.
8.4.3 Diversification of Whole BILDIV-2012 Results
In the last group of experiments in BILDIV-2012, all documents for each query
are considered to be diversified. The results, from Bing and Google by sending
the queries both in only phrase and combination of meanings, are merged for
each query. As always, CCED gives the same performance by estimating the
number of meanings and directly setting the associated parameter by using the
results of annotations. It is aimed to examine the difference if the documents per
each meaning are included in the test collection, whether it can affect the
performance of CCED or not.
Table 8.1, 8.2, and 8.3 lists evaluation results. It is examined that the queries,
which include the meanings, provide less relevant documents to the query. As a
result, CCED cannot increase its performance on the third experiment group.
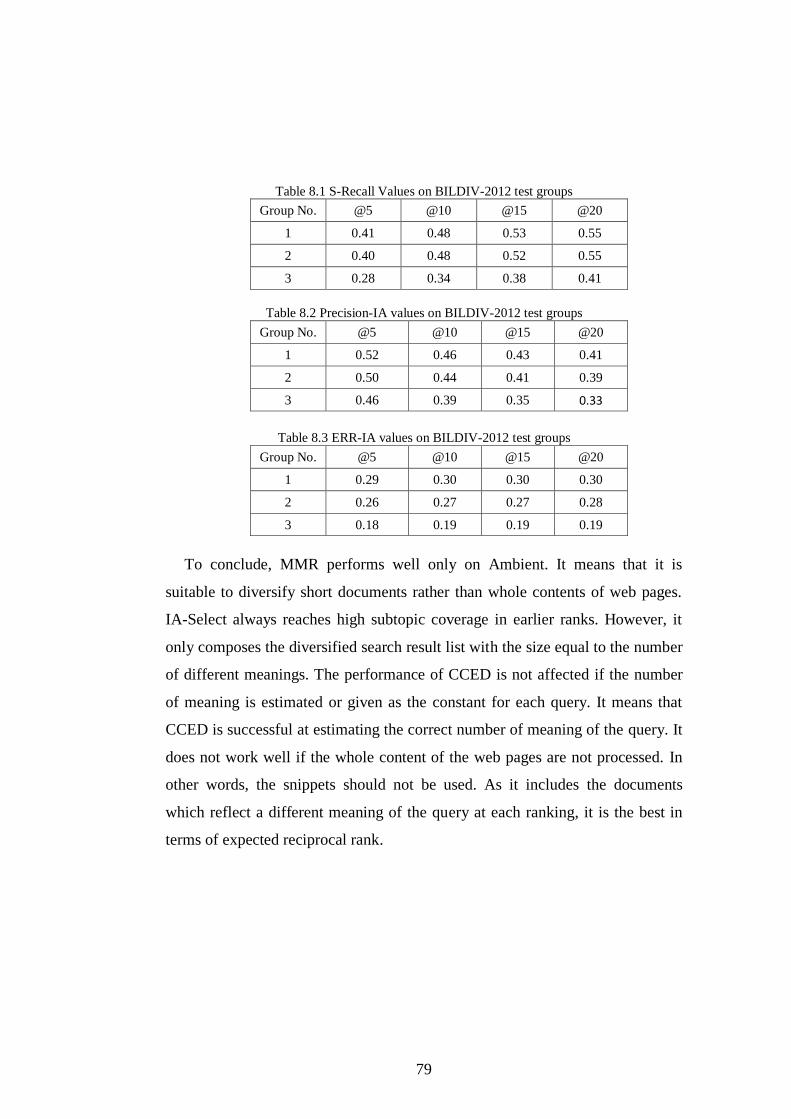
79
Table 8.1 S-Recall Values on BILDIV-2012 test groups
Group No. @5 @10 @15 @20
1 0.41 0.48 0.53 0.55
2 0.40 0.48 0.52 0.55
3 0.28 0.34 0.38 0.41
Table 8.2 Precision-IA values on BILDIV-2012 test groups
Group No. @5 @10 @15 @20
1 0.52 0.46 0.43 0.41
2 0.50 0.44 0.41 0.39
3 0.46 0.39 0.35 0.33
Table 8.3 ERR-IA values on BILDIV-2012 test groups
Group No. @5 @10 @15 @20
1 0.29 0.30 0.30 0.30
2 0.26 0.27 0.27 0.28
3 0.18 0.19 0.19 0.19
To conclude, MMR performs well only on Ambient. It means that it is
suitable to diversify short documents rather than whole contents of web pages.
IA-Select always reaches high subtopic coverage in earlier ranks. However, it
only composes the diversified search result list with the size equal to the number
of different meanings. The performance of CCED is not affected if the number
of meaning is estimated or given as the constant for each query. It means that
CCED is successful at estimating the correct number of meaning of the query. It
does not work well if the whole content of the web pages are not processed. In
other words, the snippets should not be used. As it includes the documents
which reflect a different meaning of the query at each ranking, it is the best in
terms of expected reciprocal rank.
80
Chapter 9
Conclusion and Future Work
In this study, the problem of composing a search result list for the queries, which
have more than one different meaning, is examined. The motivation behind this
study is that such queries, which are called ambiguous, are commonly sent to the
search engines. Also, it is nearly impossible to predict that which of the
meanings of the query is intended by the user. The solution to this problem is to
present a diversified search result list, in which the documents reflect different
meanings of the query. We propose an SRD algorithm, CCED to present
diversified lists for the ambiguous queries.
The SRD algorithms usually use some aspects of the meanings of the query,
like the number of meanings, the list of the meanings by taking as an input. This
type of information can be extracted from the logs. CCED differentiates from
other SRD algorithms with estimating the number of meaning of a query. Also,
by identifying the frequently and rarely used meanings, it ranks the documents,
which are related to the rare meanings, among higher ranks of the list. As it is a
typical diversification algorithm, it balances the trade-off between query-
document similarity and diversity with modified reciprocal rank and cross
entropy respectively.
81
To measure the performance of CCED, Ambient and TREC 2009 and 2010
Diversity track collections are used. Also, the Turkish SRD test collection,
BILDIV-2012 is constructed. In this way, the experiments are conducted on two
different languages, English and Turkish. CCED is compared with other
frequently used diversification algorithms, MMR and IA-Select. It is found that
CCED is more successful when the whole web page contents are available.
Although IA-Select reaches the high subtopic coverage in earlier ranks of search
result list, CCED outperforms MMR and IA-Select in terms of retrieving a
different meaning at each ranking without repetition among a subset of
meanings.
Search result diversification is open to many research topics including:
1. It is needed to detect of a query whether it has more than one meaning
or not.
2. To know the meanings of a query, it may be helpful to apply some Data
Mining techniques to extract the meanings.
3. Optimum diversified ranking can be worked to specify it more
accurately. For this purpose, it may be needed to conduct extensive user
studies.
4. According to the optimum ranking, new evaluation measures should be
proposed.
5. Learning to rank methods can be applicable to composing the
diversified search result list for an ambiguous query.
82
BIBLIOGRAPHY
1 S. Bhatia, C. Brunk, and P. Mitra, “A query classification scheme for
diversification,” in Proceedings of 2nd Workshop Diversity in Document
Retrieval, DDR ’12, (Seattle, Washington, USA), ACM, 2012.
2 M. Sanderson, “Ambiguous queries: test collections need more sense,” in
Proceedings of 31st annual international ACM SIGIR Conference on
Research and Development in Information Retrieval, SIGIR ’08, (Singapore),
pp. 499–506, ACM, 2008.
3 R. Song, D. Qi, J. Y. Nie, Y. Yu, H. W. Hon, “Identification of ambiguous
queries in web search,” Information Processing and Management, vol. 45, no.
2, pp. 216–229, 2009.
4 L. Mihalkova and R. Mooney, “Learning to disambiguate search queries from
short sessions,” in Proceedings of the European Conference on Machine
Learning and Knowledge Discovery in Databases, ECML-KDD ’09, (Bled,
Slovenia), pp. 111–127, 2009.
5 D. M. Blei, A. Y. Ng, and M. I. Jordan, “Latent dirichlet allocation,” Journal
of Machine Learning Research, vol. 3, pp. 993–1022, 2003.
6 Using Entropy for Evaluating and Comparing Probability Distributions,
http://www.cs.rochester.edu/u/james/CSC248/Lec6.pdf, 2012.
7 S. Gollapudi and A. Sharma, “An axiomatic approach for result
diversification,” in Proceedings of the 8th International World Wide Web
Conference, WWW ’09, (Madrid, Spain), pp. 381–390, ACM, 2009.
83
8 Ambient dataset, http://credo.fub.it/ambient, 2012.
9 C. L. Clarke, N. Craswell, and I. Soboroff, “Overview of TREC 2009 web
track,” in Proceedings of 18th Text Retrieval Conference, (Gaithersburg,
Maryland, USA), 2009.
10 C. L. Clarke, N. Craswell, I. Soboroff, and G. V. Cormack, “Overview of
TREC 2010 web track,” in Proceedings of 19th
Text Retrieval Conference,
(Gaithersburg, Maryland, USA), 2010.
11 B. Liu, C. W. Chin, and H. T. Ng, “Mining topic-specific concepts and
definitions on the web,” in Proceedings of the 12th International World Wide
Web Conference, WWW ’03, (Budapest, Hungary), pp. 251–260, ACM,
2003.
12 B. Zhang, H. Li, Y. Liu, L. Ji, W. Xi, W. Fan, Z. Chen, and W. Ma,
“Improving web search results using affinity graph,” in Proceedings of 28th
Annual International ACM SIGIR Conference on Research and Development
in Information Retrieval, SIGIR ’05, (Salvador, Brazil), pp. 504–511, ACM,
2005.
13 R. Agrawal, S. Gollapudi, A. Halverson, S. Ieong, “Diversifying search
results,” in Proceedings of 2nd ACM International Conference on Web
Search and Data Mining, WWW ’09, (Barcelona, Spain), pp. 5–14, ACM,
2009.
14 F. Radlinski and S. Dumais, “Improving personalized web search using result
diversification,” in Proceedings of 29th Annual International ACM SIGIR
Conference on Research and Development in Information Retrieval, SIGIR
’06, (Seattle, Washington, USA), pp. 691–692, ACM, 2006.
15 J. G. Carbonell and J. Goldstein, “The use of mmr, diversity-based reranking
for reordering documents and producing summaries,” in Proceedings of 21st
Annual International ACM SIGIR Conference on Research and Development
in Information Retrieval, SIGIR ’98, pp. 335–336, 1998.
84
16 C. Zhai, W. W. Cohen, J. Lafferty, “Beyond independent relevance: methods
and evaluation metrics for subtopic retrieval,” in Proceedings of 26th Annual
International ACM SIGIR Conference on Research and Development in
Information Retrieval, (Toronto, Canada), pp. 10–17, ACM, 2003.
17 M. R. Vieira, H. L. Razente, and M. C. N. Barioni, “On query result
diversification,” in Proceedings of the IEEE 27th International Conference on
Data Engineering, ICDE ’11, (Hannover, Germany), pp. 1163–1174, IEEE,
2011.
18 E. Vee, U. Srivastava, J. Shanmugasundaram, P. Bhat, and S. A. Yahia,
“Efficient computation of diverse query results,” in Proceedings of the IEEE
24th International Conference on Data Engineering, ICDE ’08, (Cancun,
Mexico), pp. 228–236, IEEE, 2008.
19 H. Chen and D. Karger, “Less is more: probabilistic models for retrieving
fewer relevant documents,” in Proceedings of the 29th Annual International
Conference on Research and Development in Information Retrieval, SIGIR
’06, (Seattle, Washington, USA), pp. 429–436, ACM, 2006.
20 F. Radlinski, R. Kleinberg, and T. Joachims, “Learning diverse rankings with
multi-armed bandits,” in Proceedings of 25th International Conference on
Machine Learning, ICML ’08, (Helsinki, Finland), pp. 784–791, 2008.
21 Y. Yue and T. Joachims, “Predicting diverse subsets using structural svms,”
in Proceedings of 25th International Conference on Machine Learning,
ICML ’08, pp. 1224–1231, 2008.
22 API Docs Readability, http://www.readability.com/developers/api, 2012.
23 Jericho HTML Parser, http://jericho.htmlparser.net/docs/index.html, 2012.
24 D. D. Lewis, Y. Yang, T. G. Rose, and F. Li, “RCV1: A new benchmark
collection for text categorization research,” Journal of Machine Learning
Research, vol. 5, pp. 361–397, 2004.
85
25 The Natural Language Processing Group, http://nlp.ceng.fatih.edu.tr/blog/,
2012.
26 S. Kardas, “New event detection and tracking in Turkish,” Master’s thesis,
Bilkent University, 2009.
27 LingPipe Home, http://alias-i.com/lingpipe/, 2012.
28 Mallet Homepage, http://mallet.cs.umass.edu/, 2012.
29 R. Nuray, and F. Can, “Automatic ranking of information retrieval systems
using data fusion,” Information Processing and Management, vol. 42, no. 3,
pp. 595–614, 2006.
30 T. M. Mitchell. Machine Learning. McGraw-Hill, New York, 1997.
31 R. Song, D. Qi, H. Liu, T. Sakai, J. Nie, H. Hon, and Y. Yu, “Constructing a
test collection with multi-intent queries,” in Proceedings of 3rd International
Workshop on Evaluating Information Access, (Tokyo, Japan), pp. 51–59,
National Institute of Informatics, 2010.
32 Kategori: Anlam Ayrımı,
http://tr.wikipedia.org/wiki/Kategori:Anlam_ayr%C4%B1m%C4%B1, 2012.
33 Bing Search API, https://datamarket.azure.com/dataset/5BA839F1-12CE-
4CCE-BF57-A49D98D29A44#schema, 2012.
34 Developer’s Guide, Google Web Search API,
https://developers.google.com/web-search/docs/, 2012.
35 Jsoup Java HTML Parser, with best of DOM, CSS, and jquery,
http://jsoup.org/, 2012.
36 Turkish Search Result Diversification Dataset Annotation Page,
http://www.bilgekoroglu.com/annotate/, 2012.
37 The ClueWeb09 Dataset, http://www.lemurproject.org/clueweb09.php/, 2012.
38 O. Chapelle, D. Meltzer, Y. Zhang, and P. Grinspan, “Expected reciprocal
rank for graded relevance,” in Proceedings of 18th ACM Conference on

86
Information and Knowledge Management, (Hong Kong, China), pp. 621–630,
2009.
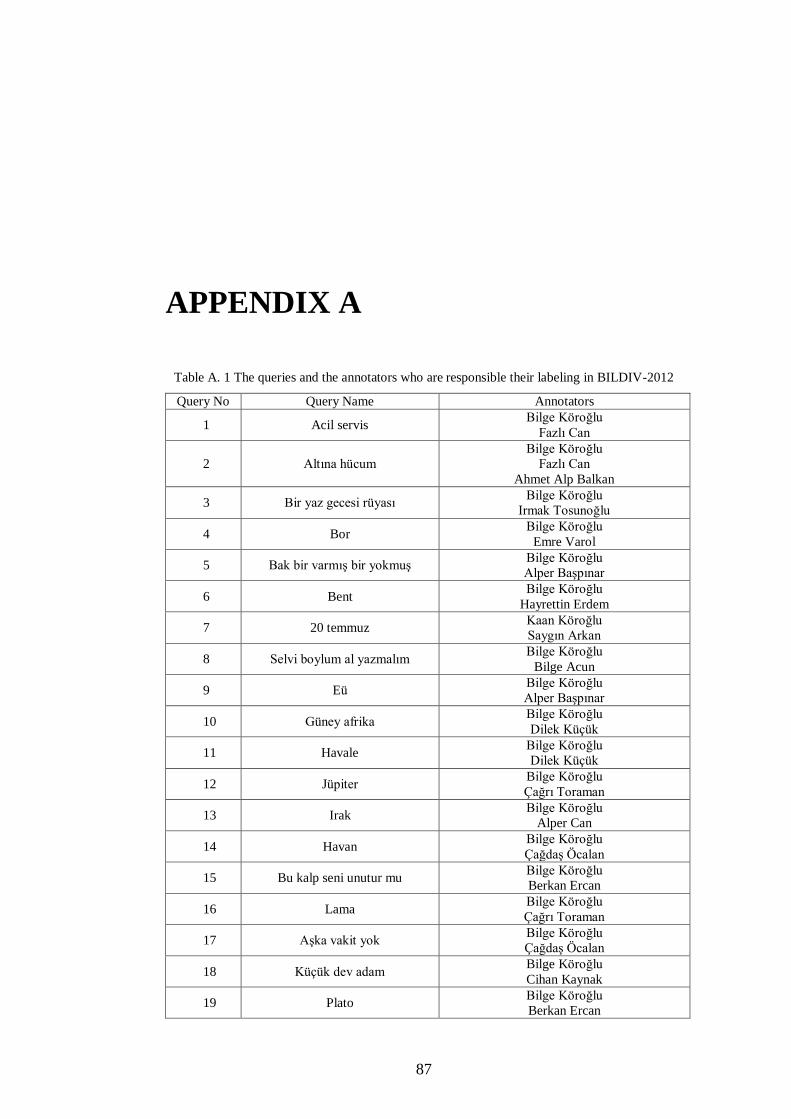
87
APPENDIX A
Table A. 1 The queries and the annotators who are responsible their labeling in BILDIV-2012
Query No Query Name Annotators
1 Acil servis Bilge Köroğlu
Fazlı Can
2 Altına hücum
Bilge Köroğlu
Fazlı Can
Ahmet Alp Balkan
3 Bir yaz gecesi rüyası Bilge Köroğlu
Irmak Tosunoğlu
4 Bor Bilge Köroğlu
Emre Varol
5 Bak bir varmış bir yokmuş Bilge Köroğlu
Alper Başpınar
6 Bent Bilge Köroğlu
Hayrettin Erdem
7 20 temmuz Kaan Köroğlu
Saygın Arkan
8 Selvi boylum al yazmalım Bilge Köroğlu
Bilge Acun
9 Eü Bilge Köroğlu
Alper Başpınar
10 Güney afrika Bilge Köroğlu
Dilek Küçük
11 Havale Bilge Köroğlu
Dilek Küçük
12 Jüpiter Bilge Köroğlu
Çağrı Toraman
13 Irak Bilge Köroğlu
Alper Can
14 Havan Bilge Köroğlu
Çağdaş Öcalan
15 Bu kalp seni unutur mu Bilge Köroğlu
Berkan Ercan
16 Lama Bilge Köroğlu
Çağrı Toraman
17 Aşka vakit yok Bilge Köroğlu
Çağdaş Öcalan
18 Küçük dev adam Bilge Köroğlu
Cihan Kaynak
19 Plato Bilge Köroğlu
Berkan Ercan
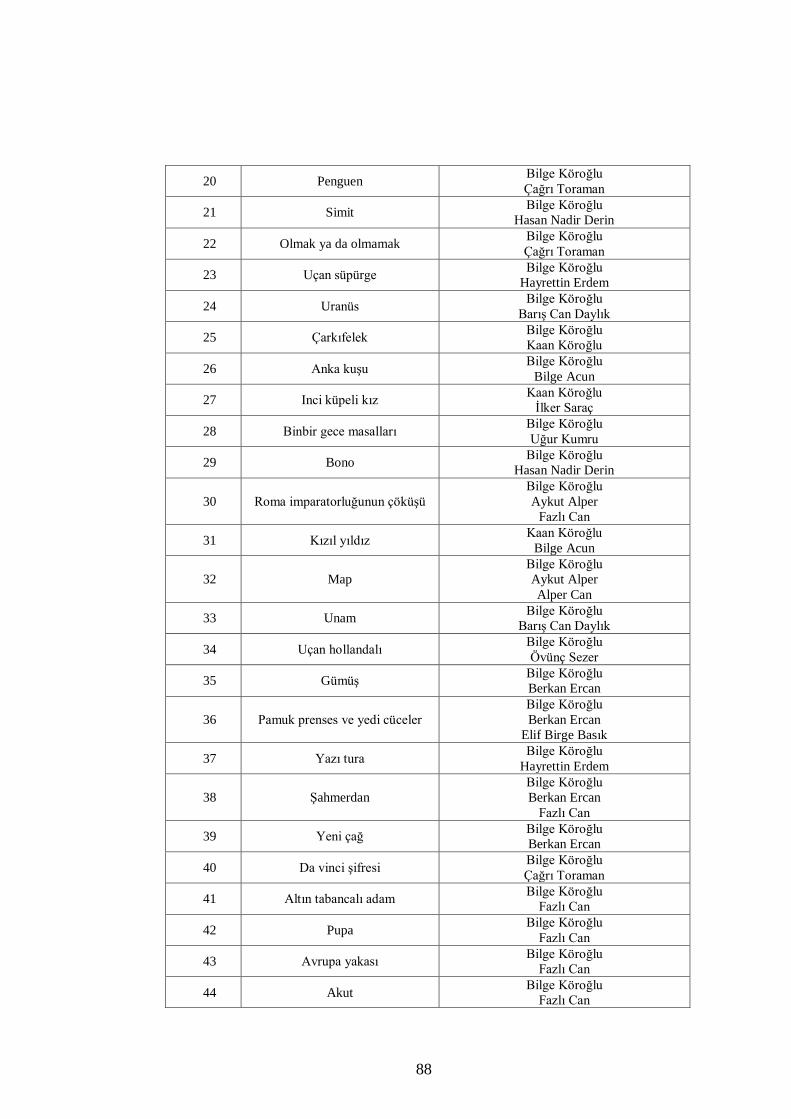
88
20 Penguen Bilge Köroğlu
Çağrı Toraman
21 Simit Bilge Köroğlu
Hasan Nadir Derin
22 Olmak ya da olmamak Bilge Köroğlu
Çağrı Toraman
23 Uçan süpürge Bilge Köroğlu
Hayrettin Erdem
24 Uranüs Bilge Köroğlu
Barış Can Daylık
25 Çarkıfelek Bilge Köroğlu
Kaan Köroğlu
26 Anka kuşu Bilge Köroğlu
Bilge Acun
27 Inci küpeli kız Kaan Köroğlu
İlker Saraç
28 Binbir gece masalları Bilge Köroğlu
Uğur Kumru
29 Bono Bilge Köroğlu
Hasan Nadir Derin
30 Roma imparatorluğunun çöküşü
Bilge Köroğlu
Aykut Alper
Fazlı Can
31 Kızıl yıldız Kaan Köroğlu
Bilge Acun
32 Map
Bilge Köroğlu
Aykut Alper
Alper Can
33 Unam Bilge Köroğlu
Barış Can Daylık
34 Uçan hollandalı Bilge Köroğlu
Övünç Sezer
35 Gümüş Bilge Köroğlu
Berkan Ercan
36 Pamuk prenses ve yedi cüceler
Bilge Köroğlu
Berkan Ercan
Elif Birge Basık
37 Yazı tura Bilge Köroğlu
Hayrettin Erdem
38 Şahmerdan
Bilge Köroğlu
Berkan Ercan
Fazlı Can
39 Yeni çağ Bilge Köroğlu
Berkan Ercan
40 Da vinci şifresi Bilge Köroğlu
Çağrı Toraman
41 Altın tabancalı adam Bilge Köroğlu
Fazlı Can
42 Pupa Bilge Köroğlu
Fazlı Can
43 Avrupa yakası Bilge Köroğlu
Fazlı Can
44 Akut Bilge Köroğlu
Fazlı Can
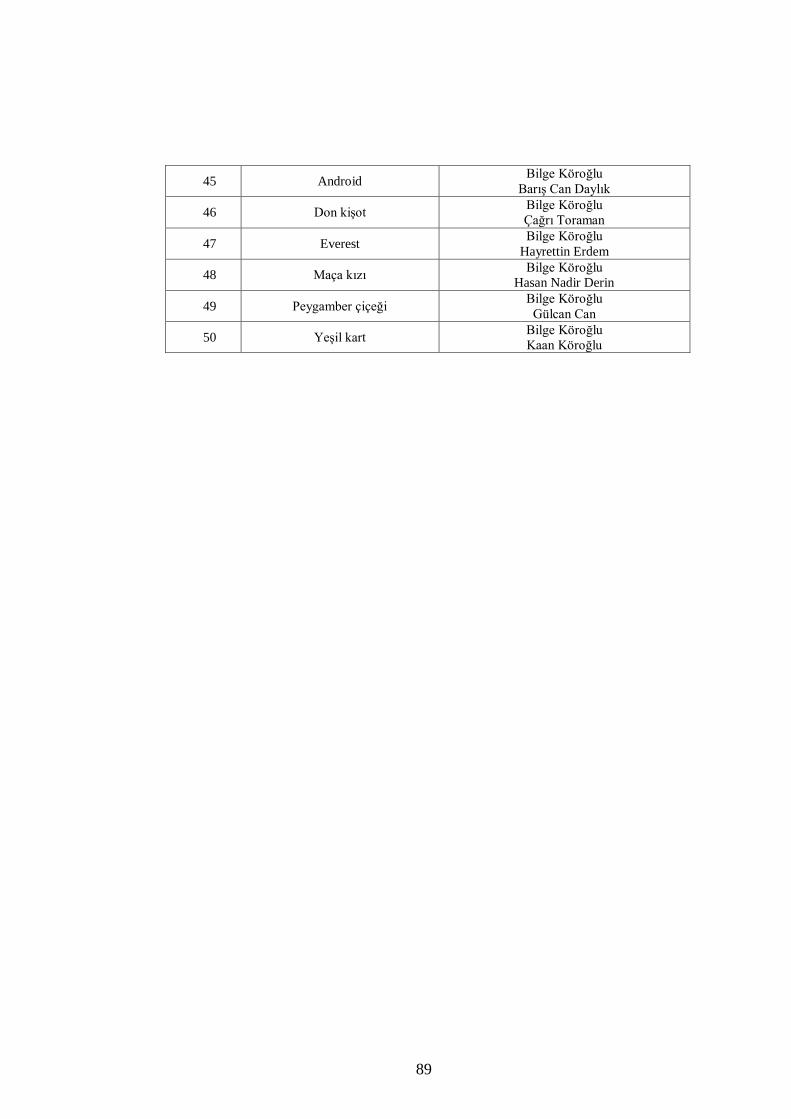
89
45 Android Bilge Köroğlu
Barış Can Daylık
46 Don kişot Bilge Köroğlu
Çağrı Toraman
47 Everest Bilge Köroğlu
Hayrettin Erdem
48 Maça kızı Bilge Köroğlu
Hasan Nadir Derin
49 Peygamber çiçeği Bilge Köroğlu
Gülcan Can
50 Yeşil kart Bilge Köroğlu
Kaan Köroğlu