Embed Size (px)
Citation preview
Exp.No. 2 Tensile Test
Introduction Universal Tensile Machine is one test using which one can determine various mechanical properties of a material like Young‟s Modulus, Toughness, resilience, ductility of a material, yield strength, ultimate tensile strength etc.,. Specimens used in this test are chosen as per the ASTM standards.
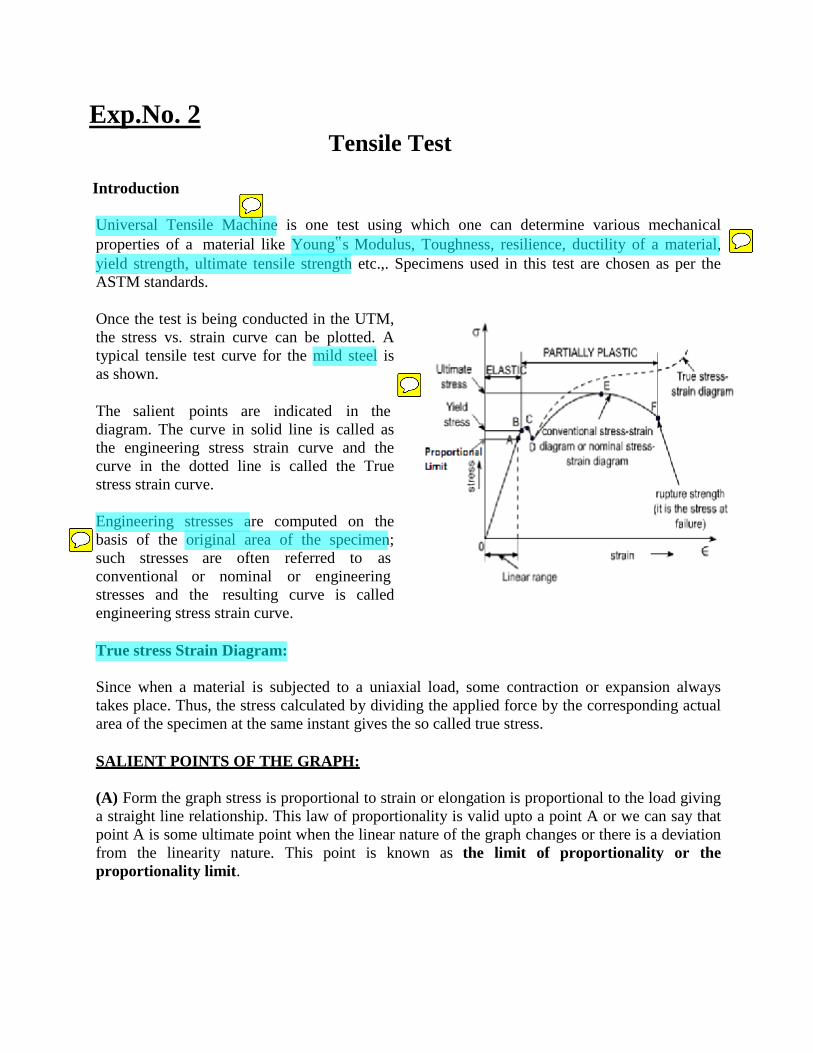
Once the test is being conducted in the UTM, the stress vs. strain curve can be plotted. A typical tensile test curve for the mild steel is as shown.
The salient points are indicated in the diagram. The curve in solid line is called as the engineering stress strain curve and the curve in the dotted line is called the True stress strain curve.
Engineering stresses are computed on the basis of the original area of the specimen; such stresses are often referred to as conventional or nominal or engineering stresses and the resulting curve is called engineering stress strain curve.
True stress Strain Diagram:
Since when a material is subjected to a uniaxial load, some contraction or expansion always takes place. Thus, the stress calculated by dividing the applied force by the corresponding actual area of the specimen at the same instant gives the so called true stress.
SALIENT POINTS OF THE GRAPH:
(A) Form the graph stress is proportional to strain or elongation is proportional to the load giving a straight line relationship. This law of proportionality is valid upto a point A or we can say that point A is some ultimate point when the linear nature of the graph changes or there is a deviation from the linearity nature. This point is known as the limit of proportionality or the proportionality limit.
1
(B) For a short period beyond the point A, the material may still be elastic in the sense that the deformations are completely recovered when the load is removed. The limiting point B is termed as Elastic Limit.
(C) and (D) - Beyond the elastic limit plastic deformation occurs and strains are not totally recoverable. There will be thus permanent deformation or permanent set when load is removed. These two points are termed as upper and lower yield points respectively. The stress at the yield point is called the yield strength.
(E) A further increase in the load will cause marked deformation in the whole volume of the metal. The maximum load which the specimen can with stand without failure is called the load at the ultimate strength. The highest point „E' of the diagram corresponds to the ultimate strength of a material.
(F) Beyond point E, the specimen begins to forms aneck. The load further falls from this maximum until fracture occurs at F.
Modulus of elasticity: The slope of the curve in the linear region will give the Young‟s modulus or modulus of elasticity.
Resilience and toughness: The area under the stress strain curve within the elastic region gives the resilience of the material and the area until the fracture point gives the toughness of the material.
The stress strain curve for a rigid material is a line along the x axis passing through the origin. For a perfectly elastic material, the stress strain curve shall be a straight line inclined to x axis with small deviation about the strain axis.
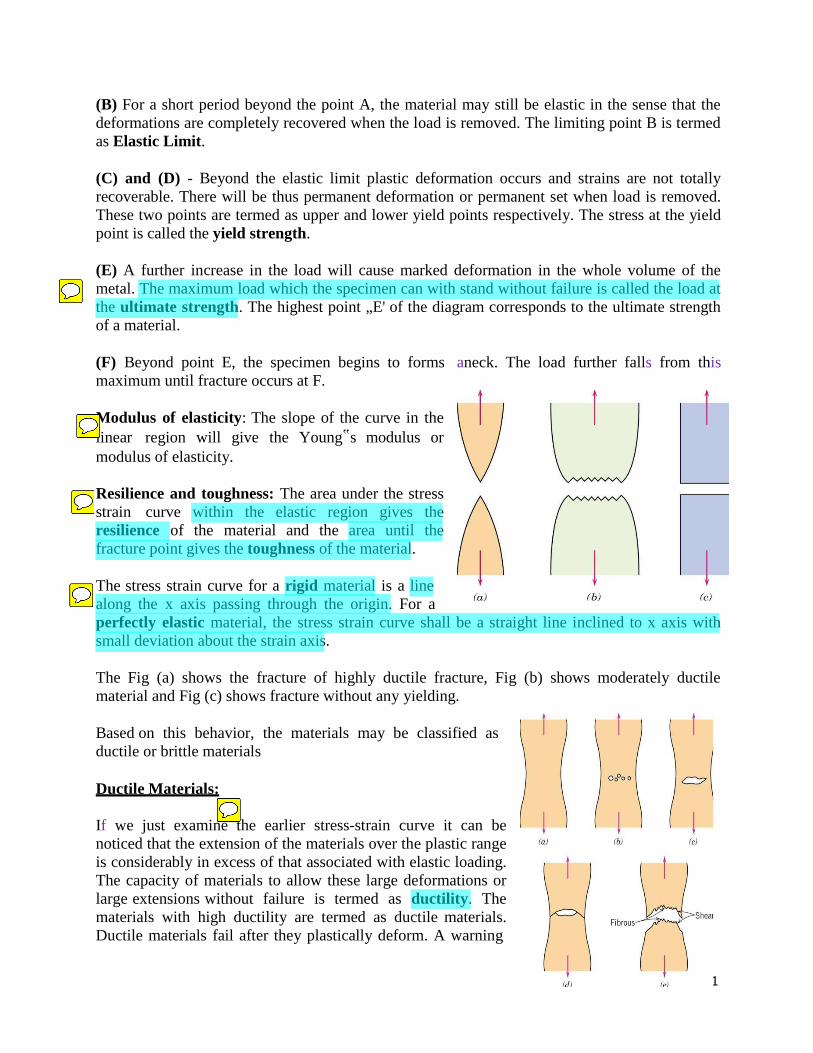
The Fig (a) shows the fracture of highly ductile fracture, Fig (b) shows moderately ductile material and Fig (c) shows fracture without any yielding.
Based on this behavior, the materials may be classified as ductile or brittle materials
Ductile Materials:
If we just examine the earlier stress-strain curve it can be noticed that the extension of the materials over the plastic range is considerably in excess of that associated with elastic loading. The capacity of materials to allow these large deformations or large extensions without failure is termed as ductility. The materials with high ductility are termed as ductile materials. Ductile materials fail after they plastically deform. A warning
or indication (formation of neck before the material fails) is the characteristic property of a ductile material. The same is illustrated in the figures from Fig (a) through Fig (e) is displayed.
Once the specimen breaks, a cup and conefracture of the specimen is form as displayed.
Brittle Materials:
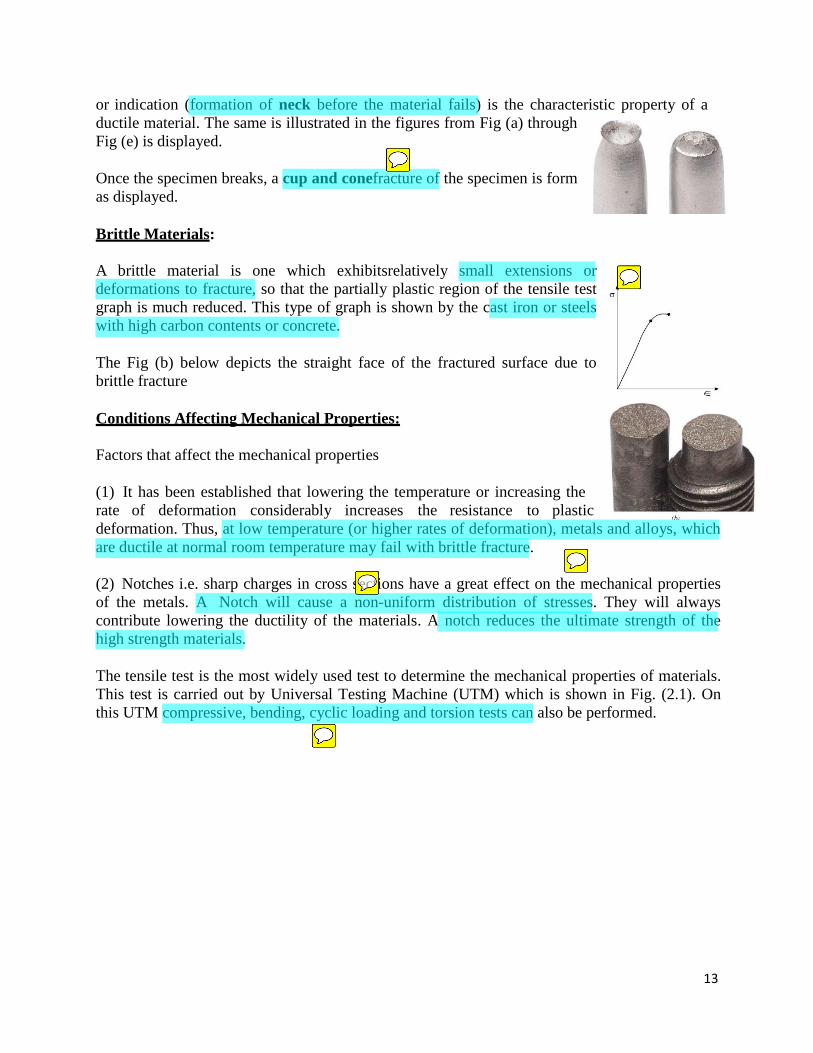
A brittle material is one which exhibitsrelatively small extensions or deformations to fracture, so that the partially plastic region of the tensile test graph is much reduced. This type of graph is shown by the cast iron or steels with high carbon contents or concrete.
The Fig (b) below depicts the straight face of the fractured surface due to brittle fracture
Conditions Affecting Mechanical Properties:
Factors that affect the mechanical properties
(1) It has been established that lowering the temperature or increasing the rate of deformation considerably increases the resistance to plastic deformation. Thus, at low temperature (or higher rates of deformation), metals and alloys, which are ductile at normal room temperature may fail with brittle fracture.
(2) Notches i.e. sharp charges in cross sections have a great effect on the mechanical properties of the metals. A Notch will cause a non-uniform distribution of stresses. They will always contribute lowering the ductility of the materials. A notch reduces the ultimate strength of the high strength materials.
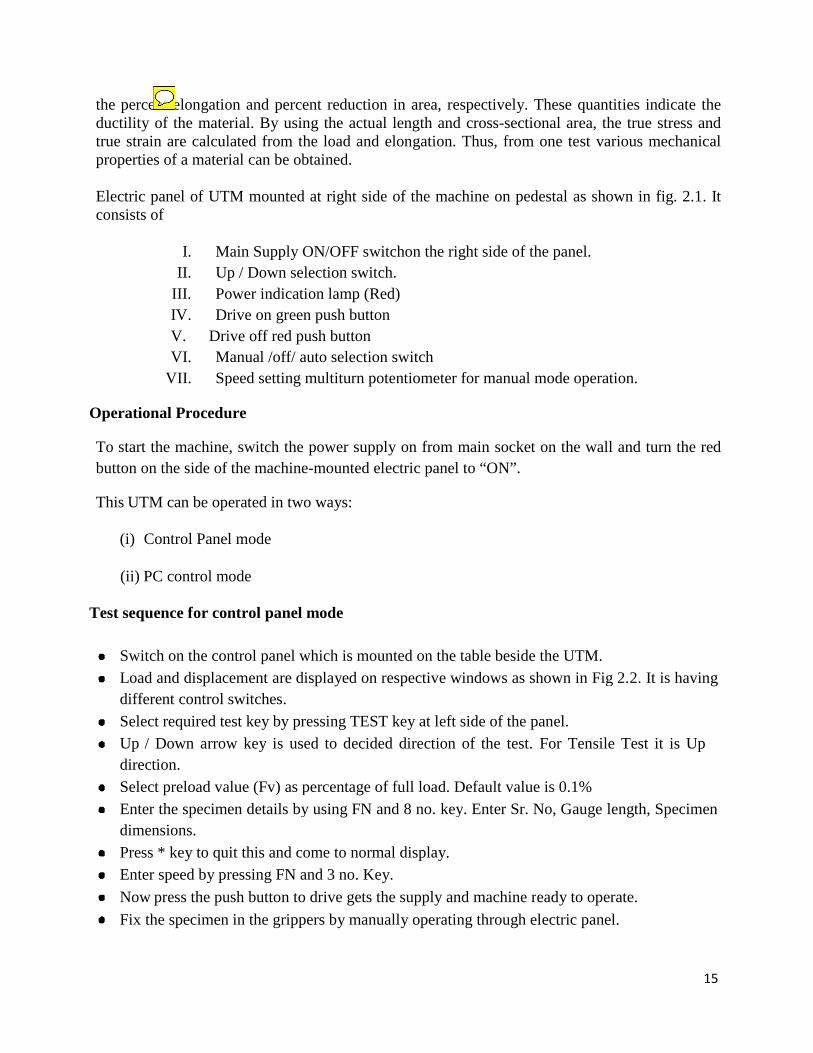
The tensile test is the most widely used test to determine the mechanical properties of materials. This test is carried out by Universal Testing Machine (UTM) which is shown in Fig. (2.1). On this UTM compressive, bending, cyclic loading and torsion tests can also be performed.
13
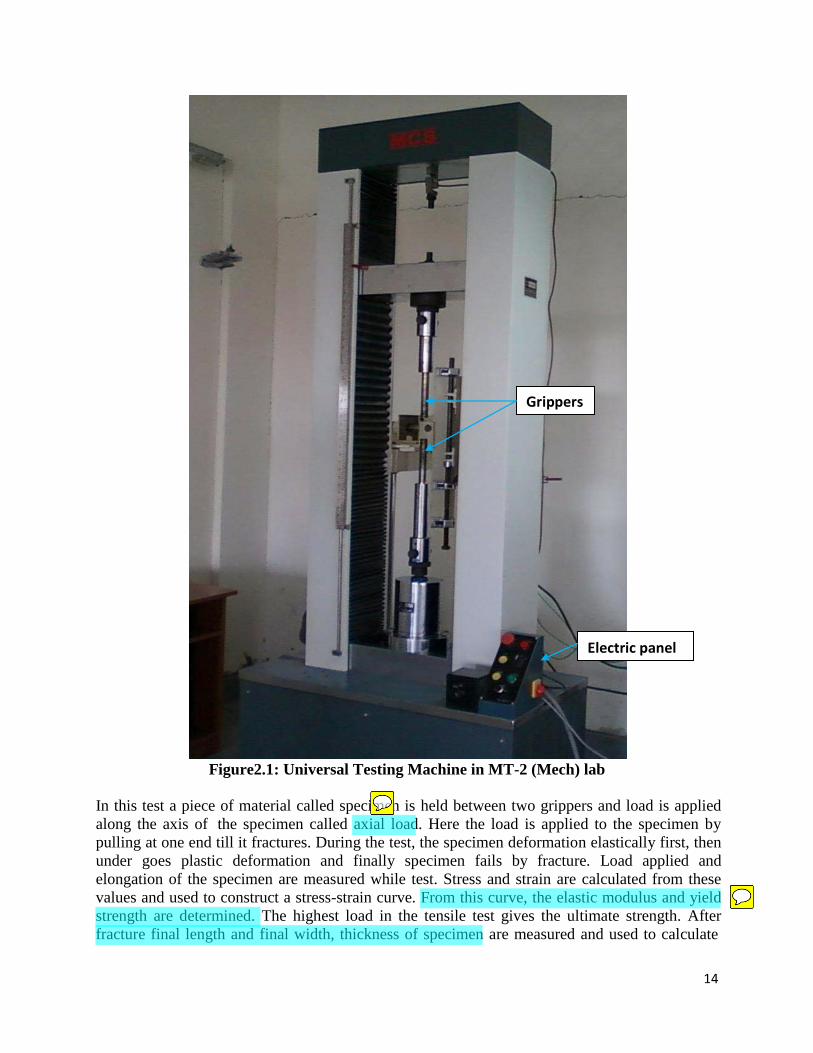
Grippers
Electric panel
Figure2.1: Universal Testing Machine in MT-2 (Mech) lab In this test a piece of material called specimen is held between two grippers and load is applied along the axis of the specimen called axial load. Here the load is applied to the specimen by pulling at one end till it fractures. During the test, the specimen deformation elastically first, then under goes plastic deformation and finally specimen fails by fracture. Load applied and elongation of the specimen are measured while test. Stress and strain are calculated from these values and used to construct a stress-strain curve. From this curve, the elastic modulus and yield strength are determined. The highest load in the tensile test gives the ultimate strength. After fracture final length and final width, thickness of specimen are measured and used to calculate
14
the perceductility true straipropertie
Electric pconsists o
Operation To start tbutton on
This UTM
(i) C
(ii) P Test sequ
SwitcLoaddifferSelecUp / directSelecEnterdimenPressEnterNow Fix th
ent elongatioof the mate
in are calcules of a mater
panel of UTof
I. MII. Up
III. PoIV. DrV. DriVI. M
VII. Sp
nal Procedu
the machinen the side of
M can be op
Control Panel
C control m
uence for con
ch on the cond and displacrent control ct required teDown arrowtion.
ct preload var the specimensions.
s * key to qur speed by prpress the pu
he specimen
on and perceerial. By usinlated from thial can be ob
TM mounted
Main Supply Op / Down selower indicatirive on greenive off red pu
Manual /off/ apeed setting
ure
e, switch the f the machine
erated in two
l mode
mode
ntrol panel
ntrol panel wcement are dswitches. est key by prw key is us
alue (Fv) as pen details by
uit this and coressing FN a
ush button ton in the gripp
ent reductionng the actuahe load andbtained.
d at right sid
ON/OFF swlection switcion lamp (Rn push buttoush button
auto selectionmultiturn po
power suppe-mounted e
o ways:
mode
which is mouisplayed on
ressing TESTed to decide
percentage oy using FN a
ome to normand 3 no. Keo drive gets tpers by manu
n in area, real length and
elongation.
de of the mac
witchon the rich. ed)
on
n switch otentiometer
ply on fromlectric panel
unted on therespective w
T key at left ed direction
of full load. Dand 8 no. key
mal display. ey. the supply anually operati
espectively.d cross-secti Thus, from
chine on ped
ight side of t
r for manual
main socketl to “ON”.
table besidewindows as s
side of the pof the test.
Default valuy. Enter Sr.
nd machine rng through e
These quanional area, th
m one test va
destal as sho
the panel.
mode opera
t on the wal
e the UTM. shown in Fig
panel. For Tensil
ue is 0.1% No, Gauge l
ready to opeelectric pane
tities indicahe true stresarious mecha
own in fig. 2
ation.
l and turn th
g 2.2. It is ha
e Test it is
length, Spec
erate. el.
te the ss and anical
2.1. It
he red
aving
Up
cimen
15
Afterfor th
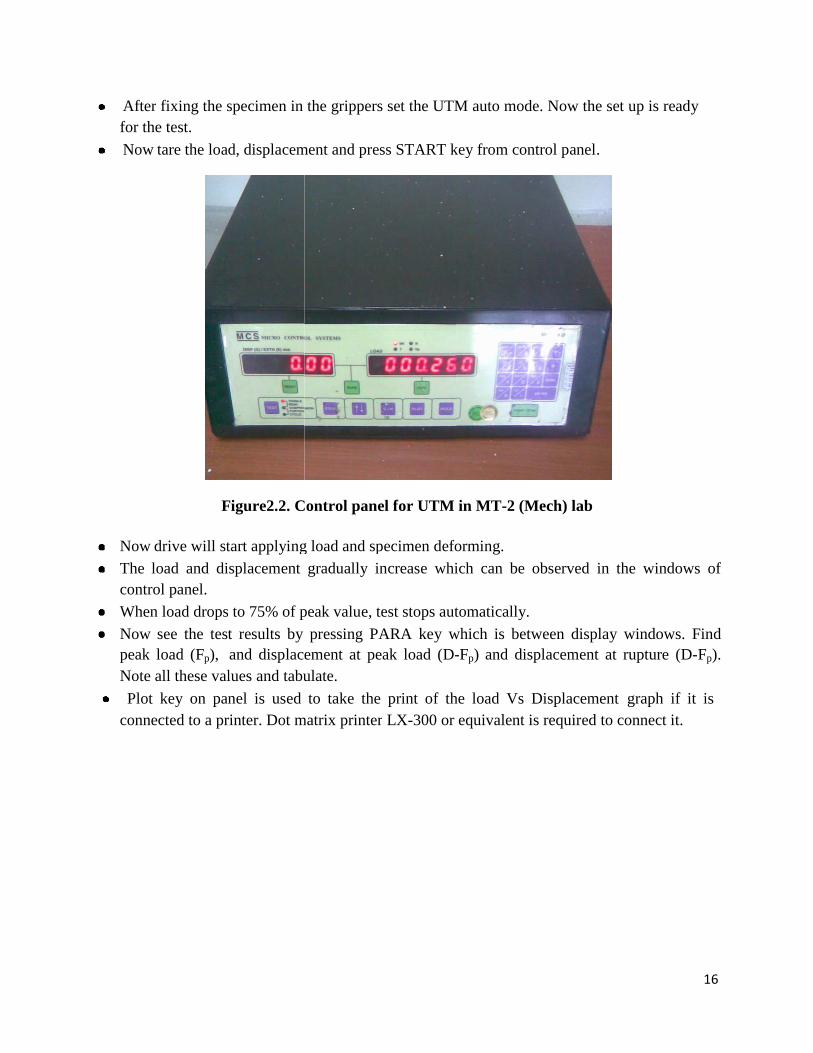
Now
Now The lcontrWhenNow peak Note Plotconne
r fixing the she test.
w tare the loa
F
drive will stload and di
rol panel. n load dropssee the testload (Fp), all these val
t key on panected to a pr
specimen in
d, displacem
Figure2.2. C
tart applyingsplacement
to 75% of pt results by and displaclues and tabunel is used rinter. Dot m
the grippers
ment and pres
Control pane
g load and spgradually in
peak value, tpressing PA
ement at peulate. to take the
matrix printer
s set the UTM
ss START k
el for UTM
pecimen defoncrease whi
test stops autARA key weak load (D-
e print of thr LX-300 or
M auto mod
key from con
in MT-2 (M
orming. ich can be
tomatically.which is betw-Fp) and dis
he load Vs Dequivalent i
e. Now the s
ntrol panel.
Mech) lab
observed in
ween displasplacement a
Displacemenis required to
set up is read
n the window
ay windows.at rupture (D
nt graph ifo connect it.
dy
ws of
Find D-Fp).
it is
16
SwitcFor thgreen
Brin(or un
The ensur
Swit
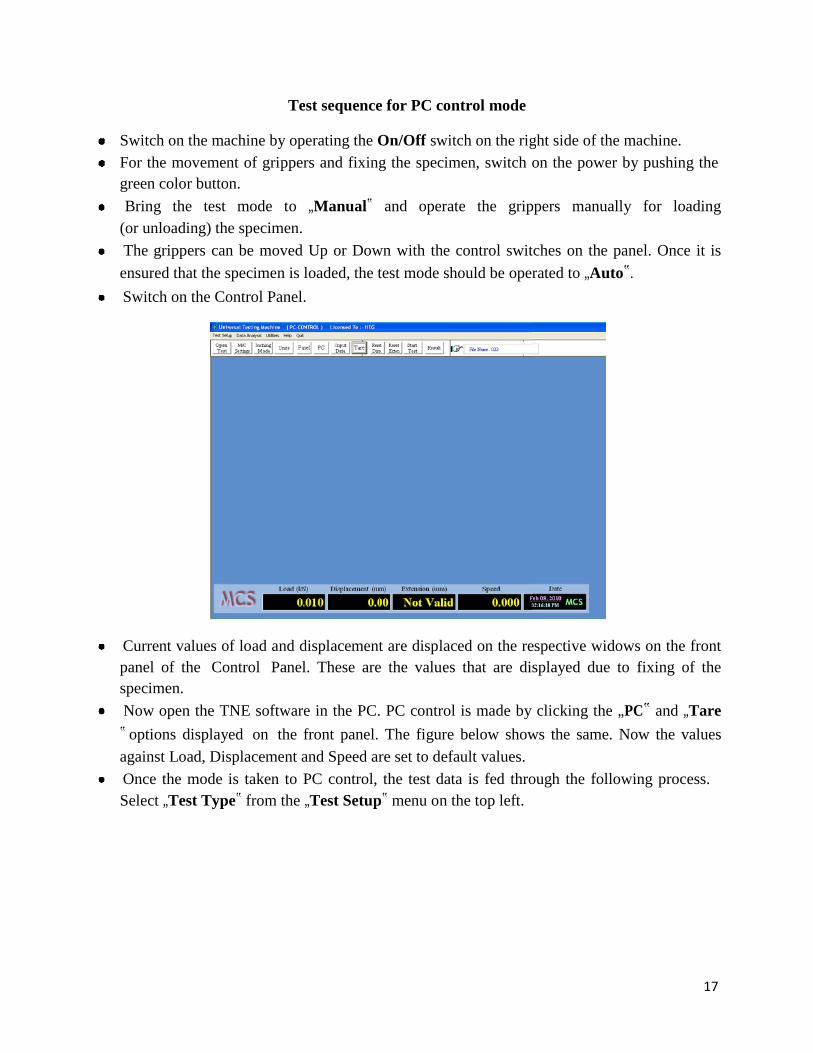
Currpanelspeci
Now‟ optiagain
OnceSelec
ch on the mahe movemen
n color buttong the test nloading) thgrippers can
red that the stch on the Co
ent values ol of the Comen.
w open the Tions displaynst Load, Dise the mode ct „Test Typ
Te
achine by opnt of gripper
on. mode to e specimen. n be moved specimen is lontrol Panel.
of load and dontrol Panel
TNE softwareyed on the fsplacement ais taken to Pe‟ from the
est sequence
perating the Ors and fixing
„Manual‟
Up or Dowloaded, the t.
displacementl. These are
e in the PC.front panel.and Speed arPC control,„Test Setup
e for PC con
On/Off switg the specim
and operat
wn with the ctest mode sh
t are displace the values
PC controlThe figure
re set to defathe test data
p‟ menu on th
ntrol mode
tch on the rigmen, switch o
te the grip
control swithould be oper
ced on the rethat are di
is made bybelow show
ault values.a is fed throhe top left.
ght side of thon the powe
ppers manua
tches on the rated to „Au
espective widsplayed due
clicking thews the same
ough the fol
he machine.er by pushin
ally for lo
panel. Onceuto‟.
dows on thee to fixing o
e „PC‟ and „e. Now the v
lowing proc
ng the
oading
e it is
e front of the
„Tarevalues
cess.
17
AmC
T
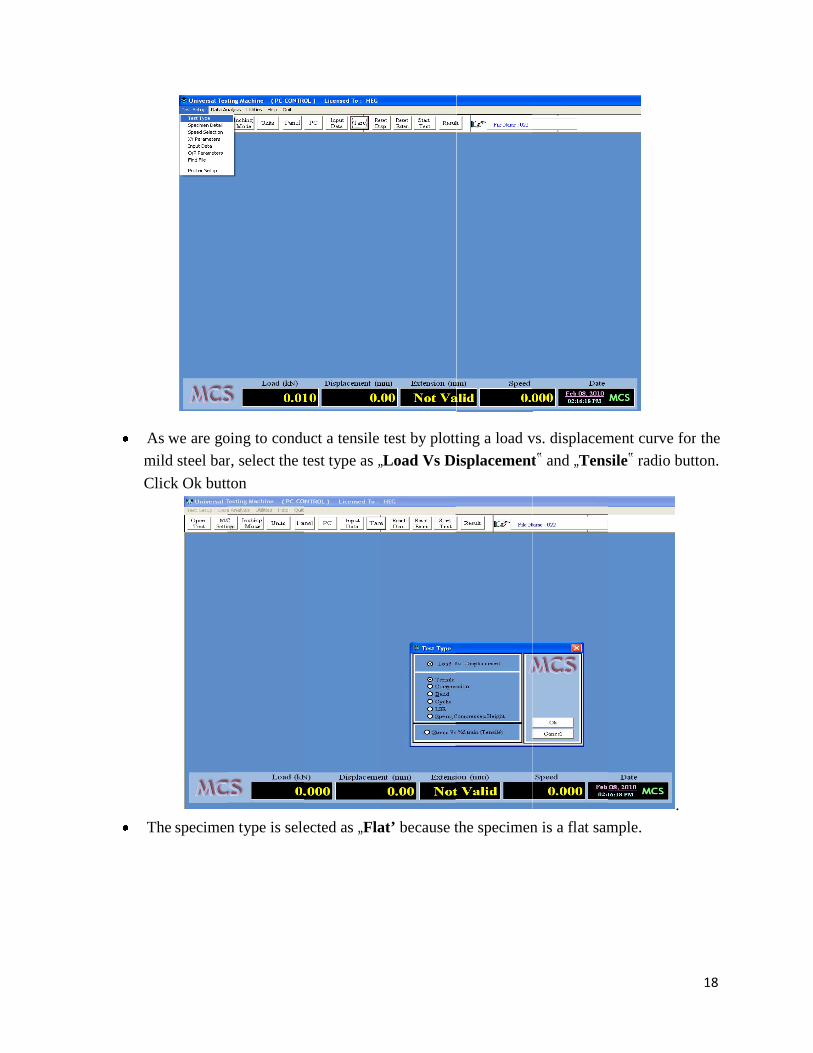
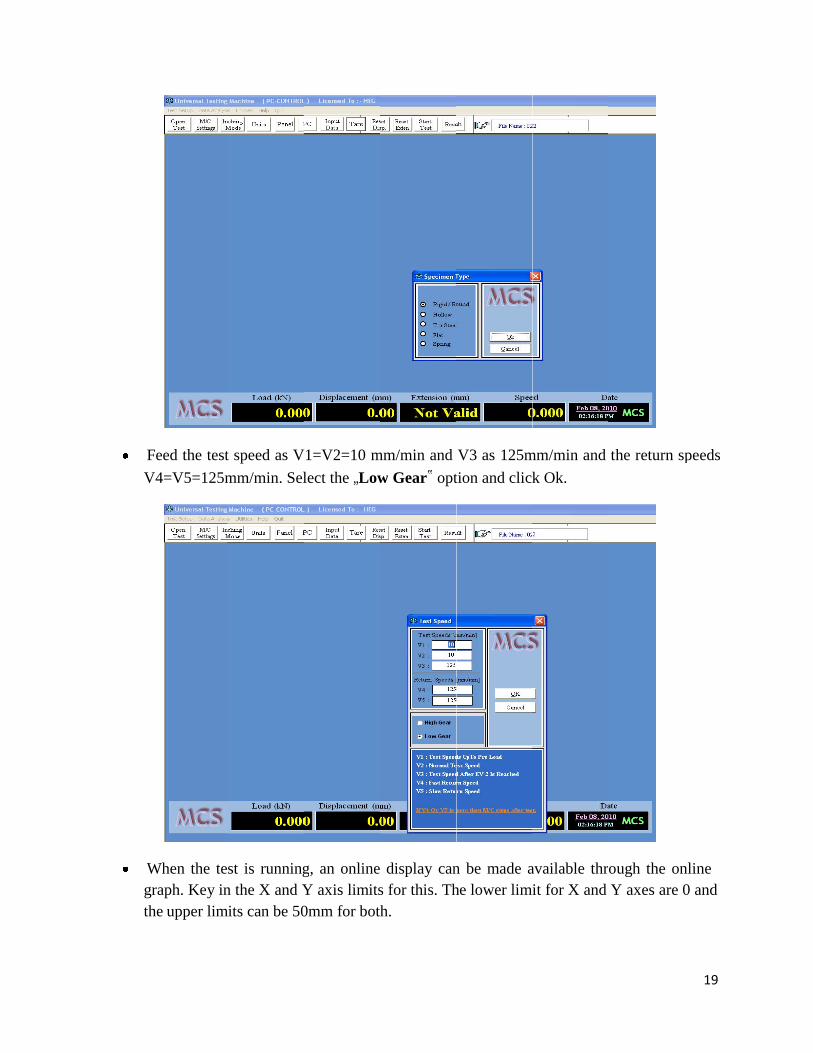
As we are gomild steel barClick Ok butt
The specimen
oing to condur, select the tton
n type is sele
uct a tensiletest type as „
ected as „Fla
test by plott„Load Vs Di
at’ because t
ting a load visplacement
the specimen
vs. displacemt‟ and „Tens
n is a flat sam
ment curve fosile‟ radio bu
.mple.
for the utton.
18
FV
Wgrth
Feed the testV4=V5=125m
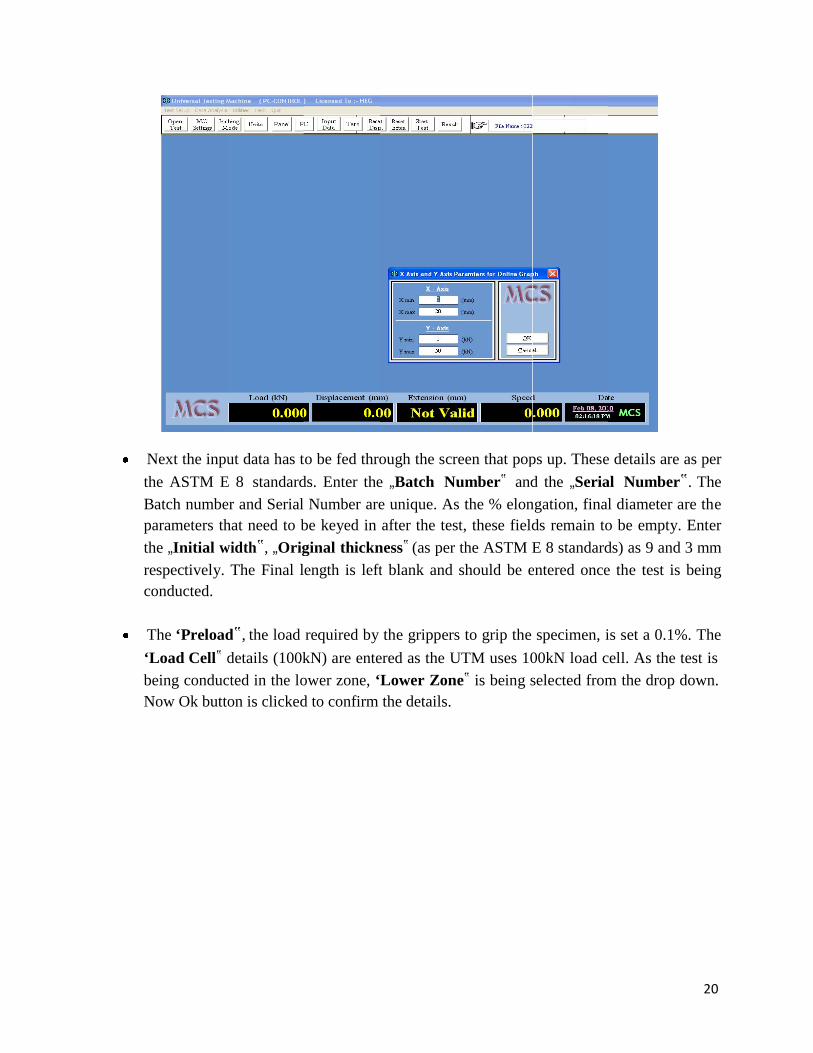
When the teraph. Key inhe upper lim
t speed as Vmm/min. Sel
st is runningn the X and Yits can be 50
1=V2=10 mlect the „Low
g, an onlineY axis limits0mm for both
mm/min andw Gear‟ opt
display cans for this. Thh.
V3 as 125mtion and click
n be made ahe lower lim
mm/min and k Ok.
available thrit for X and
the return sp
rough the onY axes are 0
peeds
nline 0 and
19
NthBpthreco
T‘LbN
Next the inpuhe ASTM E
Batch numbearameters thhe „Initial wespectively. onducted.
The ‘PreloadLoad Cell‟ deing conduc
Now Ok butto
ut data has tE 8 standarder and Serial hat need to b
width‟, „OrigThe Final l
d‟, the load details (100kcted in the loon is clicked
o be fed throds. Enter the
Number arebe keyed inginal thicknength is left
required bykN) are enteower zone, ‘d to confirm
ough the scre „Batch Nue unique. Asafter the tes
ness‟ (as pert blank and
the grippersered as the ULower Zonthe details.
reen that popumber‟ ands the % elonst, these fieldthe ASTM Eshould be e
s to grip theUTM uses 10e‟ is being s
ps up. Thesed the „Seria
ngation, finalds remain toE 8 standardentered once
specimen, i00kN load cselected from
e details are aal Number‟l diameter aro be empty.ds) as 9 ande the test is
is set a 0.1%cell. As the tm the drop d
as per ‟. The re the Enter 3 mm being
%. The test is down.
20
Tdar, „ML„Fby
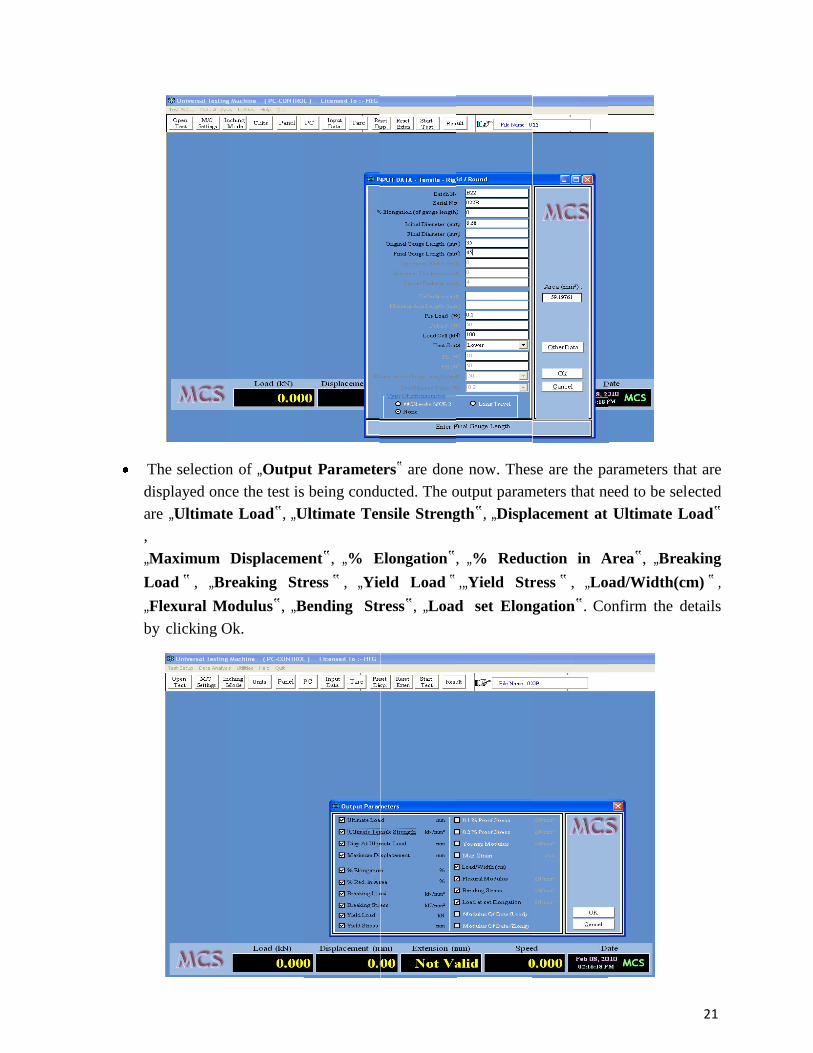
The selectionisplayed oncre „Ultimate
Maximum Load ‟ , „BrFlexural My clicking O
n of „Outpuce the test ise Load‟, „U
Displacemereaking Strodulus‟, „B
Ok.
ut Paramete being condu
Ultimate Ten
ent‟, „% Eress ‟ , „Yie
Bending Str
ers‟ are donucted. The onsile Streng
Elongation‟eld Load ‟
ress‟, „Load
e now. Thesoutput paramgth‟, „Displ
, „% Redu,„Yield Str
d set Elon
se are the pameters that ne
acement at
uction in Aress ‟ , „Logation‟. Co
arameters theed to be selUltimate L
Area‟, „Breaad/Width(c
onfirm the d
hat are lected
Load‟
aking cm) ‟ , details
21
Odcub
Tap
%ru
W
%ar
Wsp
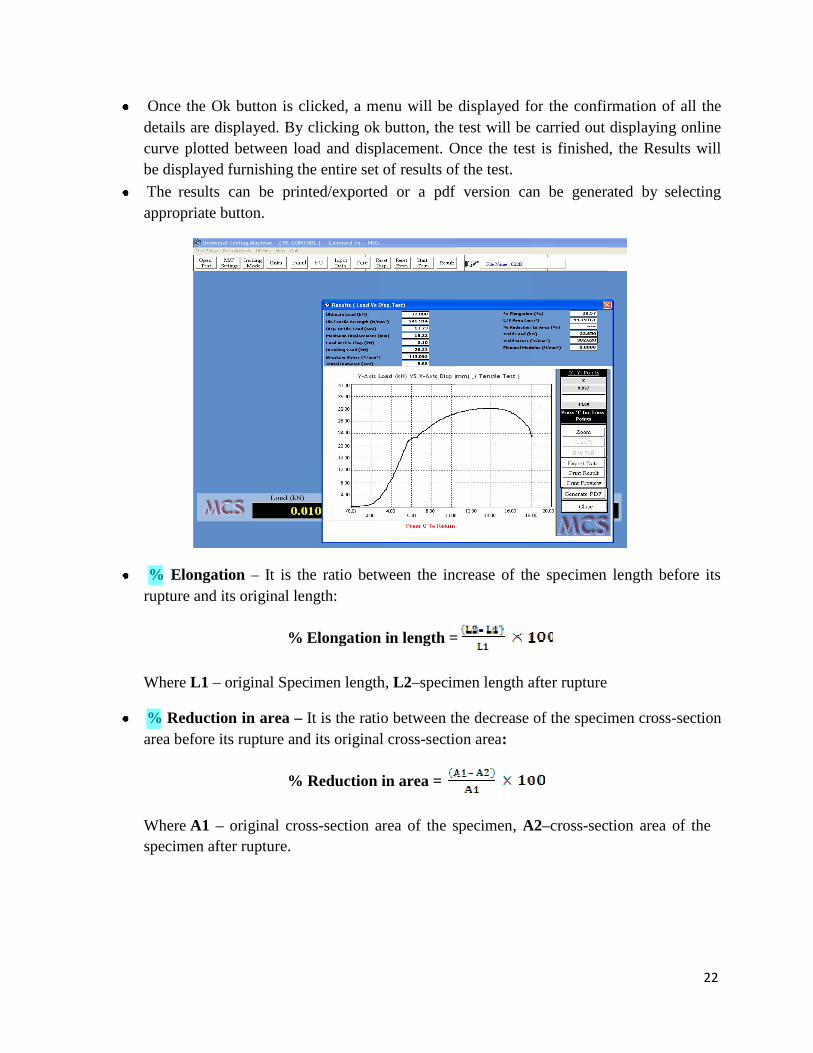
Once the Oketails are disurve plottede displayed
The results ppropriate b
% Elongatiupture and it
Where L1 – o
% Reductiorea before it
Where A1 – pecimen afte
k button is csplayed. By
d between lofurnishing thcan be prinutton.
on – It is thts original le
%
original Spec
n in area – s rupture and
%
original croer rupture.
clicked, a meclicking ok
oad and disphe entire set nted/exporte
he ratio betwength:
Elongation
cimen length
It is the ratid its original
Reduction
oss-section a
enu will bebutton, the
placement. Oof results ofd or a pdf
ween the inc
n in length =
h, L2–specim
o between thl cross-sectio
in area =
area of the s
displayed fotest will be
Once the testf the test.
f version ca
crease of th
=
men length a
he decreaseon area:
specimen, A
or the confircarried out
t is finished
an be genera
he specimen
after rupture
of the specim
A2–cross-sec
rmation of adisplaying o
d, the Result
ated by sele
length befo
men cross-se
tion area of
all the online s will
ecting
ore its
ection
f the
22
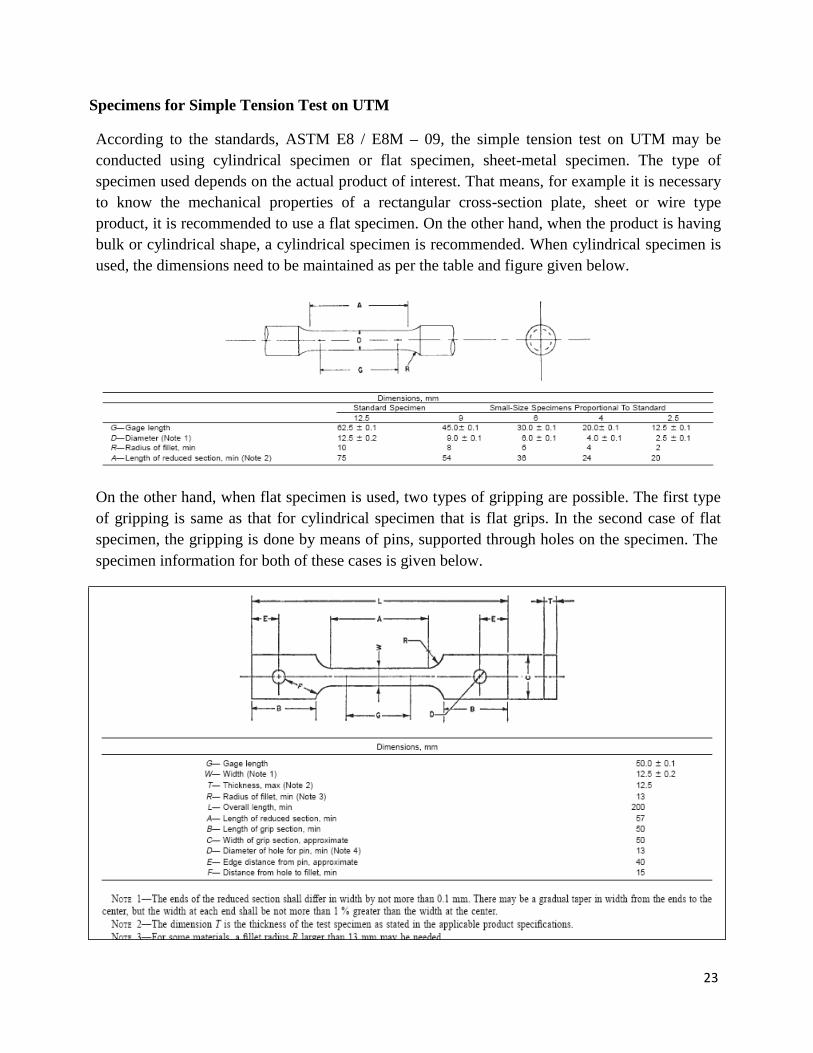
Specimens for Simple Tension Test on UTM According to the standards, ASTM E8 / E8M – 09, the simple tension test on UTM may be conducted using cylindrical specimen or flat specimen, sheet-metal specimen. The type of specimen used depends on the actual product of interest. That means, for example it is necessary to know the mechanical properties of a rectangular cross-section plate, sheet or wire type product, it is recommended to use a flat specimen. On the other hand, when the product is having bulk or cylindrical shape, a cylindrical specimen is recommended. When cylindrical specimen is used, the dimensions need to be maintained as per the table and figure given below.
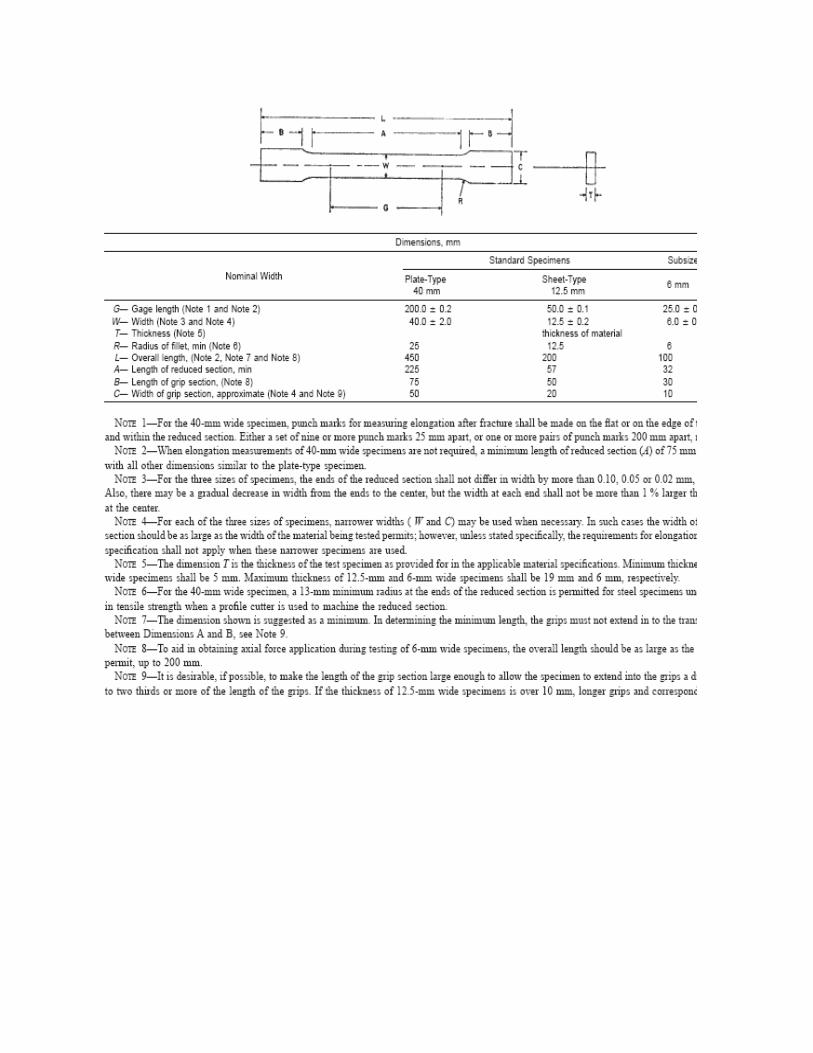
On the other hand, when flat specimen is used, two types of gripping are possible. The first type of gripping is same as that for cylindrical specimen that is flat grips. In the second case of flat specimen, the gripping is done by means of pins, supported through holes on the specimen. The specimen information for both of these cases is given below.
23
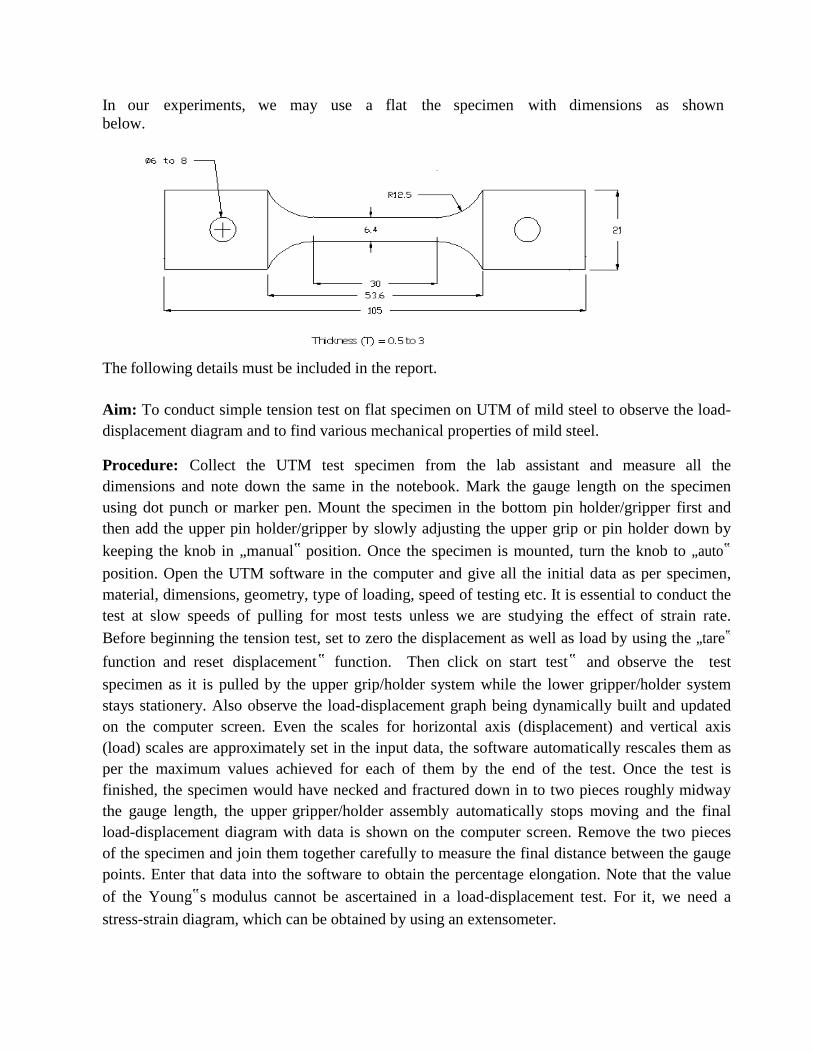
In our experiments, we may use a flat the specimen with dimensions as shown below.
The following details must be included in the report. Aim: To conduct simple tension test on flat specimen on UTM of mild steel to observe the load- displacement diagram and to find various mechanical properties of mild steel.
Procedure: Collect the UTM test specimen from the lab assistant and measure all the dimensions and note down the same in the notebook. Mark the gauge length on the specimen using dot punch or marker pen. Mount the specimen in the bottom pin holder/gripper first and then add the upper pin holder/gripper by slowly adjusting the upper grip or pin holder down by keeping the knob in „manual‟ position. Once the specimen is mounted, turn the knob to „auto‟ position. Open the UTM software in the computer and give all the initial data as per specimen, material, dimensions, geometry, type of loading, speed of testing etc. It is essential to conduct the test at slow speeds of pulling for most tests unless we are studying the effect of strain rate. Before beginning the tension test, set to zero the displacement as well as load by using the „tare‟ function and reset displacement‟ function. Then click on start test‟ and observe the test specimen as it is pulled by the upper grip/holder system while the lower gripper/holder system stays stationery. Also observe the load-displacement graph being dynamically built and updated on the computer screen. Even the scales for horizontal axis (displacement) and vertical axis (load) scales are approximately set in the input data, the software automatically rescales them as per the maximum values achieved for each of them by the end of the test. Once the test is finished, the specimen would have necked and fractured down in to two pieces roughly midway the gauge length, the upper gripper/holder assembly automatically stops moving and the final load-displacement diagram with data is shown on the computer screen. Remove the two pieces of the specimen and join them together carefully to measure the final distance between the gauge points. Enter that data into the software to obtain the percentage elongation. Note that the value of the Young‟s modulus cannot be ascertained in a load-displacement test. For it, we need a stress-strain diagram, which can be obtained by using an extensometer.

Table of Readings: Transfer data values and values of the various mechanical properties (yield strength, ultimate tensile strength, percentage elongation, fracture strength etc.) in a tabular form and sketch the load-displacement diagram, showing the various mechanical property points.
Figure: <Draw a neat sketch of the specimen with all dimensions, nature of fracture and load- displacement diagram on the other side of the page>
Conclusions: <to be furnished by the student in the report>