Embed Size (px)
Citation preview
HAL Id: hal-00874106https://hal.archives-ouvertes.fr/hal-00874106
Submitted on 5 Dec 2013
HAL is a multi-disciplinary open accessarchive for the deposit and dissemination of sci-entific research documents, whether they are pub-lished or not. The documents may come fromteaching and research institutions in France orabroad, or from public or private research centers.
L’archive ouverte pluridisciplinaire HAL, estdestinée au dépôt et à la diffusion de documentsscientifiques de niveau recherche, publiés ou non,émanant des établissements d’enseignement et derecherche français ou étrangers, des laboratoirespublics ou privés.
Expression of HLA-G by mast cells is associated withhepatitis C virus-induced liver fibrosis.
Laurence Amiot, Nicolas Vu, Michel Rauch, Annie l’ Helgoualc’H, FrédéricChalmel, Hugues Gascan, Bruno Turlin, Dominique Guyader, Michel Samson
To cite this version:Laurence Amiot, Nicolas Vu, Michel Rauch, Annie l’ Helgoualc’H, Frédéric Chalmel, et al.. Expres-sion of HLA-G by mast cells is associated with hepatitis C virus-induced liver fibrosis.. Journal ofHepatology, Elsevier, 2013, 60 (2), pp.245-252. �10.1016/j.jhep.2013.09.006�. �hal-00874106�
Expression of HLA-G by mast cells is associated with hepatitis C virus-induced liver
fibrosis
Laurence Amiot1, 2,3,4, Nicolas Vu1, 2,3, Michel Rauch1, 2,3, Annie L' Helgoualc'h1, 2,3, Frédéric Chalmel1, 2,3, Hugues Gascan5, Bruno Turlin2,6, Dominique Guyader2,7, Michel Samson1, 2,3
Short title: Overexpression of HLA-G in HCV-induced liver fibrosis
1 Institut National de la Santé et de la Recherche Médicale (Inserm), U.1085, Institut de Recherche Santé Environnement & Travail (IRSET), F-35043 Rennes, France.
2 Université de Rennes 1, F-35043 Rennes, France.
3 Fédération de Recherche BioSit de Rennes UMS 3480-, F-35043 Rennes, France.
4 Department of Biology, University Hospital Pontchaillou, CHU Pontchaillou, Rennes, France. 5 CNRS, UMR 6290, Institute of Genetics and Development of Rennes, Rennes, France. 6 Department of Pathology, University Hospital Pontchaillou, CHU Pontchaillou, Rennes, France 7 Department of Hepatology, University Hospital Pontchaillou, CHU Pontchaillou, Rennes, France.
Keys words: hepatitis C, HCV, liver, fibrosis, HLA-G, mast cell, IFN-
Corresponding author: Laurence Amiot Address : University of Rennes 1, 2 Avenue du Pr. Leon Bernard CS 34317, 35043 RENNES CEDEX, FRANCE Tel : (+33) 299 289 141 Fax: (+33) 223 234 794 d. [email protected] e. Electronic word count: 6360 words f. 4 Figures, 2 tables, 4 supplementary data g. List of abbreviations in the order of appearance: HCV: hepatitis C virus, TGF- transforming growth
factor IL: interleukin, ILT Immunoglobulin-like transcript receptors, HIV: human immunodeficiency virus,
HCMV: human cytomegalovirus, HBV: hepatitis B virus, IFN: interferon, OSM: oncostatin, MC: mast cell,
HSC: hepatic stellate cell, SCF: stem cell factor, HCC: hepatocellular carcinoma
h. No conflict of interest i. Financial support: ANRS 2010, Ligue Nationale Contre le Cancer (Comité d’Ille et Vilaine) 2009, IFR 140 2010, Biosit 2012
1
Abstract:
Background and aims:
Infection by hepatitis C virus is a worldwide health problem. An inadequate Th2 cytokine
response promotes the fibrosis-cirrhosis fate. Immune-modulating molecules favoring a Th2
profile, such as HLA-G molecules of the HLA class Ib family, may play a role in chronic
hepatitis. HLA-G contributes to the escape of tumors, and their involvement in viral infections
has been increasingly described. The aim of this work was to study the expression of HLA-G
in the liver, its cellular source and its regulation in cases of chronic C hepatitis.
Methods: HLA-G cells in blocks of liver derived from patients infected with HCV were
labeled by immunohistochemistry and enumerated. Double immunofluorescence allowed the
identification of the cellular source. HLA-G secretion by a human mast cell line was
quantified by ELISA after various stimulations. After treatment with IFN- real-time PCR
was performed to determine the kinetics of cytokine expression profiles, followed by heat
map clustering analysis.
Results: The number of HLA-G + cells was significantly associated with the area of fibrosis.
For the first time, we identify the HLA-G+ cells as being mast cells. HLA-G secretion was
significantly induced in human mast cells stimulated by IL-10 or interferons of class I. The
transcriptome of the secretome of this cell line stimulated by IFN- revealed that i) the HLA-
G gene is upregulated late, ii) T lymphocytes and NK cells are recruited.
Conclusions: These findings suggest an autocrine loop in the genesis of HCV liver fibrosis,
based on mast cells expressing HLA-G.
2
Introduction
Hepatitis C virus (HCV) infections are a worldwide public health problem. Infected patients
may develop complications including cirrhosis, liver failure or hepatocellular carcinoma. The
dynamics of fibrosis progression to cirrhosis is closely associated with chronic inflammation
which is related to the efficiency of the immune response. Cytokines play a central role in the
immune response and thus in orienting the fibrosis-cirrhosis fate [1].
In cases of chronic hepatitis, cytokines, including TGF and some interleukins such as IL-4
and IL-13, directly induce the production of extracellular matrix proteins and promote fibrosis
[2]. Immune escape by HCV and progression of the infection towards chronicity are
associated with the development of a Th2 response. These observations suggest that immune-
modulating molecules favoring a Th2 cytokine profile play a major role in chronic viral
hepatitis. These factors may include HLA-G, a member of the HLA class Ib family, and
which has membrane-bound and soluble (sHLA-G) forms which are immunomodulatory
molecules. HLA-G was initially described at the fetal-maternal interface of the
cytotrophoblast [3, 4]. Its immunomodulatory function has since been described [5] and its
involvement in various pathologies, especially in malignancies, has been demonstrated [6].
HLA-G exhibits suppressive properties in various cells by inhibiting (i) the cytolytic function
of NK cells and CD8 T cells and also triggering their apoptosis, (ii) the allo response of T4
lymphocytes, (iii) the maturation and function of antigen-presenting cells, (iv) the
proliferation and function of B cells and (v) angiogenesis. These functions are the
consequence of the interaction between HLA-G and its receptors on immune cells, such as
CD8, ILT2, ILT4, KIR2DL4 [7], or CD160 on endothelial cells [8]. HLA-G is also able to
induce suppressor/regulatory cells [9, 10]. Its suppressive action is amplified by trogocytosis
which allows effector cells to be converted into temporary regulatory cells [11]. HLA-G is
involved in many malignant diseases, and participates in the escape of tumors by promoting a
3
Th2 cytokine environment and by inhibiting immune effector cells. Also, there is increasing
evidence of the involvement of HLA-G in viral infections. Increased HLA-G expression, as
membrane and/or soluble forms, has been evidenced in various types of viral infection,
including those of human immunodeficiency virus (HIV) [12], human cytomegalovirus
(HCMV) [13], neurotropic viruses (herpes virus and rabies virus) [14], influenza A virus [15]
and hepatitis B virus [16].
However, the expression and role of HLA-G in human chronic hepatitis C have not been
thoroughly investigated. We therefore assessed HLA-G expression in liver tissues infected
with HCV, and then identified its cellular source and studied its regulation. We show that
HLA-G is expressed by some cells in hepatic tissue infected with HCV and that the number of
HLA-G-positive liver cells is significantly correlated with the area of fibrosis. In addition, we
identified the cell type expressing HLA-G as a subpopulation of mast cells. Finally, we show
that HLA-G expression by mast cells is regulated by interferons of class I.
Material and methods
Tissues samples
Liver biopsies from twenty chronically HCV-infected patients were retrospectively selected
from the Biological Resource Center (BRC) of Rennes University Hospital. They were
classified according to the METAVIR classification evaluating the severity of fibrosis (stage
F0 to F4) and the inflammatory activity (A0 to A3). All biopsies were reviewed by an
experienced pathologist. The characteristics of the patients are summarized in table 1. Non
tumoral areas of the biopsies, away from the origin of the tumor, were used for all analyses.
4
# Age Gender Metavir Etiology Pathology F stage A stage
1 49 M F4 A1 HCV HCC
2 73 F F4 A1 HCV HCC
3 72 M F1 A3 HCV HCC
4 46 M F4 A1 HCV + HBV + HIV HCC
5 56 F F4 A1 HCV HCC
6 56 F F4 A0 HCV HCC
7 62 M F4 A1 HCV HCC
8 47 M F4 A1 HCV Transplantation
9 73 F F4 A1 HCV HCC
10 84 M F4 A1 HCV HCC
11 55 M F2 A1 HCV HCC
12 51 F F4 A1 HCV HCC
13 83 F F4 A1 HCV HCC
14 40 M F4 A1 HCV + HBV HCC
15 49 F F4 A0 HCV + HIV HCC
16 65 F F4 A0 HCV HCC
17 55 M F4 A1 HCV HCC
18 75 M F3 A1 HCV + alcohol HCC
19 75 M F4 A2 HCV No
20 67 M F4 A1 HCV HCC
Table 1. Characteristics of the HCV patients.
Cell cultures
The following cell lines were used as a positive control for HLA-G expression: Jeg3
(American Type Culture Collection (ATCC)), and LCL.721.221-G5, a B lymphoblastoid cell
line transfected with HLA-G5 (D. Geraghty, Fred Hutchinson Cancer Research Center) as
previously described [17]. The human mast cell line used, HMC1.1 (a generous gift from Dr
Butterfield, Mayo clinic, Rochester), was established from a patient with mast cell leukemia
as previously described [18]. HMC1.1 cells (106 cells /ml) were cultured in six-well culture
plates in IMDM medium (Iscove Modified Dubelcco Medium, Gibco life technologies, Cergy
Pontoise, France) at 37°C with 5% CO2 for 48 hours. The effects of the presence of the
5
following cytokines, supplied by Peprotech-Tebu Bio (Neuilly, France), were tested: IL-33
(100ng/ml), IL-31 (50ng/ml), IL-4 (50ng/ml), IL-6 (50ng/ml), TNF- (10ng/ml), Oncostatin
M (OSM) (50ng/ml), IL-1 (10 ng/ml), IL-10 (50ng/ml), TGF- (5ng/ml), IL-22 (10ng/ml),
IFN-(50ng/ml), IFN-(50ng/ml), IFN-(50ng/ml), IFN-(10ng/ml), IFN-1 (50ng/ml),
and IFN-2 (50ng/ml).
Immunohistochemistry
Standard histological staining, including Sirius red staining of collagen accumulation and
HES coloration, was performed. Paraffin-embedded sections (4µm thick) were prepared,
subjected to an antigen retrieval protocol, and incubated with primary antibody in a Ventana
CT 09/021 automated machine (Ventana Medical systems, USA). Primary antibodies and
dilutions used were: monoclonal mouse anti-human hepatocyte (clone OCH1E5, Dako,
1:600), mouse monoclonal anti-human HLA-G (Exbio, 4H84, 2 µg/ml), monoclonal mouse
anti-human HLA-G (Exbio, MEM-G/1, 1µg/ml or 1:100), rabbit monoclonal anti-human CD3
(Thermo Scientific, SP7, 1:1500), mouse monoclonal anti-human CD163 recognizing liver
macrophages (Novocastra, 10 D6, 1:500), polyclonal rabbit anti-human CD117/ckit
recognizing myeloid cells (Dako, 1:200), and mouse monoclonal anti-human mast cell
tryptase (clone AA1, Dako, 1:1000). Bound primary antibody was revealed with goat
biotinylated anti-mouse or anti-rabbit IgG secondary antibody (Vector, ABCYS, Les Ulis,
France, 1:700) and then diamino-benzidine (DAB Map Detection Kit, Roche, Meylan,
France) and Mayer hematoxylin coloration.
After immunohistochemistry, the image of whole surface of the section was digitized at 20 X
magnification using a NanoZoomer Digital Pathology 2.0 RS whole-slide scanner
(Hamamatsu, Japan). An appropriate computer script analysis was developed and used for
semi automatic enumeration of HLA-G+ cells and MCs or CD3+ T cells. The area of fibrosis
6
was evaluated by annotation. Fibrosis areas were drawn on the whole section and the surface
area was calculated using “simple PCI” software. As direct HLA-G/ human mast cell tryptase
double immunofluorescence was not possible because of antibody incompatibility, two double
indirect immunofluorescence experiments, sharing CD117 (CD117/HLA-G and CD117/anti
human mast cell tryptase) were performed in parallel on serial sections of paraffin-embedded
sections from the same liver block. For immunofluorescence detection, fluorochrome-
conjugated secondary antibodies (Jackson ImmunoResearch, Cy5- affinipure donkey anti-
mouse IgG and Cy3-affinipure donkey anti-mouse IgG) were incubated with the sections for
1h at room temperature. Nuclei were counterstained with Hoechst stain (Molecular probe).
Specific Soluble HLA-G Enzyme-Linked Immunosorbent Assay
Soluble HLA-G concentrations in HMC1.1 culture-conditioned media were measured by
specific sandwich enzyme-linked immunosorbent assay (ELISA) using MEM-G/9 (Exbio,
Prague, Czech Republic; 10 µg/ml) and rabbit anti human beta-2 microglobulin (Dako,
Trappes, France) as capture and revelation antibodies, respectively, as previously described
[19] with minor modifications: after the second Ab, DAKO envision system HRP was added
and tetramethylbenzidine/peroxide (TMB, R&D system) was used as the substrate.
Quantification of chemokine gene expression by real-time quantitative PCR
After various times of stimulation of HMC1.1 cells with IFN- total RNA was extracted and
purified with the Nucleospin RNA II Kit R (Macherey-Nagel, Hoerdt, France). The High
capacity cDNA archive Kit R (Applied Biosystems, Cergy Pontoise, France) was used for
reverse transcription of aliquots of 3 µg of total extracted RNA following the manufacturer’s
instructions. Primers having the same melting temperature (Tm) were designed using Primer3
software. A large panel of cytokines and chemokines was tested using a large-scale qPCR
7
approach as shown in Fig. 4C. Real-time PCR for HLA-G was performed in parallel with the
same samples and with the HLA-G-positive cell line, Jeg3, using primers designed according
the same methodology (Fig. S1.). The CT method was used for quantification of the
housekeeping genes 18S, GAPDH, and SDHA used for multiple normalization as described
previously [20]. To ensure that the primers produced a single and specific PCR amplification
product, a dissociation curve was determined during PCR cycles. Dissociation curves were
checked and in all cases showed a single dissociation peak; products were also tested by
migration on 2% agarose gel to ensure that there was only one single PCR product in each
reaction (Fig. S2.). The expression level of each gene was adjusted to the level of
housekeeping gene mRNAs (18S mRNA, GAPDH mRNA and SDHA mRNA) and is
expressed as the mean of the three ratios (mean of the gene to house keeping gene ratios).
Gene expression was evaluated as a function of the time of stimulation, so results are
expressed as 2 – Ct referred to as the fold induction in relation to the mean Ct at time 0.
qPCR data clustering
The Annotation, Mapping, Expression and Network (AMEN) suite of tools was used for
cluster analysis [21]. After a log2 transformation of the qPCR data, genes with the most
similar expression profiles were classified into four groups (k=4) using the Partition Around
Medoids (PAM) algorithm implemented in AMEN.
Statistical analyses: Statistical analyses were performed with GraphPad prism software and
included the Spearman test and Student’s t test.
8
Results
HLA-G expression is correlated with HCV-induced liver fibrosis.
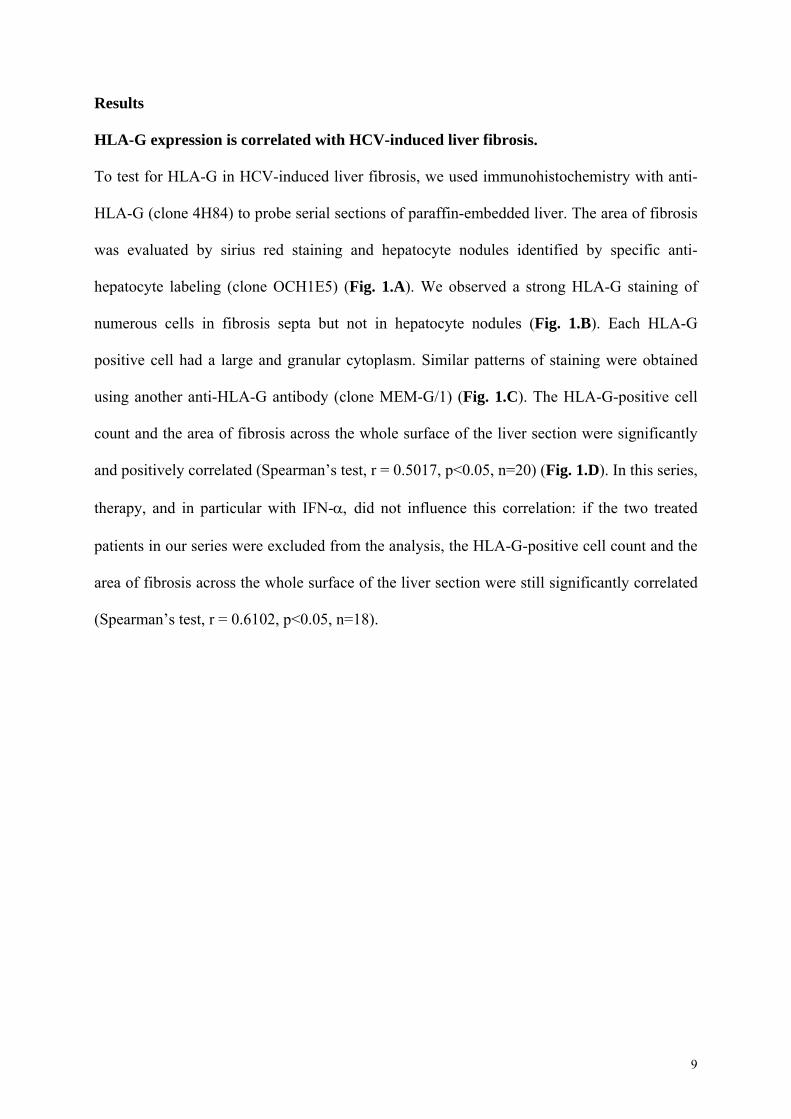
To test for HLA-G in HCV-induced liver fibrosis, we used immunohistochemistry with anti-
HLA-G (clone 4H84) to probe serial sections of paraffin-embedded liver. The area of fibrosis
was evaluated by sirius red staining and hepatocyte nodules identified by specific anti-
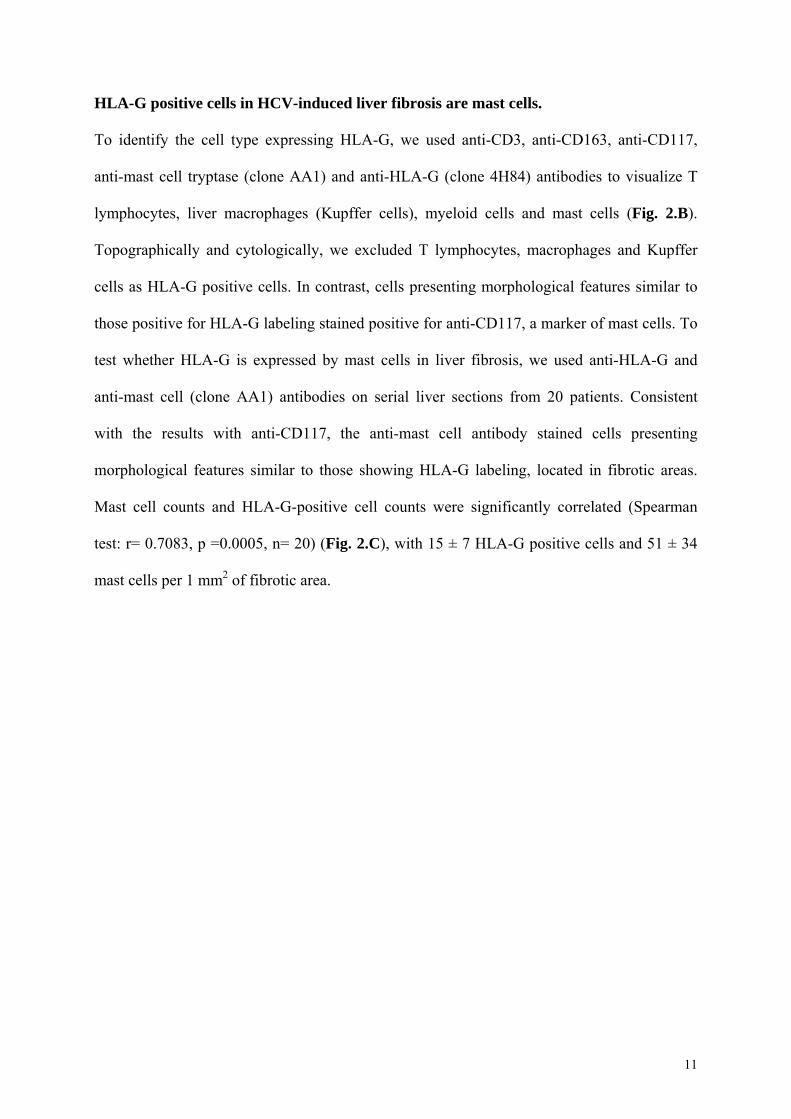
hepatocyte labeling (clone OCH1E5) (Fig. 1.A). We observed a strong HLA-G staining of
numerous cells in fibrosis septa but not in hepatocyte nodules (Fig. 1.B). Each HLA-G
positive cell had a large and granular cytoplasm. Similar patterns of staining were obtained
using another anti-HLA-G antibody (clone MEM-G/1) (Fig. 1.C). The HLA-G-positive cell
count and the area of fibrosis across the whole surface of the liver section were significantly
and positively correlated (Spearman’s test, r = 0.5017, p<0.05, n=20) (Fig. 1.D). In this series,
therapy, and in particular with IFN- did not influence this correlation: if the two treated
patients in our series were excluded from the analysis, the HLA-G-positive cell count and the
area of fibrosis across the whole surface of the liver section were still significantly correlated
(Spearman’s test, r = 0.6102, p<0.05, n=18).
9
Fig. 1. Expression of HLA-G in HCV liver fibrosis. (A) Sirius red staining of collagen accumulation and staining of hepatocyte modules with anti-hepatocyte antibodies in a representative case. (B) 4H84 Labeling is located in fibrosis septa and not in areas composed of hepatocytes. (C) Comparison between 4H84 and MEM-G/1 staining. (D) Correlation between HLA-G+ cell numbers and fibrosis area expressed in mm2 according to the Spearman test (r = 0.5017, p <0.05, n = 20).
To investigate the relation between expression of HLA-G and inflammatory activity, the
number of CD3 T cells detected over the entire surface of the liver section was counted. The
number of HLA-G positive cells and that of CD3 T lymphocytes were positively and
significantly correlated (Spearman‘s test, r = 0.7273, p<0.05) (Fig. S.1.).
10
HLA-G positive cells in HCV-induced liver fibrosis are mast cells.
To identify the cell type expressing HLA-G, we used anti-CD3, anti-CD163, anti-CD117,
anti-mast cell tryptase (clone AA1) and anti-HLA-G (clone 4H84) antibodies to visualize T
lymphocytes, liver macrophages (Kupffer cells), myeloid cells and mast cells (Fig. 2.B).
Topographically and cytologically, we excluded T lymphocytes, macrophages and Kupffer
cells as HLA-G positive cells. In contrast, cells presenting morphological features similar to
those positive for HLA-G labeling stained positive for anti-CD117, a marker of mast cells. To
test whether HLA-G is expressed by mast cells in liver fibrosis, we used anti-HLA-G and
anti-mast cell (clone AA1) antibodies on serial liver sections from 20 patients. Consistent
with the results with anti-CD117, the anti-mast cell antibody stained cells presenting
morphological features similar to those showing HLA-G labeling, located in fibrotic areas.
Mast cell counts and HLA-G-positive cell counts were significantly correlated (Spearman
test: r= 0.7083, p =0.0005, n= 20) (Fig. 2.C), with 15 ± 7 HLA-G positive cells and 51 ± 34
mast cells per 1 mm2 of fibrotic area.
11
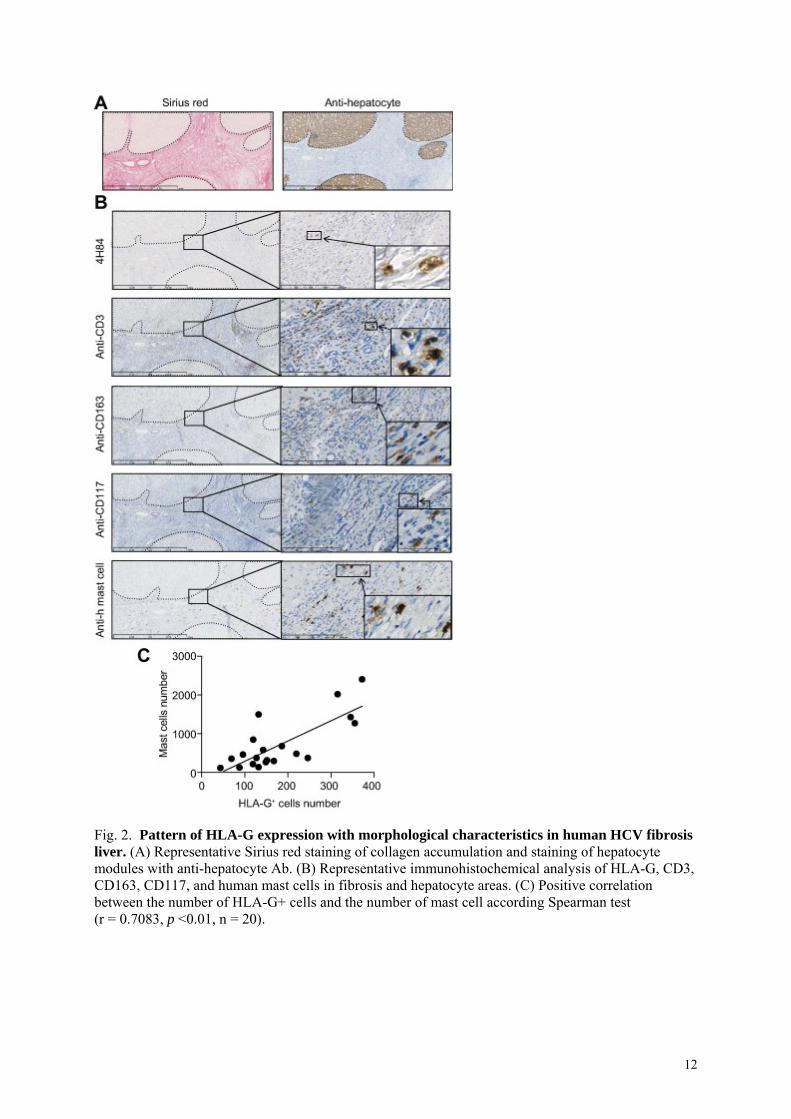
Fig. 2. Pattern of HLA-G expression with morphological characteristics in human HCV fibrosis liver. (A) Representative Sirius red staining of collagen accumulation and staining of hepatocyte modules with anti-hepatocyte Ab. (B) Representative immunohistochemical analysis of HLA-G, CD3, CD163, CD117, and human mast cells in fibrosis and hepatocyte areas. (C) Positive correlation between the number of HLA-G+ cells and the number of mast cell according Spearman test (r = 0.7083, p <0.01, n = 20).
12
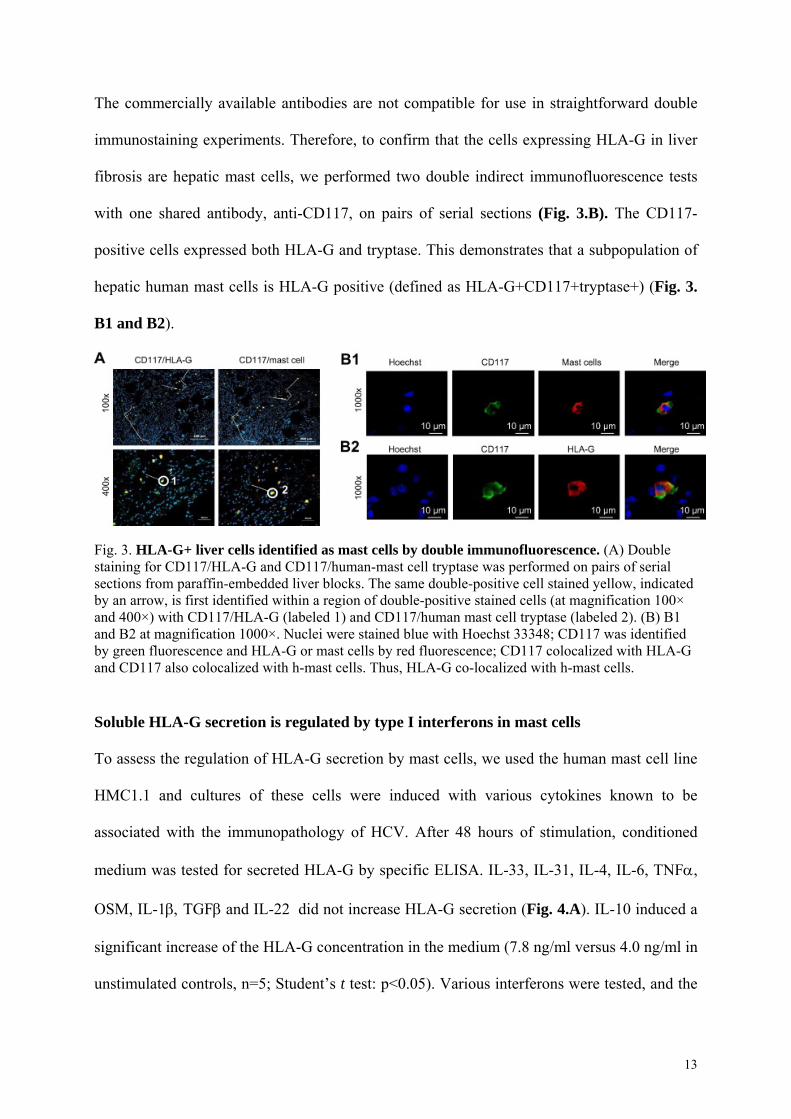
The commercially available antibodies are not compatible for use in straightforward double
immunostaining experiments. Therefore, to confirm that the cells expressing HLA-G in liver
fibrosis are hepatic mast cells, we performed two double indirect immunofluorescence tests
with one shared antibody, anti-CD117, on pairs of serial sections (Fig. 3.B). The CD117-
positive cells expressed both HLA-G and tryptase. This demonstrates that a subpopulation of
hepatic human mast cells is HLA-G positive (defined as HLA-G+CD117+tryptase+) (Fig. 3.
B1 and B2).
Fig. 3. HLA-G+ liver cells identified as mast cells by double immunofluorescence. (A) Double staining for CD117/HLA-G and CD117/human-mast cell tryptase was performed on pairs of serial sections from paraffin-embedded liver blocks. The same double-positive cell stained yellow, indicated by an arrow, is first identified within a region of double-positive stained cells (at magnification 100× and 400×) with CD117/HLA-G (labeled 1) and CD117/human mast cell tryptase (labeled 2). (B) B1 and B2 at magnification 1000×. Nuclei were stained blue with Hoechst 33348; CD117 was identified by green fluorescence and HLA-G or mast cells by red fluorescence; CD117 colocalized with HLA-G and CD117 also colocalized with h-mast cells. Thus, HLA-G co-localized with h-mast cells.
Soluble HLA-G secretion is regulated by type I interferons in mast cells
To assess the regulation of HLA-G secretion by mast cells, we used the human mast cell line
HMC1.1 and cultures of these cells were induced with various cytokines known to be
associated with the immunopathology of HCV. After 48 hours of stimulation, conditioned
medium was tested for secreted HLA-G by specific ELISA. IL-33, IL-31, IL-4, IL-6, TNF,
OSM, IL-1 TGFand IL-22 did not increase HLA-G secretion (Fig. 4.A). IL-10 induced a
significant increase of the HLA-G concentration in the medium (7.8 ng/ml versus 4.0 ng/ml in
unstimulated controls, n=5; Student’s t test: p<0.05). Various interferons were tested, and the
13
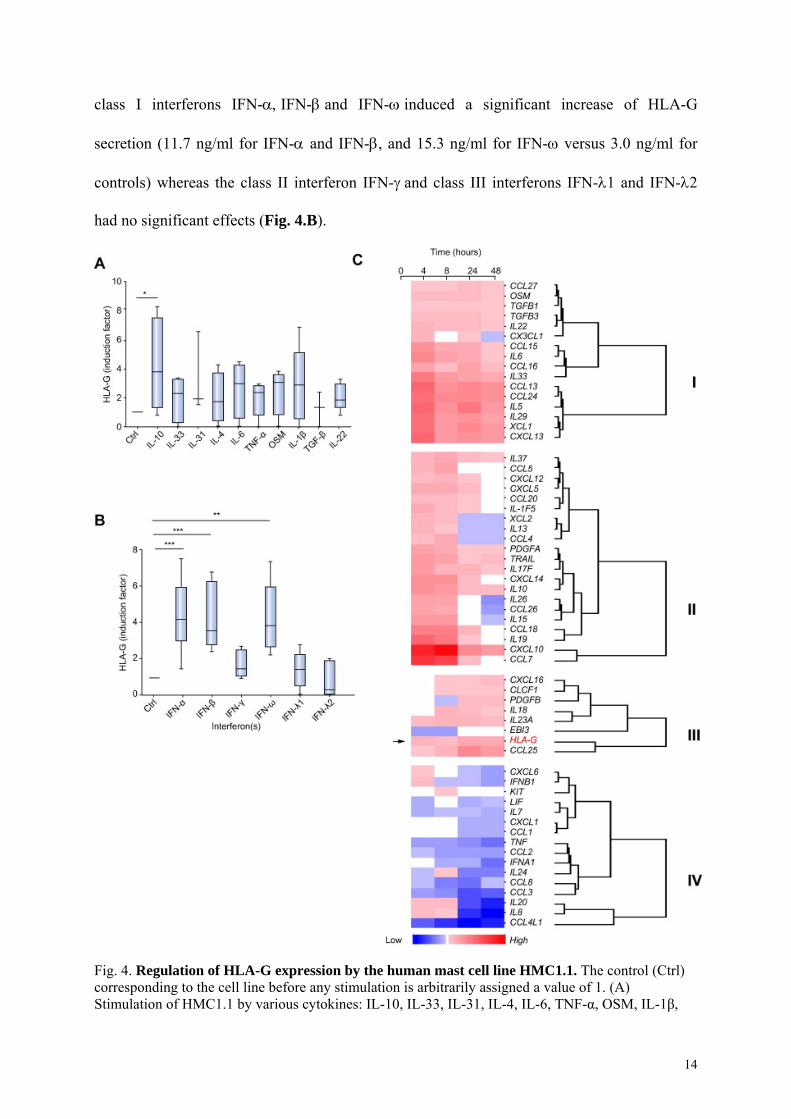
class I interferons IFN-IFN-and IFN-induced a significant increase of HLA-G
secretion (11.7 ng/ml for IFN- and IFN-, and 15.3 ng/ml for IFN- versus 3.0 ng/ml for
controls) whereas the class II interferon IFN-and class III interferons IFN-1 and IFN-2
had no significant effects (Fig. 4.B).
Fig. 4. Regulation of HLA-G expression by the human mast cell line HMC1.1. The control (Ctrl) corresponding to the cell line before any stimulation is arbitrarily assigned a value of 1. (A) Stimulation of HMC1.1 by various cytokines: IL-10, IL-33, IL-31, IL-4, IL-6, TNF-α, OSM, IL-1β,
14
IL-22. Results from at least three independent experiments are presented. �Significant expression was noted (p <0.05). (B) Stimulation of HMC1.1 by various interferons of the three classes: type I interferons IFN-α,β,ω, the type II interferon IFN-γ, and the type III interferons IFN-λ1 and IFN-λ2. Significant expression was noted thus: ��p <0.001, ���p <0.0001. (C) Cluster analysis of cytokine gene expression by HMC1.1 after various times of stimulation with IFN-α (4 h, 8 h, 24 h, and 48 h) relative to the baseline value (0 h) before addition of IFN-α. Panel C shows a false-color heatmap of genes (y-axis) having an altered expression pattern after IFN-α stimulation at the time points given (x-axis). Genes are grouped into four clusters (termed I, II, III, and IV) according to their relative expression levels at different time points. Dendrogram plots based on the hierarchical clustering of each individual group are displayed to the right. Briefly, groups I, II, and III and include genes upregulated after IFN-α stimulation but differing according to the time of increase, whereas group IV represents genes downregulated by IFN-α stimulation. The color scale bar to the bottom of the heatmap indicates log2-ratio (blue = down-regulation, white = no change in expression, red = up-regulation).
To determine whether this regulation by IFN- involved only soluble forms or membrane-
bound forms, HLA-G expression on the surface of HMC1.1 cells was determined by flow
cytometry with the antibody 87G, a specific conformational anti-HLA-G antibody. This
expression was determined after 0, 4, 8, 24, and 48 hours of IFN- stimulation, and
intracellular expression was studied at the same timepoints by immunocytochemistry and
western blotting (Fig. S.3.). We found strong cell surface expression of HLA-G associated
with intracellular expression by HMC1.1 cells at baseline (hour 0), which was confirmed by
western blot analysis. Cell surface expression as assessed by flow cytometry did not
significantly increase with stimulation with IFN-, �whether scored as % positivity or MFI
(mean of MFI ratio =6, range 5.7 to 6.8). Immunohistochemical observation revealed that the
extent of labeling of the HMC1.1 cells was very diverse: some cells were strongly labeled,
some partially labeled and some only weakly labeled (Fig. S.3).
In toxicity and proliferation assays, there were no significant differences in the numbers of
HMC1.1 cells between the IFN--stimulated and control conditions (Fig. S. 4). Furthermore,
the response of HMC1.1 cells to IFN- treatment was dose- and time-dependent (Fig. S.4.).
To study the profile of cytokines expressed by mast cells concomitantly with HLA-G during
IFN- stimulation, the transcripts of 81 cytokine genes were assayed by real-time PCR after
4, 8, 24 and 48 hours of stimulation by IFN-. Cluster analysis identified four groups of genes
15
in addition to the group of 19 genes not responsive to IFN- (IL-1, IL-, IL-2, IL-3, IL-17;
IL-17B, IL-17D, IL21, IL-12p35, IL-12p40, IL-31, IFN-, CCL17, CCL19, CCL21, CCL22,
CXCL1, CXCL2 and CXCL5) (data not shown). The first group, termed cluster I, included 16
genes that were up-regulated by IFN-in a continuous manner; OSM, IL-33, TGF- and IL-6
belonged to this cluster I (Fig. 4.C). The second group (cluster II) included 21 genes up-
regulated at 4 and 8 hours but with a decreased expression from 24 hours (Fig. 4C). The third
group (cluster III) contained eight genes, including HLA-G, that were up-regulated by IFN-
at late time points (Fig. 4.C). Finally, the fourth group (cluster IV) included 16 genes that
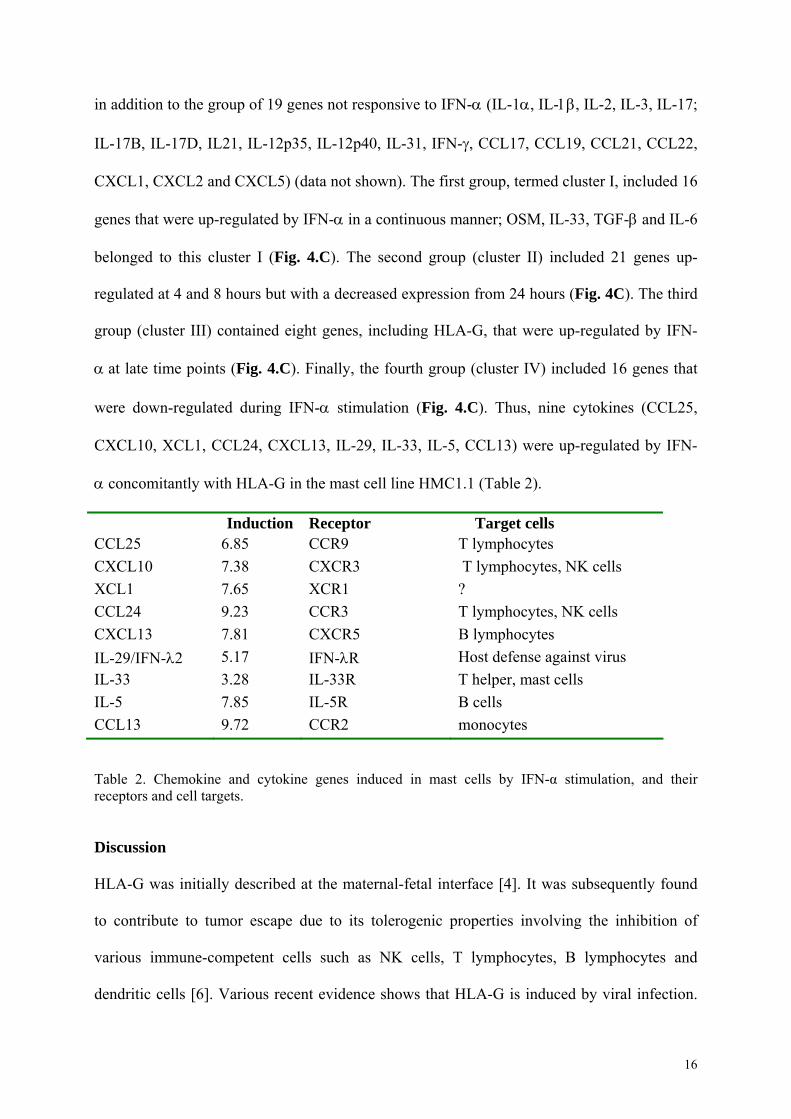
were down-regulated during IFN- stimulation (Fig. 4.C). Thus, nine cytokines (CCL25,
CXCL10, XCL1, CCL24, CXCL13, IL-29, IL-33, IL-5, CCL13) were up-regulated by IFN-
concomitantly with HLA-G in the mast cell line HMC1.1 (Table 2).
Induction Receptor Target cells CCL25 6.85 CCR9 T lymphocytes
CXCL10 7.38 CXCR3 T lymphocytes, NK cells
XCL1 7.65 XCR1 ?
CCL24 9.23 CCR3 T lymphocytes, NK cells
CXCL13 7.81 CXCR5 B lymphocytes
IL-29/IFN-2 5.17 IFN-R Host defense against virus
IL-33 3.28 IL-33R T helper, mast cells
IL-5 7.85 IL-5R B cells
CCL13 9.72 CCR2 monocytes
Table 2. Chemokine and cytokine genes induced in mast cells by IFN-α stimulation, and their receptors and cell targets. Discussion
HLA-G was initially described at the maternal-fetal interface [4]. It was subsequently found
to contribute to tumor escape due to its tolerogenic properties involving the inhibition of
various immune-competent cells such as NK cells, T lymphocytes, B lymphocytes and
dendritic cells [6]. Various recent evidence shows that HLA-G is induced by viral infection.
16
Blood HLA-G titers are high in most cases of HIV [12], HCMV [22], HBV [16] and HCV
[23] infection, and in the majority of viral infections, HLA-G is expressed by blood cells,
notably monocytes and/or T lymphocytes [15].
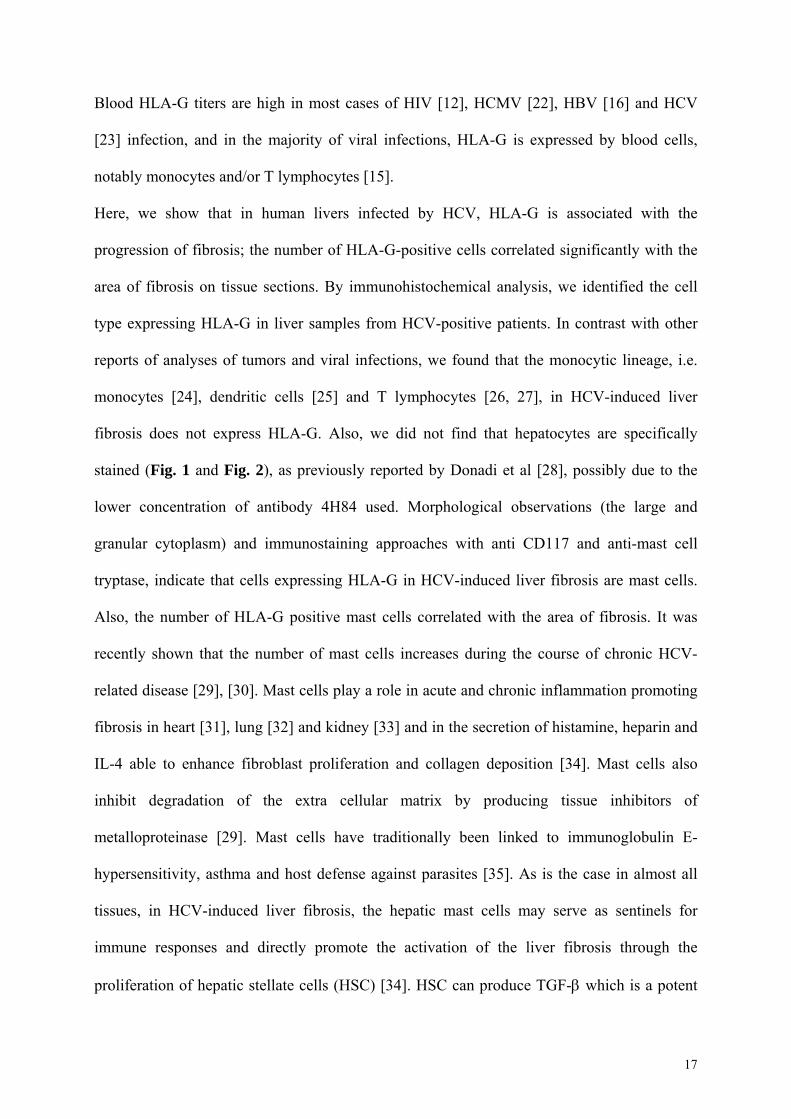
Here, we show that in human livers infected by HCV, HLA-G is associated with the
progression of fibrosis; the number of HLA-G-positive cells correlated significantly with the
area of fibrosis on tissue sections. By immunohistochemical analysis, we identified the cell
type expressing HLA-G in liver samples from HCV-positive patients. In contrast with other
reports of analyses of tumors and viral infections, we found that the monocytic lineage, i.e.
monocytes [24], dendritic cells [25] and T lymphocytes [26, 27], in HCV-induced liver
fibrosis does not express HLA-G. Also, we did not find that hepatocytes are specifically
stained (Fig. 1 and Fig. 2), as previously reported by Donadi et al [28], possibly due to the
lower concentration of antibody 4H84 used. Morphological observations (the large and
granular cytoplasm) and immunostaining approaches with anti CD117 and anti-mast cell
tryptase, indicate that cells expressing HLA-G in HCV-induced liver fibrosis are mast cells.
Also, the number of HLA-G positive mast cells correlated with the area of fibrosis. It was
recently shown that the number of mast cells increases during the course of chronic HCV-
related disease [29], [30]. Mast cells play a role in acute and chronic inflammation promoting
fibrosis in heart [31], lung [32] and kidney [33] and in the secretion of histamine, heparin and
IL-4 able to enhance fibroblast proliferation and collagen deposition [34]. Mast cells also
inhibit degradation of the extra cellular matrix by producing tissue inhibitors of
metalloproteinase [29]. Mast cells have traditionally been linked to immunoglobulin E-
hypersensitivity, asthma and host defense against parasites [35]. As is the case in almost all
tissues, in HCV-induced liver fibrosis, the hepatic mast cells may serve as sentinels for
immune responses and directly promote the activation of the liver fibrosis through the
proliferation of hepatic stellate cells (HSC) [34]. HSC can produce TGF- which is a potent
17
mast cell chemoattractant [36] [37] and this may explain the presence of mast cells in liver
fibrosis. Other cytokines, such as IL-4 and IL-33, involved in liver fibrosis may also explain
the chemoattractant and activation of mast cells in liver [51, 52].
We used the HMC1.1 cell line to study the regulation of HLA-G by 16 cytokines. We
identified IL-10 as a potential inducer of HLA-G in mast cells. This is consistent with
previous reports of induction of HLA-G expression in trophoblasts and monocytes [38] and in
some tumoral pathologies [39]. Furthermore, it was recently shown that murine mast cells can
secrete IL-10 [40]. IL-10 is an immunoregulatory cytokine that plays a key role in progression
to chronic HCV infection [41]. Interferons of classes II and III had no effect on the secretion
of HLA-G by mast cells. By contrast, class I IFNs, including IFN, and , induced
secretion of HLA-G. There is an apparent discrepancy between the increased production of
the soluble form and absence of change in the abundance of the membrane-bound form after
IFN- treatment as evaluated by flow cytometry. This could be a consequence of the
susceptibility of HLA-G1 to cleavage by metalloproteinases resulting in soluble forms
detected by ELISA but not on the cell surface by flow cytometry. Indeed, IFN- may favor
proteolytic cleavage by acting on the cleavage site. IFN and are known to induce HLA
class I expression in monocytes and many tumoral cells by binding with the interferon-
stimulated response element (IRSE) motif [42]. IFN- and , and class III IFNs are induced
by HCV and constitute the main anti-HCV viral response of the host. Thus, during the
evolution of HCV-induced liver fibrosis, IFN- produced in response to HCV attack may
induce HLA-G in mast cells in areas of fibrosis.
To investigate the cytokine microenvironment, we measured cytokine and chemokine
transcripts expressed concomitantly with that of HLA-G after IFNinduction. CCL25,
CXCL10, XCL1, CCL24, CXCL13, IL-29, IL-33, IL-5 and CCL13 were up-regulated by
IFN-concomitantly with HLA-G, suggesting that these cytokines and chemokines are
18
present in or around areas of fibrosis. Using various investigative approaches
(immunohistochemistry, quantitative PCR and DNA microarrays), the production of most of
these cytokines has already been found to be associated with HCV liver fibrosis [1, 43] and
the expression of some of them by mast cells has been reported [44-47]. The expression of
these nine cytokines concomitantly with HLA-G defines leukocyte recruitment involving T
lymphocytes, NK cells and to a lesser degree B lymphocytes and monocytes (table 2); all
these cell types are known to infiltrate HCV-induced liver fibrosis. Furthermore, the human
mast cell line expresses an HLA-G receptor, ILT2 (Fig. S3), suggesting an autocrine loop.
This type of regulation with concomitant HLA-G and ILT4 expression has been suggested in
dendritic cells or monocytes [5]. HLA-G can control the expression of it own receptors on
antigen presenting cells (APC), T cells and NK cells [48]. Similarly, it was shown that HLA-
G acts in an autocrine regulatory feedback loop in HIV infection: it is secreted by dendritic
cells and regulates the functional characteristics of these cells via interaction with its receptor,
ILT4 [49].
In conclusion, our data show clearly that HLA-G is expressed by mast cells in fibrotic areas of
liver from patients infected with HCV, and that IFN-produced in response to HCV infection
up-regulates the secretion of HLA-G. However, the function of HLA-G during HCV infection
remains to be described. HLA-G may promote viral escape from the immune system, as in
cancers, by inhibiting both adaptive and innate immunity, such that HCV-infected cells would
be protected and viral progression favored. Another possibility is that, like in septic shock,
HLA-G expression reflects an appropriate and efficient response to inflammatory processes
occurring during viral infection. Indeed, HLA-G may have different roles according to the
stage of infection: deleterious at the beginning of the chronic process of hepatitis, and
protective during the stage of established fibrosis. The effects need to be interpreted in
19
relation with those of the mast cells, the cells expressing HLA-G. Further work is needed to
elucidate the respective roles of HLA-G and mast cells in the genesis and the evolution of
liver fibrosis.
Acknowledgments
This work was supported by grants from ANRS 2010, Ligue Nationale Contre le Cancer
(Comité d’Ille et Vilaine) 2009, IFR 140 2010, Biosit 2012. We thank Dr Butterfield for his
generous gift of the human mast cell line HMC1.1, Dr Geraghty for providing
LCL721.221.G5, the Biological Resource Center (BRC) of Rennes University Hospital for
providing liver biopsies, the H2P2 platform of Biosit and particularly Pascale Bellaud for
technical assistance. We also thank Ahmed Zahedi of Rennes University Hospital for
technical assistance.
No conflict of interest.
References
[1] Marvie P, Lisbonne M, L'Helgoualc'h A, Rauch M, Turlin B, Preisser L, et al. Interleukin-33 overexpression is associated with liver fibrosis in mice and humans. J Cell Mol Med 2010;14:1726-1739. [2] Bataller R, Brenner DA. Liver fibrosis. The Journal of clinical investigation 2005;115:209-218. [3] Geraghty DE, Koller BH, Orr HT. A human major histocompatibility complex class I gene that encodes a protein with a shortened cytoplasmic segment. Proceedings of the National Academy of Sciences of the United States of America 1987;84:9145-9149. [4] Kovats S, Main EK, Librach C, Stubblebine M, Fisher SJ, DeMars R. A class I antigen, HLA-G, expressed in human trophoblasts. Science 1990;248:220-223. [5] Carosella ED, Gregori S, Rouas-Freiss N, LeMaoult J, Menier C, Favier B. The role of HLA-G in immunity and hematopoiesis. Cell Mol Life Sci 2011;68:353-368. [6] Amiot L, Ferrone S, Grosse-Wilde H, Seliger B. Biology of HLA-G in cancer: a candidate molecule for therapeutic intervention? Cell Mol Life Sci 2011;68:417-431. [7] Gonzalez A, Rebmann V, LeMaoult J, Horn PA, Carosella ED, Alegre E. The immunosuppressive molecule HLA-G and its clinical implications. Crit Rev Clin Lab Sci 2012;49:63-84. [8] Le Bouteiller P, Fons P, Herault JP, Bono F, Chabot S, Cartwright JE, et al. Soluble HLA-G and control of angiogenesis. J Reprod Immunol 2007;76:17-22.
20
[9] Carosella ED, Favier B, Rouas-Freiss N, Moreau P, Lemaoult J. Beyond the increasing complexity of the immunomodulatory HLA-G molecule. Blood 2008;111:4862-4870. [10] LeMaoult J, Krawice-Radanne I, Dausset J, Carosella ED. HLA-G1-expressing antigen-presenting cells induce immunosuppressive CD4+ T cells. Proceedings of the National Academy of Sciences of the United States of America 2004;101:7064-7069. [11] LeMaoult J, Caumartin J, Carosella ED. Exchanges of membrane patches (trogocytosis) split theoretical and actual functions of immune cells. Human immunology 2007;68:240-243. [12] Lozano JM, Gonzalez R, Kindelan JM, Rouas-Freiss N, Caballos R, Dausset J, et al. Monocytes and T lymphocytes in HIV-1-positive patients express HLA-G molecule. AIDS 2002;16:347-351. [13] Onno M, Pangault C, Le Friec G, Guilloux V, Andre P, Fauchet R. Modulation of HLA-G antigens expression by human cytomegalovirus: specific induction in activated macrophages harboring human cytomegalovirus infection. J Immunol 2000;164:6426-6434. [14] Megret F, Prehaud C, Lafage M, Moreau P, Rouas-Freiss N, Carosella ED, et al. Modulation of HLA-G and HLA-E expression in human neuronal cells after rabies virus or herpes virus simplex type 1 infections. Human immunology 2007;68:294-302. [15] Chen HX, Chen BG, Shi WW, Zhen R, Xu DP, Lin A, et al. Induction of cell surface human leukocyte antigen-G expression in pandemic H1N1 2009 and seasonal H1N1 influenza virus-infected patients. Human immunology 2011;72:159-165. [16] Shi WW, Lin A, Xu DP, Bao WG, Zhang JG, Chen SY, et al. Plasma soluble human leukocyte antigen-G expression is a potential clinical biomarker in patients with hepatitis B virus infection. Human immunology 2011;72:1068-1073. [17] Fujii T, Ishitani A, Geraghty DE. A soluble form of the HLA-G antigen is encoded by a messenger ribonucleic acid containing intron 4. J Immunol 1994;153:5516-5524. [18] Butterfield JH, Weiler D, Dewald G, Gleich GJ. Establishment of an immature mast cell line from a patient with mast cell leukemia. Leuk Res 1988;12:345-355. [19] Rebmann V, Lemaoult J, Rouas-Freiss N, Carosella ED, Grosse-Wilde H. Report of the Wet Workshop for Quantification of Soluble HLA-G in Essen, 2004. Human immunology 2005;66:853-863. [20] Vandesompele J, De Preter K, Pattyn F, Poppe B, Van Roy N, De Paepe A, et al. Accurate normalization of real-time quantitative RT-PCR data by geometric averaging of multiple internal control genes. Genome Biol 2002;3:RESEARCH0034. [21] Chalmel F, Primig M. The Annotation, Mapping, Expression and Network (AMEN) suite of tools for molecular systems biology. BMC Bioinformatics 2008;9:86. [22] Yan WH, Lin A, Chen BG, Chen SY. Induction of both membrane-bound and soluble HLA-G expression in active human cytomegalovirus infection. J Infect Dis 2009;200:820-826. [23] Weng PJ, Fu YM, Ding SX, Xu DP, Lin A, Yan WH. Elevation of plasma soluble human leukocyte antigen-G in patients with chronic hepatitis C virus infection. Human immunology 2011;72:406-411. [24] Rebmann V, Busemann A, Lindemann M, Grosse-Wilde H. Detection of HLA-G5 secreting cells. Human immunology 2003;64:1017-1024. [25] Le Friec G, Gros F, Sebti Y, Guilloux V, Pangault C, Fauchet R, et al. Capacity of myeloid and plasmacytoid dendritic cells especially at mature stage to express and secrete HLA-G molecules. Journal of leukocyte biology 2004;76:1125-1133. [26] Lila N, Rouas-Freiss N, Dausset J, Carpentier A, Carosella ED. Soluble HLA-G protein secreted by allo-specific CD4+ T cells suppresses the allo-proliferative response: a
21
CD4+ T cell regulatory mechanism. Proceedings of the National Academy of Sciences of the United States of America 2001;98:12150-12155. [27] Sebti Y, Le Maux A, Gros F, De Guibert S, Pangault C, Rouas-Freiss N, et al. Expression of functional soluble human leucocyte antigen-G molecules in lymphoproliferative disorders. Br J Haematol 2007;138:202-212. [28] de Oliveira Crispim JC, Silva TG, Souto FJ, Souza FF, Bassi CL, Soares CP, et al. Upregulation of soluble and membrane-bound human leukocyte antigen G expression is primarily observed in the milder histopathological stages of chronic hepatitis C virus infection. Human immunology 2012;73:258-262. [29] Franceschini B, Ceva-Grimaldi G, Russo C, Dioguardi N, Grizzi F. The complex functions of mast cells in chronic human liver diseases. Dig Dis Sci 2006;51:2248-2256. [30] Armbrust T, Batusic D, Ringe B, Ramadori G. Mast cells distribution in human liver disease and experimental rat liver fibrosis. Indications for mast cell participation in development of liver fibrosis. J Hepatol 1997;26:1042-1054. [31] Batlle M, Perez-Villa F, Lazaro A, Garcia-Pras E, Ramirez J, Ortiz J, et al. Correlation between mast cell density and myocardial fibrosis in congestive heart failure patients. Transplant Proc 2007;39:2347-2349. [32] Inoue Y, King TE, Jr., Tinkle SS, Dockstader K, Newman LS. Human mast cell basic fibroblast growth factor in pulmonary fibrotic disorders. Am J Pathol 1996;149:2037-2054. [33] Summers SA, Gan PY, Dewage L, Ma FT, Ooi JD, O'Sullivan KM, et al. Mast cell activation and degranulation promotes renal fibrosis in experimental unilateral ureteric obstruction. Kidney Int 2012. [34] Gruber BL, Kew RR, Jelaska A, Marchese MJ, Garlick J, Ren S, et al. Human mast cells activate fibroblasts: tryptase is a fibrogenic factor stimulating collagen messenger ribonucleic acid synthesis and fibroblast chemotaxis. J Immunol 1997;158:2310-2317. [35] Prussin C, Metcalfe DD. 4. IgE, mast cells, basophils, and eosinophils. J Allergy Clin Immunol 2003;111:S486-494. [36] Gruber BL, Marchese MJ, Kew RR. Transforming growth factor-beta 1 mediates mast cell chemotaxis. J Immunol 1994;152:5860-5867. [37] Ouyang Y, Nakao A, Han D, Zhang L. Transforming growth factor-beta1 promotes nasal mucosal mast cell chemotaxis in murine experimental allergic rhinitis. ORL J Otorhinolaryngol Relat Spec 2012;74:117-123. [38] Moreau P, Adrian-Cabestre F, Menier C, Guiard V, Gourand L, Dausset J, et al. IL-10 selectively induces HLA-G expression in human trophoblasts and monocytes. Int Immunol 1999;11:803-811. [39] Urosevic M, Dummer R. HLA-G and IL-10 expression in human cancer--different stories with the same message. Semin Cancer Biol 2003;13:337-342. [40] Grimbaldeston MA, Nakae S, Kalesnikoff J, Tsai M, Galli SJ. Mast cell-derived interleukin 10 limits skin pathology in contact dermatitis and chronic irradiation with ultraviolet B. Nat Immunol 2007;8:1095-1104. [41] Flynn JK, Dore GJ, Hellard M, Yeung B, Rawlinson WD, White PA, et al. Early IL-10 predominant responses are associated with progression to chronic hepatitis C virus infection in injecting drug users. J Viral Hepat 2011;18:549-561. [42] Gobin SJ, Keijsers V, van Zutphen M, van den Elsen PJ. The role of enhancer A in the locus-specific transactivation of classical and nonclassical HLA class I genes by nuclear factor kappa B. J Immunol 1998;161:2276-2283. [43] Tsukamoto H. Cytokine regulation of hepatic stellate cells in liver fibrosis. Alcoholism, clinical and experimental research 1999;23:911-916. [44] Hsu CL, Neilsen CV, Bryce PJ. IL-33 is produced by mast cells and regulates IgE-dependent inflammation. PLoS One 2010;5:e11944.
22
[45] Lorentz A, Schwengberg S, Sellge G, Manns MP, Bischoff SC. Human intestinal mast cells are capable of producing different cytokine profiles: role of IgE receptor cross-linking and IL-4. J Immunol 2000;164:43-48. [46] Okayama Y, Hagaman DD, Metcalfe DD. A comparison of mediators released or generated by IFN-gamma-treated human mast cells following aggregation of Fc gamma RI or Fc epsilon RI. J Immunol 2001;166:4705-4712. [47] Zhang B, Alysandratos KD, Angelidou A, Asadi S, Sismanopoulos N, Delivanis DA, et al. Human mast cell degranulation and preformed TNF secretion require mitochondrial translocation to exocytosis sites: relevance to atopic dermatitis. J Allergy Clin Immunol 2011;127:1522-1531 e1528. [48] LeMaoult J, Zafaranloo K, Le Danff C, Carosella ED. HLA-G up-regulates ILT2, ILT3, ILT4, and KIR2DL4 in antigen presenting cells, NK cells, and T cells. Faseb J 2005;19:662-664. [49] Huang J, Burke P, Yang Y, Seiss K, Beamon J, Cung T, et al. Soluble HLA-G inhibits myeloid dendritic cell function in HIV-1 infection by interacting with leukocyte immunoglobulin-like receptor B2. J Virol 2010;84:10784-10791.
23
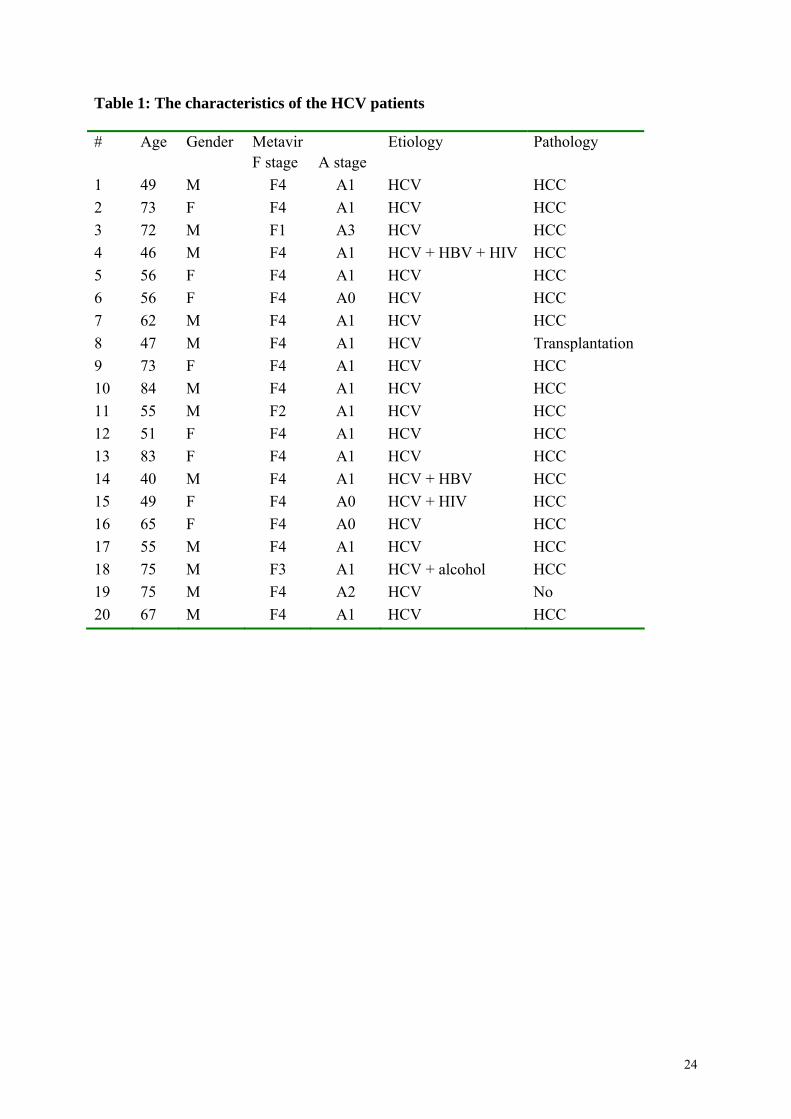
Table 1: The characteristics of the HCV patients
# Age Gender Metavir Etiology Pathology F stage A stage
1 49 M F4 A1 HCV HCC
2 73 F F4 A1 HCV HCC
3 72 M F1 A3 HCV HCC
4 46 M F4 A1 HCV + HBV + HIV HCC
5 56 F F4 A1 HCV HCC
6 56 F F4 A0 HCV HCC
7 62 M F4 A1 HCV HCC
8 47 M F4 A1 HCV Transplantation
9 73 F F4 A1 HCV HCC
10 84 M F4 A1 HCV HCC
11 55 M F2 A1 HCV HCC
12 51 F F4 A1 HCV HCC
13 83 F F4 A1 HCV HCC
14 40 M F4 A1 HCV + HBV HCC
15 49 F F4 A0 HCV + HIV HCC
16 65 F F4 A0 HCV HCC
17 55 M F4 A1 HCV HCC
18 75 M F3 A1 HCV + alcohol HCC
19 75 M F4 A2 HCV No
20 67 M F4 A1 HCV HCC
24
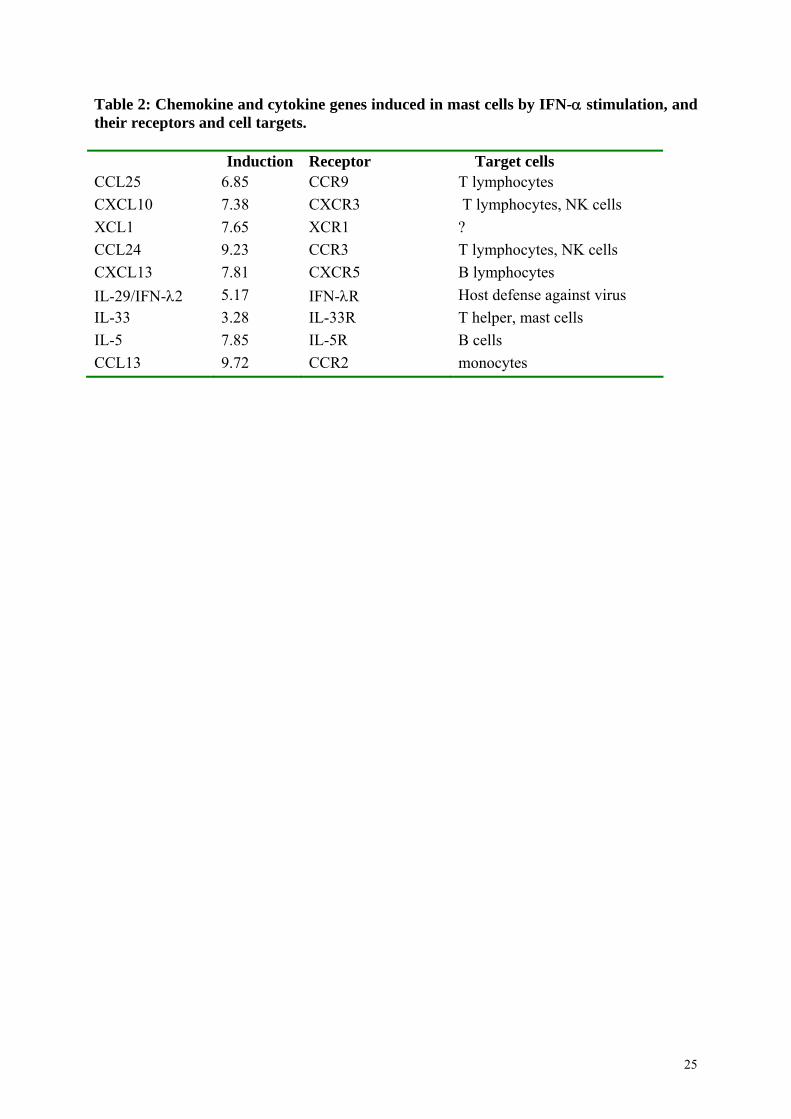
Table 2: Chemokine and cytokine genes induced in mast cells by IFN- stimulation, and their receptors and cell targets. Induction Receptor Target cells CCL25 6.85 CCR9 T lymphocytes
CXCL10 7.38 CXCR3 T lymphocytes, NK cells
XCL1 7.65 XCR1 ?
CCL24 9.23 CCR3 T lymphocytes, NK cells
CXCL13 7.81 CXCR5 B lymphocytes
IL-29/IFN-2 5.17 IFN-R Host defense against virus
IL-33 3.28 IL-33R T helper, mast cells
IL-5 7.85 IL-5R B cells
CCL13 9.72 CCR2 monocytes
25
Legends
Figure 1. Expression of HLA-G in HCV liver fibrosis. (A) Sirius red staining of collagen
accumulation and staining of hepatocyte modules with anti-hepatocyte antibodies in a
representative case. (B) 4H84 labeling is located in fibrosis septa and not in areas composed
of hepatocytes. (C) Comparison between 4H84 and MEM-G/1 staining. (D) Correlation
between HLA-G+ cell numbers and fibrosis area expressed in mm2 according to the
Spearman test (r=0.5017, p<0.05, n=20).
Figure 2. Pattern of HLA-G expression with morphological characteristics in human
HCV fibrosis liver (A) Representative Sirius red staining of collagen accumulation and
staining of hepatocyte modules with anti-hepatocyte Ab. (B) Representative
immunohistochemical analysis of HLA-G, CD3, CD163, CD117, and human mast cells in
fibrosis and hepatocyte areas. (C) Positive correlation between the number of HLA-G+ cells
and the number of mast cell according Spearman test (r=0.7083, p<0.01, n=20).
Figure 3. HLA-G+ liver cells identified as mast cells by double immunofluorescence. (A)
Double staining for CD117/HLA-G and CD117/human-mast cell tryptase was performed on
pairs of serial sections from paraffin-embedded liver blocks. The same double-positive cell
stained yellow, indicated by an arrow, is first identified within a region of double-positive
stained cells (at magnification 100 x and 400x) with CD117/HLA-G (labeled 1) and
CD117/human mast cell tryptase (labeled 2), (B) B1 and B2 at magnification 1000. Nuclei
were stained blue with Hoechst 33348; CD117 was identified by green fluorescence and
HLA-G or mast cells by red fluorescence; CD117 colocalized with HLA-G and CD117 also
colocalized with h-mast cells. Thus, HLA-G co-localized with h-mast cells.
Figure 4. Regulation of HLA-G expression by the human mast cell line HMC1.1
The control (CTRL) corresponding to the cell line before any stimulation is arbitrarily
assigned a value of 1. (A) Stimulation of HMC1.1 by various cytokines: IL-10, IL-33, IL-31,
IL-4, IL-6, TNF OSM, IL-1, IL-22. Results from at least three independent experiments
are presented. * Significant expression was noted (p<0.05). (B) Stimulation of HMC1.1 by
various interferons of the three classes: type I interferons IFN, the type II interferon
26
27
IFN-, and the type III interferons IFN-and IFN-2. Significant expression was noted
thus: p<0.05 = *, p<0.001 = **, p<0.0001=***. (C) Cluster analysis of cytokine gene
expression by HMC1.1 after various times of stimulation with IFN- (4h, 8h, 24h, and 48)
relative to the baseline value (0h) before addition of IFN- Panel C shows a false-color
heatmap of genes (y-axis) having an altered expression pattern after IFN- stimulation at the
time points given (x-axis). Genes are grouped into four clusters (termed I, II, III and IV)
according to their relative expression levels at different time points. Dendrogram plots based
on the hierarchical clustering of each individual group are displayed to the right. Briefly,
groupsand include genes upregulated after IFN- stimulation but differing according
to the time of increase, whereas group IV represents genes downregulated by IFN-
stimulation. The color scale bar to the bottom of the heatmap indicates log2-ratio
(blue=down-regulation, white=no change in expression, red=up-regulation).
![Reduced Expression of HLA Class I and II Antigens in Colon Cancer1 · [CANCER RESEARCH 50, 8023-8027, December 15, 1990] Reduced Expression of HLA Class I and II Antigens in Colon](https://img.pdfslide.us/doc/110x75/5f5945785c4df2481d781bbc/reduced-expression-of-hla-class-i-and-ii-antigens-in-colon-cancer1-cancer-research.jpg)