Embed Size (px)
Citation preview

Expression and regulation of the porin gene mspA of Mycobacterium smegmatis
Den Naturwissenschaftlichen Fakultäten
der Friedrich-Alexander-Universität Erlangen-Nürnberg
zur
Erlangung des Doktorgrades
vorgelegt von
Dietmar Hillmann aus Nürnberg

Als Dissertation genehmigt
von den Naturwissenschaftlichen Fakultäten
der Universität Erlangen-Nürnberg
Tag der mündlichen Prüfung: 15.12.2006
Vorsitzender der Promotionskommission: Prof. Dr. E. Bänsch
Erstberichterstatter: Prof. Dr. M. Niederweis
Zweitberichterstatter: Prof. Dr. A. Burkovski

Index
Index 1 Zusammenfassung / Summary 1
2 Introduction 2
2.1 The genus Mycobacterium 2 2.1.1 Taxonomy 2 2.1.2 The architecture of the mycobacterial cell wall 3
2.2 Porins: Structure and function in gram-negative bacteria 5 2.3 Mycobacterial porins 7 2.4 Porin regulation 10 2.5 Expression of mspA of M. smegmatis 12 2.6 Scope of the thesis 13
3 Results 14
3.1 Screening system to monitor mycobacterial promoter activity 14 3.2 Transcriptional mechanisms affecting mspA expression 18
3.2.1 Identification of the mspA promoter 18 3.2.2 A very long upstream DNA element is required for full activity of pmspA 22 3.2.3 Influence of translation initiation signals of pmspA on lacZ expression 24 3.2.4 Influence of a distal DNA element on pmspA activation 25 3.2.5 Alignment of the 5’ regions of mspA, mspB, mspC and mspD 27
3.3 Post-transcriptional mechanisms affecting mspA expression 28 3.3.1 Detection of an antisense RNA to the mspA transcript 28 3.3.2 Secondary structure of the 5’ UTR of mspA 31
3.4 pH dependent mspA expression 31 3.4.1 mspA expression is repressed at pH 4.5 31 3.4.2 The repression of mspA at pH 4.5 is a specific event 32 3.4.3 The regulation of mspA at pH 4.5 requires the original 5’ UTR 33 3.4.4 β-galactosidase based monitoring of pH dependent mspA expression 34
- i -

Index
4 Discussion 40
4.1 Transcriptional control of mspA expression 40 4.2 Transcriptional control of mspA, mspB, mspC and mspD 42 4.3 Post-transcriptional control of mspA expression 44
4.3.1 Stability of the mspA transcript 44 4.3.2 The 5’ end of the mspA transcript 44 4.3.3 The 3’ end of the mspA transcript 46 4.3.4 Initiation of translation 46 4.3.5 Detection of an antisense RNA to the mspA transcripts 47
4.4 Adaptation of mspA regulation to low pH 48 4.5 Conclusions and perspectives 50
5 Material and Methods 51
5.1 Material 51 5.1.1 Chemicals, equipment and biological material 51
5.2 Media, buffers and solutions 56 5.2.1 Media 56 5.2.2 Buffers and solutions 57
5.3 General methods 60 5.4 Growth of bacteria 60 5.5 Transformation of bacteria 61
5.5.1 Transformation of chemically competent E. coli 61 5.5.2 Electroporation of M. smegmatis 61
5.6 Methods for nucleic acid purification, modification and analysis 61 5.6.1 Plasmid purification 61 5.6.2 Preparation of chromosomal DNA from mycobacteria 61 5.6.3 Polymerase chain reaction (PCR) 62 5.6.4 Site-directed mutagenesis by combined polymerase chain reaction (CCR) 62 5.6.5 Phosphorylation of oligonucleotides 63 5.6.6 Primer annealing 63 5.6.7 Restriction and ligation 63 5.6.8 Construction of plasmids 63 5.6.9 RNA preparation 64 5.6.10 Primer extension 65 5.6.11 Northern blot analysis 65 5.6.12 Dot blot analysis 66
- ii -

Index
- iii -
5.6.13 RNA probe synthesis for Northern and dot blots 66 5.7 Extraction and analysis of proteins 66
5.7.1 Selective extraction of porins of M. smegmatis 66 5.7.2 Western blot analysis 66 5.7.3 Alkaline phosphatase activity measurement 67 5.7.4 β-galactosidase activity measurement 67
5.8 Computer analyses 68 5.8.1 GeSTer 68
6 References 69
7 Appendix 79
7.1 Use of phoA for pH dependent mspA expression 79
7.2 C2FDG as an alternate substrate for the β-galactosidase 80 7.3 MspA amounts during growth at pH 4.5 83 7.4 List of predicted transcriptional terminators of M. tuberculosis 83 7.5 Abbreviation index 85

Zusammenfassung
1 Zusammenfassung Aufgrund ihrer einzigartigen und lipidreichen Zellwand sind Mycobakterien resistent
gegenüber einer Vielzahl von Antibiotika. Die Diffusion hydrophiler Substanzen über diese
Permeabilitätsschranke erfolgt mit Hilfe wassergefüllter Kanalproteine, der so genannten
Porine. Die Anpassung an sich ändernde Umwelteinflüsse stellt einen Kompromiss zwischen
der Aufnahme von Nährstoffen und dem Ausschluss toxischer Substanzen dar und wird in
gram-negativen Bakterien durch ein komplexes Regulationsnetzwerk erzielt. Bisher war es
jedoch unklar, wie die Expression der Poringene in Mycobakterien reguliert wird. Im Rahmen
dieser Arbeit wurden transkriptionelle und post-transkriptionelle Mechanismen untersucht,
die für die Expression von mspA, des Hauptporins in Mycobacterium smegmatis,
verantwortlich sind. Die Verwendung eines Tandem-Terminators bestehend aus den aus
Escherichia coli und dem Bakteriophagen T4 stammenden Terminatoren ttrrnBT2 und ttT4g32
reduzierte die Hintergrundaktivität der lacZ Reporterplasmide in M. smegmatis 14-fach. Die
-10 Region des mspA Promotors wurde durch gezielte Punktmutationen in Verbindung mit
lacZ Reportergenfusionen 142 Basenpaare oberhalb von mspA ermittelt und als einziger
mspA Promotor identifiziert. 200 Basenpaare von Position -500 bis -700 erhöhten die
β-Galaktosidase Aktivität 12-fach und wurden für eine maximale Aktivierung des Promotors
benötigt. Die Insertion von 14 Basenpaaren an Position -500 führte zum Verlust dieser
Aktivierung und deutet auf eine Phasenverschiebung der DNA Helix und auf die spezifische
Bindung eines Aktivators hin. Transkripte, die antiparallel zur untranslatierten Region
oberhalb des mspA Gens sind, wurden mittels Northern Blots detektiert und repräsentieren
möglicherweise eine regulatorische, komplementäre RNA. Sequenzuntersuchungen des 5’
Endes der mspA mRNA deuten auf die Ausbildung einer Stammschlaufe hin. Diese trägt
möglicherweise zu der langen Halbwertszeit der mspA Transkripte von 6 Minuten bei,
vermutlich indem der Angriff von Ribonukleasen durch Ausbildung der Sekundärstruktur
verhindert wird. Northern und Dot Blot Analysen zeigten, dass die Menge der mspA
Transkripte mit sinkendem pH Wert abnahm und bei pH 4.5 nicht mehr detektiert werden
konnte. Episomale Fusionen von mspA mit konstitutiven Promotoren führten zu gleich
bleibenden Transkriptmengen, unabhängig vom pH Wert. Umgekehrt wurden keine lacZ
Transkripte unter der Kontrolle des mspA Promotors bei pH 4.5 nachgewiesen, was darauf
schließen lässt, dass der mspA Promotor spezifisch durch den pH Wert reguliert und dieser
Effekt durch die 5’ untranslatierte Region von mspA vermittelt wird. Die potentiell
komplementäre RNA wurde in gleicher Weise vom pH Wert reguliert wie mspA. Das deutet
auf Stabilisierung der mspA Transkripte oder Begünstigung der Ribosomenbindung durch die
RNA hin. Somit liefert diese Arbeit erste Erkenntnisse über die transkriptionelle und post-
transkriptionelle Regulation der Genexpression von Porinen in M. smegmatis.
- 1 -

Summary
1 Summary Mycobacteria possess a unique, lipid-rich cell envelope which strongly contributes to their
intrinsic resistance against many antibiotics. Hydrophilic compounds cross this permeability
barrier by diffusion through transmembrane channel proteins, the so called porins. The
balance of nutrient acquisition and blockade of toxic molecules is crucial for adaptation to
changing environmental conditions and in gram-negative bacteria it is achieved by a complex
network of regulatory circuits. However, it was unknown how expression of porin genes is
regulated in mycobacteria. In this study, transcriptional and post-transcriptional factors
controlling the expression of the major porin gene mspA of Mycobacterium smegmatis were
determined. Background transcription of the lacZ gene of the reporter plasmids in
M. smegmatis was reduced 14-fold by a tandem terminator consisting of ttrrnBT2 and ttT4g32 of
Escherichia coli and bacteriophage T4, respectively. The -10 region of the promoter of the
mspA gene was identified -142 base pairs upstream of mspA by single base pair
substitutions in a transcriptional fusion with the lacZ reporter gene. This promoter solely
drives transcription of mspA. A 200 base pair fragment at position -500 to -700 was required
for full activity of the promoter and induced transcription 12-fold as determined by
β-galactosidase activity. Activation was abolished upon insertion of 14 base pairs at position
-500 indicating phasing of the DNA helix and factor-dependent promoter activation.
Transcripts anti-parallel to the upstream untranslated region of mspA were detected in
Northern blots, suggesting the existence of an antisense RNA as a regulator of mspA
expression. Sequence analysis revealed a hairpin structure at the 5’ end of the mspA mRNA
that likely contributes to the high stability of the mspA transcripts with an average half-life of 6
minutes, probably by blocking access of ribonucleases. The amounts of mspA transcripts
were reduced by decreasing pH and were absent at pH 4.5 as detected by Northern and dot
blot analyses. Episomal fusions of mspA with constitutive promoters yielded the same
amounts of transcripts independent on the pH, whereas no mRNA was detected from lacZ
under the control of the mspA promoter at pH 4.5. These results demonstrated that the pH
sensitivity is specific for the mspA promoter and is mediated by the untranslated region
upstream of mspA. This mechanism can be exploited to subject other genes to pH
dependent regulation in fusion with the mspA promoter. The antisense RNA was regulated
by pH in the same manner as mspA. This indicated a stabilizing or activating role for the
antisense RNA by hybridizing to mspA transcripts and either inducing ribosome binding or
preventing RNA degradation. This work revealed first insights into both transcriptional and
post-transcriptional mechanisms of regulation of porin gene expression in M. smegmatis.
- 1 -

Introduction
2 Introduction
2.1 The genus Mycobacterium
2.1.1 Taxonomy Mycobacteria are aerophilic bacteria with a high G+C content of between 62 to 70%. The
bacteria are rod-shaped with uneven formed branched cells and show mostly rough colony
morphology. They are non-motile, non-sporulating organisms and are characterized by their
acid-fastness. Taxonomically, the genus Mycobacterium is a single genus in the family of
Mycobacteriaceae in the order Actinomycetales. Actinomycetes include the members of the
Corynebacterium, Mycobacterium and Nocardia (CMN) group and are the only micro-
organisms able to synthesize mycolic acids (Rastogi et al., 2001) but can be differentiated by
the number of carbon atoms. Mycobacteria possess mycolic acids with a chain length of up
to 90 carbon atoms (Barry et al., 1998), which are responsible for the acid-fastness of these
bacilli. Due to 16S ribosomal RNA sequence alignments, mycobacteria are counted to the
gram-positive branch of eubacteria (Pitulle et al., 1992). However, a genome-based
phylogeny brings mycobacteria in closer evolutionary neighborhood to gram-negative
bacteria (Fu & Fu-Liu, 2002). A close relation to gram-negative bacteria is further supported
by S12 ribosomal protein sequence analysis (Gupta, 1998). The currently known more than
110 species (Hartmans et al., 2004) are phylogeneticly separated in slow- and fast-growing
mycobacteria on the basis of 16S rRNA sequence comparisons (Rogall et al., 1990). The
fast-growing species with generation times of less than 5 hours are mostly non-pathogenic
and saprophytic soil or water dwellers such as Mycobacterium smegmatis, M. phlei or
M. chelonae. The majority of slow-growing strains is supposed to represent the most recently
evolved organisms of this genus (Pitulle et al., 1992). Slow-growing species have generation
times of 20 hours and longer and include many pathogens known to cause serious diseases
in mammals, especially tuberculosis (TB) by M. tuberculosis and leprosy by M. leprae.
2.1.2 Medical relevance of mycobacteria
Since long before their discovery and characterization in 1882 (Koch, 1882) mycobacteria
pose a major health burden to mankind. There were estimated 9 million incidences of TB in
2004 with two million people dying due to M. tuberculosis infections per year (WHO, 2006a).
Overall one-third of the world’s population is infected with M. tuberculosis and every second
one person gets newly infected (WHO, 2006b). However, infections often remain
- 2 -

Introduction
unrecognized as the bacilli are capable of adapting to prolonged periods of dormancy in
tissues (Honer zu Bentrup & Russell, 2001; Wayne, 1994), leading to an asymptomatic
infection, the so called latent disease (Gupta & Chatterji, 2005). The ability of tubercle bacilli
to lie dormant without any obvious symptoms encapsulated in granulomas in the host for
years (Russell, 2001) is likely based on the ability to shift down into a non-replicating state
(Wayne & Hayes, 1996). Individuals harboring latent M. tuberculosis have a 5 to 10 % risk to
develop active disease at some time during their life, when the immune system is perturbed
by ageing, malnutrition or other diseases (Gupta & Chatterji, 2005; WHO, 2006b). This risk
increases after the onset of AIDS (Parrish et al., 1998). Treatment of fully susceptible
bacteria lasts for six month with up to four different drugs (Espinal et al., 2000) but is
complicated by a raising number of multidrug-resistant (MDR) strains not responding to the
first-line antibiotics rifampicin and isoniazid. In 2004, 17283 verified cases of MDR-TB were
reported worldwide (WHO, 2006a). Furthermore, the emergence of extensively drug-resistant
strains (XDR-TB) being resistant against rifampicin, isoniazid and at least three classes of
second-line drugs raises concerns of a future epidemic of virtually untreatable TB (Wright et
al., 2006). The rise of MDR and XDR strains further limits the already very restricted choice
and efficiency of useful antibiotics, because mycobacteria are protected against the
environment by their unique outer membrane, forming a very efficient permeability barrier
and rendering them intrinsically resistant to a wide variety of antimicrobial agents (Brennan &
Nikaido, 1995).
2.1.2 The architecture of the mycobacterial cell wall
The affiliation of mycobacteria to gram-positive or -negative bacteria is discussed
controversial (Fu & Fu-Liu, 2002; Pitulle et al., 1992), but the architectural design of the cell
wall resembles gram-negative bacteria, consisting of an outer (OM) and an inner membrane
(IM) (Brennan & Nikaido, 1995; Minnikin, 1982). The IM consists of a phospholipid bilayer
mainly containing phosphatidylglycerol, diphosphatidylglycerol (cardiolipin), phosphatidyl-
ethanolamine, phosphatidylinositol and the phosphatidylmannoside family (PIMs) (Jackson et
al., 2000; Lee et al., 1996). The IM is followed by the mycolyl-arabinogalactan-peptidoglycan
complex (Brennan, 2003). A multi-layer of peptidoglycan (PG), a polysaccharide composed
of β-1,4-glucosidic linked N-acetylglucosamine and N-glycolylmuramic acid is attached to the
arabinogalactan (AG) via phosphodiester linkage (Dmitriev et al., 2000). The mycolic acids
are covalently bound to the PG-AG co-polymer and form the inner leaflet of the asymmetric
lipid bilayer of the OM (Niederweis, 2003). This covalent fusion results in lateral immobility of
the inner leaflet of the cell wall (Barry et al., 1998) and in a very restricted fluidity of the outer
- 3 -

Introduction
membrane (Nikaido, 1994). The mycolic acids are α-branched β-hydroxy fatty acids which
consist of up to 90 carbon atoms and are the longest fatty acids identified in nature (Barry et
al., 1998). They account for 30 to 40 % of the dry weight of the cell envelope (Rastogi et al.,
2001). The outer leaflet is composed of free lipids with different chain lengths to complement
the interstice left by the mycolic acids. The main lipids are the cord factor or
dimycolyltrehalose (TDM), phthiocerol dimycocerosates (DIMs/PDIMs), lipooligosaccharides,
phenolic glycolipids, glycerophospholipids, sulpholipids (SLs) and glycopeptidolipids
(Brennan, 2003; Ortalo-Magne et al., 1996). Interspersed in the OM are phosphatidylinositol
mannosides (PIMs) and lipoarabinomannans (LAMs). The latter are thought to be primarily
plasma membrane associated, account for up to 5 mg g-1 bacterial weight (Karakousis et al.,
2004), act as a virulence factor when capped with mannose (ManLAMs) and contribute to
M. tuberculosis phagocytosis and persistence (Brennan, 2003; Nigou et al., 2001).
Knowledge of the important role for some of these lipids in TB pathogenesis and evasion of
the host immune response is still emerging (Brennan, 2003). In the periplasm or embedded
in the OM are proteins and enzymes for cell wall synthesis, nutrient transport and waste
product disposal like mycolyltransferases, porins and transpeptidases. A schematic
representation of the main components and of the general architecture is depicted in
figure 2.1. This model is based on X-ray diffraction studies (Nikaido et al., 1993) and electron
spin resonance spectroscopy (Liu et al., 1995; Liu et al., 1996).
Fig. 2.1: Schematic re-presentation of the myco-bacterial cell envelope (Niederweis, 2003). The inner membrane (IM) consists of phospholipids (PL) and has an estimated thickness of 4 nm (Niederweis, 2003). The arabino-galactan (AG) – peptidoglycan (PG) co-polymer is located in the periplasm. The mycolic acids (MA) are covalently bound to this co-polymer and form the inner layer of the OM. This asymmetric lipid bilayer is completed by the extractable lipids (LI), which build the outer leaflet of the OM. The thickness of the outer membrane is estimated 5 to 10 nm due to electron microscopic images of mycobacterial cell envelopes (Brennan & Nikaido, 1995; Paul & Beveridge, 1993) which is in accordance to experimental data on the M. smegmatis porin A (Mahfoud et al., 2006). Small and hydrophilic compounds can cross the OM by diffusion through porins, hydrophobic can traverse the bilayer directly.
- 4 -
Introduction
The rigid character of the cell wall creates an efficient permeability barrier which protects
mycobacteria from environmental stress and limits access of many antibiotics. However, the
bacteria need to maintain an adequate nutrient supply. Whereas hydrophobic compounds
can traverse the OM directly across the lipid bilayer, hydrophilic molecules require a special
pathway. Transmembrane channels span the OM and provide water-filled pores for passive
diffusion of hydrophilic nutrients and waste products (Niederweis, 2003). They were firstly
described in 1976 (Nakae, 1976) and named porins.
2.2 Porins: Structure and function in gram-negative bacteria
Gram-negative species are characterized by the presence of two concentric lipid bilayer
membranes enclosing the periplasmic space. The OM is highly asymmetric: The inner leaflet
shows the same lipid composition as the IM, whereas the outer leaflet consists of
lipopolysaccharides (LPS) (Nikaido, 2003; Ruiz et al., 2006). Porins ensure the exchange of
hydrophilic compounds over the impermeable OM (Koebnik et al., 2000). They are ubiquitous
in gram-negative bacteria and can, depending on species and environmental conditions,
reach 104 to 106 copies per cell (Koebnik et al., 2000). Knowledge about porins emerged
since their initial characterization in 1976 (Nakae, 1976). The first crystal structure was
solved for a porin from Rhodobacter capsulatus (Weiss et al., 1991) followed by those of the
porins OmpF and PhoE of Escherichia coli (Cowan et al., 1992) (Fig. 2.2). In contrast to
other membrane proteins integral OM proteins do not consist of α-helices but of highly
organized anti-parallel β-sheets building β-barrels. This probably contributes to the transport
of the polypeptide chains over the IM, where they would become stuck if they were too
hydrophobic (Koebnik et al., 2000). The quaternary structure of porins is homo-trimeric,
constituting 3 channels per molecule (Fig. 2.2). Extensive contacts between the polypeptide
chains of the monomers provide for the high stability of the trimeric assembly (Delcour,
2003). OmpF, OmpC and PhoE of E. coli belong to the group of general porins with no
particular substrate specificity. OmpF builds moderately larger pores than OmpC. OmpF and
OmpC prefer cations slightly over anions whereas PhoE favours anions (Nikaido, 2003).
LamB or ScrY for example are specific porins for maltooligosaccharides or sucrose,
respectively (Gehring et al., 1991; Hardesty et al., 1991). The OM embedded β-barrel part of
the porins is conserved, whereas the variability in the connecting loops could be very high
(Nikaido, 2003). Based on these differences, porins can fulfill a wide variety of tasks. The
most prominent is to mediate nutrient uptake, but the extracellular loop structure is a
potential site for adhesion to other cells and an important antibody target. In pathogenic
- 5 -

Introduction
Fig. 2.2: Structure of the OmpF porin of E. coli. A: Side view of a schematic model of an OmpF monomer, which consists of a 16-stranded anti-parallel β-barrel. B: Side view of a solid ribbon model of an OmpF trimer, forming an unspecific water-filled diffusion channel. Each monomer is depicted in a different color. The β-barrels would be enclosed horizontally in the OM. C: Top view of a solid ribbon model of an OmpF trimer. Interactions between the different colored monomers occur in direct neighborhood to each other
A
B C
bacteria variation of external loops results in evasion of a host immune response and porin
expression is modulated in response to the presence of bactericidal compounds (Denyer &
Maillard, 2002). Therefore, porins play a significant role as pathogenesis effectors and
virulence factors. A strain of Shigella flexneri, which causes bacillary dysentery, with a
deletion of ompB or ompC was severely impaired in its virulence, especially in its ability to
spread from cell to cell and to induce killing of epithelial cells (Bernardini et al., 1993).
Neisseria meningitides and N. gonorrhoeae are responsible for bacterial meningitis,
septicemia and the sexually transmitted gonorrhoeae. NspA of N. meningitides is discussed
for its vaccine potential (Vandeputte-Rutten et al., 2003). Whereas the gonococcal porin
subtype PorB1B was reported to interact with HeLa cells and to induce apoptosis, the
meningococcal PorB delivered protection against apoptosis and did not elicit a toxic
response from human or murine cells (Massari et al., 2003; Muller et al., 1999). However, a
common interaction of the PorB family with the mitochondrial voltage-dependent anionic
channel (VADC) was demonstrated. Also the N. gonorrhoeae porin PorB1A contributes to
increased invasiveness and improved survival against human serum (Massari et al., 2003).
Porins from the opportunistic pathogen Pseudomonas aeruginosa were reported to induce
apoptosis in epithelial cells, to damage the human spermatozoa and to provoke reduced - 6 -

Introduction
fertility or sterility (Buommino et al., 1999). Incubation of human lymphomonocytes with
porins from Helicobacter pylori or Yersinia enterocolitica affected the cytokine production in
vitro and modulated the range of inflammatory to immunological responses (Tufano et al.,
1994a; Tufano et al., 1994b). The impact of Salmonella spp. porins on infection and progress
of the diseases salmonellosis or typhoid fever is documented for all stages of pathogenesis.
OmpC and OmpD of S. enterica serovar Typhimurium is involved in initial host-cell
recognition by macrophages (Mφ) (Negm & Pistole, 1998; Negm & Pistole, 1999) and both
ΔompC/ΔompF and ΔompS1/ΔompS2 mutant strains are attenuated for their virulence in
mice (Negm & Pistole, 1999; Rodriguez-Morales et al., 2006). Furthermore, Salmonella
porins induce cellular activation (Galdiero et al., 2003b), a sustained long-term antibody
response (Secundino et al., 2006), cytokine release and the activation of protein kinases A
and C (Galdiero et al., 2003a). The nucleoside specific porin TsX from S. enterica serovar
Typhi is suggested to participate in membrane assembly (Bucarey et al., 2005). The function
of the outer membrane protein OmpA of E. coli as a porin remains unclear. The channel
forming ability of OmpA in lipid bilayer systems in vitro was repeatedly confirmed (Nikaido,
2003). However, OmpA does not contribute significantly to the overall permeability of the OM
of E. coli in vivo (Bavoil et al., 1977; Nikaido et al., 1977). The existence of interconvertible
OmpA conformers with a majority of closed and a minority of opened channels is discussed
(Nikaido, 2003; Zakharian & Reusch, 2003). The role of OmpA in terms of resistance to
environmental stress, stability and integrity of the OM (Wang, 2002), virulence, pathogenicity
(Weiser & Gotschlich, 1991), conjugation (Zakharian & Reusch, 2003) and attachment,
phagocytosis and survival within Mφ (Sukumaran et al., 2003) was elucidated.
2.3 Mycobacterial porins
Although classified as gram-positive bacteria, the OM of the mycolata, a group of
actinomycetes characterized by their OM consisting of mycolic acids and free lipids, is
functionally analogous to the OM of gram-negative bacteria. Since this OM builds an efficient
permeability barrier, it is not surprising that porins occur all over this group. Porins were
discovered in species of Nocardia, Mycobacterium, Corynebacterium, Rhodococcus and
Tsukamurellae (Dörner et al., 2004; Nikaido, 2003). The existence of porins in mycobacteria
was postulated in 1990 (Jarlier & Nikaido, 1990). The first mycobacterial porin was isolated
two years later from M. chelonae (Trias et al., 1992), a 59 kDa protein with a single channel
conductance of 2.7 nS in 1 M KCl in lipid bilayer measurements. Similar, the existence of
porins of M. tuberculosis and M. bovis BCG was discovered. Detergent solubilized cell wall
proteins formed channels in lipid bilayer experiments with conductances of 0.7 and 3 nS with
- 7 -

Introduction
an apparent molecular weight of 15 and >60 kDa, respectively, in M. tuberculosis (Kartmann
et al., 1999) and two channels with 0.8 and 4 nS single channel conductance in the
genetically almost identical M. bovis BCG (Lichtinger et al., 1999). Due to low porin amounts,
the proteins and corresponding genes were not characterized to date. Sequence homology
led to the isolation of OmpATb of M. tuberculosis, a protein with significant homology to the
OmpA family of gram-negative bacteria with a molecular weight of 38 kDa (Senaratne et al.,
1998). In E. coli heterologous expressed and purified recombinant protein exhibited channel
forming activity in lipid bilayer experiments only when it was expressed with its putative
signal peptide. Deletion of ompATb demonstrated the importance of OmpATb for the
adaptation to low pH and for survival in Mφ and mice (Raynaud et al., 2002). Most OmpATb
channels are closed upon acidification, whereas its expression is upregulated (Molle et al.,
2006), probably physiologically triggered by low pH encountered in Mφ during infection
(Deretic & Fratti, 1999). However, the uptake of serine was just marginally reduced in the
ΔompATb strain at pH 7.2 compared to the wild-type. Thus, pore-forming activity of OmpATb
is strongly dependent on the pH and it seems not to be a major porin under neutral
conditions. Despite differences in voltage dependent behaviour (Molle et al., 2006), this is
consistent with the hypothesis of E. coli OmpA existing in different conformations just forming
an open pore complex under special conditions (Nikaido, 2003). Extensively studied are the
porins of M. smegmatis. Channel forming ability with a conductance of 4.6 nS was
determined from crude cell wall extracts from M. smegmatis (Trias & Benz, 1994). The
encoding gene was determined by N-terminal sequencing of the obtained protein, which was
purified from CHCl3/MeOH extracts of whole cells, and named mspA (M. smegmatis porin A)
(Niederweis et al., 1999). Expression and purification of MspA yielded an inactive 20 kDa
monomer and a channel forming 100 kDa oligomer. The length of one mature monomer is
184 amino acids whereas a 27 amino acids long N-terminal signal peptide is cleaved off after
the transport over the IM. In contrast to porins of gram-negative bacteria, MspA constitutes
only one central pore with a diameter of 48 Å converging to 10 Å and an outer diameter of
about 9 nm (Faller et al., 2004). Electron microscopy detected a 15-fold lower porin density in
the cell wall of M. smegmatis than in gram-negative bacteria (Fig. 2.3A). This is one of the
reasons for the 50,000-fold lower permeability of the cell wall of M. smegmatis for glucose
compared to E. coli (Engelhardt et al., 2002). The stability of the MspA oligomer towards
temperature, organic solvents and pH is unsurpassed by any other porin known to date
(Heinz et al., 2003). The crystal structure of MspA revealed an octameric structure
resembling a goblet divided into a rim at the top, a β-barrel stem in the middle and a base at
the bottom (Fig. 2.3) (Faller et al., 2004). Thus MspA is the prototype of a novel and unique
class of porins. To determine its in vivo functions a ΔmspA mutant strain was constructed.
- 8 -

Introduction
Fig. 2.3: MspA of M. smegmatis. A: Electron microscopy of an isolated cell wall fragment of M. smegmatis SMR5, negatively stained with uranyl acetate. Cell wall pores are stain-filled and appear as black dots surrounded by a bright ring indicating the pore protein. The upper inset depicts an enlarged single pore, the lower represents a magnified area of 50 nm2. Scale bar is 100 nm, pictures were taken from (Engelhardt et al., 2002). B and C show solid ribbon plots of a mature octameric MspA, every monomer in a different color. B: Side view of MspA, which would be surrounded horizontally by the OM. The upside is extracellular, the downside ends in the periplasm. The goblet consists of a thick rim at the top, a β-barrell forms the stem in the middle and the base at the bottom contains the periplasmic loops. C: Top view of MspA. The single channel is constituted in the middle of the octamer.
A
B C
Cell wall extracts of this mutant contained lower amounts of porins than the wild-type
(Stephan et al., 2005) and thus had a decreased channel activity in lipid bilayer experiments.
Furthermore, the uptake of glucose and cephaloridine was reduced four- and nine-fold
respectively (Stahl et al., 2001), and the growth was slowed down as reflected by an
increase of the generation time in 7H9 medium from 3.3 to 4.3 hours (Stephan et al., 2005),
indicating that MspA is the major porin of M. smegmatis. MspA has three paralogues in
M. smegmatis, named MspB, MspC and MspD and differing from the mature MspA protein in
only 2, 4 and 18 amino acids, respectively. Their expression and functionality as porins was
demonstrated recently, whereas mspB and mspD seem to act as backup porins for their
expression is activated upon deletion of mspA and mspC (Stephan et al., 2005). Consecutive
deletions of the corresponding porin genes decreased the permeability of the cell wall and
increased the resistance towards hydrophilic antibiotics (Stephan et al., 2004b; Stephan et
al., 2004c; Stephan et al., 2005). Furthermore, sequence comparisons with mspA identified
one orthologue in M. chelonae and four in M. phlei (Niederweis, 2003).
- 9 -

Introduction
2.4 Porin regulation Since porins are involved in protection, transport and virulence and represent the main
determinants of the OM permeability to hydrophilic solutes, the regulation of porin expression
and activity is of utmost importance. Several studies confirmed mechanisms where porins
were modified or the porin pathway was blocked. In E. coli the synthesis and excretion of
polyamines led to specific porin inhibition and increased the ability to survive acid stress
(Samartzidou et al., 2003). Low pH altered the channel sizes of OmpF and OmpC (Todt &
McGroarty, 1992) and stabilized a closed state of OmpC in a voltage dependent manner (Liu
& Delcour, 1998). This voltage-induced conformational modulation of porins was
demonstrated also for OmpF and PhoE (Delcour, 2003). Its physiological relevance as well
as its molecular mechanism remains to be established. Whereas these effects may trigger an
immediate response, bacteria can adopt to changing environmental conditions they are
facing inside or outside mammalian hosts by modifying porin gene expression (Achouak et
al., 2001). One example is Vibrio cholerae, where expression of the general porins OmpU
and OmpT is regulated by the transmembrane transcriptional activator ToxR (Provenzano &
Klose, 2000). Based on distinct channel properties of OmpT and OmpU (Simonet et al.,
2003) the bile induced down-regulation of OmpT (Wibbenmeyer et al., 2002) results in an
increased resistance to antimicrobial agents during growth in the human intestine (Mathur &
Waldor, 2004). Moreover, the ompU paralogue vca1008 is up-regulated by an unsolved
mechanism upon infection and is required for virulence in the mouse model (Osorio et al.,
2004).
The best established model exists for E. coli, where the factors influencing porin expression
are manifold. Porin regulation was observed to depend on medium osmolarity (Mizuno &
Mizushima, 1990), nutrient supply (Liu & Ferenci, 1998), temperature (Delihas & Forst,
2001), pH (Heyde et al., 2000; Sato et al., 2000; Thomas & Booth, 1992), oxidative stress,
growth phase and the presence of toxic compounds (Pratt et al., 1996). Expression of ompC
and ompF is regulated on transcriptional level by the 2-component-regulatory systems EnvZ-
OmpR and CpxA-CpxR. The sensor kinases EnvZ and CpxA monitor outside conditions and
phosphorylate the corresponding response regulators OmpR and CpxR, acting as
transcriptional activators of the porin genes (Batchelor et al., 2005; Heyde et al., 2000). The
EnvZ-OmpR system was reported to mainly react on medium osmolarity and affects the
expression of ompC and ompF divergently by the amounts of phosphorylated OmpR,
however the total number of porins is maintained (Pratt et al., 1996). Furthermore, OmpR
was reported to be phosphorylated dependent on levels of acetyl phosphate (AcP) or by
alternative histidine kinases (Liu & Ferenci, 2001). The mechanisms of the repression of
ompF by the sigma factor RpoS (σS), the general porin repression by σE (Batchelor et al.,
- 10 -

Introduction
Fig. 2.4: Regulatory network of ompC and ompF expression in E. coli. Depicted are the major regulatory pathways depending on different environmental stimuli (dotted arrows). Transcriptional regulation occurs via EnvZ and CpxA phosphorylating OmpR and CpxR (encircled P), respectively. Post-transcriptional control includes the antisense RNAs IpeX, MicF, MicC, RseX and RyhB. Factors and conditions regulating antisense RNA expression are depicted. Repression or activation is indicated by encircled – or +, respectively, and corresponding solid arrows aim on the relevant targets. Genes are presented as filled arrows with gene abbreviations, proteins are either ovals, rounded rectangles or barrels with their annotated names, a question mark indicates a hypothesis. OM: outer membrane; P: periplasm; IM: inner membrane; C: cytoplasma. For citations please refer to the text.
2005) and the strong influence of cAMP on ompF and ompC expression during nitrogen or
carbon limitation (Liu & Ferenci, 2001) are still unknown. Involved in the EnvZ-OmpR
pathway is also the integration host factor (IHF), able to bind and bend DNA and being
responsible for formation of a repressive DNA loop, therefore inhibiting ompF transcription in
media of high osmolarity (Pratt et al., 1996). Furthermore, ompC and ompF expression is
regulated post-transcriptionally by a complex inventory of non-coding antisense RNAs (Storz
et al., 2004). MicF and MicC are partially complementary to the 5’ untranslated regions
(UTR) of their cognate ompF and ompC transcripts and upon binding inhibit translation
initiation followed by mRNA degradation (Chen et al., 2004; Delihas & Forst, 2001).
Transcription of the 93 nucelotides long micF is activated by increased temperature and by
- 11 -

Introduction
MarA, SoxS and Rob which are induced by weak acids, oxidative stress and cationic peptide
antibiotics, respectively (Delihas & Forst, 2001). Expression of micF is inhibited by the
histone-like protein H-NS, by the global starvation regulator Lrp and its transcript is
destabilized by the RNA chaperone StpA (Deighan et al., 2000). Expression of the 109
nucleotides long micC occurs in an opposite manner to micF, resulting in the divergent
regulation of ompC and ompF expression (Chen et al., 2004). Recently, the antisense RNAs
RseX, RyhB and IpeX were discovered to repress expression of ompC or of both ompC and
ompF, respectively (Castillo-Keller et al., 2006; Douchin et al., 2006; Guillier et al., 2006). As
described for most antisense RNAs (Wassarman, 2002; Zhang et al., 2003), Hfq is required
for their activity except IpeX (Castillo-Keller et al., 2006). The conservation of micF and micC
antisense regulation in Serratia marcescens, Klebsiella pneumoniae and Salmonella strains
underlines the importance of this mechanism for adapting to a changing environment (Begic
& Worobec, 2006; Delihas & Forst, 2001). Furthermore, the antisense RNAs OmrA an OmrB
were discovered to play a role in auto-regulation of EnvZ and OmpR and to negatively
regulate expression of several outer membrane proteins (Guillier & Gottesman, 2006).
2.5 Expression of mspA of M. smegmatis
Earlier studies revealed first insights in the expression mechanisms of mspA of
M. smegmatis. Primer extension analyses revealed two transcriptional start points (TSP) in
the 5’ upstream sequence of mspA (Thiel, 1999). One strong signal for G at the position -135
bp upstream of mspA, one weak signal for G at position -153 bp. Corresponding potential
promoters were identified, but not yet characterized (Thiel, 1999). The dependence of mspA
expression on environmental factors was investigated with Northern blot analyses. Amounts
of mspA transcripts were elevated under nitrogen limitation, while carbon and phosphate
limitation decreased mspA levels (Kaps, 2004). Growth at 28°C did not result in an altered
mspA expression, however heat shock conditions at 42°C repressed the mspA expression
more than 10-fold. 1.4-fold, 4-fold and 50-fold repression occurred in the presence of 10%
glucose, 18 mM hydrogen peroxide and 0.5 M sodium chloride, respectively. No mspA
mRNA was detectable when M. smegmatis was exposed to 10% ethanole or growing in a
lowered medium pH of 3 (Kaps, 2004). Thus, the expression of the mycobacterial porin
mspA is affected by environmental conditions as known from gram-negative bacteria as
E. coli. The mechanism of porin regulation is unknown for M. smegmatis and for
mycobacteria in general.
- 12 -

Introduction
2.6 Scope of the thesis
This work focused on the expression of mspA of M. smegmatis. Cis-elements necessary for
transcription should be identified and characterized, including potential promoters and
regulatory sequences. Furthermore, trans-acting regulatory elements such as activators or
repressors should be elucidated and the pathways responsible for regulation of gene
expression on transcriptional and post-transcriptional level should be determined. To
investigate specific regulatory events of mspA expression, pH dependent repression should
be exploited and analyzed.
- 13 -

Results
3 Results
3.1 Screening system to monitor mycobacterial promoter activity To evaluate the expression of the porin gene mspA and its regulation, mspA promoter
fragments were fused to the reporter gene lacZ of E. coli. This is a widely-used tool to
monitor gene expression in mycobacteria (Rowland et al., 1999; Timm et al., 1994b). The
plasmid pMlacZsd (Table 5.8) contains a promoterless lacZ reporter gene encoding for the
β-galactosidase with an optimized Shine-Dalgarno (SD) sequence (AAGGAGA) (Kempsell et
al., 1992) and is the origin of a series of lacZ expression vectors with mspA promoter
fragments (Table 5.8, fig. 3.11). The transcriptional terminator ttrrnBT2 of E. coli is located
upstream of lacZ to eliminate background activity (Kaps et al., 2001; Steward & Linn, 1992).
This system should be established for both screening on plates with X-gal (5-bromo-4-chloro-
3-indolyl-β-D-galactopyranoside) as substrate and quantification of β-galactosidase activity of
liquid cultures with ONPG (2-Nitrophenyl β-D-galactopyranoside). However, M. smegmatis
SMR5 containing the plasmid pMlacZsd with a promoterless lacZ revealed a high
background activity on 7H10 plates with 40 µg ml-1 X-gal without defined promoter (Fig. 3.1,
Table 5.8). This residual read-through was detected probably due to the presence of cryptic
promoters in the ORIs, as observed earlier (Mulder et al., 1999; Stolt et al., 1999). To reduce
this promoter activity, three transcriptional terminators (tt) were constructed. The functionality
of ttT4g32 for mycobacteria was proven before (Dellagostin et al., 1999; Timm et al., 1994a)
and it was inserted between ttrrnBT2 and the lacZ gene. Additionally, the annotated genome of
M. tuberculosis H37Rv was scanned for putative terminators with the GeSTer algorithm
(Unniraman et al., 2001), to identify novel potential transcriptional terminators (Ch. 5.8.1,
Fig. 3.1: Plate screening for the presence of promoters due to β-galactosidase activity. M. smegmatis SMR5 with the plasmids pMlacZsd (promoterless lacZ), pML159 (pimyc-lacZ), pML160 (pmspA500 bp-lacZ), pML161 (pwmyc-lacZ) or pMS2 (without lacZ) was streaked on 7H10 plates containing 40 µg ml-1 X-gal. The plate was incubated for 3 days at 37°C.
- 14 -

Results
table 7.1). The use of this algorithm was based on the observations that transcription
termination in mycobacteria does not necessarily require a U-stretch when the stem length
exceeds 27 bp, and that tandem stem loops increase the termination efficiency (Unniraman
et al., 2001). The potential terminators ttnrdB and ttrv1324 with stem lengths of 30 and 28 bp,
respectively, were among the most stable hairpins identified in the genome of M. tuberculosis
by GeSTer (Fig. 3.2, table 7.1). The termination efficiency of these terminators was
determined for plasmids pML163 (ttrrnBT2 + ttT4g32), pML165 (ttrv1324 + ttnrdB) and pML169
(ttrv1324) as residual β-galactosidase activity compared to pMlacZsd with ttrrnBT2 (Ch. 5.7.3).
The single terminator ttrv1324 had a lower read-through of 76% (Fig. 3.4A). The tandem
construct with ttrv1324 and ttnrdB reduced the residual activity to 37%. However, the highest
termination efficiency was delivered by the tandem of ttrrnBT2 and ttT4g32 with a read-through of
7%, i.e. a 14-fold reduction compared to pMlacZsd (Fig. 3.4A). With respect to further cloning
purposes, a PacI restriction site was introduced during construction of pML169. Since this
restriction site consists of the motif TTAATTAA and resembles therefore a -10 sequence of a
promoter, it was deleted in order to avoid intrinsic promoter activity (Fig. 3.3). Deletion of the
PacI restriction site yielded pML800 (Ch. 5.6.8) and caused 50% less read-through
compared to the otherwise identical pML169 with ttrv1324 (Fig. 3.4B). Nevertheless, the
termination efficiency of ttrrnBT2 + ttT4g32 was twice as high as of ttrv1324 ΔPacI with overall about
84% reduction of the background activity (Fig. 3.4B). In conclusion, the most efficient
construct for M. smegmatis was the tandem transcriptional terminator ttrrnBT2 + ttT4g32.
Therefore, this construct was used upstream of all lacZ constructs all throughout this
C
A
A
U - A
U - A
A - UA - U
A - UA - UA - UA - U
A - U
A - U
A - U
GCG
G - C
G - C
G - C
G - C
G - C
G - CG - C
GC
C - GC - GC - G
C - G
C - G
C - G
C - G
C - G
C - GC - G
CUCGGCCUAGGC - GGGAACGCUAG
C
A
A
U - A
U - A
A - UA - U
A - UA - UA - UA - U
A - U
A - U
A - U
GCG
G - C
G - C
G - C
G - C
G - C
G - CG - C
GC
C - GC - GC - G
C - G
C - G
C - G
C - G
C - G
C - GC - G
CUCGGCCUAGGC - GGGAACGCUAG AGGCCGGCUGG - CGCUGGGCGGCC - G
U - A
U - A
A - U
A
A - UA - UA - U
A - UA - U
A - U
A - U
A - U
G
G - C
G - C
G - C
G - C
G - C
G - C
CC
C - GC - GC - G
C - GC - G
C - G
C - G
C - G
C - G
AGGCCGGCUGG - CGCUGGGCGGCC - G
U - A
U - A
A - U
A
A - UA - UA - U
A - UA - U
A - U
A - U
A - U
G
G - C
G - C
G - C
G - C
G - C
G - C
CC
C - GC - GC - G
C - GC - G
C - G
C - G
C - G
C - G
B CA
AAGCAGA - UUUUGCGUUUAAUA
G - C
C
A - U
A - U
A
U - A
U
G - C
G
C - G
C - G
C - G
C - G
AAGCAGA - UUUUGCGUUUAAUA
G - C
C
A - U
A - U
A
U - A
U
G - C
G
C - G
C - G
C - G
C - G
G
AAUUAAUUG - CUUUUUUA
G - CG - CG - C
CCC - GC - G
U
A - U
A G
AAUUAAUUG - CUUUUUUA
G - CG - CG - C
CCC - GC - G
U
A - U
AD Fig. 3.2: Transcriptional terminators. A: ttrrnBT2 with a 10 bp stem loop and a U-trail characteristic for intrinsic terminators of transcription. B: ttnrdB with a 30 bp stem loop, no U-stretch and a folding energy of ∆G = -60.64 kcal mol-1. C: ttrv1324 with a 28 bp stem loop, no U-trail and a folding energy of ∆G = -57.98 kcal mol-1. D: ttT4g32 with a 7 bp stem loop followed by a U-trail.
- 15 -

Results
Fig. 3.3: Alignment of the transcriptional terminators upstream of the lacZ gene. Plasmid names and terminators (stem loops are underlined) are indicated on the right, the lacZ gene start is marked in light grey and restriction sites are indicated as grey boxes with corresponding enzymes. The construction is described in chapter 5.6.8.
Fig. 3.4: β-galactosidase activity describes residual read-through of transcriptional terminators. The activity of the β-galactosidase expressed of M. smegmatis SMR5 harboring different plasmids, was measured, calculated and is depicted in Miller units (MU). The β-galactosidase was expressed from the following plasmids from the left to the right: A: pMlacZsd (ttrrnBT2), pML163 (ttrrnBT2 + ttT4g32), pML169 (ttrv1324) or pML165 (ttrv1324 + ttnrdB). B: pMlacZsd (ttrrnBT2), pML163 (ttrrnBT2 + ttT4g32), pML169 (ttrv1324), or pML800 (ttrv1324 with a deleted PacI restriction site). Miller units generated by pMlacZsd were taken as 100% and all others were set in relation. The
bars represent a mean of three independent measurements, the error bars the standard deviation.
- 16 -

Results
study and pML163 was used as the standard reference ‘lacZ without promoter’. Furthermore,
A
pA
pML163 was the origin for all following promoter constructs (Ch. 5.6.8). However,
M. smegmatis SMR5 containing pML163 still formed blue colonies on plates consisting of
7H10 medium with the β-galactosidase substrate X-gal in a concentration of 40 µg ml-1.
Thus, the screening for active promoter fragments was hampered. To determine the optimal
X-gal concentration for differentiation between strong and weak transcription, the color of
colonies from mixed cultures of M. smegmatis SMR5 with pML163 (promoterless lacZ) or
pML167 (pmsp 1100 bp-lacZ) on 7H10 plates with X-gal concentrations ranging from 5 to
35 µg ml-1 was examined (Ch. 5.4). The optimal differentiation between active promoters and
promoterless constructs was obtained at an X-gal concentration of 20 µg ml-1 (Fig. 3.5). The
cells with plasmids encoding lacZ under the control of pms 1100 bp were easily distinguished
from the cells harboring plasmids with a promoterless lacZ gene. However, 7H10 plates with
a pH adjusted to 5 or below decreased the growth rate of M. smegmatis SMR5 significantly,
so that no colonies were detectable before the plates dried out. Thus, plate screening was
inappropriate to monitor mspA promoter activity and regulation at low pH.
Fig. 3.5: Optimal concentration of X-gal in 7H10 solid medium for differentiation of promoter strength.
M. smegmatis SMR5 with pML163 (promoterless lacZ) or pML167 (pmspA1100 bp-lacZ) was grown, mixed and approximately 200 CFUs were plated on 7H10 solid medium containing X-gal in a range of 5 to 35 µg ml-1. Blue and white colonies correlate with high and low activity of β-galactosidase, respectively.
- 17 -

Results
3.2 Transcriptional mechanisms affecting mspA expression
3.2.1 Identification of the mspA promoter The 5’ UTR of mspA was initially investigated by Anja Thiel (Thiel, 1999). Primer extension
analyses and nuclease S1 mapping revealed two potential transcriptional start sites (TSPs)
with a strong signal for G at position -135 and a weak signal for G at position -153 (Fig. 3.6).
Transcription from the TSP at position -135 was maintained under conditions of changing
temperature and osmolarity, but strongly decreased during stationary growth phase, whereas
no conditions are known to affect the weak signal for position -153. In addition to the above
listed influences, it should be determined whether variations in the pH may induce alternate
promoters and therefore reveal other TSPs. RNA was prepared from M. smegmatis SMR5
(5.6.9) after growth at pH 4.5, 5.5 and 6.8 (Ch. 5.4) and primer extension analysis was
performed using the primer MP-PE2 (Table 5.6, ch. 5.6.10). At a pH of 6.8, the TSP was
located at position G -135 (Fig. 3.7A) as observed earlier (Thiel, 1999). A reduced pH
resulted in the same TSP at pH 5.5 and in the absence of any signal at pH 4.5. This result
Fig. 3.6: Chromosomal region of mspA in M. smegmatis. The location of mspA on the chromosome. Annotations are: msmeg0951 (transcriptional regulator of the TetR family), msmeg0958 (cytochrome P450), hemL (glutamate-1-semialdehyde-2,1-aminomutase). Other genes represent open reading frames of unknown function (Stephan et al., 2005). The region -450 to +22 relative to the mspA start codon is magnified. The large arrow depicts the mspA gene with the potential start codon ATG. It should be noted that the start codon of mspA has not been experimentally verified. The putative Shine-Dalgarno sequence (SD) is boxed. The asterisks mark the transcription start points (TSP) as determined by primer extension and S1 mapping experiments (Thiel, 1999). The bold letter with an asterisk indicates the main TSP. Bold underlined letters denote the potential -10 region of the mspA promoter, regular underlined letters represent the potential -35 region of the mspA promoter. Italic and underlined letters indicate palindromes which may act as potential binding sites for regulatory proteins. Italic but not underlined letters represent mismatches in the palindromes.
- 18 -

Results
confirmed that amounts of mspA transcripts correlate with decreasing pH (Kaps, 2004), and
that no alternate mspA promoters are utilized under these conditions. Additional to the
identified TSPs, the region further upstream of the area analyzed in figure 3.6 was
investigated for additional TSPs left unconsidered in earlier experiments. RNA was prepared
from M. smegmatis SMR5 (Ch. 5.6.9) after growth in 7H9 medium (Ch. 5.4) and primer
extension analysis was performed using the primer lacZPE2 (Table 5.6, ch. 5.6.10). No
signals were detected in the region upstream of lacZPE2, so no further TSPs in the region
above 400 bp upstream of mspA were identified (Fig. 3.7B), indicating the absence of
alternate mspA promoters under these conditions.
- 19 -

Results
Fig. 3.7: Primer extension analyses to determine start points of mspA transcription. The sequencing of the plasmid pPOR6 (resulting in A, C, T, G) was carried out with the primers MP-PE2 (A) and lacZ-PE2 (B). The same oligonucleotides were used for the primer extension reaction with RNA preüared from M. smegmatis SMR5 grown A: at pH 4.5 (PE pH 4.5), 5.5 (PE pH 5.5) or 6.8 (PE pH 6.8) or B: under standard conditions (PE). Highlighted areas depict the region around the TSP at position -135 (A), marked by an asterisk, and the area 14 bp upstream of lacZ-PE2 i.e. 413 bp upstream of mspA (B).
- 20 -

Results
Fig. 3.8: Overview of point mutations introduced in the potential -10 promoter region of mspA. Plasmid pML167 contains the original promoter sequence, point mutations introduced in pML820 to pML822 are highlighted with an asterisk. The putative -10 region of the mspA promoter is underlined and in bold. Position numbers refer to the gene start of mspA.
A search within the 5’ UTR of mspA upstream of the TSPs for sequences similar to the
consensus sequence of promoters of M. smegmatis (T 100%, A 93%, T 50%, A 57%, A 43%,
T 71%, (Mulder et al., 1997)) revealed a potential -10 promoter sequence TATGTT 6 bp
upstream of the main TSP (Fig. 3.6). In agreement with the weak TSP, a promoter with poor
similarity was identified further upstream. To examine the promoter activities of these
sequences, reporter gene fusions of lacZ and an 1100 bp promoter fragment of mspA were
constructed (Ch. 5.6.8). The plasmid pML167 carried the original upstream sequence of
mspA, whereas pML820, pML821 and pML822 harbored the same fragment with point
mutations at the highest conserved positions T1, A2 and T6 (-147, -146 and -142 relative to
the mspA start codon), respectively (Ch. 5.6.8, fig. 3.8). The β-galactosidase activity of
M. smegmatis SMR5 cultures transformed with these plasmids was measured (Ch. 5.7.4).
The substitutions T1C and T6C reduced the β-galactosidase activity more than 30-fold,
whereas A2C completely eliminated β-galactosidase activity (Fig. 3.9). This correlates with
the strong signal for the TSP at -135 and demonstrates that this promoter solely initiates
mspA transcription under these conditions, since no residual activity was detected. This
confirms the absence of other promoters observed in primer extension experiments.
Fig. 3.9: Mutational analysis of the mspA promoter. The β-galactosidase activity of M. smegmatis SMR5 containing plasmids harboring lacZ fusions with different mspA promoter fragments was measured and is indicated in Miller units (MU). All plasmids contained an 1100 bp pmspA fragment. T1C (pML820), A2C (pML821) and T6C (pML822) carried mutations at the corresponding positions of the potential -10 promoter region. Plasmid pML167 had the same fragment without mutations (pmspA1100 bp) and pML163 lacZ without promoter (no promoter).
- 21 -
Results
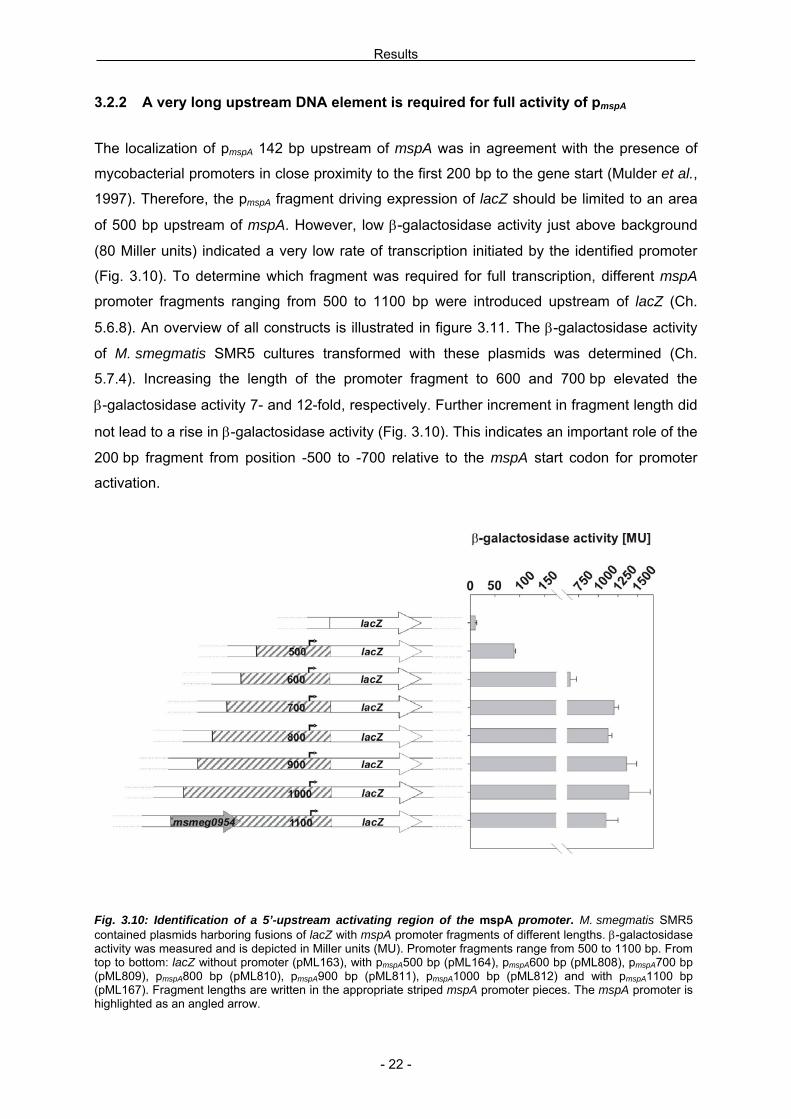
3.2.2 A very long upstream DNA element is required for full activity of pmspA
The localization of pmspA 142 bp upstream of mspA was in agreement with the presence of
mycobacterial promoters in close proximity to the first 200 bp to the gene start (Mulder et al.,
1997). Therefore, the pmspA fragment driving expression of lacZ should be limited to an area
of 500 bp upstream of mspA. However, low β-galactosidase activity just above background
(80 Miller units) indicated a very low rate of transcription initiated by the identified promoter
(Fig. 3.10). To determine which fragment was required for full transcription, different mspA
promoter fragments ranging from 500 to 1100 bp were introduced upstream of lacZ (Ch.
5.6.8). An overview of all constructs is illustrated in figure 3.11. The β-galactosidase activity
of M. smegmatis SMR5 cultures transformed with these plasmids was determined (Ch.
5.7.4). Increasing the length of the promoter fragment to 600 and 700 bp elevated the
β-galactosidase activity 7- and 12-fold, respectively. Further increment in fragment length did
not lead to a rise in β-galactosidase activity (Fig. 3.10). This indicates an important role of the
200 bp fragment from position -500 to -700 relative to the mspA start codon for promoter
activation.
Fig. 3.10: Identification of a 5’-upstream activating region of the mspA promoter. M. smegmatis SMR5 contained plasmids harboring fusions of lacZ with mspA promoter fragments of different lengths. β-galactosidase activity was measured and is depicted in Miller units (MU). Promoter fragments range from 500 to 1100 bp. From top to bottom: lacZ without promoter (pML163), with pmspA500 bp (pML164), pmspA600 bp (pML808), pmspA700 bp (pML809), pmspA800 bp (pML810), pmspA900 bp (pML811), pmspA1000 bp (pML812) and with pmspA1100 bp (pML167). Fragment lengths are written in the appropriate striped mspA promoter pieces. The mspA promoter is highlighted as an angled arrow.
- 22 -

Results
Fig. 3.11: Overview of mspA promoter fragment fusions to the reporter gene lacZ. Depicted at the top is the chromosomal situation of mspA and its 5’ upstream region. Listed below are fusions of mspA promoter fragments to lacZ. A grey box at the gene start of lacZ marks a translational fusion and encodes for the first seven amino acids of MspA. All other constructs are transcriptional fusions. Striped boxes denote the 5’ upstream areas of mspA, white boxes mark the plasmid backbone of pML163. The length of each fragment in bp is included in the striped boxes. The mspA promoter is marked as a black, angled arrow. Corresponding plasmids are listed on the right side. The positions of all elements relative to the chromosomal situation at the top were maintained, dotted boxes among the last four constructs are physically not present. The 200 bp pieces of pML823, pML824 and pML825 divide the 600 bp of pML801 into the three illustrated fragments: 200a is originally located at -500 to -700, 200b at -700 to -900 and 200c at -900 to -1100 relative to mspA. With the exception of the lacZ gene, everything is drawn to scale. The scale bar is given in the lower left corner. The cloning strategies are described in Material and Methods, chapter 5.6.8, plasmids are listed in table 5.8.
- 23 -

Results
3.2.3 Influence of translation initiation signals of pmspA on lacZ expression To examine whether translation initiation of the lacZ mRNA is different for the original SD
sequence of mspA, an 1100 bp translational fusion of the mspA promoter with lacZ was
constructed (Ch. 5.6.8). This 1100 bp promoter fragment included the SDmspA and encoded
for the first seven amino acids of MspA. In frame insertion of this fragment upstream of lacZ
yielded the plasmid pML166 (Fig. 3.11). The β-galactosidase activity of M. smegmatis SMR5
cultures electroporated with the plasmids pML163 (no promoter), pML164 (pmspA500 bp),
pML166 (pmspA1100 bp::lacZ) or pML167 (pmspA1100 bp) was determined (Ch. 5.7.4). The
activity yielded by pmspA500 bp was low as observed earlier (Fig. 3.10), whereas pmspA1100 bp
drove high expression both in transcriptional and translational fusion (Fig. 3.12). The activity
was even increased by a transcriptional fusion indicating a higher rate of translation initiation
for the synthetic SD sequence compared to the original SD sequence of mspA. However, the
SD sequence does not appear to be critical in these constructs.
Fig. 3.12: Comparison of transcriptional and translational mspA promoter fusions to lacZ. M. smegmatis SMR5 contained plasmids harboring lacZ fusions with different mspA promoter fragments. The occurring β-galactosidase activity was measured and is indicated as Miller units (MU). From top to bottom: lacZ without promoter (pML163), with pmspA500 bp (pML164), pmspA1100 bp::lacZ (pML166) and with pmspA1100 bp (pML167). Fragment lengths are written in the appropriate striped mspA promoter boxes. The mspA promoter is highlighted as a black, angled arrow. The translational fusion of pML166 is highlighted as a light grey box at the beginning of the lacZ gene and represents the coding sequence for the first seven amino acids of MspA fused in frame to lacZ.
- 24 -

Results
3.2.4 Influence of a distal DNA element on pmspA activation To elucidate the importance of the upstream segment exceeding 500 bp proximal to mspA,
further fusions were constructed. First 600 bp from position -500 to -1100 bp (“600 bp up”)
were fused to lacZ to confirm the absence of any promoter in the upper part of the whole
1100 bp fragment to yield pML801 (Ch. 5.6.8). The β-galactosidase activity of M. smegmatis
SMR5 transformed with pML801 (pmspA600 bp up) was measured (Ch. 5.7.4) and compared
to the full length fragment pmspA1100 bp and to pmspA500 bp (Fig. 3.13). The 600 bp proximal
fragment conferred promoter activity 6-fold above background, but even 1.6-fold lower than
pmspA500 bp. Both fragments led to an 11- and 18-fold lower activity than pmspA1100 bp,
respectively. Thus, each single fragment was not able to strongly activate pmspA. The absence
of an unidentified promoter on the distal fragment was confirmed. This result is consistent
with the mutational analysis of the mspA promoter (Fig. 3.9) and previous primer extension
experiments (Fig. 3.7).
Fig. 3.13: Determination of the influence of a distal mspA promoter fragment on promoter activation. M. smegmatis SMR5 contained plasmids harboring lacZ fusions with different mspA promoter fragments. The occurring β-galactosidase activity was measured and is indicated as Miller units (MU). From top to bottom: lacZ without promoter (pML163), with pmspA500 bp (pML164), pmspA1100 bp (pML167) and with pmspA600 bp up (pML801). Fragment lengths are written in the appropriate striped mspA promoter boxes. The mspA promoter is highlighted as a black, angled arrow. The positions of the elements relative to each other are maintained, the dotted box in the lowest construct is physically not present.
- 25 -
Results
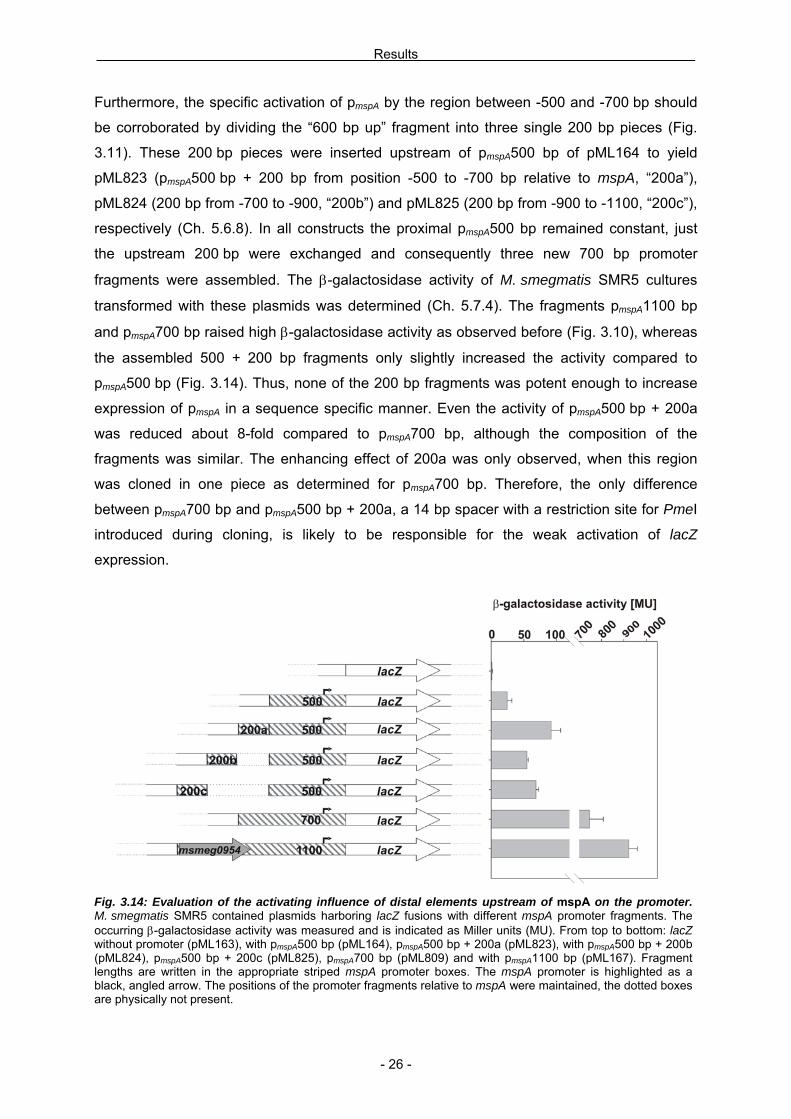
Furthermore, the specific activation of pmspA by the region between -500 and -700 bp should
be corroborated by dividing the “600 bp up” fragment into three single 200 bp pieces (Fig.
3.11). These 200 bp pieces were inserted upstream of pmspA500 bp of pML164 to yield
pML823 (pmspA500 bp + 200 bp from position -500 to -700 bp relative to mspA, “200a”),
pML824 (200 bp from -700 to -900, “200b”) and pML825 (200 bp from -900 to -1100, “200c”),
respectively (Ch. 5.6.8). In all constructs the proximal pmspA500 bp remained constant, just
the upstream 200 bp were exchanged and consequently three new 700 bp promoter
fragments were assembled. The β-galactosidase activity of M. smegmatis SMR5 cultures
transformed with these plasmids was determined (Ch. 5.7.4). The fragments pmspA1100 bp
and pmspA700 bp raised high β-galactosidase activity as observed before (Fig. 3.10), whereas
the assembled 500 + 200 bp fragments only slightly increased the activity compared to
pmspA500 bp (Fig. 3.14). Thus, none of the 200 bp fragments was potent enough to increase
expression of pmspA in a sequence specific manner. Even the activity of pmspA500 bp + 200a
was reduced about 8-fold compared to pmspA700 bp, although the composition of the
fragments was similar. The enhancing effect of 200a was only observed, when this region
was cloned in one piece as determined for pmspA700 bp. Therefore, the only difference
between pmspA700 bp and pmspA500 bp + 200a, a 14 bp spacer with a restriction site for PmeI
introduced during cloning, is likely to be responsible for the weak activation of lacZ
expression.
Fig. 3.14: Evaluation of the activating influence of distal elements upstream of mspA on the promoter. M. smegmatis SMR5 contained plasmids harboring lacZ fusions with different mspA promoter fragments. The occurring β-galactosidase activity was measured and is indicated as Miller units (MU). From top to bottom: lacZ without promoter (pML163), with pmspA500 bp (pML164), pmspA500 bp + 200a (pML823), with pmspA500 bp + 200b (pML824), pmspA500 bp + 200c (pML825), pmspA700 bp (pML809) and with pmspA1100 bp (pML167). Fragment lengths are written in the appropriate striped mspA promoter boxes. The mspA promoter is highlighted as a black, angled arrow. The positions of the promoter fragments relative to mspA were maintained, the dotted boxes are physically not present.
- 26 -

Results
3.2.5 Alignment of the 5’ regions of mspA, mspB, mspC and mspD
The four identified Msp proteins of M. smegmatis SMR5 are differentially expressed. Thus
mspA and mspC transcripts are both present in the wild-type, whereas expression of mspB
and mspD is switched on only after deletion of mspA (Stephan et al., 2005). On protein level,
MspB, MspC and MspD differ from MspA in 2, 4 and 18 amino acids, respectively. To
compare the transcriptionally relevant areas, 250 bp upstream of every msp gene were
aligned with each other. In contrast to the mature proteins, the 5’ UTRs of mspA and mspC
had the highest similarity with 54.3 % identical nucleotides. The identities of the mspA
5’ UTR to those of mspB and mspD were 48.3 and 43.5 %, respectively. Additionally, the
sequence was searched for the anticipated and known determinants of mspA transcription
(Fig. 3.15). Despite only 54.3 % identity between the upstream regions of mspA and mspC,
the putative SD sequence, the TSP, the -10 and the potential -35 regions of the promoter
were conserved with just one substitution (Fig. 3.15). The 5’ UTR of mspB exhibited lower
similarities to that of mspA. Whereas the SD sequence contained one substitution and the
potential TSP was present, the promoter structures were lacking. Two possible -10 promoter
regions were discovered, but differed from the σA consensus sequence of mycobacterial
promoters (Mulder et al., 1997). Also two -35 regions were identified, but the spacing was
Fig. 3.15: Alignment of the 5’ UTRs of mspA, mspB, mspC and mspD. 250 bp of each immediate upstream region of every of the four msp genes of M. smegmatis were aligned. The position relative to the start codons of mspA, mspB and mspC are indicated above the sequences, possible or verified meaning of emphasized grey boxes was written below: -35: -35 promoter region; -10: -10 promoter region; SD: Shine-Dalgarno sequence; gene start: Coding sequence beginning with each start codon; The for mspA detected and partially conserved TSPs are marked with an asterisk (for the strong TSP at position -135) or with an asterisk in brackets (for the weak TSP at position -153). To account for the highest similarity of mspA and mspC 5’ UTRs, the sequences were brought in direct neighborhood.
- 27 -

Results
suboptimal to both of the -10 regions (Agarwal & Tyagi, 2006). None of the identified
sequences and no promoter structures were discovered upstream of mspD. These findings
suggest similar mechanisms of transcriptional regulation for mspA and mspC and are
consistent with the simultaneous expression of both porin genes. However, it is likely that the
parallel expression of mspB and mspD is not induced by the same specific mechanisms.
3.3 Post-transcriptional mechanisms affecting mspA expression
When expressed episomal under the control of exchanged promoter fragments, the half-life
of the mspA mRNA decreased. The use of the constitutive promoters pimyc and psmyc (Kaps et
al., 2001) in transcriptional fusions with mspA resulted in a 6- and 2.3-fold lower stability of
the mspA transcripts, respectively, compared to the chromosomal transcribed mspA mRNA
(Hillmann, 2002). This indicates regulation on a post-transcriptional level, deduced from the
fact that the stability of mspA transcripts obviously depends on its original 5’ UTR. The
5’ UTR can be a major determinant in terms of messenger stability by the formation of
stabilizing secondary structures (Regnier & Arraiano, 2000) or by being targeted by
regulatory antisense RNAs (Storz et al., 2005).
3.3.1 Detection of an antisense RNA to the mspA transcript
Northern blotting was used to detect potential antisense RNAs to the mspA mRNA. The
utilized RNA probes with similar sequences to the corresponding areas of mspA transcripts
were designed to cover the first 158 bp upstream of mspA, including the promoter, down to
the end of the gene (Ch. 5.6.13). Therefore, antisense RNAs were supposed to
simultaneously hybridize to mspA mRNA and the constructed RNA probes. Individual probe
lengths and relative positions are depicted and described in table 5.7 and in figure 3.16.
Additionally, a probe for the 16S rRNA was generated (Ch. 5.6.13) to control amounts of
loaded RNA. Since low pH strongly repressed mspA expression (Kaps, 2004), total RNA was
prepared (Ch. 5.6.9) from M. smegmatis SMR5 grown at pH 6.8 or pH 4.5 for 2.5 hours prior
to RNA extraction (Ch. 5.4). Northern blotting was performed (Ch. 5.6.11) using the
antisense probes anti-mspA 1 to 6 (Ch. 5.6.11, table 5.7). To control RNA loading, the 16S
rRNA probe was used in parallel. The procedure was carried out with three independent
cultures for each condition. At pH 6.8, strong signals for transcripts anti-parallel to the mspA
region were observed for every probe representing a region of the mspA 5’ UTR and for
- 28 -

Results
Fig. 3.16: Detection of transcripts anti-parallel to the mspA mRNA. The chromosomal region of the mspA gene, its promoter (pmspA) and its putative Shine-Dalgarno sequence (SD) are depicted. Thick black lines indicate the positions of RNA probes for antisense RNA detection (anti-mspA 1 to 6). The picture is drawn to scale and represents exact locations and overlapping areas of the probes relative to each other and to the mspA gene. A scale bar for 25 bp is given. Northern blots were performed and detections are presented for each corresponding anti-mspA probe. The loading scheme is identical for all blots: RNA samples of three independent cultures were blotted for each condition. The RNA in the upper and lower blots was hybridized and detected with labeled probes for mspA antisense RNA and for the 16S rRNA as control, respectively. The blots to the left and to the right were performed with RNA prepared from cultures grown at pH 6.8 and pH 4.5, respectively.
anti-mspA 2, covering the immediate beginning of the mspA gene (Fig. 3.16).
However, probes anti-mspA 3 and 6 did not detect signals for the intragenic region of mspA
at any pH. Growth at pH 4.5 did not result in any signals for all probes. The presence of an
anti-parallel transcript to the 5’ UTR of mspA may play a role in regulation, for example in
transcript stabilization. The common regulatory mechanism of antisense RNAs inducing
transcript degradation (Storz et al., 2005) would require up-regulation of the antisense RNA
at low pH, thus decreasing mspA transcript stability. However, the pH dependent co-
expression of mspA and its antisense RNA rather indicates a stabilizing role for the antisense
RNA. To test the hypothesis that the antisense RNA regulates expression by stabilizing the
mspA transcript, the 5’ UTR of mspA should be over-expressed to compete with the mspA
transcripts for hybridization with potential regulatory RNAs. By trapping the antisense RNA,
Fig. 3.17: Schematic construction of pML826. 135 bp of the 5’ UTR of mspA were amplified and inserted downstream of the smyc promoter (black, angled arrow) of the original plasmid pMN016 to result in pML826. hyg: hygromycin resistance cassette; Origins of replication for E. coli and mycobacteria are present, but not depicted.
- 29 -

Results
any stabilizing effect on mspA transcripts would be eliminated. For this purpose pML826 was
constructed (Ch. 5.6.8), constitutively expressing a 135 bp long 5’ UTR fragment of mspA
under the control of the psmyc promoter (Kaps et al., 2001) (Fig. 3.17). Total RNA was
extracted (Ch. 5.6.9) from M. smegmatis SMR5 transformed with pML826 and wild-type
strain during exponential growth phase in neutral 7H9 medium (Ch. 5.4). Dot blotting was
performed (Ch. 5.6.12) with RNA from three independent cultures of each strain and RNA
was detected with specific probes for mspA mRNA and for the 16S rRNA as a control (Ch.
5.6.13). The over-production of the 5’ UTR of mspA in the strain with pML826 did not alter
the amounts of mspA transcripts compared to the wild-type (Fig. 3.18). This result does not
support a stabilizing role of an antisense RNA for mspA transcripts. Some antisense RNAs
are often transcribed from the same genetic location as the target, but from the opposite
strand (Gottesman, 2004). To identify the chromosomal location of an antisense RNA, the
four msp genes were scanned for known consensus sequences for mycobacterial promoters
(Agarwal & Tyagi, 2006; Mulder et al., 1997), but without identifying any transcriptional unit
responsible for cis-encoded antisense RNA.
Fig. 3.18: Levels of mspA mRNA are not affected by 5’ UTR overproduction: Dot blot analysis of RNA prepared from M. smegmatis SMR5 (wt, left side) and M. smegmatis SMR5 with pML826 (wt / pML826, right side). Expression of the 5’ UTR was driven by psmyc. RNA was probed against mspA mRNA and the 16S rRNA. Three RNA samples for each strain were analyzed independently.
- 30 -

Results
3.3.2 Secondary structure of the 5’ UTR of mspA
To elucidate a potential role of the 5’ UTR of mspA in terms of stabilization, the sequence
was subjected to a secondary structure analysis. The program RNAstructure 4.3 (Mathews et
al., 2004) revealed a potential hairpin in the region of -75 to -116 relative to the start codon of
mspA (Fig. 3.19). This most stable loop within the 5’ UTR of mspA forms with an energy ΔG
of -13.4 kcal mol-1. The identified hairpin may limit RNase accessibility and stabilize the
mspA transcripts (Kushner, 2002).
Fig. 3.19: The 5’ UTR of mspA has the potential to form a hairpin structure. The picture was drawn according to secondary structure predictions of RNAstructure 4.3. The depicted loop forms with an energy of ΔG of -13.4 kcal mol-1. The start codon of mspA and the Shine-Dalgarno sequence are underlined. Position numbers refer to the gene start of mspA. The asterisk marks the TSP at position -135, the two slashes illustrate a gap of 40 nucleotides.
3.4 pH dependent mspA expression
3.4.1 mspA expression is repressed at pH 4.5
The pH of the medium is a well established factor known to influence porin expression in
E. coli (Pratt et al., 1996). A physiological necessity for adaptation to pH exists for many
mycobacteria. For example, the pathogen M. tuberculosis encounters acidification in
macrophages and in caseating granulomas (Deretic & Fratti, 1999; Saviola et al., 2003).
M. smegmatis dwells in the soil, where it faces fast changing environmental conditions
including growth at pH below 4 (Iivanainen et al., 1999). Indeed, it was discovered earlier,
that growth at pH 3.5 represses mspA expression in M. smegmatis (Kaps, 2004). This was
- 31 -

Results
confirmed by primer extension analyses with RNA samples of M. smegmatis SMR5 after
growth at low pH (Fig. 3.7). Therefore, the effect of pH on mspA expression should be
analyzed for physiologically relevant pH values. Thus, total RNA was prepared (Ch. 5.6.9)
from M. smegmatis SMR5 after a final incubation at pH 4.5, 5.0, 5.5 and 6.8 (Ch. 5.4) and
analyzed by Northern blotting (Ch. 5.6.11) with RNA probes against mspA transcripts and the
16S rRNA (Fig. 3.20A). Quantification of the mspA bands revealed that the amount of mspA
mRNA steadily declined with decreasing pH (Fig. 3.20B). At pH 4.5 no mspA transcripts were
detected.
Fig. 3.20: Influence of the medium pH on amounts of mspA transcripts. A: RNA was prepared from M. smegmatis SMR5 after incubation at pH 6.8, 5.5, 5.0 and 4.5 and Northern blotting was performed. The blotted RNA was detected using mixed specific RNA probes for mspA mRNA (lower bands) and the 16S rRNA (upper bands). B: Quantitative analysis of three independent blots, of which one is depicted in figure 3.20A. The amounts of mspA transcripts were determined by quantitative image analysis using UVP LabWorks™. The intensities of the mspA bands were normalized to the corresponding bands of the 16S rRNA. The mspA transcript amounts at pH 6.8 were set as 100%.
3.4.2 The repression of mspA at pH 4.5 is a specific event
The total amounts of RNA decreased significantly when extracted from M. smegmatis
cultures growing at low pH. A global down-regulation in response to acid shock as observed
for other bacteria (Foster, 2004) may also explain the observed reduction of mspA transcripts
at low pH. To examine whether the observed effect on mspA expression was a specific
event, additional to the 16S rRNA probe, a 324 bp long specific sigA RNA probe was
synthesized (Ch. 5.6.13). The sigma factor σA is essential for mycobacteria and is constantly
expressed during exponential growth (Gomez et al., 1998; Manganelli et al., 2004). Thus,
- 32 -

Results
sigA is a good indicator of global transcription in mycobacteria. Total RNA was prepared (Ch.
5.6.9) from M. smegmatis SMR5 after final incubation at pH 6.8, 5.5 and 4.5 (Ch. 5.4) and
analyzed by dot blotting (Ch. 5.6.12). Hybridization with RNA probes against the mRNAs of
mspA and sigA and against the 16S rRNA (Table 5.7) revealed constant levels of sigA and
16S rRNA expression independent from the pH of the medium (Fig. 3.21). In contrast the
expression of mspA at pH 4.5 was drastically reduced as observed earlier (Fig. 3.20). This
confirms that pH dependent down-regulation of mspA is a specific regulatory event.
Fig. 3.21: Specific influence of the pH on mspA expression. RNA was prepared from M. smegmatis SMR5 after incubation at pH 6.8, 5.5 and 4.5 (from left to right) and analyzed by dot blotting. Detection of mspA (upper row) and sigA (middle row) mRNA and of the 16S rRNA (lower row) was done with specific digoxygenin-labeled RNA probes.
3.4.3 The regulation of mspA at pH 4.5 requires the original 5’ UTR
Since many regulatory effects depend on the promoter region and the 5’ UTR of a gene, the
expression of mspA under the control of other promoters was investigated. Therefore, mspA
expression plasmids were electroporated in M. smegmatis MN01, a strain where the mspA
gene is deleted (Stahl et al., 2001). On these plasmids, mspA expression was driven by the
promoters pwmyc (pMN012), pimyc (pMN013) and psmyc (pMN016)(Table 5.8). The plasmid
pPOR6 contains a 3 kbp fragment including the central mspA gene, therefore harboring both
3’ and 5’ flanking sequences of mspA. Total RNA was prepared (Ch. 5.6.9) from those four
strains and M. smegmatis SMR5 after final incubation at pH 6.8 and 4.5 (Ch. 5.4) and
analyzed by dot blotting (Ch. 5.6.12) using probes against mspA mRNA and the 16S rRNA
(Fig. 3.22). The mspA specific signals received from the wild-type RNA from M. smegmatis
were down-regulated at pH 4.5 as observed before (Fig. 3.20). Episomal expression of
pPOR6 with the original 5’ UTR of mspA including approximately 1800 bp of the mspA
upstream region led to the same result, whereas the amounts of mspA transcripts originated
- 33 -

Results
from the promoters pwmyc, pimyc and psmyc did not change as a consequence of pH decrease.
Thus, the pH dependent mspA expression is connected to the presence of the original 5’
UTR. Other promoters than pmspA were not impaired in their ability to drive mspA expression
excluding a general transcription deficiency at pH 4.5.
ig. 3.22: Regulatory effect of pH 4.5
Fon mspA expression is dependent on the original 5’ UTR. RNA was prepared either from M. smegmatis SMR5 without plasmids (wt) or from M. smegmatis MN01 (ΔmspA) with the mspA expression plasmids pPOR6 (pmspA), pMN012 (pwmyc), pMN013 (pimyc) or pMN016 (psmyc) after growth at pH 6.8 (1st and 3rd row) and 4.5 (2nd and 4th row). The RNA was blotted and detected with probes against mspA transcripts (upper rows) and the 16S rRNA (lower rows).
3.4.4 β-galactosidase based monitoring of pH dependent mspA expression
orthern and dot blots require the tedious preparation of RNA and are therefore not the
N
method of choice to analyze a large number of different samples. For this reason a reporter
system based on the expression of the E. coli β-galactosidase was established to monitor
regulation of mspA expression. For this purpose, mspA promoter fusions with lacZ on the
basis of pML163 harboring a promoterless lacZ (Table 5.8, Fig. 3.11 and 3.23) were employed. As measured earlier, β-galactosidase activity originated from pML167
Fig. 3.23: Schematic representation of the plasmid pML167. As one example of transcriptional mspA
promoter fusions to lacZ (white arrow), pML167 contains a 1100 bp upstream segment of mspA (striped box), both a mycobacterial (pAL5000) and an E. coli (COLE1) origin of replication and a hygromycin resistance cassette (hyg) as a selection marker. The mspA promoter is indicated as a black, angled arrow. Genes are not drawn to scale.
- 34 -

Results
(pmspA1100 bp-lacZ) was considerable high and increased the rate of transcription more than
10-fold compared to the promoterless construct pML163. This activity should be used to
monitor the pH dependent regulation of mspA expression and therefore decrease after
growth at pH 4.5. For this purpose total RNA was prepared (Ch. 5.6.9) from M. smegmatis
SMR5 with pML167 (pmspA1100 bp) or without plasmid (wt) after growth at pH 4.5 or 6.8 (Ch.
5.4). The RNA was blotted (Ch. 5.6.11) and detected with probes specific for mspA
messengers and the 16S rRNA. Simultaneously to the RNA preparation, samples of
M. smegmatis with pML167 were collected and β-galactosidase activity was determined
(Ch. 5.7.4). No decrease in β-galactosidase activity was measured at pH 4.5 compared to pH
6.8 (Fig. 3.24A). However, the down-regulation of mspA mRNA amounts at pH 4.5 occurred
both in wild-type and pML167 containing cultures (Fig. 3.24B). Thus, regulation of the mspA
promoter could only be observed on mspA RNA level, but was not reflected by the
β-galactosidase activity. This neglects an effect of additional 2 to 10 copies of pmspA during
episomal expression of pML167 (Ranes et al., 1990), because parallel regulation of
chromosomal mspA still occurred.
Fig. 3.24: Low pH reduces the level of mspA transcripts but not β-galactosidase activity. M. smegmatis SMR5 with or without pML167 (pmspA1100 bp–lacZ) was grown at pH 6.8 and 4.5. A: β-galactosidase activity of M. smegmatis SMR5 with pML167 (wt / pML167) was measured after growth at pH 6.8 (black bar) or pH 4.5 (grey bar). Bars represent a mean over three independent samples, error bars the standard deviation. B: RNA was prepared from both M. smegmatis SMR5 with pML167 (wt / pML167, left side) and M. smegmatis SMR5 (wt, right side), blotted and probed for mspA transcripts (upper row) and the 16S rRNA (lower row). Each strain was grown at pH 6.8 (left side) and pH 4.5 (right side).
- 35 -

Results
Since the reporter gene construct pML167 (pmspA1100 bp–lacZ) utilized not the original
SDmspA sequence, possible regulatory mechanisms which depend on ribosome binding would
remain undetected. For this reason the translational fusion of pmspA1100 bp with lacZ
(pML166, table 5.8, fig. 3.11), containing the SD sequence of mspA and the sequence
encoding for the first seven amino acids of MspA, was used for the same experiment:
M. smegmatis SMR5 with and without pML166 was finally incubated at pH 6.8 and 4.5 (Ch.
5.4) and β-galactosidase activity of M. smegmatis SMR5 with pML166 was determined (Ch.
5.7.4) in parallel to RNA preparation (Ch. 5.6.9) and concomitant detection of mspA
transcripts and the 16S rRNA of both strains (Ch. 5.6.11). Levels of β-galactosidase activity
at both pH 6.8 and 4.5 were similar and not repressed at pH 4.5 (Fig. 3.25A). However, on
transcript level the pH dependent down-regulation of mspA mRNA at pH 4.5 occurred in both
strains (Fig. 3.25B). The transcripts were absent and the regulation was unaffected by the
presence or absence of pML166 (Fig. 3.25). This does not represent the observed down-
regulation of mspA expression.
Fig. 3.25: Low pH reduces the level of mspA transcripts but not β-galactosidase activity. M. smegmatis SMR5 with or without pML166 (pmspA1100 bp::lacZ) was grown at pH 6.8 and 4.5. A: β-galactosidase activity of M. smegmatis SMR5 with pML166 (wt / pML166) was measured after growth at pH 6.8 (black bar) and pH 4.5 (grey bar). Bars represent a mean over three independent samples, error bars the standard deviation. B: RNA was prepared from both M. smegmatis SMR5 with pML166 (wt / pML166, left side) and M. smegmatis SMR5 (wt, right side), blotted and probed for mspA transcripts (upper row) and the 16S rRNA (lower row). Each strain was grown at pH 6.8 (left side) and pH 4.5 (right side).
- 36 -

Results
Since regulation of chromosomal mspA occurred independently of the presence or absence
of 2 to 10 copies of the same promoter on pML166 or pML167, overloading of the regulatory
mechanism seems unlikely. This was further supported by analyses of β-galactosidase
activities of strains with chromosomally integrated promoter–lacZ fusions. To this end, the
site-specific integration system based on the mycobacteriophage L5 (Lee et al., 1991; Stover
et al., 1991) was employed as a two-plasmid system (Mailänder, 2004) (Fig. 3.26). The
integrative plasmid carries the attachment site attP, necessary for recombination with the
bacterial attB site in the chromosome, a hygromycin resistance cassette (hyg) and the
expression element of interest. To avoid retroactive excision after integration, the integrase,
encoded by the int gene, is provided on a second plasmid pML102 (Table 5.8), together with
the mycobacterial ORI pAL5000, a kanamycin resistance cassette (aph) and sacB as a
counterselectable marker. Integrating vectors carrying promoter-lacZ fusions were
constructed as described in chapter 5.6.8 (Fig. 3.26). The integrase expressing plasmid
pML102 was electroporated in M. smegmatis mc2 155 and competent cells were prepared
(Ch. 5.5.2). A second transformation with the integrating suicide vectors pML806 (no
promoter), pML815 (pmspA500 bp), pML816 (pmspA600 bp), pML817 (pmspA700 bp) or pML805
(pmspA1100 bp) yielded hygromycin and kanamycin resistant strains containing two plasmids.
A second round of selection on 10% sucrose and hygromycin confirmed the loss of pML102
Fig. 3.26: Schematic representation of the two-plasmid system for stable chromosomal integration in mycobacteria. The plasmid (pML102) carrying the integrase gene (int) from mycobacteriophage L5, a kanamycin resistance cassette (aph), a mycobacterial origin of replication pAL5000 (ori myc) and sacB as counterselectable marker was electroporated in M. smegmatis mc2 155. In a second transformation of the pML102 containing strain, the suicide vector with the attachment site (attP), the promoter-lacZ fusion of interest and the hygromycin resistance cassette (hyg) was introduced. Recombinant strains with integrated plasmids were selected as HygR, KanS and SucR. Plasmid pML805 (pmspA1100 bp-lacZ) represents the integration plasmids carrying mspA promoter fusions with lacZ. Further constructed fusions and corresponding plasmid names are depicted above.
- 37 -

Results
due to the sucrose sensitivity delivered by sacB, and the integration of the plasmids carrying
the lacZ fusions. Recombinant and wild-type strains of M. smegmatis mc2 155 were grown at
pH 6.8 or pH 4.5 as described above (Ch. 5.4). Total RNA was prepared (Ch. 5.6.9), blotted
(Ch. 5.6.12) and probed for mspA transcripts and for the 16S rRNA. In parallel
β-galactosidase activities of the same samples were measured (Ch. 5.7.4). After growth at
pH 6.8, mspA transcripts were detected in the presence of all integrated constructs, whereas
at pH 4.5, all mspA transcripts were absent (Fig. 3.27A). However, β-galactosidase activity
remained unaffected by the pH and reached similar levels after growth at pH 6.8 or 4.5 (Fig.
3.27B). As for episomal expressed lacZ fusions, the β-galactosidase activity rose with
increased length of the promoter fragment. No promoter or pmspA500 bp induced only basal
activity on the wild-type level. As observed earlier during episomal expression (Fig. 3.10), the
activity increased about 6- to more than 7-fold when the mspA promoter fragment was
prolonged from 600 to 700 and to 1100 bp, respectively. Due to the single-copy situation in
contrast to 2 to 10 copies during episomal expression, the chromosomal integration of the
promoter fusions consequently decreased the overall β-galactosidase activity more than
10-fold. Albeit pH dependent β-galactosidase activity did not occur, expression of mspA was
repressed at pH 4.5 and was not altered by the presence of a second copy of the mspA
promoter integrated into the chromosome, rendering overloading of the regulatory
mechanism very unlikely.
Fig. 3.27: Regulatory impact of low pH on mspA expression but not on β-galactosidase activity of integrated promoter lacZ fusions. Wild-type (wt) and recombinant strains of M. smegmatis mc2 155 were grown at pH 6.8 and 4.5. Recombinant strains carried mspA promoter lacZ fusions on chromosomal integrated plasmids pML806 (no promoter), pML815 (pmspA500 bp), pML816 (pmspA600 bp), pML817 (pmspA700 bp), pML805 (pmspA1100 bp) and pML807 (psmyc). A: RNA was prepared, blotted and probed for mspA mRNA (1st and 3rd row) and the 16S rRNA (2nd and 4th row) from cultures growing at pH 6.8 (upper rows) or 4.5 (lower rows). B: β-galactosidase activity of the same strains was measured and depicted in Miller units (MU). Cultures were grown at pH 6.8 (black bars) or 4.5 (grey bars).
- 38 -
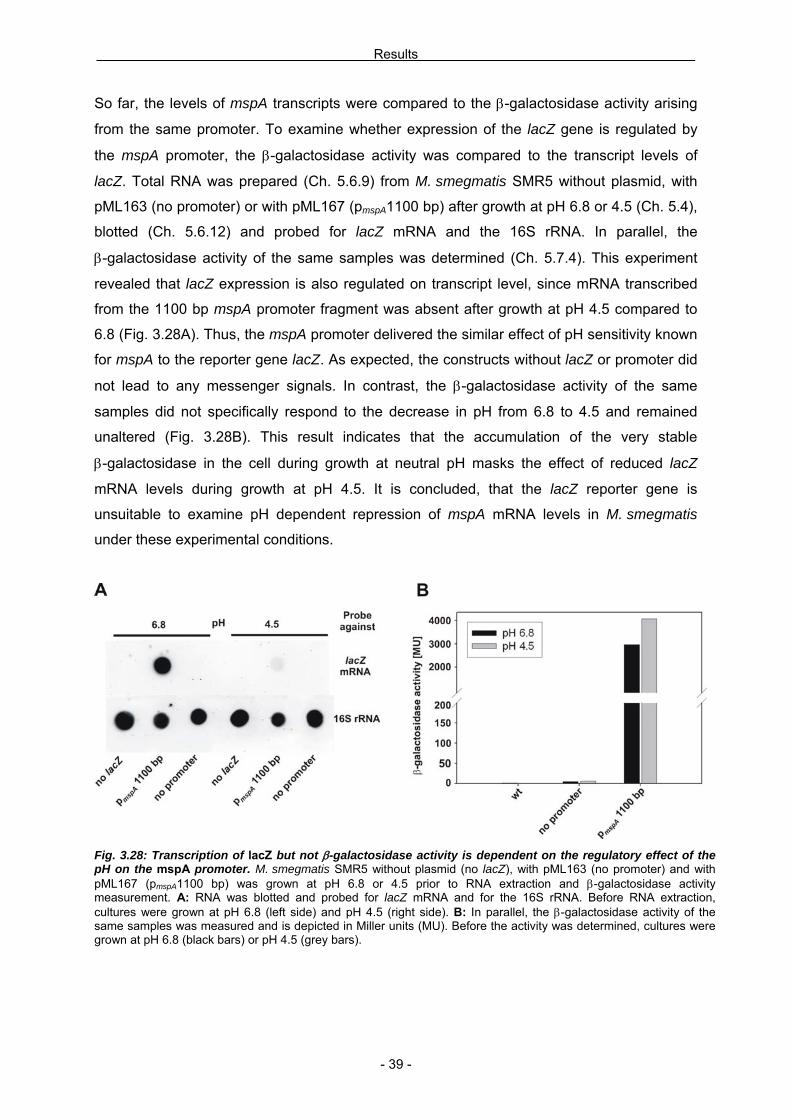
Results
So far, the levels of mspA transcripts were compared to the β-galactosidase activity arising
from the same promoter. To examine whether expression of the lacZ gene is regulated by
the mspA promoter, the β-galactosidase activity was compared to the transcript levels of
lacZ. Total RNA was prepared (Ch. 5.6.9) from M. smegmatis SMR5 without plasmid, with
pML163 (no promoter) or with pML167 (pmspA1100 bp) after growth at pH 6.8 or 4.5 (Ch. 5.4),
blotted (Ch. 5.6.12) and probed for lacZ mRNA and the 16S rRNA. In parallel, the
β-galactosidase activity of the same samples was determined (Ch. 5.7.4). This experiment
revealed that lacZ expression is also regulated on transcript level, since mRNA transcribed
from the 1100 bp mspA promoter fragment was absent after growth at pH 4.5 compared to
6.8 (Fig. 3.28A). Thus, the mspA promoter delivered the similar effect of pH sensitivity known
for mspA to the reporter gene lacZ. As expected, the constructs without lacZ or promoter did
not lead to any messenger signals. In contrast, the β-galactosidase activity of the same
samples did not specifically respond to the decrease in pH from 6.8 to 4.5 and remained
unaltered (Fig. 3.28B). This result indicates that the accumulation of the very stable
β-galactosidase in the cell during growth at neutral pH masks the effect of reduced lacZ
mRNA levels during growth at pH 4.5. It is concluded, that the lacZ reporter gene is
unsuitable to examine pH dependent repression of mspA mRNA levels in M. smegmatis
under these experimental conditions.
Fig. 3.28: Transcription of lacZ but not β-galactosidase activity is dependent on the regulatory effect of the pH on the mspA promoter. M. smegmatis SMR5 without plasmid (no lacZ), with pML163 (no promoter) and with pML167 (pmspA1100 bp) was grown at pH 6.8 or 4.5 prior to RNA extraction and β-galactosidase activity measurement. A: RNA was blotted and probed for lacZ mRNA and for the 16S rRNA. Before RNA extraction, cultures were grown at pH 6.8 (left side) and pH 4.5 (right side). B: In parallel, the β-galactosidase activity of the same samples was measured and is depicted in Miller units (MU). Before the activity was determined, cultures were grown at pH 6.8 (black bars) or pH 4.5 (grey bars).
- 39 -

Discussion
4 Discussion The ability to react to environmental changes is a key factor for survival of bacteria. The
control of the outer membrane permeability is crucial for adaptation of gram-negative
bacteria to changing conditions and is executed by a complex network regulating porin
expression and channel activity. By contrast, nothing is known about those mechanisms in
mycobacteria. The OM of mycobacteria differs from gram-negative bacteria in lipid
composition and architecture, but is assumed to have similar functions (Niederweis, 2003). In
this study, expression and its regulation of the major porin gene mspA of M. smegmatis was
investigated.
4.1 Transcriptional control of mspA expression
Initial primer extensions revealed a strong signal for a transcriptional start point (TSP) for the
mspA gene at position G -135 (Thiel, 1999). A -10 promoter region TATGTT 6 bp upstream
of the TSP was identified which correlated perfectly with the M. smegmatis σA promoter
consensus sequence T(100%), A(93%), T(50%), A(57%), a(43%) and T(71%) (Mulder et al.,
1997). The point mutations T1C and T6C in the -10 region of the mspA promoter reduced the
activity more than 30-fold, respectively, whereas the mutation A2C eliminated
β-galactosidase activity driven by pmspA entirely. Similar drastic effects were observed for
single point mutations in P2 of the M. tuberculosis recA gene (Gopaul et al., 2003). This
result demonstrates that this sequence represents the only promoter of mspA under these
conditions, since no residual activity of possible second promoters further upstream was
detected. This is also consistent with primer extension experiments covering the region more
than 400 bp upstream of mspA and with weak β-galactosidase activity resulting from a
600 bp promoter fragment from 500 to 1100 bp upstream of mspA. However, earlier primer
extension analyses revealed another weak TSP at position -153, which was not observed by
nuclease S1 mapping (Thiel, 1999). This discrepancy was also reported for M. smegmatis
sigA, where of two in vitro determined TSPs only one corresponding promoter was identified
in vivo (Gomez et al., 1998). Thus, the second TSP may be an artifact of the primer
extension reaction.
In mycobacteria the -35 promoter regions as known for E. coli promoters can either be
replaced by an extended -10 region (TGN element, Bashyam & Tyagi, 1998) or have a
higher variability, probably owing to the presence of multiple sigma factors (Bashyam et al.,
1996). For mspA, an extended -10 region was not present, but a potential -35 region
TTGCTG with two mismatches to a proposed sequence requirement of TTGCGA in
- 40 -

Discussion
mycobacteria (Agarwal & Tyagi, 2006) was identified. A 17 bp spacer between the -35 and
-10 regions of the mspA promoter is within the range of an optimal spacing of 16-18 bp in
M. smegmatis (Agarwal & Tyagi, 2006).
A 500 bp fragment of the mspA 5’ region including the identified promoter resulted in only
basal expression of β-galactosidase whereas expression was activated 12- to 13-fold when a
700 bp fragment was employed. Importantly, this activation was abolished, when the 700 bp
were divided into proximal 500 bp and distal 200 bp separated only by a 14 bp spacer. These
observations led to the following conclusions: (i) The mspA promoter is located 142 bp
upstream of the gene. (ii) Approximately 700 bp DNA upstream of mspA are required for full
activity of its promoter. (iii) Activation by a 200 bp distal element occurs in a distance- and
sequence-specific manner.
Upstream enhancer elements are common in bacterial gene regulation. One class
encompasses UP elements of E. coli, which are AT-rich blocks in close proximity to the -35
promoter region. UP elements are factor independent and stimulate transcription via direct
interaction with the C-terminal domain of the RNA polymerase subunit α (αCTD) (Estrem et
al., 1998; Meng et al., 2001). When located further upstream, the integration host factor (IHF)
was reported to bend DNA to enable the interaction between the UP element and αCTD
(Giladi et al., 1998). A similar conserved element of 23 AT-rich bp was discovered upstream
of furA of M. tuberculosis, but was supposed to bind FurA and function auto-regulatory in a
factor dependent manner (Sala et al., 2003). In the case of mspA, the upstream activating
region (UAR) is located more than 500 bp upstream, indicating a factor dependent
mechanism (Arnvig et al., 2005). Prokaryotic transcriptional UARs are usually composed of
binding sites for activator proteins and can function over a distance of up to 15 kbp
(Bondarenko et al., 2002). The average distance between enhancer and promoter could be
considerably decreased and enhancer-promoter communication established, if the
intervening DNA is either supercoiled (Liu et al., 2001) or forms a loop (Vilar & Saiz, 2005),
suggesting an involvement of IHF in both processes (Dai & Rothman-Denes, 1999). The
activation is usually face-of-the-helix dependent (Martin & Rosner, 2001). In E. coli,
enhancers interact specifically with the σN subunit of the RNA polymerase stimulating the
conversion to the transcriptionally active open promoter-polymerase complex (Buck et al.,
2000). Although widely distributed among eubacteria, no homologue of σN was discovered in
mycobacteria (Studholme & Buck, 2000). However, the function of many of the 13 identified
and 26 predicted σ-factors of M. tuberculosis (Manganelli et al., 2004) and M. smegmatis
(Waagmeester et al., 2005), respectively, needs to be elucidated. Despite the lack of precise
knowledge about mechanisms, examples of essential enhancer elements were discovered in
mycobacterial species (Mulder et al., 1997). Expression of the 18 kDa protein of M. leprae
(Dellagostin et al., 1995), the M. tuberculosis iniBAC operon (Alland et al., 2000), the recA
- 41 -

Discussion
(Gopaul et al., 2003) and rrnB (Arnvig et al., 2005) genes and of katG in both M. smegmatis
and M. tuberculosis (Master et al., 2001; Milano et al., 2001; Mulder et al., 1999) was
reported to be dependent on the activation by upstream sequences more than 150 bp
upstream of the corresponding genes. The enhancer of the M. tuberculosis mas gene
encompasses the region between -670 and -764 bp upstream of mas (Sirakova et al., 2002),
about in the same range as observed for mspA in M. smegmatis.
The reduced enhancer activity of the upstream UAR upon introduction of a 14 bp spacer may
indicate a factor dependent regulation and the presence of an activator binding site, which
has to be face-to-the-helix with the promoter to enable interaction. This was reported earlier
for the rrnB operon, where insertion of 2, 6 and 8 bp moved the UAR to the opposite site of
the DNA helix and eliminated promoter activity (Arnvig et al., 2005). Introduction of ½ helical
turns resulted in 1.2 % promoter activity, whereas insertion of one full helical turn restored
the activity to about 40 %. Thus, the enhancer was rather dependent on the spatial
arrangement than on proximity. The 14 bp upstream of mspA represent 1.3 helical turns, but
to prove an effect of DNA phasing, activity had to be restored upon insertion of full turns.
Another indication for transcriptional control of mspA expression was an observed up-
regulation of mspA upon sigB over-production (Mukherjee & Chatterji, 2005), suggesting the
presence of alternate promoters which are active under unknown conditions. This sigma
factor is closely related to sigA (Mehrotra & Bishai, 2001), but not essential for M. smegmatis
(Gomez et al., 1998). Sequence comparison with known sigma factors of other bacteria
suggests the involvement of σB in stress response (Mukherjee & Chatterji, 2005). Yet, there
is only evidence for up-regulation of mspA due to phosphate limitation (Kaps, 2004).
4.2 Transcriptional control of mspA, mspB, mspC and mspD The 5’ upstream regions of all four msp genes were aligned to identifiy the transcriptional
relevant elements. Despite only 54.3% identical nucleotides upstream of mspA and mspC,
they share the SD sequence, -10 and -35 promoter region and TSP. Therefore, mspA and
mspC expression may be regulated by similar mechanisms which is supported by the
presence of both mspA and mspC, but not mspB and mspD messengers in the wild-type
M. smegmatis SMR5 (Stephan et al., 2005). The 5’ UTRs of mspB and mspD only share
minor or no relevant elements with those of mspA and mspC or with each other, respectively.
Thus, the mechanism of activation of both back-up porin genes upon deletion of mspA is
unclear (Stephan et al., 2005) and probably not the result of similar transcriptional
mechanisms. The hypothesis, that an insertion element with homology to the IS 1547
element of M. tuberculosis (Fang et al., 1999) 156 bp upstream of mspD (Stephan et al.,
2005) could be brought in direct vicinity to mspD upon deletion of the IS element and
- 42 -
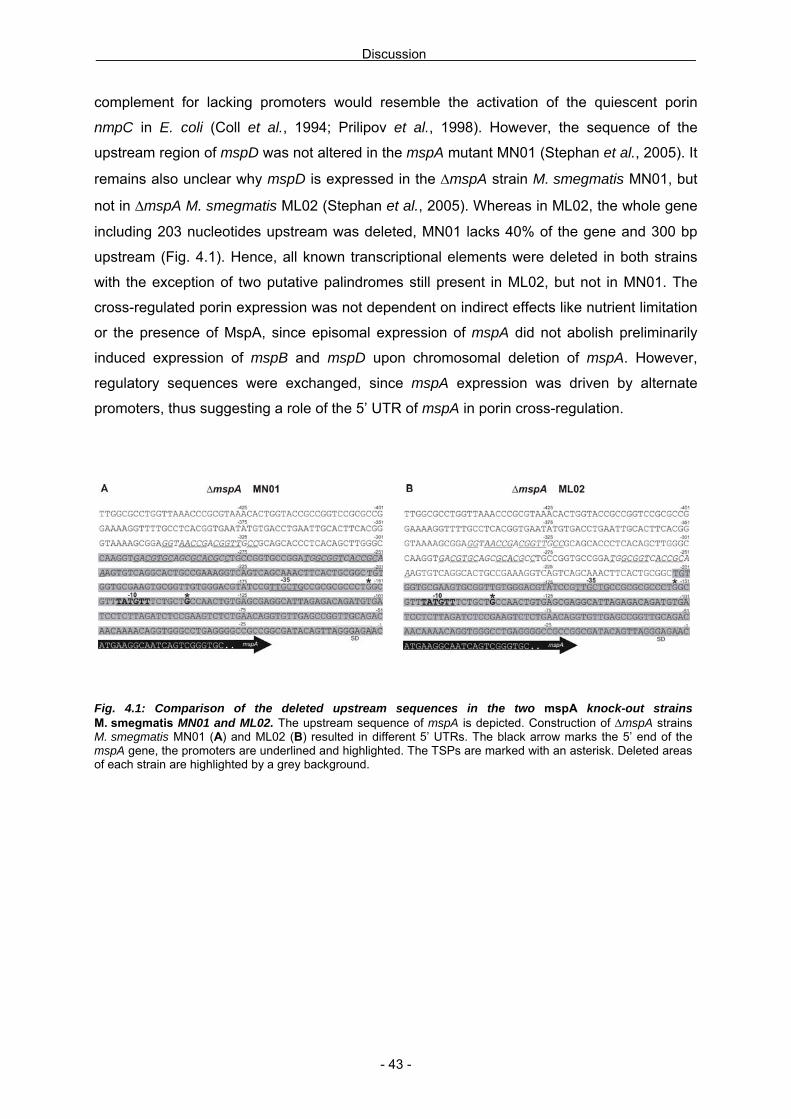
Discussion
complement for lacking promoters would resemble the activation of the quiescent porin
nmpC in E. coli (Coll et al., 1994; Prilipov et al., 1998). However, the sequence of the
upstream region of mspD was not altered in the mspA mutant MN01 (Stephan et al., 2005). It
remains also unclear why mspD is expressed in the ΔmspA strain M. smegmatis MN01, but
not in ΔmspA M. smegmatis ML02 (Stephan et al., 2005). Whereas in ML02, the whole gene
including 203 nucleotides upstream was deleted, MN01 lacks 40% of the gene and 300 bp
upstream (Fig. 4.1). Hence, all known transcriptional elements were deleted in both strains
with the exception of two putative palindromes still present in ML02, but not in MN01. The
cross-regulated porin expression was not dependent on indirect effects like nutrient limitation
or the presence of MspA, since episomal expression of mspA did not abolish preliminarily
induced expression of mspB and mspD upon chromosomal deletion of mspA. However,
regulatory sequences were exchanged, since mspA expression was driven by alternate
promoters, thus suggesting a role of the 5’ UTR of mspA in porin cross-regulation.
Fig. 4.1: Comparison of the deleted upstream sequences in the two mspA knock-out strains M. smegmatis MN01 and ML02. The upstream sequence of mspA is depicted. Construction of ΔmspA strains M. smegmatis MN01 (A) and ML02 (B) resulted in different 5’ UTRs. The black arrow marks the 5’ end of the mspA gene, the promoters are underlined and highlighted. The TSPs are marked with an asterisk. Deleted areas of each strain are highlighted by a grey background.
- 43 -

Discussion
4.3 Post-transcriptional control of mspA expression
4.3.1 Stability of the mspA transcript
Post-transcriptional regulation is mediated by the control of the transcript stability and by the
efficiency of translation initiation. The half-life of mspA transcripts was determined to
approximately 6 minutes (Kaps, 2004). To date, nothing is known about general mRNA
stability in mycobacteria, but for E. coli an average messenger stability of 2.4 minutes at
37°C was reported (Regnier & Arraiano, 2000). One of the most stable transcripts in E. coli is
the ompA mRNA with a half-life of about 15 minutes under conditions of rapid growth at 37°C
(Rasmussen et al., 2005). However, in slowly growing cells ompA transcripts have a reduced
half-life of 4 minutes. In comparison, mspA transcripts are considered to be relatively stable.
It was assumed that slowly growing mycobacteria compensate a slower rate of transcription
elongation by enhanced stability of the mRNA to avoid wasting any resources (Nagaraja,
2004). The faster decay of episomal mspA transcripts compared to chromosomal derived
messengers indicates a sequence specific mRNA stabilization (Hillmann, 2002), because
both the original 3’ and 5’ sequences of mspA were eliminated upon plasmid construction.
Since the level of gene expression is dependent on messenger synthesis and degradation,
the importance of the regulation of mRNA decay is obvious (Unniraman et al., 2002a). The
major determinants of RNA stability are protection from RNases either by occupation with
ribosomes or by stem-loops close to the 5’ and 3’ ends of the transcripts (Khemici &
Carpousis, 2004; Schlax & Worhunsky, 2003) and the presence of regulatory antisense
RNAs, which affect mRNA stability and translation initiation (Masse et al., 2003).
4.3.2 The 5’ end of the mspA transcript
The degradosome is discussed as a major mechanism of mRNA degradation. In E. coli it is
composed of the endonuclease RNase E, the exonuclease PNPase, the RNA helicase RhlB
and the enolase. RNase E is supposed to be the rate determining enzyme: It binds to the 5’
end of transcripts, scans in 5’ to 3’ direction and cleaves the mRNA at a distant target site,
thus producing unprotected 3’ ends for 3’ to 5’ exonucleases (Arraiano & Maquat, 2003;
Kushner, 2002). The genomes of M. tuberculosis and M. smegmatis each encode for a
homologue of this ribonuclease (Cole et al., 1998), suggesting similar mechanisms for
mycobacteria. The RNase interaction with the 5’ end of the mRNA could be impeded by
hairpin structures close to the end (Arnold et al., 1998). Indeed, a potential hairpin at the
position -75 to -16 relative to the mspA start codon was found. This stem-loop structure
- 44 -

Discussion
resembles the 5’ UTR of E. coli ompA which is the major determinant of ompA mRNA
stability (Emory & Belasco, 1990; Emory et al., 1992). Whereas the ompA transcript forms
two hairpins, the mspA mRNA forms just one (Fig. 4.2). The free energy of the mspA hairpin
is ΔG = -13.4 kcal mol-1 and is in the range of the ompA stem-loop at position -30 to -60 to
the gene start with ΔG = -12.6 kcal mol-1. In fact, a designed stem-loop structure with a stem
length of 5 bp and a predicted stability of ΔG = -9.9 kcal mol-1 was sufficient to increase the
half-life of a transcript in E. coli from 3.9 minutes to 20 minutes (Arnold et al., 1998).
However, the secondary structure upstream of mspA is 19 bp away from the 5’ terminus,
Fig. 4.2: Potential hairpin structures in the 5’ regions of mspA and ompA. Depicted are putative stem-loops determined by RNAstructure™ 4.3 of M. smegmatis mspA 5’ UTR (A), and of E. coli ompA 5’ UTR (B), taken from Hansen (Hansen et al., 1994). The stars denote the transcriptional start points. The start codons and SD sequences are underlined and positions are numbered relative to the gene start. The two slashes in (A) symbolize a gap of 40 b.
- 45 -

Discussion
whereas the stabilizing function of the ompA stem-loop was lost upon insertion of 12 to
16 bp, indicating that a hairpin is required in close proximity to the 5’ terminus of the ompA
mRNA (Emory et al., 1992). On the other hand, in the absence of the original 5’ UTR of
mspA, the transcript half-life decreased 6 and 2.3-fold when expressed under the control of
pimyc and psmyc, respectively (Hillmann, 2002). No potential stem-loops were found in the latter
constructs. Thus, the hairpin in the 5’ UTR of mspA appears to contribute to the stability of
the mspA mRNA.
4.3.3 The 3’ end of the mspA transcript The length of the mspA transcript was determined earlier to an approximate size of 900 bp
(Kaps, 2004). The mspA gene encompasses 636 bp and the 5’ UTR has a length of 135 bp.
It is concluded that the transcript is terminated in the 3’ UTR after about 130 bp. Termination
mechanisms are divided into two classes: (a) Factor-independent intrinsic terminators and
(b) factor-dependent terminators requiring the Rho termination factor (Henkin, 1996; Yarnell
& Roberts, 1999). The E. coli protein Rho encoded by the rho gene is a widespread factor
identified in most bacteria (Banerjee et al., 2006). The presence of rho in M. tuberculosis was
deduced from sequence comparisons and functional predictions for the ORF rv1297 (Cole et
al., 1998; Rosenkrands et al., 2000), but was not experimentally verified. In the finished
genome of M. smegmatis neither annotations of a Rho factor were included, nor revealed a
BLAST search significant homologies, rendering the identification of Rho dependent
transcription termination in M. smegmatis impossible. In search of an intrinsic terminator
downstream of mspA, no characteristic run of more than 7 U’s was discovered. Poly U-trails
were reported not to be necessary for translational termination in mycobacteria when the
length of the stem exceeds 27 bp (Unniraman et al., 2002b). However, the longest identified
hairpin structure in the 3’ UTR of mspA had a stem length of just 4 bp. This excluded a stem-
loop structure which is usually part of Rho independent terminators (Steege, 2000). Thus, the
control of transcriptional termination of mspA remains unclear.
4.3.4 Initiation of translation
Ribosomal protection of mRNA from degradation by RNases is a common mechanism to
stabilize transcripts. This requires effective recruitment of ribosomes and frequent ribosomal
elongation, blocking access of nucleases to degradative signals present in the naked mRNA
(Coburn & Mackie, 1999; Vytvytska et al., 2000). The sequence GGAGA 2 bp upstream of
- 46 -

Discussion
the ATG start codon has one mismatch to the hypothetical mycobacterial SD sequence
AGAAAGGAGG and is 5 bp shorter (Kempsell et al., 1992). In addition, the spacing between
the SDmspA and the start codon is very short with just 2 bp. An average spacing as derived by
whole genome analysis of M. tuberculosis ranged between 7 to 11 bp (Ma et al., 2002). A
spacer shorter than 5 bp decreases the efficiency of translation initiation probably due to
configurational constraints during ribosome assembly at the complementary region and the
ribosomal P-side (Chen et al., 1994; Vellanoweth & Rabinowitz, 1992). Nevertheless, more
recent investigations revealed the presence of suboptimal spacing of less than 5 bp for
several bacteria (Starmer et al., 2006) including mycobacteria (Ma et al., 2002), for example
upstream of the M. tuberculosis iniBAC operon (Alland et al., 2000). This would explain the
effect of a reduced fluorescence intensity of a gfp reporter construct in M. smegmatis using
the mspA SD sequence compared to a synthesized fully complementary SD sequence by a
factor of 3.5 (Hillmann, 2002). Furthermore, when using identical mspA promoter fragments,
resulting β-galactosidase activity was 1.4-fold higher for a transcriptional fusion with a SD
sequence with optimized sequence and spacing compared to a translational fusion with the
mspA SD sequence. However, an optimized sequence (AGAAAGGAGG) with a distance of
6 bp to the ATG start codon did not increase the half-life of mspA mRNA expressed from
plasmids (Hillmann, 2002). This indicates that ribosomal binding does not play a major role in
stabilizing mspA transcripts.
4.3.5 Detection of an antisense RNA to the mspA transcripts A transcript anti-parallel to the 5’ upstream region of mspA was detected by several RNA
probes. This transcript covers the entire 5’ UTR of mspA and the beginning of the gene (Fig.
3.16). Antisense RNAs can be encoded on the opposite strand (Storz et al., 2004), but a
manual search in all four msp genes did not reveal a σA consensus sequence (Agarwal &
Tyagi, 2006) of a divergent promoter. This was not surprising for mspD, since anti-parallel
transcripts of the mspD 5’ UTR are not supposed to be able to hybridize to the 5’ UTR of
mspA due to their poor sequence homology. The subsequent search for any trans-encoded
antisense RNAs by a BLAST search for 50 bp fragments in the 5’ UTR of mspA did not
reveal any potential transcriptional unit. However, this search was complicated by the fact,
that trans-encoded antisense RNAs not necessarily exhibit perfect complementary to their
target transcripts (Eddy, 2001; Tjaden et al., 2006). Thus, an origin of such an antisense
RNA was not identified.
- 47 -

Discussion
4.4 Adaptation of mspA regulation to low pH First approaches to investigate the regulation of mspA revealed a strong repression by both
the presence of ethanol or by downshift of the medium pH to 3 (Kaps, 2004). The transcript
levels of mspA correlated with the pH and decreased progressively over a range from pH 6.8
to 4.5. The mspA expression remained unaffected by low pH when expression was driven by
other promoters proving that the mspA promoter itself is pH sensitive. Vice versa, lacZ
fusions with the mspA promoter were repressed by low pH and lacZ transcripts were absent
after growth at pH 4.5.
M. smegmatis was classified as the Mycobacterium with the broadest tolerance for growth at
different pH, ranging from 3.5 to 9.5 (Chapman & Bernard, 1962; Portaels & Pattyn, 1982).
They are able to express an adaptive acid tolerance response (ATR) to enhance survival at
low pH (O'Brien et al., 1996) and maintain an intracellular pH of 6.1 to 7.2 even during growth
at an extracellular pH of 4.5 (Rao et al., 2001). A low pH of 3.5 to 4.3 posed a positive
selective pressure for the growth of unspecified mycobacteria in forest soils (Iivanainen et al.,
1999; Iivanainen et al., 1997) and acid inducible genes exist in both M. smegmatis (Saviola
et al., 2003) and M. tuberculosis (Fisher et al., 2002). Thus, acidic pH is a relevant
environmental factor for mycobacteria to adapt to.
Intrinsic pH tolerance of M. smegmatis is mediated by low proton permeability of the inner
membrane and high buffering capacity of the cytoplasm (Tran et al., 2005). However, MspA
represents the major pathway for hydrophilic solutes over the OM (Stahl et al., 2001) and a
participation of the pH dependent mspA regulation in the ATR is likely to reduce the OM for
protons. This would be consistent with proposed alterations in the mycobacterial cell wall due
to low pH (Fisher et al., 2002; Saviola et al., 2003; Tran et al., 2005) and with pH specific
regulation of porin expression, which is necessary for E. coli to adapt to changing
environmental conditions and stresses (Batchelor et al., 2004; Sato et al., 2000). Low pH
was also observed to regulate porin expression in Serratia marcescens, Salmonella enterica
serovar Typhimurium and in Yersinia species (Begic & Worobec, 2006; Delihas, 2003;
Santiviago et al., 2003). In the presence of toxic solutes, the general porin OmpC, which
constitutes the smaller pore than OmpF, is preferentially expressed (Pratt et al., 1996).
Consequently, decreased pH induces expression of ompC and repression of ompF,
respectively (Thomas & Booth, 1992). This regulation occurs both on transcriptional and
post-transcriptional level (Heyde & Portalier, 1987). The increased expression of ompC
correlates with increased expression of the antisense RNA micF, since they share identical
regulatory sequences (Begic & Worobec, 2006). MicF specifically binds to ompF mRNA, thus
inhibiting translation and inducing degradation of the transcripts (Delihas & Forst, 2001).
Furthermore, the transcription of ompF is directly repressed at low pH. The sensor for
extracellular pH is discussed controversial. The increased level of phosphorylated OmpR
- 48 -

Discussion
(OmpR-P) is responsible for expression of ompC and micF, but phosphorylation depends not
exclusively on the sensor kinase EnvZ. The level of acetylphosphate (AcP) seems to be
important for phosphorylation of OmpR when E. coli was grown at low pH (Heyde et al.,
2000). Additionally, transcription of micF is not only induced by OmpR-P, but also by MarA, a
transcriptional activator responding to weak acids (Delihas & Forst, 2001). Moreover, porin
activity is regulated post-translational. Low pH was reported to decrease the OmpF and
OmpC channel size in vivo (Todt & McGroarty, 1992; Todt et al., 1992), to stabilize a closed
state of OmpC (Liu & Delcour, 1998) and to induce the excretion of polyamines, specifically
blocking the porin pathway over the OM (Samartzidou et al., 2003). Thus, the extracellular
pH has a major impact on porin expression and function and triggers both immediate and
long-term responses in gram-negative bacteria.
The sensitivity of the mspA promoter to pH suggests an important role of the 5’ upstream
region of mspA. The discovery of a stabilizing hairpin structure and of a putative regulatory
antisense RNA to the 5’ UTR of mspA indicates post-transcriptional control of mspA
expression. The fact that mspA and the antisense RNA are co-repressed by low pH in the
same way excludes a destabilizing function of the antisense RNA as reported for MicF, MicC,
IpeX, RseX and RyhB (Guillier et al., 2006). Indeed, in some cases antisense RNAs are able
to activate transcription. The antisense RNAs DSrA and RprA bind in the 5’ UTR of rpoS of
E. coli and thereby prevent the formation of a secondary structure at the SD sequence, which
usually hinders ribosome assembly (Storz, 2002; Wassarman, 2002). Since expression of
mspA and the antisense RNA correlates, it is conceivable that the antisense RNA binds in
the 5’ UTR of mspA and activates transcription by releasing the RBS. In such a case, loading
of the transcript with ribosomes should prevent RNA degradation. However, no relevant
secondary structures covering the SD sequence were discovered in the 5’ UTR of mspA.
Furthermore, regulation by pH was independent of SDmspA, since the mspA 5’ UTR conferred
“pH sensitivity” to the lacZ transcripts with a different SD sequence. Thus, the putative
stabilizing role of the antisense RNA does not appear to be mediated by ribosome binding
and its mechanism remains unclear.
Over-expression of the 5’ UTR of mspA to competitively bind the putative antisense RNA to
reduce the potential stabilizing effect on mspA transcripts yielded no reduction in mspA
mRNA amounts. The 5’ UTR was expressed under the control of psmyc, used for gene
expression and complementation in mycobacteria (Stephan et al., 2005), but the amounts of
expressed 5’ UTR are not known and may be too low to trap the antisense RNA effectively.
Since the whole 135 bp of the 5’ UTR were expressed, the length should be sufficient for
antisense RNA binding. However, this result could also indicate, that the detected antisense
RNA does not specifically bind to the 5’ UTR of mspA.
The absence of mspA transcripts after 2.5 hours of growth at pH 4.5 did not reduce the
- 49 -

Discussion
amounts of cell wall associated MspA. However, nothing is known about the turnover of the
exceptional stable MspA protein (Heinz et al., 2003). The physiological relevance remains
unclear, since an immediate response can be delivered by regulation of porin activity or by
modulating channel size and the properties of existing pores (Delcour, 2003), whereas a
long-term response can include the inhibition of further porin synthesis.
4.5 Conclusions and perspectives
Elements of transcriptional and post-transcriptional regulation of mspA were determined. On
transcriptional level, the promoter of mspA was identified and proved to be solely responsible
for mspA transcription under the tested conditions. Furthermore, a UAR of about 200 bp was
identified 500 bp upstream of mspA and was required for full activation of pmspA. To prove the
importance of DNA phasing of this fragment, the activation of the mspA promoter mediated
by its UAR should be restored upon insertion of full helical turns. To demonstrate factor-
dependent activation the activating region should be tested for possible binding sites and the
presence of a regulator by electrophoretic mobility shift essays (EMSA) with protein fractions
of M. smegmatis. Furthermore, the mspA upstream fragment should be tested in its ability to
confer activation to alternate genes. On post-transcriptional level, a crucial function of the 5’
UTR in mRNA stability of mspA was deduced from an increased half-life compared to
transcripts with alternate promoters and therefore exchanged upstream fragments. In
agreement with this observation, a structure with the general ability to form a hairpin was
identified upstream of mspA. To investigate its participation in mspA transcript stabilization,
the hairpin should be eliminated and destabilized by mutations. Additionally, the secondary
structure could be transferred to the upstream region of other genes.
Expression of mspA itself is dependent on the extracellular pH. This sensitivity is exclusively
delivered by the 5’ UTR of mspA and leads to the absence of mspA mRNA after growth at
pH 4.5 for 2.5 hours. To exploit this effect and to identify a potential regulator, the reporter
system should be modified: gfp expression could depend on both the mspA promoter and on
an inducible operator like the tet-system to prevent accumulation of the reporter protein
during growth at neutral pH. This construct should be integrated into the M. smegmatis
chromosome and after subsequent transposon mutagenesis of M. smegmatis, clones
deficient in pH regulation could be identified by fluorescence activated cell sorting (FACS)
and the regulator by transposon based sequencing. Moreover, a ΔmspA strain should be
probed for the presence of the antisense RNA to examine whether the transcript starts from
within the mspA gene. To evaluate the physiological significance of the pH dependent mspA
down-regulation, MspA amounts, which were stable over 2.5 hours after exposure to pH 4.5,
should be monitored over a longer period of growth in acidic medium.
- 50 -

Material and Methods
5 Material and Methods
5.1 Material
5.1.1 Chemicals, equipment and biological material The chemicals used in this study are summarized in table 5.1. Other chemicals were taken in p.a. quality from Merck, Roth and Sigma in Germany or from Fisher Scientific, Acros Organics and Sigma in the USA. In further on following tables auxiliary material (Table 5.2), instruments (Table 5.3), enzymes and size markers (Table 5.4), strains (Table 5.5), oligonucleotides (Tables 5.6 and 5.7) and plasmids (Table 5.8) are listed. If only one source is given, the manufacturer was the same for Germany and for the USA.
Chemical Manufacturer (Germany / USA) 25%-Glutardialdehyde Merck 37%-Formaldehyde Merck / Sigma [α-33P] dATP GE Healthcare Agar Oxoid / Calbiochem Agarose Gibco/BRL / EMD biosciences Ammonium Persulfate (APS) Sigma / EMD biosciences Ampicillin Sigma β-Mercaptoethanol Merck / Calbiochem 5-Bromo-4-Chloro-3-Indolyl-Phosphate (BCIP) Sigma Blocking Reagent Roche Bromphenolblue Fisher BSA (Bovine Serum Albumin Fraction V) Sigma / MP Biomedicals Cetyltrimethyl Ammonium Bromide (CTAB) Acros Organics Chloroform Acros Organics Citric Acid Sigma Citric Acid Trisodium Ssalt Acros Organics Cobalt-(II)-Chloride Hexahydrate Sigma Copper-(II)-Sulfate Pentahydrate Sigma [γ-32P] ATP GE Healthcare Diethanolamine Sigma Difco™ Middlebrook 7H9 Broth BD Difco™ Middlebrook 7H10 Agar BD Dimethyl Sulfoxide (DMSO) Sigma Desoxynucleosidetriphosphates dNTPs Boehringer / Invitrogen Ethylenediaminetetraacetic Acid (EDTA) Sigma / Fisher Ethidium Bromide Roth / EMD biosciences Fat Free Milk Powder Nestlé / Wal Mart Formamide Fluka / Fisher Glucose Serva / Fisher Glycerol Roth / Fisher Hygromycin B Calbiochem Iron-(II)-Sulfate Heptahydrate Sigma Kanamycin Sigma Lithium Chloride Roth Maleic Acid Roth Manganese Chloride Sigma / EMD Biosciences 3-(N-Morpholino)Propanesulfonic Acid (MOPS) Roth / Fisher N-Lauroylsarcosine Sigma / Acros Organics N-Octylpolyethylen Bachem 2-Nitrophenyl β-D-Galactopyranoside (ONPG) Sigma Polyethylene Glycol 6000 (PEG) EMD Biosciences p-Nitrophenyl Phosphate (pNPP) Sigma Polyacrylamide Roth / EMD biosciences
- 51 -

Material and Methods
Rifampicin Sigma Sodium Azide Sigma /Acros Organics Sodium Dodecyl Sulfate (SDS) Serva / Mallinckrodt Sodium Molybdate Dihydrate Sigma Streptomycin Sigma Sucrose Merck / Fisher N,N,N,N -Tetramethyl-Ethylenediamine (TEMED) Merck / EMD Biosciences Tricine Sigma / Fisher Tris-(Hydroxymethyl)-Aminomethan (Tris) Roth / Fisher TRIzol® Reagent Invitrogen Tryptone Oxoid Tween® 20 Sigma / Fisher Tween® 80 Serva / Fisher Zinc Sulfate Heptahydrate Fluka 5-Bromo-4-Chloro-3-Indolyl-β-D-Galactopyranoside (X-Gal) Sigma Yeast Extract Oxoid / Fisher
Table 5.1: Chemicals and reagents
Equipment Manufacturer (Germany / USA) Cell star PP-tubes (15 and 50 ml) Greiner / VWR CryoTubesTM CryoLine™ (1.8 ml) Nalge Nunc Cryovials (2 ml) Fisher Cuvettes (semi-micro, 1.5 ml, visible and UV range) BrandTech Cuvettes (Acryl, 10 x 10 x 48 mm) Sarstedt Developer and fixer Du Pont Electroporation cuvettes (2 mm) peqlab / Fisher Falcon™ Round Bottom Tube (14 ml Polystyrene) BD FastPrep tubes Lysing Matrix B QBiogene Filterpaper Whatman Filters Minisart (0.22 and 5 µm pore size) Sartorius Flasks, glass reaction tubes, glass ware Schott / Corning Glass pipettes Brand Hybond™-N+ GE Healthcare Hybond™-P GE Healthcare Multistep pipettes Eppendorf Microplates (96 wells) Nalge Nunc Nitrocellulose membrane Schleicher & Schüll Nylon membrane (positively charged) Roche Pipettes (2, 20, 200, 1000 µl) Gilson / Rainin Pipet Tips Greiner / Rainin Parafilm “M” American National Can / Pechiney PCR tubes PE / Eppendorf Petri dishes Greiner / Fisher Pipetboy Integra Biosciences Reaction tubes (1.5 and 2 ml) Greiner Serological plastic pipettes (5 – 25 ml) Fisher Syringes (5, 10, 50 ml) Greiner / Exelint Quartzglass cuvettes (1 and 10 mm) Hellma VEP-2 Bandit™ Mini Tank Electroblotting system Owl X-Ray cassettes Goos X-Ray films Kodak
Table 5.2: Equipment
Instrument ManufacturerAllegra X-12 R Beckman Coulter B20 / B12 incubators Heraeus Biofuge fresco / pico / primoR Heraeus BP 210 S / BP 2100 Sartorius Centrifuge 5415 D / R Eppendorf Centrifuge Avanti J-25 Beckmann DNA Thermo Cycler 2400 Perkin Elmer Doc Print 1000 Gel documentation peqlab
- 52 -

Material and Methods
ECM 630 BTX EpiChemi™ II Darkroom UVP FastPrep® FP 220A QBiogene Fisher accuSeries II 4102 Denver Forma Tabletop Orbital shaker 430 Thermo Forma Console Orbital shaker 435 Thermo Gene pulser II Biorad HL-2000 HybriLinker UVP Isotemp Incubator Fisher LabWorks™ Analysis software UVP Lambda 35 UV/Vis Spectrophotometer Perkin Elmer Mastercycler® gradient Eppendorf Mastercycler® ep gradient Eppendorf Multianalyst™ Software Biorad Novaspec II Pharmacia PerfectBlue™ Tank Electroblotter Web S peqlab Rotary shaker G-25 / G76 New Brunswick Savant 110 SpeedVac Savant Sequencer ABI Prism310 Genetic Analyzer Applied Bioscience Serological plastic pipettes (5 – 25 ml) Fisher SI-224 Balance Denver SmartSpec™ 3000 Spectrophotometer Biorad Spectrophotometer V 560 Jasco Speed Vac DNA 110 Savant Ultraspec 3000 Pharmacia UV screen 254 and 366 nm Vetter UW 2070 and Sonoplus GM70 Bandelin Vacufuge Concentrator 3501 Eppendorf VacuGene™ CL Vacuum blotting system GE Healthcare Vacuum Blot chamber Pharmacia Biotech
Table 5.3: Instruments
Enzymes / Size markers Manufacturer (Germany / USA) 2-log DNA ladder New England Biolabs DNase I Macherey Nagel / New England Biolabs Lysozyme Merck / Sigma MagicMarkTM XP Western protein standard Invitrogen PEQ Gold “Leitermix” peqlab Pfu-DNA-Polymerase Stratagene Phusion™-DNA-Polymerase Finnzymes Proteinase K peqlab / Sigma Pwo-DNA-Polymerase peqlab Restriction endonucleases New England Biolabs RNA Molecular weight marker II, DIG-labeled Roche RNase A Serva / Sigma RNase Inhibitor RNAguard© GE Healthcare T4-DNA-Ligase New England Biolabs T4-DNA-Polymerase New England Biolabs T4-Polynucleotide Kinase New England Biolabs T7-RNA-Polymerase Roche Taq-DNA-Polymerase Eppendorf TURBO DNase™ Ambion
Table 5.4: Enzymes / Size markers
- 53 -

Material and Methods
Strain Relevant genotype Source or referencerecA1; endA1; gyrA96; thi; relA1;hsdR17(rK
-,mK+); supE44; E. coli DH5α
φ80ΔlacZΔM15, ΔlacZ(YA-argF)UE169 (Sambrook et al., 1989)
M. smegmatis mc2155 not characterized, high transformation efficiency (Snapper et al., 1990)M. smegmatis mc2155, SmR M. smegmatis SMR5 (Sander et al., 1996)
M. smegmatis MN01 M. smegmatis SMR5 derivative; ∆mspA; SmR, GmR (Stahl et al., 2001)M. smegmatis ML02 M. smegmatis SMR5 derivative, ∆mspA; SmR (Stephan et al., 2004c)
M. smegmatis SMR5 derivative, ∆mspA / ∆mspC; SmRM. smegmatis ML10 (Stephan et al., 2004c)M. smegmatis ML16 M. smegmatis SMR5 derivative, ∆mspA / ∆mspC / ∆mspD; SmR (Stephan et al., 2005)M. smegmatis ML60 M. smegmatis mc2155 derivative, attB::pML806; HygR This study M. smegmatis ML61 M. smegmatis mc2155 derivative, attB::pML805; HygR This study M. smegmatis ML62 M. smegmatis mc2155 derivative, attB::pML807; HygR This study M. smegmatis ML63 M. smegmatis mc2155 derivative, attB::pML815; HygR This study M. smegmatis ML64 M. smegmatis mc2155 derivative, attB::pML816; HygR This study M. smegmatis ML65 M. smegmatis mc2155 derivative, attB::pML817; HygR This study
Table 5.5: Bacterial strains. The annotations Sm , Gm and Hyg indicate resistance of the according strain to the antibiotics streptomycin, gentamycin and hygromycin, respectively.
R R R
Oligonucleotide Sequence (5’→3’) 5UTRdown AGAAGCTTGTTCTCCCTAACTGTATCGC5UTRup AGGCATGCGCCAACTGTGAGCGAGGCATattB1 ACGTGGCGGTCCCTACCGattB2 ACAGGATTTGAACCTGCGGCattL01 TCGCCACGTTCGCCCTAGCOLE1 GCGAGTCAGTGAGCGAGGAAGCGHyg-RevII GGCTCGCGTAGGAATCATCClacZ01 GGTGCCGGAAAGCTGGCTGGlacZ02 GTTTGCCGTCTGAATTTGAClacZ03 CTCTATCGTGCGGTGGTTGAlacZ04 CCTGTATGTGGTGGATGAAGlacZ05 TGCCGAAATGGTCCATCAAAlacZ06 CTGTTCCGTCATAGCGATAAlacZ07 ATCAGTTCACCCGTGCACCGlacZ08 TTGGCCTGAACTGCCAGCTGlacZ09 GCTACCATTACCAGTTGGTClacZ_fwd CATGCCATGGAGATCGATCCCGTCGTTlacZ_rev GCTAAAGCTTGGCTGCAGGTlacZPE1 ACGTTGTAAAACGACGGGATlacZPE2 ACCGTGAGGCAAAACCTTTTMP11 GCGGCTGTGGTGCGAAGTGCMP14 CGAAGATCATCCGGCAGATTGMP16 GTTACGACCCGAACATCATCCMP22 CATCCGATCTGGGAGTTCGACMP24 GTGAGGGCACCGTGGCGATCMP27 GCATTTCCTGCCGAGCCTMP32 GAGCGCCCAATACGCAAACCMP-PE2 CACCCGACTGATTGCCTTCAmpp1-fwd ATATATGTTTAAACTCTAGACGCTGCAGTTAACGGAGTCGGGCmpp4 AAGCTCGCATGCCCCTCAGGCCCACCTGTTTTGTTGTCmpp5 ACCTCGGCATGCACCTACTGTGGCTCCCGmpp6 ATCAGTACTCGACTGATTGCCTTCATmpp7 AGCTTAGTTTAAACACCTACTGTGGCTCCCGTGAmpp7fs TTAGTTTAAACACCTACTGTGGCTCCCGTGACCGTCCCTTmpp8 CATACGCATGCTCTAGACGCTGCAGTTAACGGAGTmpp9 GTACGCATGCACTGCAGCGGGTGCGGAAACCGmpp10 CTTAGTTTAAACGGTGGATGAATGCATCCCTAGCmpp11 CTTAGTTTAAACCGCTGCACTGCGTCTTGCACCGmpp12 CTTAGTTTAAACCCGACTGGTCTGGGACAAATTCmpp13 CTTAGTTTAAACAACACCCCTACATGTCGCTGAAmpp14 CTTAGTTTAAACCGCCCCAGAAGCCGTGTTCTCCmpp15 AGGTTTAAACGGTGCGGAAACCGCAACTTGmpp16 AGGTTTAAACTTGCACCGTATCGCCTGCG
- 54 -

Material and Methods
mpp17 AGGTTTAAACACGCAGTGCAGCGAACTCCGmpp18 AGGTTTAAACTACATGTCGCTGAACTACTmpp19 AGGTTTAAACGGGTGTTCGGCCAGGTGCGCmpp20 AGGTTTAAACACCTACTGTGGCTCCCGTGApMS-SEQ1 CGTTCTCGGCTCGATGATCCPromT1C CGCCCTGGCGTTCATGTTTCTGCTPromA2C GCCCTGGCGTTTCTGTTTCTGCTGCPromT6C TGGCGTTTATGTCTCTGCTGCCAACT4g32T_Pme_Sph_fwd ATCGATTAATTAACCCCTGGGATCTCCAGGGGAAAAAATAAAAGTTTAAACATCGCTAAC
GCATG T4g32T_Pme_Sph_rev CGTTAGCGATGTTTAAACTTTTATTTTTTCCCCTGGAGATCCCAGGGGTTAATTAATCGATTrv1324_fwd CTAGTCGGTACCGCGCTCGTCTGCGTCTTAGCGGATTTGGGCACGCCCAAATCCGCTAA
GACGCAGACGAGCGGTTTAAACTTAATTAACGCATG ttnrdB_fwd CTAGTCCCTGGCGAGCAGACGCAAAATCGCCCAATTTCGTGCCGAATTGGGCGATTTTGC
GTCTGCTCGCCAGGTGGTACttnrdB_rev_new CACCTGGCGAGCAGACGCAAAATCGCCCAATTCGGCACGAAATTGGGCGATTTTGCGTCT
GCTCGCCAGGGA ttrevSeq CGGGCCTCTTCGCTATTACGttrv1324_rev_new CGTTAATTAAGTTTAAACCGCTCGTCTGCGTCTTAGCGGATTTGGGCGTGCCCAAATCCGC
TAAGACGCAGACGAGCGCGGTACCGA
Table 5.6: Oligonucleotides. Introduced restriction sites are italic and underlined.
RNA probe for Oligonucleotide Sequence (5’→3’) LengthmspANbfw ATCGCGATGGTTGCAGCCATmspA mspArevT7Prom CTAATACGACTCACTATAGGGAGACGAACGGCGGAGCGGTGA
379 bp
16SNbfw TGCTACAATGGCCGGTACAAA16S rRNA 16SrevT7Prom CTAATACGACTCACTATAGGGAGACGCTTCCGGTACGGCTACCT 298 bp
sigAfwd CGCTGCCAAGCCCGAGGACG 324 bp sigA sigArevT7 CTAATACGACTCACTATAGGGAGAGCGTCTTTGCGTGCCTGTCG lacZfwdNb TGGCTGGAGTGCGATCTTCClacZ lacZrevT7prom CTAATACGACTCACTATAGGGAGACGCCATCAAAAATAATTCGC
244 bp
mspAsRNA1 CTAATACGACTCACTATAGGGAGAGCCCTGGCGTTTATGTTTCT antimspA 1 mspAsRNA2 244 bp CTCGTGAAAAGCGCCGCGAT
mspAsRNA3 CTAATACGACTCACTATAGGGAGAGAAGGCAATCAGTCGGGTGC antimspA 2 mspAsRNA4 GGTAAGACGGTTGCGGTCCA214 bp
mspAsRNA5 CTAATACGACTCACTATAGGGAGAGACGTGAGTGGTTCCACTCCGGantimspA 3 mspAsRNA6 346 bp ACGGCCACGCCACCCTCGGC
mspAsRNA7 CTAATACGACTCACTATAGGGAGAGACAGGTGGGCCTGAGGGGCCantimspA 4 mspAsRNA8 GCACCCGACTGATTGCCTTC91 bp
mspAsRNA9 CTAATACGACTCACTATAGGGAGACTCTTAGATCTCCGAAGTCT antimspA 5 mspAsRNA10 94 bp CCTCAGGCCCACCTGTTTTG
mspAsRNA11 CTAATACGACTCACTATAGGGAGACATCACCCCGAACCTGTTCC antimspA 6 mspAsRNA12 GTTCATGTTCCAGGGTTCGC265 bp
Table 5.7: Oligonucleotides for RNA probe synthesis. Recognition sites for T7-RNA-polymerase are marked in bold.
Plasmid Relevant genotype and properties ReferencepPOR6 3 kbp chrom. fragment with mspA, ColE1 origin, PAL5000 origin; HygR; 8394 bp (Niederweis et al., 1999)pMlacZsd promoterless lacZ, ColE1 origin, PAL5000 origin; HygR; 8692 bp S. Ehrt, unpublishedpMN012 pwmyc-mspA, ColE1 origin, PAL5000 origin; HygR; 6152 bp (Mailänder et al., 2004)pMN013 pimyc-mspA, ColE1 origin, PAL5000 origin; HygR; 6000 bp (Mailänder et al., 2004)pMN016 psmyc-mspA, ColE1 origin, PAL5000 origin; HygR; 6164 bp (Stephan et al., 2005)pMN041 psmyc-SDM-mspA, ColE1 origin, PAL5000 origin; HygR; 6186 bp (Stephan et al., 2005)pML102 int, sacB, ColE1 origin, PAL5000 origin; KanR; 8647 bp (Stephan et al., 2005)pML114 ColE1 origin, attP site, FRT-hyg-FRT; HygR, AmpR; 4365 bp (Mailänder, 2004)pML159 pMN013 derivative, pimyc-lacZ; 8806 bp This work pML160 pMlacZsd derivative, pmspA500-lacZ; 9158 bp This work pML161 pMN012 derivative, pwmyc-lacZ; 8958 bp This work
- 55 -

Material and Methods
pML162 pMlacZsd derivative, promoterless lacZ inverted; 8700 bp This work pML163 pMlacZsd derivative, promoterless lacZ, ttrrnBT2 + ttT4g32; 8730 bp This work pML164 pML163 derivative, pmspA500-lacZ; 9205 bp This work pML165 pML169 derivative, promoterless lacZ, ttnrdB + ttrv1324; 8766 bp This work pML166 pML163 derivative, translational fusion pmspA1100bp::lacZ; 9859 bp This work pML167 pML163 derivative, pmspA1100-lacZ; 9817 bp This work pML168 pML163 derivative, translational fusion pmspA500bp::lacZ; 9247 bp This work pML169 pML163 derivative, promoterless lacZ, ttrv1324; 8697 bp This work pML440 pimyc-phoA, ColE1 origin, PAL5000 origin; HygR; 6896 bp (Mahfoud, 2004)pML800 pML169 derivative, promoterless lacZ, ttrv1324, PacI deleted; 8679 bp This work pML801 pML163 derivative, pmspA600 up-lacZ; 9348 bp This work pML803 pML163 derivative, psmyc-lacZ; 9030 bp This work pML804 pML163 derivative, pimyc-lacZ; 8853 bp This work pML805 pML114 derivative, integration vector for pmspA1100-lacZ; 9093 bp This work pML806 pML114 derivative, integration vector for promoterless lacZ; 8006 bp This work pML807 pML114 derivative, integration vector for psmyc-lacZ; 8306 bp This work pML808 pML163 derivative, pmspA600-lacZ; 9312 bp This work pML809 pML163 derivative, pmspA700-lacZ; 9412 bp This work pML810 pML163 derivative, pmspA800-lacZ; 9512 bp This work pML811 pML163 derivative, pmspA900-lacZ; 9606 bp This work pML812 pML163 derivative, pmspA1000-lacZ; 9711 bp This work pML813 pML163 derivative, pmspA1100 frameshift-lacZ; 9819 bp This work pML815 pML114 derivative, integration vector for pmspA500-lacZ; 8481 bp This work pML816 pML114 derivative, integration vector for pmspA600-lacZ; 8588 bp This work pML817 pML114 derivative, integration vector for pmspA700-lacZ; 8688 bp This work pML820 pML167 derivative, pmspA1100(T1C)-lacZ; 9817 bp This work pML821 pML167 derivative, pmspA1100(A2C)-lacZ; 9817 bp This work pML822 pML167 derivative, pmspA1100(T6C)-lacZ; 9817 bp This work pML823 pML164 derivative, pmspA500+200a (-500 to -700)-lacZ; 9412 bp This work pML824 pML164 derivative, pmspA500+200b (-700 to -900)-lacZ; 9412 bp This work pML825 pML164 derivative, pmspA500+200c (-900 to -1100)-lacZ; 9431 bp This work pML826 pMN016 derivative, psmyc-5’UTRmspA; 5621 bp This work pMS2 ColE1 origin, PAL5000 origin; HygR; 5229 bp (Kaps et al., 2001)
Table 5.8: Plasmids. Derivatives contain the same origins of replication and selection markers as the parental plasmids. ColE1 origin: origin of replication for E. coli; PAL5000 origin: origin of replication for M. smegmatis; HygR: hygromycin resistance; AmpR: ampicillin resistance.
5.2 Media, buffers and solutions Media, buffers and solutions were prepared with de-ionized or Millipore water and autoclaved for 20 minutes at 121°C and 2 bar. Heat-labile substances were dissolved and filtered through a sterile filter of 0.22 µm pore size. If not stated otherwise indicated substances were dissolved in water. If necessary the pH was adjusted and monitored.
5.2.1 Media LB-Broth: 10 g/l Tryptone 7H9-Broth: 4.7 g/l 7H9 Broth 5 g/l Yeast 2.5 ml/l 20% Tween 80
10 g/l NaCl 2 ml/l 100% Glycerol
SOC-Broth: 20 g/l Tryptone 7H10-Agar: 19 g/l 7H10 Agar 5 g/l Yeast 5 ml/l 100% Glycerol 10 mM NaCl 2.5 mM KCl 10 mM MgCl2 10 mM MgSO4 20 mM Glucose
- 56 -

Material and Methods
Hartmans-de 10 ml/l 100x Trace elements Trace elements: 1 g/l EDTA Bont Broth 10 ml/l 100x (NH4)2SO4 (100x for HdB) 10 g/l MgCl2(HdB): 2.5 ml/l 20% Tween 80 0.1 g/l CaCl2 2 ml/l 100% Glycerol 0.02 g/l NaMoO4 10 ml/l 1.5 M Phosphate buffer 0.04 g/l CoCl2 (33 ml/l 1.5 M Citrate buffer) 0.1 g/l MnCl2 0.2 g/l ZnSO4 0.5 g/l FeSO4 0.02 g/l CuSO4
(NH4)2SO4: 200 g/l (NH4)2SO4 Phosphate buffer:145 g/l K2PO4(100x for HdB) (1.5 M for HdB) 85 g/l NaH2PO4
Citrate buffer: 144 g/l Citric acid (1.5 M for HdB) 221 g/l Sodium-citrate Citrate buffer was added to Hartmans-de Bont medium solely for experiments with modified pH. The pH of HdB was then adjusted with either 1 M HCl or 1 M NaOH prior to autoclaving. For the preparation of solid medium, LB was supplemented with 1.2 % (w/v) agar and autoclaved together with all other components. If not stated otherwise solid media were supplemented with X-Gal (for β-galactosidase) or BCIP (for alkaline phosphatase) to a final concentration of 40 µg/ml or 60 µg/ml, respectively, when screening was necessary. Antibiotics were prepared as 1000-fold stock solutions, sterile filtered and added to autoclaved media after cooling down to approximately 50°C in the following concentrations:
Antibiotic final concentration for E. coli M. smegmatis
Ampicillin 100 µg/ml - Hygromycin B 200 µg/ml 50 µg/ml Kanamycin 30 µg/ml 10 µg/ml Streptomycin - 400 µg/ml
Table 5.9: Antibiotics
5.2.2 Buffers and solutions General buffers and solutions TE: 10 mM Tris/HCl pH 8 0.1 mM EDTA Buffers and solutions for DNA agarose gel electrophoresis Agarose gel: 0.8-2%(w/v) Agarose TAE: 0.8 M Tris (0.8-2%) in 1x TAE (20x) 0.4 M Acetic acid 0.025 M EDTA pH 8.3 (Acetic acid) DNA loading 0.1% (w/v) Bromphenolblue buffer: 0.1% (w/v) Xylencyanol (3x) 50% (w/v) Glycerol in 1x TAE Buffer for DNA agarose gel electrophoresis was 1x TAE. The gels were run in horizontal gel chambers with 100 to 150 V for 30 to 60 minutes depending on the loaded fragment lengths. Gels were stained with ethidium bromide and photographed under UV light.
- 57 -

Material and Methods
Buffers and solutions for DNA polyacrylamide gel electrophoresis (PAGE) TBE: 0.45 M Tris PAA Gel: 2.5 ml 40% Acrylamide (5x) 0.45 M Boric acid (10%) 2 ml 5x TBE 0.01 M EDTA 7.4 ml Millipore pH 8.3 (Boric acid) 0.2 ml 10% APS
0.01 ml TEMED Denaturing 0.04 M Urea PAA Gel: 16 ml 5x TBE (8%) 30 ml Millipore 16 ml 40% Acrylamide 0.2 ml 10% APS 0.08 ml TEMED Gels for DNA PAGE were run in 1x TBE in vertical gel chambers with 120 V for 60 to 100 minutes under constant cooling by a fan. Gels were stained with ethidium bromide and photographed under UV light. Denaturing DNA PAGE for sequencing gels were run in 1x TBE. Detailed conditions are described in chapter 5.6.9. Buffers and solutions for RNA agarose gel electrophoresis Denaturing 1.2% (w/v) Agarose RNA loading 0.2% (w/v) Bromphenolblue agarose gel: 1x MOPS buffer: 0.2% (w/v) Xylencyanol (1.2%) dissolve at 68°C (3x) 65% (v/v) Formamide 3% (v/v) Formaldehyde 12% (v/v) Formaldehyde 2x MOPS 2% (v/v) Sucrose Buffer for RNA gel electrophoresis was 1x MOPS. Samples (1 to 3 µg of total RNA) were mixed with loading buffer, heated to 65°C for 10 minutes and cooled down on ice before loading. The gels were run in horizontal gel chambers with 70 V for 180 minutes. Gels were stained with ethidium bromide and photographed under UV light. Before blotting, gels were de-stained in H20Millipore for at least 2 hours. Buffers and solutions for RNA preparation GTC: 5 M Guanidinium isothiocyanate Killing buffer: 0.02 M Tris-HCl (pH 7.5) 0.02 M N-Laurylsarcosine 0.005 M MgCl2 0.025 M Sodium citrate 0.02 M NaN3 0.7% (v/v) β-Mercaptoethanol Buffers and solutions for denaturing protein PAGE (Schägger & von Jagow, 1987) Collection gel: 1 ml Acrylamide (37.5:1) Separation gel: 4.5 ml Acrylamide (37.5:1) (4%) 2.6 ml 3x gel buffer (10%) 4.5 ml 3x gel buffer 4 ml Millipore 3 ml Millipore 0.16 ml 10% APS 1.35 g glycerol 0.01 ml TEMED 0.135 ml 10% APS 0.015 ml TEMED 4x PAP 0.14 M Tris-HCl pH 7 3x gel buffer: 3 M Tris 30% (w/v) glycerol 0.3% (v/v) SDS 4% (w/v) SDS pH (HCl) 8.45 0.1% (w/v) Bromphenolblue Anode buffer: 1 M Tris Cathode buffer: 1 M Tris (10x) pH (HCl) 8.9 (10x) 1 M Tricin 1% (v/v) SDS pH (HCl) 8.25 Buffers for SDS PAGE were 1x cathode and 1x anode buffers respectively. Gels were run in vertical gel chambers at 120 V for 100 to 120 minutes under constant cooling by a fan.
- 58 -

Material and Methods
Buffers for selective purification of MspA 3x PEN Buffer: 0.3 M Na2HPO4/NaH2PO4 PN05 Buffer: 1x PEN 0.3 mM Na2EDTA 0.5% (v/v) n-octyl-POE 0.45 M NaCl Buffers and solutions for Western blot analysis TBST: 0.1 M Tris-HCl pH 8 Transfer Buffer: 0.01 M NaHCO3(10x) 1.5 M NaCl 0.003 M Na2CO3 0.5% Tween 20 20% Methanol Blocking: 5% (w/v) fat free milk powder Primary Antibody 1/2000 #813 Anti-MspA in 1x TBST Solution: 1% (w/v) fat free milk powder in 1x TBST Secondary 1/5000 α-rabbit-IgG-HRP Antibody in 1x TBST Solution: Buffers and solutions for Northern and dot blot analysis 20x SSC: 3 M NaCl Denaturation: 0.01 M NaCl 0.3 M Trisodiumcitrate 0.05 M NaOH pH 7.0 (1 M HCl) Neutralization: 0.1 M Tris-HCl MOPS: 0.2 M MOPS pH 7.4 (1M HCl) (10x) 0.05 M Sodium-acetate
0.01 M EDTA pH 7 (1M NaOH)
10x Maleic 1 M Maleic acid Detection Buffer: 0.1 M Diethanolamine Acid Buffer: 1.5 M NaCl pH 7.5 (NaOH) Blocking stock: 10 g Blocking powder Blocking 10% (v/v) Blocking stock 100 ml 1x Maleic acid buffer Solution: in 1x Maleic acid buffer Dissolve at 68°C prior to autoclaveing Stringency 2x SSC Stringency 0.5x SSC Buffer 1: 0.1% (v/v) SDS Buffer 2: 0.1% (v/v) SDS Prehybridi- 5x SSC Antibody 1/10000 Anti-DIG-AP zation: 50% (v/v) Formamide solution: in blocking solution 0.1% (v/v) N-laurylsarcosine 0.02% (v/v) SDS 2% (v/v) Blocking Stock Buffers for primer extension reaction Hybridization 1.5 M KCl RT buffer: 0.1 M Tris-HCl (pH 8.2) buffer: 0.1 M MgCl2 0.012 M MgCl2(10x) 0.01 M EDTA 0.02 M DTT 0.4 mM each dNTP
- 59 -

Material and Methods
Buffer for combined polymerase-chain reaction (CCR) CCR buffer: 0.2 M TrisHCl pH 8.4 10x 0.03 M MgCl2 0.5 M KCl 5 mM NAD
5.3 General methods General and established methods and protocols applied during these studies are summarized in table 5.10, commercially available reagent systems (“kits”) are listed in table 5.11.
Method Reference Determination of DNA / RNA concentrations (Ausubel et al., 1987) Ethidium bromide staining of DNA (Ausubel et al., 1987) Gel electrophoresis of DNA (Ausubel et al., 1987) Ligation of DNA fragments (Ausubel et al., 1987) DNA sequencing (Sanger et al., 1977) Transformation of E. coli (Hanahan et al., 1991) Preparation of competent E. coli (Hanahan et al., 1991) Northern blot analysis (Alwine et al., 1977) DNA precipitation (Ausubel et al., 1987)
Table 5.10: General methods
System Application Manufacturer BigDye® Termination Mix DNA sequencing Applied Bioscience DIG RNA Labeling Kit Northern Blot analysis Roche ECL Plus™ Western Blot analysis GE Healthcare GFX™ PCR purification Kit DNA purification and gel elution GE Healthcare Nucleobond® PC100 Plasmid preparation Macherey-Nagel Nucleospin® Plasmid Plasmid preparation Macherey-Nagel Nucleospin® Extract II DNA purification and gel elution Macherey-Nagel Sequenase™ Version 2.0 DNA sequencing USB QIAquick nucleotide removal kit DNA purification QIAGEN QIAquick PCR purification kit DNA purification QIAGEN
Table 5.11: Commercially available systems (“kits”)
5.4 Growth of bacteria If not otherwise stated E. coli was grown in liquid or on solid LB broth, M. smegmatis was grown either in liquid 7H9, in liquid HdB or on solid 7H10 broth. Both were incubated at 37°C under constant agitation. Growth was monitored by measuring the optical density at 600 nm. Inoculation was conducted by supplying cells from a pre-culture or from freshly spread colonies. Culture plates of M. smegmatis were wrapped with parafilm to avoid drying out. Cultures needed for pH dependent gene expression analysis were grown in neutral HdB medium without citrate buffer to an OD600 of 0.6 to 0.8, harvested and resuspended in an equal volume of HdB medium of defined pH containing 50 mM citrate buffer. Subsequently, cell suspensions were incubated at 37°C for additional 2.5 to 3 hours prior to further experiments. For plate assays, M. smegmatis SMR5 was grown to an OD600 of about 0.8, diluted to approximately 1000 CFU ml-1 and 200 µl were plated.
- 60 -

Material and Methods
5.5 Transformation of bacteria
5.5.1 Transformation of chemically competent E. coli RbCl2 competent cells of E. coli (Table 5.10) were thawed on ice and 100 µl cells were carefully mixed with 10 to 100 ng plasmid DNA. After 1 hour incubation on ice, the cells were exposed to 42°C for 90 seconds (heat-shock). 200 µl SOC broth was added followed by an outgrowth at 37°C for 1 hour before the cells were spread on selective media and incubated at 37°C. Verified singled candidates were grown over night, adjusted to a final concentration of 20% glycerol, shock frosted in liquid N2 and kept at -80°C as stock cultures for further use.
5.5.2 Electroporation of M. smegmatis Preparation of the cells: A required volume of 7H9 broth was inoculated with 4 ml filtered (pore size 5 µm) pre-culture of M. smegmatis and incubated until an OD600 of 0.6 to 0.8 was reached. Washing of the culture was achieved by repeated centrifugation (4°C, 4000 rpm, 15 min) and resuspension in 10% ice-cold glycerol: First in 1/4th of the original volume, then in 1/10th, in 1/25th and finally in 1/100th. Aliquots of 100 µl were shock-frosted in liquid N2 and stored at -80°C. Transformation: The cells were thawed on ice, carefully mixed with 0.5 to 1 µg plasmid DNA and transferred to a pre-cooled electroporation cuvette. After pulsing (U = 2.5 kV, R = 800 Ω, C = 25 µF), the bacteria were supplied with 1 ml SOC broth and outgrown for 3 hours at 37°C. Afterwards, the cells were plated on selective 7H10 medium and incubated for at least 3 days at 37°C. Verified singled candidates were grown for 3 days, adjusted to a final concentration of 20% glycerol, shock frosted in liquid N2 and kept at -80°C as stock cultures for further use.
5.6 Methods for nucleic acid purification, modification and analysis
5.6.1 Plasmid purification Plasmid DNA of E. coli cultures was extracted and purified during exponential growth phase utilizing a modified alkaline / SDS lysis either with Nucleospin Plasmid using a 4 ml overnight culture or with Nucleobond AX100 using a 100 ml overnight culture following the instructions of the manufacturer (Table 5.11).
5.6.2 Preparation of chromosomal DNA from mycobacteria Chromosomal DNA of M. smegmatis was extracted using the method described in (Stahl et al., 2001). A 50 ml culture was grown to an oD600 of 0.8 to 1, harvested (4°C, 4000 rpm, 15 min), resuspended in 1.5 ml TE buffer, 150 µl lysozyme (10 mg/ml) and 30 µl RNase A (10 mg/ml) were added and the mixture was incubated for 90 minutes at 37°C under continuous agitation. 210 µl 10% SDS and 60 µl Proteinase K (10 mg/ml) were added and the tubes were incubated at 65°C for 75 minutes. 300 µl 5 M NaCl and 240 µl 10% CTAB solution were supplied after 45 minutes. The lysed cells were mixed with 1.5 ml chloroform and harvested as described. The aqueous phase was mixed with 1.5 ml phenol and centrifuged. The upper phase was removed and added to 1.5 ml chloroform-isoamylalcohol (24:1). After a last centrifugation step, the chromosomal DNA in the aqueous phase was precipitated with 1 ml isopropanol, washed with 70% ethanol, dried and resuspended in TE buffer for PCR analysis.
- 61 -

Material and Methods
5.6.3 Polymerase chain reaction (PCR) The polymerase chain reaction was carried out either with chromosomal or plasmid DNA as template. Unless otherwise stated the following general protocol was used: Reagents: 10 ng plasmid DNA or PCR profile: 0.1 µg chromosomal DNA 10 pmol 3‘-oligonucleotide 10 pmol 5’-oligonucleotide 1 µl 10x polymerase buffer 1 µl 2.5 mM dNTPs 2.5 U Polymerase ad 10 µl H2OMillipore dNTPs: 2.5 mM dATP, 2.5 mM dCTP, 2.5 mM dGTP, 2.5 mM dTTP The annealing temperature was 50 to 70°C depending on the melting temperature of the applied oligonucleotides. The reaction mixture was analyzed by running 1/10th of the sample on an agarose gel. Amplified DNA was either precipitated or purified with Nucleospin® Extract II or with GFX™ PCR purification Kit.
5.6.4 Site-directed mutagenesis by combined polymerase chain reaction (CCR) The method of the CCR was used as described previously (Mahfoud et al., 2006). To introduce a point mutation during a PCR at a defined position two end-primers and one mutagenesis primer with one exchanged nucleotide were designed (table 5.6). The mutagenesis primer was 5’-phosphorylated to enable ligation to the 3’-OH-end of the synthesized DNA fragments during each cycle of the amplification process. Reagents: 100 ng plasmid DNA CCR profile: 5 µl 10x CCR buffer 20 pmol 3‘-oligonucleotide (EP1) 20 pmol 5’-oligonucleotide (EP2) 30 pmol mutagenesis oligonucleotide (MP) 5 µl 2.5 mM dNTPs 5 µl BSA (4 mg/ml) 2.5 U Pfu-DNA-Polymerase 3 U Ampliligase, thermostable
ad 50 µl H2OMillipore
Concerning analysis and purification, CCR samples were treated similar to PCR samples (chapter 5.6.3). Fig. 5.1: Schematic representation of CCR (Bi & Stambrook, 1997). Depicted is one cycle of a CCR under above documented conditions. EP: end-primer; MP: mutagenesis primer, P indicates phosphorylation of the 5’-end, the asterisk marks the inserted mutation.
- 62 -

Material and Methods
5.6.5 Phosphorylation of oligonucleotides If necessary, the oligonucleotides were phosphorylated at the 5’-end prior to use. The following protocol for the T4 polynucleotide kinase refers to the recommendations of the manufacturer: For primer annealing : 200 pmol oligonucleotide 10 mM ATP 0.5 U T4 Polynucleotide kinase 2 µl 10x T4 PNK buffer Ad 20 µl H20Millipore For primer extension: 20 pmol oligonucleotide 5 µl [γ-32P] ATP 3 U T4 Polynucleotide kinase 5 µl 10x T4 PNK buffer Ad 50 µl H20Millipore Carefully mixed samples were incubated at 37°C for 30 minutes and purified.
5.6.6 Primer annealing For construction of smaller fragments up to 100 bp, anti-parallel oligonucleotides were designed. Annealing of a pair of 5’-phosphorylated oligonucleotides resultet in a double stranded DNA fragment with restriction site compatible ends depending on the purpose. Annealing was carried out by mixing two phosphorylation samples (Chapter 5.6.5), maintaining a temperature of 90°C for 20 minutes and letting them cool down slowly to room temperature. For verification 100 ng of each oligonucleotide and of the annealing reaction were loaded on a 10% DNA PAA gel (Chapter 5.2.2) and run at 100 V for about 1 hour. Double stranded fragments ran slower and proved successful annealing.
5.6.7 Restriction and ligation Restriction enzymes were purchased from New England Biolabs exclusively. To digest up to 5 µg DNA, enzyme units, corresponding buffers, temperature and incubation time were adjusted dependent on DNA amounts following the instructions of the manufacturer. Restrictions were purified using kits or by precipitation and were confirmed by DNA gel electrophoresis. Ligation of fragments was achieved by using T4 Ligase and corresponding buffer according to the manufacturer’s instructions over night at 14°C. Samples were used to transform E. coli which was grown on selective medium. Positive clones were separated and inoculated, the plasmids were extracted and verified by restriction analysis and sequencing.
5.6.8 Construction of plasmids Transcriptional terminators: Anti-parallel primer pairs covered the whole terminator structure: T4g32T_Pme_Sph_fwd and T4g32T_Pme_Sph_rev raised ttT4g32, ttnrdB_fwd and ttnrdB_rev_new raised ttnrdB and Trv1324_fwd and ttrv1324_rev_new raised ttrv1324 (Table 5.6). After phosphorylation (Ch. 5.6.5) and annealing (Ch. 5.6.6) of each primer pair, ttT4g32 and ttrv1324 had compatible ends to the backbone of pMlacZsd digested with PmeI / SphI and SpeI / SphI, respectively. Ligation of the backbone with ttT4g32 and ttrv1324 resulted in plasmids pML163 and pML169, respectively (Table 5.8). To gain ttrv1324 + ttnrdB, pML169 was cut with KpnI and SpeI and ligated with ttnrdB, resulting in pML165. To delete the PacI restriction site of pML169, it was digested with PmeI and SphI and relegated to yield pML800 (ttrv1324 ∆PacI). Fusions of the mspA promoter to lacZ: An initial fusion of the mspA promoter with lacZ was obtained by PCR (Ch. 5.6.3) from the template pPOR6 with the primer pair mpp1-fwd and mpp4 for the pmspA500 bp fragment, subsequent restriction with PmeI and SphI and ligation to the backbone of similar cut pMlacZsd (resulting in pML160). Digestion of pMlacZsd with SphI and HindIII and concomitant ligation to the equally cut backbone of pMN013 and pMN012 yielded fusions of pimyc
- 63 -

Material and Methods
(pML159) and pwmyc (pML161) with lacZ, respectively. Further mspA promoter fragments were amplified by PCR from the template pPOR6 using the following primers: mpp4 and mpp1-fwd for pmspA500 bp (pML164), mpp4 and mpp7 for pmspA1100 bp (pML167), mpp7 and mpp9 for pmspA600 bp up (pML801), mpp4 and mpp10 for pmspA600 bp (pML808), mpp4 and mpp11 for pmspA700 bp (pML809), mpp4 and mpp12 for pmspA800 bp (pML810), mpp4 and mpp13 for pmspA900 bp (pML811) and mpp4 and mpp14 for pmspA1000 bp (pML812). Obtained fragments were digested with PmeI and SphI and ligated to the backbone of similar cut pML163. For fusing three different 200 bp fragments dividing the “600 bp up” fragment to pmspA500 bp, a PCR with the primers mpp15 and mpp16 (200 bp at position -500 to -700 bp relative to mspA, “200a”), mpp17 and mpp18 (200 bp at -700 to -900, “200b”) and mpp19 and mpp20 (200 bp at -900 to -1100, “200c”) and the template pPOR6 was performed. The obtained products were digested with PmeI and ligated to the backbone of similar cut pML164 to yield pML823, pML824 and pML825, respectively. A translational fusion was obtained by amplification of pPOR6 with the primers mpp5 and mpp6 by PCR, maintaining the sequence of the first seven amino acids of mspA, but modifying the codon usage to insert a ScaI restriction site. The lacZ gene was amplified from pMlacZsd with lacZ_fwd and lacZ_rev. Subsequent restriction was performed with SphI and ScaI for the promoter fragment and with NcoI and HindIII for lacZ. The 5’ overhang of the NcoI site was filled up with T4 DNA Polymerase and ligation of both fragments to the backbone of SphI and HindIII cut pML163 yielded pML166. Integrating fusions of the mspA promoter to lacZ: The plasmids pML163, pML164, pML167, pML803, pML808 and pML809 were digested with SpeI and HindIII. The obtained promoter-lacZ fragments were ligated to the similar cut backbone of pML114 to result in pML806 (lacZ without promoter), pML815 (pmspA500 bp), pML816 (pmspA600 bp), pML817 (pmspA700 bp), pML805 (pmspA1100 bp) and pML807 (psmyc). Promoter point mutations: To obtain the same fragment as in pML167 (Table 5.8) but with site-specific point mutations in the mspA promoter at position -142 to -147 relative to the gene start, a CCR (Ch. 5.6.4) was carried out using the same end-primers and three mutational primers. The primers PromT1C, PromA2C and PromT6C (Table 5.6) replaced the highest conserved nucleotides T at position 1, A at 2 and T at 6 with a C, respectively (Fig 3.8). All fragments were digested with PmeI and SphI and ligated to the backbone of similar digested pML163 (Table 5.8) to result in pML167 (1100 bp promoter fragment), pML820 (1100 bp with substitution T1C), pML821 (1100 bp with substitution A2C) and pML822 (1100 bp with substitution T6C) (Fig. 3.11). 5’ mspA UTR overexpression: 135 bp of the upstream fragment of mspA were amplified by PCR using primers 5UTRup and 5UTRdown and the template pPOR6. The product was digested with HindIII and SphI and ligated with the backbone of similar cut pMN016 to obtain pML826 (Fig. 3.17).
5.6.9 RNA preparation Culture volumes of 20 to 40 ml of M. smegmatis SMR5 were grown in HdB medium or in 7H9 medium until an OD600 of 0.8 to 1 was reached and RNA was extracted. If the RNA was required for Northern or dot blots or for primer extension reactions, the sodium azide method was used as described previously (Stephan et al., 2004a). For microarray experiemnts the guanidinium isothiocyanate protocol was utilized: Sodium azide protocol: The cultures were mixed with half of the volume of pre-cooled killing buffer. The cell suspension was incubated for 5 minutes on ice. Cells were harvested by centrifugation (4°C, 8500 rpm, 10 min), resuspended in buffer RA1 (Nucleospin® RNA II kit) with β-mercaptoethanol and lysed by agitation with glass beads (FastRNA Tubes-Blue) in a FastPrep® FP220 bead beater apparatus for 3x 20 seconds at level 6.5. Suspensions were cooled on ice for 5 minutes between agitation steps. Further processing of the sample to purify the RNA was performed using the Nucleospin® RNA II kit following the manufacturer’s instructions. Guanidinium isothiocyanate protocol: The cultures were immediately mixed with the same volume of GTC-buffer and harvested by centrifugation (4°C, 3500 rpm, 10 min). The pellets were resuspended in 1 ml TRIzol®, transferred to glass bead tubes (FastRNA Tubes-Blue) and lysed by agitation as described above. Glass beads were pelleted by centrifugation (4°C, 13000 rpm, 1 min). The supernatant was mixed with 300 µl chloroform, the sample was incubated for 2 minutes and centrifuged (4°C, 11000 rpm, 10 min).
- 64 -

Material and Methods
Supernatant without interphase was collected, mixed with 500 µl 80% ethanol and transferred to Nucleospin® RNA II blue columns. Further on the protocol for the Nucleospin® RNA II kit was followed starting with the MDB buffer washing step. Finally the total RNA was eluted with 58 µl of RNase free H2O and 5 µl were used for spectrophotometrical determination of the RNA concentration. When the preparation was successful, 6 µl of 10x TurboDNase buffer and 1 µl of TurboDNase were added, mixed carefully and incubated for 1 hour at 37°C. DNase treatment was stopped by adding 350 µl buffer RA1 (Nucleospin® RNA II kit) with β-mercaptoethanol. After providing 250 µl of 100% ethanol samples were loaded on Nucleospin® RNA II blue columns and centrifuged (RT, 8000 rpm, 30 sec). Washing was done twice with 600 and 250 µl RA3 buffer. RNA was eluted in a final volume of 50 µl DNase free water and stored at -80°C for further use.
5.6.10 Primer extension For primer extension reactions gene-specific reverse primers MP-PE2 (binding directly at the gene start of mspA) and lacZPE2 (binding approximately 400 bp upstream of mspA) were designed (Table 5.6). After phosphorylation (Chapter 5.6.5), the primers were purified using the QIAquick nucleotide removal kit and eluted in 50 µl H2OMillipore. 0.4 pmol [γ-32P] end-labeled primers were annealed to 10 μg total RNA from exponential-phase cultures of M. smegmatis SMR5 in 1x hybridization buffer. Samples were denatured for 5 minutes at 95°C and hybridized for 2 hours at 50°C. cDNA was synthesized using AMV reverse transcriptase and the corresponding RT buffer. The reaction was incubated at 42°C for 1 hour. For sequencing 5 μg of the plasmid pPOR6 and the according primers were used. Plasmid DNA was denatured in 0.2 M NaOH and 0.2 mM EDTA for 30 minutes at 37°C, precipitated and redissolved in 7 μl H20. The [γ-32P] end-labeled primers corresponding to the primer extension were annealed and sequencing was performed using USB® Sequenase Version 2.0™ sequencing kit following the manufacturer’s guidelines. To achieve stronger signals, [α-33P] dATPs were included in the reaction. All samples were mixed with 4 µl of the loading dye of the USB® Sequenase Version 2.0™ sequencing kit and were denatured at 75°C for 5 minutes prior to loading on the gel. A 0.1 mm thick 8 % denaturing polyacrylamide gel (7 M urea) was pre-warmed by running at 1500 V for 10 minutes. The sequencing samples together with the corresponding primer extension reactions were loaded on the gel, empty lanes were loaded with 4 µl dye and gel electrophoresis was performed at 1500 to 2000 V maintaining a gel temperature of 50°C. Radioactive signals were visualized by exposing X-ray films to the gels at -80°C for 1 to 6 days.
5.6.11 Northern blot analysis Amounts of 1 to 3 μg of total RNA of M. smegmatis SMR5 were loaded on a denaturing RNA gel. Gel electrophoresis was done at 70 V for 3 to 4 hours in 1x MOPS. The RNA was transferred onto a positively charged nylon membrane by using a vacuum blot apparatus at 60 mbar. The gel was constantly soaked, first with denaturing and neutralizing buffer for 10 minutes respectively, and then with 20x SSC for 3 hours. After the transfer, the RNA was cross-linked twice to the membrane with UV light at 1200 kJ. The membrane was incubated at 68°C in a hybridization oven with pre-hybridization solution for 2 hours and overnight at 68°C with an RNA probe (Chapter 5.6.12). To remove unspecific bound probe the membrane was washed twice for 5 minutes in stringency buffer 1 at room temperature and three times for 15 minutes in stringency buffer 2 at 68°C. For detection, the membrane was equilibrated in 1x maleic acid buffer for one minute, then incubated for 30 minutes in blocking buffer and for 30 minutes in blocking buffer containing anti-Digoxigenin-AP antibody. Then, the membrane was washed twice for 15 minutes in 1x maleic acid buffer and for 5 minutes in detection buffer. All incubation steps were performed under gentle shaking at room temperature. The membrane was completely covered with CDP* and incubated in darkness for 5 minutes. Chemiluminescent signals on the membrane were photographed and detected bands were densitometrically quantified in a UVP® EpiChemi™ II Darkroom using the LabWorks™ software. If not stated otherwise, detection of the 16S rRNA was performed as a control and the amounts of mspA transcripts were normalized to that of 16S rRNA in the same sample.
- 65 -

Material and Methods
5.6.12 Dot blot analysis Amounts of 1 to 3 µg of total RNA of M. smegmatis SMR5 were loaded directly on a positively charged nylon membrane. To avoid differences in dot size when using equal amounts of total RNA, the RNA concentrations of all samples were adjusted to 500 to 600 ng µl-1. The membrane was dried and cross-linked as described above. Hybridization and detection were performed similar to Northern blot analysis.
5.6.13 RNA probe synthesis for Northern and dot blots RNA probes for sigA and the 16S rRNA were amplified from chromosomal DNA of M. smegmatis SMR5 by PCR using specifically designed primer pairs (Table 5.7). Probes for the mspA gene, mspA antisense RNAs and lacZ were amplified from the plasmids pPOR6 and pMlacZsd (Table 5.8), respectively. A recognition site for the T7 RNA polymerase was added to the 5’-ends of the reverse primers. However, due to their anti-parallel character, the T7 RNA polymerase recognition site was added to the 5’-ends of the forward primers for probes designed to detect antisense RNAs. The PCR products were purified by elution from agarose gels and quantified. 200 ng were used for in vitro transcription using the Roche® DIG RNA Labeling Mix according to the manufacturer’s instructions. The digoxygenin labeled RNA probes were purified by elution from agarose gels, precipitated and resuspended in 50 μl RNase free water. For hybridization over night 10 μl of an RNA probe were added to 10 ml prehybridization solution. All primer pairs and probe lengths are summarized in table 5.7.
5.7 Extraction and analysis of proteins
5.7.1 Selective extraction of porins of M. smegmatis Extraction was performed as described previously (Heinz & Niederweis, 2000; Heinz et al., 2003). Cultures of M. smegmatis were grown to an OD600 of 0.9 to 1, harvested (4°C, 8000 rpm, 15 min), washed once with 1/4th of the starting volume 1x PBS and resuspended in 1/20th 1x PBS. The cell suspension was transferred into a new tube of known weight, centrifuged (4°C, 8000 rpm, 15 min) and the supernatant was discarded. The wet weight of the cells was determined and every 10 mg cells were resuspended in 35 µl POP05 buffer. The samples were incubated in boiling water for 30 minutes under constant stirring, cooled on ice and centrifuged (4°C, 4000 rpm, 15 min). The supernatant was collected and stored at 4°C for further analysis.
5.7.2 Western blot analysis Of the above described supernatant 1 µl was mixed with 8 µl POP05, 3 µl 4x PAP and objected to protein PAGE. Electrophoresis was performed at 120 V for 1 to 2 hours. As molecular weight standard, MagicMarkTM XP Western protein standard was used, as mass standard purified MspA of known concentration was loaded. The PAA gel and a nitrocellulose membrane were equilibrated for 30 minutes in transfer buffer. Proteins were blotted onto the membrane using a blot module Mini Tank VEP-2 running over night with 50 mA and being filled with transfer buffer. For all following steps, the membrane was incubated at room temperature under constant shaking. It was incubated for 60 minutes in blocking solution. Afterwards the primary antibody solution was applied for 60 minutes. Washing occurred in 1x TBST for 3x 5 minutes. Subsequently the secondary antibody solution was provided for 60 minutes, followed by washing with 1x TBST for 3x 5 minutes. Detection was carried out with the ECL+ kit according to the manufacturer’s recommendations. Signals were visualized and photographed with a EpiChemi™ II Darkroom in connection with the LabWorks™ software or by exposing an x-ray film to the membrane.
- 66 -

Material and Methods
5.7.3 Alkaline phosphatase activity measurement Culture volumes of 20 ml of M. smegmatis SMR5 were grown to an OD600 of 0.6 to 0.8. 1 ml was harvested (4°C, 5000 rpm, 10 min) and resuspended in 1 ml Tris HCl pH 8. 100 µl were taken for determination of the precise OD600. 300 µl of the cell suspension were sonicated using the following settings: 2 complete intervals of 20 seconds, pulse on 9/10 seconds, pulse off 5/10 seconds, strength 3. Between intervals, the samples were kept on ice. 100 µl of the lysed cells and 100 µl of the cell suspension in Tris HCl pH 8 were taken and mixed with 1 ml Tris HCl pH 8 containing 4 mM p-nitrophenyl phosphate (pNPP) respectively. The samples were incubated in darkness for 30 minutes and absorption of p-nitrophenol was determined at 420 nm. All measurements were performed in triplicate. Alkaline phosphatase activity was calculated using the following equation: U: Activity of alkaline phosphatase OD405: absorbance of p-nitrophenol OD600: cell density t: reaction time in minutes
VODtODU
⋅⋅=
600
405
V: volume of assayed cell suspension in ml
5.7.4 β-galactosidase activity measurement Substrate ONPG: To determine β-galactosidase activity of recombinant or wild-type M. smegmatis, cells were grown in 7H9 medium to an OD600 of 0.8 to 1. For measuring activity at defined pH, cells were grown in HdB medium as described above (5.4) and incubated under different conditions for 2.5 to 3 hours. In general, samples of 1 ml were taken, harvested (4°C, 3500 rpm, 5 min) and resuspended in the same volume of corresponding 7H9 or neutral HdB medium, respectively. OD600 was determined with 100 µl of these samples. The remaining 900 µl were sonicated using the following settings: 2 complete intervals of 20 seconds, pulse on 9/10 seconds, pulse off 5/10 seconds, strength 3. Between intervals, the samples were kept on ice. 200 µl of sonicated cells were mixed with 800 µl of freshly prepared LacZ medium consisting of 1x LacZ buffer and 600 µl of 7H9 or neutral HdB medium, depending on previous growth conditions. The samples were pre-warmed at 28ºC for 15 minutes, 200 µl ONPG (4 mg ml-1 in 1x LacZ buffer) were added and the time was taken. Samples were incubated at 28ºC until they turned yellow. Then, β-galactosidase was inactivated by adding 500 µl 1 M Na2CO3 and the time was stopped. Absorption was measured at 420 and 550 nm and Miller Units (MU) were calculated using the following equation: MU: Miller Units OD420: absorbance of o-nitrophenol OD550: scatter from cell debris ( ) OD600: cell density
100075.1600
550⋅
⋅⋅⋅−
V: volume of assayed cell suspension in ml t: reaction time in minutes Substrate C2FDG: To determine β-galactosidase activity of recombinant or wild-type M. smegmatis, cells were grown in 7H9 medium to an OD600 of 0.4 to 0.5. Of the growing cultures, 100 µl cells were transferred to 96-well-plates and mixed with 10 µl of a 330 µM stock solution of C2FDG. For background normalization, three wells were incubated with cells in the absence of substrate. The plates were incubated at 37°C and relative fluorescence units were determined in a plate reader after selected intervals. For measuring activity at defined pH, cells were grown in neutral HdB medium as described above (5.4), harvested and resuspended in similar volumes of HdB medium with adjusted pH. Then, 100 µl of this cell suspension were taken for the plate assay.
=MUtVOD
ODOD420
- 67 -

Material and Methods
5.8 Computer analyses For processing DNA, oligonecleotide and protein sequence data, Vector NTI™ suites 7 and 8 were used. For raw data analysis, statistical methods and graph generation SigmaPlot® 8 and 9 were employed. Gel electrophoresis and immunoblot pictures were taken and densitometrical analyzed with LabWorks™or Mulitanalyst®. DNA and protein databank searches were performed using the BLAST server of the National Center for Biotechnology Information at the National Institutes of Health, Bethesda, USA (http://www.ncbi.nlm.nih.gov). Sequences of mycobacteria were obtained either from TIGR (http://www.tigr.org) or from Institute Pasteur (http://genolist.pasteur.fr/TubercuList). RNA folding predictions were made with RNAstructure® 4.3 (Mathews et al., 2004).
5.8.1 GeSTer Genomic search for terminators was performed with GeSTer (Genome scanner for transcriptional Terminators), kindly provided, supported and described by (Unniraman et al., 2001). This algorithm scans whole prokaryotic genomes and recognizes stem loops in intergenic regions downstream of open reading frames. The following settings were employed to scan the annotated genome sequence of M. tuberculosis (GenBank™ accession number AL123456).: stem length 9 to 99 bp, loop length 3 to 9 bp and the location from 0 to 270 bp downstream of an open reading frame. The result is listed in table 7.1.
- 68 -

References
6 References Achouak, W., Heulin, T. & Pages, J. M. (2001). Multiple facets of bacterial porins. FEMS Microbiol Lett 199, 1-7. Agarwal, N. & Tyagi, A. K. (2006). Mycobacterial transcriptional signals: requirements for recognition by RNA polymerase and optimal transcriptional activity. Nucleic Acids Res 34, 4245-4257. Alland, D., Steyn, A. J., Weisbrod, T., Aldrich, K. & Jacobs, W. R., Jr. (2000). Characterization of the Mycobacterium tuberculosis iniBAC promoter, a promoter that responds to cell wall biosynthesis inhibition. J Bacteriol 182, 1802-1811. Alwine, J. C., Kemp, D. J. & Stark, G. R. (1977). Method for Detection of Specific RNAs in Agarose Gels by Transfer to Diazobenzyloxymethyl-Paper and Hybridization with DNA Probes. Proceedings of the National Academy of Sciences 74, 5350-5354. Arnold, T. E., Yu, J. & Belasco, J. G. (1998). mRNA stabilization by the ompA 5' untranslated region: two protective elements hinder distinct pathways for mRNA degradation. Rna 4, 319-330. Arnvig, K. B., Gopal, B., Papavinasasundaram, K. G., Cox, R. A. & Colston, M. J. (2005). The mechanism of upstream activation in the rrnB operon of Mycobacterium smegmatis is different from the Escherichia coli paradigm. Microbiology 151, 467-473. Arraiano, C. M. & Maquat, L. E. (2003). Post-transcriptional control of gene expression: effectors of mRNA decay. Mol Microbiol 49, 267-276. Ausubel, F. M., Brent, R., Kingston, R. E., Moore, D. D., Seidmann, J. G., Smith, J. A. & Struhl, K. (1987). Current Protocols in Molecular Biology. New York: John Wiley & Sons. Banerjee, S., Chalissery, J., Bandey, I. & Sen, R. (2006). Rho-dependent transcription termination: more questions than answers. J Microbiol 44, 11-22. Barry, C. E., 3rd, Lee, R. E., Mdluli, K., Sampson, A. E., Schroeder, B. G., Slayden, R. A. & Yuan, Y. (1998). Mycolic acids: structure, biosynthesis and physiological functions. Prog Lipid Res 37, 143-179. Bashyam, M. D., Kaushal, D., Dasgupta, S. K. & Tyagi, A. K. (1996). A study of mycobacterial transcriptional apparatus: identification of novel features in promoter elements. J Bacteriol 178, 4847-4853. Bashyam, M. D. & Tyagi, A. K. (1998). Identification and analysis of "extended -10" promoters from mycobacteria. J Bacteriol 180, 2568-2573. Batchelor, E., Silhavy, T. J. & Goulian, M. (2004). Continuous control in bacterial regulatory circuits. J Bacteriol 186, 7618-7625. Batchelor, E., Walthers, D., Kenney, L. J. & Goulian, M. (2005). The Escherichia coli CpxA-CpxR envelope stress response system regulates expression of the porins ompF and ompC. J Bacteriol 187, 5723-5731. Bavoil, P., Nikaido, H. & von Meyenburg, K. (1977). Pleiotropic transport mutants of Escherichia coli lack porin, a major outer membrane protein. Mol Gen Genet 158, 23-33. Begic, S. & Worobec, E. A. (2006). Regulation of Serratia marcescens ompF and ompC porin genes in response to osmotic stress, salicylate, temperature and pH. Microbiology 152, 485-491. Bernardini, M. L., Sanna, M. G., Fontaine, A. & Sansonetti, P. J. (1993). OmpC is involved in invasion of epithelial cells by Shigella flexneri. Infect Immun 61, 3625-3635. Bi, W. & Stambrook, P. J. (1997). CCR: a rapid and simple approach for mutation detection. Nucleic acids research 25, 2949-2951. Bondarenko, V., Liu, Y., Ninfa, A. & Studitsky, V. M. (2002). Action of prokaryotic enhancer over a distance does not require continued presence of promoter-bound sigma54 subunit. Nucleic Acids Res 30, 636-642. Brennan, P. J. & Nikaido, H. (1995). The envelope of mycobacteria. Annu Rev Biochem 64, 29-63. Brennan, P. J. (2003). Structure, function, and biogenesis of the cell wall of Mycobacterium tuberculosis. Tuberculosis (Edinb) 83, 91-97.
- 69 -

References
Bucarey, S. A., Villagra, N. A., Martinic, M. P., Trombert, A. N., Santiviago, C. A., Maulen, N. P., Youderian, P. & Mora, G. C. (2005). The Salmonella enterica serovar Typhi tsx gene, encoding a nucleoside-specific porin, is essential for prototrophic growth in the absence of nucleosides. Infection and immunity 73, 6210-6219. Buck, M., Gallegos, M. T., Studholme, D. J., Guo, Y. & Gralla, J. D. (2000). The bacterial enhancer-dependent sigma(54) (sigma(N)) transcription factor. J Bacteriol 182, 4129-4136. Buommino, E., Morelli, F., Metafora, S., Rossano, F., Perfetto, B., Baroni, A. & Tufano, M. A. (1999). Porin from Pseudomonas aeruginosa induces apoptosis in an epithelial cell line derived from rat seminal vesicles. Infect Immun 67, 4794-4800. Castillo-Keller, M., Vuong, P. & Misra, R. (2006). Novel mechanism of Escherichia coli porin regulation. J Bacteriol 188, 576-586. Chapman, J. S. & Bernard, J. S. (1962). The tolerances of unclassified mycobacteria. I. Limits of pH tolerance. Am Rev Respir Dis 86, 582-583. Chen, H., Bjerknes, M., Kumar, R. & Jay, E. (1994). Determination of the optimal aligned spacing between the Shine-Dalgarno sequence and the translation initiation codon of Escherichia coli mRNAs. Nucleic Acids Res 22, 4953-4957. Chen, S., Zhang, A., Blyn, L. B. & Storz, G. (2004). MicC, a second small-RNA regulator of Omp protein expression in Escherichia coli. J Bacteriol 186, 6689-6697. Coburn, G. A. & Mackie, G. A. (1999). Degradation of mRNA in Escherichia coli: an old problem with some new twists. Prog Nucleic Acid Res Mol Biol 62, 55-108. Cole, S. T., Brosch, R., Parkhill, J. & other authors (1998). Deciphering the biology of Mycobacterium tuberculosis from the complete genome sequence. Nature 393, 537-544. Coll, J. L., Heyde, M. & Portalier, R. (1994). Expression of the nmpC gene of Escherichia coli K-12 is modulated by external pH. Identification of cis-acting regulatory sequences involved in this regulation. Mol Microbiol 12, 83-93. Cowan, S. W., Schirmer, T., Rummel, G., Steiert, M., Ghosh, R., Pauptit, R. A., Jansonius, J. N. & Rosenbusch, J. P. (1992). Crystal structures explain functional properties of two E. coli porins. Nature 358, 727-733. Dai, X. & Rothman-Denes, L. B. (1999). DNA structure and transcription. Curr Opin Microbiol 2, 126-130. Deighan, P., Free, A. & Dorman, C. J. (2000). A role for the Escherichia coli H-NS-like protein StpA in OmpF porin expression through modulation of micF RNA stability. Mol Microbiol 38, 126-139. Delcour, A. H. (2003). Solute uptake through general porins. Front Biosci 8, d1055-1071. Delihas, N. & Forst, S. (2001). MicF: an antisense RNA gene involved in response of Escherichia coli to global stress factors. J Mol Biol 313, 1-12. Delihas, N. (2003). Annotation and evolutionary relationships of a small regulatory RNA gene micF and its target ompF in Yersinia species. BMC Microbiol 3, 13. Dellagostin, O., Cruz, F., Medeiros, M., Armoa, G. & McFadden, J. (1999). Cloning and evaluation of transcription terminator sequences in mycobacteria. Abstr Gen Meet Am Soc Microbiol 99, 650. Dellagostin, O. A., Esposito, G., Eales, L. J., Dale, J. W. & McFadden, J. (1995). Activity of mycobacterial promoters during intracellular and extracellular growth. Microbiology 141 (Pt 8), 1785-1792. Denyer, S. P. & Maillard, J. Y. (2002). Cellular impermeability and uptake of biocides and antibiotics in Gram-negative bacteria. J Appl Microbiol 92 Suppl, 35S-45S. Deretic, V. & Fratti, R. A. (1999). Mycobacterium tuberculosis phagosome. Mol Microbiol 31, 1603-1609. Dmitriev, B. A., Ehlers, S., Rietschel, E. T. & Brennan, P. J. (2000). Molecular mechanics of the mycobacterial cell wall: from horizontal layers to vertical scaffolds. Int J Med Microbiol 290, 251-258. Dörner, U., Maier, E. & Benz, R. (2004). Identification of a cation-specific channel (TipA) in the cell wall of the gram-positive mycolata Tsukamurella inchonensis: the gene of the channel-forming protein is identical to mspA of Mycobacterium smegmatis and mppA of Mycobacterium phlei. Biochimica et biophysica acta 1667, 47-55.
- 70 -

References
Douchin, V., Bohn, C. & Bouloc, P. (2006). Down-regulation of porins by a small RNA bypasses the essentiality of the regulated intramembrane proteolysis protease RseP in Escherichia coli. J Biol Chem 281, 12253-12259. Eddy, S. R. (2001). Non-coding RNA genes and the modern RNA world. Nat Rev Genet 2, 919-929. Emory, S. A. & Belasco, J. G. (1990). The ompA 5' untranslated RNA segment functions in Escherichia coli as a growth-rate-regulated mRNA stabilizer whose activity is unrelated to translational efficiency. J Bacteriol 172, 4472-4481. Emory, S. A., Bouvet, P. & Belasco, J. G. (1992). A 5'-terminal stem-loop structure can stabilize mRNA in Escherichia coli. Genes Dev 6, 135-148. Engelhardt, H., Heinz, C. & Niederweis, M. (2002). A tetrameric porin limits the cell wall permeability of Mycobacterium smegmatis. J Biol Chem 277, 37567-37572. Espinal, M. A., Kim, S. J., Suarez, P. G. & other authors (2000). Standard short-course chemotherapy for drug-resistant tuberculosis: treatment outcomes in 6 countries. Jama 283, 2537-2545. Estrem, S. T., Gaal, T., Ross, W. & Gourse, R. L. (1998). Identification of an UP element consensus sequence for bacterial promoters. Proc Natl Acad Sci U S A 95, 9761-9766. Faller, M., Niederweis, M. & Schulz, G. E. (2004). The structure of a mycobacterial outer-membrane channel. Science 303, 1189-1192. Fang, Z., Doig, C., Morrison, N., Watt, B. & Forbes, K. J. (1999). Characterization of IS1547, a new member of the IS900 family in the Mycobacterium tuberculosis complex, and its association with IS6110. J Bacteriol 181, 1021-1024. Fisher, M. A., Plikaytis, B. B. & Shinnick, T. M. (2002). Microarray analysis of the Mycobacterium tuberculosis transcriptional response to the acidic conditions found in phagosomes. J Bacteriol 184, 4025-4032. Foster, J. W. (2004). Escherichia coli acid resistance: tales of an amateur acidophile. Nat Rev Genet 2, 898-907. Fu, L. M. & Fu-Liu, C. S. (2002). Is Mycobacterium tuberculosis a closer relative to Gram-positive or Gram-negative bacterial pathogens? Tuberculosis (Edinb) 82, 85-90. Galdiero, M., D'Isanto, M., Vitiello, M., Finamore, E., Peluso, L. & Galdiero, M. (2003a). Monocytic activation of protein tyrosine kinase, protein kinase A and protein kinase C induced by porins isolated from Salmonella enterica serovar Typhimurium. J Infect 46, 111-119. Galdiero, M., Pisciotta, M. G., Galdiero, E. & Carratelli, C. R. (2003b). Porins and lipopolysaccharide from Salmonella typhimurium regulate the expression of CD80 and CD86 molecules on B cells and macrophages but not CD28 and CD152 on T cells. Clin Microbiol Infect 9, 1104-1111. Gehring, K., Cheng, C. H., Nikaido, H. & Jap, B. K. (1991). Stoichiometry of maltodextrin-binding sites in LamB, an outer membrane protein from Escherichia coli. J Bacteriol 173, 1873-1878. Giladi, H., Koby, S., Prag, G., Engelhorn, M., Geiselmann, J. & Oppenheim, A. B. (1998). Participation of IHF and a distant UP element in the stimulation of the phage lambda PL promoter. Mol Microbiol 30, 443-451. Gomez, M., Doukhan, L., Nair, G. & Smith, I. (1998). sigA is an essential gene in Mycobacterium smegmatis. Mol Microbiol 29, 617-628. Gopaul, K. K., Brooks, P. C., Prost, J. F. & Davis, E. O. (2003). Characterization of the two Mycobacterium tuberculosis recA promoters. J Bacteriol 185, 6005-6015. Gottesman, S. (2004). The small RNA regulators of Escherichia coli: roles and mechanisms*. Annu Rev Microbiol 58, 303-328. Guillier, M. & Gottesman, S. (2006). Remodelling of the Escherichia coli outer membrane by two small regulatory RNAs. Molecular microbiology 59, 231-247. Guillier, M., Gottesman, S. & Storz, G. (2006). Modulating the outer membrane with small RNAs. Genes Dev 20, 2338-2348. Gupta, R. S. (1998). Protein phylogenies and signature sequences: A reappraisal of evolutionary relationships among archaebacteria, eubacteria, and eukaryotes. Microbiol Mol Biol Rev 62, 1435-1491. Gupta, S. & Chatterji, D. (2005). Stress responses in mycobacteria. IUBMB Life 57, 149-159.
- 71 -
References
Hanahan, D., Jessee, J. & Bloom, F. R. (1991). Plasmid transformation of Escherichia coli and other bacteria. Methods Enzymol 204, 63-113. Hansen, M. J., Chen, L. H., Fejzo, M. L. & Belasco, J. G. (1994). The ompA 5' untranslated region impedes a major pathway for mRNA degradation in Escherichia coli. Mol Microbiol 12, 707-716. Hardesty, C., Ferran, C. & Di Rienzo, J. M. (1991). Plasmid-mediated sucrose metabolism in Escherichia coli: characterization of scrY, the structural gene for a phosphoenolpyruvate-dependent sucrose phosphotransferase system outer membrane porin. J Bacteriol 173, 449-456. Hartmans, S., De Bont, J. A. M. & Stackebrandt, E. (2004). The Genus Mycobacterium — Nonmedical. The Prokaryotes, online edition Release 3.20, http://141.150.157.117:8080/prokPUB/chaphtm/8413/COMPLETE.htm. Heinz, C. & Niederweis, M. (2000). Selective extraction and purification of a mycobacterial outer membrane protein. Anal Biochem 285, 113-120. Heinz, C., Engelhardt, H. & Niederweis, M. (2003). The core of the tetrameric mycobacterial porin MspA is an extremely stable beta-sheet domain. J Biol Chem 278, 8678-8685. Henkin, T. M. (1996). Control of transcription termination in prokaryotes. Annu Rev Genet 30, 35-57. Heyde, M. & Portalier, R. (1987). Regulation of major outer membrane porin proteins of Escherichia coli K 12 by pH. Mol Gen Genet 208, 511-517. Heyde, M., Laloi, P. & Portalier, R. (2000). Involvement of carbon source and acetyl phosphate in the external-pH- dependent expression of porin genes in Escherichia coli. J Bacteriol 182, 198-202. Hillmann, D. (2002). Optimierung der Expression von mspA in Mycobacterium smegmatis. Diploma thesis. Honer zu Bentrup, K. & Russell, D. G. (2001). Mycobacterial persistence: adaptation to a changing environment. Trends Microbiol 9, 597-605. Iivanainen, E., Martikainen, P. J., Vaananen, P. & Katila, M. L. (1999). Environmental factors affecting the occurrence of mycobacteria in brook sediments. J Appl Microbiol 86, 673-681. Iivanainen, E. K., Martikainen, P. J., Raisanen, M. L. & Katila, M. L. (1997). Mycobacteria in arboreal coniferous forest soils. FEMS Microbiol Ecology 23, 325-332. Jackson, M., Crick, D. C. & Brennan, P. J. (2000). Phosphatidylinositol is an essential phospholipid of mycobacteria. J Biol Chem 275, 30092-30099. Jarlier, V. & Nikaido, H. (1990). Permeability barrier to hydrophilic solutes in Mycobacterium chelonei. J Bacteriol 172, 1418-1423. Kaps, I., Ehrt, S., Seeber, S., Schnappinger, D., Martin, C., Riley, L. W. & Niederweis, M. (2001). Energy transfer between fluorescent proteins using a co-expression system in Mycobacterium smegmatis. Gene 278, 115-124. Kaps, I. (2004). Untersuchung der Expression des Poringens mspA von Mycobacterium smegmatis. PhD Thesis. Karakousis, P. C., Bishai, W. R. & Dorman, S. E. (2004). Mycobacterium tuberculosis cell envelope lipids and the host immune response. Cell Microbiol 6, 105-116. Kartmann, B., Stenger, S., Niederweis, M. & Stengler, S. (1999). Porins in the cell wall of Mycobacterium tuberculosis. J Bacteriol 181, 6543-6546. Kempsell, K. E., Ji, Y. E., Estrada, I. C., Colston, M. J. & Cox, R. A. (1992). The nucleotide sequence of the promoter, 16S rRNA and spacer region of the ribosomal RNA operon of Mycobacterium tuberculosis and comparison with Mycobacterium leprae precursor rRNA. J Gen Microbiol 138, 1717-1727. Khemici, V. & Carpousis, A. J. (2004). The RNA degradosome and poly(A) polymerase of Escherichia coli are required in vivo for the degradation of small mRNA decay intermediates containing REP-stabilizers. Mol Microbiol 51, 777-790. Koch, R. (1882). Classics in infectious diseases. The etiology of tuberculosis: Robert Koch. Berlin, Germany 1882. Rev Infect Dis 4, 1270-1274.
- 72 -
References
Koebnik, R., Locher, K. P. & Van Gelder, P. (2000). Structure and function of bacterial outer membrane proteins: barrels in a nutshell. Mol Microbiol 37, 239-253. Kriakov, J., Lee, S. & Jacobs, W. R., Jr. (2003). Identification of a regulated alkaline phosphatase, a cell surface-associated lipoprotein, in Mycobacterium smegmatis. Journal of bacteriology 185, 4983-4991. Kushner, S. R. (2002). mRNA decay in Escherichia coli comes of age. Journal of bacteriology 184, 4658-4665; discussion 4657. Lee, M. H., Pascopella, L., Jacobs, W. R., Jr. & Hatfull, G. F. (1991). Site-specific integration of mycobacteriophage L5: integration-proficient vectors for Mycobacterium smegmatis, Mycobacterium tuberculosis, and bacille Calmette-Guerin. Proc Natl Acad Sci U S A 88, 3111-3115. Lee, R. E., Brennan, P. J. & Besra, G. S. (1996). Mycobacterium tuberculosis cell envelope. Curr Top Microbiol Immunol 215, 1-27. Lichtinger, T., Heym, B., Maier, E., Eichner, H., Cole, S. T. & Benz, R. (1999). Evidence for a small anion-selective channel in the cell wall of Mycobacterium bovis BCG besides a wide cation-selective pore. FEBS Lett 454, 349-355. Liu, J., Rosenberg, E. Y. & Nikaido, H. (1995). Fluidity of the lipid domain of cell wall from Mycobacterium chelonae. Proc Natl Acad Sci U S A 92, 11254-11258. Liu, J., Barry, C. E., 3rd, Besra, G. S. & Nikaido, H. (1996). Mycolic acid structure determines the fluidity of the mycobacterial cell wall. J Biol Chem 271, 29545-29551. Liu, N. & Delcour, A. H. (1998). Inhibitory effect of acidic pH on OmpC porin: wild-type and mutant studies. FEBS Lett 434, 160-164. Liu, X. & Ferenci, T. (1998). Regulation of porin-mediated outer membrane permeability by nutrient limitation in Escherichia coli. J Bacteriol 180, 3917-3922. Liu, X. & Ferenci, T. (2001). An analysis of multifactorial influences on the transcriptional control of ompF and ompC porin expression under nutrient limitation. Microbiology 147, 2981-2989. Liu, Y., Bondarenko, V., Ninfa, A. & Studitsky, V. M. (2001). DNA supercoiling allows enhancer action over a large distance. Proc Natl Acad Sci U S A 98, 14883-14888. Ma, J., Campbell, A. & Karlin, S. (2002). Correlations between Shine-Dalgarno sequences and gene features such as predicted expression levels and operon structures. J Bacteriol 184, 5733-5745. Mahfoud (2004). Structural and functional characterisation of MspA, the main porin of Mycobacterium smegmatis. Mahfoud, M., Sukumaran, S., Hulsmann, P., Grieger, K. & Niederweis, M. (2006). Topology of the porin MspA in the outer membrane of Mycobacterium smegmatis. J Biol Chem 281, 5908-5915. Mailänder, C. (2004). Porins in Mycobacterium tuberculosis - Importance for outer membrane permeability and identification of genes. PhD Thesis. Mailänder, C., Reiling, N., Engelhardt, H., Bossmann, S., Ehlers, S. & Niederweis, M. (2004). The MspA porin promotes growth and increases antibiotic susceptibility of both Mycobacterium bovis BCG and Mycobacterium tuberculosis. Microbiology 150, 853-864. Manganelli, R., Provvedi, R., Rodrigue, S., Beaucher, J., Gaudreau, L. & Smith, I. (2004). Sigma factors and global gene regulation in Mycobacterium tuberculosis. J Bacteriol 186, 895-902. Martin, R. G. & Rosner, J. L. (2001). The AraC transcriptional activators. Curr Opin Microbiol 4, 132-137. Massari, P., Ram, S., Macleod, H. & Wetzler, L. M. (2003). The role of porins in neisserial pathogenesis and immunity. Trends Microbiol 11, 87-93. Masse, E., Majdalani, N. & Gottesman, S. (2003). Regulatory roles for small RNAs in bacteria. Curr Opin Microbiol 6, 120-124. Master, S., Zahrt, T. C., Song, J. & Deretic, V. (2001). Mapping of Mycobacterium tuberculosis katG promoters and their differential expression in infected macrophages. J Bacteriol 183, 4033-4039.
- 73 -

References
Mathews, D. H., Disney, M. D., Childs, J. L., Schroeder, S. J., Zuker, M. & Turner, D. H. (2004). Incorporating chemical modification constraints into a dynamic programming algorithm for prediction of RNA secondary structure. Proc Natl Acad Sci U S A 101, 7287-7292. Mathur, J. & Waldor, M. K. (2004). The Vibrio cholerae ToxR-regulated porin OmpU confers resistance to antimicrobial peptides. Infect Immun 72, 3577-3583. Mehrotra, J. & Bishai, W. R. (2001). Regulation of virulence genes in Mycobacterium tuberculosis. Int J Med Microbiol 291, 171-182. Meng, W., Belyaeva, T., Savery, N. J., Busby, S. J., Ross, W. E., Gaal, T., Gourse, R. L. & Thomas, M. S. (2001). UP element-dependent transcription at the Escherichia coli rrnB P1 promoter: positional requirements and role of the RNA polymerase alpha subunit linker. Nucleic Acids Res 29, 4166-4178. Milano, A., Forti, F., Sala, C., Riccardi, G. & Ghisotti, D. (2001). Transcriptional regulation of furA and katG upon oxidative stress in Mycobacterium smegmatis. J Bacteriol 183, 6801-6806. Minnikin, D. E. (1982). Lipids: Complex lipids, their chemistry, biosynthesis and roles. In The biology of the mycobacteria: Physiology, identification and classification, pp. 95-184. Edited by C. Ratledge & J. Stanford. London: Academic Press. Mizuno, T. & Mizushima, S. (1990). Signal transduction and gene regulation through the phosphorylation of two regulatory components: the molecular basis for the osmotic regulation of the porin genes. Mol Microbiol 4, 1077-1082. Molle, V., Saint, N., Campagna, S., Kremer, L., Lea, E., Draper, P. & Molle, G. (2006). pH-dependent pore-forming activity of OmpATb from Mycobacterium tuberculosis and characterization of the channel by peptidic dissection. Molecular microbiology 61, 826-837. Mukherjee, R. & Chatterji, D. (2005). Evaluation of the role of sigma B in Mycobacterium smegmatis. Biochem Biophys Res Commun 338, 964-972. Mulder, M. A., Zappe, H. & Steyn, L. M. (1997). Mycobacterial promoters. Tuber Lung Dis 78, 211-223. Mulder, M. A., Zappe, H. & Steyn, L. M. (1999). The Mycobacterium tuberculosis katG promoter region contains a novel upstream activator. Microbiology 145 (Pt 9), 2507-2518. Muller, A., Gunther, D., Dux, F., Naumann, M., Meyer, T. F. & Rudel, T. (1999). Neisserial porin (PorB) causes rapid calcium influx in target cells and induces apoptosis by the activation of cysteine proteases. Embo J 18, 339-352. Nagaraja, V. (2004). Regulation of DNA topology in mycobacteria. Current Science 86, 135-140. Nakae, T. (1976). Outer membrane of Salmonella. Isolation of protein complex that produces transmembrane channels. J Biol Chem 251, 2176-2178. Negm, R. S. & Pistole, T. G. (1998). Macrophages recognize and adhere to an OmpD-like protein of Salmonella typhimurium. FEMS Immunol Med Microbiol 20, 191-199. Negm, R. S. & Pistole, T. G. (1999). The porin OmpC of Salmonella typhimurium mediates adherence to macrophages. Can J Microbiol 45, 658-669. Niederweis, M., Ehrt, S., Heinz, C., Klocker, U., Karosi, S., Swiderek, K. M., Riley, L. W. & Benz, R. (1999). Cloning of the mspA gene encoding a porin from Mycobacterium smegmatis. Mol Microbiol 33, 933-945. Niederweis, M. (2003). Mycobacterial porins - new channel proteins in unique outer membranes. Mol Microbiol 49, 1167-1177. Nigou, J., Zelle-Rieser, C., Gilleron, M., Thurnher, M. & Puzo, G. (2001). Mannosylated lipoarabinomannans inhibit IL-12 production by human dendritic cells: evidence for a negative signal delivered through the mannose receptor. J Immunol 166, 7477-7485. Nikaido, H., Bavoil, P. & Hirota, Y. (1977). Outer membranes of gram-negative bacteria. XV. Transmembrane diffusion rates in lipoprotein-deficient mutants of Escherichia coli. J Bacteriol 132, 1045-1047. Nikaido, H., Kim, S. H. & Rosenberg, E. Y. (1993). Physical organization of lipids in the cell wall of Mycobacterium chelonae. Mol Microbiol 8, 1025-1030.
- 74 -

References
Nikaido, H. (1994). Porins and specific diffusion channels in bacterial outer membranes. J Biol Chem 269, 3905-3908. Nikaido, H. (2003). Molecular basis of bacterial outer membrane permeability revisited. Microbiol Mol Biol Rev 67, 593-656. O'Brien, L. M., Gordon, S. V., Roberts, I. S. & Andrew, P. W. (1996). Response of Mycobacterium smegmatis to acid stress. FEMS Microbiol Lett 139, 11-17. Ortalo-Magne, A., Lemassu, A., Laneelle, M. A., Bardou, F., Silve, G., Gounon, P., Marchal, G. & Daffé, M. (1996). Identification of the surface-exposed lipids on the cell envelopes of Mycobacterium tuberculosis and other mycobacterial species. J Bacteriol 178, 456-461. Osorio, C. G., Martinez-Wilson, H. & Camilli, A. (2004). The ompU Paralogue vca1008 is required for virulence of Vibrio cholerae. J Bacteriol 186, 5167-5171. Parrish, N. M., Dick, J. D. & Bishai, W. R. (1998). Mechanisms of latency in Mycobacterium tuberculosis. Trends Microbiol 6, 107-112. Paul, T. R. & Beveridge, T. J. (1993). Ultrastructure of mycobacterial surfaces by freeze-substitution. Zentralbl Bakteriol 279, 450-457. Pitulle, C., Dorsch, M., Kazda, J., Wolters, J. & Stackebrandt, E. (1992). Phylogeny of rapidly growing members of the genus Mycobacterium. Int J Syst Bacteriol 42, 337-343. Portaels, F. & Pattyn, S. R. (1982). Growth of mycobacteria in relation to the pH of the medium. Ann Microbiol (Paris) 133, 213-221. Pratt, L. A., Hsing, W., Gibson, K. E. & Silhavy, T. J. (1996). From acids to osmZ: multiple factors influence synthesis of the OmpF and OmpC porins in Escherichia coli. Mol Microbiol 20, 911-917. Prilipov, A., Phale, P. S., Koebnik, R., Widmer, C. & Rosenbusch, J. P. (1998). Identification and characterization of two quiescent porin genes, nmpC and ompN, in Escherichia coli BE. J Bacteriol 180, 3388-3392. Provenzano, D. & Klose, K. E. (2000). Altered expression of the ToxR-regulated porins OmpU and OmpT diminishes Vibrio cholerae bile resistance, virulence factor expression, and intestinal colonization. Proc Natl Acad Sci U S A 97, 10220-10224. Ranes, M. G., Rauzier, J., Lagranderie, M., Gheorghiu, M. & Gicquel, B. (1990). Functional analysis of pAL5000, a plasmid from Mycobacterium fortuitum: construction of a "mini" mycobacterium-Escherichia coli shuttle vector. J Bacteriol 172, 2793-2797. Rao, M., Streur, T. L., Aldwell, F. E. & Cook, G. M. (2001). Intracellular pH regulation by Mycobacterium smegmatis and Mycobacterium bovis BCG. Microbiology 147, 1017-1024. Rasmussen, A. A., Eriksen, M., Gilany, K., Udesen, C., Franch, T., Petersen, C. & Valentin-Hansen, P. (2005). Regulation of ompA mRNA stability: the role of a small regulatory RNA in growth phase-dependent control. Mol Microbiol 58, 1421-1429. Rastogi, N., Legrand, E. & Sola, C. (2001). The mycobacteria: an introduction to nomenclature and pathogenesis. Rev Sci Tech 20, 21-54. Raynaud, C., Papavinasasundaram, K. G., Speight, R. A., Springer, B., Sander, P., Bottger, E. C., Colston, M. J. & Draper, P. (2002). The functions of OmpATb, a pore-forming protein of Mycobacterium tuberculosis. Mol Microbiol 46, 191-201. Regnier, P. & Arraiano, C. M. (2000). Degradation of mRNA in bacteria: emergence of ubiquitous features. Bioessays 22, 235-244. Rodriguez-Morales, O., Fernandez-Mora, M., Hernandez-Lucas, I., Vazquez, A., Puente, J. L. & Calva, E. (2006). Salmonella enterica serovar Typhimurium ompS1 and ompS2 mutants are attenuated for virulence in mice. Infection and immunity 74, 1398-1402. Rogall, T., Wolters, J., Flohr, T. & Bottger, E. C. (1990). Towards a phylogeny and definition of species at the molecular level within the genus Mycobacterium. Int J Syst Bacteriol 40, 323-330. Rosenkrands, I., King, A., Weldingh, K., Moniatte, M., Moertz, E. & Andersen, P. (2000). Towards the proteome of Mycobacterium tuberculosis. Electrophoresis 21, 3740-3756.
- 75 -

References
Rowland, B., Purkayastha, A., Monserrat, C., Casart, Y., Takiff, H. & McDonough, K. A. (1999). Fluorescence-based detection of lacZ reporter gene expression in intact and viable bacteria including Mycobacterium species. FEMS Microbiol Lett 179, 317-325. Ruiz, N., Kahne, D. & Silhavy, T. J. (2006). Advances in understanding bacterial outer-membrane biogenesis. Nat Rev Microbiol 4, 57-66. Russell, D. G. (2001). Mycobacterium tuberculosis: here today, and here tomorrow. Nat Rev Mol Cell Biol 2, 569-577. Sala, C., Forti, F., Di Florio, E., Canneva, F., Milano, A., Riccardi, G. & Ghisotti, D. (2003). Mycobacterium tuberculosis FurA autoregulates its own expression. J Bacteriol 185, 5357-5362. Samartzidou, H., Mehrazin, M., Xu, Z., Benedik, M. J. & Delcour, A. H. (2003). Cadaverine inhibition of porin plays a role in cell survival at acidic pH. J Bacteriol 185, 13-19. Sambrook, J., Fritsch, E. F. & Maniatis, T. (1989). Molecular cloning: a laboratory manual, 2nd edn. Cold Spring Harbor, N. Y.: Cold Spring Harbor Laboratory Press. Sander, P., Meier, A. & Bottger, E. C. (1996). Ribosomal drug resistance in mycobacteria. Res Microbiol 147, 59-67. Sanger, F., Nicklen, S. & Coulson, A. R. (1977). DNA sequencing with chain terminating inhibitors. Proc Natl Acad Sci USA 74, 5463-5467. Santiviago, C. A., Toro, C. S., Hidalgo, A. A., Youderian, P. & Mora, G. C. (2003). Global regulation of the Salmonella enterica serovar typhimurium major porin, OmpD. Journal of bacteriology 185, 5901-5905. Sato, M., Machida, K., Arikado, E., Saito, H., Kakegawa, T. & Kobayashi, H. (2000). Expression of outer membrane proteins in Escherichia coli growing at acid pH. Appl Environ Microbiol 66, 943-947. Saviola, B., Woolwine, S. C. & Bishai, W. R. (2003). Isolation of acid-inducible genes of Mycobacterium tuberculosis with the use of recombinase-based in vivo expression technology. Infect Immun 71, 1379-1388. Schägger, H. & von Jagow, G. (1987). Tricine-sodium dodecyl sulfate-polyacrylamide gel electrophoresis for the separation of proteins in the range from 1 to 100 kDa. Anal Biochem 166, 368-379. Schlax, P. J. & Worhunsky, D. J. (2003). Translational repression mechanisms in prokaryotes. Mol Microbiol 48, 1157-1169. Secundino, I., Lopez-Macias, C., Cervantes-Barragan, L. & other authors (2006). Salmonella porins induce a sustained, lifelong specific bactericidal antibody memory response. Immunology 117, 59-70. Senaratne, R. H., Mobasheri, H., Papavinasasundaram, K. G., Jenner, P., Lea, E. J. & Draper, P. (1998). Expression of a gene for a porin-like protein of the OmpA family from Mycobacterium tuberculosis H37Rv. J Bacteriol 180, 3541-3547. Simonet, V. C., Basle, A., Klose, K. E. & Delcour, A. H. (2003). The Vibrio cholerae porins OmpU and OmpT have distinct channel properties. J Biol Chem 278, 17539-17545. Sirakova, T. D., Fitzmaurice, A. M. & Kolattukudy, P. (2002). Regulation of expression of mas and fadD28, two genes involved in production of dimycocerosyl phthiocerol, a virulence factor of Mycobacterium tuberculosis. J Bacteriol 184, 6796-6802. Snapper, S. B., Melton, R. E., Mustafa, S., Kieser, T. & Jacobs, W. R., Jr. (1990). Isolation and characterization of efficient plasmid transformation mutants of Mycobacterium smegmatis. Mol Microbiol 4, 1911-1919. Stahl, C., Kubetzko, S., Kaps, I., Seeber, S., Engelhardt, H. & Niederweis, M. (2001). MspA provides the main hydrophilic pathway through the cell wall of Mycobacterium smegmatis. Mol Microbiol 40, 451-464. Starmer, J., Stomp, A., Vouk, M. & Bitzer, D. (2006). Predicting Shine-Dalgarno sequence locations exposes genome annotation errors. PLoS Comput Biol 2, e57. Steege, D. A. (2000). Emerging features of mRNA decay in bacteria. RNA 6, 1079-1090. Stephan, J., Bail, J. G., Titgemeyer, F. & Niederweis, M. (2004a). DNA-free RNA preparations from mycobacteria. BMC Microbiol 4, 45.
- 76 -

References
Stephan, J., Mailaender, C., Etienne, G., Daffe, M. & Niederweis, M. (2004b). Multidrug resistance of a porin deletion mutant of Mycobacterium smegmatis. Antimicrob Agents Chemother 48, 4163-4170. Stephan, J., Stemmer, V. & Niederweis, M. (2004c). Consecutive gene deletions in Mycobacterium smegmatis using the yeast FLP recombinase. Gene 343, 181-190. Stephan, J., Bender, J., Wolschendorf, F., Hoffmann, C., Roth, E., Mailander, C., Engelhardt, H. & Niederweis, M. (2005). The growth rate of Mycobacterium smegmatis depends on sufficient porin-mediated influx of nutrients. Mol Microbiol 58, 714-730. Steward, K. L. & Linn, T. (1992). Transcription frequency modulates the efficiency of an attenuator preceding the rpoBC RNA polymerase genes of Escherichia coli: possible autogenous control. Nucleic acids research 20, 4773-4779. Stolt, P., Zhang, Q. & Ehlers, S. (1999). Identification of promoter elements in mycobacteria: mutational analysis of a highly symmetric dual promoter directing the expression of replication genes of the Mycobacterium plasmid pAL5000. Nucleic Acids Res 27, 396-402. Storz, G. (2002). An expanding universe of noncoding RNAs. Science 296, 1260-1263. Storz, G., Opdyke, J. A. & Zhang, A. (2004). Controlling mRNA stability and translation with small, noncoding RNAs. Curr Opin Microbiol 7, 140-144. Storz, G., Altuvia, S. & Wassarman, K. M. (2005). An abundance of RNA regulators. Annu Rev Biochem 74, 199-217. Stover, C. K., de la Cruz, V. F., Fuerst, T. R. & other authors (1991). New use of BCG for recombinant vaccines. Nature 351, 456-460. Studholme, D. J. & Buck, M. (2000). The biology of enhancer-dependent transcriptional regulation in bacteria: insights from genome sequences. FEMS microbiology letters 186, 1-9. Sukumaran, S. K., Shimada, H. & Prasadarao, N. V. (2003). Entry and intracellular replication of Escherichia coli K1 in macrophages require expression of outer membrane protein A. Infect Immun 71, 5951-5961. Thiel, A. (1999). Untersuchung zur Genregulation von mspA aus Mycobacterium smegmatis und Optimierung des Grün fluoreszierenden Proteins(GFP) als Reporterprotein in Mycobakterien. PhD Thesis. Thomas, A. D. & Booth, I. R. (1992). The regulation of expression of the porin gene ompC by acid pH. J Gen Microbiol 138, 1829-1835. Timm, J., Lim, E. M. & Gicquel, B. (1994a). Escherichia coli-mycobacteria shuttle vectors for operon and gene fusions to lacZ: the pJEM series. J Bacteriol 176, 6749-6753. Timm, J., Perilli, M. G., Duez, C. & other authors (1994b). Transcription and expression analysis, using lacZ and phoA gene fusions, of Mycobacterium fortuitum beta-lactamase genes cloned from a natural isolate and a high-level beta-lactamase producer. Mol Microbiol 12, 491-504. Tjaden, B., Goodwin, S. S., Opdyke, J. A., Guillier, M., Fu, D. X., Gottesman, S. & Storz, G. (2006). Target prediction for small, noncoding RNAs in bacteria. Nucleic acids research 34, 2791-2802. Todt, J. C. & McGroarty, E. J. (1992). Acid pH decreases OmpF and OmpC channel size in vivo. Biochem Biophys Res Commun 189, 1498-1502. Todt, J. C., Rocque, W. J. & McGroarty, E. J. (1992). Effects of pH on bacterial porin function. Biochemistry 31, 10471-10478. Tran, S. L., Rao, M., Simmers, C., Gebhard, S., Olsson, K. & Cook, G. M. (2005). Mutants of Mycobacterium smegmatis unable to grow at acidic pH in the presence of the protonophore carbonyl cyanide m-chlorophenylhydrazone. Microbiology (Reading, England) 151, 665-672. Trias, J., Jarlier, V. & Benz, R. (1992). Porins in the cell wall of mycobacteria. Science 258, 1479-1481. Trias, J. & Benz, R. (1994). Permeability of the cell wall of Mycobacterium smegmatis. Mol Microbiol 14, 283-290. Tufano, M. A., Rossano, F., Catalanotti, P., Liguori, G., Capasso, C., Ceccarelli, M. T. & Marinelli, P. (1994a). Immunobiological activities of Helicobacter pylori porins. Infect Immun 62, 1392-1399.
- 77 -

References
Tufano, M. A., Rossano, F., Catalanotti, P., Liguori, G., Marinelli, A., Baroni, A. & Marinelli, P. (1994b). Properties of Yersinia enterocolitica porins: interference with biological functions of phagocytes, nitric oxide production and selective cytokine release. Res Microbiol 145, 297-307. Unniraman, S., Prakash, R. & Nagaraja, V. (2001). Alternate paradigm for intrinsic transcription termination in eubacteria. J Biol Chem 276, 41850-41855. Unniraman, S., Chatterji, M. & Nagaraja, V. (2002a). A hairpin near the 5' end stabilises the DNA gyrase mRNA in Mycobacterium smegmatis. Nucleic Acids Res 30, 5376-5381. Unniraman, S., Prakash, R. & Nagaraja, V. (2002b). Conserved economics of transcription termination in eubacteria. Nucleic Acids Res 30, 675-684. Vandeputte-Rutten, L., Bos, M. P., Tommassen, J. & Gros, P. (2003). Crystal structure of Neisserial surface protein A (NspA), a conserved outer membrane protein with vaccine potential. J Biol Chem 278, 24825-24830. Vellanoweth, R. L. & Rabinowitz, J. C. (1992). The influence of ribosome-binding-site elements on translational efficiency in Bacillus subtilis and Escherichia coli in vivo. Mol Microbiol 6, 1105-1114. Vilar, J. M. & Saiz, L. (2005). DNA looping in gene regulation: from the assembly of macromolecular complexes to the control of transcriptional noise. Curr Opin Genet Dev 15, 136-144. Vytvytska, O., Moll, I., Kaberdin, V. R., von Gabain, A. & Blasi, U. (2000). Hfq (HF1) stimulates ompA mRNA decay by interfering with ribosome binding. Genes Dev 14, 1109-1118. Waagmeester, A., Thompson, J. & Reyrat, J. M. (2005). Identifying sigma factors in Mycobacterium smegmatis by comparative genomic analysis. Trends Microbiol 13, 505-509. Wang, Y. (2002). The function of OmpA in Escherichia coli. Biochem Biophys Res Commun 292, 396-401. Wassarman, K. M. (2002). Small RNAs in Bacteria: Diverse regulators of gene expression in response to environmental changes. Cell 109, 141-144. Wayne, L. G. (1994). Dormancy of Mycobacterium tuberculosis and latency of disease. Eur J Clin Microbiol Infect Dis 13, 908-914. Wayne, L. G. & Hayes, L. G. (1996). An in vitro model for sequential study of shiftdown of Mycobacterium tuberculosis through two stages of nonreplicating persistence. Infect Immun 64, 2062-2069. Weiser, J. N. & Gotschlich, E. C. (1991). Outer membrane protein A (OmpA) contributes to serum resistance and pathogenicity of Escherichia coli K-1. Infect Immun 59, 2252-2258. Weiss, M. S., Kreusch, A., Schiltz, E., Nestel, U., Welte, W., Weckesser, J. & Schulz, G. E. (1991). The structure of porin from Rhodobacter capsulatus at 1.8 A resolution. FEBS Lett 280, 379-382. WHO (2006a). Global tuberculosis control: surveillance, planning, financing. WHO report 2006, http://www.who.int/whr/2006/en/. WHO (2006b). Tuberculosis fact sheet N°104. http://www.who.int/mediacentre/factsheets/fs104/en/. Wibbenmeyer, J. A., Provenzano, D., Landry, C. F., Klose, K. E. & Delcour, A. H. (2002). Vibrio cholerae OmpU and OmpT porins are differentially affected by bile. Infect Immun 70, 121-126. Wright, A., Bai, G., Barrera, L. & other authors (2006). Emergence of Mycobacterium tuberculosis with extensive resistance to second-line drugs - Worldwide, 2000 - 2004. Morbidity and Mortality Weekly Report 55, 301-305. Yarnell, W. S. & Roberts, J. W. (1999). Mechanism of intrinsic transcription termination and antitermination. Science 284, 611-615. Zakharian, E. & Reusch, R. N. (2003). Outer membrane protein A of Escherichia coli forms temperature-sensitive channels in planar lipid bilayers. FEBS Lett 555, 229-235. Zhang, A., Wassarman, K. M., Rosenow, C., Tjaden, B. C., Storz, G. & Gottesman, S. (2003). Global analysis of small RNA and mRNA targets of Hfq. Molecular microbiology 50, 1111-1124.
- 78 -

Appendix
7 Appendix
7.1 Use of phoA for pH dependent mspA expression To monitor pH dependent regulation of the mspA promoter, fusions of the M. smegmatis
alkaline phosphatase phoA gene (Kriakov et al., 2003) with different promoters were tested.
The use of phoA as a reporter gene is based on the hydrolysis of the substrate pNPP
(p-nitrophenyl phosphate) resulting in a water-soluble yellow reaction product which absorbs
light at a wavelength of 405 nm. This reaction occurs in the periplasm and the porin
dependent uptake of the substrate was exploited earlier to measure the cell wall permeability
(Mahfoud, 2004). Since MspA is a major determinant of the cell wall permeability (Stahl et
al., 2001), its downregulation due to low pH was supposed to result in a reduced uptake of
the substrate pNPP and consequently in a lower hydrolysis rate by the alkaline phosphatase.
To test the relevant conditions, the phosphatase activity of M. smegmatis SMR5 carrying
either pMS2 (Table 5.8) without phoA or pML440 (Table 5.8) containing a fusion of psmyc with
phoA, grown at pH 6.8, 5.5, 5 or 4.5 (Ch. 5.4) was determined (Ch. 5.7.3). The activity was
measured with lysed (total activity of phoA) and with whole cells (determination of cell wall
permeability) for each strain. As expected, pMS2 resulted in only background activity of
weakly expressed chromosomal phoA (Mahfoud, 2004), whereas pML440 led to high rates of
substrate hydrolysis (Fig. 7.1). This activity decreased with lowering the pH of the growth
medium both for whole and lysed cells. This result indicates that the activity of phoA is
reduced at low pH. Thus, it is concluded that phoA is not useful as a reporter gene under
acidic conditions.
Fig. 7.1: Influence of the pH on phoA activity. The phosphatase activity ([U]) of M. smegmatis SMR5 with pMS2 without phoA (pMS2) or with pML440 con-taining a psmyc-phoA fusion (pML440) was determined of whole or lysed cells. Cultures were grown in neutral medium (st.) or at different pH (pH 6.8, pH 5.5, pH 5 and pH 4.5). The measurement was performed in triplicate with three independent cultures and error bars represent standard deviation.
- 79 -
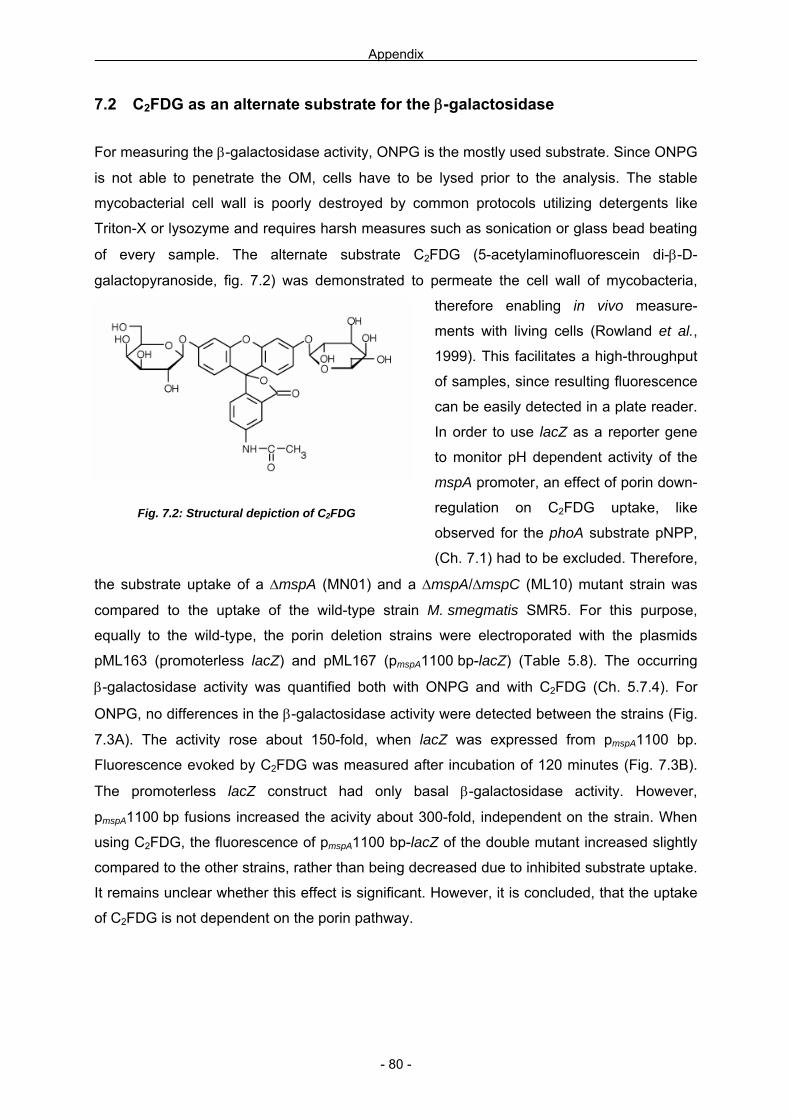
Appendix
7.2 C2FDG as an alternate substrate for the β-galactosidase
For measuring the β-galactosidase activity, ONPG is the mostly used substrate. Since ONPG
is not able to penetrate the OM, cells have to be lysed prior to the analysis. The stable
mycobacterial cell wall is poorly destroyed by common protocols utilizing detergents like
Triton-X or lysozyme and requires harsh measures such as sonication or glass bead beating
of every sample. The alternate substrate C2FDG (5-acetylaminofluorescein di-β-D-
galactopyranoside, fig. 7.2) was demonstrated to permeate the cell wall of mycobacteria,
therefore enabling in vivo measure-
ments with living cells (Rowland et al.,
1999). This facilitates a high-throughput
of samples, since resulting fluorescence
can be easily detected in a plate reader.
In order to use lacZ as a reporter gene
to monitor pH dependent activity of the
mspA promoter, an effect of porin down-
regulation on C2FDG uptake, like
observed for the phoA substrate pNPP,
(Ch. 7.1) had to be excluded. Therefore,
the substrate uptake of a ΔmspA (MN01) and a ΔmspA/ΔmspC (ML10) mutant strain was
compared to the uptake of the wild-type strain M. smegmatis SMR5. For this purpose,
equally to the wild-type, the porin deletion strains were electroporated with the plasmids
pML163 (promoterless lacZ) and pML167 (pmspA1100 bp-lacZ) (Table 5.8). The occurring
β-galactosidase activity was quantified both with ONPG and with C2FDG (Ch. 5.7.4). For
ONPG, no differences in the β-galactosidase activity were detected between the strains (Fig.
7.3A). The activity rose about 150-fold, when lacZ was expressed from pmspA1100 bp.
Fluorescence evoked by C2FDG was measured after incubation of 120 minutes (Fig. 7.3B).
The promoterless lacZ construct had only basal β-galactosidase activity. However,
pmspA1100 bp fusions increased the acivity about 300-fold, independent on the strain. When
using C2FDG, the fluorescence of pmspA1100 bp-lacZ of the double mutant increased slightly
compared to the other strains, rather than being decreased due to inhibited substrate uptake.
It remains unclear whether this effect is significant. However, it is concluded, that the uptake
of C2FDG is not dependent on the porin pathway.
Fig. 7.2: Structural depiction of C2FDG
- 80 -

Appendix
Fig. 7.3: β-galactosidase activity in porin knock-out strains with the substrates ONPG and C2FDG. M. smegmatis SMR5 (wt), MN01 (ΔmspA) and ML10 (ΔmspA / ΔmspC) contained the plasmids pML163 (no promoter) or pML167 (pmspA1100 bp-lacZ). A: ONPG was used as substrate for determination of β-galactosidase activity of sonicated cells, indicated as Miller units (MU). B: C2FDG was used as substrate for determination of β-galactosidase activity in vivo. Relative fluorescence units (U) were collected after 120 minutes incubation at 37°C. Both experiments were done in triplicate with three independent cultures and with the error bars representing the standard deviation.
For further use, the influence of low pH on the application of C2FDG was investigated. The
β-galactosidase activity of M. smegmatis SMR5 wild-type or with the plasmids pML803 (psmyc-
lacZ), pML804 (pimyc-lacZ), pML163 (promoterless lacZ) or pML167 (pmspA1100 bp-lacZ)
grown at pH 6.8, 5.5, 5 or 4.5 was determined (Ch. 5.7.4). The fluorescence of C2FDG was
detected after incubation of 120 minutes. High β-galactosidase activity was determined for
pH 6.8 and 5.5 for all promoter fusions, whereas at pH 5 and 4.5 the activity of all constructs
was eliminated (Fig. 7.4). The promoters psmyc and pimyc were expressed constitutively at low
pH (Ch. 3.4.3), indicating, that the decrease in β-galactosidase activity at a pH below 5.5 was
not a specific regulatory effect on pmspA, but rather an effect of acidification on the substrate,
uptake of the substrate, inactivation of the β-galactosidase or fluorescence extinction of the
product. Thus, C2FDG is not a suitable substrate to measure β-galactosidase activity in vivo
under acidic conditions.
- 81 -

Appendix
Fig. 7.4: Fluorescence produced by promoter-lacZ fusions dependent on the pH. M. smegmatis SMR5 wild-type (wt) or with the plasmids pML803 (psmyc-lacZ), pML804 (pimyc-lacZ), pML163 (no promoter) or pML167 (pmspA1100 bp) was grown in neutral 7H9 medium (7H9) or at different pH (pH 6.8, pH 5.5, pH 5 and pH 4.5). Relative fluorescence units (U) were determined after incubation of 120 minutes at 37°C. Measurements were performed in triplicate with the error bars representing the standard deviation.
- 82 -
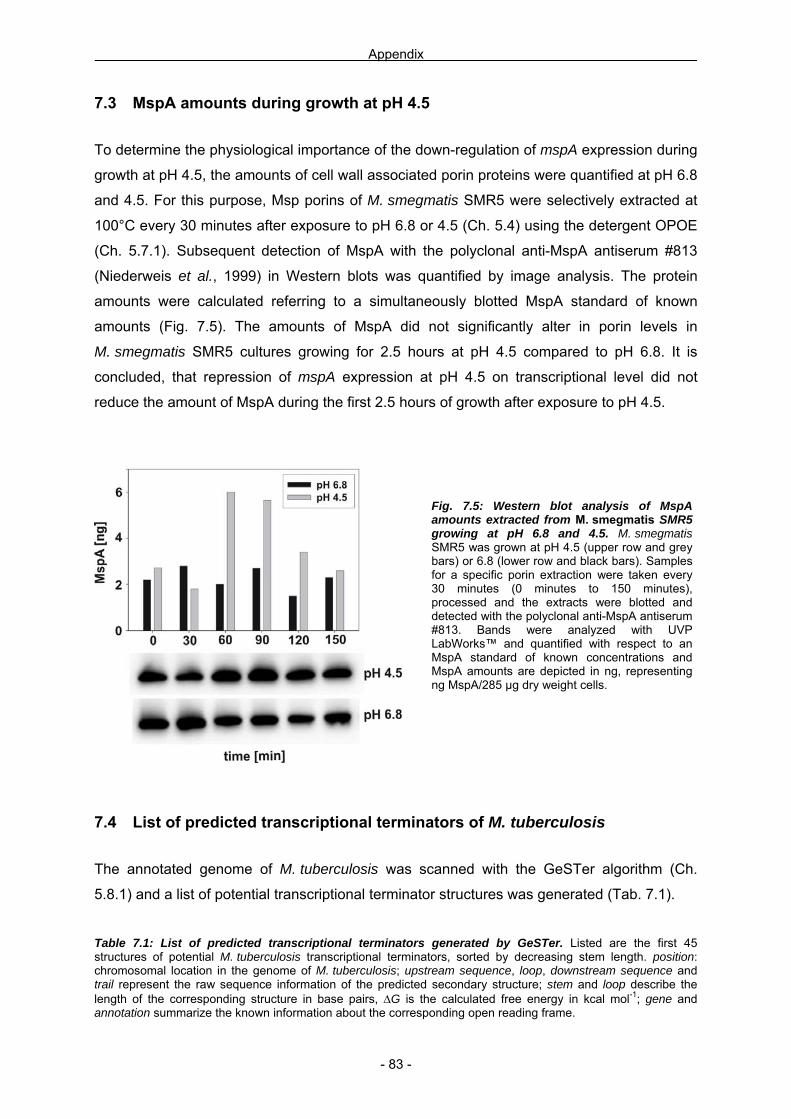
Appendix
7.3 MspA amounts during growth at pH 4.5
To determine the physiological importance of the down-regulation of mspA expression during
growth at pH 4.5, the amounts of cell wall associated porin proteins were quantified at pH 6.8
and 4.5. For this purpose, Msp porins of M. smegmatis SMR5 were selectively extracted at
100°C every 30 minutes after exposure to pH 6.8 or 4.5 (Ch. 5.4) using the detergent OPOE
(Ch. 5.7.1). Subsequent detection of MspA with the polyclonal anti-MspA antiserum #813
(Niederweis et al., 1999) in Western blots was quantified by image analysis. The protein
amounts were calculated referring to a simultaneously blotted MspA standard of known
amounts (Fig. 7.5). The amounts of MspA did not significantly alter in porin levels in
M. smegmatis SMR5 cultures growing for 2.5 hours at pH 4.5 compared to pH 6.8. It is
concluded, that repression of mspA expression at pH 4.5 on transcriptional level did not
reduce the amount of MspA during the first 2.5 hours of growth after exposure to pH 4.5.
Fig. 7.5: Western blot analysis of MspA amounts extracted from M. smegmatis SMR5 growing at pH 6.8 and 4.5. M. smegmatis SMR5 was grown at pH 4.5 (upper row and grey bars) or 6.8 (lower row and black bars). Samples for a specific porin extraction were taken every 30 minutes (0 minutes to 150 minutes), processed and the extracts were blotted and detected with the polyclonal anti-MspA antiserum #813. Bands were analyzed with UVP LabWorks™ and quantified with respect to an MspA standard of known concentrations and MspA amounts are depicted in ng, representing ng MspA/285 µg dry weight cells.
7.4 List of predicted transcriptional terminators of M. tuberculosis
The annotated genome of M. tuberculosis was scanned with the GeSTer algorithm (Ch.
5.8.1) and a list of potential transcriptional terminator structures was generated (Tab. 7.1).
Table 7.1: List of predicted transcriptional terminators generated by GeSTer. Listed are the first 45 structures of potential M. tuberculosis transcriptional terminators, sorted by decreasing stem length. position: chromosomal location in the genome of M. tuberculosis; upstream sequence, loop, downstream sequence and trail represent the raw sequence information of the predicted secondary structure; stem and loop describe the length of the corresponding structure in base pairs, ΔG is the calculated free energy in kcal mol-1; gene and annotation summarize the known information about the corresponding open reading frame.
- 83 -

Appendix Appendix
- 84 -
- 84 -

Appendix
7.5 Abbreviation index APS Ammonium persulfate ATP Adenosine triphosphate bp base pairs BSA bovine serum albumin C2FDG 5-acetylaminofluorescein di-β-D-galactopyranoside CCR combined polymerase chain reaction Ch. chapter DMSO dimethylsulfoxide DNA Desoxyribonucleic acid dNTPs Desoxyribonucleotide triphosphate E. Escherichia ECL Enhanced chemiluminescence EDTA ethylendiamin tetraacetate EtOH Ethanol Fig. figure GFP Green fluorescent protein Hyg Hygromycin HygR Hygromycin resistance kb kilo base pair kDa kilo Dalton Km Kanamycin KmR Kanamycin resistance LB Luria-Bertani (broth) M. Mycobacterium mRNA messenger RNA ODx optical density measured at λ= x nm ONPG 2-Nitrophenyl β-D-galactopyranoside PAA Polyacrylamide PAGE Polyacrylamide gel electrophoresis PBS phosphate buffered saline PCR polymerase chain reaction pH potentia hygrogenii RBS Ribosome binding site RNA Ribonucleic acid RNase Ribonuclease rpm revolutions per minute RT room temperature SD Shine-Dalgarno sequence SDS sodiumdodecylsulfate Strep Streptomycin StrepR Streptomycin resistance Suc sucrose TEMED N,N,N’,N’-Tetramethylethylendiaminetriphosphate Tris Tris-(hydroxymethyl-)aminomethan UAR upstream activating region UTR untranslated region WT wildtype x after numbers: -fold X-gal 5-Bromo-4-Chloro-3-Indolyl-β-D-Galactopyranoside / between strain and plasmid: transformed with %(v/v) % (volume/volume) %(v/w) % (weight/volume)
- 85 -

Appendix
Units Nucleotides °C degree celsius A Adenosine Da Dalton C Cytidine g gram G Guanosin h hour T Thymidine l liter m meter M molar Dimensions min minute MU Miller units k kilo (103) s second m milli (10-3) U unit µ micro (10-6) V volt n nano (10-9) p pico (10-12) Amino acid nomenclature (IUPAC-IUB, 1969) A Alanine C Cysteine D Aspartate E Glutamate F Phenylalanine G Glycine H Histidine I Isoleucine K Lysine L Leucine M Methionine N Asparagine P Proline Q Glutamine R Arginine S Serine T Threonine V Valine W Tryptophan Y Tyrosine
- 86 -

Publications Hillmann, D. , Eschenbacher, I., Thiel, A. & Niederweis M. (2007). Expression of the major porin gene mspA is regulated in Mycobacterium smegmatis. J Bacteriol 189, 958-967

Curriculum Vitae Personal Data: Dietmar Gerd Hillmann
rd of December, 1975 in Nürnberg born on the 23
marital status: single
Professional career: Sept. 2002 – Sept. 2006 Scientific employee at the Department of
Microbiology, University of Erlangen
Oct. 2005 – June 2006 Department of Microbiology,
University of Alabama at Birmingham and
Department of Microbiology and Immunology,
Weill Cornell Medical College, New York City
PhD Thesis:
Expression and regulation of the porin gene mspA of
Mycobacterium smegmatis
Nov. 1998 – Sept. 2001 Study accompanying marketing research
Icon-Brand-Navigation, Nürnberg
University: Nov. 1996 – June 2002 Studies of Biology at the Friedrich-Alexander-University
Erlangen-Nürnberg (FAU)
Diploma with degrees in:
Microbiology, Immunology, Zoology, Informatics
Thesis: Optimizing the expression of porins in
Mycobacteria
Civilian service: Aug. 1995 – Sept. 1996 Home for elderly and disabled persons
AWO Castle Faberschloß, Schwarzenbruck
Education: Sept. 1982 – July 1986 Elementary school Winkelhaid
Sept. 1986 – July 1995 Secondary school Leibniz-Gymnasium Altdorf
High school diploma Grants: Sept. 2002 – Oct. 2005 The work was funded by the SFB Graduiertenkolleg 805


![2019 MSPA ABC Test (002) [Read-Only]...6/19/2019 1 MSPA-Americas Strategies for Satisfying an ‘ABC’ Test For Independent-Contractor Status Paul Ryan MSPA Legislative Chair Russell](https://img.pdfslide.us/doc/110x75/61106947b2fe2e45f6101acf/2019-mspa-abc-test-002-read-only-6192019-1-mspa-americas-strategies-for.jpg)