Embed Size (px)
Citation preview
–
Expressing Load Allocations withExpressing Load Allocations with Direct Linkage to ImplementationDirect Linkage to ImplementationDirect Linkage to ImplementationDirect Linkage to Implementation
ToolsTools
Nutrient TMDL Workshop February 15 17 2011February 15 17, 2011
New Orleans, LA
Kevin Kirsch PEKevin Kirsch, PE Wisconsin Department of Natural Resources
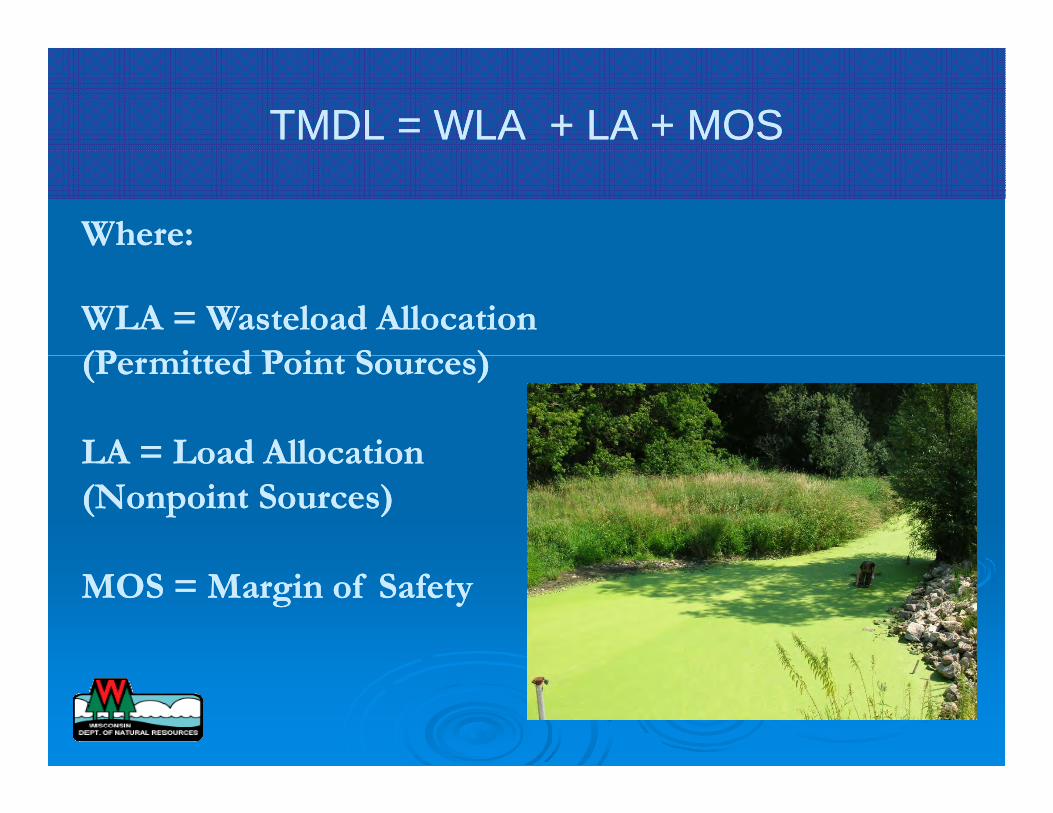
TMDL = WLA + LA + MOSTMDL = WLA + LA + MOS
Where:Where:
WLA = Wasteload AllocationWLA = Wasteload Allocation (P i d P i S )(P i d P i S )(Permitted Point Sources)(Permitted Point Sources)
LA = Load AllocationLA = Load AllocationLA Load AllocationLA Load Allocation (Nonpoint Sources)(Nonpoint Sources)
MOS = Margin of SafetyMOS = Margin of Safety
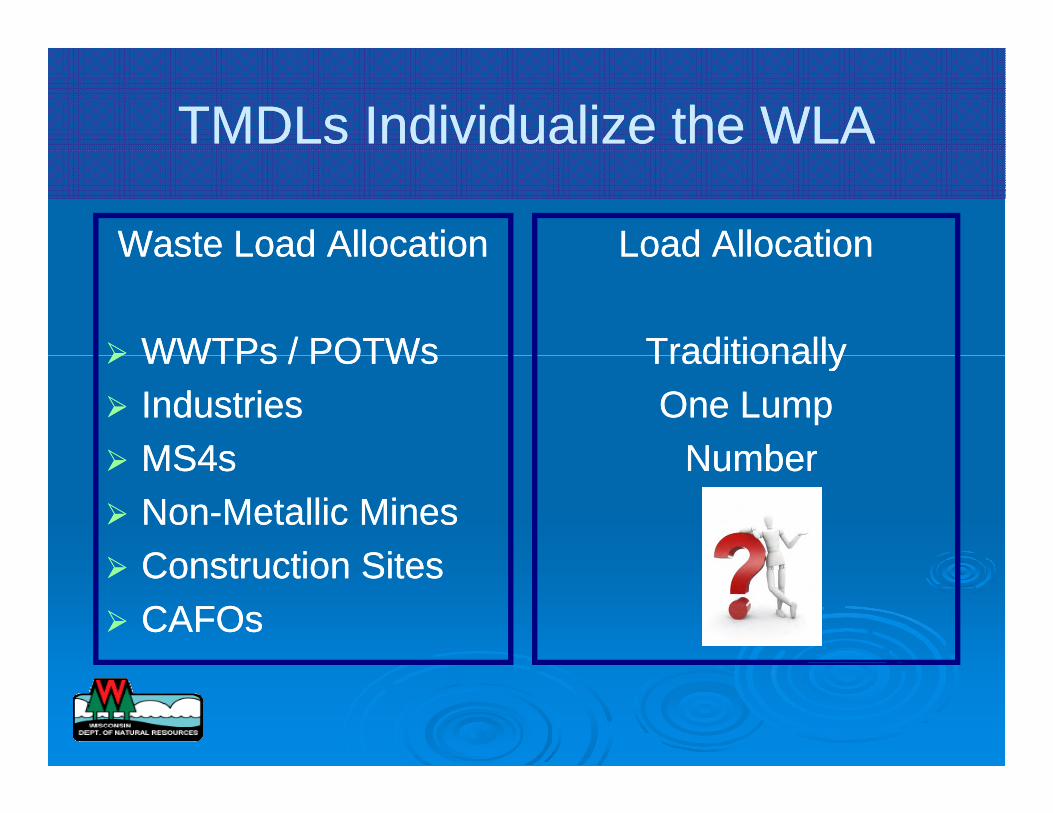
TMDLs Individualize the WLATMDLs Individualize the WLA
Waste Load AllocationWaste Load Allocation Load AllocationLoad AllocationWaste Load AllocationWaste Load Allocation
¾¾ WWTPs / POTWsWWTPs / POTWs
Load AllocationLoad Allocation
TraditionallyTraditionally¾¾ WWTPs / POTWsWWTPs / POTWs ¾¾ IndustriesIndustries ¾¾ MS4sMS4s
TraditionallyTraditionally One LumpOne Lump
NumberNumber¾¾ MS4sMS4s ¾¾ NonNon--Metallic MinesMetallic Mines ¾¾ Construction SitesConstruction Sites
NumberNumber
¾¾ Construction SitesConstruction Sites ¾¾ CAFOsCAFOs
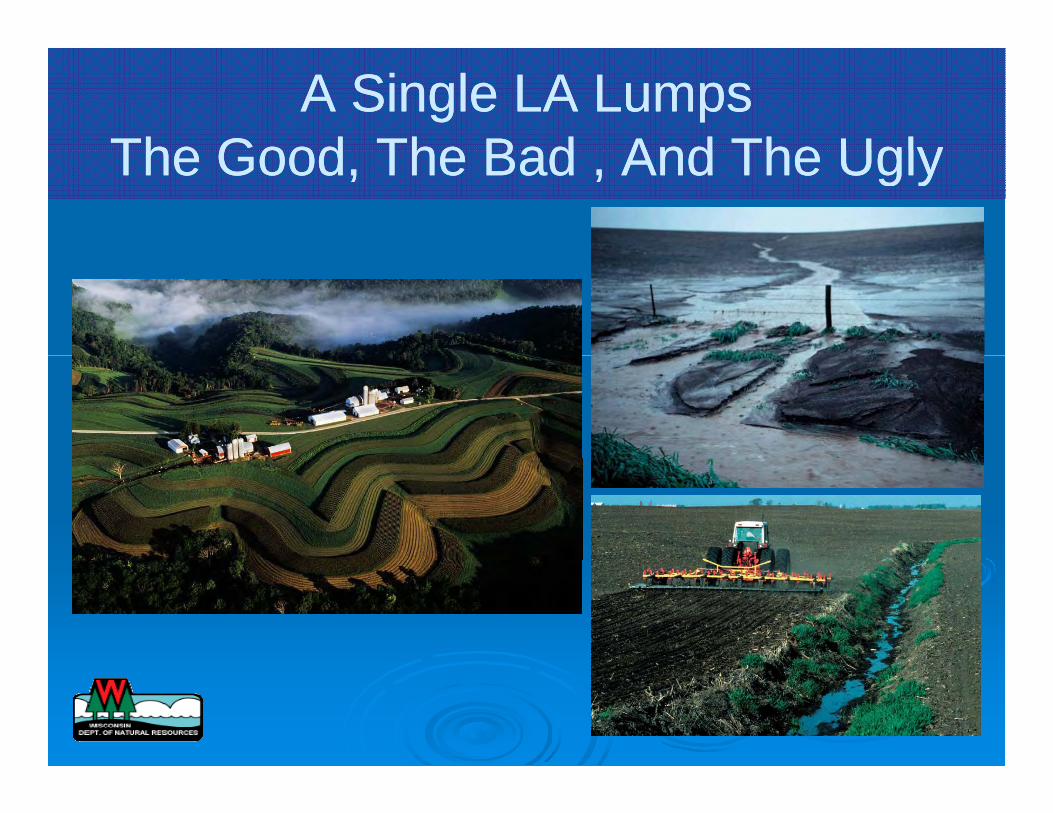
A Single LA LumpsA Single LA Lumps
The Good The Bad And The UglyThe Good The Bad And The UglyThe Good, The Bad , And The UglyThe Good, The Bad , And The Ugly
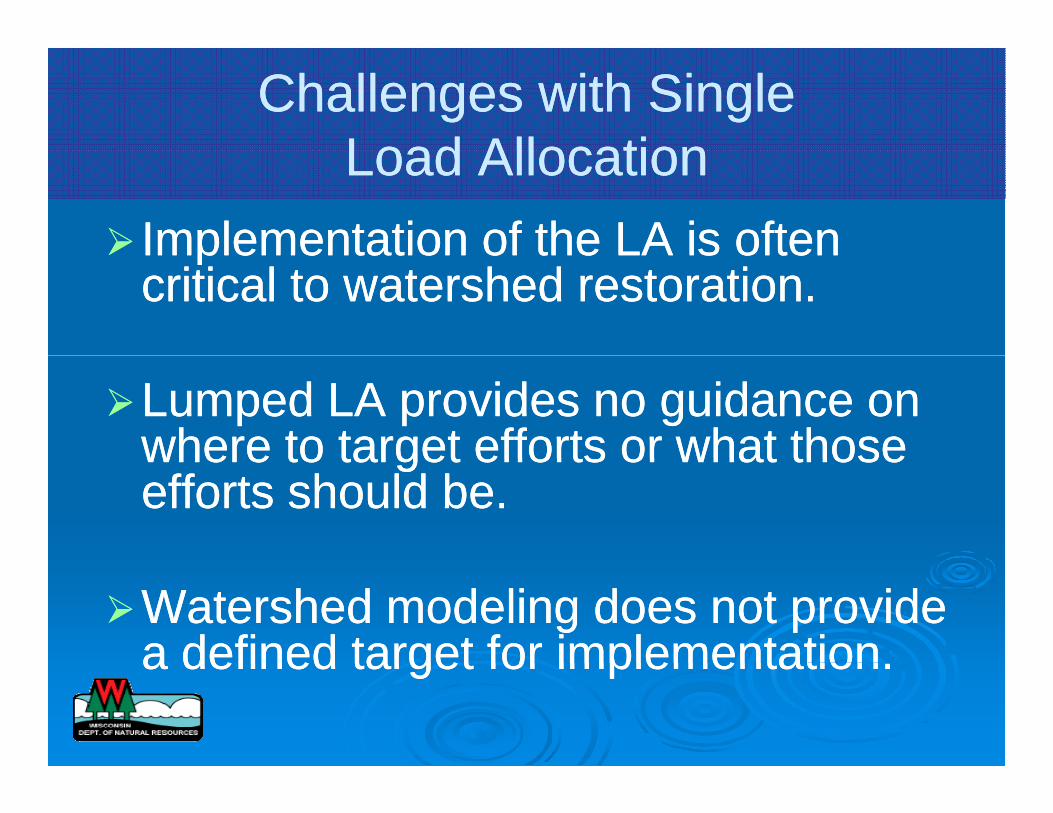
Challenges with SingleChallenges with Single Load AllocationLoad AllocationLoad AllocationLoad Allocation
¾¾ Implementation of the LA is oftenImplementation of the LA is often¾¾ Implementation of the LA is oftenImplementation of the LA is often critical to watershed restoration.critical to watershed restoration.
¾¾Lumped LA provides no guidance onLumped LA provides no guidance onwhere to target efforts or what thosewhere to target efforts or what thosewhere to target efforts or what thosewhere to target efforts or what those efforts should be.efforts should be.
¾¾Watershed modeling does not provideWatershed modeling does not provide a defined target for implementationa defined target for implementationa defined target for implementation.a defined target for implementation.
gg
SO WHAT???SO WHAT???SO WHAT???SO WHAT???
Excuse: We have limited controlExcuse: We have limited control over nonover non--permitted discharges.permitted discharges.
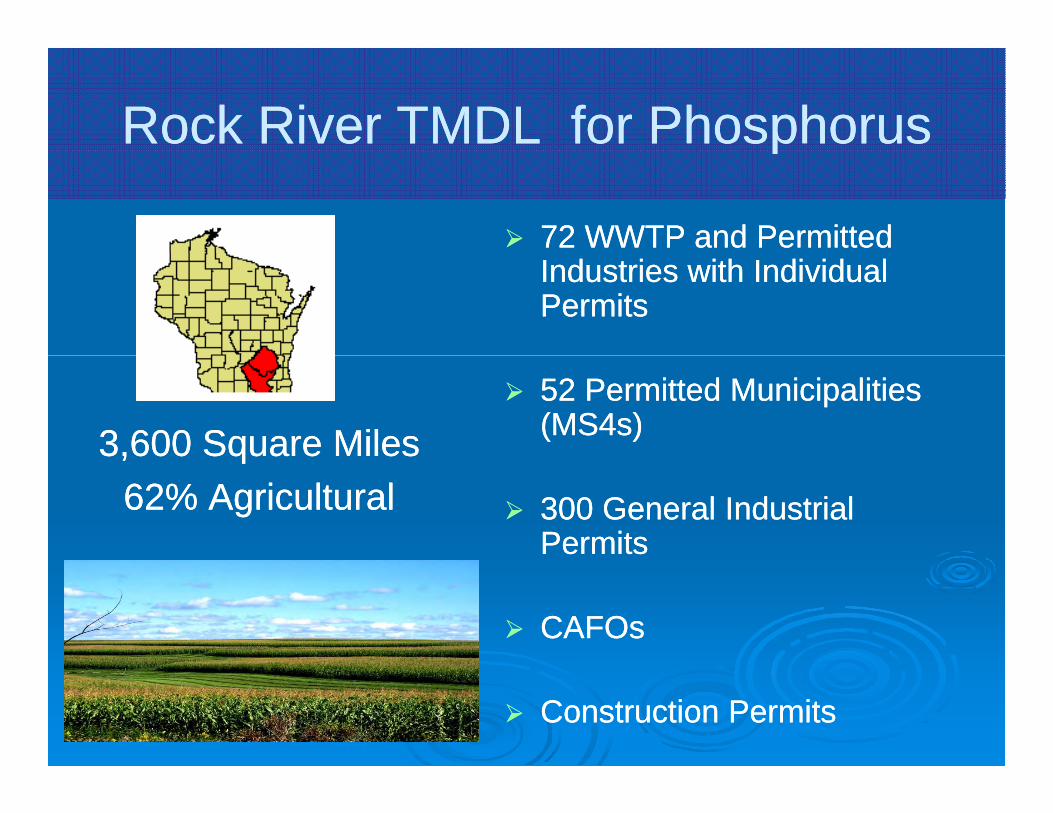
Rock River TMDL for PhosphorusRock River TMDL for Phosphoruspp
¾¾ 72 WWTP and Permitted72 WWTP and Permitted Industries with IndividualIndustries with Individual PermitsPermits
3,600 Square Miles3,600 Square Miles ¾¾ 52 Permitted Municipalities52 Permitted Municipalities
(MS4s)(MS4s) , q, q 62% Agricultural62% Agricultural ¾¾ 300 General Industrial300 General Industrial
PermitsPermits
¾¾ CAFOsCAFOs
¾¾ Construction PermitsConstruction Permits
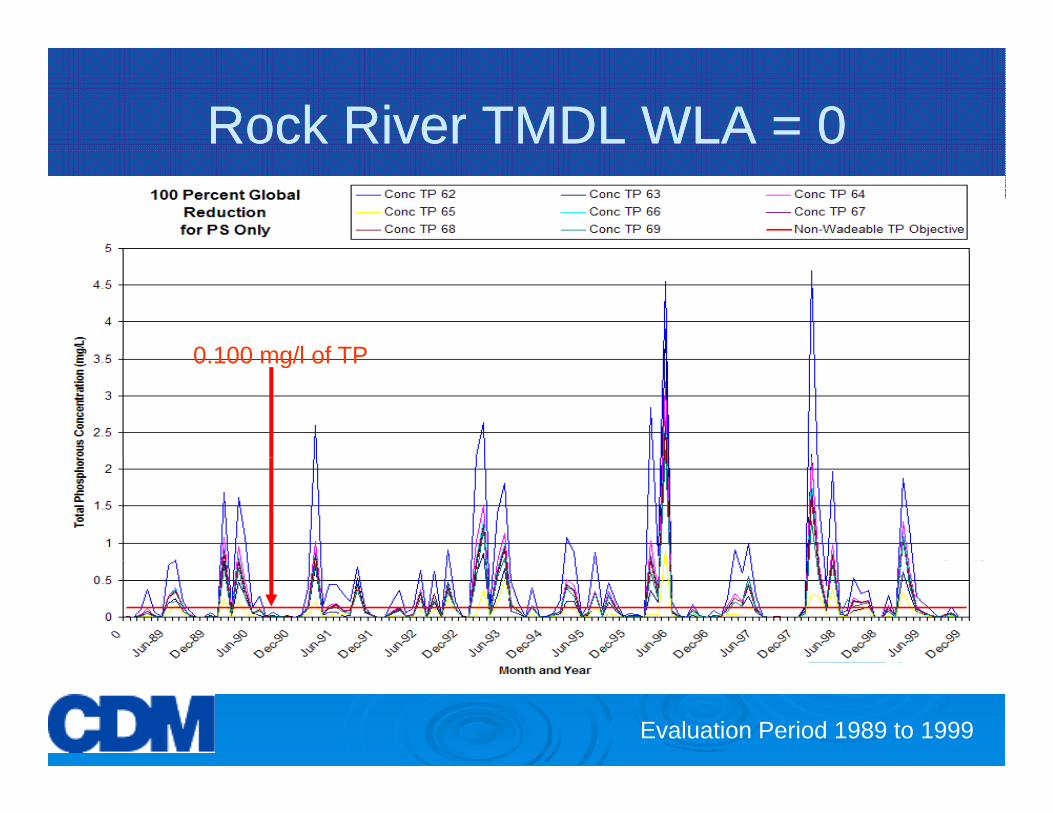
Rock River TMDL WLA = 0Rock River TMDL WLA = 0
0 100 mg/l of TP0.100 mg/l of TP
Evaluation Period 1989 to 1999
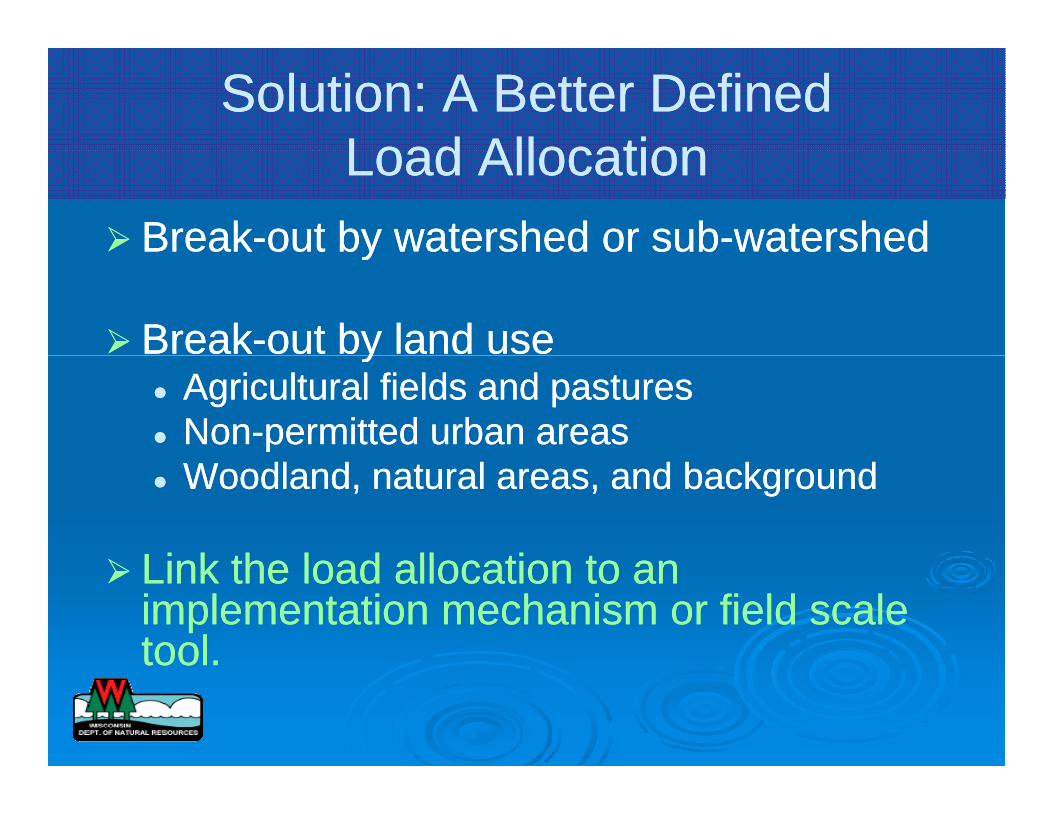
Solution: A Better DefinedSolution: A Better Defined Load AllocationLoad AllocationLoad AllocationLoad Allocation
¾¾ BreakBreak--out by watershed or subout by watershed or sub--watershedwatershedyy
¾¾ BreakBreak--out by land useout by land useyyzz Agricultural fields and pasturesAgricultural fields and pastures zz NonNon--permitted urban areaspermitted urban areas zz Woodland, natural areas, and backgroundWoodland, natural areas, and background
¾¾ Li k th l d ll ti tLi k th l d ll ti t¾¾ Link the load allocation to anLink the load allocation to an implementation mechanism or field scaleimplementation mechanism or field scaletool.tool.tool.tool.
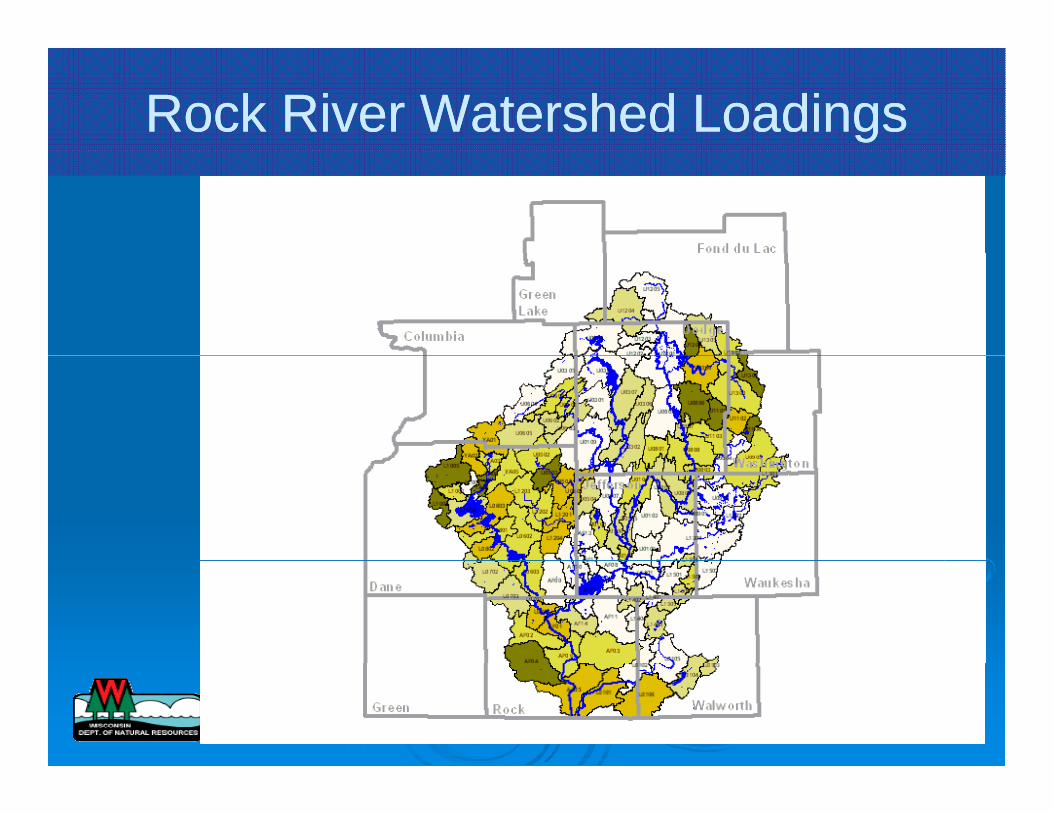
Rock River Watershed LoadingsRock River Watershed Loadings
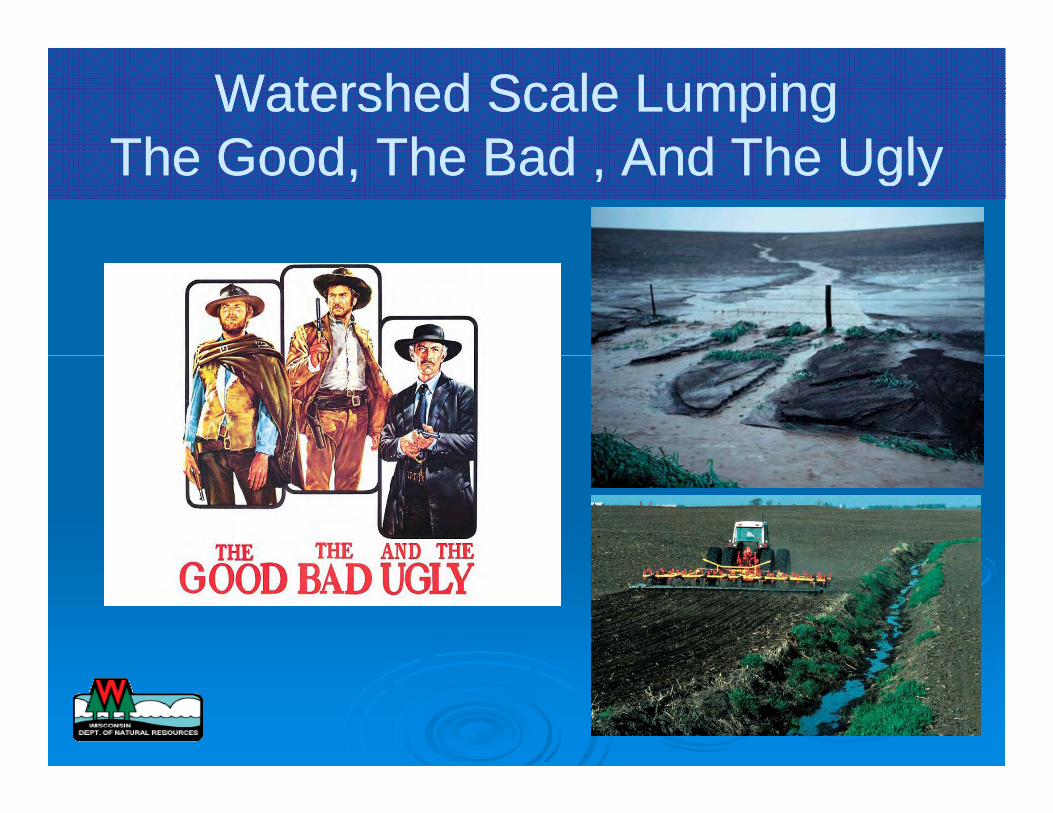
Watershed Scale LumpingWatershed Scale Lumping
The Good The Bad And The UglyThe Good The Bad And The UglyThe Good, The Bad , And The UglyThe Good, The Bad , And The Ugly
to anto an
¾¾¾¾
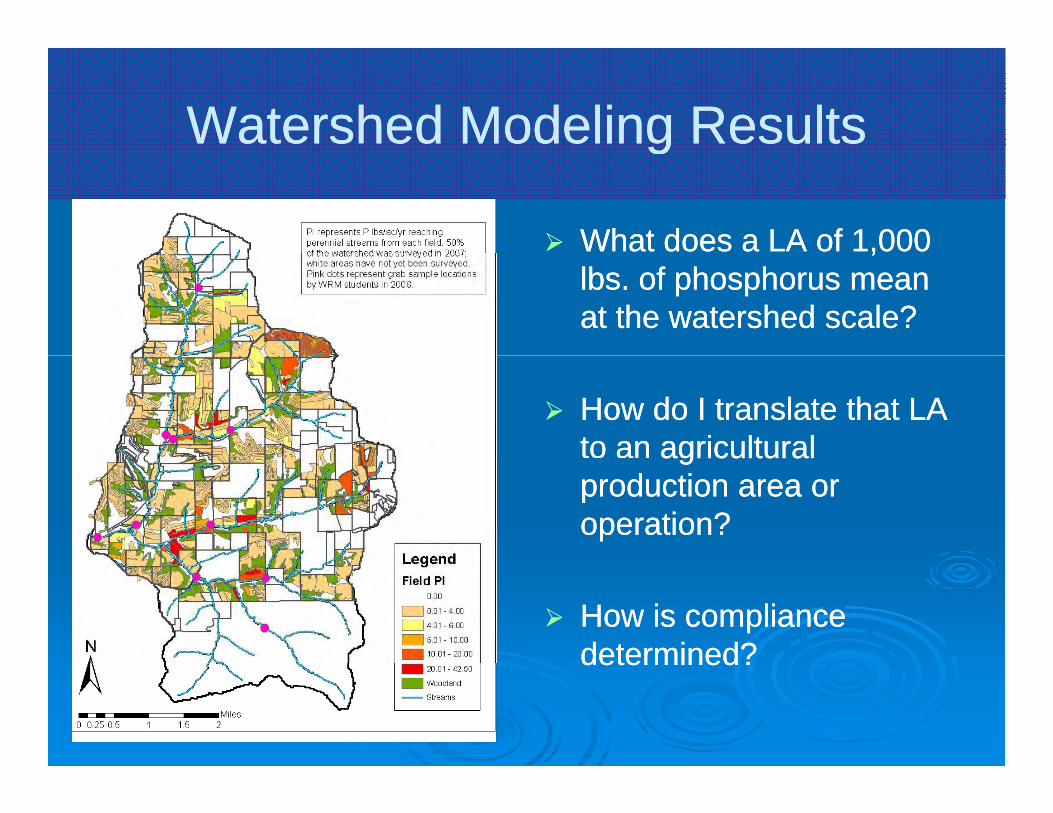
Watershed Modeling ResultsWatershed Modeling Resultsgg
¾¾ What does a LA of 1,000What does a LA of 1,000,,lbs. of phosphorus meanlbs. of phosphorus mean at the watershed scale?at the watershed scale?
¾¾ How do I translate that LAHow do I translate that LA to an agriculturalto an agriculturalagriculturalagricultural production area orproduction area or operation?operation?
¾¾ How is complianceHow is compliance determined?determined?determined?determined?
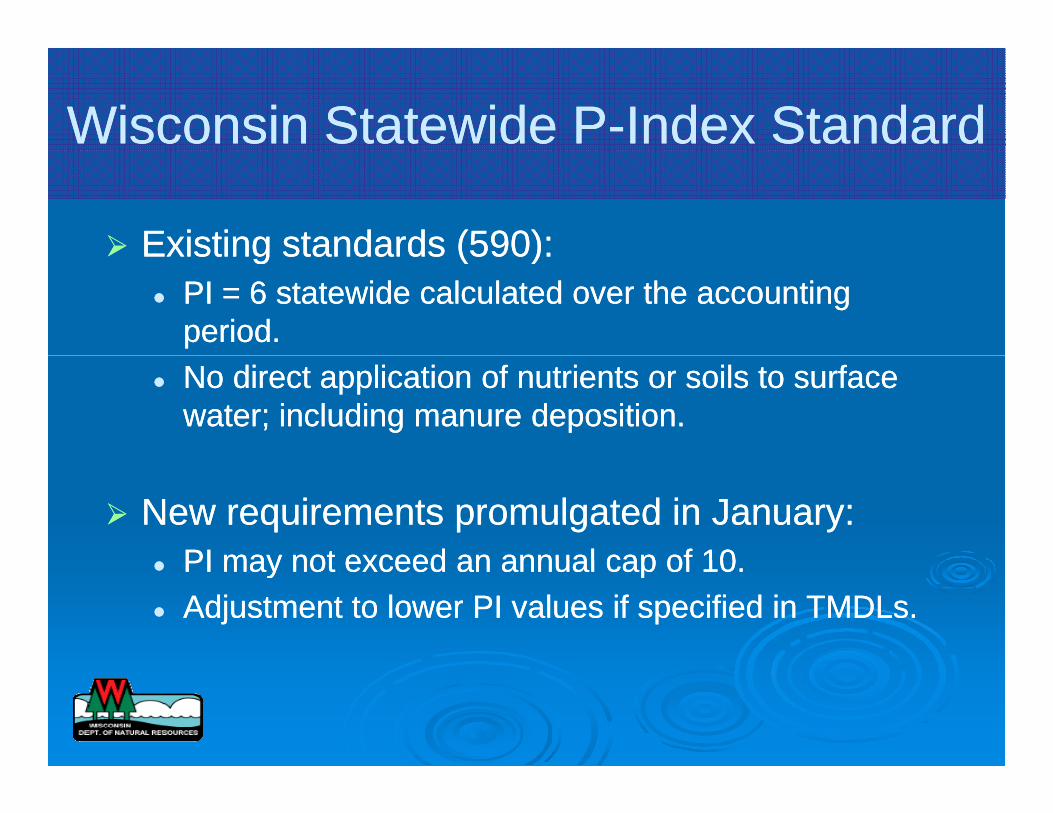
Wisconsin Statewide PWisconsin Statewide P--Index StandardIndex Standard
¾¾ Existing standards (590):Existing standards (590):¾¾ Existing standards (590):Existing standards (590): zz PI = 6 statewide calculated over the accountingPI = 6 statewide calculated over the accounting
period.period. zz No direct application of nutrients or soils to surfaceNo direct application of nutrients or soils to surface
water; including manure deposition.water; including manure deposition.
¾¾ New requirements promulgated in January:New requirements promulgated in January: PI may not exceed an annual cap of 10PI may not exceed an annual cap of 10zz PI may not exceed an annual cap of 10.PI may not exceed an annual cap of 10.
zz Adjustment to lower PI values if specified in TMDLs.Adjustment to lower PI values if specified in TMDLs.
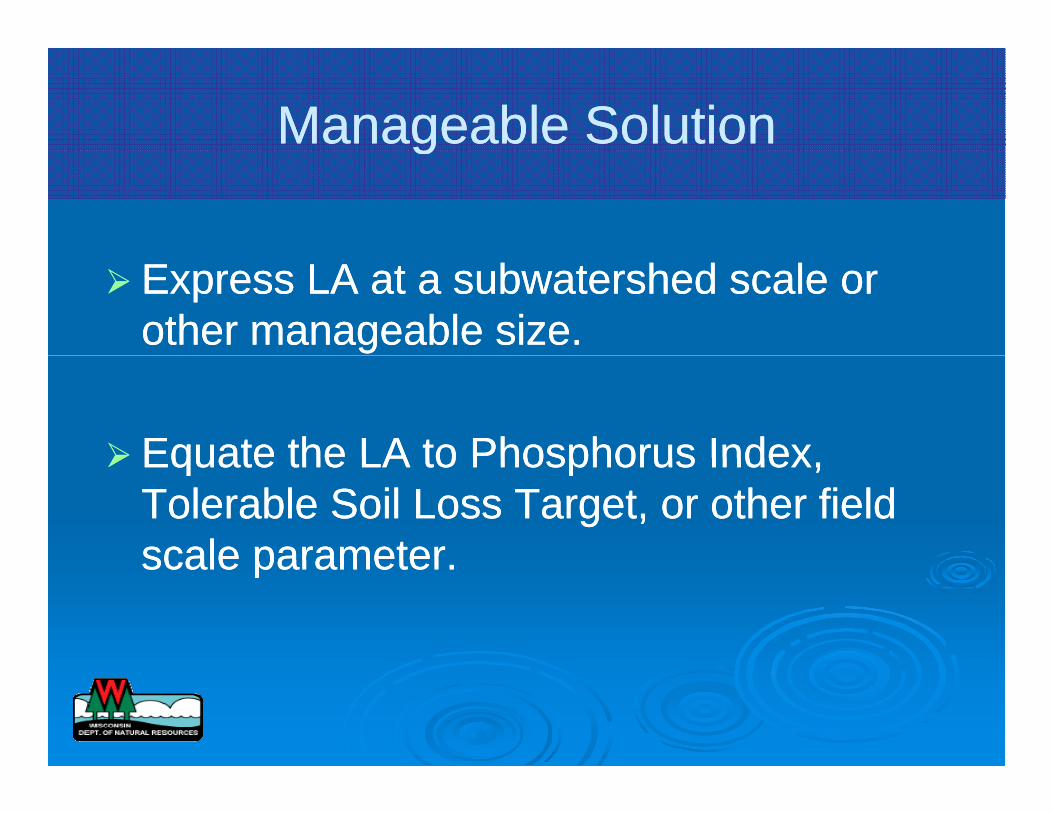
Manageable SolutionManageable Solutiongg
¾¾ Express LA at a subwatershed scale orExpress LA at a subwatershed scale or other manageable size.other manageable size.
¾¾ Equate the LA to Phosphorus IndexEquate the LA to Phosphorus Index¾¾ Equate the LA to Phosphorus Index,Equate the LA to Phosphorus Index, Tolerable Soil Loss Target, or other fieldTolerable Soil Loss Target, or other field scale parameterscale parameterscale parameter.scale parameter.
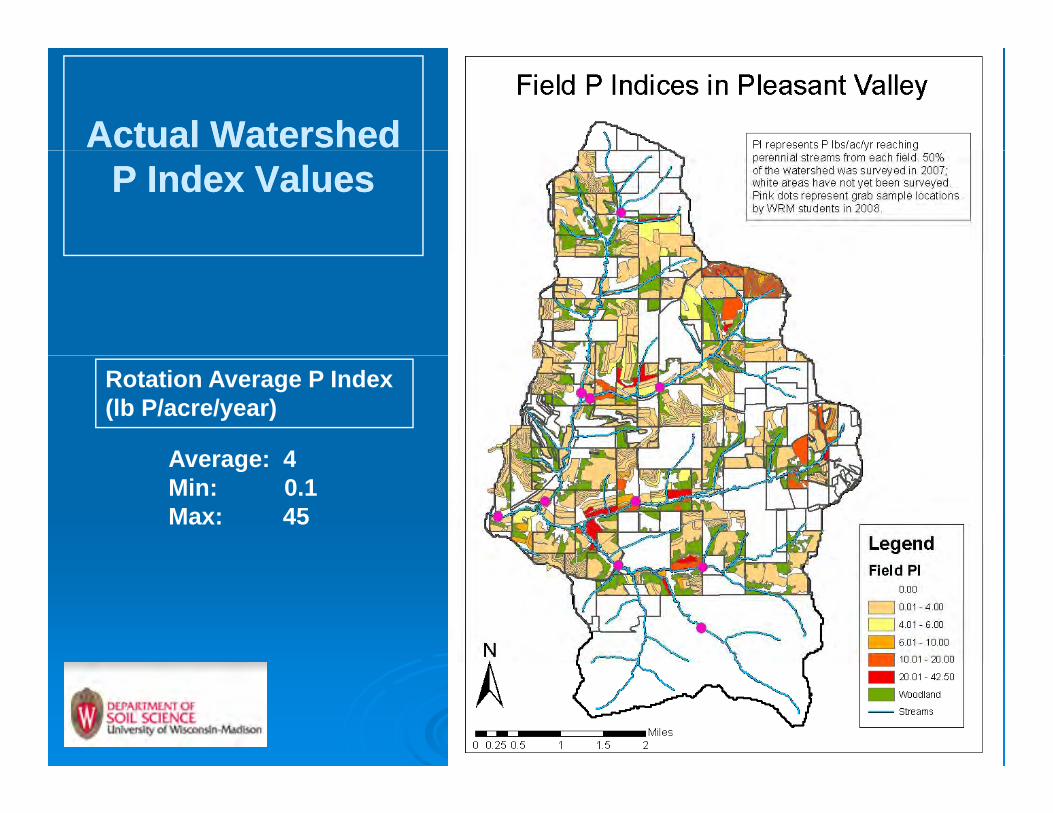
Actual WatershedActual Watershed P Index ValuesP Index Values
Rotation Average P Index (lb P/acre/year)
Average: 4Average: 4 Min: 0.1 Max: 45
of loads.of loads.
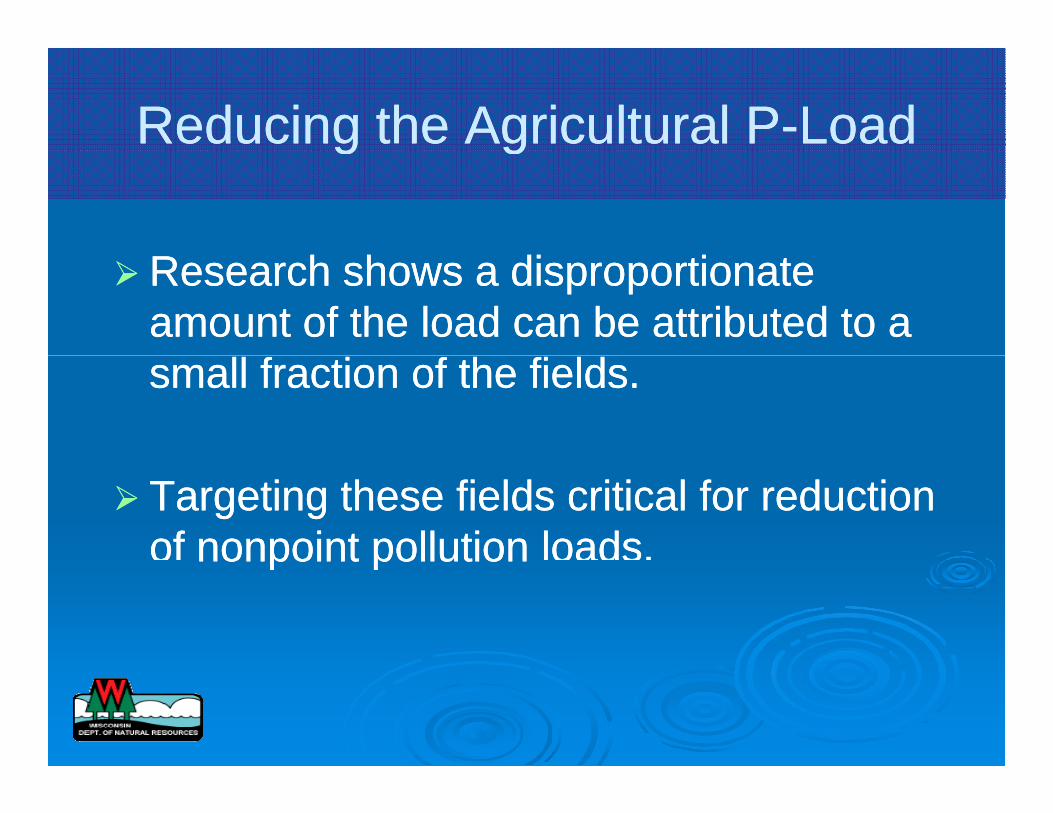
Reducing the Agricultural PReducing the Agricultural P--LoadLoadg gg g
¾¾Research shows a disproportionateResearch shows a disproportionate amount of the load can be attributed to aamount of the load can be attributed to a small fraction of the fields.small fraction of the fields.
¾¾ Targeting these fields critical for reductionTargeting these fields critical for reduction of nonpoint pollution loads.of nonpoint pollution loads.nonpoint pollutionnonpoint pollution
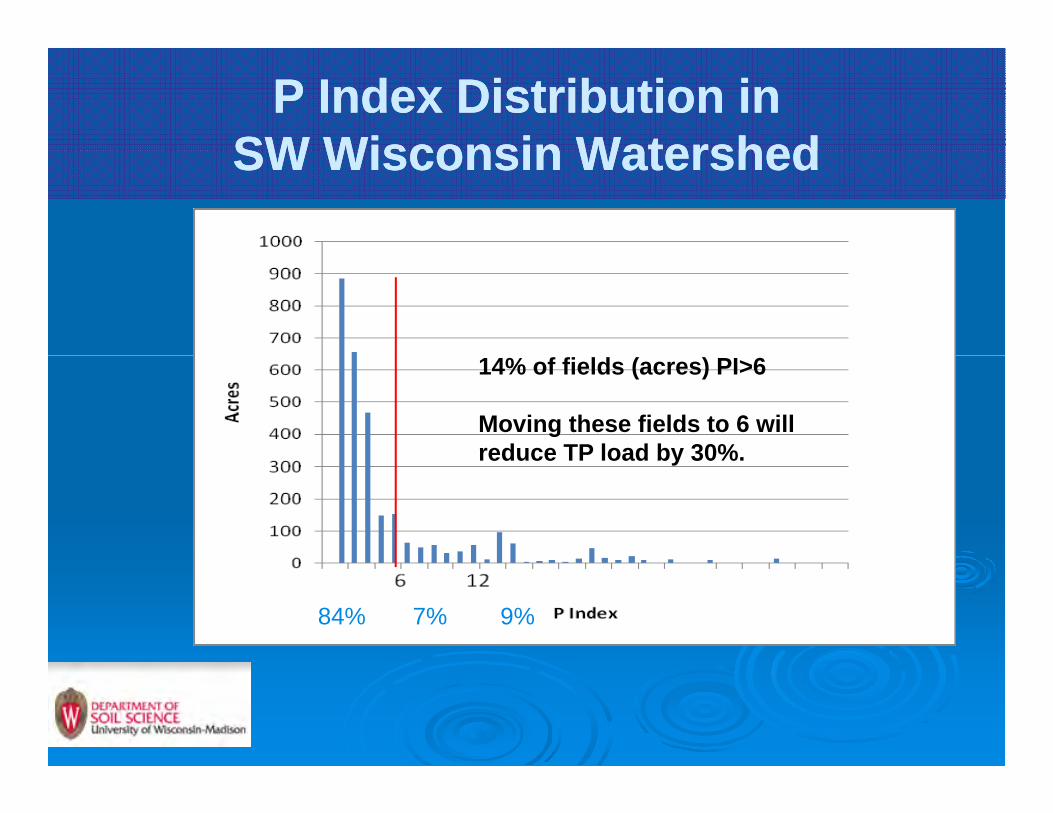
P Index Distribution inP Index Distribution in SW Wisconsin WatershedSW Wisconsin WatershedSW Wisconsin WatershedSW Wisconsin Watershed
14% of fields (acres) PI>6
Moving these fields to 6 will reduce TP load by 30%.reduce TP load by 30%.
7% 9%84%
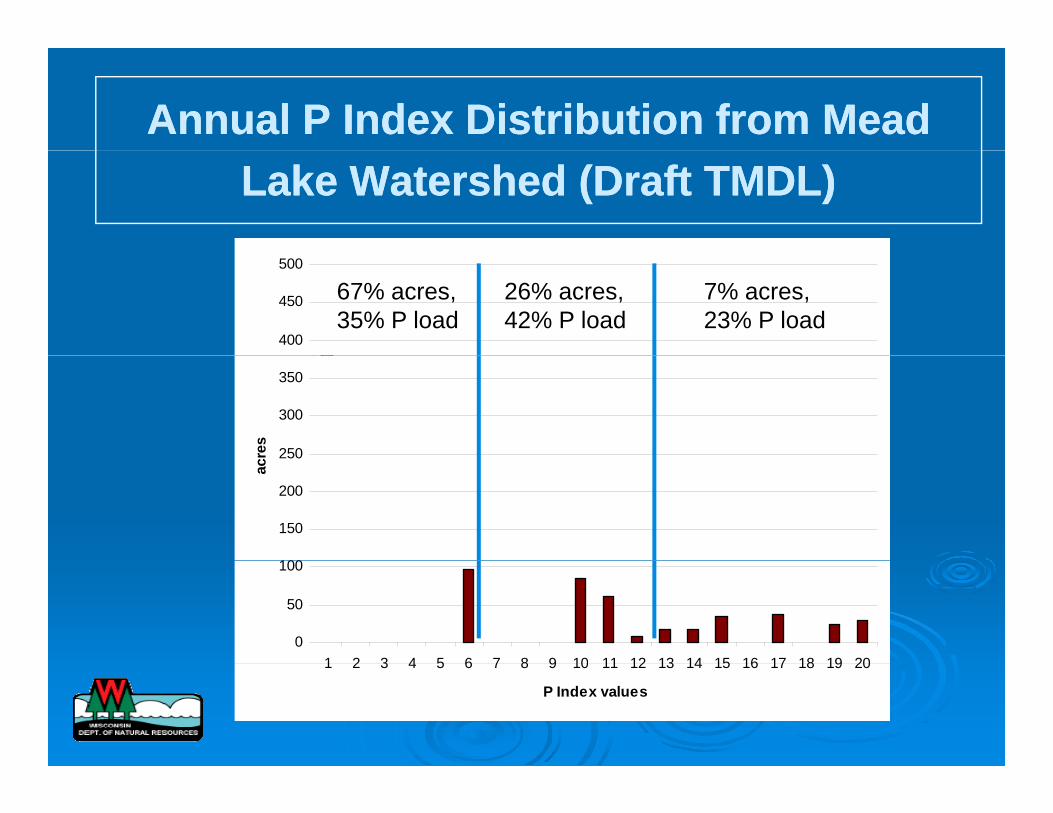
Annual P Index Distribution from MeadAnnual P Index Distribution from Mead Lake Watershed (Draft TMDL)Lake Watershed (Draft TMDL)
400
450
500
67% acres, 35% P load
26% acres, 42% P load
7% acres, 23% P load
250
300
350
res
100
150
200
250
ac
0
50
100
1 2 3 4 5 6 7 8 9 10 11 12 13 14 15 16 17 18 19 201 2 3 4 5 6 7 8 9 10 11 12 13 14 15 16 17 18 19 20
P Index values
Acres
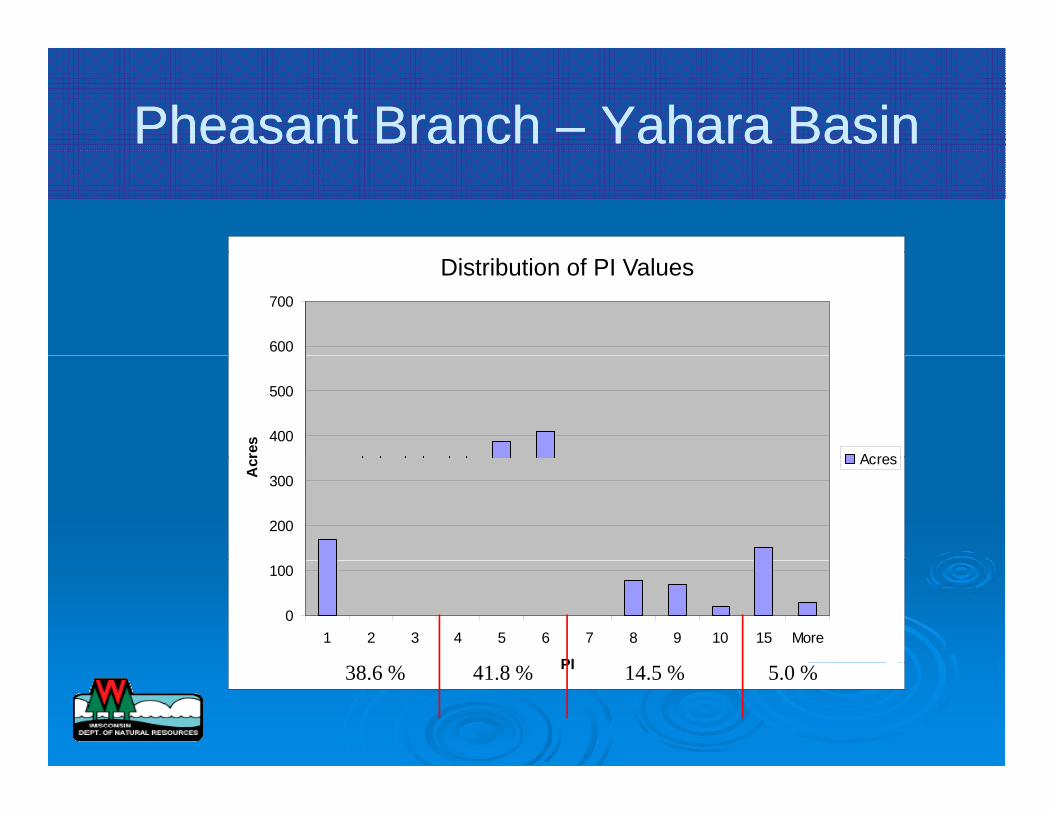
Pheasant BranchPheasant Branch –– Yahara BasinYahara Basin
A
600
700
Distribution of PI Values
400
500
res
Acres
200
300Ac Acres
0
100
1 2 3 4 5 6 7 8 9 10 15 More
PIPI38.6 % 41.8 % 14.5 % 5.0 %
D i i d i ib i
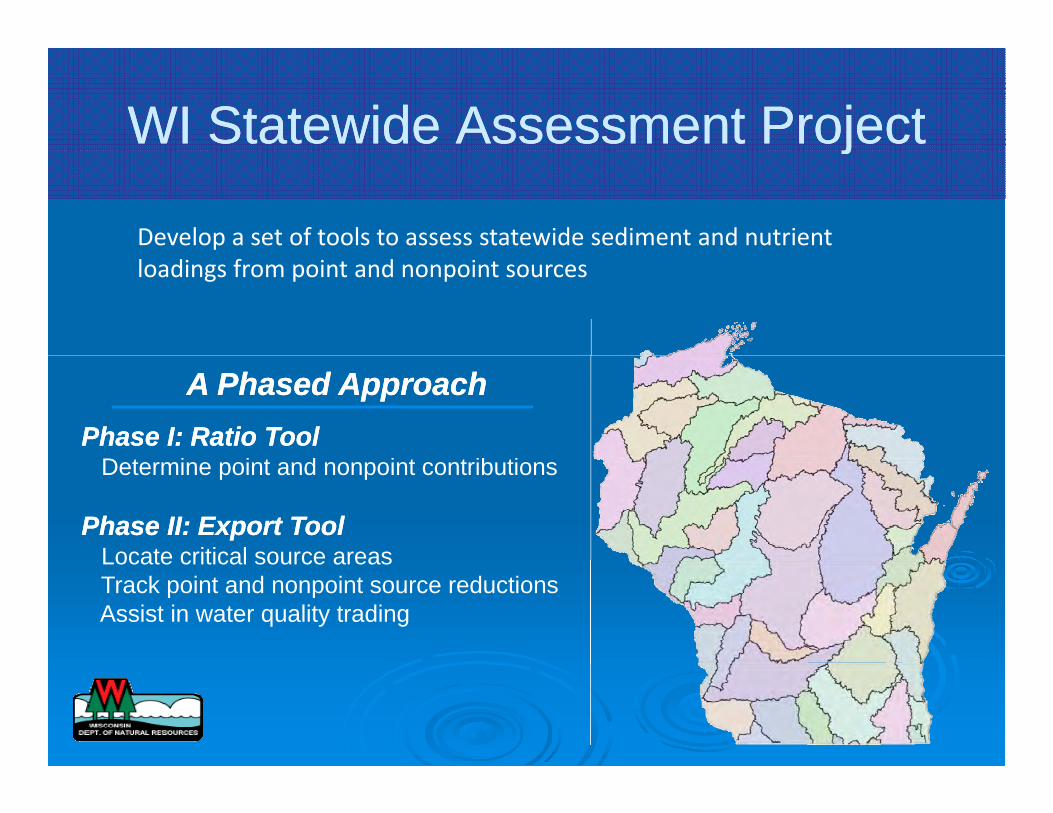
WI Statewide Assessment ProjectWI Statewide Assessment Projectjj
Develop a set of tools to assess statewide sediment and nutrient loadings from point and nonpoint sources
Phase I: Ratio ToolPhase I: Ratio Tool
A Phased ApproachA Phased Approach
Determine point and nonpoint contributions
Phase II: Export ToolPhase II: Export Tool Locate critical source areasLocate critical source areas Track point and nonpoint source reductions Assist in water quality trading
o t s o o t Sou ce a s s
3
portport
-
-
1
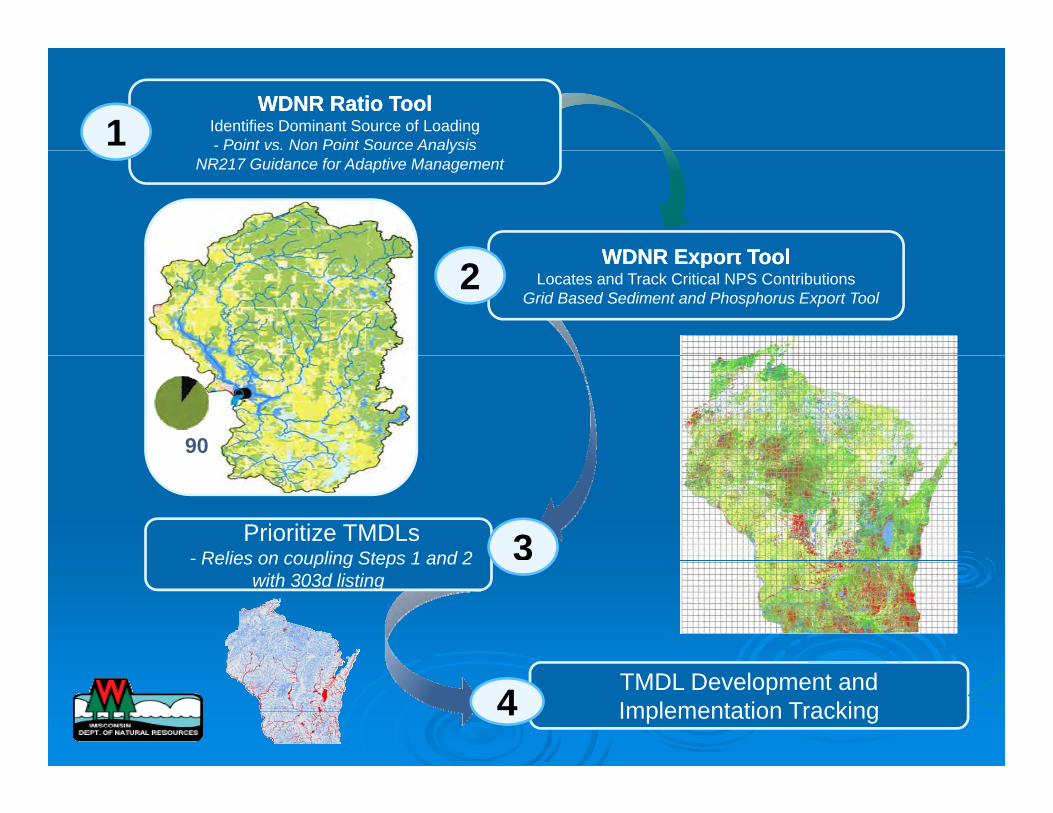
WDNR Ratio ToolWDNR Ratio Tool Identifies Dominant Source of Loading - Point vs. Non Point Source Analysis1
WDNR E ToolWDNR E Tool
y NR217 Guidance for Adaptive Management
WDNR Export ToolWDNR Export Tool Locates and Track Critical NPS Contributions
Grid Based Sediment and Phosphorus Export Tool 2
1
10:90
Prioritize TMDLs - Relies on coupling Steps 1 and 2 3Relies on coupling Steps 1 and 2
with 303d listing
TMDL Development and Implementation Tracking4
Q i Wh i h j ib f ll i h h d?
l d l h
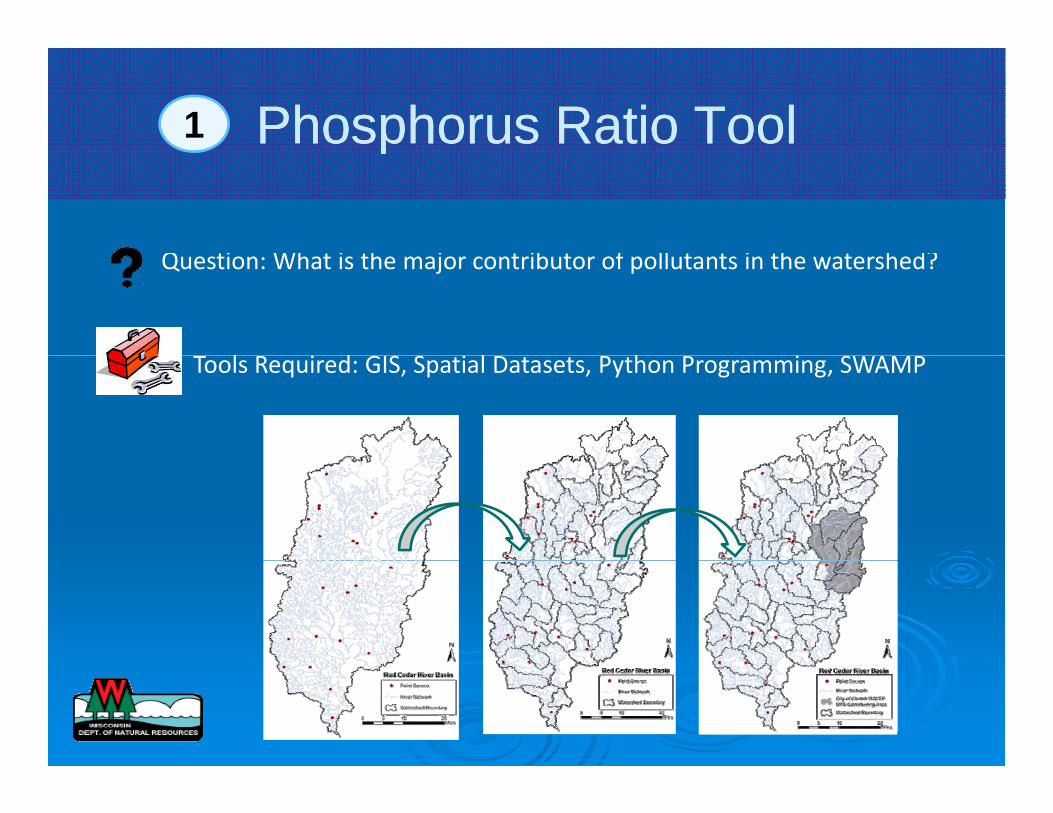
Phosphorus Ratio ToolPhosphorus Ratio Tool1 pp
Question: What is the major contributor of pollutants in the watershed?
Tools Required: GIS, Spatial Datasets, Python Programming, SWAMP
O tf ll L ti El ti
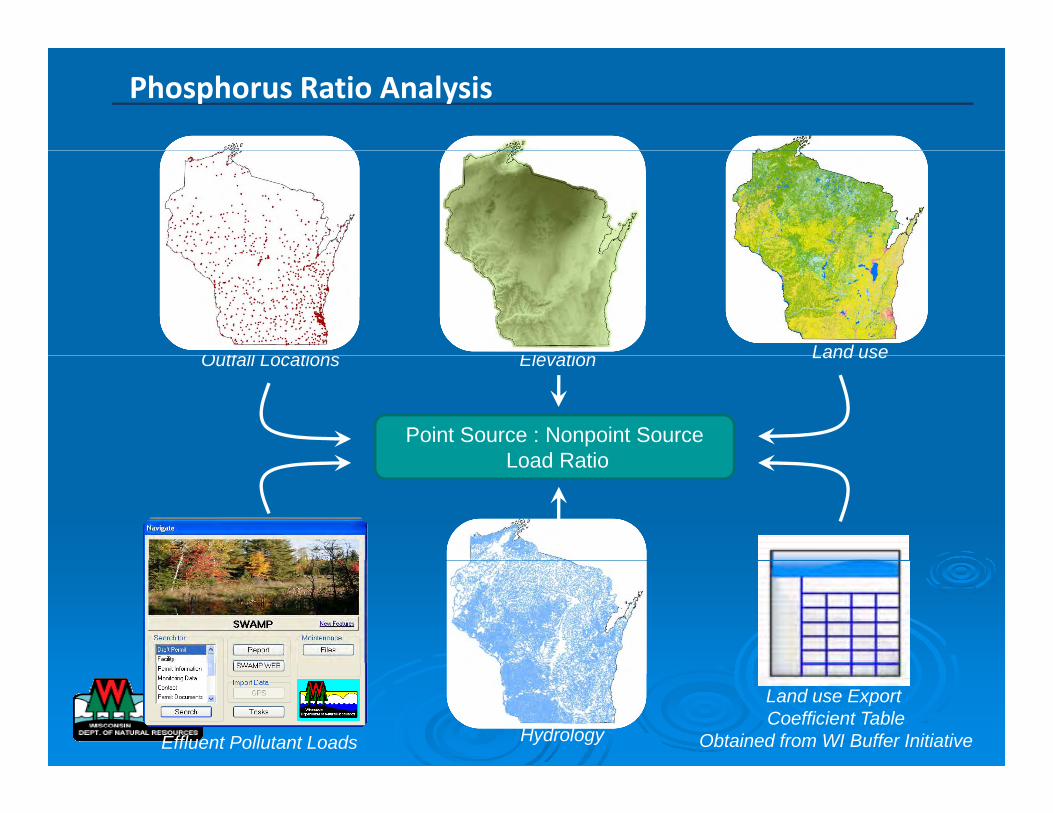
Phosphorus Ratio Analysis
Land use
Point Source : Nonpoint Source Load Ratio
Outfall Locations Elevation Land use
Load Ratio
Land use Export Coefficient Table
Obtained from WI Buffer Initiative HydrologyEffluent Pollutant Loads
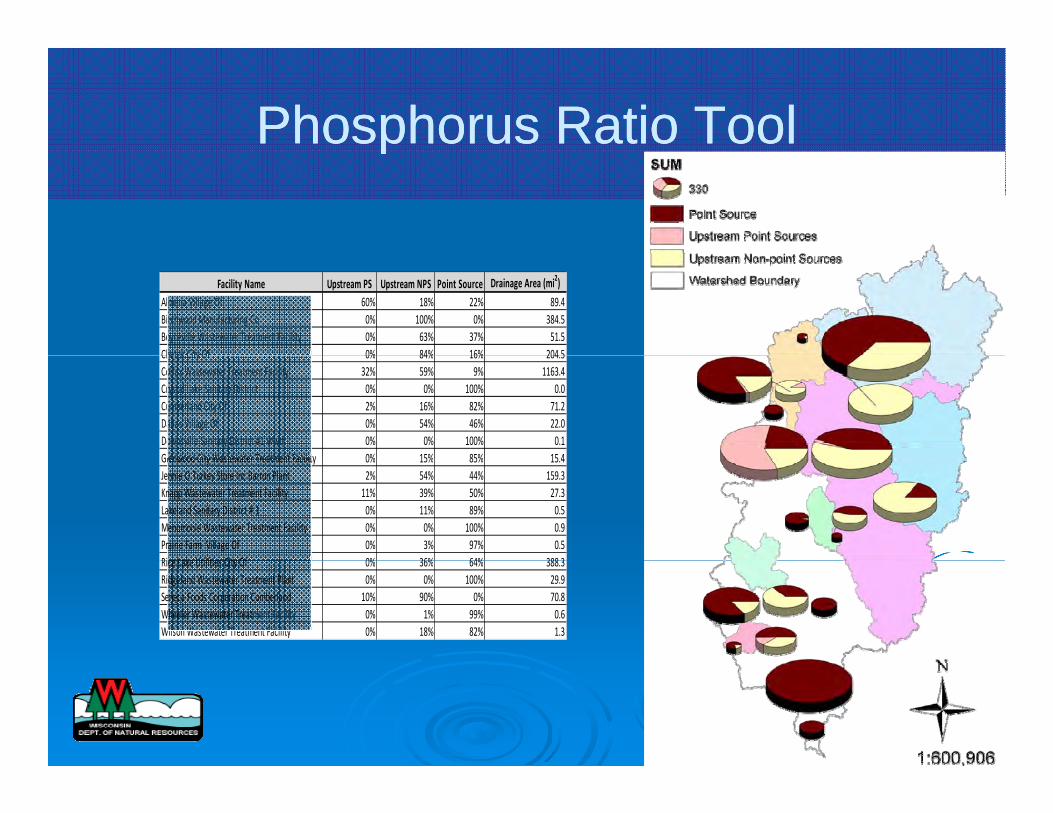
Phosphorus Ratio ToolPhosphorus Ratio Toolpp
Facility Name Upstream PS Upstream NPS Point Source Drainage Area (mi2)
Almena Village Of 60% 18% 22% 89.4 Birchwood Manufacturing Co 0% 100% 0% 384.5 Boyceville Wastewater Treatment Facility 0% 63% 37% 51.5 Chetek City Of 0% 84% 16% 204 5Chetek City Of 0% 84% 16% 204.5 Colfax Wastewater Treatment Facility 32% 59% 9% 1163.4 Crystal Lake Sanitary District 0% 0% 100% 0.0 Cumberland City Of 2% 16% 82% 71.2 Dallas Village Of 0% 54% 46% 22.0 Downsville Sanitary District #1 Wwtf 0% 0% 100% 0.1 Glenwood City Wastewater Treatment Facility 0% 15% 85% 15 4
ycilitaFtenmtearTretawetsWanoilsWycilitaFtenm
Glenwood City Wastewater Treatment Facility 0% 15% 85% 15.4 Jennie O Turkey Store Inc Barron Plant 2% 54% 44% 159.3 Knapp Wastewater Treatment Facility 11% 39% 50% 27.3 Lakeland Sanitary District # 1 0% 11% 89% 0.5 Menomonie Wastewater Treatment Facility 0% 0% 100% 0.9 Prairie Farm Village Of 0% 3% 97% 0.5 Rice Lake Utilities City Of 0% 36% 64% 388 3Rice Lake Utilities City Of 0% 36% 64% 388.3 Ridgeland Wastewater Treatment Plant 0% 0% 100% 29.9 Seneca Foods Corporation Cumberland 10% 90% 0% 70.8 Wheeler Wastewater Treat 0% 1% 99% 0.6
0% 18% 82% 1.3
t
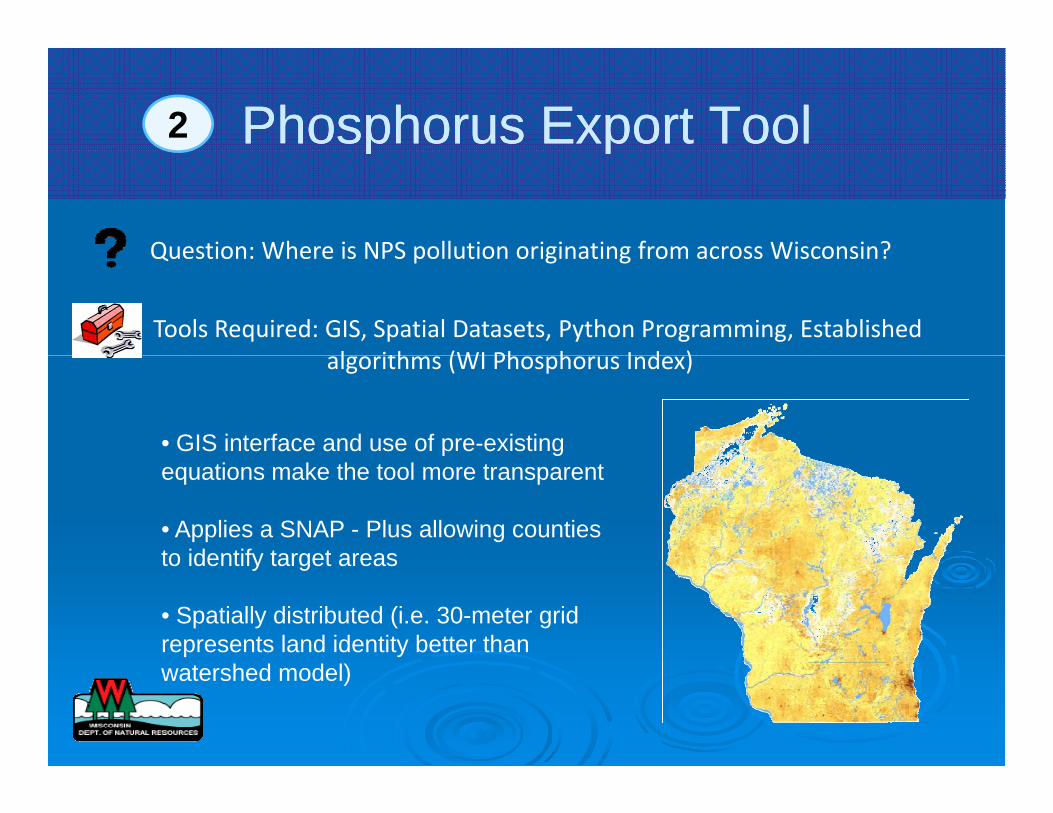
Phosphorus Export ToolPhosphorus Export Tool2 p pp p
Question: Where is NPS pollution originating from across Wisconsin?Question: Where is NPS pollution originating from across Wisconsin?
Tools Required: GIS, Spatial Datasets, Python Programming, Established l i h (WI Ph h I d )algorithms (WI Phosphorus Index)
• GIS interface and use of pre-existing equations make the tool more transparent
• Applies a SNAP - Plus allowing counties to identify target areasto identify target areas
• Spatially distributed (i.e. 30-meter grid represents land identity better than watershed model)
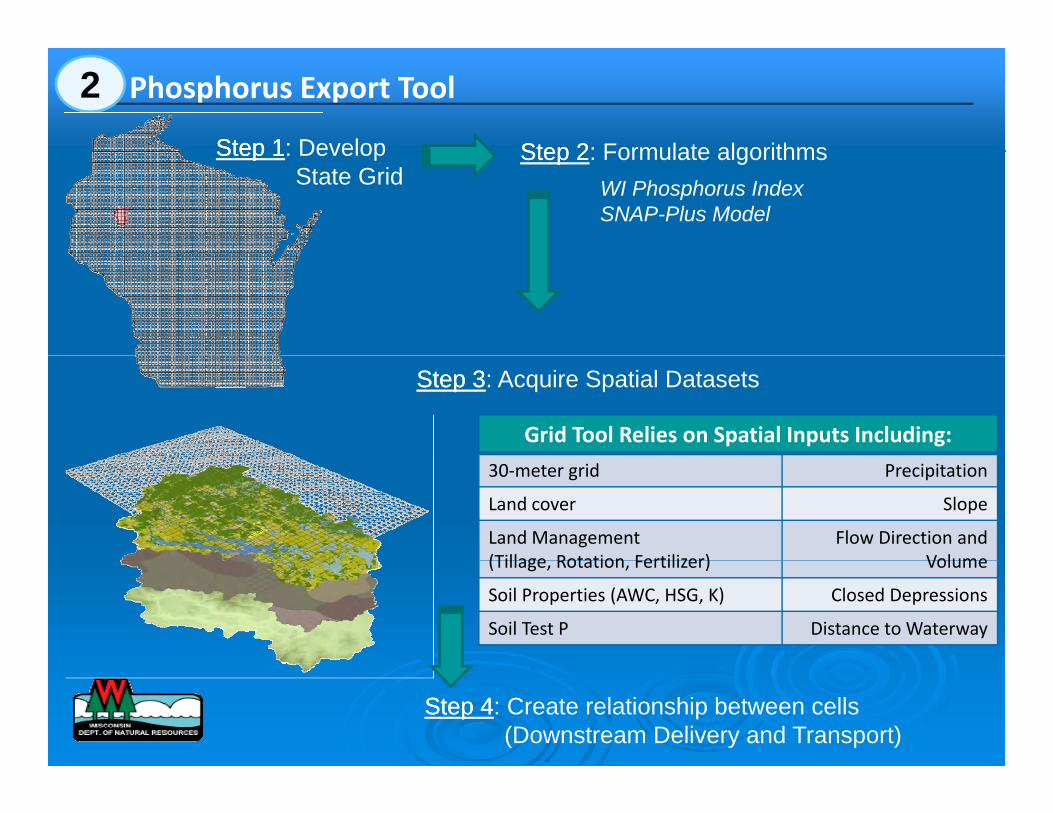
Phosphorus Export Tool2 Step 1Step 1: Develop Step 2Step 2: Formulate algorithms Step 1Step 1: Develop
State Grid Step 2Step 2: Formulate algorithms
WI Phosphorus Index SNAP-Plus Model
Step 3Step 3: Acquire Spatial Datasets
Grid Tool Relies on Spatial Inputs Including:
30‐meter grid Precipitation
Land cover Slope
Land Management (Tillage Rotation Fertilizer)
Flow Direction and Volume(Tillage, Rotation, Fertilizer) Volume
Soil Properties (AWC, HSG, K) Closed Depressions
Soil Test P Distance to Waterway
Step 4Step 4: Create relationship between cells (Downstream Delivery and Transport)
P i i i i f TMDL
on elevated simulated loads
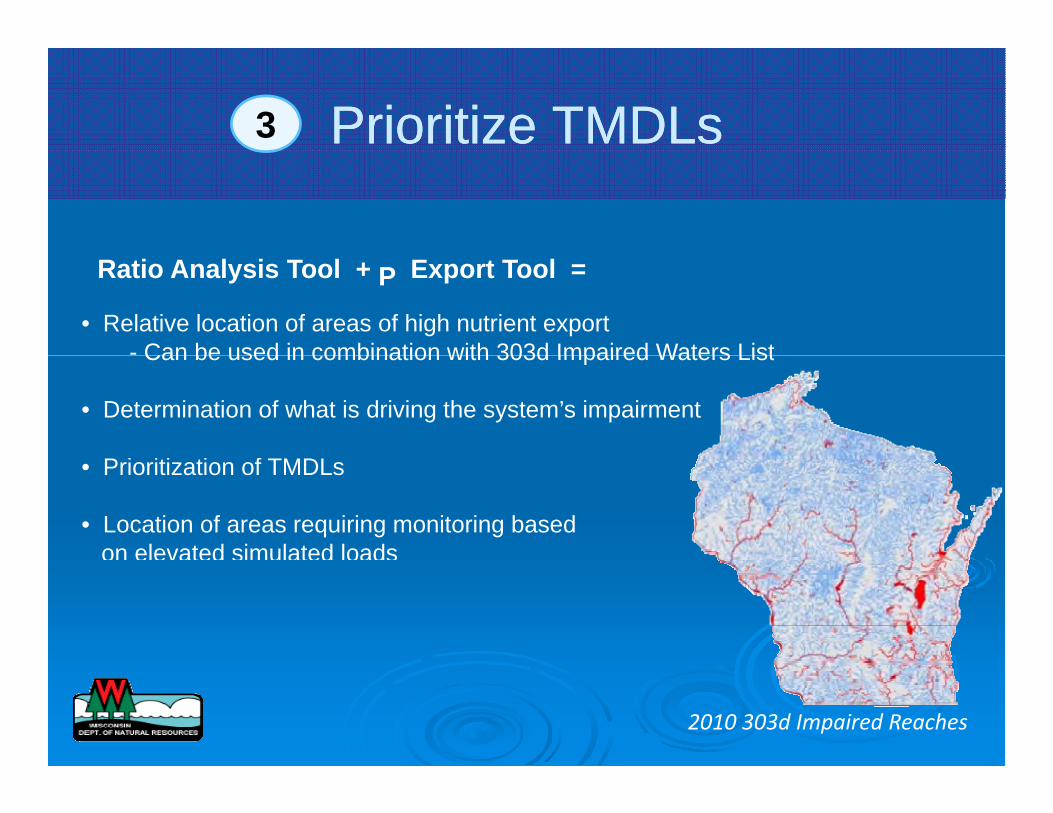
Prioritize TMDLsPrioritize TMDLs3
• Relative location of areas of high nutrient export - Can be used in combination with 303d Impaired Waters List
Ratio Analysis Tool + P Export Tool =
Can be used in combination with 303d Impaired Waters List
• Determination of what is driving the system’s impairment
• Prioritization of TMDLs
• Location of areas requiring monitoring based on elevated simulated loads
2010 303d Impaired Reaches
Tr of and non load assist in
nonnon as areas are
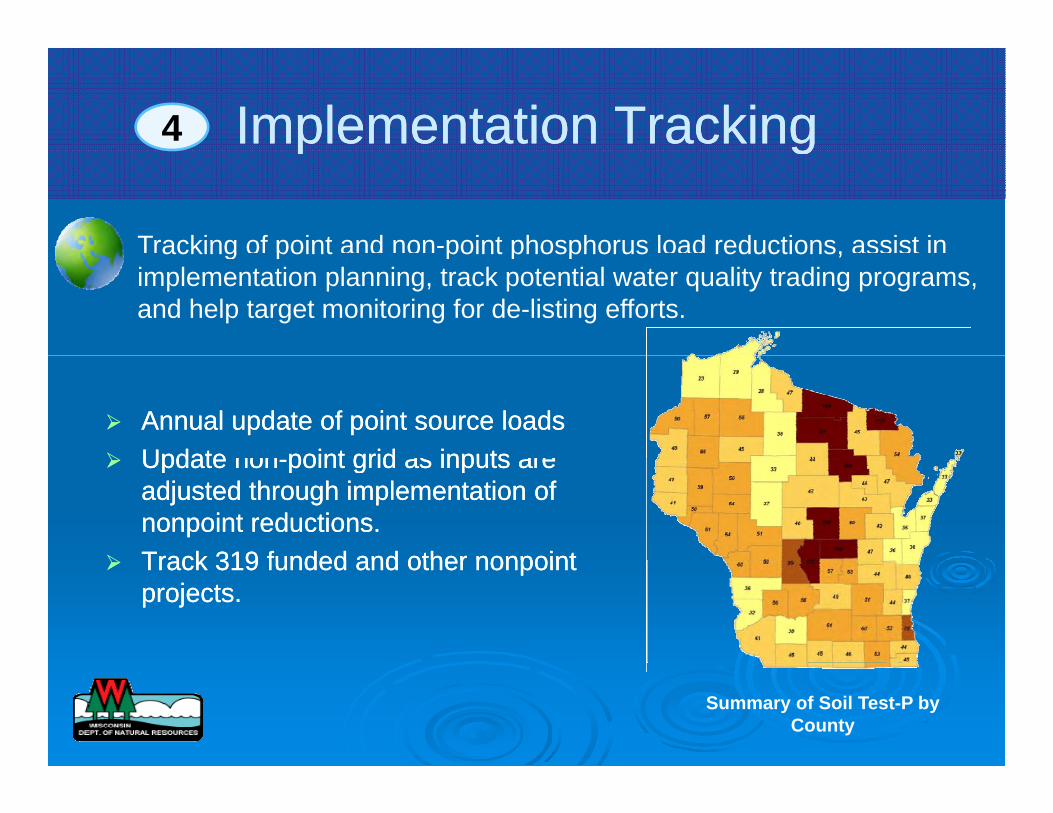
Implementation TrackingImplementation Tracking4 p gp g
Tracking of point and non-point phosphorus load reductions, assist inacking point point phosphorus reductions, implementation planning, track potential water quality trading programs, and help target monitoring for de-listing efforts.
¾¾ Annual update of point source loadsAnnual update of point source loads ¾¾ UpdateUpdate point grid inputspoint grid inputs¾¾ Update nonUpdate non--point grid as inputs arepoint grid as inputs are
adjusted through implementation ofadjusted through implementation of nonpoint reductions.nonpoint reductions.
¾¾ Track 319 funded and other nonpointTrack 319 funded and other nonpoint¾¾ Track 319 funded and other nonpointTrack 319 funded and other nonpoint projects.projects.
Summary of Soil Test-P by County
pp
ConclusionsConclusions
¾¾Refine LA to aid in implementation andRefine LA to aid in implementation and reduction of nonpoint pollution.reduction of nonpoint pollution.
¾¾GIS coupled with fieldGIS coupled with field--scale modelsscale models allowing targeting of nonpoint loadsallowing targeting of nonpoint loadsallowing targeting of nonpoint loads.allowing targeting of nonpoint loads.
¾¾Direct linkage with implementation planningDirect linkage with implementation planning and tracking.and tracking.