Embed Size (px)
Citation preview

EXPOSURE TO MILD HYPOXIA AND IMPLICATIONS FOR DECISION MAKING
Bob Henderson M.Sc.
October 2001
Abstract Eight healthy male subjects were required to make speeded responses to the
Manikin task and to complete a flight simulation instrument landing task during
prolonged exposure to a partially oxygen-deficient environment (mild hypoxic hypoxia).
The subjects were exposed, in a hypobaric chamber, to experimental conditions
at altitudes of Sea Level, 6,000ft, 8,000ft, 10,000ft, and 14,000 ft. All subjects served as
their own controls.
The individual variability of physiological responses to the hypoxic insult,
reported by other researchers, was confirmed. Accuracy on the Manikin was adversely
affected by decreasing blood oxygen saturation. Changes in blood oxygen saturation
were not correlated with reaction time on the Manikin task or any dependent variables
on the Flight Simulator task. Implications for skill-based and rule-based decision-
making in gliding and the use of supplementary oxygen are discussed.

EXPOSURE TO MILD HYPOXIA AND IMPLICATIONS FOR DECISION MAKING
Bob Henderson M.Sc.
October 2001
INTRODUCTION The absence of an adequate supply of oxygen to the tissues is termed hypoxia.
Glider pilots, like all humans, are vulnerable to the effects of oxygen deprivation and
severe or acute hypoxia nearly always results in a rapid deterioration of body functions.
The cells of the brain are particularly sensitive to a lack of oxygen. Hypoxic hypoxia
occurs when breathing air due to the reduction in the partial pressure of oxygen as
atmospheric pressure decreases with increasing altitude. It is caused by the absence of
an adequate supply of oxygen in arterial and capillary blood.
Oxygen is transported between the lungs and the tissues by haemoglobin
molecules in the blood. The combination of haemoglobin and oxygen is a loose and
reversible bond allowing haemoglobin to pick up and unload oxygen according to the
metabolic need and demand. The percentage saturation of arterial haemoglobin (SaO2)
describes the ratio of oxyhaemoglobin molecules to the total number of haemoglobin
molecules available to bind with oxygen. This is also referred to as blood oxygen
saturation.
An individual exposed to hypoxic hypoxia, at about 10,000 ft, experiences a
reduction in their SaO2 level from a sea level value of about 98% to a value of
approximately 92% to 93%. In response to this relatively mild insult, the respiration and
cardiac rates increase slightly. These physiological responses continue as altitude
increases. Breathing air at 25,000 ft results in a doubling of the heart rate and an
increase of 40 to 60% in the respiratory rate. For a normally healthy person, these
page 1

responses provide a measure of protection up to about 13,000 ft for periods of less than
60 minutes.
The physiological effects of hypoxia are well understood in terms of gaseous
exchange, times of useful consciousness and physical reactions, and excellent
summaries are available in the literature (e.g., Ernsting, Nicholson & Rainford, 1999).
The full range of accepted visual, general physiological, and neuro-muscular symptoms
induced by hypoxic hypoxia is detailed in Table 1. The altitude at which significant
effects of hypoxia occur can be lowered by a number of factors. Physical activity,
extremes of temperature, and anxiety all increase the body’s demand for oxygen and
hence its susceptibility to hypoxia. Carbon monoxide inhaled in smoking and certain
medications can also reduce the oxygen-carrying capacity of the blood and magnify the
effects of hypoxia.
Table 1 Physiological and psychological effects on humans exposed to hypoxic hypoxia Visual General Neuro-muscular
Decrease in colour perception Decrease in peripheral awareness Decrease in acuity Dimming
Euphoria Task fixation Personality changes Fuzziness (not dizziness) Amnesia Lethargy Mental confusion Sensitivity to cold or heat Cyanosis Loss of self criticism, judgement
Clumsiness Fine tremor Slurring of speech Slow movements Hypoxic 'flap'
As altitude increases, the various symptoms are accentuated and the time
required for their onset reduces. A summary of specific cognitive effects and their
trigger altitudes, as detailed by Ernsting et al. (1999), is shown in Table 2.
page 2
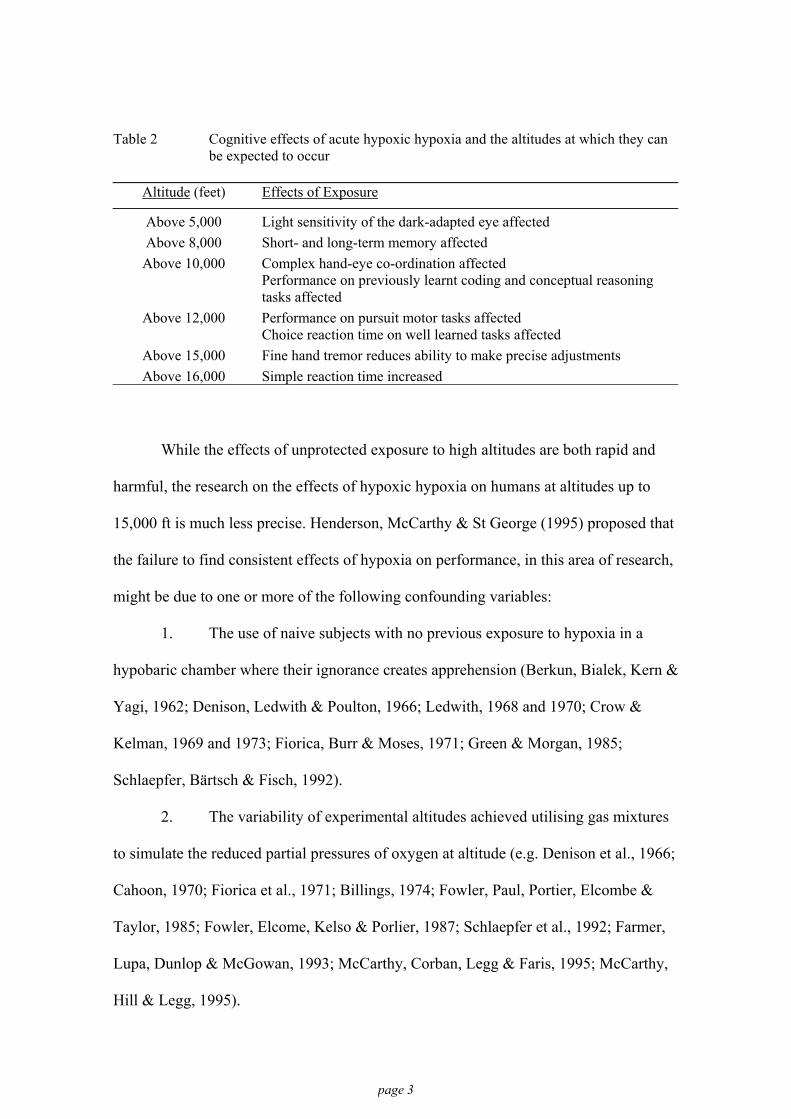
Table 2 Cognitive effects of acute hypoxic hypoxia and the altitudes at which they can be expected to occur
Altitude (feet) Effects of Exposure
Above 5,000 Above 8,000
Light sensitivity of the dark-adapted eye affected Short- and long-term memory affected
Above 10,000 Complex hand-eye co-ordination affected Performance on previously learnt coding and conceptual reasoning tasks affected
Above 12,000 Performance on pursuit motor tasks affected Choice reaction time on well learned tasks affected
Above 15,000 Above 16,000
Fine hand tremor reduces ability to make precise adjustments Simple reaction time increased
While the effects of unprotected exposure to high altitudes are both rapid and
harmful, the research on the effects of hypoxic hypoxia on humans at altitudes up to
15,000 ft is much less precise. Henderson, McCarthy & St George (1995) proposed that
the failure to find consistent effects of hypoxia on performance, in this area of research,
might be due to one or more of the following confounding variables:
1. The use of naive subjects with no previous exposure to hypoxia in a
hypobaric chamber where their ignorance creates apprehension (Berkun, Bialek, Kern &
Yagi, 1962; Denison, Ledwith & Poulton, 1966; Ledwith, 1968 and 1970; Crow &
Kelman, 1969 and 1973; Fiorica, Burr & Moses, 1971; Green & Morgan, 1985;
Schlaepfer, Bärtsch & Fisch, 1992).
2. The variability of experimental altitudes achieved utilising gas mixtures
to simulate the reduced partial pressures of oxygen at altitude (e.g. Denison et al., 1966;
Cahoon, 1970; Fiorica et al., 1971; Billings, 1974; Fowler, Paul, Portier, Elcombe &
Taylor, 1985; Fowler, Elcome, Kelso & Porlier, 1987; Schlaepfer et al., 1992; Farmer,
Lupa, Dunlop & McGowan, 1993; McCarthy, Corban, Legg & Faris, 1995; McCarthy,
Hill & Legg, 1995).
page 3
3. Individual variations in the physiological response to hypoxia. The
critical independent variable being the 'effective' altitude of the subject, as measured by
SaO2, rather than their 'nominal' altitude measured by the altimeter (Fowler et al., 1985;
Knight, Schlichting, Dougherty, Messier & Tappan, 1991; Paul & Fraser, 1994;
Cottrell, Lebovitz, Fennell & Kohn, 1995; McCarthy, Hill & Legg, 1995). In addition,
few experiments have measured individual subject SaO2.
4. The use of tasks with little relevance to those performed in the aviation
environment. Those that have used tasks such as 2D tracking and monitoring (e.g.
Figarola & Billings, 1966; Chiles, Iampietro, Higgins, Vaughan, West & Funkhouser,
1971; Collins, Mertens & Higgins, 1985) have shown conflicting results.
The aim of the present study was to determine the effects on the performance of
pilots during prolonged exposure to a partially oxygen-deficient environment (mild
hypoxic hypoxia). The specific issues identified above related to experimental designs
in previous research investigating the effect of exposure to mild hypoxia. This study
sought to manage each of these design issues by using experienced subjects, inducing
the hypoxic insult in a hypobaric chamber, using individual SaO2 levels as the
independent variable, and by incorporating a piloting task.
Measures of Dependent Variables
Two tasks were used for this study, the first being the Manikin figure task
incorporated in the Walter Reed Performance Assessment Battery, which has been used
to study the effects of sleep deprivation, circadian disrhythmia, heat stress, physical
fatigue, and hypoxia (Thorne, Genser, Sing & Hegge, 1985). The Microsoft Flight
Simulator Version 5.0 software provided the subjects with a simulated Instrument
Landing System (ILS) approach. This was the same task used by Rasmussen &
page 4

Hasbrook (1972) to investigate pilot performance on an ILS task during successive in-
flight simulated instrument approaches.
The Manikin Task
Since 1966 a number of researchers have used a Manikin figure, as shown in
Figure 1, to investigate the effects of hypoxia on cognitive performance (e.g., Denison,
et al., 1966; Fowler et al., 1985; Farmer et al, 1993; Paul & Fraser, 1994). The task was
devised by Benson and Gedye (1963) to test the ability of pilots to orientate themselves
with respect to an external visual reference system.
Figure 1 The Manikin Figure shown in the upright orientation. The border and hand-held
symbols may be either coloured or, as shown, a circle or square. The shape of the surrounding border determines which is the correct stimulus. The subjects are required to identify the hand in which the stimulus is being held.
Previous researchers have used Reaction Time (RT) as the dependent variable
and the accuracy of responding has rarely been considered. The required responses to
this task can be viewed as a signal-detection task. Signal-detection theory assumes that
the subject has two possible responses - one when the required stimulus is present and
an alternative response when the stimulus presented is not the required stimulus. There
are, therefore, four possible responses: (a) a Hit - the correct selection of the required
response when the target stimulus is present; (b) a False Alarm - an incorrect selection
of the required response in the absence of the target stimulus; (c) a Miss - the incorrect
selection of the required response in the presence of the inappropriate stimulus; and, (d)
page 5

a Correct Rejection - the correct selection of the alternative response when the stimulus
presented is not the required stimulus.
The Manikin task required the subjects to respond with the selection of Left or
Right via a computer keyboard. For this research, a ‘Hit’ was, arbitrarily, assigned as
being the correct selection of ‘Left’ when the stimulus (the target symbol) was in the
Manikin’s left hand. Consequently the correct selection of ‘Right’ was defined as a
‘Correct Rejection’. The four possible signal-detection events are shown in Figure 2.
RESPONSE
LEFT RIGHT (Press ‘V’ Key) (Press ‘M’ Key)
Target Symbol in Manikin Left Hand
Hit (H)
Miss (M)
STIMULUS Target Symbol in
Manikin Right Hand False Alarm
(FA) Correct Rejection
(CR)
Figure 2 Matrix of possible signal-detection responses to the Manikin task
The frequencies of these four events are determined by two factors: how good
the subject is at the task; and, their disposition towards a particular response. The
sensory ability of the subject and the distinctiveness of the stimulus influence the first
factor. The second factor is influenced by the rewards or penalties for responding
correctly or incorrectly, and the relative frequency of presentation of the stimulus.
Signal-detection theory separates an individual’s performance into two distinct
measures: (a) Stimulus discriminability, which is a measure of accuracy; and (b)
Response bias, which is a measure of the extent to which the subject favours one
response over another independently of the sensory evidence provided. Davison and
Tustin (1978) derived the measure of discriminability used in this research. As the
probability of the presentation of ‘left’ or ‘right’ was set at .5 in this study response bias
page 6

(log b) was not included as a dependent variable as it was not manipulated. A response-
bias free measure of discriminability (log d) is given by:
××
=FAMCRHd log5.log (1)
The Flight Simulator ILS Task
The dependent variables obtained from the Flight Simulator task all involved
measures of the subject’s ability to maintain the position of the ‘aircraft’ within vertical
altitude and heading limits at a target airspeed. The nature of the ILS task is such that it
could be expected that sinusoidal error responses would be evident. A mathematical
measure of the deviations, assuming a balanced sinusoidal flightpath was achieved,
would therefore result in the sum of the errors being zero. In similar experiments, using
data derived from aircraft tracking tasks, (Hasbrook & Rasmussen, 1971; Rasmussen &
Hasbrook, 1972) absolute values were measured for all dependent variables to provide a
model of the actual performance achieved. Chiles et al. (1971) also used absolute
measures for their dependent variables on a tracking task. As a result, absolute values
were also measured for all dependent variables obtained on the Flight Simulator ILS
task in this experiment.
METHOD
Subjects
Eight volunteer subjects were drawn from amongst Royal New Zealand Air
Force (RNZAF) pilots as they were familiar with the hypobaric chamber, had been
exposed to hypoxia indoctrination training in the chamber, were trained to recognize the
dangers of hypoxia, and were all experienced with exposure to prolonged mild hypoxia.
The subjects were required to be physically fit, non-smokers, not on medication, and
page 7

were required to abstain from alcohol for 48 hours prior to each experiment and to
report any abnormal sleep patterns.
Apparatus
The hypoxic condition was induced by exposing the subjects to reduced
atmospheric pressure in the hypobaric chamber at the RNZAF Auckland Aviation
Medicine Unit facility. This procedure ensured that the subjects were physically
exposed to the combination of reduced atmospheric pressure and hypoxia, and avoided
the restrictions associated with the use of masks for breathing. The pressure demand
oxygen system fitted to the chamber was isolated from the external supply to minimize
the risk of free oxygen leaking into the chamber. Four roof-mounted fans provided
ventilation of the main compartment.
The Walter Reed Manikin program ran on an IBM compatible DSE 386 25 MHz
processor with a 35 cm SVGA monitor. An Adventech PCL-830 timer card was added
to the computer to provide the timing accuracy required for the software package.
The ILS task was proprietary Microsoft Version 5.0 Flight Simulator software.
The software was installed on an IBM compatible 486 DX2 66 MHz computer and the
imagery displayed on a Phillips 50 cm monitor. Control inputs for the aircraft were
provided through a proprietary Flightmaster control device comprising a yoke-style
control column, rudder pedals, a rotary elevator trim switch, and a single lever throttle.
The flight profile and aircraft configuration of each approach was recorded using the
Microsoft video record software option for subsequent analysis.
A Nellcor N-200E Pulse Oximeter, using a ten to fifteen second averaging time,
was used to provide non-invasive and continuous measures of functional oxygen
saturation of arterial haemoglobin. The Nellcor D2-25 adult oxygen adhesive transducer
sensor was attached to the little finger on the subject’s non-preferred hand and was
protected from external illumination by multiple layers of black stocking material.
page 8

The researcher was protected from hypoxia by the use of the Mountain High
Equipment and Supply Company Model A-1 analogue computer electronic oxygen
delivery system. This system provided a pre-determined bolus of oxygen with each
breath and minimized the possibility of a subject being exposed to oxygen-enriched air
because of the proximity of the researcher at any time during the experiment.
The composition of the free chamber air was assessed using a Datex Oscaroxy
SCO-123 monitor. The sampling line was positioned above the computer workstations.
The chamber ventilation fans were operated as necessary, during periods when subjects
were not engaged in a task, to maintain the chamber temperature between 200C and
220C.
Procedure
Training was conducted in the hypobaric chamber and was completed on the day
immediately prior to the first day of experiments for each subject.
The subjects were exposed to five experimental conditions at chamber altitudes
of 500 ft (Control condition), 6,000 ft, 8,000 ft, 10,000 ft and 14,000 ft. Fifteen minutes
was provided for the ascent followed by fifteen minutes rest after the altitude had been
established to allow for physiological accommodation prior to the presentation for any
tasks. The 14,000 ft condition was used primarily to provide SaO2 data prior to a
descent to the 10,000 ft condition. The subjects were not aware of the actual chamber
altitude.
A repeated measures design was used with subjects serving as their own
controls. The sequence in which the tasks were presented was repeated every two hours.
Three blocks of tasks were completed in the Control, 6,000 ft and 8,000 ft conditions,
and two blocks of tasks in the 10,000 ft condition.
SaO2 levels for each subject were monitored to enable individual responses to
the hypoxic insult to be assessed. Arterial blood samples were taken while the subjects
page 9

were stable at a chamber altitude of 10,000 ft to provide a baseline physiological
measure of 'effective' altitude to be determined relative to the 'nominal' altitude of the
hypobaric chamber.
The potential effects of fatigue were reduced; the chamber was quiet and
vibration free, the experimental conditions were completed between the hours of 8 am
and 5 pm and subjects completed no more than three experimental conditions on
consecutive days.
The Manikin Task
The Manikin task was presented on a computer screen with a figure inside either
a green or red square, and holding a green or red square in either the left or right hand.
The figure was randomly presented in one of four orientations: front-on upright or
inverted, and rear-view upright or inverted. The subjects were instructed to respond as
quickly and as accurately as possible. The subject initiated the commencement of each
block of 264 trials. After each response the screen was blanked for 300 msecs and then
the next figure was presented.
Subjects were given immediate feedback after each trial with the word ‘Correct’
or ‘Error’ being displayed on the screen as appropriate and were provided with an on-
screen display at the completion of each block showing the number of trials of the task
that had been completed, the percent correct and the mean RT. The dependent variables
recorded for the Manikin task were the RT for all responses and the value for log d
(accuracy), computed in accordance with Equation 1.
The Flight Simulator ILS Task
The Flight Simulator instrument landing task was based on the Instrument
Landing System (ILS) approach on runway 28 Left at San Franciso using the Learjet 35
aircraft. The subjects were given control of the aircraft in stable flight at an altitude of
3,000 ft, 20 nautical miles from the runway, with the autopilot engaged. The approach
page 10

was conducted with no external imagery visible through the aircraft ‘windscreen’. The
subjects were required to fly the approach accurately down to the minimum published
altitude for the ILS approach of 200 ft above ground level. At this point the subjects
were required to pause the program, not land the aircraft.
Control of the aircraft configuration was through the keyboard with the
appropriate keys acting as toggle switches. Labels placed on the keys identified the
control function of each key.
The dependent variables recorded for the ILS task were aircraft altitude,
heading, vertical speed, and indicated airspeed. The value for each dependent variable
was extracted at 0.1 DME intervals from 15 DME to the point at which the simulator
was put on hold.
RESULTS
Physiological Measures
A Pearson product-moment correlation was conducted on the arterial blood data.
The arterial blood samples showed a significant correlation with the digit oximeter
readings (r (4) = .954, p < .05). The manual readings and oximeter readings were also
significantly correlated (r (4) = .970, p < .05). These correlations provided confidence
that the values of SaO2 obtained during this study were valid. Arterial blood samples
were only obtained from four subjects due to the other subjects experiencing
physiological problems during the blood extraction, including one who fainted.
Individual effective altitudes, as defined by the SaO2 levels, varied considerably
from the nominal chamber altitude. For example, at the 14,000 ft nominal chamber
altitude, the effective physiological altitude of subject 3 was about 17,000 ft and that of
subject 6 about 12,000 ft, but a one-way ANOVA test, to consider between-subject
differences, was not significant (F = 0.811, MSE = 18.16). A non-parametric trend test
page 11
(Kendall, 1955) showed that the SaO2 levels decreased significantly as the nominal
altitude of the chamber was increased (n = 8, k = 5, z = 6.41; p < .01).
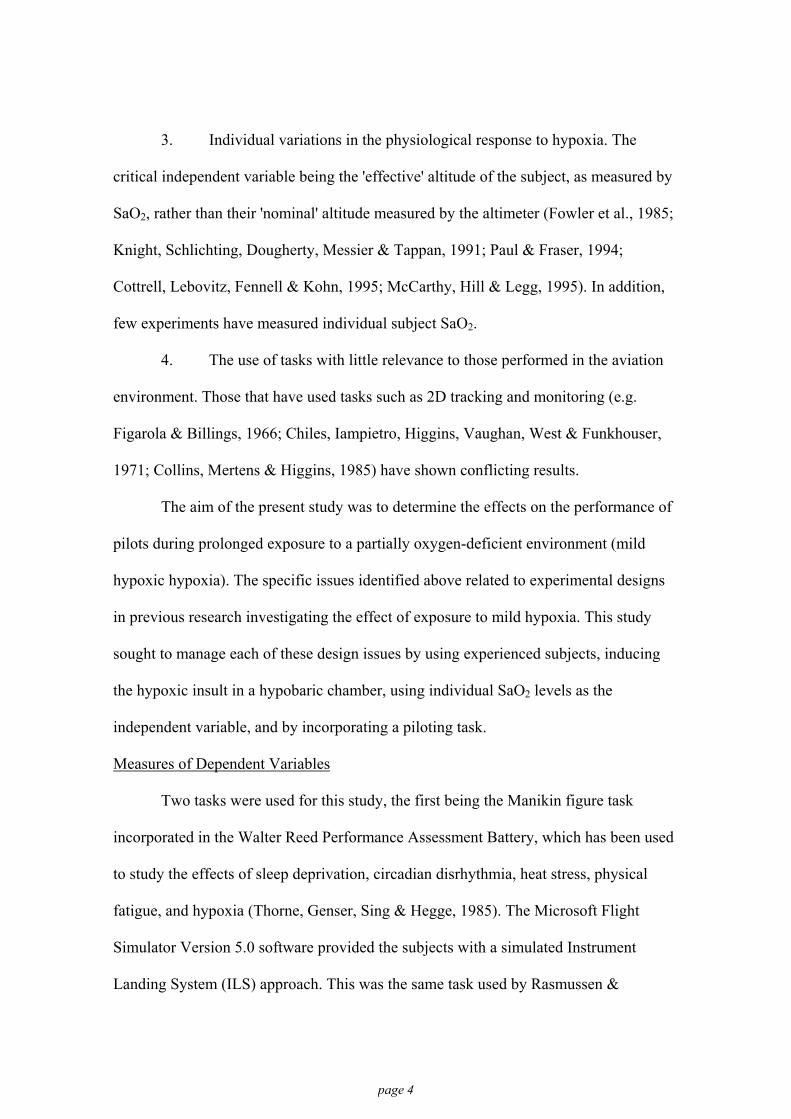
In addition, a significant Pearson product-moment correlation was found
between the SaO2 after the chamber had been stable at altitude for 10 minutes and the
SaO2 during the first experimental task (r (30) = .946, p < .01). This provided evidence
that the subjects were physiologically stable prior to testing commencing. The SaO2
values, for each subject at each nominal altitude are shown in Figure 3.
Chamber Altitude (feet)
Sea Level 6,000 8,000 10,000 14,000
Blo
od O
xyge
n S
atur
atio
n (S
aO2)
60
65
70
75
80
85
90
95
100
Subject 1Subject 2Subject 3Subject 4Subject 5Subject 6Subject 7Subject 8
Figure 3 Individual mean blood oxygen saturations as a function of chamber altitude
Measures of Dependent Variables
Pearson product-moment correlations were conducted to investigate the effect of
SaO2 on performance. The data from four conditions; Control, 6,000 ft, 8,000 ft, and
10,000 ft, was included in these analyses. The Pearson product-moment correlation
page 12

yielded a significant correlation between SaO2 and accuracy (log d) on the Manikin task
(r (32) = .465, p < .01) as shown in Figure 4. Reaction Time was not significantly
correlated with SaO2 (r (32) = .274, p > .05), and so is not plotted.
Blood Oxygen Saturation (SaO2)
90 92 94 96 98 100
Man
ikin
Acc
urac
y (lo
g d )
1.00
1.25
1.50
1.75
2.00
2.25Subject 1Subject 2Subject 3Subject 4Subject 5Subject 6Subject 7Subject 8
Figure 4 Accuracy (log d) for individual subjects and the correlation between subjects, as
a function of blood oxygen saturation
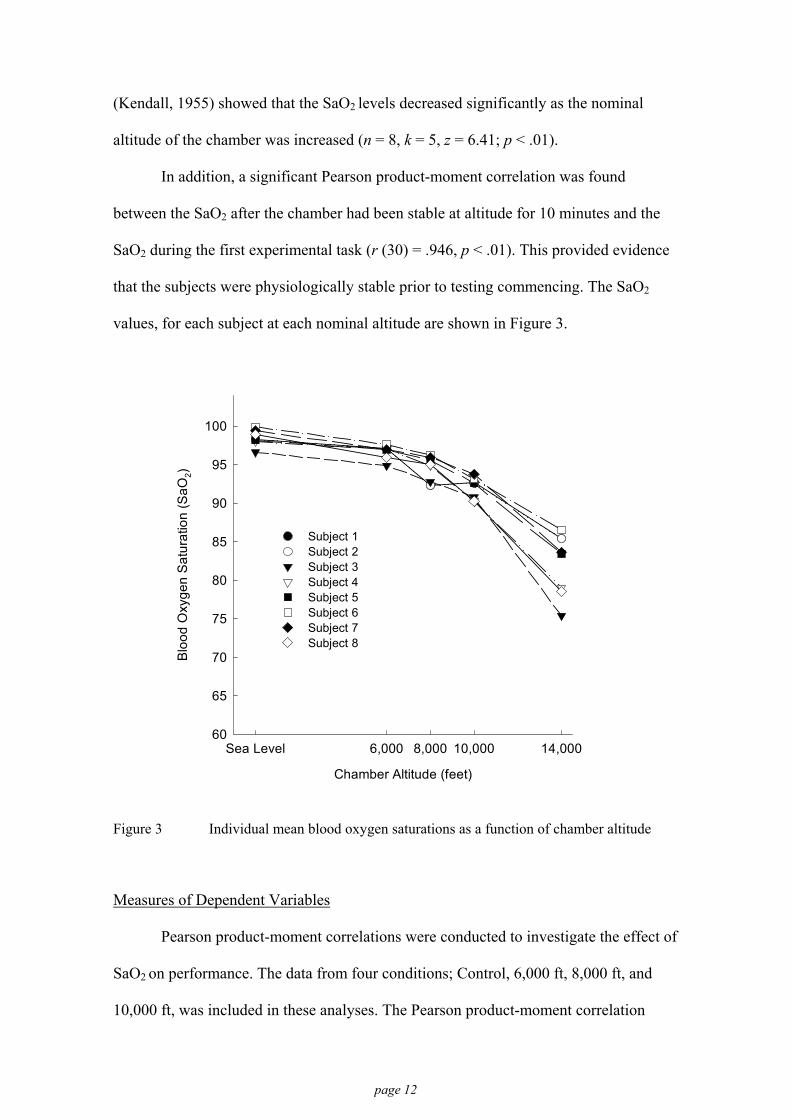
The grouped results for the Flight Simulator ILS task dependent variables, by
experimental condition, are provided in Table 3. There were no significant correlations
between SaO2 and the Flight Simulator ILS task dependent variables.
page 13
Table 3 Group means and standard deviations for Flight Simulator ILS task as a function of the experimental condition
Condition
Dependent Variables Control n = 9
6,000-ft n = 9
8,000-ft n = 9
10,000-ft n = 6
Altitude (ft) M 83.70 85.88 88.14 80.65 SD 45.15 43.97 62.56 39.26
Heading (o) M 1.10 1.22 1.08 1.14 SD 0.47 0.72 0.46 0.46
Vertical Speed (ft/min) M 330.32 365.80 336.18 325.31 SD 134.62 139.44 122.65 99.49
Air Speed (knots) M 7.13 8.49 6.53 7.31 SD 8.04 8.05 8.87 7.59
Environmental Factors
The measured percentage of oxygen in the chamber air remained at 21%. The
mean overall temperature in the main compartment of the hypobaric chamber was
21.6oC with a SD of 1.22oC. The mean temperature gradually increased during each
experimental condition, rising by an average of 2.5oC over the period.
DISCUSSION Physiological Responses
The digit transducer sensors and NELLCOR N200-E pulse oximeter equipment
provided accurate predictions of the level of SaO2 at a chamber altitude of 10,000 ft
when compared to the values of saturation obtained from the analysis of arterial blood
samples. The significant correlation of oximeter and arterial blood SaO2, at 10,000 ft,
made it reasonable to assume that the oximeter values obtained throughout each
experimental condition were valid.
The subjects were drawn from military aircrew and all had experience of acute
hypoxic symptoms during their RNZAF training while being exposed to known
page 14
altitudes of 20,000 ft and 25,000 ft. The use of experienced and knowledgeable subjects
avoided the difficulties identified by previous researchers regarding naive subjects
possibly experiencing apprehension and anxiety while in the hypobaric chamber. There
was no overt evidence that the subjects were apprehensive or anxious in the hypobaric
chamber during testing. The stability of the blood oxygen saturations prior to the
commencement of testing supports the contention that the subjects were not
apprehensive.
The initiation of the exposure to hypoxic hypoxia through the use of a hypobaric
chamber avoided the difficulties identified by Colrain (1988) and Ernsting et al. (1999)
regarding the breathing difficulties induced by the use of masks. The use of a hypobaric
chamber to induce the hypoxic insult also ensured that the subjects were physiologically
immersed in the reduced atmospheric pressure and exposed to an identical environment.
The range of saturations obtained in each condition (Figure 3) show similar
results to those obtained by McCarthy, Corban, Legg & Faris (1995), McCarthy, Hill &
Legg (1995) and documented by Cottrell et al. (1995). This variability in individual
response leads further evidence to the fact that the “effective altitude”, proposed by
Fowler et al. (1987), and as measured by the level of saturation, may be more relevant
to the effect of the hypoxic insult on individual performance than the actual
environmental altitude.
The variation in individual SaO2 responses lends evidence to concerns raised in
regarding the actual altitudes achieved in previous research where measured values of
SaO2 differed from the intended test altitude. Between-subjects differences in blood
oxygen saturation were, however, not significant, and the non-parametric trend test
showed that the SaO2 values decreased with increasing altitude.
page 15
Measures of Dependent Variables
Accuracy on the Manikin task (measured by the discriminability function log d)
reduced with decreasing blood oxygen saturation as shown in Figure 4. This figure also
shows the individual variability of responses but the significant relationship between
SaO2 and accuracy is evident. This suggests, as a result of the significant tendency for
SaO2 values to decrease with increasing altitude, that accuracy on the Manikin task
would also decrease if measured against altitude. However, as the intention of this study
was to consider SaO2 as an independent variable, the relationship of accuracy and
nominal chamber altitude was not explored.
The resulting decreased accuracy with decreased blood oxygen saturation, with
no change in RT, adds to the body of conflicting literature regarding the effects of mild
hypoxia at intermediate altitudes. The reduced accuracy supports the findings of
Denison et al. (1966) and McCarthy, Corban, Legg & Faris (1995).
The lack of any detectable change in performance, over blood oxygen saturation,
on the Flight Simulator dependent variables is consistent with the findings of Collins et
al. (1985) who reported no effect of altitude on a tracking task performed at 12,500 ft.
In contrast Chiles et al. (1971) reported increased errors on a tracking task at 14,000 ft
when combined with an arithmetic task. However, direct comparisons with these studies
must be treated with some caution as SaO2 values were not measured for the subjects in
these studies.
The dependent variables on the Flight Simulator ILS task were, effectively, all
measures of accuracy. The more accurately the subject managed the simulated approach
the smaller the deviations one would expect to observe for each of the dependent
variables. The absence of any effect of the hypoxic conditions on accuracy on the ILS
task contrasts with the significant reduction in accuracy on the Manikin task with
page 16

decreasing blood oxygen saturation. This raises the question as to the exact cognitive
requirements of the ILS task compared to the Manikin task.
The management of an aircraft flying an instrument approach falls into the
category of a skill-based behaviour (Rasmussen, 1983). Performance is governed by
stored patterns of pre-programmed instructions. In this case, for example, if the aircraft
is above the glideslope then well-practiced control inputs are made to pitch the nose of
the aircraft down to increase the rate of descent and return to the glideslope.
The task of managing the flight path of the flight simulator aircraft requires
spatial orientation and judgement. The accurate performance of this task requires
concentration and practice. The subjects were familiar with the task from their flying
training and it is suggested that the required elements of the task, especially the
assessment of the subtle changes of control required to manage the flight path, were
being performed at the skill level. The results of this research suggest that behaviour, at
the skill-based level, is not affected by exposure to hypoxic conditions resulting in
decreased SaO2 values in the order of 90 – 94%. This is consistent with the results
reported by Collins et al. (1985) and Rasmussen & Hasbrook (1972), when the only task
that was being performed was a tracking task.
Rasmussen (1983) also proposed the category of rule-based behaviour where
the solutions to familiar problems are governed by stored rules of the type “if (state)
then (action)”. Errors at this level are typically associated with the misclassification of
situations or stimuli leading to the application of the wrong rule as a response. This
follows signal-detection theory rationale where the selection of a response requires a
decision as to the presence or absence of a stimulus. It is suggested that the Manikin
task, requiring the correct recognition of spatial orientation and the matching of the
stimulus shape to the Manikin’s hand, to enable a correct response, could be described
as a rule-based task. Accuracy on the Manikin task, by comparison to the Flight
page 17

Simulator ILS task, was more sensitive to the effects of blood oxygen saturation. The
results from this study suggest, therefore, that tasks requiring rule-based behaviour,
such as the Manikin, are more appropriate for the investigation of the subtle effects of
hypoxia on cognitive performance in the aviation environment.
Rasmussen (1983) also proposed a third level of behaviour – knowledge-based
behaviour where conscious analytical processes must be used, in conjunction with
stored knowledge, to solve novel situations. It is suggested that the Manikin task does
not require this level of cognitive functioning.
Performance on the dependent variables was unlikely to have been affected by
environmental factors. There was no evidence of any increased percentage of oxygen in
the chamber and the temperature of the chamber environment was appropriate for the
type of tasks being completed. Industry standards vary, but Bell (1974) notes that, in the
United States, optimal temperatures for workers undertaking light work lie within the
range 20oC to 22oC, while in the United Kingdom an air temperature of 19.5oC to 20oC
is suggested as suitable for clerical workers.
Implications for Gliding
The finding that a skill-based task, the simulation of an instrument landing task,
is not affected by exposure to acute mild hypoxia producing SaO2 saturations generally
equivalent to an altitude of 10,000 ft, suggests that the existing requirement that
supplementary oxygen be used above 10,000 ft may be appropriate for the basic tasks of
flying a glider. However, the demands of competitive flying require that constant
decision-making also occur (Moffat, 1974). These decisions will involve the application
of rule-based behaviours and even knowledge-based behaviours.
Consequently, the requirement to ensure that glider pilots are functioning at a
sufficiently competent level must be based on their ability to perform rule-based and
knowledge-based decision making. When the implication for decision making is
page 18
combined with the now, well documented, variability in individual response to a
hypoxic insult, the results of this study suggest that competitive glider pilots should
consider using supplementary oxygen at altitudes significantly below 10,000 ft in order
to maintain a high level of blood oxygen saturation to improve their rule- and
knowledge-based decision making abilities.
page 19

REFERENCES
Bell, C.R. (1974). Men at Work. London: George Allen and Unwin. Benson, A.J., & Gedye, J.L. (1963). Logical processes in the resolution of orientational
conflict. RAF Institute of Aviation Medicine, Report No. 259. London: Ministry of Defence.
Berkun, M.M., Bialek, H.L., Kern, R.P. & Yagi K. (1962). Experimental studies of
psychological stress in man. Psychological Monographs: General and Applied, 16(15), Whole No. 534.
Billings, C.E. (1974). Evaluation of performance using the Gedye task. Aerospace
Medicine, 45(2), 128-131. Cahoon, R.L., (1970). Vigilance performance under hypoxia. Journal of Applied
Psychology, 54(6), 479-483. Chiles, W.D., Iampietro, P.F., Higgins, E.A., Vaughan, J.A., West, G., & Funkhouser,
G.E. (1971). Combined effects of altitude and high temperature on complex performance. (FAA-AM-71-17). Washington, DC: U.S. Office of Aviation Medicine.
Collins, W.E., Mertens, H.W. & Higgins, E.A. (1985). Some effects of alcohol and
simulated altitude on complex performance scores and breathalyzer readings. (FAA-AM-85-5). Washington, DC: U.S. Office of Aviation Medicine.
Colrain, I.M. (1988). Ventilation during sleep onset. Unpublished doctoral thesis,
University of Tasmania, Hobart, Australia. Cottrell, J.J., Lebovitz, B.L., Fennell, R.G. & Kohn, G.M. (1995). Inflight arterial
saturation: continuous monitoring by pulse oximetry. Aviation, Space, and Environmental Medicine, 66, 126-130.
Crow, T.J., & Kelman, G.R. (1969). Psychological effects of mild hypoxia. Proceedings
of the Psychological Society, Jun, 24-5. Crow, T.J., & Kelman, G.R. (1973). Psychological effects of mild hypoxia. British
Journal of Anaesthesia, 45, 335-337. Davison, M.C. & Tustin, R.D. (1978). The relation between the generalized matching
law and signal-detection theory. Journal of Experimental Analysis of Behaviour, 29, 331-336.
Denison, D.M., Ledwith, F. & Poulton, E.C. (1966). Complex reaction times at
simulated cabin altitudes of 5,000 Feet and 8,000 Feet. Aerospace Medicine, 37(10), 1010-1013.
Ernsting, J., Nicholson, A., & Rainford. D. (Eds.). (1999). Aviation Medicine (3rd Ed).
London: Butterworths.
page 20

Farmer, E.W., Lupa, H.T., Dunlop, F. & McGowan, F.F. (1993). Task learning under
mild hypoxia. Unpublished IAM Farnborough Report. Figarola, T.R. & Billings, C.E. (1966). Effects of meprobamate and hypoxia on
psychomotor performance. Aerospace Medicine, 34, 951-954. Fiorica, V., Burr, M.J. & Moses, R. (1971). Effects of low-grade hypoxia on
performance in a vigilance situation. (FAA-AM-71-11). Washington, DC: U.S. Office of Aviation Medicine.
Fowler, B., Elcome, D.D., Kelso, B. & Porlier G. (1987). The threshold for hypoxia
effects on perceptual-motor performance. Human Factors, 29(1), 61-66. Fowler, B., Paul, M., Porlier, G., Elcombe, D.D., & Taylor. M. (1985). A re-evaluation
of the minimum altitude at which hypoxia performance decrements can be detected. Ergonomics, 28(5), 781-791.
Green, R.G. & Morgan, D.R. (1985). The effects of mild hypoxia on a logical reasoning
task. Aviation, Space, and Environmental Medicine, 56, 1004-1008. Hasbrook, A.H., & Rasmussen, P.G. (1971). Aural glide slope cues: Their effect on
pilot performance during in-flight simulated ILS instrument approaches. (FAA-AM-71-24). Washington, DC: U.S. Office of Aviation Medicine.
Henderson, R., McCarthy, D. & St George, R. (1995). Pilots, performance and hypoxia.
A review of some research into the effects of mild hypoxic hypoxia. In R. Fuller, N. Johnston & N. McDonald (Eds.). Human factors in aviation operations. (pp 223-228). Aldershot: Ashgate Publishing.
Kendall, M.G. (1955). Rank Correlation Methods. London: Charles Griffin. Knight, D.R., Schlichting, C., Dougherty, J.H., Messier, A.A., & Tappan, D.V. (1991).
Effect of hypoxia on psychomotor performance during graded exercise. Aviation, Space, and Environmental Medicine, 62, 228-232.
Ledwith, F. (1968). The effects of hypoxia on an information-reduction task in humans.
Psychonomic Science, 12(1), 29-30. Ledwith, F. (1970). The effects of hypoxia on choice reaction time and movement time.
Ergonomics, 13, 465-482. McCarthy, D., Corban, R., Legg, S. & Faris, J. (1995). Effects of mild hypoxia on
perceptual-motor performance: a signal-detection approach. Ergonomics, 38(10), 1979-1992.
McCarthy, D., Hill, P., & Legg, S. (1995). Behavioural detection theory as a descriptor
of sustained attention under conditions of mild hypoxia. Unpublished manuscript, University of Auckland.
Moffat, G. (1974). Winning on the wind. Los Altos, California: The Soaring Press.
page 21

page 22
Mountain High Equipment and Supply Company. Operation and Owners Manual for the EDS Model A-1.
Paul, M.A. & Fraser, W.D. (1994). Performance during mild acute hypoxia. Aviation,
Space, and Environmental Medicine, 65, 891-899. Rasmussen, J. (1983). Skills, rules, knowledge: signals, signs and symbols and other
distinctions in human performance models. IEEE Transactions: Systems, Man & Cybernetics, SMC-13, 257-267.
Rasmussen, P.G., & Hasbrook, A.H. (1972). Pilot tracking performance during
successive in-flight simulated instrument approaches. (FAA-AM-72-9). Washington, DC: U.S. Office of Aviation Medicine.
Schlaepfer, T.E., Bärtsch, P., & Fisch, H.U. (1992). Paradoxical Effects of Mild
Hypoxia and Moderate Altitude on Human Visual Perception. Clinical Science, 83, 633-636.
Thorne, D.R., Genser, S.G., Sing, H.C. & Hegge, F.W. (1985). The Walter Reed
performance assessment battery. Neurobehavioural Toxicology and Teratology, 7(4), 415-418.