Embed Size (px)
Citation preview
www.liser.lu
WORKING PAPERS
Exposure, participation in human resource management practices and employee attitudes
Laetitia HAURET 1
Ludivine MARTIN 1, 2
Nessrine OMRANI 3
Donald R. WILLIAMS 4, 1
1 LISER, Luxembourg2 CREM UMR CNRS 6211, France3 Paris School of Business, France4 Kent State University, USA
n° 2016-16 November 2016

LISER Working Papers are intended to make research findings available and stimulate comments and discussion. They have been approved for circulation but are to be considered preliminary. They have not been edited and have not
been subject to any peer review.
The views expressed in this paper are those of the author(s) and do not necessarily reflect views of LISER. Errors and omissions are the sole responsibility of the author(s).
1
Exposure, participation in human resource management
practices and employee attitudes1
Laetitia Hauret (LISER, Luxembourg Institute of Socio-Economic Research)2
Ludivine Martin (LISER, Luxembourg Institute of Socio-Economic Research & CREM UMR CNRS 6211)3
Nessrine Omrani
(PSB, Paris School of Business)4
Donald R. Williams
(Kent State University & LISER)5
Version of September 2016
Abstract: Existing evidence on Human Resource Management (HRM) strategy has been
limited to separate analyses of the relationship between exposure to or participation in HRM
and employee attitudes which affect overall firm performance. This paper is the first to integrate
the two perspectives in a single analysis. Using employer-employee matched data with both
exposure and participation measures, we find that a high exposure to HRM is not sufficient to
improve employee attitudes when the level of employee participation in HRM is taken into
account. Furthermore, based on a Blinder-Oaxaca decomposition, the results suggest that
employee involvement in HRM practices affects the value employees place on their personal,
occupational and workplace characteristics.
Keywords: Job satisfaction; commitment; Human Resources Management; exposure;
participation; employee
JEL Codes: J28; M12; M5; R23
1 This research is part of the TWAIN project supported by the National Research Fund, Luxembourg (contract
FNR/C11/LM/1196209) and by core funding for LISER (formerly CEPS/INSTEAD) from the Ministry of Higher
Education and Research of Luxembourg. 2 LISER - Luxembourg Institute of Socio-Economic Research, 11 Porte des sciences, L-4366 Esch-sur-Alzette –
Luxembourg. Tel.: +352 58 58 55 515 ; E-mail: [email protected] 3 LISER – Luxembourg Institute of Socio-Economic Research, 11 Porte des sciences, L-4366 Esch-sur-Alzette –
Luxembourg ; CREM, Faculté des Sciences Economiques, 7, Place Hoche, 35065 Rennes Cedex – France. Tel.:
+352 58 58 55 631; Fax: +352 58 58 55 700 ; E-mail: [email protected] – corresponding author. 4 PSB - Paris School of Business, 59 rue Nationale, 75013 Paris – France. Tel: +33 1 53 36 44 22 ; E-mail:
[email protected] 5 Kent State University, Department of Economics, 475 Terrace Drive, Kent, Ohio 44242 – United States. Tel: +
1 330 672 2366; E-mail: [email protected]
2
1 Introduction
In recent years, various scholars find that HRM practices enhance firm performance across
sectors, sample characteristics, HRM practices studied, and firm performance measures
(Huselid 1995; MacDuffie 1995; Ichniowski, Shaw and Prennushi 1997; Ramsay, Scholarios
and Harley 2000; Cappelli and Neumark 2001; Bryson, Forth and Kirby 2005; Becker and
Huselid 2006; Bloom and Van Reenen 2011; Wu, Hoque, Bacon and Bou Llusar 2015). The
assumed underlying process starts with the HRM system and flows through the resulting
increase of workforce skills, knowledge, empowerment, the strengthening of employee job
satisfaction and commitment, to firm performance (Combs, Liu, Hall and Ketchen 2006; Macky
and Boxall 2007).
To assess this underlying process, the literature focuses on the linkages between HRM practices
and employee attitudes such as job satisfaction, organizational commitment or motivation.
Previous research takes two perspectives. On the one hand, studies follow the organizational
perspective and directly examine the exposure of employees to the HRM strategy (Ramsay et
al. 2000; Wood and De Menezes 2011; White and Bryson 2013). The measure of exposure is
based on managers’ reports about the presence of HRM practices in the organization; for
example, meeting between management and the staff. The evidence mainly points out that the
exposure to HRM is positively related to employees attitudes. On the other hand, another strand
of literature focuses on the employee perspective. From this perspective, the participation or
involvement of employees in HRM practices is investigated (Guest 1999, 2002; Gallie, Felstead
and Green 2001; Godard 2001, 2010; Macky and Boxall 2007; Kalmi and Kauhanen 2008;
Mohr and Zoghi 2008; Böckerman, Bryson and Ilmakunnas 2012; Martin 2016). The measure
of employee participation is obtained from employees who report their personal experience
about, for example quality circles, or for some practices such as meeting between management
and the staff, their assessment of the usefulness of the practices in their current job. These
studies support a positive linkage between employees participation in HRM and their attitudes.
This paper is the first to integrate the both perspectives in a single analysis by examining the
relationships between exposure to HRM and participation in HRM with employee attitudes
jointly. In particular, we seek to identify the extent to which the provision of HRM practices at
the firm level, independent of the level of employee participation, can affect employee attitudes.
To examine this research question, we use recent employer-employee data collected in a small,
open European country characterized by the predominance of its service sector, namely
Luxembourg. The dataset constitutes a representative sample of employees of the private sector
3
working in workplaces of at least 15 employees. Due to the specificity of the Luxembourgish
labor market characterized by a large proportion of foreign employees, the results apply not
only to Luxembourgish employees but also French, Belgian, German, Portuguese and
employees of other nationalities.
This paper contributes to the literature in several ways. First, using more recent data than those
found in the existing empirical literature, we address the question of whether the link between
HRM practices and employee attitudes is still relevant. Second, we investigate the relationships
between the HRM strategy of the firm and employee attitudes using both the exposure and the
participation perspectives made possible by the use of matched employer-employee data. The
two attitudes examined are job satisfaction and organizational commitment. These are two
facets of overall job attitudes that are key mediating variables between the HRM strategy and
organizational performance (Harrison, Newman and Roth 2006). Third, we deepen the
examination of differences in employee attitudes, using the Oaxaca-Blinder decomposition
method, by comparing groups who face different levels of HRM exposure and who have
different levels of HRM participation. More precisely, we identify how much of the difference
in employee attitudes between groups is due to the fact that (i) they have different characteristics
(personal, occupational and workplace) or (ii) they value job characteristics differently. The
exposure and the participation in HRM can indeed modify the way that employees react to their
work environment.
The results support integrating both the organizational and employee perspectives in the
analysis of employee attitudes. The results indicate that a high level of exposure to HRM
practices is not sufficient to improve employee attitudes when the level of employee
participation in HRM is taken into account. Moreover, our results show that the extent of
employees involvement in HRM practices affect the way they value their personal, occupational
and workplace characteristics.
The paper proceeds as follows. Section 2 defines concepts, reviews the existing literature and
develops hypotheses. Section 3 describes the data, the variables and the estimation strategy.
Section 4 presents and discusses the results. Section 5 concludes.

4
2 Concepts and existing evidence
2.1 The HRM concept
The HRM strategy is a way for managers to convince employees that their work values and
their contribution to the firm performance is recognized (Osterman 2000; Kalmi and Kauhanen
2008). By increasing employees’ skills and knowledge, empowering employees to make
decisions, strengthening positive employee attitudes, the HRM strategy contributes to firm-
level performance.
The scope of HRM practices adopted by employers to improve economic performance does not
receive either a common terminology6 or a common view on the practices that are covered. The
HRM domains used in the literature mostly cover participation in the organizational life,
working in teams, development, job security, family-friendly practices, incentives and
selection.
HRM practices designed to strengthen employee participation in the organizational life are
practices through which employees can make their voice heard regarding their working
conditions and/or the organization of the firm and actively contribute to modify them (e.g.
McGovern, Hill, Mills and White 2007). They take the form of meetings organized between
managers and the staff, the involvement of employees in changes affecting the firm, the
collection of attitude surveys to measure the employee point of view on the current working
conditions and work climate, and to obtain employee participation in concrete changes through
quality circles or problem-solving groups. In return to the implementation of these HRM
practices, employers expect to improve employee attitudes.
Working in a team is an HRM practice that is assumed to be a method for managers to obtain
positive reactions of employees (e.g. Gallie, Zhou, Felstead and Green 2012). In most existing
analyses, team work is found to play a major role in the relationship between the HRM strategy
and economic performance. Team co-workers can share at least part of the responsibilities from
decision-making and give more discretion to employees. Job rotation also permits employees
to learn new skills and knowledge to carry out other tasks. It thus increases variability, enriches
the work of employees and gives more flexibility for managers to cover for employee absences.
6 High-Performance Work Practices - HPWP, Alternative Work Practices - AWP, Innovative Work Practices -
IWP, High-Involvement Management - HIM, etc.
5
HRM practices dedicated to employees development are also included in the HRM strategy to
increase workforce skills and implemented through training and appraisals (e.g. Boxall and
Macky 2009). Moreover, skill development is necessary for firms that want to increase the
involvement of employees in work decision-making. Appraisals allow managers to take time
to discuss with each employee on individual work, give feedback and propose further training
if needed. The appraisal can also be used to define appropriate rewards included in the incentive
domain.
Practices improving job security to employees help build a stable environment in which
employees can develop their skills (e.g. Ramsay et al. 2000). These HRM practices take the
form of no-compulsory redundancies policies and procedures for airing grievances.
Family-friendly practices included in the HRM strategy aim to support family roles, reduce
work-family conflicts and may be beneficial for employees (e.g. Ernst Kossek and Ozeki 1998).
In this vein, employers can provide flexible work-time schemes and financial support to sustain
family life.
In the incentive domain, individual pay incentives and fringe benefits are studied. Pay incentive
is a traditional personnel management practice to reward performance. Non-monetary benefits
are part of modern compensation packages. Employers resort to those benefits due to scale
economies to acquire the goods, it is a sorting tool to retain key employees, and it provides
status and identity sharing of a job or position (e.g. Eriksson and Kristensen 2014).
Selection of employees in the recruitment process and the monitoring of this process to ensure
no discrimination by gender, ethnic background, disability, age are also included in the scope
of HRM by some scholars (e.g. Combs et al. 2006; Wu et al. 2015). Through the use of
sophisticated tests on personality/attitude and performance/competency, employers screen job
applicants with equal opportunities. This selection process allows employers to bring external
knowledge, skills, and abilities into the organization and hire applicants that appear they will
be productive employees.
Most scholars emphasize that HRM practices need to be adopted together to strengthen the
positive relationship with firm economic performance (Wood 1999; Bowen and Ostroff 2004;
Godard 2004; Combs et al. 2006). This concept is termed ‘bundle’ since the works of Huselid
(1995) and MacDuffie (1995). The hypothesis is that the greater the number of HRM practices,
the greater the positive results obtained by firms.
6
2.2 Job attitudes
We focus on those attitudes that jointly form the “overall job attitudes” defined by Harrison et
al. (2006). Based on a wide range of previous evidence, they conclude that job satisfaction and
organizational commitment are the key mediating variables between the HRM strategy and firm
performance. Job satisfaction focuses on one’s position and organizational commitment on the
entire organization and adequacy of values. More specifically, job satisfaction is an “emotional
state resulting from the evaluation or appraisal of one’s job experience” (Harrison et al., 2006,
p.306). Organizational commitment is also an emotional state covering the “feeling of sharing
beliefs and values with one’s entire organization” (Harrison et al., 2006, p.306).
2.3 Existing research on HRM and overall job attitude measures7
Two perspectives, “organizational” and “employee”, are presented in the literature. In the
organizational perspective, scholars focus on the exposure of employees to the HRM strategy
adopted in the firm. Most of these studies analyze directly the link between HRM employee
exposure and firm performance without taking into account explicitly the reaction of employees
to these practices (Huselid 1995; MacDuffie 1995; Ichniowski et al. 1997; Ramsay et al. 2000;
Cappelli and Neumark 2001; Bryson et al. 2005; Wu et al. 2015).
Nonetheless, some studies that follow the organizational perspective concentrate their attention
to the link between the exposure of employees to the HRM strategy (i.e. the adoption and the
level of diffusion inside the workplace of HRM practices) and employee attitudes. In this
perspective, it is managers that report about the adoption of HRM practices by the firm and a
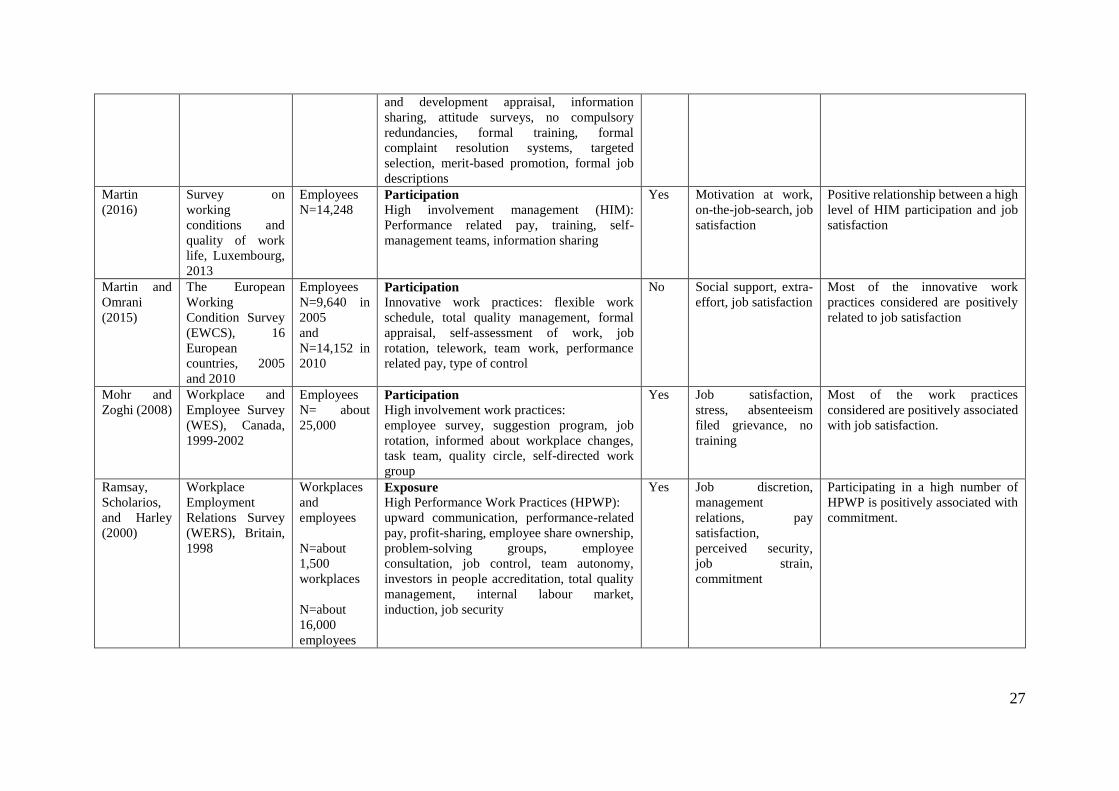
practice may exist but only for a minority of the staff. Ramsay et al. (2000), using employer-
employee data collected in Britain in 1998, find positive links between the score of HRM
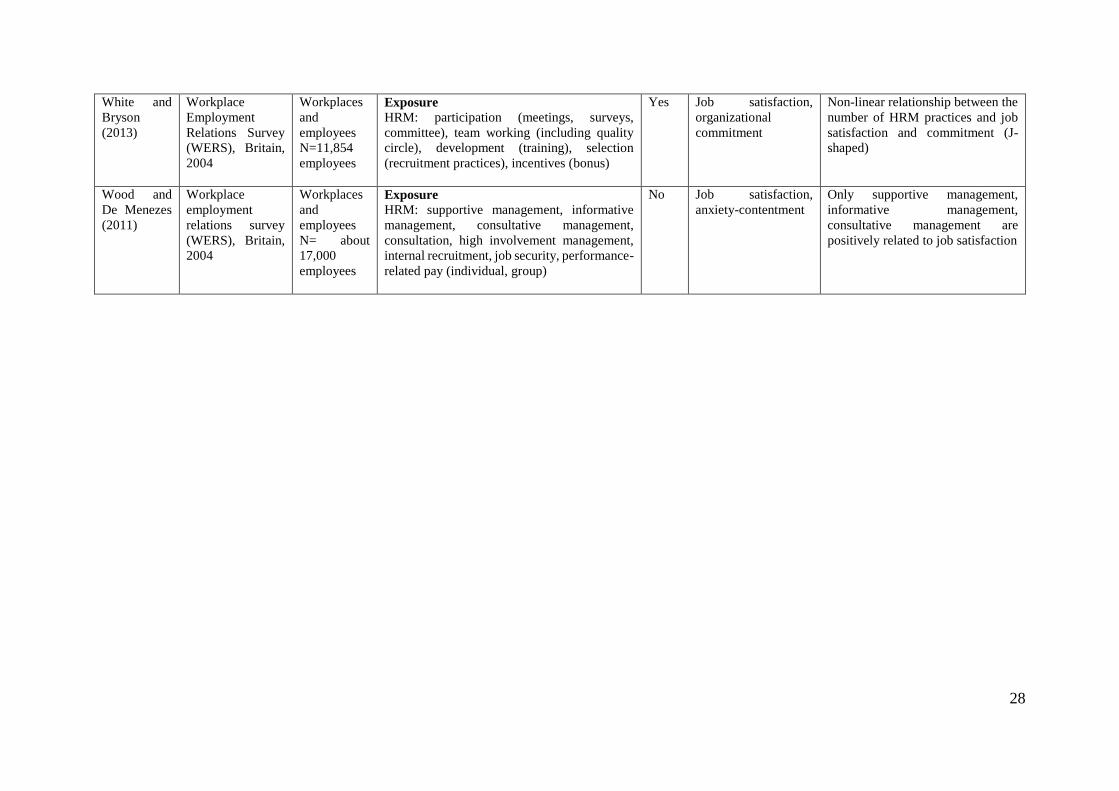
practices adopted by firms and commitment. In contrast, Wood and De Menezes (2011), using
a British dataset collected in 2004 on about 17,000 employees, show that HRM exposure is not
statistically related to employees job satisfaction. Nevertheless, there are significant and
positive links between employee perceptions about supportive, consultative, and informative
management and job satisfaction. White and Bryson (2013), through a British dataset collected
in 2004 of 2,295 establishments and 11,854 employees, study intrinsic job satisfaction and
organizational commitment. HRM variables are introduced as the sum of practices measured at
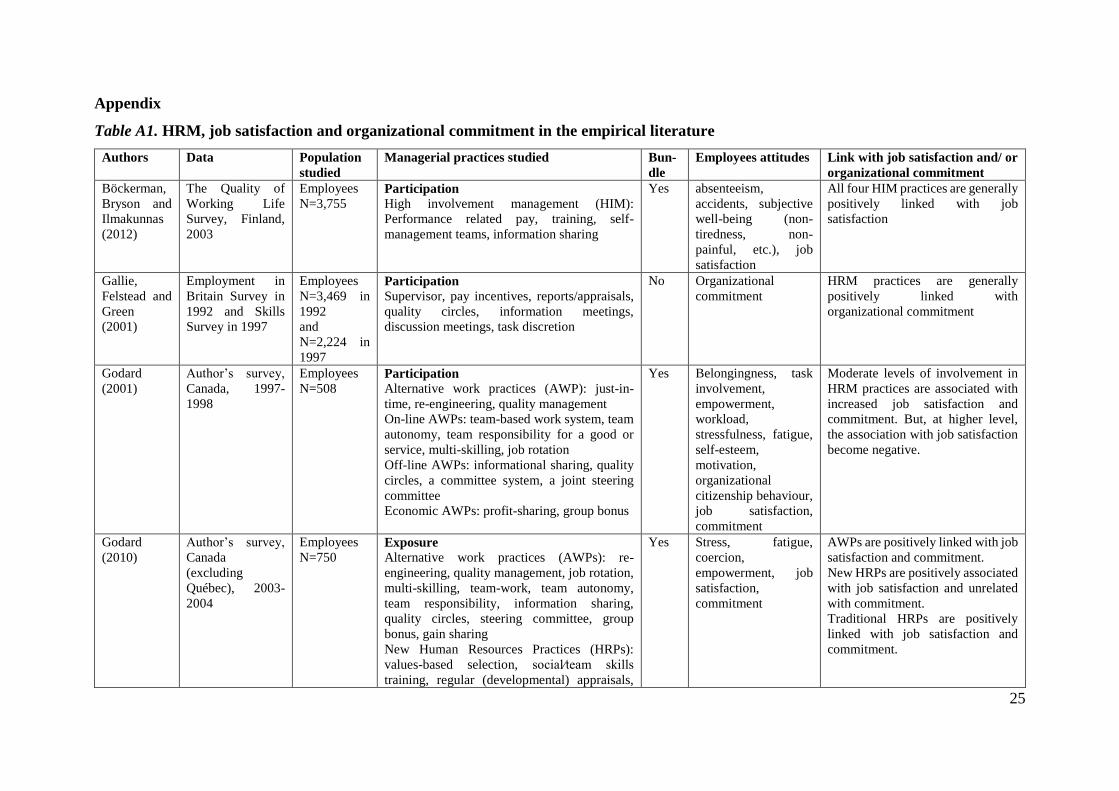
7 Appendix Table A1 provides an overview of the empirical findings in the literature on the links between HRM
on the one hand and job satisfaction and organizational commitment on the other hand.
7
the workplace level about participation in the organizational life, team working, development
(training), selection (recruitment practices), and incentives (bonus). They show that the
relationship between the bundle of HRM and employee job attitudes is J-shaped. Exposure
measures capture the managerial orientation of the firm towards HRM but not the level of
employee participation.
A second stream of research focuses on the employee perspective and looks at the participation
or involvement of employees in HRM practices. From this perspective, it is by winning the
hearts and minds of employees that firms can improve economic performance. In this approach
the best way to assess the presence of HRM practices is by asking employees to report their
personal experience or for some items, such as meetings between management and the staff, to
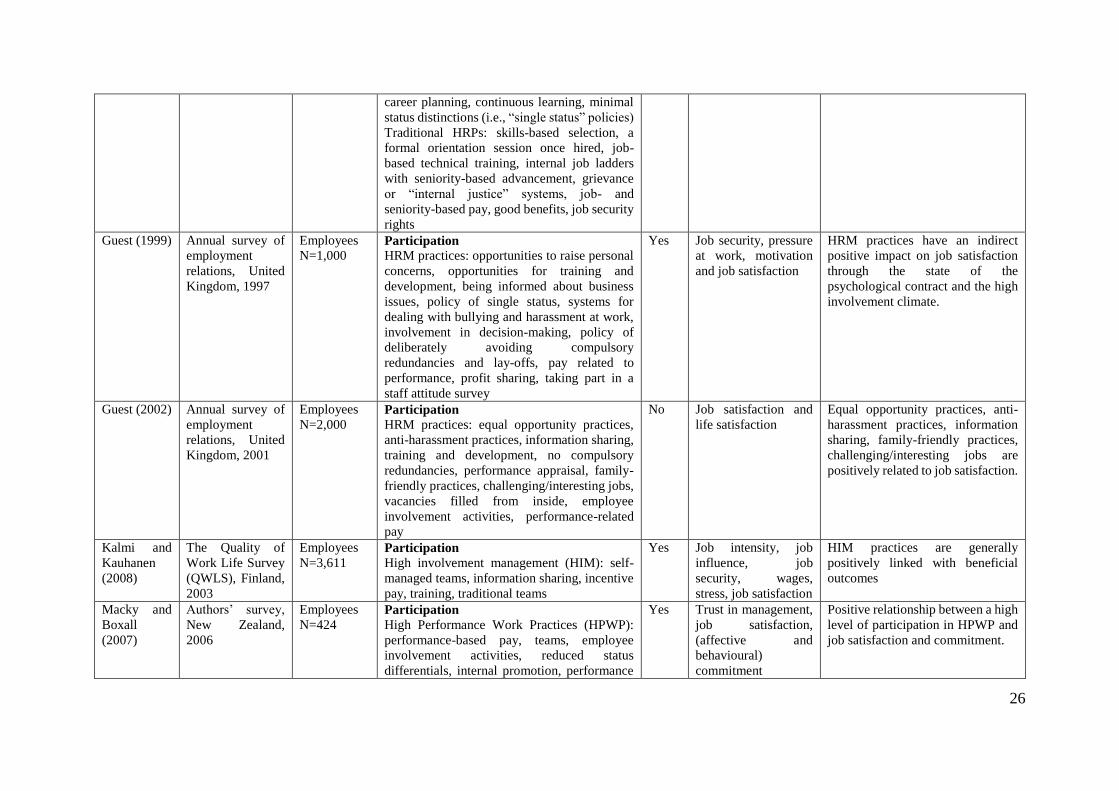
report their usefulness. Guest (1999), for 1,000 UK employees of the private sector collected in
1997, and Guest (2002), for 2,000 UK employees of the whole economy collected in 2001, find
that the more employees experienced HRM practices, the more satisfied they are through a
better psychological contract and involvement climate. Godard (2001), for 508 Canadian
employees surveyed in 1997-1998, and Godard (2010), for 750 Canadian employees surveyed
in 2003-2004, study various employee attitudes and HRM practices taken as a bundle. Their
results support a positive link between the bundle of work practices on one hand and
commitment and job satisfaction on the other. Gallie et al. (2001), using a sample of 3,469
British employees in 1992 and 2,224 in 1997, conclude that task discretion (employee scope
for decision-making), control over work performance (supervision), forms of employee
involvement, and extrinsic reward (extra payment) are important determinants of commitment.
Macky and Boxall (2007), for 424 employees of New Zealand, find a positive relationship
between high performance work practices and job satisfaction and organizational commitment,
stressing that innovative work practices can provide win-win outcomes for both employees and
employers. Mohr and Zoghi (2008), for about 25,000 employees working in Canada (1999-
2002), study the linkage between seven management practices and job satisfaction. Their results
show that most individual practices and the bundle of these practices are positively related to
job satisfaction. Böckerman et al. (2012), using a Finish survey collected in 2003 and covering
3,755 employees, examine the relationships between the four core High Involvement Practices
(HIM that are self-managed teams, information sharing, training and performance-related pay)
and employee attitudes. Their results reveal positive and significant relationships between the
four practices studied and various aspects of employee wellbeing, especially job satisfaction.
Using the same dataset and the same HIM, and adopting a bundle approach, Kalmi and
8
Kauhanen (2008) also find these positive associations. Martin (2016) on Luxembourgish data
collected in 2013 focuses on the association between employees participation in HIM practices
and job satisfaction and finds a positive relationship. Martin and Omrani (2015) show, based
on data from the European Working Condition Survey of 2005 and 2010, that most of the
innovative work practices studied (team work, quality management, formal appraisal, etc.) are
positively related to employee positive attitudes.
The existing literature, therefore, suggests the following hypotheses:
H1: The level of exposure to HRM practices is positively related to employee attitudes
H2: The level of participation of employees in HRM practices is positively related to employee
attitudes
To our knowledge, existing work on HRM has examined only the relationship of exposure to
HRM and employee attitudes or the relationship of participation in HRM and employee
attitudes separately. This paper seeks to integrate both perspectives to explore the linkage
between exposure and participation and employee attitudes jointly. The paper adds to the
literature by filling that gap. A priori, we are not able to predict how controlling for one of the
two variables will affect the relationships between the other and employee attitudes.
3 Data and methodology
3.1 Data
The data used in this paper come from a nationally representative linked employer-employee
survey for Luxembourg conducted in 2013. The employer survey consists of a self-completion
survey of the Human Resources Responsible of all workplaces with 15 or more employees in
the private sector. The employee survey questionnaires were sent to a stratified random sample
of employees aged at least 16 years, working at least six months in all workplaces with 15 or
more employees in the private sector. The sample was drawn from the data register of the social
security of Luxembourg and employees were contacted at their personal home addresses. This
survey was an online self-completion survey. Due to the specificity of the Luxembourgish labor
market characterized by a large proportion of cross border employees8, the employee survey
was conducted in four countries (Luxembourg, France, Germany and Belgium) and three
languages (French, German and English). Due to the absence of linked employee or employer
8 The cross border employees represent 53% of the working population in the private sector in 2013.
9
data in some cases, the effective samples used in this paper are 1,238 workplaces and 8,373
employees. The database includes weights to account for non-response and survey design
probabilities and to ensure representativeness.
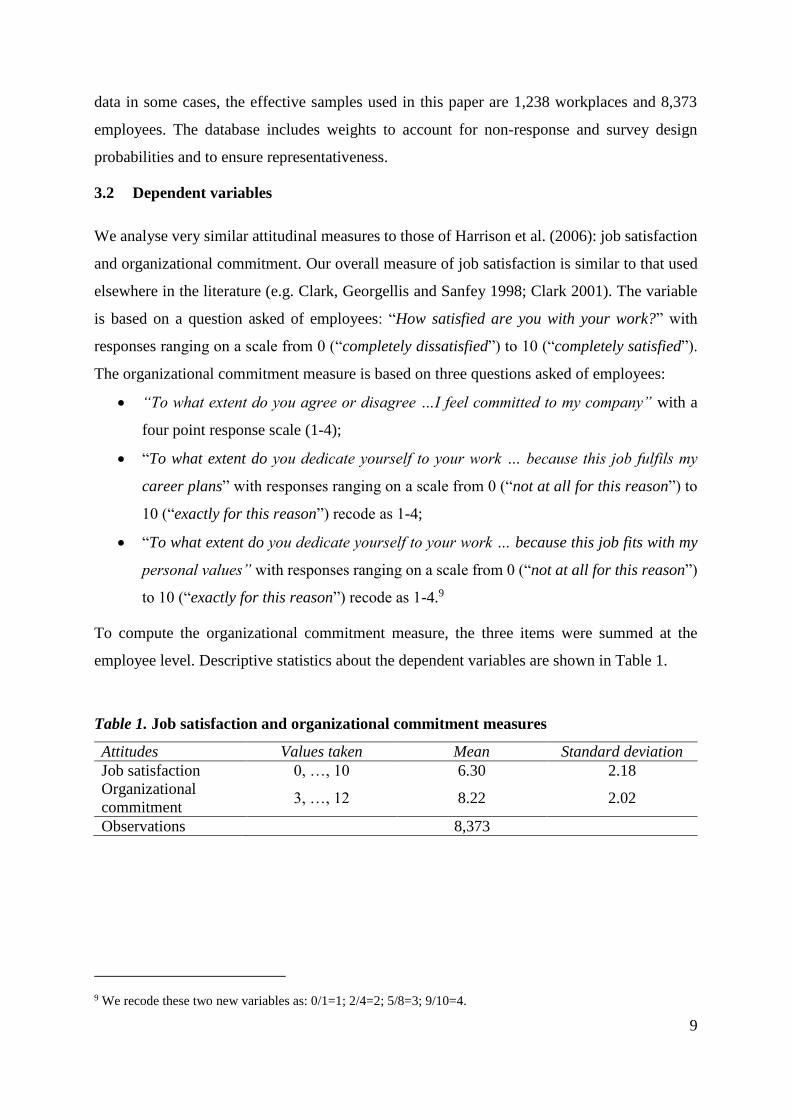
3.2 Dependent variables
We analyse very similar attitudinal measures to those of Harrison et al. (2006): job satisfaction
and organizational commitment. Our overall measure of job satisfaction is similar to that used
elsewhere in the literature (e.g. Clark, Georgellis and Sanfey 1998; Clark 2001). The variable
is based on a question asked of employees: “How satisfied are you with your work?” with
responses ranging on a scale from 0 (“completely dissatisfied”) to 10 (“completely satisfied”).
The organizational commitment measure is based on three questions asked of employees:
“To what extent do you agree or disagree …I feel committed to my company” with a
four point response scale (1-4);
“To what extent do you dedicate yourself to your work … because this job fulfils my
career plans” with responses ranging on a scale from 0 (“not at all for this reason”) to
10 (“exactly for this reason”) recode as 1-4;
“To what extent do you dedicate yourself to your work … because this job fits with my
personal values” with responses ranging on a scale from 0 (“not at all for this reason”)
to 10 (“exactly for this reason”) recode as 1-4.9
To compute the organizational commitment measure, the three items were summed at the
employee level. Descriptive statistics about the dependent variables are shown in Table 1.
Table 1. Job satisfaction and organizational commitment measures
Attitudes Values taken Mean Standard deviation
Job satisfaction 0, …, 10 6.30 2.18
Organizational
commitment 3, …, 12 8.22 2.02
Observations 8,373
9 We recode these two new variables as: 0/1=1; 2/4=2; 5/8=3; 9/10=4.
10
3.3 Measures of HRM
In the literature, isolated individual practices or a system of practices referred to as a bundle
have been examined and the HRM practices studied partially overlap. Based on existing
research, it is becoming increasingly clear that HRM practices need to be adopted together as
there is an additive advantage of adopting complementary and overlapping practices to achieve
positive results. Moreover, looking at the HRM system as a whole allows taking into account
the positive and negative complementarities between practices that is not possible when
studying isolated individual HRM practices (Wood 1999; Bowen and Ostroff 2004; Godard
2004; Combs et al. 2006).
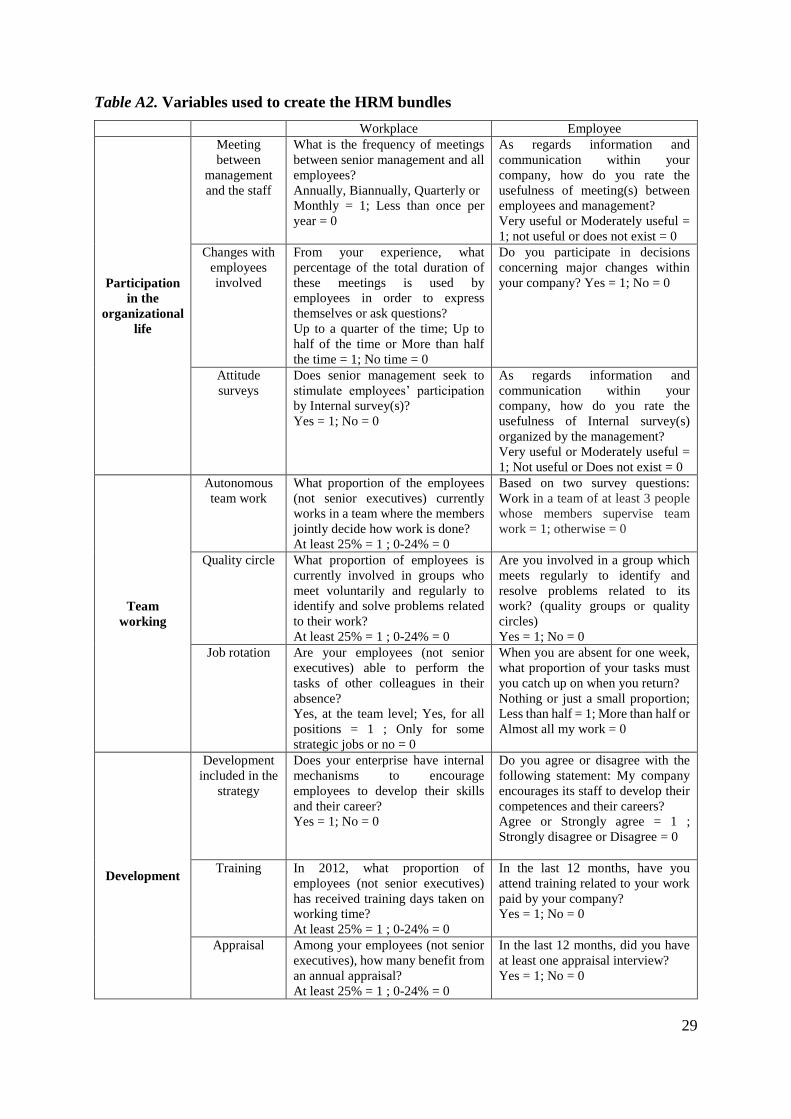
We use this bundle perspective to characterize the exposure of employees to HRM and the
participation of employees in the HRM strategy of their employer (see Table 2). The HRM
practices included in our bundle are close to those used in the literature and cover participation
in the organizational life, team working, development, family-friendly and incentives domains
(e.g. Macky and Boxall 2007; Mohr and Zoghi 2008; White and Bryson 2013). Appendix Table
A2 provides details about the variables included in the bundles. Some HRM practices included
in existing studies are not covered in our analysis mainly due to non-relevance regarding the
aim of our analysis and/or the Luxembourgish context. This is the case, firstly, for the practices
that refer to the screening and selection process of employees. While these practices may have
an effect on performance, by selecting better employees, they should not influence incumbent
employees who already work for the firm. Secondly, the equal opportunity treatment of
applicants in the selection process included in some studies seems to not be relevant in the
Luxembourgish context as all workplaces covered in our sample (with at least 15 employees)
have, by law10, to put in place a representative staff with one person in charge of the defense of
equal treatment. Thirdly, the practices related to job security and non-compulsory redundancies
policy are not relevant in the Luxembourgish context characterized by strict employment
protection both at the individual and collective levels.11
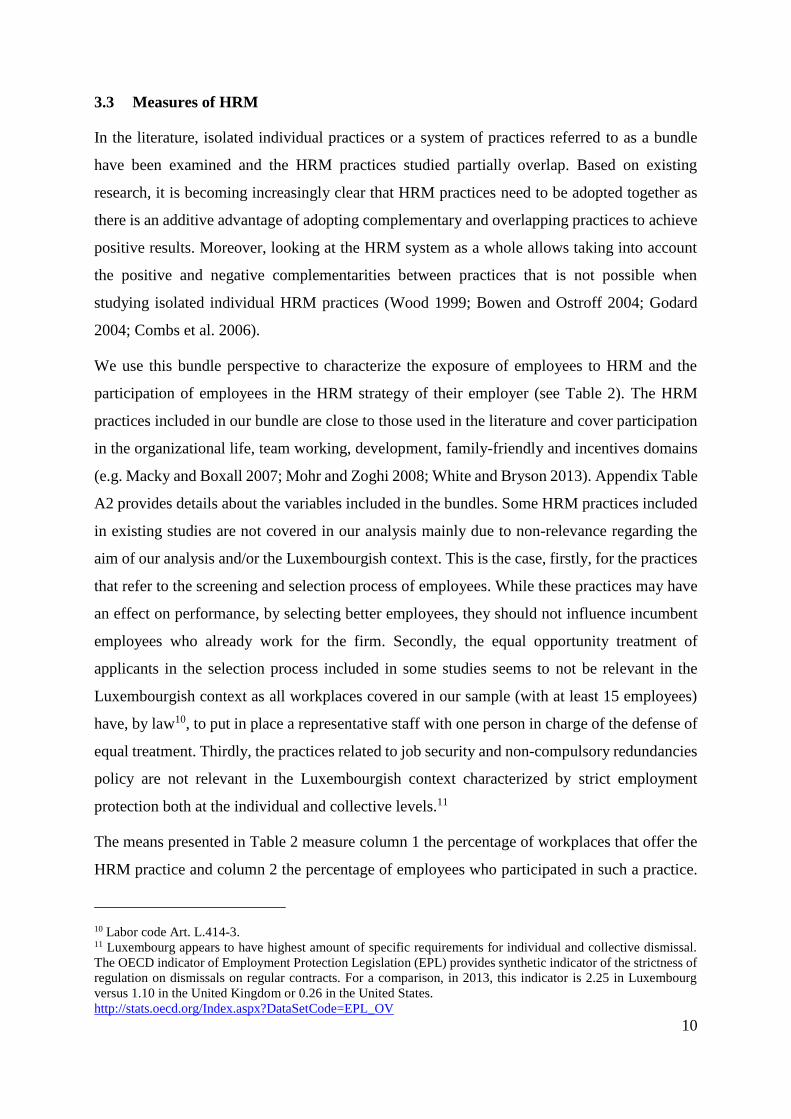
The means presented in Table 2 measure column 1 the percentage of workplaces that offer the
HRM practice and column 2 the percentage of employees who participated in such a practice.
10 Labor code Art. L.414-3. 11 Luxembourg appears to have highest amount of specific requirements for individual and collective dismissal.
The OECD indicator of Employment Protection Legislation (EPL) provides synthetic indicator of the strictness of
regulation on dismissals on regular contracts. For a comparison, in 2013, this indicator is 2.25 in Luxembourg
versus 1.10 in the United Kingdom or 0.26 in the United States.
http://stats.oecd.org/Index.aspx?DataSetCode=EPL_OV
11
The values for “HRM bundle” are the average for the sum of the HRM practices at the
workplace and the employee levels. That is, for a given workplace, HRM bundle represents the
number of HRM practices offered by the employer. For a given employee, HRM bundle
represents the number of practices in which the employee participated. A comparison of the
means and [medians] reveal the distributions are slightly skewed.
Table 2. HRM practices included in the HRM bundle
Domain name Contents Workplace
mean
Employee
mean
(1) (2)
Participation
in the
organizational
life
Meeting between management and the staff 79.6% 66.8%
Changes with employees involved 87.6% 13.4%
Attitude surveys 36.5% 42.1%
Quality circle 31.6% 24.3%
Team working Team work 28.3% 30.9%
Job rotation 82.7% 51.3%
Development Development included in the strategy 42.1% 53.7%
Training 26.2% 42.1%
Appraisal 46.1% 58.3%
Family-
friendly
Flexible working hours 20.7% 39.4%
Work-life balance 21.9% 39.4%
Work at home during work hours 19.9% 7.7%
Incentives Individual pay incentive 65.1% 32.4%
Fringe benefits 70.8% 49.6%
HRM bundle Sum of the 14 HRM practices 6.6
(2.76)
[7]
5.5
(2.6)
[5]
Observations 1,238 8,373
Notes: Standard deviations are reported in parentheses and median values in brackets for non-
binary variables.
Reading guide: In 70.8% of workplaces, a fringe benefits system, which includes at least one
of these benefits (company car or car fee participation, supplementary pension or life insurance,
meal vouchers), is set up for all or part of their employees (excluding senior executives). 49.6%
of employees declare that they participate in this kind of system.
We separate workplaces into two groups (high and low exposure) and employees into two
groups (high and low participation) using the median values of the bundles as cutoffs.
Moreover, these median values are calculated at the sectoral level to take into account that HRM
strategies may differ by sector as shown by Arundel, Lorenz, Lundvall and Valeyre (2007). We
then define four employee-employer groups using these cutoffs: “Exposure low & participation
low” (LL); “Exposure high & participation low” (HL); “Exposure low & participation high”
(LH) and “Exposure high & participation high” (HH). In order to compare with previous work
we also created variables indicating a high level of exposure (regardless of the level of
12
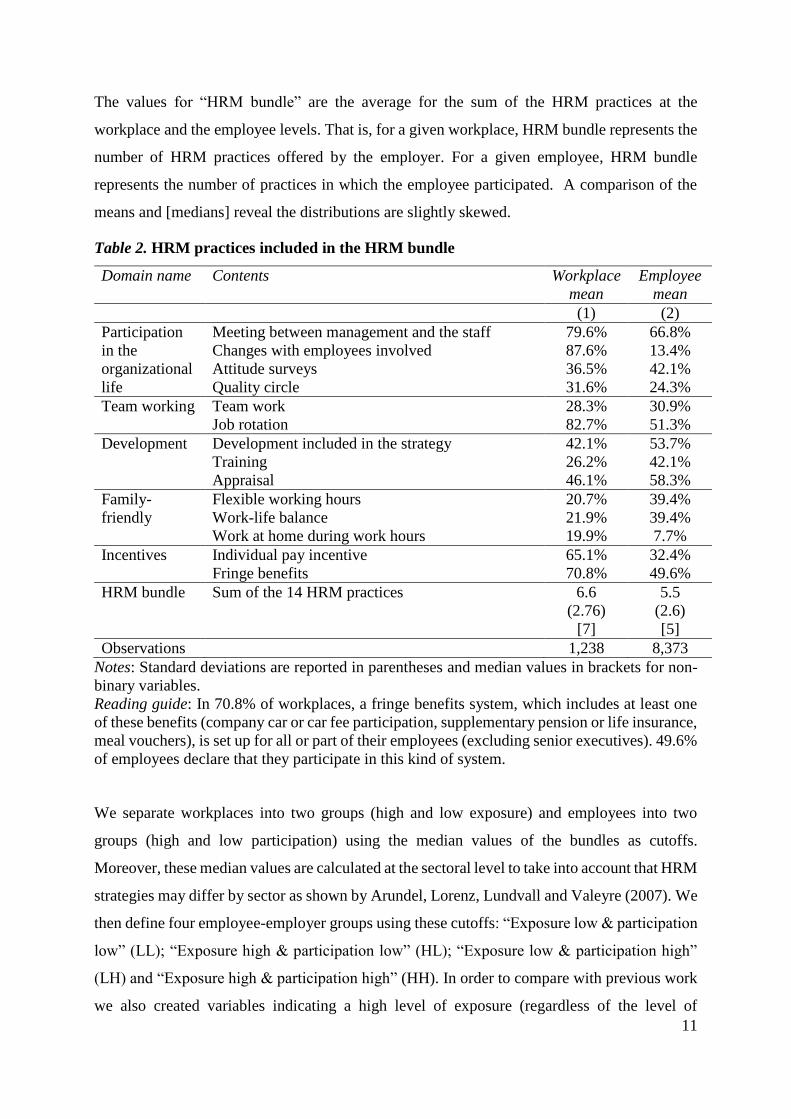
participation), EH, and a high level of participation, PH. We see in Table 3, that nearly 59
percent of employees work in a firm that offers a high level of exposure to HRM, and 54 percent
of employees report a high participation level. We also see that 17.5 percent of employees
belong to the “Exposure low & participation high” (LH) group. These employees work in a
workplace where the number of HRM strategies adopted is lower than the median of the sector.
They are therefore less exposed to HRM practices compared to other employees working in the
same sector. But when the practices are available they actively participate and reach a level of
participation that is higher than the median of the employees belonging to the same sector.
Table 3. Distribution of the exposure-participation groups
Groups Employee
Exposure high (EH) 58.74%
Participation high (PH) 54.31%
Exposure low & participation low (LL) 23.8%
Exposure high & participation low (HL) 21.9%
Exposure low & participation high (LH) 17.5%
Exposure high & participation high (HH) 36.8%
Observations 8,373
3.4 Control variables
The control variables, included in all the analyses, are similar to those used in the literature
focusing on job satisfaction (e.g. Clark, Oswald and Warr 1996; Clark 1997; Sousa-Poza and
Sousa-Poza 2000; Gazioglu and Tansel 2006; Stutzer and Frey 2008; Martin and Omrani 2015)
and that focusing on organizational commitment (e.g. Mowday, Porter and Steers 1982;
DeCotiis and Summers 1987; Mathieu and Zajac 1990; Gallie et al. 2001; Madsen, Miller and
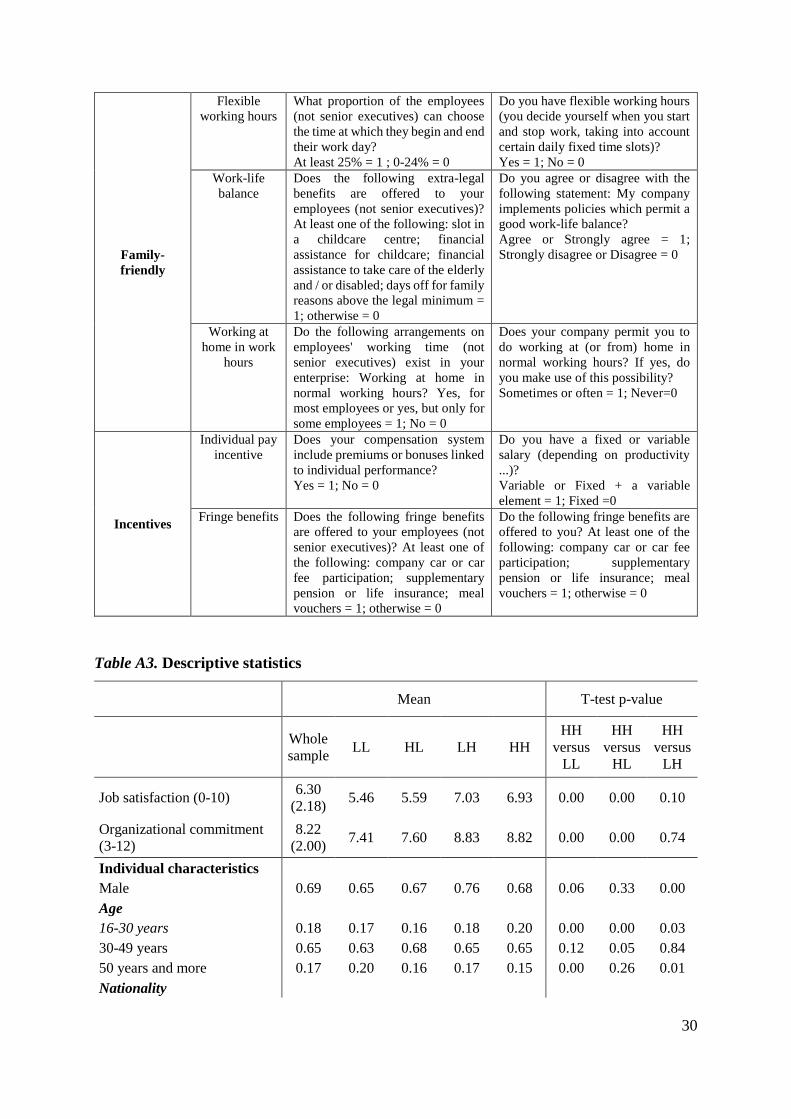
John 2005). Appendix Table A3 presents these variables, provides descriptive statistics and
compares the characteristics of employees, their job and their workplace related to their
exposure-participation group.
The figures reported in Table A3 reveal that the mean values for the high-high (HH) category
of workers differ from the others for several variables. First, some differences appear in their
personal characteristics. High-high employees are more likely than the others to, for example,
have a post-secondary level of education. They are less likely to be Portuguese. They spend
more time, each day, commuting from home to work than the employees who work in
workplaces that provide a low level of HRM exposure. Second, differences appear in the
characteristics of their occupation. High-high employees occupy more often a top occupation
(professional and managers) and they are less likely sellers, service personals, craftsmen or
13
unskilled workers. Therefore, their jobs are better paid, they more intensively use ICT and they
face fewer harmful working conditions. They are more likely to work full time than the low-
low group. Third, they work in different types of firms. They work in larger organization (with
at least 250 employees) and more often in the finance sector and less often in construction.
Their firm is more often foreign owned, more often in existence for at least 20 years, less often
multi-site, and with a higher percentage of graduates and a lower percentage of colleagues with
the same gender or nationality as the respondent.
The differences highlighted above imply the need to carefully control for individual,
occupational and workplace characteristics.
3.5 Estimation strategy
The measures of job satisfaction and organizational commitment are treated as continuous
variables. We use linear regression to estimate the coefficients. Robust standard errors are
clustered at the organization level to correct for the fact that some employees are employed by
the same organization and therefore the observations may not be entirely independent. In a first
step, we analyze, as previous studies, the link between employee positive attitudes and
participation or exposure taken individually to see if our results are consistent with previous
literature.
In a second step, we include both exposure and participation variables in the analysis. The
parameters of the following model are estimated:
𝑌𝑖 = 𝐸𝐻𝑖𝛽1 + 𝑃𝐻𝑖𝛽2 + 𝑋𝑖𝛽3 + 𝜀𝑖,
where 𝑌𝑖 is the level of job satisfaction (or organizational commitment) of individual i, EHi,
and PHi indicate high levels of exposure or participation, respectively, 𝑋𝑖 a vector of the
individual, occupational and workplace characteristics (and a constant), 𝛽 the vector of
coefficients and 𝜀𝑖 is a normally distributed random error term.
In a third step, we go further and use dummy variables indicating the exposure-participation
groups (𝐿𝐿𝑖, 𝐻𝐿𝑖, 𝐿𝐻𝑖, with 𝐻𝐻𝑖 as the reference group):
𝑌𝑖 = 𝐿𝐿𝑖𝛽1 + 𝐻𝐿𝑖𝛽2 + 𝐿𝐻𝑖𝛽3 + 𝑋𝑖𝛽4 + 𝜀𝑖,
The high-high (HH) category is chosen as the reference group in accordance with the J-shaped
relationship between the number of HRM and employees attitudes shown by White and Bryson
(2013). Moreover, in our sample high-high is the most common category.
14
In a fourth step, we proceed to our decomposition analysis. First, we estimate the same
regressions but separately by exposure-participation groups.
𝑌𝑖𝑗 = 𝑋𝑖𝑗𝛽𝑗 + 𝜀𝑖𝑗
where 𝑌𝑖𝑗 is the level of job satisfaction (or organizational commitment) of individual i of group
j (j=LL, LH, HL, HH), 𝑋𝑖𝑗 a vector containing the values of individual, occupational and
workplace characteristics for individual i of group j and the intercept, 𝛽𝑗 the vector of
coefficients for group j, and 𝜀𝑖𝑗 is the random error term normally distributed.12 In this analysis
the coefficients for the characteristics (X) are allowed to vary across groups.
Second, the results from these models are used to decompose the employee differences in, on
the one hand, job satisfaction, and on the other hand, organizational commitment, into three
components following a variant of the Blinder (1973) & Oaxaca (1973) decomposition done by
Daymont and Adrisani (1984). The first (the “endowments effects”) is the part of the difference
that is attributable to differences in individual, occupational and workplace characteristics
between the groups. The second (the “coefficients effects”) is the part that is attributable to
differences in the coefficients (β) on those characteristics. The third (the interaction) is the part
that is attributable to the simultaneous effect of differences in endowments and coefficients.
Taking the example of the low-low employee group and keeping “high-high” (HH) as the
reference group, the decomposition results from constructing the counterfactual asking, what
would the level of job satisfaction (or organizational commitment) be for low-low employees
if they had the same individual, occupational and workplace characteristics as high-high
employees, and, what would the level of job satisfaction (or organizational commitment) be for
low-low employees if they placed the same value on characteristics as high-high employees?
The specification for the decomposition is the following:
𝐸(𝑌𝐻𝐻) − 𝐸(𝑌𝐿𝐿) = [𝐸(𝑋𝐻𝐻) − 𝐸(𝑋𝐿𝐿)]′𝛽𝐿𝐿 + 𝐸(𝑋𝐿𝐿)′(𝛽𝐻𝐻 − 𝛽𝐿𝐿) + [𝐸(𝑋𝐻𝐻) − 𝐸(𝑋𝐿𝐿)]′(𝛽𝐻𝐻 − 𝛽𝐿𝐿)
The first term on the right hand side is the part attributable to differences in the outcome variable
between the two groups that is due to differences in the covariates X. The second term is the
part attributable to differences in the valuation of personal, occupational and workplace
characteristics. The third part is the interaction term. We present estimates of these components
for job satisfaction and organizational commitment by comparing each group with the reference
12 The results of this step are shown in Appendix Table A6.
15
group (high-high). Robust standard errors are clustered at the workplace level to correct for the
fact that some employees are employed by the same workplace.
It should be noted that the data are cross-sectional and so we are only able to identify the
strength of conditional correlations and not causal relationships. Satisfied and committed
employees can indeed be the ones that participate more in the HRM practices designed by their
employer. But for the exposure level, it is not obvious that HRM practices are adopted only by
employers with low satisfaction and commitment levels (see Table 3). Our analysis is also not
immune to a potential self-selection issue. Satisfied and committed employees could have been
attracted to work in the current firm because of the information they had when they postulated
about the availability of management practices in the desired job. The available data do not
permit solving this issue, but as observed in the descriptive statistics, workplaces with high
exposure are distributed between those with low participation of their employees and those with
a high participation (see Table 3). Thus the self-selection issue may not be too serious.
4 Results
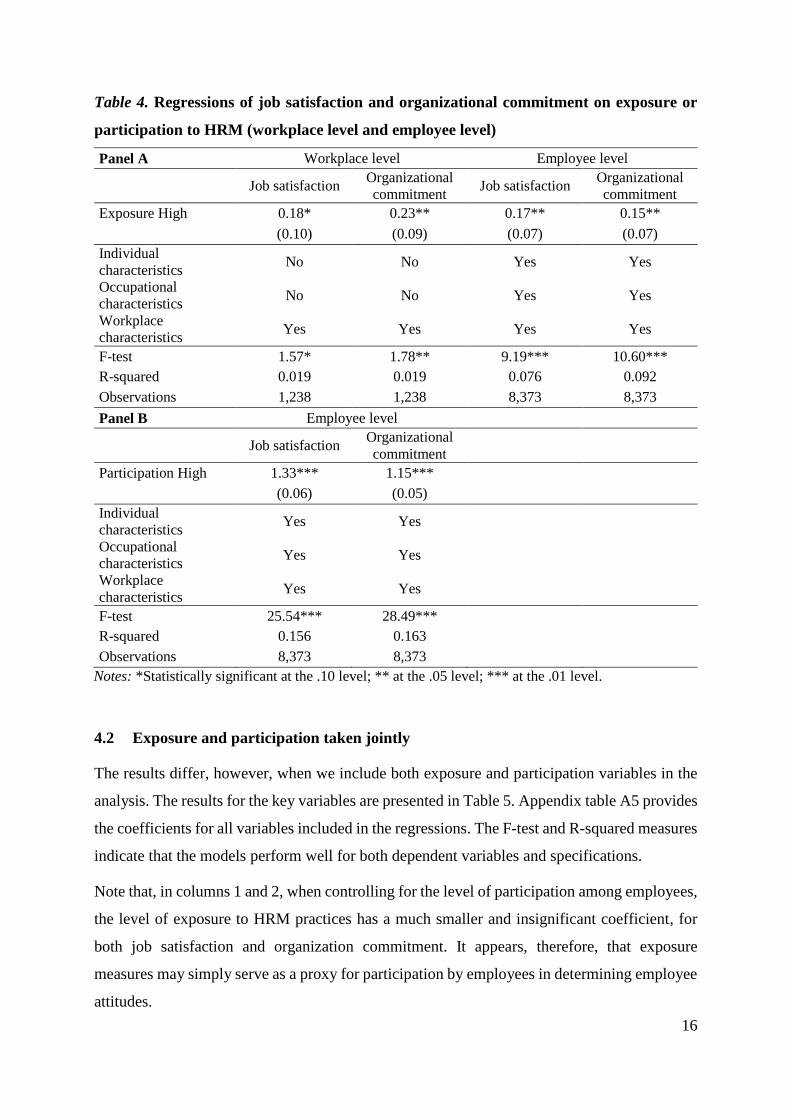
4.1 Exposure and participation taken individually
We estimate regressions that loosely replicate the results found in the literature regarding
exposure and participation taken individually. These are presented in Table 4. Appendix table
A4 provides the results of all variables included in the regressions. The F-test and R-squared
measures indicate that the models perform well for both dependent variables. Panel A shows
the coefficients for variables measuring exposure to HRM practices, using attitudes measured
at, on the one hand, the workplace level as in White and Bryson (2013) or, on the other hand,
the employee level as in Wood and De Menezes (2011) or Ramsay et al. (2000). The results
indicate that a High (above the median) level of exposure is positively related to both job
satisfaction and organizational commitment. These results are broadly consistent with those
presented in White and Bryson (2013), Wood and De Menezes (2011), and Ramsay et al.
(2000).
Panel B shows the coefficients for variables measuring participation in HRM practices. Not
controlling for the level of exposure, again we find results broadly consistent with the literature
(Godard 2001; Mohr and Zoghi 2001). That is, a High (above the median) level of participation
in HRM practices is positively associated with both job satisfaction and organizational
commitment.
16
Table 4. Regressions of job satisfaction and organizational commitment on exposure or
participation to HRM (workplace level and employee level)
Panel A Workplace level Employee level
Job satisfaction Organizational
commitment Job satisfaction
Organizational
commitment
Exposure High 0.18* 0.23** 0.17** 0.15**
(0.10) (0.09) (0.07) (0.07)
Individual
characteristics No No Yes Yes
Occupational
characteristics No No Yes Yes
Workplace
characteristics Yes Yes Yes Yes
F-test 1.57* 1.78** 9.19*** 10.60***
R-squared 0.019 0.019 0.076 0.092
Observations 1,238 1,238 8,373 8,373
Panel B Employee level
Job satisfaction Organizational
commitment
Participation High 1.33*** 1.15***
(0.06) (0.05)
Individual
characteristics Yes Yes
Occupational
characteristics Yes Yes
Workplace
characteristics Yes Yes
F-test 25.54*** 28.49***
R-squared 0.156 0.163
Observations 8,373 8,373
Notes: *Statistically significant at the .10 level; ** at the .05 level; *** at the .01 level.
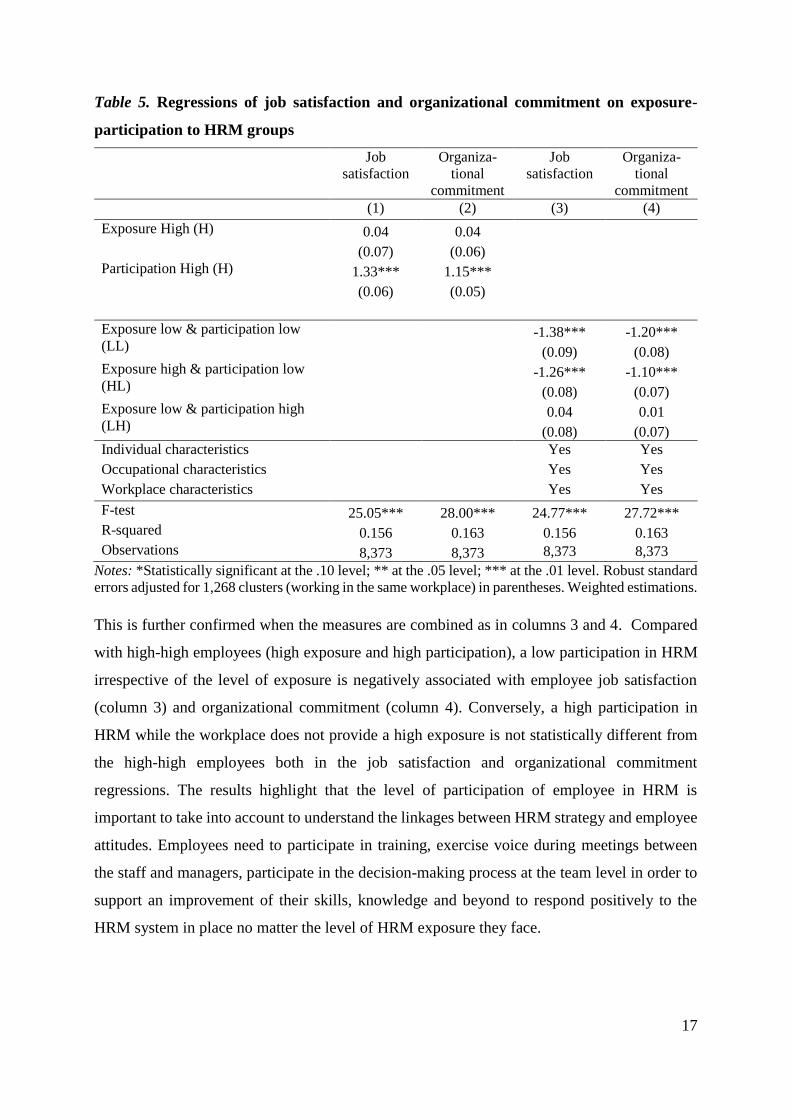
4.2 Exposure and participation taken jointly
The results differ, however, when we include both exposure and participation variables in the
analysis. The results for the key variables are presented in Table 5. Appendix table A5 provides
the coefficients for all variables included in the regressions. The F-test and R-squared measures
indicate that the models perform well for both dependent variables and specifications.
Note that, in columns 1 and 2, when controlling for the level of participation among employees,
the level of exposure to HRM practices has a much smaller and insignificant coefficient, for
both job satisfaction and organization commitment. It appears, therefore, that exposure
measures may simply serve as a proxy for participation by employees in determining employee
attitudes.
17
Table 5. Regressions of job satisfaction and organizational commitment on exposure-
participation to HRM groups
Job
satisfaction
Organiza-
tional
commitment
Job
satisfaction
Organiza-
tional
commitment
(1) (2) (3) (4)
Exposure High (H) 0.04 0.04
(0.07) (0.06)
Participation High (H) 1.33*** 1.15***
(0.06) (0.05)
Exposure low & participation low
(LL)
-1.38*** -1.20***
(0.09) (0.08)
Exposure high & participation low
(HL)
-1.26*** -1.10***
(0.08) (0.07)
Exposure low & participation high
(LH)
0.04 0.01
(0.08) (0.07)
Individual characteristics Yes Yes
Occupational characteristics Yes Yes
Workplace characteristics Yes Yes
F-test 25.05*** 28.00*** 24.77*** 27.72***
R-squared 0.156 0.163 0.156 0.163
Observations 8,373 8,373 8,373 8,373
Notes: *Statistically significant at the .10 level; ** at the .05 level; *** at the .01 level. Robust standard
errors adjusted for 1,268 clusters (working in the same workplace) in parentheses. Weighted estimations.
This is further confirmed when the measures are combined as in columns 3 and 4. Compared
with high-high employees (high exposure and high participation), a low participation in HRM
irrespective of the level of exposure is negatively associated with employee job satisfaction
(column 3) and organizational commitment (column 4). Conversely, a high participation in
HRM while the workplace does not provide a high exposure is not statistically different from
the high-high employees both in the job satisfaction and organizational commitment
regressions. The results highlight that the level of participation of employee in HRM is
important to take into account to understand the linkages between HRM strategy and employee
attitudes. Employees need to participate in training, exercise voice during meetings between
the staff and managers, participate in the decision-making process at the team level in order to
support an improvement of their skills, knowledge and beyond to respond positively to the
HRM system in place no matter the level of HRM exposure they face.
18
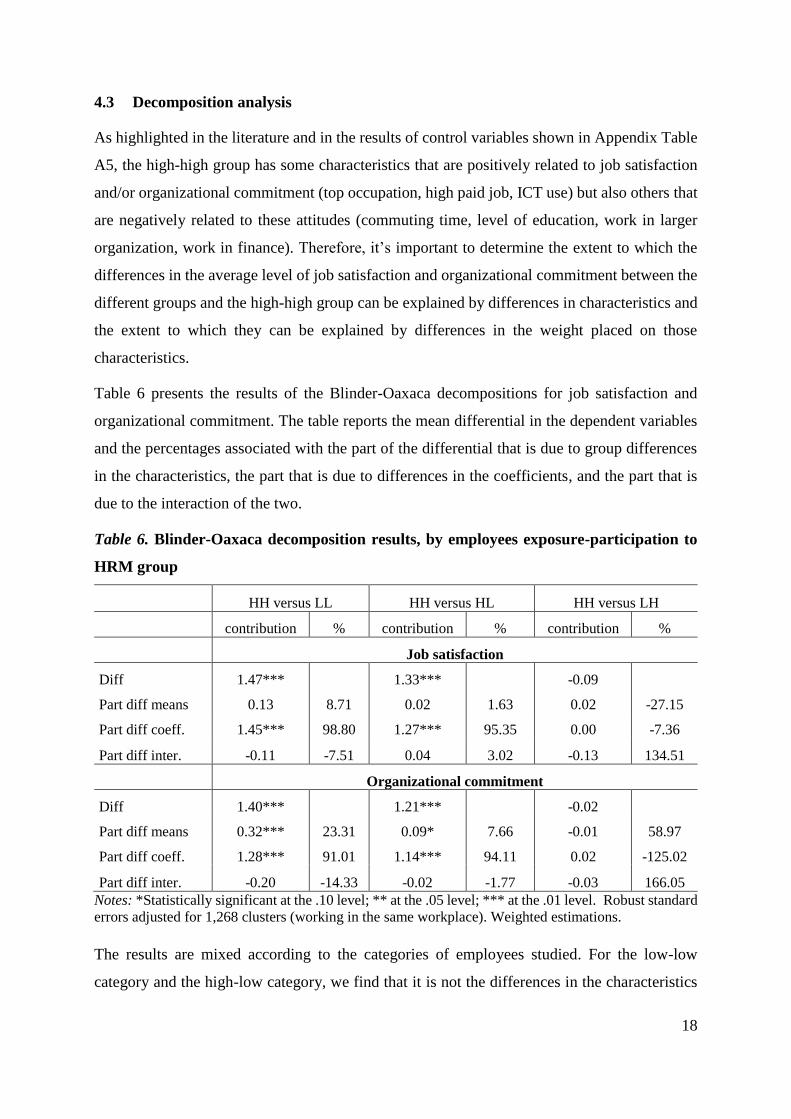
4.3 Decomposition analysis
As highlighted in the literature and in the results of control variables shown in Appendix Table
A5, the high-high group has some characteristics that are positively related to job satisfaction
and/or organizational commitment (top occupation, high paid job, ICT use) but also others that
are negatively related to these attitudes (commuting time, level of education, work in larger
organization, work in finance). Therefore, it’s important to determine the extent to which the
differences in the average level of job satisfaction and organizational commitment between the
different groups and the high-high group can be explained by differences in characteristics and
the extent to which they can be explained by differences in the weight placed on those
characteristics.
Table 6 presents the results of the Blinder-Oaxaca decompositions for job satisfaction and
organizational commitment. The table reports the mean differential in the dependent variables
and the percentages associated with the part of the differential that is due to group differences
in the characteristics, the part that is due to differences in the coefficients, and the part that is
due to the interaction of the two.
Table 6. Blinder-Oaxaca decomposition results, by employees exposure-participation to
HRM group
HH versus LL HH versus HL HH versus LH
contribution % contribution % contribution %
Job satisfaction
Diff 1.47*** 1.33*** -0.09
Part diff means 0.13 8.71 0.02 1.63 0.02 -27.15
Part diff coeff. 1.45*** 98.80 1.27*** 95.35 0.00 -7.36
Part diff inter. -0.11 -7.51 0.04 3.02 -0.13 134.51
Organizational commitment
Diff 1.40*** 1.21*** -0.02
Part diff means 0.32*** 23.31 0.09* 7.66 -0.01 58.97
Part diff coeff. 1.28*** 91.01 1.14*** 94.11 0.02 -125.02
Part diff inter. -0.20 -14.33 -0.02 -1.77 -0.03 166.05 Notes: *Statistically significant at the .10 level; ** at the .05 level; *** at the .01 level. Robust standard
errors adjusted for 1,268 clusters (working in the same workplace). Weighted estimations.
The results are mixed according to the categories of employees studied. For the low-low
category and the high-low category, we find that it is not the differences in the characteristics
19
that explain the largest part of the job satisfaction or organizational commitment gap but rather
the differences in the coefficients. Indeed, for these two categories of employees, the differences
in coefficients explain between 91.01% and 98.80% of these gaps. This result suggests that the
extent of employees involvement in HRM modifies the value they place on their personal,
occupational and workplace characteristics. Applying the coefficients of the high-high to the
employees who have a low participation in HRM, irrespective of the exposure level, would
increase significantly their job satisfaction and their organizational commitment. No significant
difference between the high-high and the low-high is found in our results for job satisfaction
and organizational commitment.
4.4 Robustness checks
For the three first steps of our estimation strategy, robustness check regressions were performed
to see if the results presented in Table 4 and 5 are sensitive to the empirical strategy or the
threshold choice made to distinguish high versus low exposure and participation to HRM
groups. First, we estimate ordered probit instead of linear regressions for job satisfaction and
organizational commitment. The sign and significance of Table 4 results concerning the high
levels of exposure and the high levels of participation are the same both at the workplace and
the employee levels. The results presented in Table 5 are identical. Second, we distinguish the
high exposure and the high participation groups from the low using the average taken by the
bundles instead of the median as a cutoff. The sign and significance of the results of Table 4
and 5 are mostly the same. It should be noted that the Exposure High (EH) in the regression of
job satisfaction at the employee level in Table 4 - Panel A is no more significant at the 0.10
level (p = 0.14). The group ‘Exposure low & participation high’, not significant in Table 5
column 3, appears to be significant and positive at the 0.05 level.
For the fourth step of our estimation strategy, sensitivity analysis has been done by applying an
alternative decomposition method, the twofold decomposition method following Neumark
(1988). The qualitative results are mostly the same. The results of all robustness check
regressions are available from the authors upon request.
5 Conclusion
This paper focuses on the links between HRM strategy and job satisfaction and organizational
commitment. More precisely, the paper seeks to identify the extent to which the provision of
HRM practices at the firm level, independent of the level of employee participation, can affect
employee attitudes. The existing literature fails to provide an answer to this issue because the
20
relationships between employee attitudes and the exposure of employees to the HRM strategy,
on the one hand, or the level of involvement of employees in HRM practices, on the other hand,
are studied separately.
This paper uses a recent employer-employee dataset collected in Luxembourg to reconcile these
two perspectives. Due to the specificity of the Luxembourgish labor market characterized by a
large proportion of foreign employees, the results relate not only to Luxembourgish but also
French, Belgian, German, Portuguese and other nationalities. We find that a high exposure to
HRM is not sufficient to improve employee attitudes when the level of employee participation
in HRM is taken into account. Furthermore, based on a Blinder-Oaxaca decomposition, we find
that employee involvement in HRM practices affects the value employees place on their
personal, occupational and workplace characteristics.
Our results provide practical managerial implications for employers as employee attitudes are
the key mediating variables between the HRM strategy and firm performance. Even if all
employees do not have the same role in the value creation process of the firm, the results
indicate that managers should encourage a high involvement of the staff in the HRM system
they have adopted. Employees need especially to participate in training, to exercise voice during
meetings with managers, to participate in the decision-making process at the team level, to
strengthen their skills, knowledge and empowerment and beyond to exhibit a positive response
to the HRM system in place no matter the level of HRM exposure they face.
A potential shortcoming of this paper is that the dataset is cross-sectional. Due to the fact that
they are only measured one time (2013) they do not allow us to identify a causal relationship
between exposure-participation to HRM and employees attitudes. Only additional research
using employer-employee panel data would permit to overcome this issue.
21
References
Arundel, Anthony, Edward Lorenz, Bengt-Ake Lundvall, and Antoine Valeyre. 2007. How
Europe’s economies learn: a comparison of work organization and innovation mode for the EU-
15. Industrial and Corporate Change 16(6): 1175–1210.
Becker, Brian E., and Mark A. Huselid. 2006. Strategic human resources management: where do
we go from here? Journal of Management 32(6): 898–925.
Blinder, Alan S. 1973. Wage discrimination: Reduced Form and Structural Estimates. Journal of
Human Resources 8(4): 436–455.
Bloom, Nicolas, and John Van Reenen. 2011. Human resource management and productivity. In
Card David and Orley Ashenfelter (Eds.), Handbook of Labor Economics, Vol. B, pp. 1697-
1767. North Holland and Amsterdam: Elsevier.
Böckerman, Petri, Alex Bryson, and Pekka Ilmakunnas. 2012. Does high involvement
management improve worker wellbeing? Journal of Economic Behavior & Organization 84(2):
660–680.
Bowen, David E., and Cheri Ostroff. 2004. Understanding HRM-performance linkages: The role
of the ‘strength’ of the HRM system. Academy of Management Review 29(2): 203–221.
Boxall, Peter, and Keith Macky. 2009. Research and theory on high-performance work systems:
progressing the high-involvement stream. Human Resource Management Journal 19(1): 3–23.
Bryson, Alex, John Forth, and Simon Kirby. 2005. High-involvement management practices, trade
unions representation and workplace performance in Britain. Scottish Journal of Political
Economy 52(3): 451–491.
Cappelli, Peter, and David Neumark. 2001. Do “high-performance” work practices improve
establishment-level outcomes? Industrial and Labor Relations Review 54(4): 737–775.
Clark, Andrew E., 1997. Job satisfaction and gender: Why are women so happy at work? Labour
Economics 4(4): 341–372.
Clark, Andrew E., 2001. What really matters in a job? Hedonic measurement using quit data.
Labour Economics 8(2): 223–242.
Clark, Andrew E., Yannis Georgellis and Peter Sanfey. 1998. Job satisfaction, wage changes, and
quits: Evidence from Germany. Research in Labor Economics 17, 95–121.
Clark, Andrew E., Andrew J. Oswald, and Peter Warr. 1996. Is job satisfaction U-shaped in age?
Journal of Occupational and Organizational Psychology 69: 57–81.
22
Combs, James, Yongmei Liu, Angela Hall, and David Ketchen. 2006. How much do high-
performance work practices matter? A meta-analysis of their effects on organizational
performance. Personnel Psychology 59(3): 501–528.
Daymont, Thomas N., and Paul J. Andrisani. 1984. Job preferences, college major, and the gender
gap in earnings. Journal of Human Resources 19(3): 408–428.
DeCotiis, Thomas A., and Timothy P. Summers. 1987. A path analysis of a model of the
antecedents and consequences of organizational commitment. Human Relations 40(7): 445–
470.
Eriksson, Tor, and Nicolai Kristensen. 2014. Wages or fringes? Some evidence on trade-offs and
sorting. Journal of Labor Economics 32(4): 899–928.
Ernst Kossek, Ellen, and Cynthia Ozeki. 1998. Work-family conflict, policies, and the job-life
satisfaction relationship: a review and directions for organizational behavior human resources
research. Journal of Applied Psychology 83(2): 139–149.
Gallie, Duncan, Alan Felstead, and Francis Green. 2001. Employer policies and organizational
commitment in Britain 1992-97. Journal of Management Studies 38(8): 1081–1101.
Gallie, Duncan, Ying Zhou, Alan Felstead, and Francis Green. 2012. Teamwork, skill
development and employee welfare. British Journal of Industrial Relations 50(1): 23–46.
Gazioglu, Saziye, and Aysit Tansel. 2006. Job satisfaction in Britain: individual and job related
factors. Applied economics 38(10): 1163–1171.
Godard, John. 2001. High performance and the transformation of work? The implications of
alternative work practices for the experience and outcomes of work. Industrial and Labor
Relations Review 54(4): 776–805.
Godard, John. 2004. A Critical Assessment of the High-Performance Paradigm. British Journal of
Industrial Relations 42(2): 349-378.
Godard, John. 2010. What is best for workers? the implications of workplace and human resource
management practices revisited. Industrial Relations 49(3): 466–488.
Guest, David E. 1999. Human resource management – The workers verdict. Human Resource
Management Journal 9(3): 5–25.
Guest, David E. 2002. Human resource management, corporate performance and employee well-
being: building the worker into HRM. Journal of Industrial Relations 44(3): 335–358.
Harrison, David A., Daniel A. Newman, and Philip L. Roth. 2006. How important are job
attitudes? Meta-analytic comparisons of integrative behavioral outcomes and time sequences.
The Academy of Management Journal 49(2): 305-325.
23
Huselid, Mark A. 1995. The impact of human resource management practices on turnover,
productivity, and corporate financial performance. The Academy of Management Journal 38(3):
635–672.
Ichniowski, Casey, Kathryn Shaw, and Giovanna Prennushi. 1997. The effects of human resource
management practices on productivity: A study of steel finishing lines. The American Economic
Review 87(3): 291–313.
Jones, Frank L. 1983. On decomposing the wage gap: A critical comment on Blinder's method.
Journal of Human Resources 18(1): 126–130.
Kalmi, Panu, and Antti Kauhanen. 2008. Workplace innovations and employee outcomes:
Evidence from Finland. Industrial Relations 47(3): 430–459.
MacDuffie, John P. 1995. Human resource bundles and manufacturing performance:
Organizational logic and flexible production systems in the world auto industry. Industrial and
Labor Relations Review 48(2): 197–221.
Macky, Keith, and Peter Boxall. 2007. The relationship between ’high-performance work
practices’ and employee attitudes: an investigation of additive and interaction effects.
International Journal of Human Resource Management 18(4): 537–567.
Madsen, Susan R., Duane Miller, and Cameron R. John. 2005. Readiness for organizational
change: do organizational commitment and social relationships in the workplace make a
difference. Human Resource Development Quarterly 16(2): 213–233.
Martin, Ludivine. 2016. High involvement management practices, technology use, work
motivation and job search behaviour. LISER Working Papers 2016.
Martin, Ludivine, and Nessrine Omrani. 2015. An assessment of trends in technology use,
innovative work practices and employees’ attitudes in Europe. Applied Economics 47(6): 623–
638.
Mathieu, John, and Dennis M. Zajac. 1990. A review of meta-analysis of the antecedents,
correlates and consequences of organizational commitment. Psychological Bulletin 108(2):
171–194.
McGovern, Patrick, Hill, Stephen, Mills Colin and Michael White. 2007. Market, class, and
employment. Oxford: Oxford University Press.
Mohr, Robert D., and Cindy Zoghi. 2008. High-involvement work design and job satisfaction.
Industrial and Labor Relations Review 61(3): 275–296.
Mowday, Richard T., Lyman W. Porter, and Richard M. Steers. 1982. Employee-organizational
linkages. New Yok: Academic Press.
24
Neumark, David. 1988. Employers’ discriminatory behaviour and the estimation of wage
discrimination. Journal of Human Resources 23(3): 279-295.
Oaxaca, Ronald. L. 1973. Male-female wage differentials in urban labor markets. International
Economic Review 14: 693–709.
Osterman, Paul. 2000. Work reorganization in an era of restructuring: Trends in diffusion and
effects on employee welfare. Industrial and Labor Relations Review 53(2): 179–196.
Ramsay, Harvie, Dora Scholarios, and Bill Harley. 2000. Employees and high-performance work
systems: Testing inside the black box. British Journal of Industrial Relations 38(4): 501–531.
Sousa-Poza, Alfonso, and Andres A. Sousa-Poza. 2000. Taking another look at the gender/job
satisfaction paradox. Kyklos 53(2): 135–151.
Stutzer, Alois, and Bruno S. Frey. 2008. Stress that doesn’t pay: The commuting paradox.
Scandinavian Journal of Economics 110(2): 339–366.
White, Michael, and Alex Bryson. 2013. Positive employee attitudes: How much human resource
management do you need? Human Relations 66(3): 385–406.
Wood, Stephen. 1999. Human Resource Management and Performance. International Journal of
Management Reviews 1(4): 367–413.
Wood, Stephen, and Lilian M. de Menezes. 2011. High involvement management, high-
performance work systems and well-being. The International Journal of Human Resource
Management 22(7): 1586–1610.
Wu, Ning, Kim Hoque, Nicolas Bacon, and Juan Carlos Bou Llusar. 2015. High-performance
work systems and workplace performance in small, medium-sized and large firms. Human
Resource Management Journal 25(4): 408–423.
25
Appendix
Table A1. HRM, job satisfaction and organizational commitment in the empirical literature
Authors Data Population
studied
Managerial practices studied Bun-
dle
Employees attitudes Link with job satisfaction and/ or
organizational commitment
Böckerman,
Bryson and
Ilmakunnas
(2012)
The Quality of
Working Life
Survey, Finland,
2003
Employees
N=3,755 Participation
High involvement management (HIM):
Performance related pay, training, self-
management teams, information sharing
Yes absenteeism,
accidents, subjective
well-being (non-
tiredness, non-
painful, etc.), job
satisfaction
All four HIM practices are generally
positively linked with job
satisfaction
Gallie,
Felstead and
Green
(2001)
Employment in
Britain Survey in
1992 and Skills
Survey in 1997
Employees
N=3,469 in
1992
and
N=2,224 in
1997
Participation
Supervisor, pay incentives, reports/appraisals,
quality circles, information meetings,
discussion meetings, task discretion
No Organizational
commitment
HRM practices are generally
positively linked with
organizational commitment
Godard
(2001)
Author’s survey,
Canada, 1997-
1998
Employees
N=508 Participation
Alternative work practices (AWP): just-in-
time, re-engineering, quality management
On-line AWPs: team-based work system, team
autonomy, team responsibility for a good or
service, multi-skilling, job rotation
Off-line AWPs: informational sharing, quality
circles, a committee system, a joint steering
committee
Economic AWPs: profit-sharing, group bonus
Yes Belongingness, task
involvement,
empowerment,
workload,
stressfulness, fatigue,
self-esteem,
motivation,
organizational
citizenship behaviour,
job satisfaction,
commitment
Moderate levels of involvement in
HRM practices are associated with
increased job satisfaction and
commitment. But, at higher level,
the association with job satisfaction
become negative.
Godard
(2010)
Author’s survey,
Canada
(excluding
Québec), 2003-
2004
Employees
N=750 Exposure
Alternative work practices (AWPs): re-
engineering, quality management, job rotation,
multi-skilling, team-work, team autonomy,
team responsibility, information sharing,
quality circles, steering committee, group
bonus, gain sharing
New Human Resources Practices (HRPs):
values-based selection, social⁄team skills
training, regular (developmental) appraisals,
Yes Stress, fatigue,
coercion,
empowerment, job
satisfaction,
commitment
AWPs are positively linked with job
satisfaction and commitment.
New HRPs are positively associated
with job satisfaction and unrelated
with commitment.
Traditional HRPs are positively
linked with job satisfaction and
commitment.
26
career planning, continuous learning, minimal
status distinctions (i.e., “single status” policies)
Traditional HRPs: skills-based selection, a
formal orientation session once hired, job-
based technical training, internal job ladders
with seniority-based advancement, grievance
or “internal justice” systems, job- and
seniority-based pay, good benefits, job security
rights
Guest (1999) Annual survey of
employment
relations, United
Kingdom, 1997
Employees
N=1,000 Participation
HRM practices: opportunities to raise personal
concerns, opportunities for training and
development, being informed about business
issues, policy of single status, systems for
dealing with bullying and harassment at work,
involvement in decision-making, policy of
deliberately avoiding compulsory
redundancies and lay-offs, pay related to
performance, profit sharing, taking part in a
staff attitude survey
Yes Job security, pressure
at work, motivation
and job satisfaction
HRM practices have an indirect
positive impact on job satisfaction
through the state of the
psychological contract and the high
involvement climate.
Guest (2002) Annual survey of
employment
relations, United
Kingdom, 2001
Employees
N=2,000 Participation
HRM practices: equal opportunity practices,
anti-harassment practices, information sharing,
training and development, no compulsory
redundancies, performance appraisal, family-
friendly practices, challenging/interesting jobs,
vacancies filled from inside, employee
involvement activities, performance-related
pay
No Job satisfaction and
life satisfaction
Equal opportunity practices, anti-
harassment practices, information
sharing, family-friendly practices,
challenging/interesting jobs are
positively related to job satisfaction.
Kalmi and
Kauhanen
(2008)
The Quality of
Work Life Survey
(QWLS), Finland,
2003
Employees
N=3,611 Participation
High involvement management (HIM): self-
managed teams, information sharing, incentive
pay, training, traditional teams
Yes Job intensity, job
influence, job
security, wages,
stress, job satisfaction
HIM practices are generally
positively linked with beneficial
outcomes
Macky and
Boxall
(2007)
Authors’ survey,
New Zealand,
2006
Employees
N=424 Participation
High Performance Work Practices (HPWP):
performance-based pay, teams, employee
involvement activities, reduced status
differentials, internal promotion, performance
Yes Trust in management,
job satisfaction,
(affective and
behavioural)
commitment
Positive relationship between a high
level of participation in HPWP and
job satisfaction and commitment.
27
and development appraisal, information
sharing, attitude surveys, no compulsory
redundancies, formal training, formal
complaint resolution systems, targeted
selection, merit-based promotion, formal job
descriptions
Martin
(2016)
Survey on
working
conditions and
quality of work
life, Luxembourg,
2013
Employees
N=14,248 Participation
High involvement management (HIM):
Performance related pay, training, self-
management teams, information sharing
Yes Motivation at work,
on-the-job-search, job
satisfaction
Positive relationship between a high
level of HIM participation and job
satisfaction
Martin and
Omrani
(2015)
The European
Working
Condition Survey
(EWCS), 16
European
countries, 2005
and 2010
Employees
N=9,640 in
2005
and
N=14,152 in
2010
Participation
Innovative work practices: flexible work
schedule, total quality management, formal
appraisal, self-assessment of work, job
rotation, telework, team work, performance
related pay, type of control
No Social support, extra-
effort, job satisfaction
Most of the innovative work
practices considered are positively
related to job satisfaction
Mohr and
Zoghi (2008)
Workplace and
Employee Survey
(WES), Canada,
1999-2002
Employees
N= about
25,000
Participation
High involvement work practices:
employee survey, suggestion program, job
rotation, informed about workplace changes,
task team, quality circle, self-directed work
group
Yes Job satisfaction,
stress, absenteeism
filed grievance, no
training
Most of the work practices
considered are positively associated
with job satisfaction.
Ramsay,
Scholarios,
and Harley
(2000)
Workplace
Employment
Relations Survey
(WERS), Britain,
1998
Workplaces
and
employees
N=about
1,500
workplaces
N=about
16,000
employees
Exposure
High Performance Work Practices (HPWP):
upward communication, performance-related
pay, profit-sharing, employee share ownership,
problem-solving groups, employee
consultation, job control, team autonomy,
investors in people accreditation, total quality
management, internal labour market,
induction, job security
Yes Job discretion,
management
relations, pay
satisfaction,
perceived security,
job strain,
commitment
Participating in a high number of
HPWP is positively associated with
commitment.
28
White and
Bryson
(2013)
Workplace
Employment
Relations Survey
(WERS), Britain,
2004
Workplaces
and
employees
N=11,854
employees
Exposure
HRM: participation (meetings, surveys,
committee), team working (including quality
circle), development (training), selection
(recruitment practices), incentives (bonus)
Yes Job satisfaction,
organizational
commitment
Non-linear relationship between the
number of HRM practices and job
satisfaction and commitment (J-
shaped)
Wood and
De Menezes
(2011)
Workplace
employment
relations survey
(WERS), Britain,
2004
Workplaces
and
employees
N= about
17,000
employees
Exposure
HRM: supportive management, informative
management, consultative management,
consultation, high involvement management,
internal recruitment, job security, performance-
related pay (individual, group)
No Job satisfaction,
anxiety-contentment
Only supportive management,
informative management,
consultative management are
positively related to job satisfaction
29
Table A2. Variables used to create the HRM bundles
Workplace Employee
Participation in the
organizational
life
Meeting
between
management
and the staff
What is the frequency of meetings
between senior management and all
employees?
Annually, Biannually, Quarterly or
Monthly = 1; Less than once per
year = 0
As regards information and
communication within your
company, how do you rate the
usefulness of meeting(s) between
employees and management?
Very useful or Moderately useful =
1; not useful or does not exist = 0
Changes with
employees
involved
From your experience, what
percentage of the total duration of
these meetings is used by
employees in order to express
themselves or ask questions?
Up to a quarter of the time; Up to
half of the time or More than half
the time = 1; No time = 0
Do you participate in decisions
concerning major changes within
your company? Yes = 1; No = 0
Attitude
surveys
Does senior management seek to
stimulate employees’ participation
by Internal survey(s)?
Yes = 1; No = 0
As regards information and
communication within your
company, how do you rate the
usefulness of Internal survey(s)
organized by the management?
Very useful or Moderately useful =
1; Not useful or Does not exist = 0
Team
working
Autonomous
team work
What proportion of the employees
(not senior executives) currently
works in a team where the members
jointly decide how work is done?
At least 25% = 1 ; 0-24% = 0
Based on two survey questions:
Work in a team of at least 3 people
whose members supervise team
work = 1; otherwise = 0
Quality circle What proportion of employees is
currently involved in groups who
meet voluntarily and regularly to
identify and solve problems related
to their work?
At least 25% = 1 ; 0-24% = 0
Are you involved in a group which
meets regularly to identify and
resolve problems related to its
work? (quality groups or quality
circles)
Yes = 1; No = 0
Job rotation Are your employees (not senior
executives) able to perform the
tasks of other colleagues in their
absence?
Yes, at the team level; Yes, for all
positions = 1 ; Only for some
strategic jobs or no = 0
When you are absent for one week,
what proportion of your tasks must
you catch up on when you return?
Nothing or just a small proportion;
Less than half = 1; More than half or
Almost all my work = 0
Development
Development
included in the
strategy
Does your enterprise have internal
mechanisms to encourage
employees to develop their skills
and their career?
Yes = 1; No = 0
Do you agree or disagree with the
following statement: My company
encourages its staff to develop their
competences and their careers?
Agree or Strongly agree = 1 ;
Strongly disagree or Disagree = 0
Training In 2012, what proportion of
employees (not senior executives)
has received training days taken on
working time?
At least 25% = 1 ; 0-24% = 0
In the last 12 months, have you
attend training related to your work
paid by your company?
Yes = 1; No = 0
Appraisal Among your employees (not senior
executives), how many benefit from
an annual appraisal?
At least 25% = 1 ; 0-24% = 0
In the last 12 months, did you have
at least one appraisal interview?
Yes = 1; No = 0
30
Family-
friendly
Flexible
working hours
What proportion of the employees
(not senior executives) can choose
the time at which they begin and end
their work day?
At least 25% = 1 ; 0-24% = 0
Do you have flexible working hours
(you decide yourself when you start
and stop work, taking into account
certain daily fixed time slots)?
Yes = 1; No = 0
Work-life
balance
Does the following extra-legal
benefits are offered to your
employees (not senior executives)?
At least one of the following: slot in
a childcare centre; financial
assistance for childcare; financial
assistance to take care of the elderly
and / or disabled; days off for family
reasons above the legal minimum =
1; otherwise = 0
Do you agree or disagree with the
following statement: My company
implements policies which permit a
good work-life balance?
Agree or Strongly agree = 1;
Strongly disagree or Disagree = 0
Working at
home in work
hours
Do the following arrangements on
employees' working time (not
senior executives) exist in your
enterprise: Working at home in
normal working hours? Yes, for
most employees or yes, but only for
some employees = 1; No = 0
Does your company permit you to
do working at (or from) home in
normal working hours? If yes, do
you make use of this possibility?
Sometimes or often = 1; Never=0
Incentives
Individual pay
incentive
Does your compensation system
include premiums or bonuses linked
to individual performance?
Yes = 1; No = 0
Do you have a fixed or variable
salary (depending on productivity
...)?
Variable or Fixed + a variable
element = 1; Fixed =0
Fringe benefits Does the following fringe benefits
are offered to your employees (not
senior executives)? At least one of
the following: company car or car
fee participation; supplementary
pension or life insurance; meal
vouchers = 1; otherwise = 0
Do the following fringe benefits are
offered to you? At least one of the
following: company car or car fee
participation; supplementary
pension or life insurance; meal
vouchers = 1; otherwise = 0
Table A3. Descriptive statistics
Mean T-test p-value
Whole
sample LL HL LH HH
HH
versus
LL
HH
versus
HL
HH
versus
LH
Job satisfaction (0-10) 6.30
(2.18) 5.46 5.59 7.03 6.93 0.00 0.00 0.10
Organizational commitment
(3-12)
8.22
(2.00) 7.41 7.60 8.83 8.82 0.00 0.00 0.74
Individual characteristics
Male 0.69 0.65 0.67 0.76 0.68 0.06 0.33 0.00
Age
16-30 years 0.18 0.17 0.16 0.18 0.20 0.00 0.00 0.03
30-49 years 0.65 0.63 0.68 0.65 0.65 0.12 0.05 0.84
50 years and more 0.17 0.20 0.16 0.17 0.15 0.00 0.26 0.01
Nationality
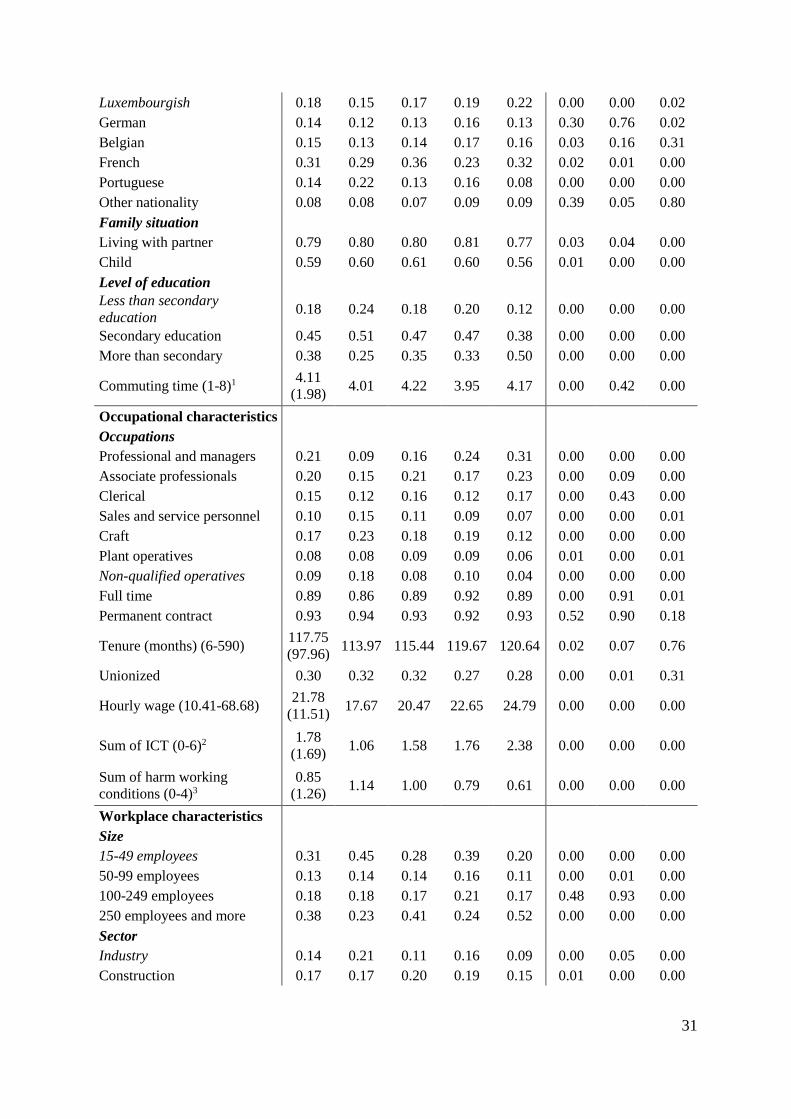
31
Luxembourgish 0.18 0.15 0.17 0.19 0.22 0.00 0.00 0.02
German 0.14 0.12 0.13 0.16 0.13 0.30 0.76 0.02
Belgian 0.15 0.13 0.14 0.17 0.16 0.03 0.16 0.31
French 0.31 0.29 0.36 0.23 0.32 0.02 0.01 0.00
Portuguese 0.14 0.22 0.13 0.16 0.08 0.00 0.00 0.00
Other nationality 0.08 0.08 0.07 0.09 0.09 0.39 0.05 0.80
Family situation
Living with partner 0.79 0.80 0.80 0.81 0.77 0.03 0.04 0.00
Child 0.59 0.60 0.61 0.60 0.56 0.01 0.00 0.00
Level of education
Less than secondary
education 0.18 0.24 0.18 0.20 0.12 0.00 0.00 0.00
Secondary education 0.45 0.51 0.47 0.47 0.38 0.00 0.00 0.00
More than secondary 0.38 0.25 0.35 0.33 0.50 0.00 0.00 0.00
Commuting time (1-8)1 4.11
(1.98) 4.01 4.22 3.95 4.17 0.00 0.42 0.00
Occupational characteristics
Occupations
Professional and managers 0.21 0.09 0.16 0.24 0.31 0.00 0.00 0.00
Associate professionals 0.20 0.15 0.21 0.17 0.23 0.00 0.09 0.00
Clerical 0.15 0.12 0.16 0.12 0.17 0.00 0.43 0.00
Sales and service personnel 0.10 0.15 0.11 0.09 0.07 0.00 0.00 0.01
Craft 0.17 0.23 0.18 0.19 0.12 0.00 0.00 0.00
Plant operatives 0.08 0.08 0.09 0.09 0.06 0.01 0.00 0.01
Non-qualified operatives 0.09 0.18 0.08 0.10 0.04 0.00 0.00 0.00
Full time 0.89 0.86 0.89 0.92 0.89 0.00 0.91 0.01
Permanent contract 0.93 0.94 0.93 0.92 0.93 0.52 0.90 0.18
Tenure (months) (6-590) 117.75
(97.96) 113.97 115.44 119.67 120.64 0.02 0.07 0.76
Unionized 0.30 0.32 0.32 0.27 0.28 0.00 0.01 0.31
Hourly wage (10.41-68.68) 21.78
(11.51) 17.67 20.47 22.65 24.79 0.00 0.00 0.00
Sum of ICT (0-6)2 1.78
(1.69) 1.06 1.58 1.76 2.38 0.00 0.00 0.00
Sum of harm working
conditions (0-4)3
0.85
(1.26) 1.14 1.00 0.79 0.61 0.00 0.00 0.00
Workplace characteristics
Size
15-49 employees 0.31 0.45 0.28 0.39 0.20 0.00 0.00 0.00
50-99 employees 0.13 0.14 0.14 0.16 0.11 0.00 0.01 0.00
100-249 employees 0.18 0.18 0.17 0.21 0.17 0.48 0.93 0.00
250 employees and more 0.38 0.23 0.41 0.24 0.52 0.00 0.00 0.00
Sector
Industry 0.14 0.21 0.11 0.16 0.09 0.00 0.05 0.00
Construction 0.17 0.17 0.20 0.19 0.15 0.01 0.00 0.00
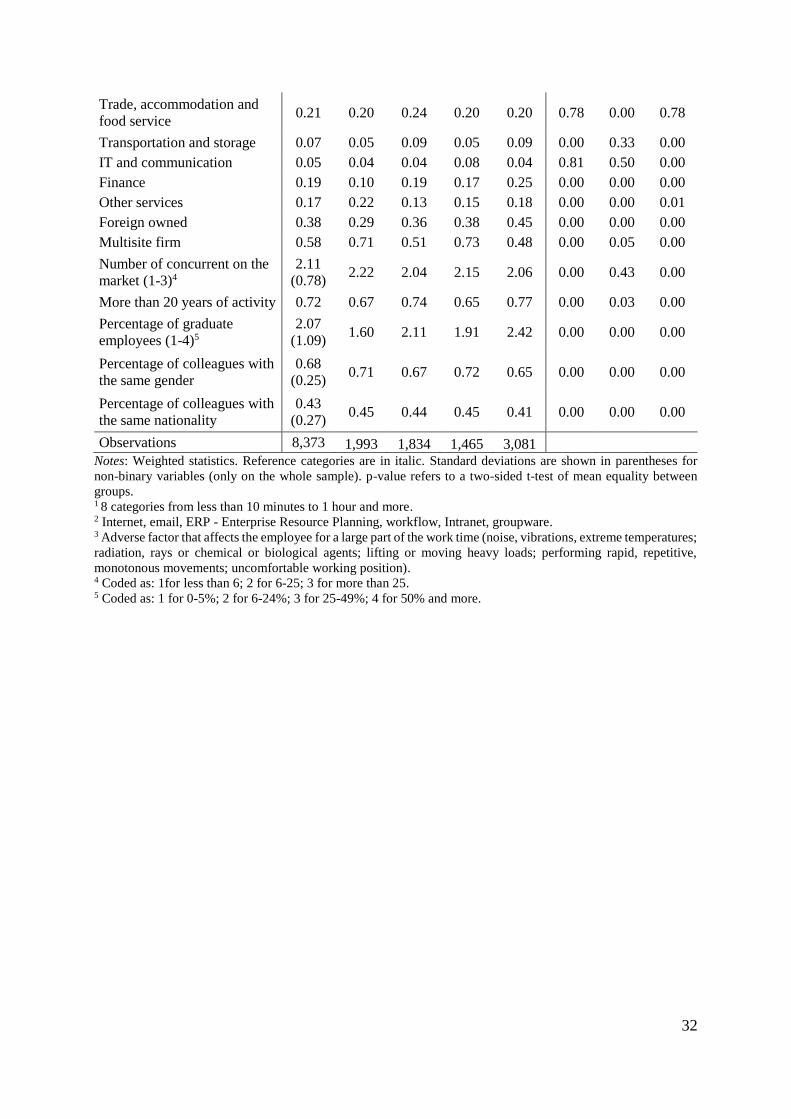
32
Trade, accommodation and
food service 0.21 0.20 0.24 0.20 0.20 0.78 0.00 0.78
Transportation and storage 0.07 0.05 0.09 0.05 0.09 0.00 0.33 0.00
IT and communication 0.05 0.04 0.04 0.08 0.04 0.81 0.50 0.00
Finance 0.19 0.10 0.19 0.17 0.25 0.00 0.00 0.00
Other services 0.17 0.22 0.13 0.15 0.18 0.00 0.00 0.01
Foreign owned 0.38 0.29 0.36 0.38 0.45 0.00 0.00 0.00
Multisite firm 0.58 0.71 0.51 0.73 0.48 0.00 0.05 0.00
Number of concurrent on the
market (1-3)4
2.11
(0.78) 2.22 2.04 2.15 2.06 0.00 0.43 0.00
More than 20 years of activity 0.72 0.67 0.74 0.65 0.77 0.00 0.03 0.00
Percentage of graduate
employees (1-4)5
2.07
(1.09) 1.60 2.11 1.91 2.42 0.00 0.00 0.00
Percentage of colleagues with
the same gender
0.68
(0.25) 0.71 0.67 0.72 0.65 0.00 0.00 0.00
Percentage of colleagues with
the same nationality
0.43
(0.27) 0.45 0.44 0.45 0.41 0.00 0.00 0.00
Observations 8,373 1,993 1,834 1,465 3,081
Notes: Weighted statistics. Reference categories are in italic. Standard deviations are shown in parentheses for
non-binary variables (only on the whole sample). p-value refers to a two-sided t-test of mean equality between
groups. 1 8 categories from less than 10 minutes to 1 hour and more.
2 Internet, email, ERP - Enterprise Resource Planning, workflow, Intranet, groupware. 3 Adverse factor that affects the employee for a large part of the work time (noise, vibrations, extreme temperatures;
radiation, rays or chemical or biological agents; lifting or moving heavy loads; performing rapid, repetitive,
monotonous movements; uncomfortable working position). 4 Coded as: 1for less than 6; 2 for 6-25; 3 for more than 25. 5 Coded as: 1 for 0-5%; 2 for 6-24%; 3 for 25-49%; 4 for 50% and more.
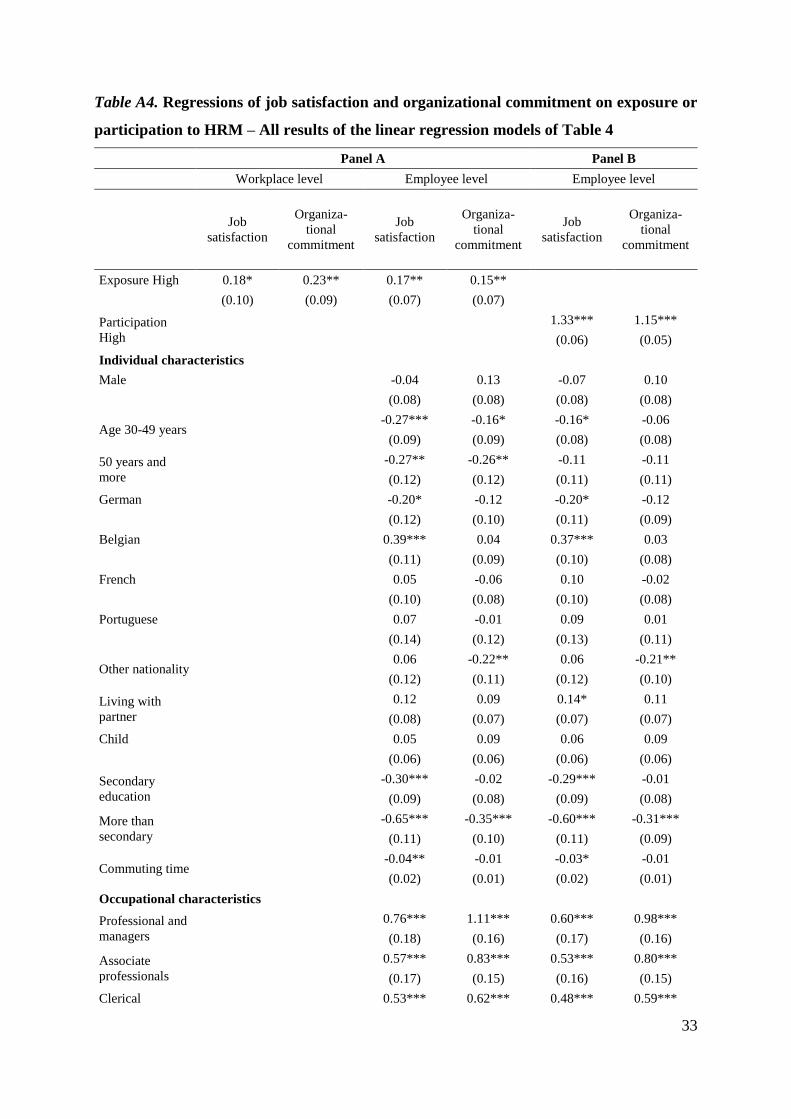
33
Table A4. Regressions of job satisfaction and organizational commitment on exposure or
participation to HRM – All results of the linear regression models of Table 4
Panel A Panel B
Workplace level Employee level Employee level
Job
satisfaction
Organiza-
tional
commitment
Job
satisfaction
Organiza-
tional
commitment
Job
satisfaction
Organiza-
tional
commitment
Exposure High 0.18* 0.23** 0.17** 0.15**
(0.10) (0.09) (0.07) (0.07)
Participation
High
1.33*** 1.15***
(0.06) (0.05)
Individual characteristics
Male -0.04 0.13 -0.07 0.10
(0.08) (0.08) (0.08) (0.08)
Age 30-49 years -0.27*** -0.16* -0.16* -0.06
(0.09) (0.09) (0.08) (0.08)
50 years and
more
-0.27** -0.26** -0.11 -0.11
(0.12) (0.12) (0.11) (0.11)
German -0.20* -0.12 -0.20* -0.12
(0.12) (0.10) (0.11) (0.09)
Belgian 0.39*** 0.04 0.37*** 0.03
(0.11) (0.09) (0.10) (0.08)
French 0.05 -0.06 0.10 -0.02
(0.10) (0.08) (0.10) (0.08)
Portuguese 0.07 -0.01 0.09 0.01
(0.14) (0.12) (0.13) (0.11)
Other nationality 0.06 -0.22** 0.06 -0.21**
(0.12) (0.11) (0.12) (0.10)
Living with
partner
0.12 0.09 0.14* 0.11
(0.08) (0.07) (0.07) (0.07)
Child 0.05 0.09 0.06 0.09
(0.06) (0.06) (0.06) (0.06)
Secondary
education
-0.30*** -0.02 -0.29*** -0.01
(0.09) (0.08) (0.09) (0.08)
More than
secondary
-0.65*** -0.35*** -0.60*** -0.31***
(0.11) (0.10) (0.11) (0.09)
Commuting time -0.04** -0.01 -0.03* -0.01
(0.02) (0.01) (0.02) (0.01)
Occupational characteristics
Professional and
managers
0.76*** 1.11*** 0.60*** 0.98***
(0.18) (0.16) (0.17) (0.16)
Associate
professionals
0.57*** 0.83*** 0.53*** 0.80***
(0.17) (0.15) (0.16) (0.15)
Clerical 0.53*** 0.62*** 0.48*** 0.59***
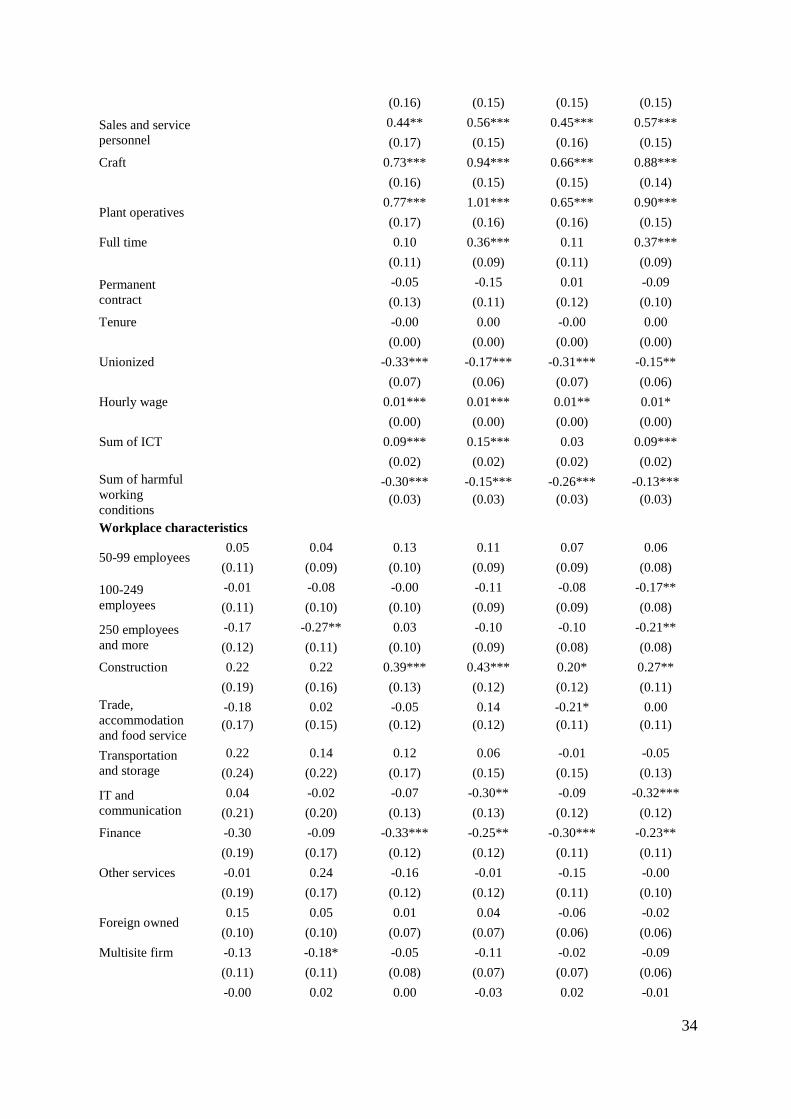
34
(0.16) (0.15) (0.15) (0.15)
Sales and service
personnel
0.44** 0.56*** 0.45*** 0.57***
(0.17) (0.15) (0.16) (0.15)
Craft 0.73*** 0.94*** 0.66*** 0.88***
(0.16) (0.15) (0.15) (0.14)
Plant operatives 0.77*** 1.01*** 0.65*** 0.90***
(0.17) (0.16) (0.16) (0.15)
Full time 0.10 0.36*** 0.11 0.37***
(0.11) (0.09) (0.11) (0.09)
Permanent
contract
-0.05 -0.15 0.01 -0.09
(0.13) (0.11) (0.12) (0.10)
Tenure -0.00 0.00 -0.00 0.00
(0.00) (0.00) (0.00) (0.00)
Unionized -0.33*** -0.17*** -0.31*** -0.15**
(0.07) (0.06) (0.07) (0.06)
Hourly wage 0.01*** 0.01*** 0.01** 0.01*
(0.00) (0.00) (0.00) (0.00)
Sum of ICT 0.09*** 0.15*** 0.03 0.09***
(0.02) (0.02) (0.02) (0.02)
Sum of harmful
working
conditions
-0.30*** -0.15*** -0.26*** -0.13***
(0.03) (0.03) (0.03) (0.03)
Workplace characteristics
50-99 employees 0.05 0.04 0.13 0.11 0.07 0.06
(0.11) (0.09) (0.10) (0.09) (0.09) (0.08)
100-249
employees
-0.01 -0.08 -0.00 -0.11 -0.08 -0.17**
(0.11) (0.10) (0.10) (0.09) (0.09) (0.08)
250 employees
and more
-0.17 -0.27** 0.03 -0.10 -0.10 -0.21**
(0.12) (0.11) (0.10) (0.09) (0.08) (0.08)
Construction 0.22 0.22 0.39*** 0.43*** 0.20* 0.27**
(0.19) (0.16) (0.13) (0.12) (0.12) (0.11)
Trade,
accommodation
and food service
-0.18 0.02 -0.05 0.14 -0.21* 0.00
(0.17) (0.15) (0.12) (0.12) (0.11) (0.11)
Transportation
and storage
0.22 0.14 0.12 0.06 -0.01 -0.05
(0.24) (0.22) (0.17) (0.15) (0.15) (0.13)
IT and
communication
0.04 -0.02 -0.07 -0.30** -0.09 -0.32***
(0.21) (0.20) (0.13) (0.13) (0.12) (0.12)
Finance -0.30 -0.09 -0.33*** -0.25** -0.30*** -0.23**
(0.19) (0.17) (0.12) (0.12) (0.11) (0.11)
Other services -0.01 0.24 -0.16 -0.01 -0.15 -0.00
(0.19) (0.17) (0.12) (0.12) (0.11) (0.10)
Foreign owned 0.15 0.05 0.01 0.04 -0.06 -0.02
(0.10) (0.10) (0.07) (0.07) (0.06) (0.06)
Multisite firm -0.13 -0.18* -0.05 -0.11 -0.02 -0.09
(0.11) (0.11) (0.08) (0.07) (0.07) (0.06)
-0.00 0.02 0.00 -0.03 0.02 -0.01
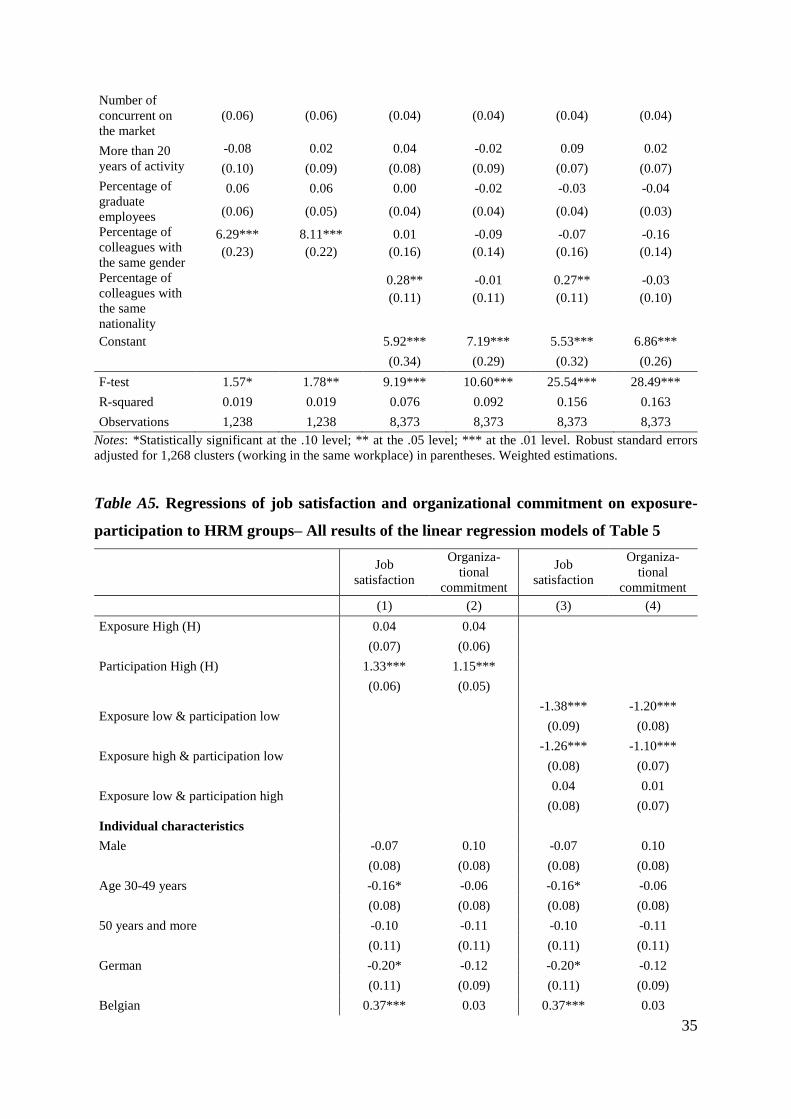
35
Number of
concurrent on
the market
(0.06) (0.06) (0.04) (0.04) (0.04) (0.04)
More than 20
years of activity
-0.08 0.02 0.04 -0.02 0.09 0.02
(0.10) (0.09) (0.08) (0.09) (0.07) (0.07)
Percentage of
graduate
employees
0.06 0.06 0.00 -0.02 -0.03 -0.04
(0.06) (0.05) (0.04) (0.04) (0.04) (0.03)
Percentage of
colleagues with
the same gender
6.29*** 8.11*** 0.01 -0.09 -0.07 -0.16
(0.23) (0.22) (0.16) (0.14) (0.16) (0.14)
Percentage of
colleagues with
the same
nationality
0.28** -0.01 0.27** -0.03
(0.11) (0.11) (0.11) (0.10)
Constant 5.92*** 7.19*** 5.53*** 6.86***
(0.34) (0.29) (0.32) (0.26)
F-test 1.57* 1.78** 9.19*** 10.60*** 25.54*** 28.49***
R-squared 0.019 0.019 0.076 0.092 0.156 0.163
Observations 1,238 1,238 8,373 8,373 8,373 8,373
Notes: *Statistically significant at the .10 level; ** at the .05 level; *** at the .01 level. Robust standard errors
adjusted for 1,268 clusters (working in the same workplace) in parentheses. Weighted estimations.
Table A5. Regressions of job satisfaction and organizational commitment on exposure-
participation to HRM groups– All results of the linear regression models of Table 5
Job
satisfaction
Organiza-
tional
commitment
Job
satisfaction
Organiza-
tional
commitment
(1) (2) (3) (4)
Exposure High (H) 0.04 0.04
(0.07) (0.06)
Participation High (H) 1.33*** 1.15***
(0.06) (0.05)
Exposure low & participation low -1.38*** -1.20***
(0.09) (0.08)
Exposure high & participation low -1.26*** -1.10***
(0.08) (0.07)
Exposure low & participation high 0.04 0.01
(0.08) (0.07)
Individual characteristics
Male -0.07 0.10 -0.07 0.10
(0.08) (0.08) (0.08) (0.08)
Age 30-49 years -0.16* -0.06 -0.16* -0.06
(0.08) (0.08) (0.08) (0.08)
50 years and more -0.10 -0.11 -0.10 -0.11
(0.11) (0.11) (0.11) (0.11)
German -0.20* -0.12 -0.20* -0.12
(0.11) (0.09) (0.11) (0.09)
Belgian 0.37*** 0.03 0.37*** 0.03
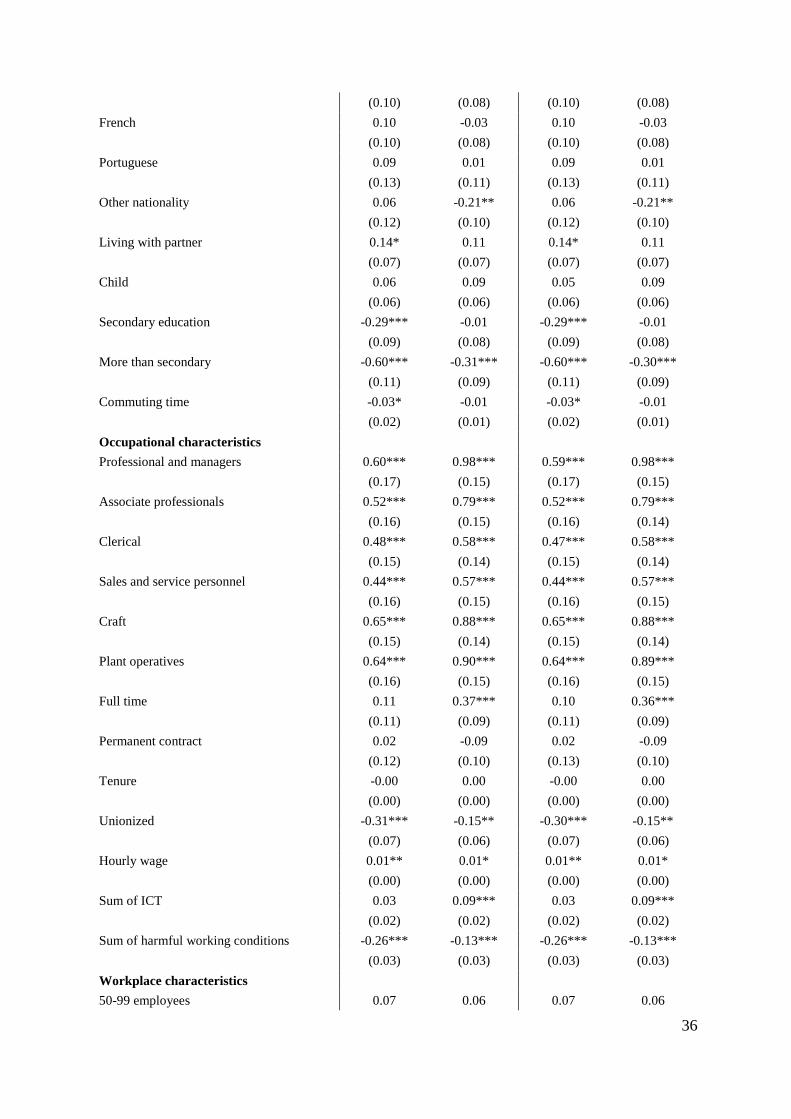
36
(0.10) (0.08) (0.10) (0.08)
French 0.10 -0.03 0.10 -0.03
(0.10) (0.08) (0.10) (0.08)
Portuguese 0.09 0.01 0.09 0.01
(0.13) (0.11) (0.13) (0.11)
Other nationality 0.06 -0.21** 0.06 -0.21**
(0.12) (0.10) (0.12) (0.10)
Living with partner 0.14* 0.11 0.14* 0.11
(0.07) (0.07) (0.07) (0.07)
Child 0.06 0.09 0.05 0.09
(0.06) (0.06) (0.06) (0.06)
Secondary education -0.29*** -0.01 -0.29*** -0.01
(0.09) (0.08) (0.09) (0.08)
More than secondary -0.60*** -0.31*** -0.60*** -0.30***
(0.11) (0.09) (0.11) (0.09)
Commuting time -0.03* -0.01 -0.03* -0.01
(0.02) (0.01) (0.02) (0.01)
Occupational characteristics
Professional and managers 0.60*** 0.98*** 0.59*** 0.98***
(0.17) (0.15) (0.17) (0.15)
Associate professionals 0.52*** 0.79*** 0.52*** 0.79***
(0.16) (0.15) (0.16) (0.14)
Clerical 0.48*** 0.58*** 0.47*** 0.58***
(0.15) (0.14) (0.15) (0.14)
Sales and service personnel 0.44*** 0.57*** 0.44*** 0.57***
(0.16) (0.15) (0.16) (0.15)
Craft 0.65*** 0.88*** 0.65*** 0.88***
(0.15) (0.14) (0.15) (0.14)
Plant operatives 0.64*** 0.90*** 0.64*** 0.89***
(0.16) (0.15) (0.16) (0.15)
Full time 0.11 0.37*** 0.10 0.36***
(0.11) (0.09) (0.11) (0.09)
Permanent contract 0.02 -0.09 0.02 -0.09
(0.12) (0.10) (0.13) (0.10)
Tenure -0.00 0.00 -0.00 0.00
(0.00) (0.00) (0.00) (0.00)
Unionized -0.31*** -0.15** -0.30*** -0.15**
(0.07) (0.06) (0.07) (0.06)
Hourly wage 0.01** 0.01* 0.01** 0.01*
(0.00) (0.00) (0.00) (0.00)
Sum of ICT 0.03 0.09*** 0.03 0.09***
(0.02) (0.02) (0.02) (0.02)
Sum of harmful working conditions -0.26*** -0.13*** -0.26*** -0.13***
(0.03) (0.03) (0.03) (0.03)
Workplace characteristics
50-99 employees 0.07 0.06 0.07 0.06
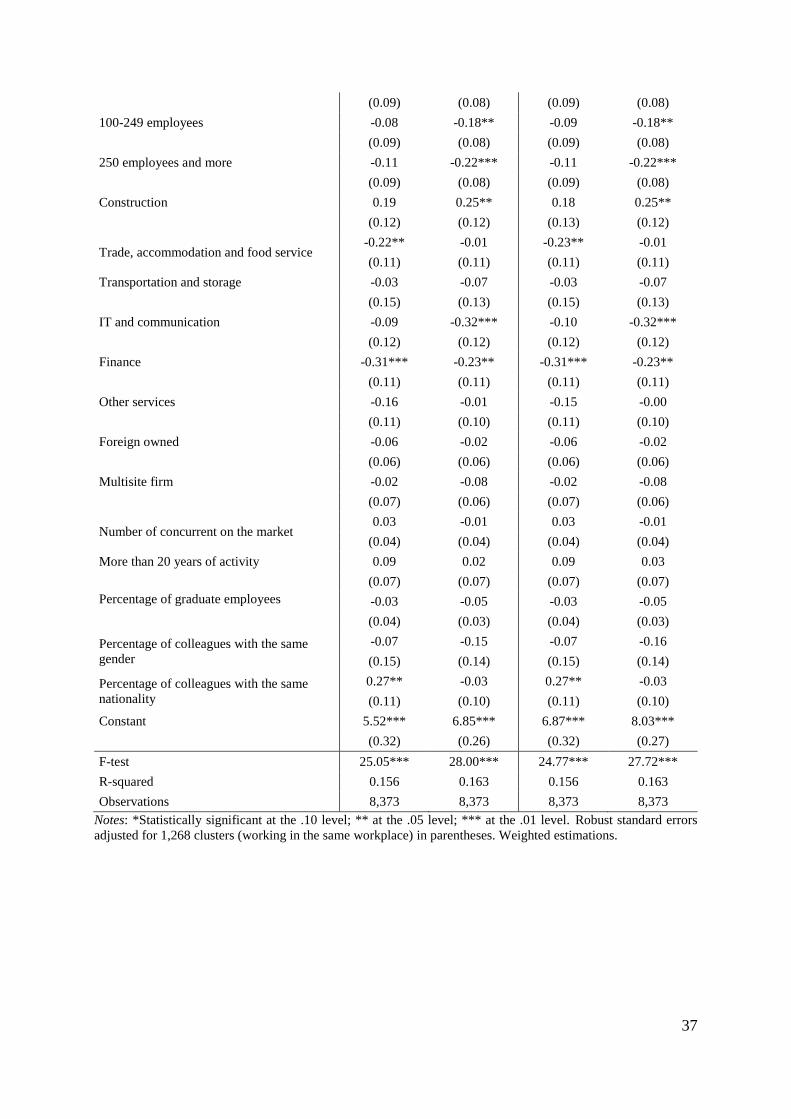
37
(0.09) (0.08) (0.09) (0.08)
100-249 employees -0.08 -0.18** -0.09 -0.18**
(0.09) (0.08) (0.09) (0.08)
250 employees and more -0.11 -0.22*** -0.11 -0.22***
(0.09) (0.08) (0.09) (0.08)
Construction 0.19 0.25** 0.18 0.25**
(0.12) (0.12) (0.13) (0.12)
Trade, accommodation and food service -0.22** -0.01 -0.23** -0.01
(0.11) (0.11) (0.11) (0.11)
Transportation and storage -0.03 -0.07 -0.03 -0.07
(0.15) (0.13) (0.15) (0.13)
IT and communication -0.09 -0.32*** -0.10 -0.32***
(0.12) (0.12) (0.12) (0.12)
Finance -0.31*** -0.23** -0.31*** -0.23**
(0.11) (0.11) (0.11) (0.11)
Other services -0.16 -0.01 -0.15 -0.00
(0.11) (0.10) (0.11) (0.10)
Foreign owned -0.06 -0.02 -0.06 -0.02
(0.06) (0.06) (0.06) (0.06)
Multisite firm -0.02 -0.08 -0.02 -0.08
(0.07) (0.06) (0.07) (0.06)
Number of concurrent on the market 0.03 -0.01 0.03 -0.01
(0.04) (0.04) (0.04) (0.04)
More than 20 years of activity 0.09 0.02 0.09 0.03
(0.07) (0.07) (0.07) (0.07)
Percentage of graduate employees -0.03 -0.05 -0.03 -0.05
(0.04) (0.03) (0.04) (0.03)
Percentage of colleagues with the same
gender
-0.07 -0.15 -0.07 -0.16
(0.15) (0.14) (0.15) (0.14)
Percentage of colleagues with the same
nationality
0.27** -0.03 0.27** -0.03
(0.11) (0.10) (0.11) (0.10)
Constant 5.52*** 6.85*** 6.87*** 8.03***
(0.32) (0.26) (0.32) (0.27)
F-test 25.05*** 28.00*** 24.77*** 27.72***
R-squared 0.156 0.163 0.156 0.163
Observations 8,373 8,373 8,373 8,373
Notes: *Statistically significant at the .10 level; ** at the .05 level; *** at the .01 level. Robust standard errors
adjusted for 1,268 clusters (working in the same workplace) in parentheses. Weighted estimations.
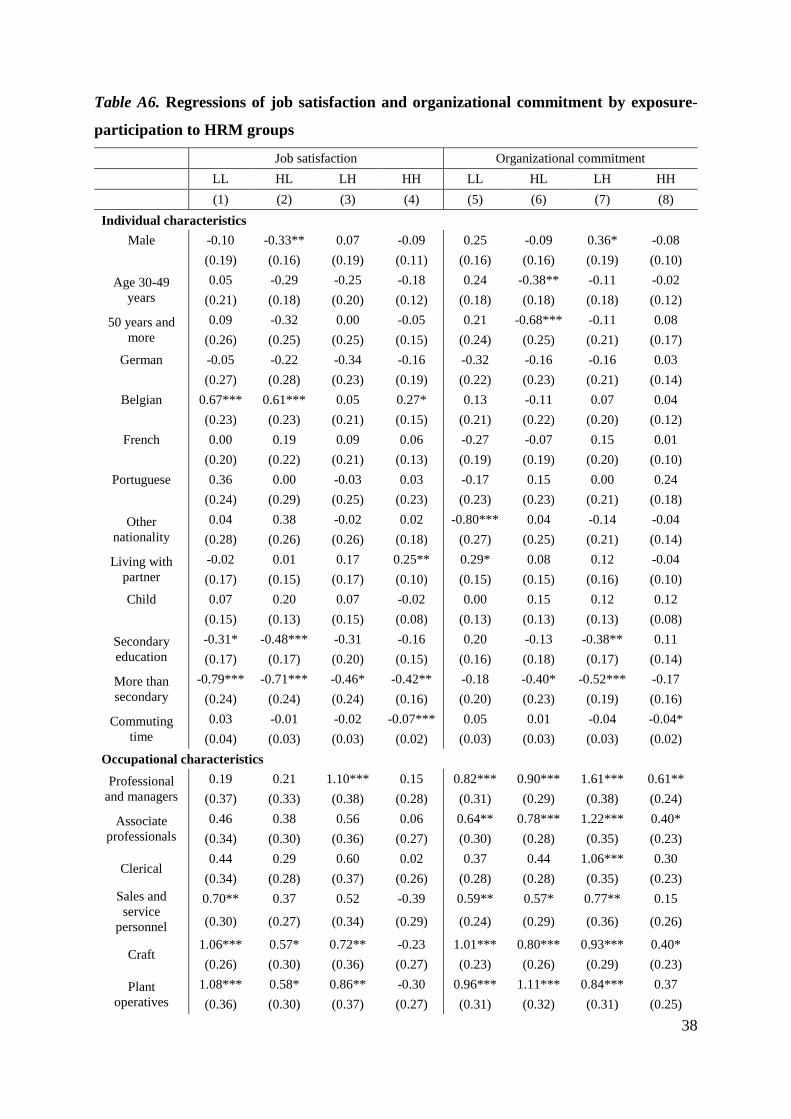
38
Table A6. Regressions of job satisfaction and organizational commitment by exposure-
participation to HRM groups
Job satisfaction Organizational commitment
LL HL LH HH LL HL LH HH
(1) (2) (3) (4) (5) (6) (7) (8)
Individual characteristics
Male -0.10 -0.33** 0.07 -0.09 0.25 -0.09 0.36* -0.08
(0.19) (0.16) (0.19) (0.11) (0.16) (0.16) (0.19) (0.10)
Age 30-49
years
0.05 -0.29 -0.25 -0.18 0.24 -0.38** -0.11 -0.02
(0.21) (0.18) (0.20) (0.12) (0.18) (0.18) (0.18) (0.12)
50 years and
more
0.09 -0.32 0.00 -0.05 0.21 -0.68*** -0.11 0.08
(0.26) (0.25) (0.25) (0.15) (0.24) (0.25) (0.21) (0.17)
German -0.05 -0.22 -0.34 -0.16 -0.32 -0.16 -0.16 0.03
(0.27) (0.28) (0.23) (0.19) (0.22) (0.23) (0.21) (0.14)
Belgian 0.67*** 0.61*** 0.05 0.27* 0.13 -0.11 0.07 0.04
(0.23) (0.23) (0.21) (0.15) (0.21) (0.22) (0.20) (0.12)
French 0.00 0.19 0.09 0.06 -0.27 -0.07 0.15 0.01
(0.20) (0.22) (0.21) (0.13) (0.19) (0.19) (0.20) (0.10)
Portuguese 0.36 0.00 -0.03 0.03 -0.17 0.15 0.00 0.24
(0.24) (0.29) (0.25) (0.23) (0.23) (0.23) (0.21) (0.18)
Other
nationality
0.04 0.38 -0.02 0.02 -0.80*** 0.04 -0.14 -0.04
(0.28) (0.26) (0.26) (0.18) (0.27) (0.25) (0.21) (0.14)
Living with
partner
-0.02 0.01 0.17 0.25** 0.29* 0.08 0.12 -0.04
(0.17) (0.15) (0.17) (0.10) (0.15) (0.15) (0.16) (0.10)
Child 0.07 0.20 0.07 -0.02 0.00 0.15 0.12 0.12
(0.15) (0.13) (0.15) (0.08) (0.13) (0.13) (0.13) (0.08)
Secondary
education
-0.31* -0.48*** -0.31 -0.16 0.20 -0.13 -0.38** 0.11
(0.17) (0.17) (0.20) (0.15) (0.16) (0.18) (0.17) (0.14)
More than
secondary
-0.79*** -0.71*** -0.46* -0.42** -0.18 -0.40* -0.52*** -0.17
(0.24) (0.24) (0.24) (0.16) (0.20) (0.23) (0.19) (0.16)
Commuting
time
0.03 -0.01 -0.02 -0.07*** 0.05 0.01 -0.04 -0.04*
(0.04) (0.03) (0.03) (0.02) (0.03) (0.03) (0.03) (0.02)
Occupational characteristics
Professional
and managers
0.19 0.21 1.10*** 0.15 0.82*** 0.90*** 1.61*** 0.61**
(0.37) (0.33) (0.38) (0.28) (0.31) (0.29) (0.38) (0.24)
Associate
professionals
0.46 0.38 0.56 0.06 0.64** 0.78*** 1.22*** 0.40*
(0.34) (0.30) (0.36) (0.27) (0.30) (0.28) (0.35) (0.23)
Clerical 0.44 0.29 0.60 0.02 0.37 0.44 1.06*** 0.30
(0.34) (0.28) (0.37) (0.26) (0.28) (0.28) (0.35) (0.23)
Sales and
service
personnel
0.70** 0.37 0.52 -0.39 0.59** 0.57* 0.77** 0.15
(0.30) (0.27) (0.34) (0.29) (0.24) (0.29) (0.36) (0.26)
Craft 1.06*** 0.57* 0.72** -0.23 1.01*** 0.80*** 0.93*** 0.40*
(0.26) (0.30) (0.36) (0.27) (0.23) (0.26) (0.29) (0.23)
Plant
operatives
1.08*** 0.58* 0.86** -0.30 0.96*** 1.11*** 0.84*** 0.37
(0.36) (0.30) (0.37) (0.27) (0.31) (0.32) (0.31) (0.25)
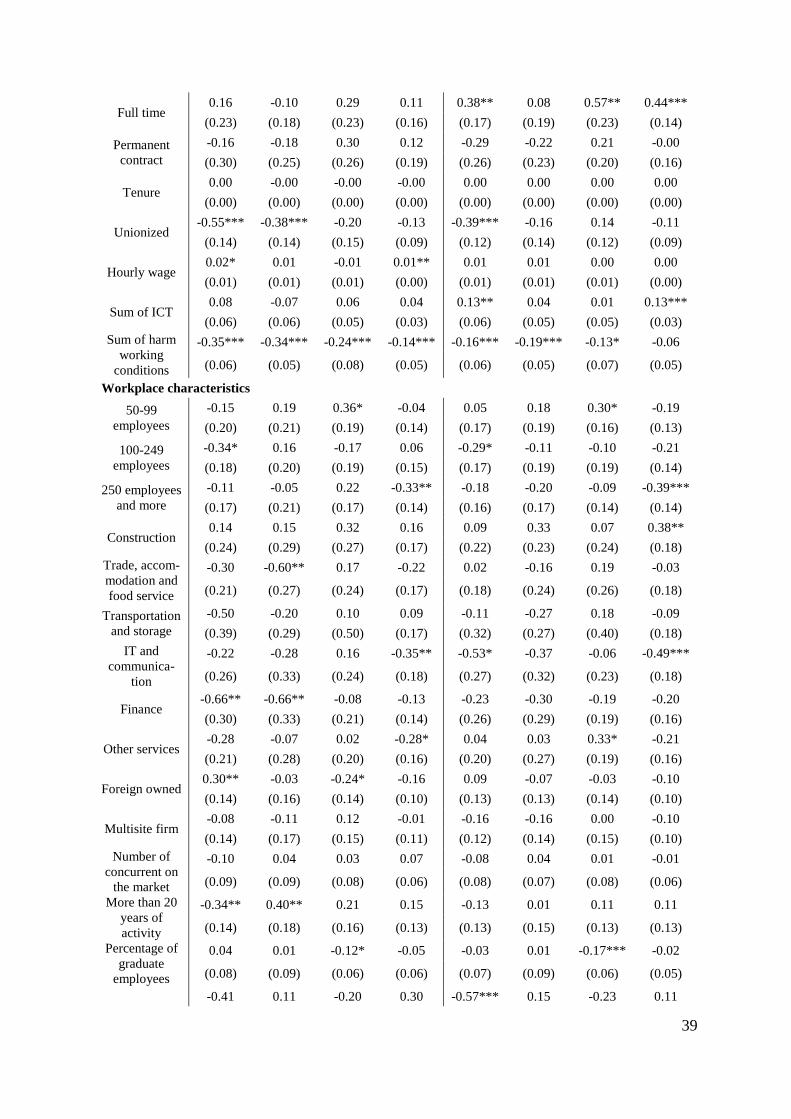
39
Full time 0.16 -0.10 0.29 0.11 0.38** 0.08 0.57** 0.44***
(0.23) (0.18) (0.23) (0.16) (0.17) (0.19) (0.23) (0.14)
Permanent
contract
-0.16 -0.18 0.30 0.12 -0.29 -0.22 0.21 -0.00
(0.30) (0.25) (0.26) (0.19) (0.26) (0.23) (0.20) (0.16)
Tenure 0.00 -0.00 -0.00 -0.00 0.00 0.00 0.00 0.00
(0.00) (0.00) (0.00) (0.00) (0.00) (0.00) (0.00) (0.00)
Unionized -0.55*** -0.38*** -0.20 -0.13 -0.39*** -0.16 0.14 -0.11
(0.14) (0.14) (0.15) (0.09) (0.12) (0.14) (0.12) (0.09)
Hourly wage 0.02* 0.01 -0.01 0.01** 0.01 0.01 0.00 0.00
(0.01) (0.01) (0.01) (0.00) (0.01) (0.01) (0.01) (0.00)
Sum of ICT 0.08 -0.07 0.06 0.04 0.13** 0.04 0.01 0.13***
(0.06) (0.06) (0.05) (0.03) (0.06) (0.05) (0.05) (0.03)
Sum of harm
working
conditions
-0.35*** -0.34*** -0.24*** -0.14*** -0.16*** -0.19*** -0.13* -0.06
(0.06) (0.05) (0.08) (0.05) (0.06) (0.05) (0.07) (0.05)
Workplace characteristics
50-99
employees
-0.15 0.19 0.36* -0.04 0.05 0.18 0.30* -0.19
(0.20) (0.21) (0.19) (0.14) (0.17) (0.19) (0.16) (0.13)
100-249
employees
-0.34* 0.16 -0.17 0.06 -0.29* -0.11 -0.10 -0.21
(0.18) (0.20) (0.19) (0.15) (0.17) (0.19) (0.19) (0.14)
250 employees
and more
-0.11 -0.05 0.22 -0.33** -0.18 -0.20 -0.09 -0.39***
(0.17) (0.21) (0.17) (0.14) (0.16) (0.17) (0.14) (0.14)
Construction 0.14 0.15 0.32 0.16 0.09 0.33 0.07 0.38**
(0.24) (0.29) (0.27) (0.17) (0.22) (0.23) (0.24) (0.18)
Trade, accom-
modation and
food service
-0.30 -0.60** 0.17 -0.22 0.02 -0.16 0.19 -0.03
(0.21) (0.27) (0.24) (0.17) (0.18) (0.24) (0.26) (0.18)
Transportation
and storage
-0.50 -0.20 0.10 0.09 -0.11 -0.27 0.18 -0.09
(0.39) (0.29) (0.50) (0.17) (0.32) (0.27) (0.40) (0.18)
IT and
communica-
tion
-0.22 -0.28 0.16 -0.35** -0.53* -0.37 -0.06 -0.49***
(0.26) (0.33) (0.24) (0.18) (0.27) (0.32) (0.23) (0.18)
Finance -0.66** -0.66** -0.08 -0.13 -0.23 -0.30 -0.19 -0.20
(0.30) (0.33) (0.21) (0.14) (0.26) (0.29) (0.19) (0.16)
Other services -0.28 -0.07 0.02 -0.28* 0.04 0.03 0.33* -0.21
(0.21) (0.28) (0.20) (0.16) (0.20) (0.27) (0.19) (0.16)
Foreign owned 0.30** -0.03 -0.24* -0.16 0.09 -0.07 -0.03 -0.10
(0.14) (0.16) (0.14) (0.10) (0.13) (0.13) (0.14) (0.10)
Multisite firm -0.08 -0.11 0.12 -0.01 -0.16 -0.16 0.00 -0.10
(0.14) (0.17) (0.15) (0.11) (0.12) (0.14) (0.15) (0.10)
Number of
concurrent on
the market
-0.10 0.04 0.03 0.07 -0.08 0.04 0.01 -0.01
(0.09) (0.09) (0.08) (0.06) (0.08) (0.07) (0.08) (0.06)
More than 20
years of
activity
-0.34** 0.40** 0.21 0.15 -0.13 0.01 0.11 0.11
(0.14) (0.18) (0.16) (0.13) (0.13) (0.15) (0.13) (0.13)
Percentage of
graduate
employees
0.04 0.01 -0.12* -0.05 -0.03 0.01 -0.17*** -0.02
(0.08) (0.09) (0.06) (0.06) (0.07) (0.09) (0.06) (0.05)
-0.41 0.11 -0.20 0.30 -0.57*** 0.15 -0.23 0.11
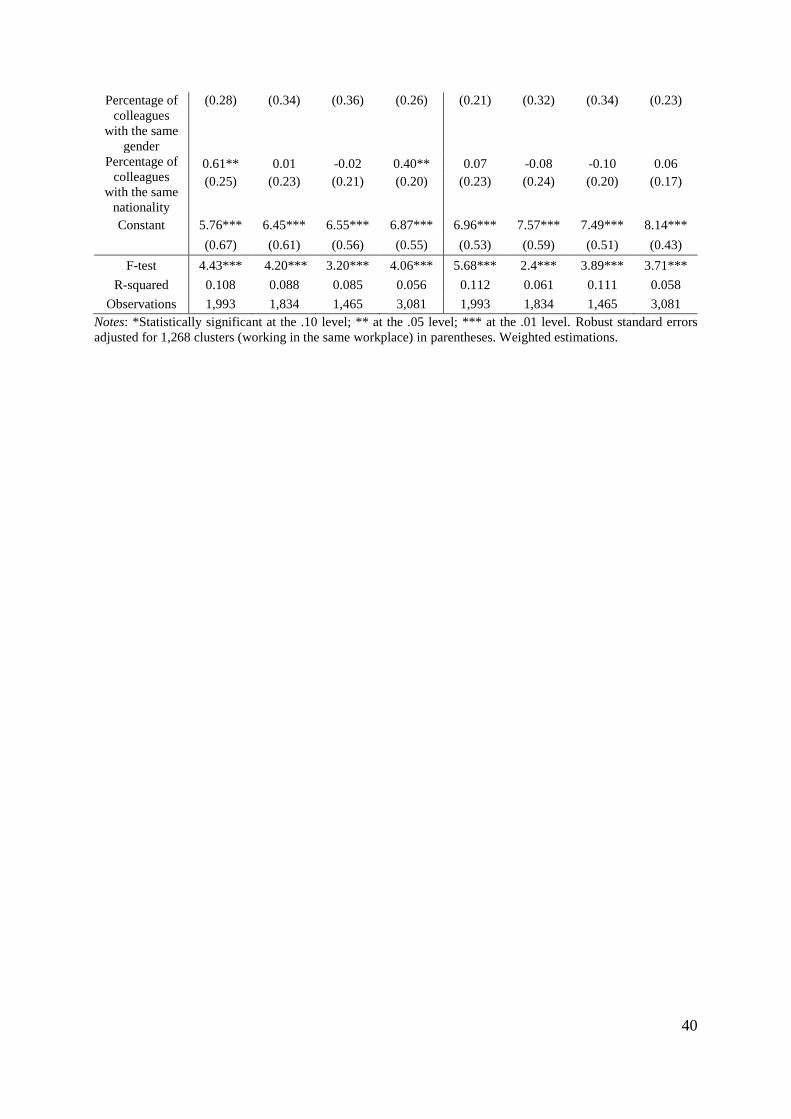
40
Percentage of
colleagues
with the same
gender
(0.28) (0.34) (0.36) (0.26) (0.21) (0.32) (0.34) (0.23)
Percentage of
colleagues
with the same
nationality
0.61** 0.01 -0.02 0.40** 0.07 -0.08 -0.10 0.06
(0.25) (0.23) (0.21) (0.20) (0.23) (0.24) (0.20) (0.17)
Constant 5.76*** 6.45*** 6.55*** 6.87*** 6.96*** 7.57*** 7.49*** 8.14***
(0.67) (0.61) (0.56) (0.55) (0.53) (0.59) (0.51) (0.43)
F-test 4.43*** 4.20*** 3.20*** 4.06*** 5.68*** 2.4*** 3.89*** 3.71***
R-squared 0.108 0.088 0.085 0.056 0.112 0.061 0.111 0.058
Observations 1,993 1,834 1,465 3,081 1,993 1,834 1,465 3,081
Notes: *Statistically significant at the .10 level; ** at the .05 level; *** at the .01 level. Robust standard errors
adjusted for 1,268 clusters (working in the same workplace) in parentheses. Weighted estimations.


T +352 58 58 55-1F +352 58 58 55-700 www.liser.lu
11, Porte des SciencesCampus BelvalL-4366 Esch-sur-Alzette


![Constraints Impacting Minority Swimming Participation ... · media exposure on the issue of minority swimming (in)ability; and, [3] resulted in action by community and governmental](https://img.pdfslide.us/doc/110x75/5e459695f8a0842fab5305db/constraints-impacting-minority-swimming-participation-media-exposure-on-the.jpg)