Embed Size (px)
Citation preview
Labs
Exposure modeling
Dr. Keiko Saito
GFDRRLabs, The World Bank
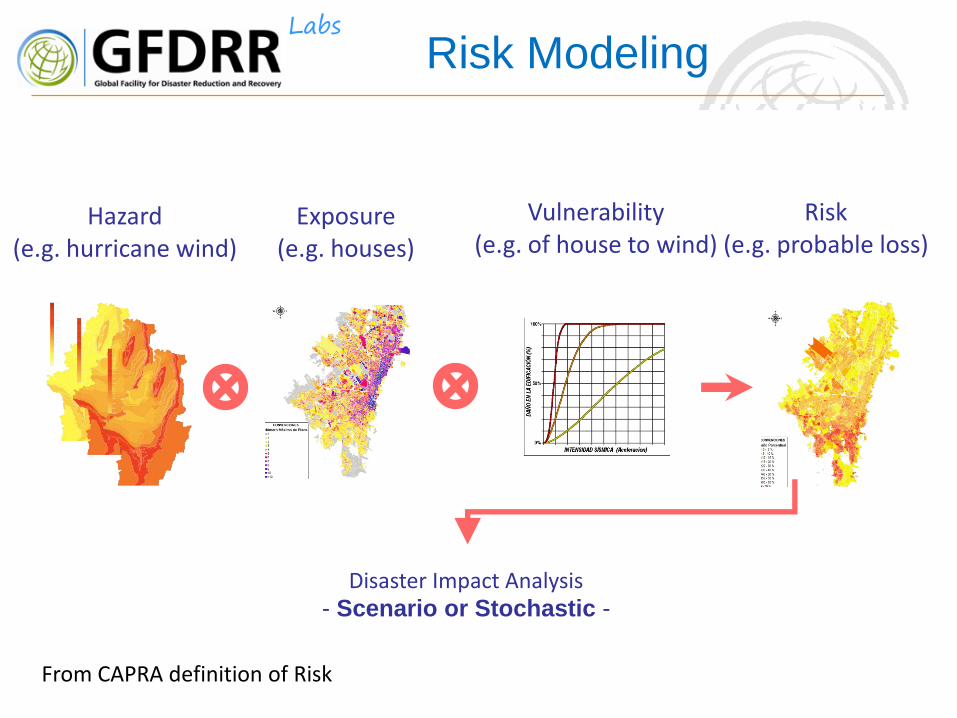
LabsRisk Modeling
Risk(e.g. probable loss)
Hazard(e.g. hurricane wind)
Exposure(e.g. houses)
Vulnerability(e.g. of house to wind)
Disaster Impact Analysis - Scenario or Stochastic -
From CAPRA definition of Risk
Labs
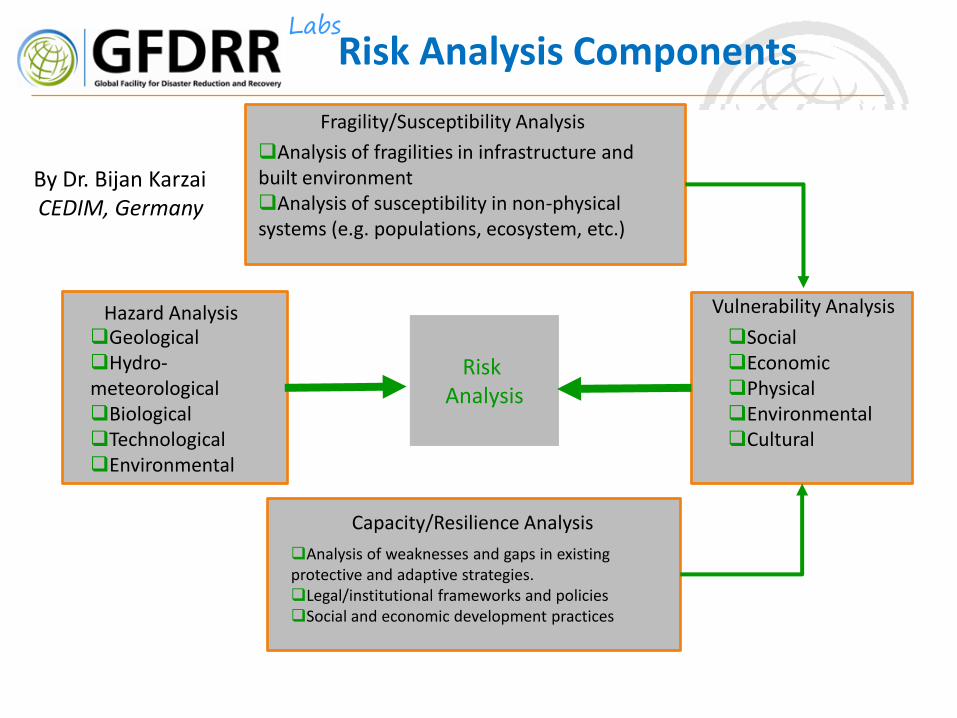
Risk Analysis
Vulnerability AnalysisHazard Analysis
Fragility/Susceptibility Analysis
Capacity/Resilience Analysis
SocialEconomicPhysicalEnvironmentalCultural
Analysis of weaknesses and gaps in existing protective and adaptive strategies.Legal/institutional frameworks and policiesSocial and economic development practices
GeologicalHydro-meteorologicalBiologicalTechnologicalEnvironmental
Analysis of fragilities in infrastructure and built environmentAnalysis of susceptibility in non-physical systems (e.g. populations, ecosystem, etc.)
By Dr. Bijan KarzaiCEDIM, Germany
Risk Analysis Components
Labs
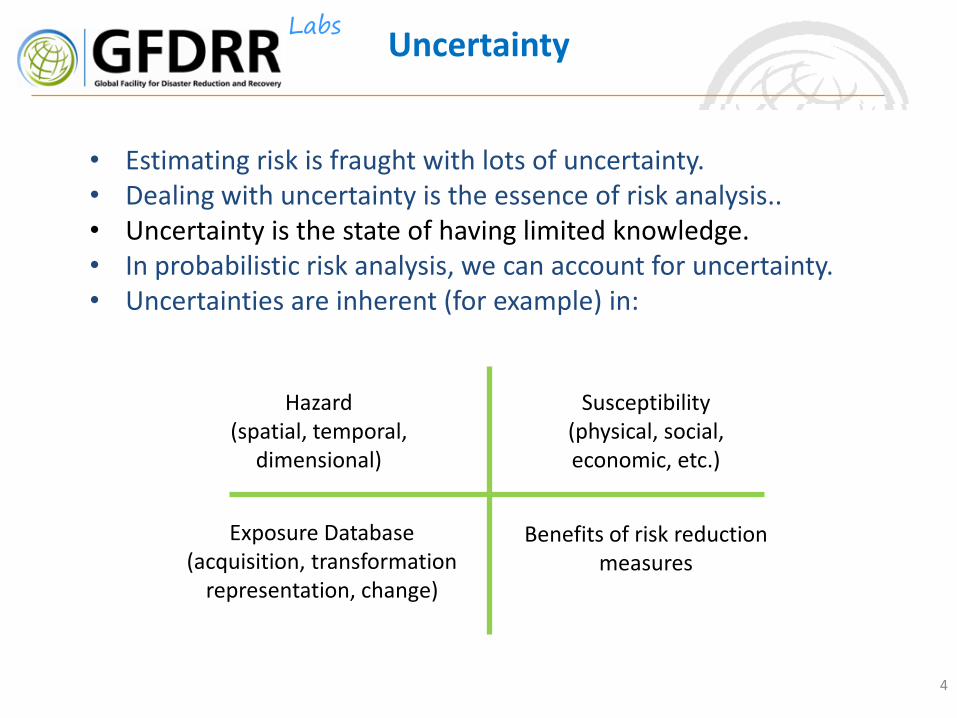
• Estimating risk is fraught with lots of uncertainty.• Dealing with uncertainty is the essence of risk analysis..• Uncertainty is the state of having limited knowledge.• In probabilistic risk analysis, we can account for uncertainty.• Uncertainties are inherent (for example) in:
4
Uncertainty
Hazard(spatial, temporal,
dimensional)
Susceptibility(physical, social,economic, etc.)
Exposure Database(acquisition, transformation
representation, change)
Benefits of risk reduction measures
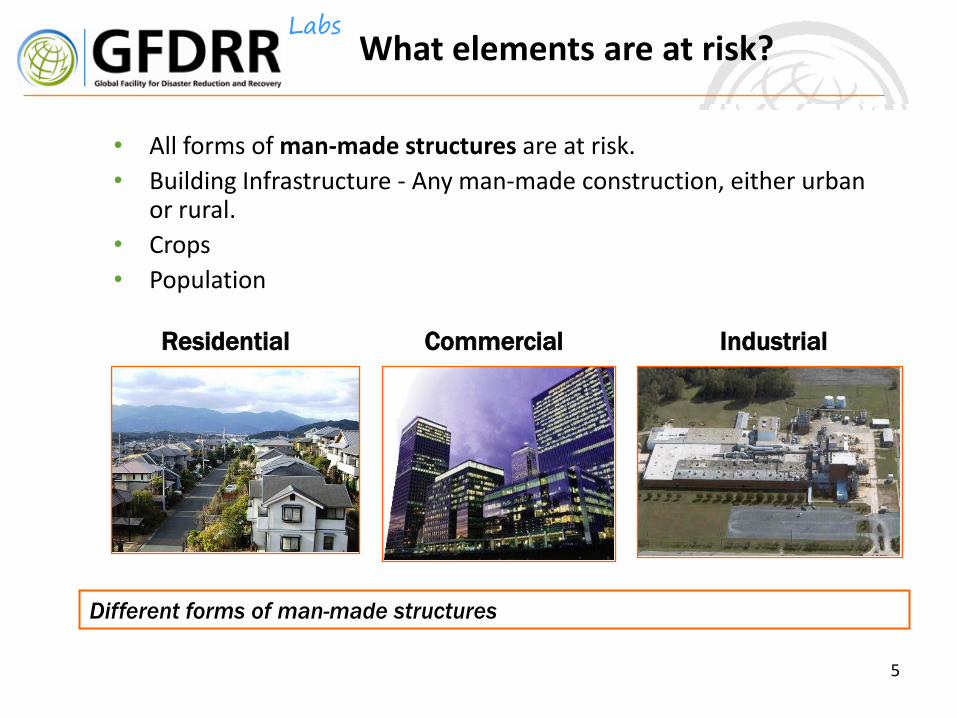
LabsWhat elements are at risk?
5
• All forms of man-made structures are at risk.
• Building Infrastructure - Any man-made construction, either urban or rural.
• Crops
• Population
Residential Commercial Industrial
Different forms of man-made structures
6
What elements are at risk?
• Transportation
– Road, rail, air and other transport-related networks
• Large Loss Facilities
– Sports stadiums, marketplaces, churches/temples/mosques, schools and other high population density infrastructure
• Critical/High-Risk Loss Facilities
– Hospital and health care facilities, public buildings, telecommunications, airports, energy systems, bridges and other facilities critical to the recovery of a region post-earthquake
• Other Lifelines – Utilities, Pipelines
– Oil, gas and water supply pipelines/distribution systems, wastewater and electricity systems
7
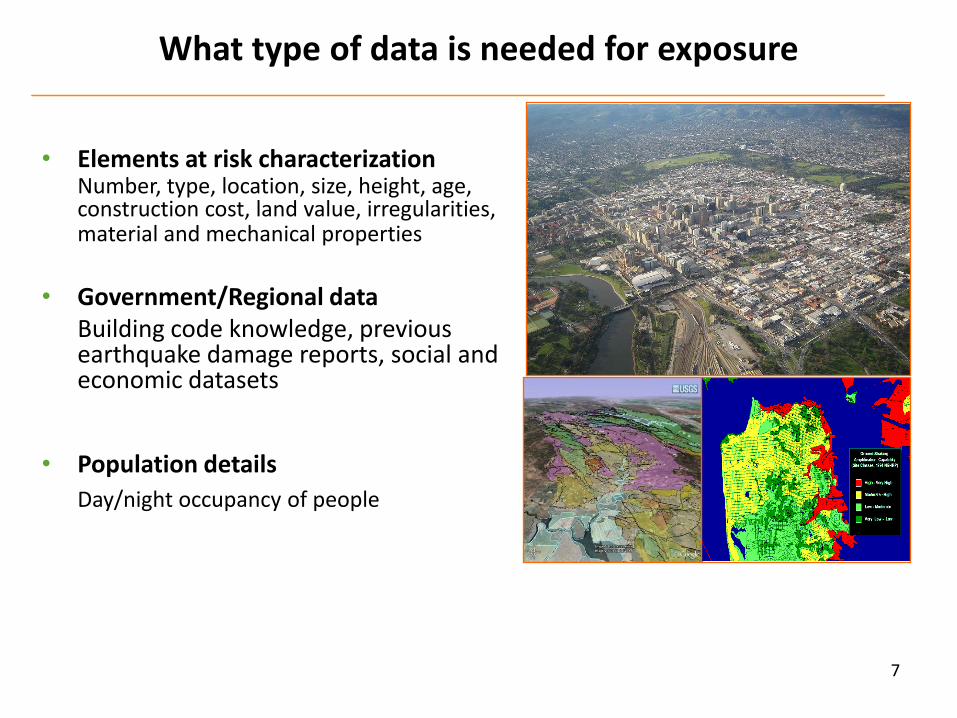
What type of data is needed for exposure
• Elements at risk characterizationNumber, type, location, size, height, age, construction cost, land value, irregularities, material and mechanical properties
• Government/Regional dataBuilding code knowledge, previous earthquake damage reports, social and economic datasets
• Population details
Day/night occupancy of people
8
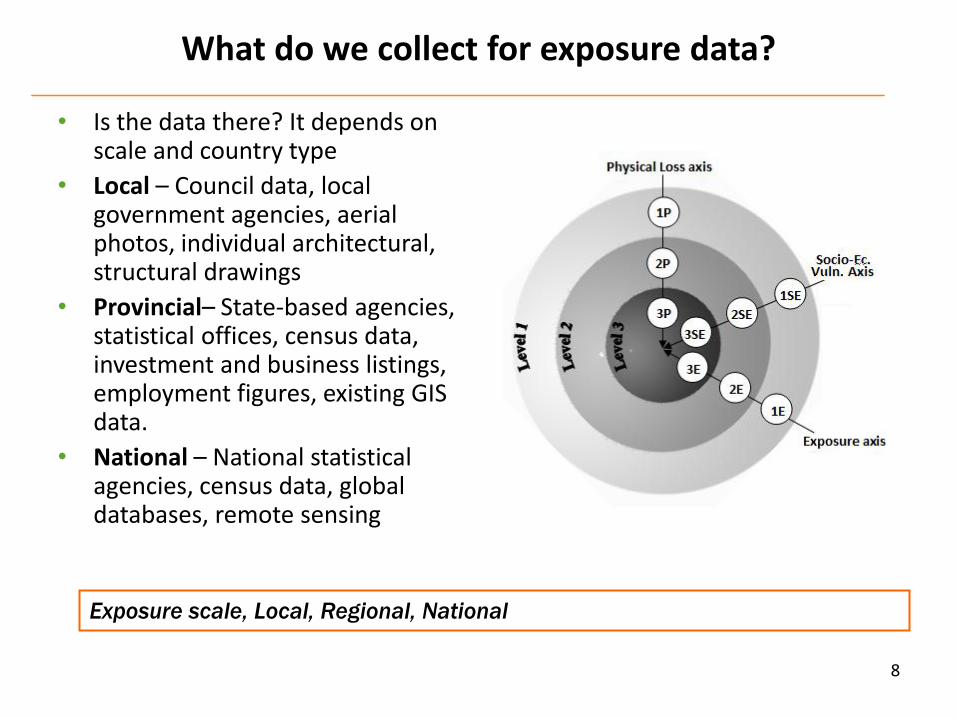
What do we collect for exposure data?
• Is the data there? It depends on scale and country type
• Local – Council data, local government agencies, aerial photos, individual architectural, structural drawings
• Provincial– State-based agencies, statistical offices, census data, investment and business listings, employment figures, existing GIS data.
• National – National statistical agencies, census data, global databases, remote sensing
Exposure scale, Local, Regional, National
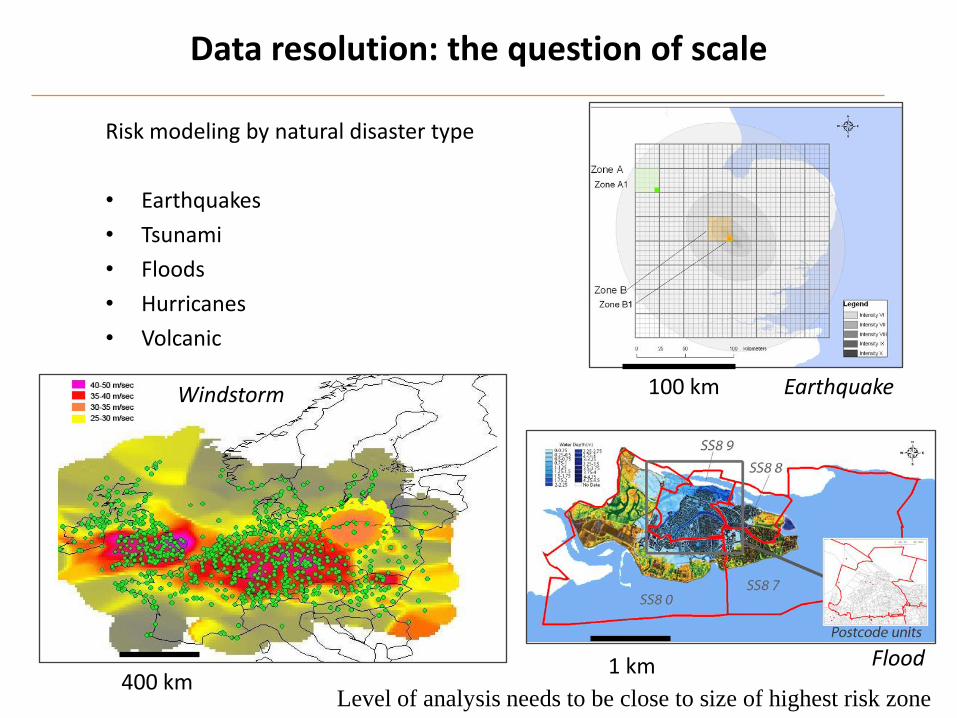
Data resolution: the question of scale
Risk modeling by natural disaster type
• Earthquakes
• Tsunami
• Floods
• Hurricanes
• Volcanic
Level of analysis needs to be close to size of highest risk zone
1 km400 km
100 km Earthquake
Flood
Windstorm
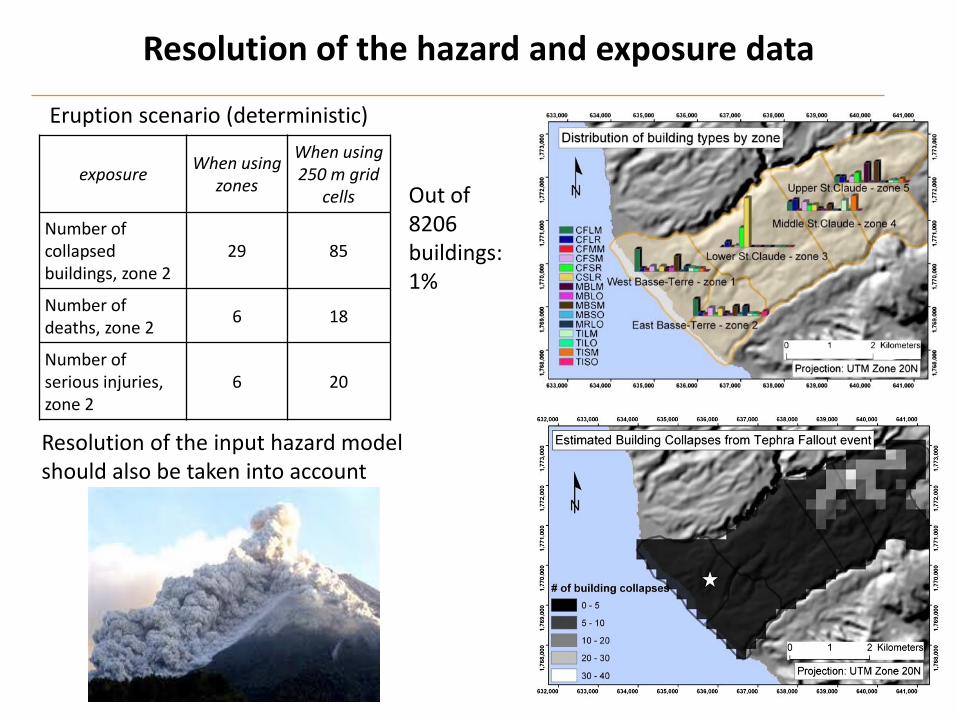
Resolution of the hazard and exposure data
exposureWhen using
zones
When using250 m grid
cells
Number of collapsed buildings, zone 2
29 85
Number of deaths, zone 2
6 18
Number of serious injuries, zone 2
6 20
Eruption scenario (deterministic)
Out of 8206 buildings: 1%
Resolution of the input hazard model should also be taken into account
Exposure data guidelines (Buildings)
The data collection method depends on the purpose of the study, as well as data availability.
The building types defined should correspond to those for which vulnerability data already exists.
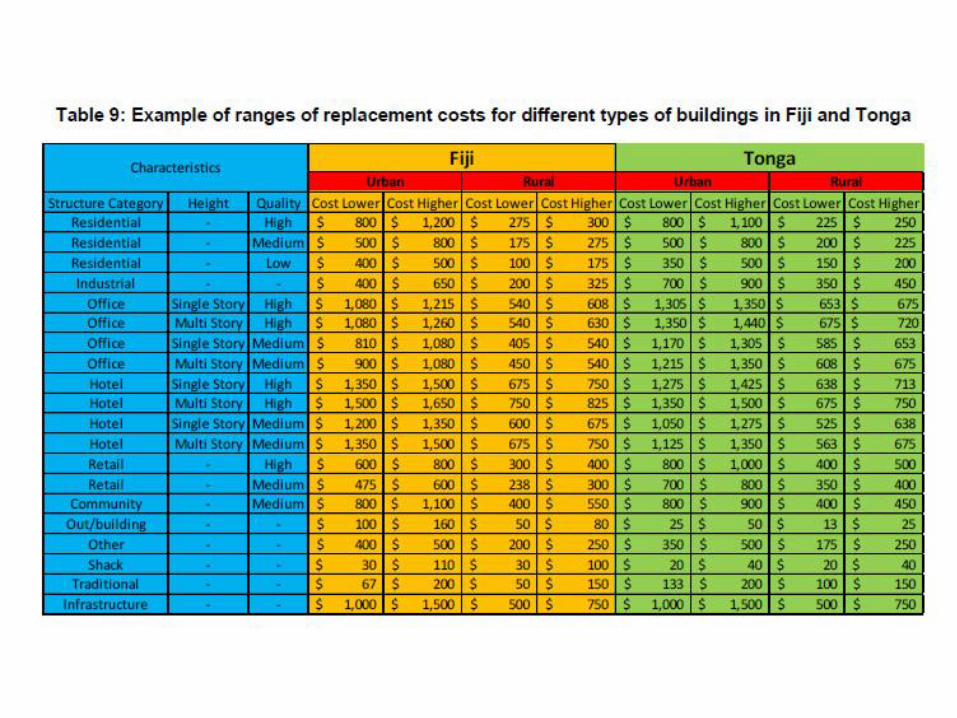
For exposure data, the necessary information is usually reduced to the following parameters :
Building type (location, material, regularity, and building shape in general, number of storeys/ building height, year of construction, use type, replacement cost, square footage, roof type, base elevation)
Context information e.g. the spatial position of a house in relation to other buildings
(Grunthal, 1998; HAZUS, 1999; Lang, 2002; Muller et at, 2006)
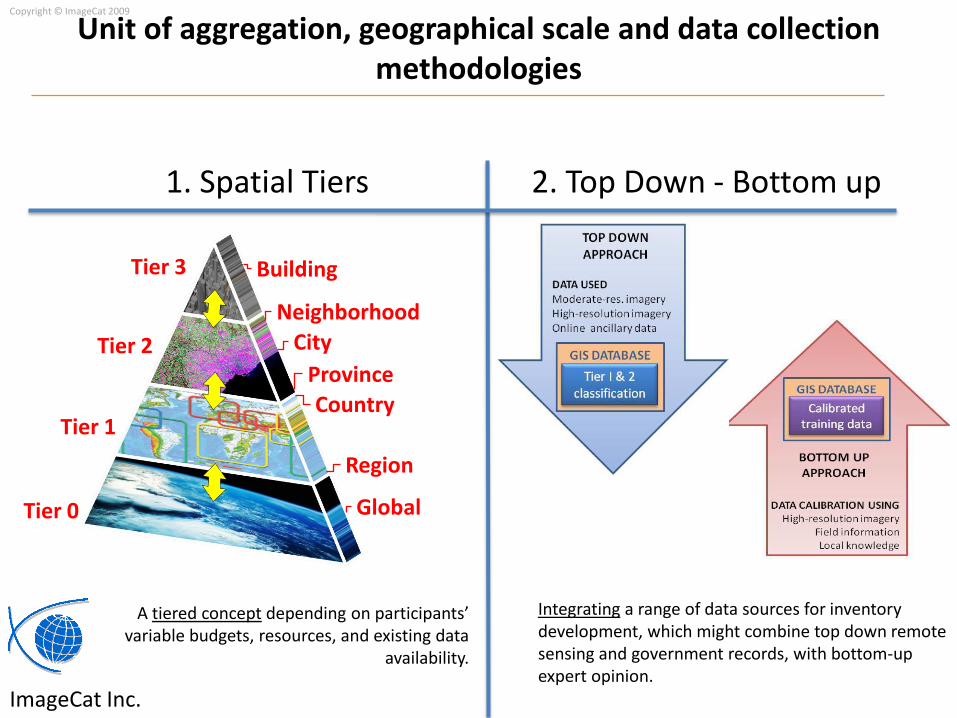
Unit of aggregation, geographical scale and data collection methodologies
A tiered concept depending on participants’ variable budgets, resources, and existing data
availability.
1. Spatial Tiers 2. Top Down - Bottom up
Integrating a range of data sources for inventory development, which might combine top down remote sensing and government records, with bottom-up expert opinion.
Tier 0
Tier 1
Tier 2
Tier 3 Building
Neighborhood
Country
Global
Region
Province
City
Copyright © ImageCat 2009
ImageCat Inc.
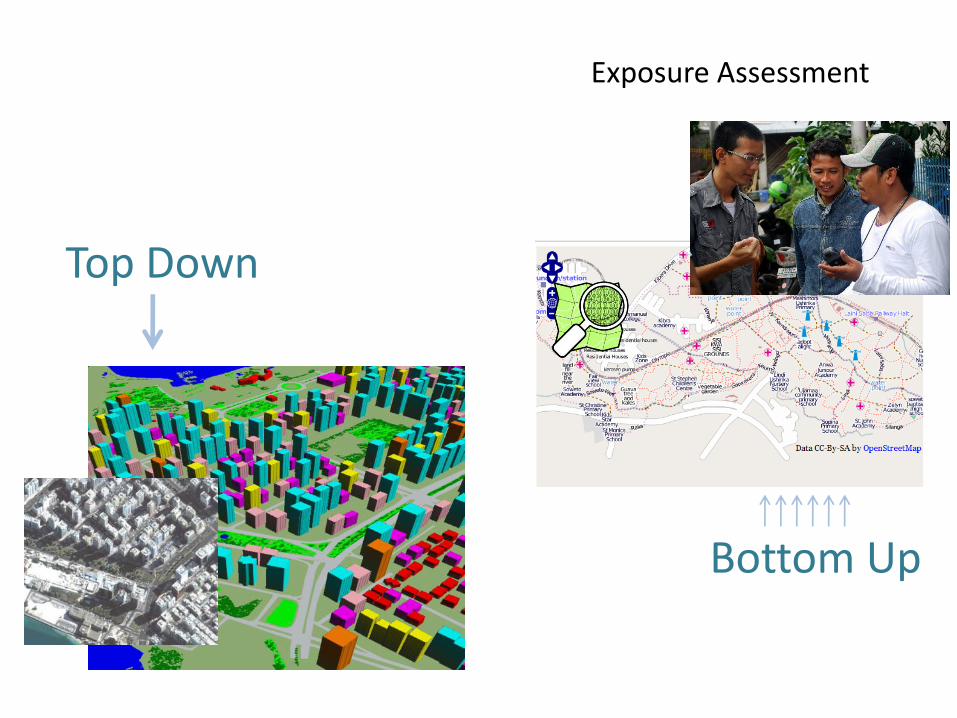
Exposure Assessment
Top Down
Bottom Up
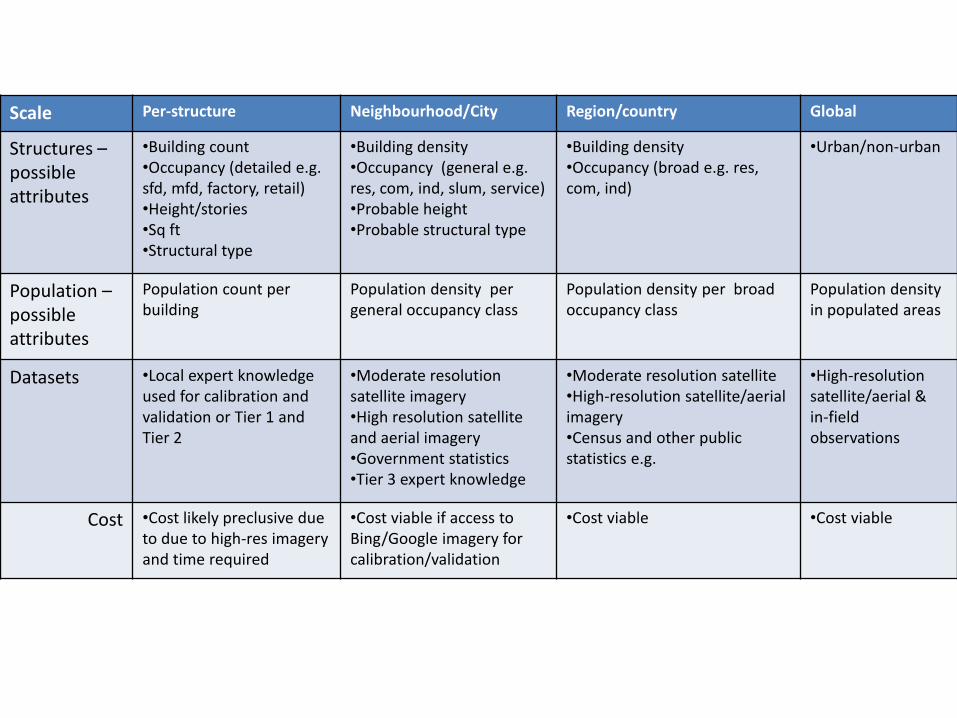
Scale Per-structure Neighbourhood/City Region/country Global
Structures –possible attributes
•Building count•Occupancy (detailed e.g. sfd, mfd, factory, retail)•Height/stories•Sq ft•Structural type
•Building density•Occupancy (general e.g. res, com, ind, slum, service)•Probable height•Probable structural type
•Building density•Occupancy (broad e.g. res, com, ind)
•Urban/non-urban
Population –possible attributes
Population count per building
Population density per general occupancy class
Population density per broad occupancy class
Population density in populated areas
Datasets •Local expert knowledge used for calibration and validation or Tier 1 and Tier 2
•Moderate resolution satellite imagery•High resolution satellite and aerial imagery•Government statistics•Tier 3 expert knowledge
•Moderate resolution satellite •High-resolution satellite/aerial imagery•Census and other publicstatistics e.g.
•High-resolution satellite/aerial & in-field observations
Cost •Cost likely preclusive due to due to high-res imagery and time required
•Cost viable if access to Bing/Google imagery for calibration/validation
•Cost viable •Cost viable
Per-Building data
•For small areas, building by building surveys can be carried out on the ground. E.g. Pylos, Greece, approximately 1400 buildings surveyed in 2 weeks by 2 people.
• Countries like Japan have a long history of collecting per building data
•MasterMap in the UK now contains attributes and footprints at the per-building level. However, lacks information about the structure type.
•Padang data was collected with a view to use the data for DRM. Used combination of remotely sensed data (object oriented classification) and field survey.
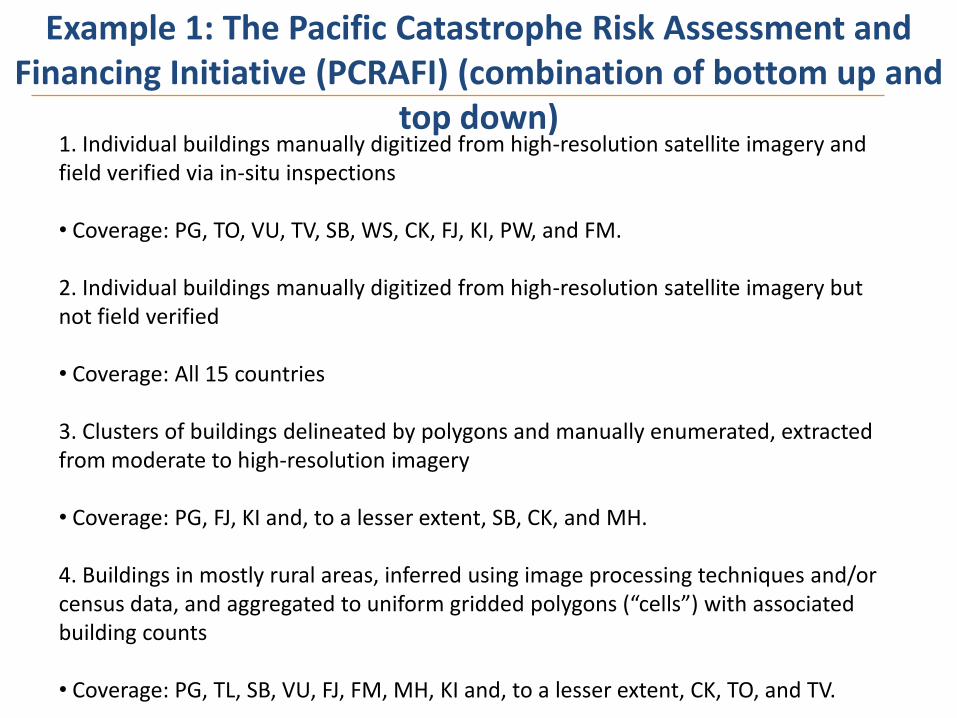
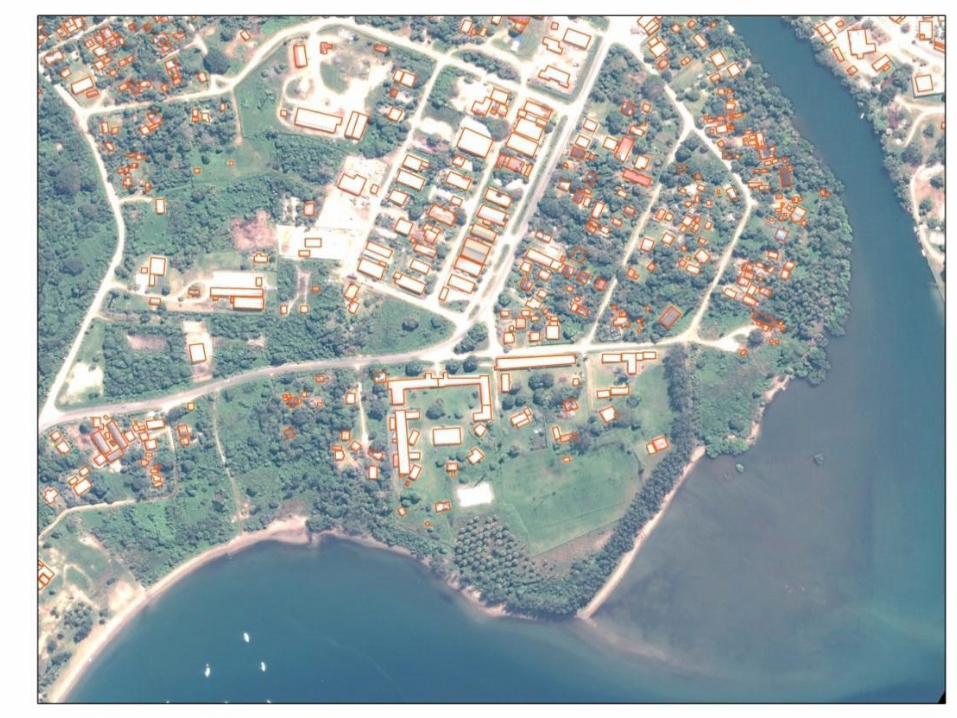
1. Individual buildings manually digitized from high-resolution satellite imagery and field verified via in-situ inspections
• Coverage: PG, TO, VU, TV, SB, WS, CK, FJ, KI, PW, and FM.
2. Individual buildings manually digitized from high-resolution satellite imagery but not field verified
• Coverage: All 15 countries
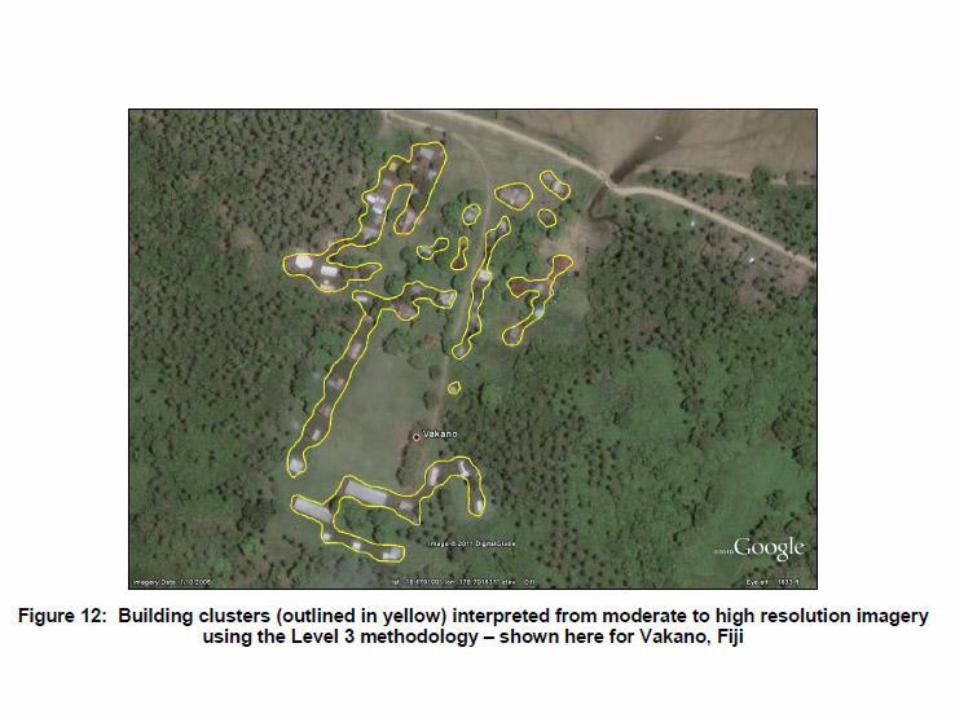
3. Clusters of buildings delineated by polygons and manually enumerated, extracted from moderate to high-resolution imagery
• Coverage: PG, FJ, KI and, to a lesser extent, SB, CK, and MH.
4. Buildings in mostly rural areas, inferred using image processing techniques and/or census data, and aggregated to uniform gridded polygons (“cells”) with associated building counts
• Coverage: PG, TL, SB, VU, FJ, FM, MH, KI and, to a lesser extent, CK, TO, and TV.
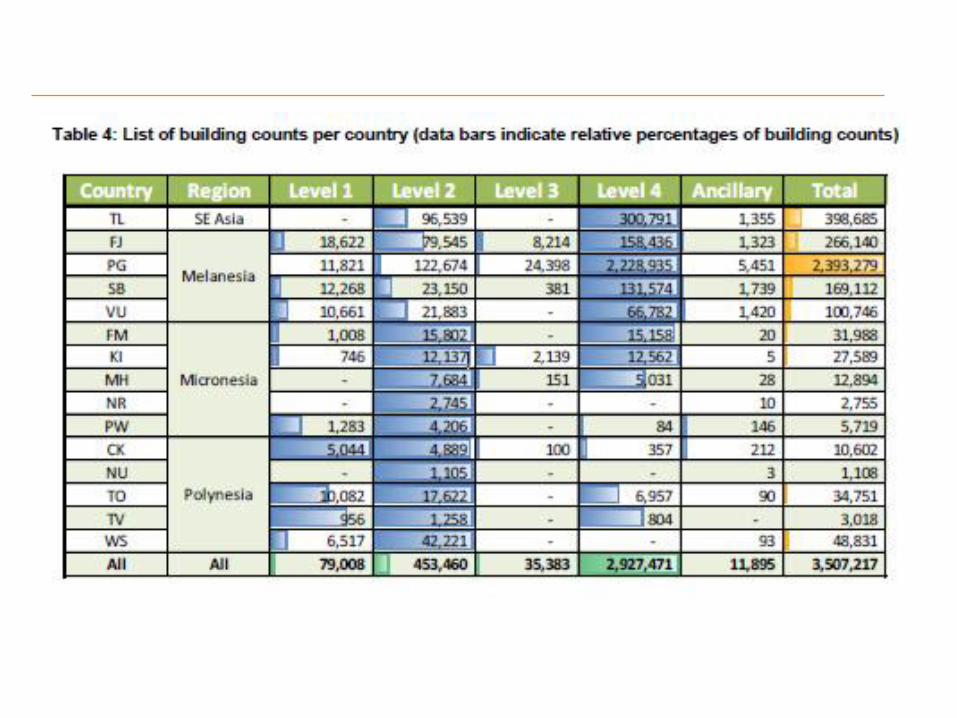
Example 1: The Pacific Catastrophe Risk Assessment and Financing Initiative (PCRAFI) (combination of bottom up and
top down)
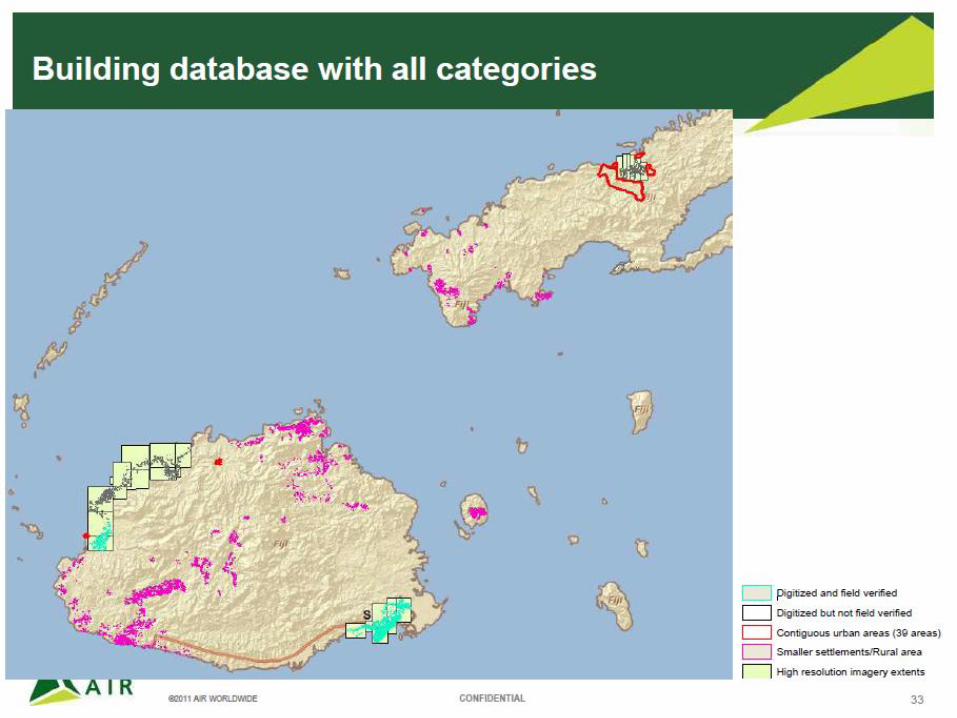
Building database with all categories
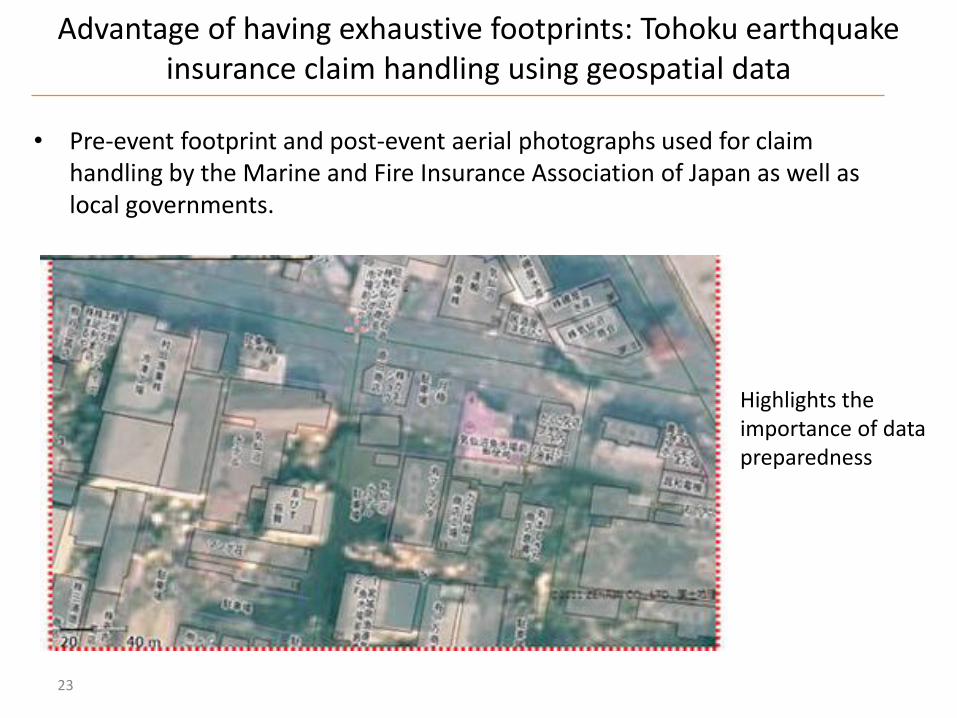
Advantage of having exhaustive footprints: Tohoku earthquake insurance claim handling using geospatial data
• Pre-event footprint and post-event aerial photographs used for claim handling by the Marine and Fire Insurance Association of Japan as well as local governments.
23
Highlights the importance of data preparedness
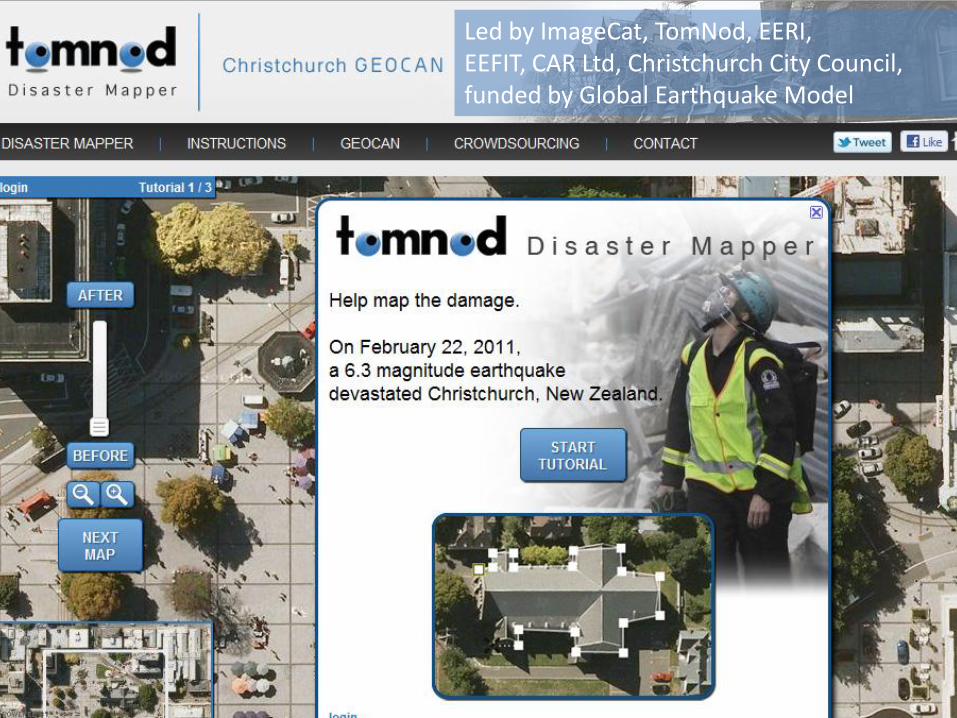
Crowd sourced post-event building damage assessment
24
Led by ImageCat, TomNod, EERI, EEFIT, CAR Ltd, Christchurch City Council, funded by Global Earthquake Model
• Another example of creating exposure model utilising satellite data.
• Assume homogeneous building type distribution for a particular land cover class. Building inventory Extrapolate based on land cover type across a wide region.
• Validation of the assumption is needed. Area of research.
Example 2: Indonesia exposure data
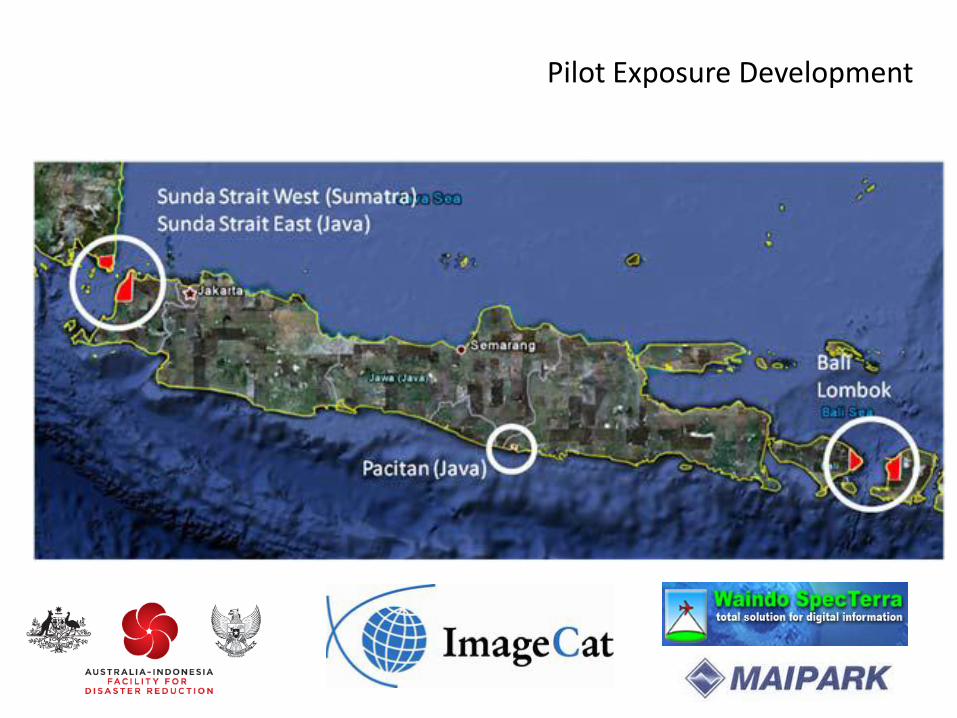
Pilot Exposure Development
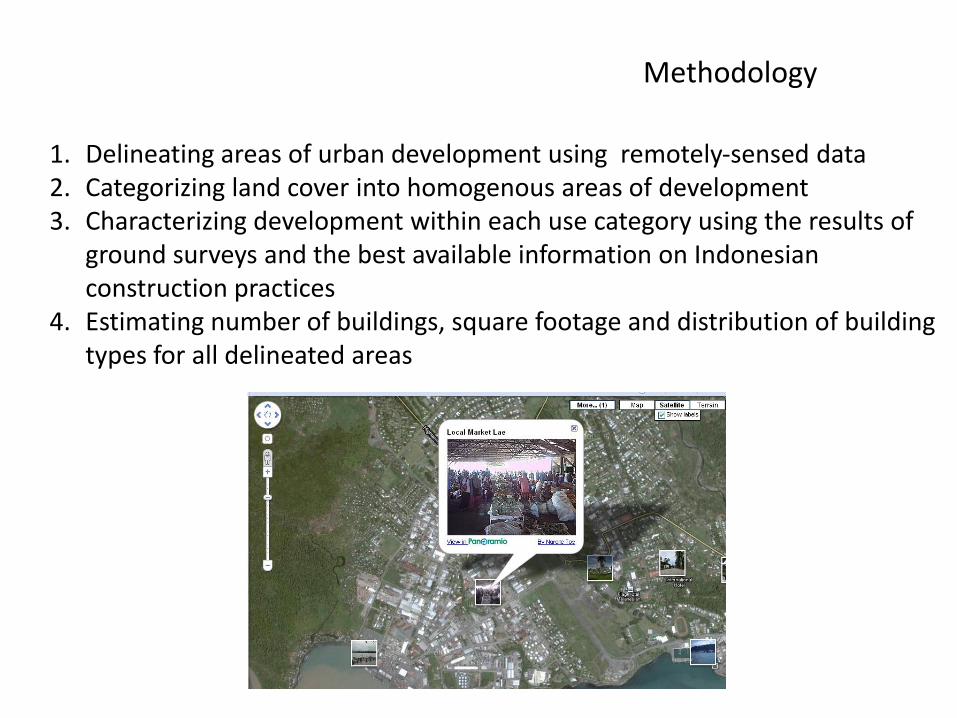
Methodology
1. Delineating areas of urban development using remotely‐sensed data2. Categorizing land cover into homogenous areas of development3. Characterizing development within each use category using the results of
ground surveys and the best available information on Indonesian construction practices
4. Estimating number of buildings, square footage and distribution of building types for all delineated areas
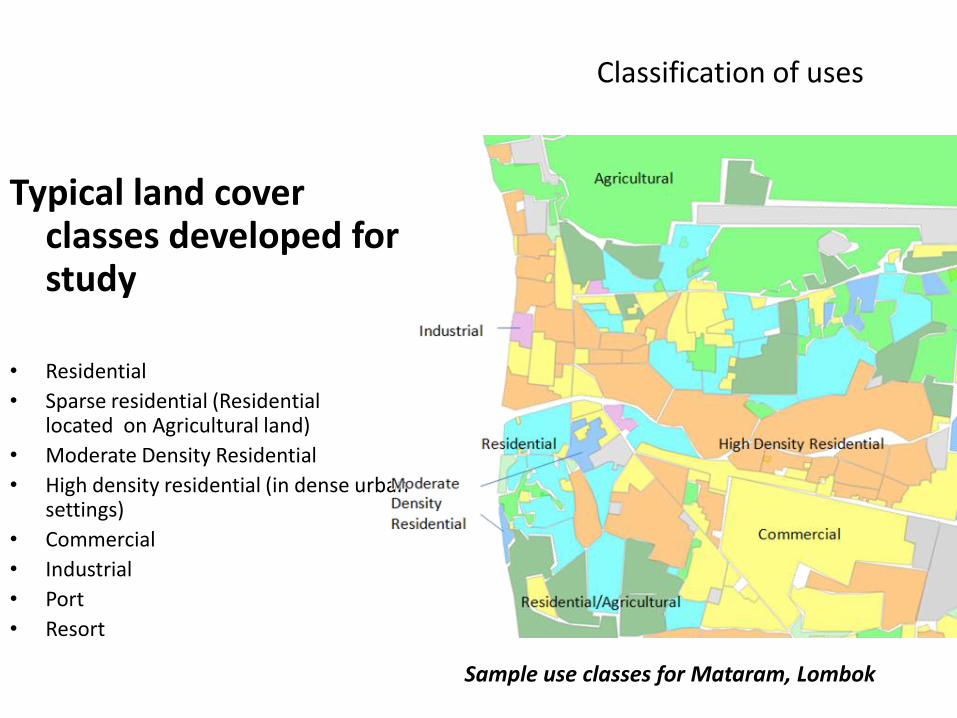
Classification of uses
Typical land cover classes developed for study
• Residential
• Sparse residential (Residential located on Agricultural land)
• Moderate Density Residential
• High density residential (in dense urban settings)
• Commercial
• Industrial
• Port
• Resort
Sample use classes for Mataram, Lombok
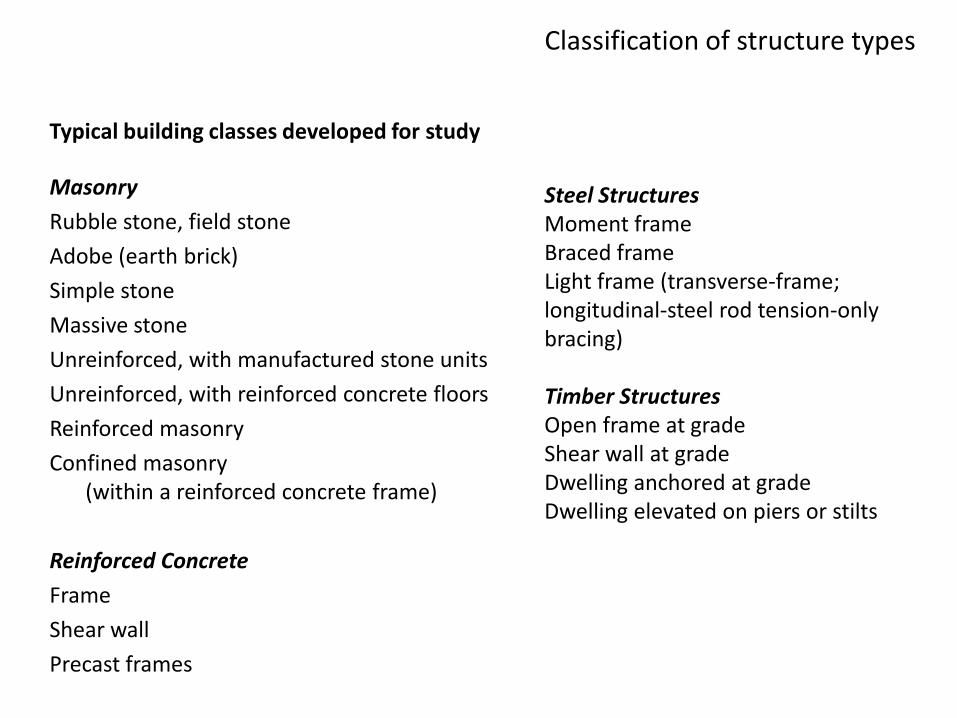
Classification of structure types
Masonry
Rubble stone, field stone
Adobe (earth brick)
Simple stone
Massive stone
Unreinforced, with manufactured stone units
Unreinforced, with reinforced concrete floors
Reinforced masonry
Confined masonry (within a reinforced concrete frame)
Reinforced Concrete
Frame
Shear wall
Precast frames
Steel StructuresMoment frameBraced frameLight frame (transverse-frame; longitudinal-steel rod tension-only bracing)
Timber StructuresOpen frame at gradeShear wall at gradeDwelling anchored at gradeDwelling elevated on piers or stilts
Typical building classes developed for study
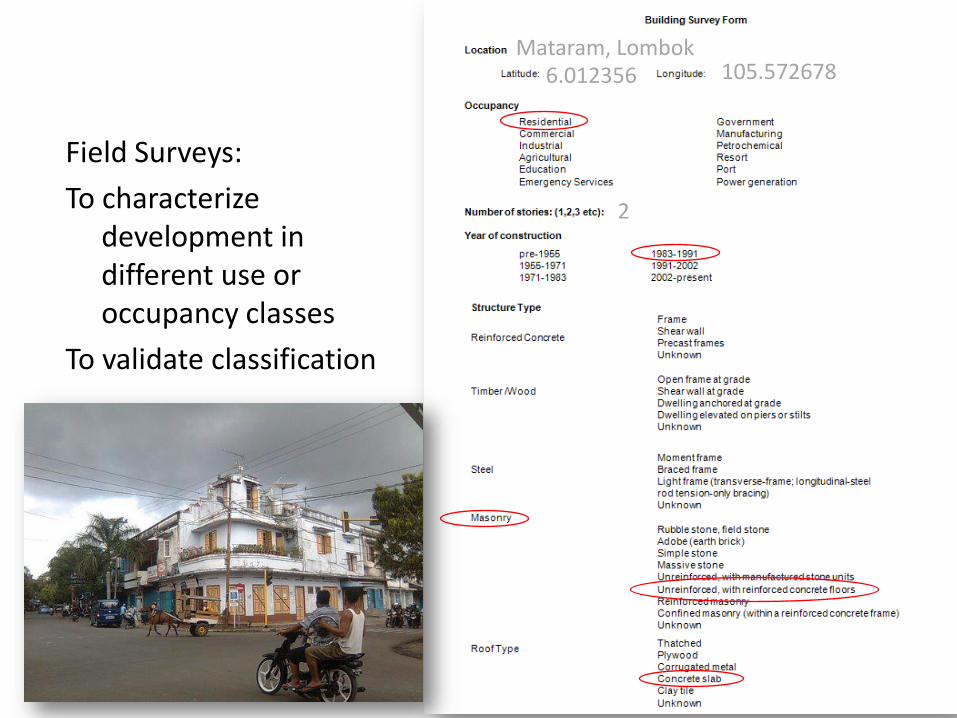
Field Surveys:
To characterize development in different use or occupancy classes
To validate classification
2
6.012356 105.572678Mataram, Lombok
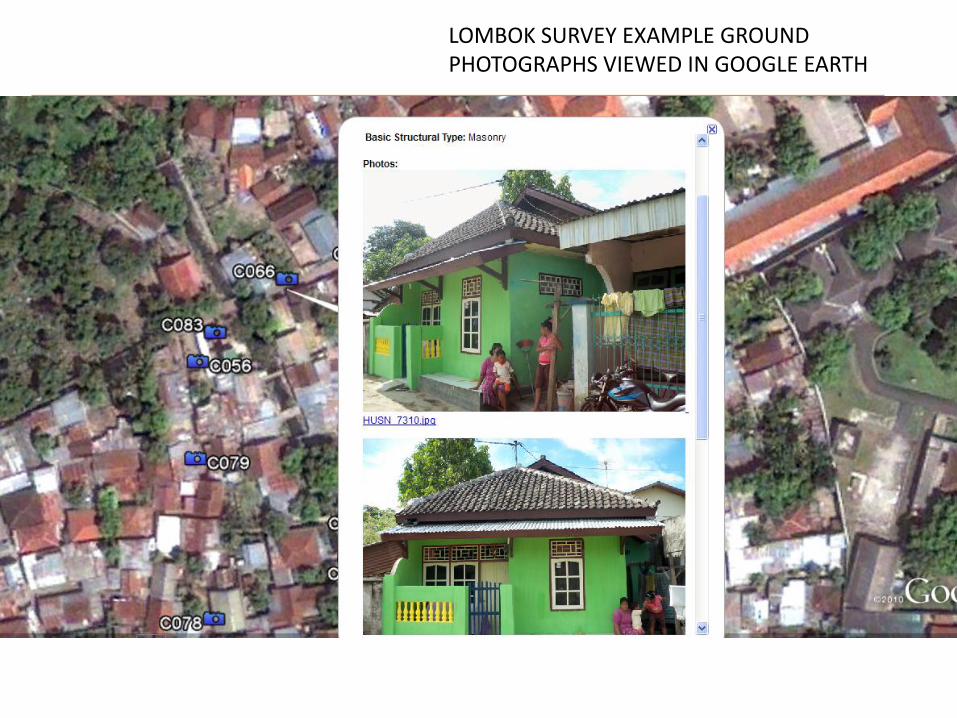
LOMBOK SURVEY EXAMPLE GROUND PHOTOGRAPHS VIEWED IN GOOGLE EARTH
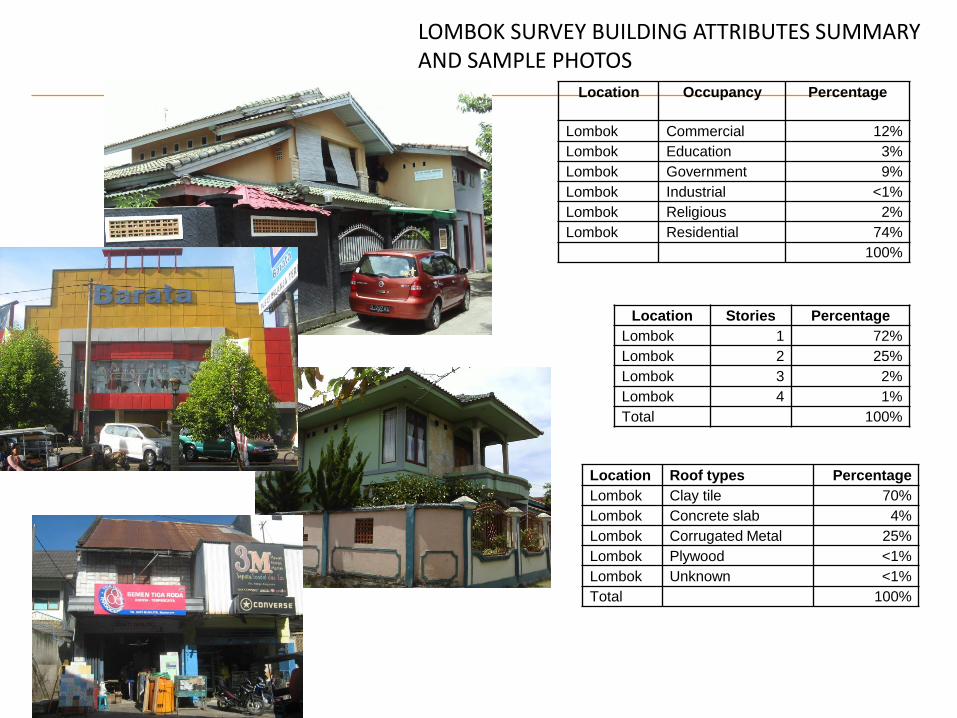
Location Roof types Percentage
Lombok Clay tile 70%
Lombok Concrete slab 4%
Lombok Corrugated Metal 25%
Lombok Plywood <1%
Lombok Unknown <1%
Total 100%
Location Stories Percentage
Lombok 1 72%
Lombok 2 25%
Lombok 3 2%
Lombok 4 1%
Total 100%
Location Occupancy Percentage
Lombok Commercial 12%
Lombok Education 3%
Lombok Government 9%
Lombok Industrial <1%
Lombok Religious 2%
Lombok Residential 74%
100%
LOMBOK SURVEY BUILDING ATTRIBUTES SUMMARY AND SAMPLE PHOTOS
Critical infrastructure mapping
• It may be possible to re-use information on the location of critical infrastructure from previous mapping projects.
• If data does not exist, one avenue to investigate would be to use crowd sourcing. (e.g. Open Street Map or Google Map Maker etc).
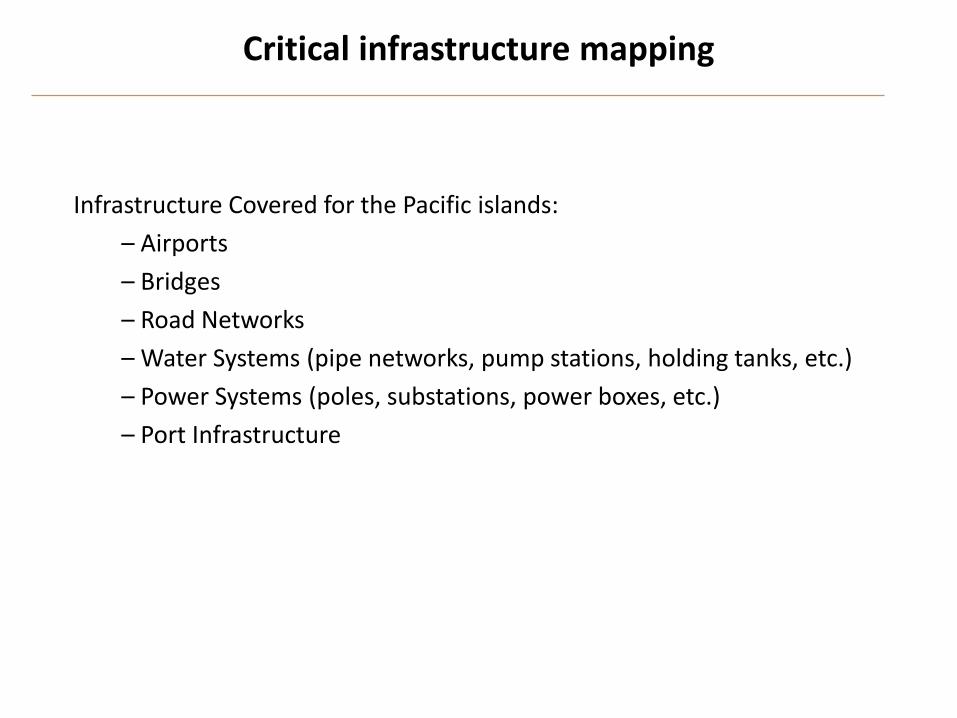
Critical infrastructure mapping
Infrastructure Covered for the Pacific islands:
– Airports
– Bridges
– Road Networks
– Water Systems (pipe networks, pump stations, holding tanks, etc.)
– Power Systems (poles, substations, power boxes, etc.)
– Port Infrastructure
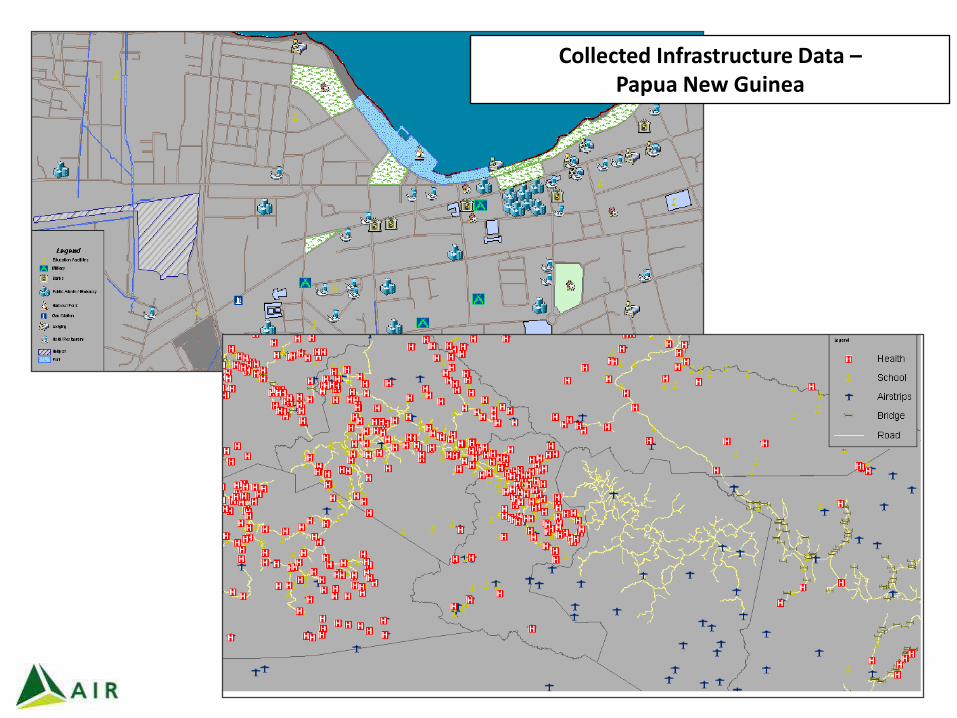
Collected Infrastructure Data –Papua New Guinea
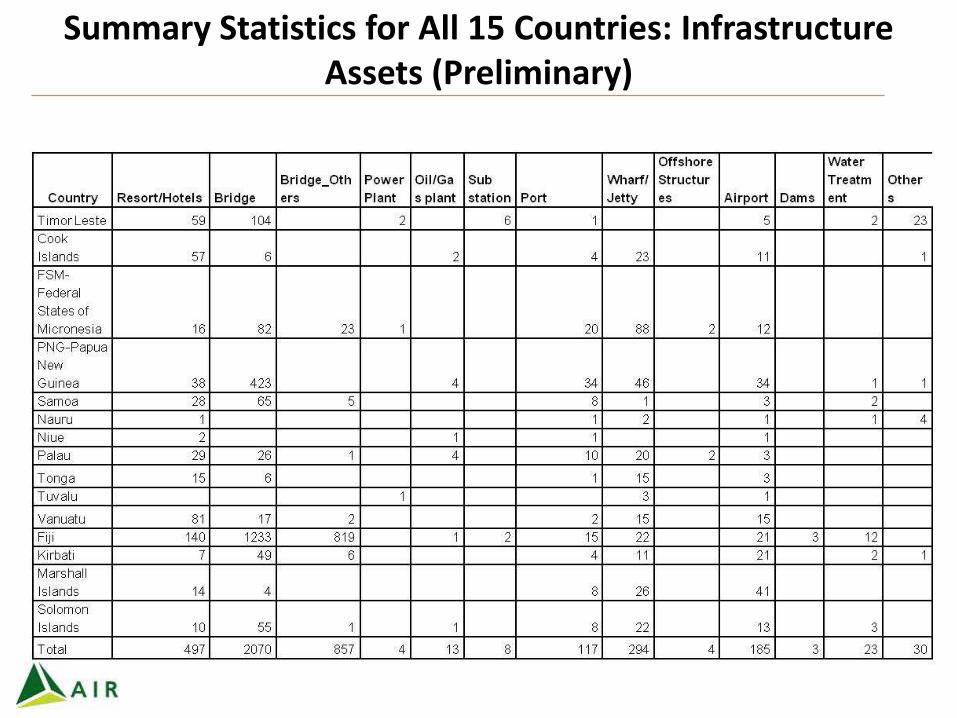
Summary Statistics for All 15 Countries: InfrastructureAssets (Preliminary)
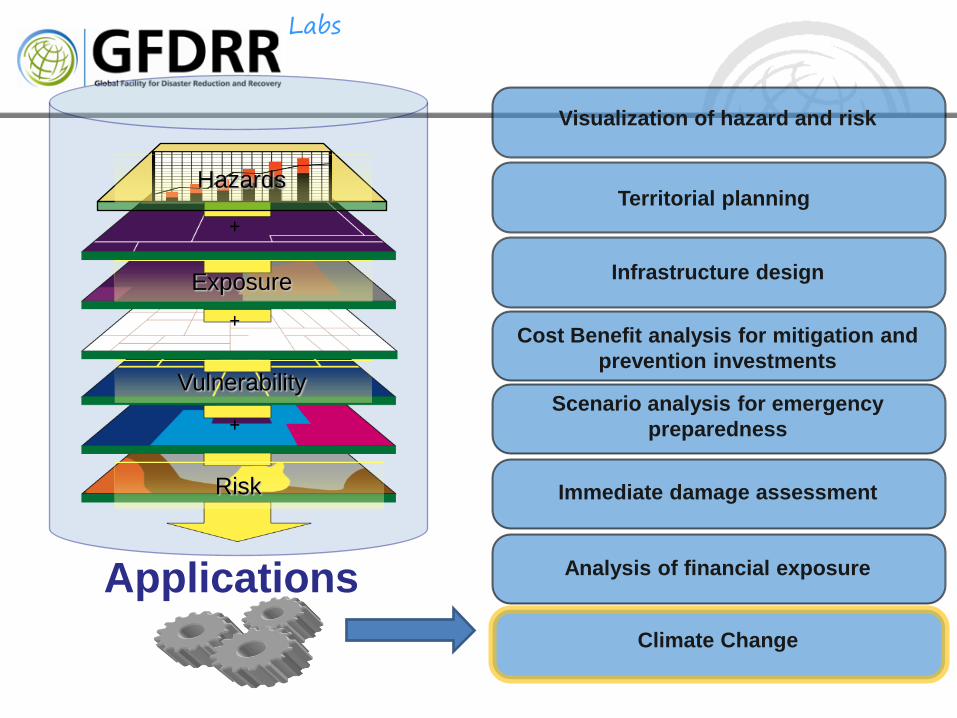
Labs
Hazards
Exposure
Vulnerability
Risk
+
+
+
Applications
Visualization of hazard and risk
Territorial planning
Infrastructure design
Cost Benefit analysis for mitigation and
prevention investments
Scenario analysis for emergency
preparedness
Immediate damage assessment
Analysis of financial exposure
Climate Change

Thank you! Questions?