Embed Size (px)
Citation preview

Exposure Factors Handbook
Chapter 6—Inhalation Rates
Exposure Factors Handbook Page September 2011 6-i
TABLE OF CONTENTS LIST OF TABLES ..................................................................................................................................................... 6-ii LIST OF FIGURES .................................................................................................................................................. 6-iv 6. INHALATION RATES ............................................................................................................................... 6-1
6.1. INTRODUCTION .........................................................................................................................6-1 6.2. RECOMMENDATIONS ...............................................................................................................6-2 6.3. KEY INHALATION RATE STUDIES ..........................................................................................6-7
6.3.1. Brochu et al. (2006b)—Physiological Daily Inhalation Rates for Free-Living Individuals Aged 1 Month to 96 Years, Using Data From Doubly Labeled Water Measurements: A Proposal for Air Quality Criteria, Standard Calculations, and Health Risk Assessment ...................................................................................................6-7
6.3.2. Arcus-Arth and Blaisdell (2007)—Statistical Distributions of Daily Breathing Rates for Narrow Age Groups of Infants and Children ....................................................6-7
6.3.3. Stifelman (2007)—Using Doubly Labeled Water Measurements of Human Energy Expenditure to Estimate Inhalation Rates ...........................................................6-9
6.3.4. U.S. EPA (2009a)—Metabolically Derived Human Ventilation Rates: A Revised Approach Based Upon Oxygen Consumption Rates .......................................................6-9
6.3.5. Key Studies Combined ..................................................................................................6-10 6.4. RELEVANT INHALATION RATE STUDIES ............................................................................6-10
6.4.1. International Commission on Radiological Protection (ICRP) (1981)—Report of the Task Group on Reference Man ................................................................................6-10
6.4.2. U.S. EPA (1985)—Development of Statistical Distributions or Ranges of Standard Factors Used in Exposure Assessment ............................................................ 6-11
6.4.3. Shamoo et al. (1990)—Improved Quantitation of Air Pollution Dose Rates by Improved Estimation of Ventilation Rate ....................................................................... 6-11
6.4.4. Shamoo et al. (1991)—Activity Patterns in a Panel of Outdoor Workers Exposed to Oxidant Pollution .......................................................................................................6-12
6.4.5. Linn et al. (1992)—Documentation of Activity Patterns in “High-Risk” Groups Exposed to Ozone in the Los Angeles Area ...................................................................6-13
6.4.6. Shamoo et al. (1992)—Effectiveness of Training Subjects to Estimate Their Level of Ventilation .......................................................................................................6-14
6.4.7. Spier et al. (1992)—Activity P atterns in Elementary and High School Students Exposed to Oxidant Pollution ........................................................................................6-15
6.4.8. Adams (1993)—Measurement of Breathing Rate and Volume in Routinely Performed Daily Activities, Final Report ......................................................................6-15
6.4.9. Layton (1993)—Metabolically Consistent Breathing Rates for Use in Dose Assessments ...................................................................................................................6-16
6.4.10. Linn et al. (1993)—Activity Patterns in Ozone Exposed Construction Workers ...........6-18 6.4.11. Rusconi et al. (1994)—Reference Values for Respiratory Rate in the First 3
Years of Life ..................................................................................................................6-18 6.4.12. Price et al. (2003)—Modeling Interindividual Variation in Physiological Factors
Used in PBPK Models of Humans.................................................................................6-19 6.4.13. Brochu et al. (2006a)—Physiological Daily Inhalation Rates for Free-Living
Pregnant and Lactating Adolescents and Women Aged 11 to 55 Years, Using Data From Doubly Labeled Water Measurements for Use in Health Risk Assessment ....................................................................................................................6-19
6.4.14. Allan et al. (2009)—Inhalation Rates for Risk Assessments Involving Construction Workers in Canada ...................................................................................6-20
6.5. REFERENCES FOR CHAPTER 6 ..............................................................................................6-21

Exposure Factors Handbook
Chapter 6—Inhalation Rates
Page Exposure Factors Handbook September 2011 6-ii
LIST OF TABLES
Table 6-1. Recommended Long-Term Exposure Values for Inhalation (males and females combined) ........ 6-3 Table 6-2. Recommended Short-Term Exposure Values for Inhalation (males and females combined) ........ 6-4 Table 6-3. Confidence in Recommendations for Long- and Short-Term Inhalation Rates ............................ 6-6 Table 6-4. Distribution Percentiles of Physiological Daily Inhalation Rates (PDIRs) (m3/day) for
Free-Living Normal-Weight Males and Females Aged 2.6 Months to 96 Years ......................... 6-24 Table 6-5. Mean and 95th Percentile Inhalation Rate Values (m3/day) for Free-Living Normal-Weight
Males, Females, and Males and Females Combined ................................................................... 6-25 Table 6-6. Distribution Percentiles of Physiological Daily Inhalation Rates (PDIRs) (m3/day) for
Free-Living Normal-Weight and Overweight/Obese Males and Females Aged 4 to 96 Years ... 6-27 Table 6-7. Distribution Percentiles of Physiological Daily Inhalation Rates (PDIRs) per Unit of
Body Weight (m3/kg-day) for Free-Living Normal-Weight Males and Females Aged 2.6 Months to 96 Years...................................................................................................................... 6-28
Table 6-8. Distribution Percentiles of Physiological Daily Inhalation Rates (PDIRs) (m3/kg-day) for Free-Living Normal-Weight and Overweight/Obese Males and Females Aged 4 to 96 Years ... 6-29
Table 6-9. Physiological Daily Inhalation Rates (PDIRs) for Newborns Aged 1 Month or Less ................ 6-30 Table 6-10. Non-Normalized Daily Inhalation Rates (m3/day) Derived Using L ayton’s (1993) Method
and CSFII Energy Intake Data .................................................................................................... 6-31 Table 6-11. Mean and 95th Percentile Inhalation Rate Values (m3/day) for Males and Females Combined .. 6-32 Table 6-12. Summary of Institute of Medicine (IOM) Energy Expenditure Recommendations for Active
and Very Active People With Equivalent Inhalation Rates ......................................................... 6-33 Table 6-13. Mean Inhalation Rate Values (m3/day) for Males, Females, and Males and Females
Combined .................................................................................................................................... 6-34 Table 6-14. Descriptive Statistics for Daily Average Inhalation Rate in Males, by Age Category ................ 6-35 Table 6-15. Descriptive Statistics for Daily Average Inhalation Rate in Females, by Age Category ............. 6-36 Table 6-16. Mean and 95th Percentile Inhalation Rate Values (m3/day) for Males, Females, and
Males and Females Combined .................................................................................................... 6-37 Table 6-17. Descriptive Statistics for Average Ventilation Rate, Unadjusted for Body Weight, While
Performing Activities Within the Specified Activity Category, for Males by Age Category ...... 6-39 Table 6-18. Descriptive Statistics for Average Ventilation Rate, Adjusted for Body Weight, While
Performing Activities Within the Specified Activity Category, for Males by Age Category ...... 6-43 Table 6-19. Descriptive Statistics for Average Ventilation Rate, Unadjusted for Body Weight, While
Performing Activities Within the Specified Activity Category, for Females by Age Category ... 6-47 Table 6-20. Descriptive Statistics for Average Ventilation Rate, Adjusted for Body Weight, While
Performing Activities Within the Specified Activity Category, for Females by Age Category ... 6-51 Table 6-21. Descriptive Statistics for Duration of Time (hours/day) Spent Performing Activities
Within the Specified Activity Category, by Age for Males ......................................................... 6-55 Table 6-22. Descriptive Statistics for Duration of Time (hours/day) Spent Performing Activities
Within the Specified Activity Category, by Age for Females ..................................................... 6-58 Table 6-23. Mean Inhalation Rate Values (m3/day) From Key Studies for Males and Females Combined ... 6-61 Table 6-24. 95th Percentile Inhalation Rate Values (m3/day) From Key Studies for
Males and Females Combined .................................................................................................... 6-62 Table 6-25. Concordance of Age Groupings Among Key Studies ................................................................. 6-63 Table 6-26. Time Weighted Average of Daily Inhalation Rates (DIRs) Estimated From Daily Activities ..... 6-64 Table 6-27. Selected Inhalation Rate Values During Different Activity Levels Obtained From Various
Literature Sources ....................................................................................................................... 6-65 Table 6-28. Summary of Human Inhalation Rates by Activity L evel (m3/hour) ............................................ 6-66 Table 6-29. Estimated Minute Ventilation Associated With Activity Level for Average Male Adult............. 6-66 Table 6-30. Activity Pattern Data Aggregated for Three Microenvironments by Activity Level for
All Age Groups ........................................................................................................................... 6-67 Table 6-31. Summary of Daily Inhalation R ates (DIRs) Grouped by Age and Activity Level ...................... 6-67 Table 6-32. Distribution Pattern of Predicted Ventilation Rate (VR) and Equivalent Ventilation Rate
(EVR) for 20 Outdoor Workers ................................................................................................... 6-68 Table 6-33. Distribution Pattern of Inhalation Rate by Location and Activity Type for 20 Outdoor
Workers ....................................................................................................................................... 6-69

Exposure Factors Handbook
Chapter 6—Inhalation Rates
Exposure Factors Handbook Page September 2011 6-iii
LIST OF TABLES (continued) Table 6-34. Calibration and Field Protocols for Self-Monitoring of Activities Grouped by Subject
Panels .......................................................................................................................................... 6-70 Table 6-35. Subject Panel Inhalation Rates by Mean Ventilation Rate (VR), Upper Percentiles, and
Self-Estimated Breathing Rates .................................................................................................. 6-71 Table 6-36. Actual Inhalation Rates Measured at Four Ventilation Levels .................................................... 6-71 Table 6-37. Distribution of Predicted Inhalation Rates by Location and Activity Levels for Elementary
and High School Students ........................................................................................................... 6-72 Table 6-38. Average Hours Spent per Day i n a Given Location and Activity L evel for Elementary and
High School Students .................................................................................................................. 6-73 Table 6-39. Distribution Patterns of Daily Inhalation Rates (DIRs) for Elementary (EL) and High
School (HS) Students Grouped by Activity Level ...................................................................... 6-73 Table 6-40. Mean Minute Inhalation Rate (m3/minute) by Group and Activity for Laboratory Protocols ..... 6-74 Table 6-41. Mean Minute Inhalation Rate (m3/minute) by Group and Activity for Field Protocols .............. 6-74 Table 6-42. Summary of Average Inhalation Rates (m3/hour) by Age Group and Activity L evels for
Laboratory Protocols ................................................................................................................... 6-75 Table 6-43. Summary of Average Inhalation Rates (m3/hour) by Age Group And Activity Levels in
Field Protocols ............................................................................................................................ 6-76 Table 6-44. Comparisons of Estimated Basal Metabolic Rates (BMR) With Average Food-Energy
Intakes (EFDs) for Individuals S ampled in the 1977−1978 NFCS ............................................. 6-77 Table 6-45. Daily Inhalation Rates (DIRs) Calculated From Food-Energy Intakes (EFDs) .......................... 6-78 Table 6-46. Statistics of the Age/Sex Cohorts Used to Develop Regression Equations for Predicting
Basal Metabolic Rates (BMR) .................................................................................................... 6-79 Table 6-47. Daily Inhalation Rates (DIRs) Obtained From the Ratios of Total Energy
Expenditure to Basal Metabolic Rate (BMR) ............................................................................. 6-79 Table 6-48. Daily Inhalation Rates (DIRs) Based on Time-Activity Survey ................................................. 6-80 Table 6-49. Inhalation Rates for Short-Term Exposures ................................................................................ 6-81 Table 6-50. Distributions of Individual and Group Inhalation/Ventilation Rate (VR) for Outdoor
Workers ....................................................................................................................................... 6-82 Table 6-51. Individual Mean Inhalation Rate (m3/hour) by S elf-Estimated Breathing Rate or Job
Activity Category for Outdoor Workers ...................................................................................... 6-82 Table 6-52. Mean, Median, and SD of Inhalation Rate According to Waking or Sleeping in 618 Infants
and Children Grouped in Classes of Age .................................................................................... 6-83 Table 6-53. Distribution of Physiological Daily Inhalation Rate (PDIR) (m3/day) Percentiles for
Free-Living Underweight Adolescents and Women Aged 11 to 55 Years During Pregnancy and Postpartum Weeks .............................................................................................. 6-84
Table 6-54. Distribution of Physiological Daily Inhalation Rate (PDIR) (m3/day) Percentiles for Free-Living Normal-Weight Adolescents and Women Aged 11 to 55 Years During Pregnancy and Postpartum Weeks .............................................................................................. 6-85
Table 6-55. Distribution of Physiological Daily Inhalation Rate (PDIR) (m3/day) Percentiles for Free-Living Overweight/Obese Adolescents and Women Aged 11 to 55 Years During Pregnancy and Postpartum Weeks .............................................................................................. 6-86
Table 6-56. Distribution of Physiological Daily Inhalation Rate (PDIR) (m3/kg-day) Percentiles for Free-Living Underweight Adolescents and Women Aged 11 to 55 Years During Pregnancy and Postpartum Weeks ................................................................................................................ 6-87
Table 6-57. Distribution of Physiological Daily Inhalation Rate (PDIR) (m3/kg-day) Percentiles for Free-Living Normal-Weight and Women Aged 11 to 55 Years During Pregnancy and Postpartum Weeks ....................................................................................................................... 6-88
Table 6-58. Distribution of Physiological Daily Inhalation Rate (PDIR) (m3/kg-day) Percentiles for Free-Living Overweight/Obese Adolescents and Women Aged 11 to 55 Years During Pregnancy and Postpartum Weeks .............................................................................................. 6-89

Exposure Factors Handbook
Chapter 6—Inhalation Rates
Page Exposure Factors Handbook September 2011 6-iv
LIST OF FIGURES
Figure 6-1. 5th, 10th, 25th, 50th, 75th, 90th, and 95th Smoothed Centiles by Age in Awake Subjects. ............... 6-90 Figure 6-2. 5th, 10th, 25th, 50th, 75th, 90th, and 95th Smoothed Centiles by Age in Asleep Subjects. ............... 6-90

Exposure Factors Handbook
Chapter 6—Inhalation Rates
This page intentionally left blank
Exposure Factors Handbook Page September 2011 6-v

Exposure Factors Handbook
Chapter 6—Inhalation Rates 6. INHALATION RATES 6.1. INTRODUCTION
Ambient and indoor air are potential sources of exposure to toxic substances. Adults and children can be exposed to contaminated air during a variety of activities in different environments. They may be exposed to contaminants in ambient air and may also inhale chemicals from the indoor use of various sources (e.g., stoves, heaters, fireplaces, and consumer products) as well as from those that infiltrate from ambient air.
The Agency defines exposure as the chemical concentration at the boundary of the body (U.S. EPA, 1992). In the case of inhalation, the situation is complicated by the fact that oxygen exchange with carbon dioxide takes place in the distal portion of the lung. The anatomy and physiology of the respiratory system as well as the characteristics of the inhaled agent diminishes the pollutant concentration in inspired air (potential dose) such that the amount of a pollutant that actually enters the body through the upper respiratory tract (especially the nasal-pharyngeal and tracheo-bronchial regions) and lung (internal dose) is less than that measured at the boundary of the body. A detailed discussion of this concept can be found in Guidelines for Exposure Assessment (U.S. EPA, 1992). Suggestions for further reading on the anatomy and physiology of the respiratory system include Phalen et al. (1990), Bates (1989), Cherniack (1972), Forster et al. (1986), and West (2008a, b). When constructing risk assessments that concern the inhalation route of exposure, one must be aware of any adjustments that have been employed in the estimation of the pollutant concentration to account for this reduction in potential dose.
There are also a number of resources available in the literature describing various approaches and techniques related to inhalation rate estimates, including Ridley et al. (2008), Ridley and Olds (2008), Speakman and Selman (2003), Thompson et al. (2009), and Westerterp (2003).
Inclusion of this chapter in the Exposure Factors Handbook does not imply that assessors will always need to select and use inhalation rates when evaluating exposure to air contaminants. For example, it is unnecessary to calculate inhaled dose when using dose-response factors from the Integrated Risk Information System (IRIS) (U.S. EPA, 1994), because the IRIS methodology accounts for inhalation rates in the development of “dose-response” relationships. Information in this chapter may be used by toxicologists in their derivation of human equivalent concentrations (HECs), where adjustments are usually required to
account for differences in exposure scenarios or populations (U.S. EPA, 1994). Inhalation dosimetry and the factors affecting the disposition of particles and gases that may be deposited or taken up in t he respiratory tract are discussed in more detail in the U.S. Environmental Protection Agency’s (EPA’s) report on Methods for Derivation of Inhalation Reference Concentrations (RfCs) and Application of Inhalation Dosimetry (U.S. EPA, 1994). When using IRIS for inhalation risk assessments, “dose-response” relationships require only an average air concentration to evaluate health concerns:
For non-carcinogens, IRIS uses Reference
Concentrations (RfCs), which are expressed in concentration units. Hazard is evaluated by comparing the inspired air concentration to the RfC.
For carcinogens, IRIS uses unit risk values, which are expressed in inverse concentration units. Risk is evaluated by multiplying the unit risk by the inspired air concentration.
Detailed descriptions of the IRIS methodology for derivation of inhalation RfCs can be found in two methods manuals produced by the Agency (U.S. EPA, 1994, 1992).
The Superfund Program has also updated its approach for determining inhalation risk, eliminating the use of inhalation rates when evaluating exposure to air contaminants (U.S. EPA, 2009b). The current methodology recommends that risk assessors use the concentration of the chemical in air as the exposure metric (e.g., mg/m3), instead of the intake of a contaminant in air based on inhalation rate and body weight (e.g., mg/kg-day).
Due to their size, physiology, behavior, and activity level, the inhalation rates of children differ from those of adults. Infants and children have a higher resting metabolic rate and oxygen consumption rate per unit of body weight than adults because of their rapid growth and relatively larger lung surface area (SA) per unit of body weight. For example, the oxygen consumption rate for a resting infant between 1 week and 1 year of age is 7 milliliters per kilogram of body weight (mL/kg) per minute, while the rate for an adult under the same conditions is 3−5 mL/kg per minute (WHO, 1986). Thus, while greater amounts of air and pollutants are inhaled by adults than children over similar time periods on an absolute basis, the relative volume of air passing through the lungs of a resting infant is up to twice that of a resting adult on a body-weight basis. It should be noted that lung volume is correlated, among other factors, with a person’s
Exposure Factors Handbook Page September 2011 6-1

Exposure Factors Handbook
Chapter 6—Inhalation Rates
height. Also, people living in higher altitudes have larger lung capacity than those living at sea level.
Children’s inhalation dosimetry and health effects were topics of discussion at a U.S. Environmental Protection Agency workshop held in June 2006 (Foos and Sonawane, 2008). Age-related differences in lung structure and function, breathing patterns, and how these affect the inhaled dose and the deposition of particles in the lung are important factors in assessing risks from inhalation exposures (Foos et al., 2008). Children more often than adults, breathe through their mouths and, therefore, may have a lesser nasal contribution to breathing during rest and while performing various activities. The uptake of particles in the nasal airways is also less efficient in children (Bennett et al., 2008). Thus, the deposition of particles in the lower respiratory tract may be greater in children (Foos et al., 2008). In addition, the rate of fine particle deposition has been significantly correlated with increased body mass index (BMI), an important point as childhood obesity becomes a greater issue (Bennett and Zeman, 2004).
Recommended inhalation rates (both long- and short-term) for adults and children are provided in Section 6.2, along with the confidence ratings for these recommendations, which are based on four key studies identified by U.S. EPA for this factor. Long-term inhalation is repeated exposure for more than 30 days, up to approximately 10% of the life span in humans (more than 30 days). Long-term inhalation rates for adults and children (including infants) are presented as daily rates (m3/day). Short-term exposure is repeated exposure for more than 24 hours, up to 30 days. Short-term inhalation rates are reported for adults and children (including infants) performing various activities in m3/minute. Following the recommendations, the available studies (both key and relevant studies) on inhalation rates are summarized.
6.2. RECOMMENDATIONS The recommended inhalation rates for adults and
children are based on three recent studies (U.S. EPA, 2009a; Stifelman, 2007; Brochu et al., 2006b), as well as an additional study of children (Arcus-Arth and Blaisdell, 2007). These studies represent an improvement upon those previously used for recommended inhalation rates in earlier versions of this handbook, because they use a large data set that is representative of the United States as a whole and consider the correlation between body weight and inhalation rate.
The selection of inhalation rates to be used for exposure assessments depends on the age of the exposed population and the specific activity levels of this population during various exposure scenarios. Table 6-1 presents the recommended long-term
values for adults and children (including infants) for use in various exposure scenarios. For children, the age groups included are from U.S. EPA’s Guidance on Selecting Age Groups for Monitoring and Assessing Childhood Exposures to Environmental Contaminants (U.S. EPA, 2005a). Section 6.3.5 describes how key studies were combined to derive the mean and 95th percentile inhalation rate values and the concordance between the age groupings used for adults and children in this chapter and the original age groups in the key studies.
As shown in Table 6-1, the daily average inhalation rates for long-term exposures for children (males and females combined, unadjusted for body weight) range from 3.5 m3/day for children from 1 to <3 months to 16.3 m3/day for children aged 16 to <21 years. Mean values for adults range from 12.2 m3/day (81 years and older) to 16.0 m3/day (31 to <51 years). The 95th percentile values for children range from 5.8 m3/day (1 to <3 months) to 24.6 m3/day (16 to <21 years) and for adults range from 15.7 m3/day (81 years and older) to 21.4 m3/day (31 to <41 years). The mean and 95th percentile values shown in Table 6-1 represent averages of the inhalation rate data from the key studies for which data were available for selected age groups.
It should be noted that there may be a high degree of uncertainty associated with the upper percentiles. These values represent unusually high estimates of caloric intake per day and are not representative of the average adult or child. For example, using Layton’s equation (Layton, 1993) for estimating metabolically consistent inhalation rates to calculate caloric equivalence (see Section 6.4.9), the 95th percentile value for 16 to <21-year-old children is greater than 4,000 kcal/day (Stifelman, 2003). All of the 95th percentile values listed in Table 6-1 represent unusually high inhalation rates for long-term exposures, even for the upper end of the distribution, but were included in this handbook to provide exposure assessors a sense of the possible range of inhalation rates for adults and children. These values should be used with caution when estimating long-term exposures.
Short-term mean and 95th percentile data in m3/minute are provided in Table 6-2 for males and females combined for adults and children for whom activity patterns are known. These values represent averages of the activity level data from the one key study from which short-term inhalation rate data were available (U.S. EPA, 2009a).
Table 6-3 shows the confidence ratings for the inhalation rate recommendations. Table 6-4, Table 6-6 through Table 6-8, Table 6-10, Table 6-14, Table 6-15, and Table 6-17 through Table 6-20 provide multiple percentiles for long- and short-term inhalation rates for both males and females.
Page Exposure Factors Handbook September 2011 6-2

Exposure Factors Handbook
Chapter 6—Inhalation Rates
Table 6-1. Recommended Long-Term Exposure Values for Inhalation (males and females combined)
Age Groupa Mean
(m3/day)
Sources Used for Means
95th Percentileb
(m3/day)
Sources Used for 95th
Percentiles Multiple Percentiles
Birth to <1 month
3.6 c 7.1 c
See Table 6-4, Table 6-6 through Table 6-8,
Table 6-10, Table 6-14 Table 6-15 [none
available for Stifelman (2007)]
1 to <3 months 3.5 c, d 5.8 c, d
3 to <6 months 4.1 c, d 6.1 c, d
6 to <12 months 5.4 c, d 8.0 c, d
Birth to <1 year 5.4 c, d, e, f 9.2 c, d, e
1 to <2 years 8.0 c, d, e, f 12.8 c, d, e
2 to <3 years 8.9 c, d, e, f 13.7 c, d, e
3 to <6 years 10.1 c, d, e, f 13.8 c, d, e
6 to <11 years 12.0 c, d, e, f 16.6 c, d, e
11 to <16 years 15.2 c, d, e, f 21.9 c, d, e
16 to <21 years 16.3 c, d, e, f 24.6 c, d, e
21 to <31 years 15.7 d, e, f 21.3 d, e
31 to <41 years 16.0 d, e, f 21.4 d, e
41 to <51 years 16.0 d, e, f 21.2 d, e
51 to <61 years 15.7 d, e, f 21.3 d, e
61 to <71 years 14.2 d, e, f 18.1 d, e
71 to <81 years 12.9 d, e 16.6 d, e
≥81 years 12.2 d, e 15.7 d, e a When age groupings in the original reference did not match the U.S. EPA groupings used for this
handbook, means from all age groupings in the original reference that overlapped U.S. EPA’s age groupings by more than one year were averaged, weighted by the number of observations contributed from each age group. Similar calculations were performed for the 95th percentiles. See Table 6-25 for concordance with U.S. EPA age groupings.
b Some 95th percentile values may be unrealistically high and not representative of the average person.
c Arcus-Arth and Blaisdell (2007). d Brochu et al. (2006b). e U.S. EPA (2009a). f Stifelman (2007).
Exposure Factors Handbook Page September 2011 6-3

Exposure Factors Handbook
Chapter 6—Inhalation Rates
Table 6-2. Recommended Short-Term Exposure Values for Inhalation (males and females combined)
Activity Level Age Group
(years) Mean
(m3/minute) 95th Percentile (m3/minute) Multiple Percentiles
Sleep or Nap Birth to <1 3.0E−03 4.6E−03
See Table 6-17 and Table 6-19
1 to <2 4.5E−03 6.4E−03
2 to <3 4.6E−03 6.4E−03
3 to <6 4.3E−03 5.8E−03
6 to <11 4.5E−03 6.3E−03
11 to <16 5.0E−03 7.4E−03
16 to <21 4.9E−03 7.1E−03
21 to <31 4.3E−03 6.5E−03
31 to <41 4.6E−03 6.6E−03
41 to <51 5.0E−03 7.1E−03
51 to <61 5.2E−03 7.5E−03
61 to <71 5.2E−03 7.2E−03
71 to <81 5.3E−03 7.2E−03
≥81 5.2E−03 7.0E−03
Sedentary/ Passive
Birth to <1 3.1E−03 4.7E−03
1 to <2 4.7E−03 6.5E−03
2 to <3 4.8E−03 6.5E−03
3 to <6 4.5E−03 5.8E−03
6 to <11 4.8E−03 6.4E−03
11 to <16 5.4E−03 7.5E−03
16 to <21 5.3E−03 7.2E−03
21 to <31 4.2E−03 6.5E−03
31 to <41 4.3E−03 6.6E−03
41 to <51 4.8E−03 7.0E−03
51 to <61 5.0E−03 7.3E−03
61 to <71 4.9E−03 7.3E−03
71 to <81 5.0E−03 7.2E−03
≥81 4.9E−03 7.0E−03
Light Intensity Birth to <1 7.6E−03 1.1E−02
1 to <2 1.2E−02 1.6E−02
2 to <3 1.2E−02 1.6E−02
3 to <6 1.1E−02 1.4E−02
6 to <11 1.1E−02 1.5E−02
11 to <16 1.3E−02 1.7E−02
16 to <21 1.2E−02 1.6E−02
Page Exposure Factors Handbook September 2011 6-4

Exposure Factors Handbook
Chapter 6—Inhalation Rates
Table 6-2. Recommended Short-Term Exposure Values for Inhalation (males and females combined) (continued)
Activity Level Age Group
(year) Mean
(m3/minute) 95th Percentile (m3/minute) Multiple Percentiles
Light Intensity (continued)
21 to <31 1.2E−02 1.6E−02
31 to <41 1.2E−02 1.6E−02
41 to <51 1.3E−02 1.6E−02
51 to <61 1.3E−02 1.7E−02
61 to <71 1.2E−02 1.6E−02
71 to <81 1.2E−02 1.5E−02
≥81 1.2E−02 1.5E−02
Moderate Intensity
Birth to <1 1.4E−02 2.2E−02
1 to <2 2.1E−02 2.9E−02
2 to <3 2.1E−02 2.9E−02
3 to <6 2.1E−02 2.7E−02
6 to <11 2.2E−02 2.9E−02
11 to <16 2.5E−02 3.4E−02
16 to <21 2.6E−02 3.7E−02
21 to <31 2.6E−02 3.8E−02
31 to <41 2.7E−02 3.7E−02
41 to <51 2.8E−02 3.9E−02
51 to <61 2.9E−02 4.0E−02
61 to <71 2.6E−02 3.4E−02
71 to <81 2.5E−02 3.2E−02
≥81 2.5E−02 3.1E−02
High Intensity Birth to <1 2.6E−02 4.1E−02
1 to <2 3.8E−02 5.2E−02
2 to <3 3.9E−02 5.3E−02
3 to <6 3.7E−02 4.8E−02
6 to <11 4.2E−02 5.9E−02
11 to <16 4.9E−02 7.0E−02
16 to <21 4.9E−02 7.3E−02
21 to <31 5.0E−02 7.6E−02
31 to <41 4.9E−02 7.2E−02
41 to <51 5.2E−02 7.6E−02
51 to <61 5.3E−02 7.8E−02
61 to <71 4.7E−02 6.6E−02
71 to <81 4.7E−02 6.5E−02
≥81 4.8E−02 6.8E−02
Source: U.S. EPA (2009a).
Exposure Factors Handbook Page September 2011 6-5

Exposure Factors Handbook
Chapter 6—Inhalation Rates
Table 6-3. Confidence in Recommendations for Long- and Short-Term Inhalation Rates
General Assessment Factors Rationale Rating
Soundness Adequacy of Approach
Minimal (or defined) Bias
The survey methodology and data analysis was adequate. Measurements were made by indirect methods. The studies analyzed existing primary data.
Potential bias within the studies was fairly well documented.
Medium
Applicability and Utility Exposure Factor of Interest
Representativeness
Currency
Data-Collection Period
The studies focused on inhalation rates and factors influencing them.
The studies focused on the U.S. population. A wide range of age groups were included.
The studies were published during 2006 and 2009 and represent current exposure conditions.
The data-collection period for the studies may not be representative of long-term exposures.
High
Clarity and Completeness Accessibility
Reproducibility
Quality Assurance
All key studies are available from the peer-reviewed literature.
The methodologies were clearly presented; enough information was included to reproduce most results.
Information on ensuring data quality in the key studies was limited.
Medium
Variability and Uncertainty Variability in Population
Uncertainty
In general, the key studies addressed variability in inhalation rates based on age and activity level. Although some factors affecting inhalation rate, such as body mass, are discussed, other factors (e.g., ethnicity) are omitted.
Multiple sources of uncertainty exist for these studies. Assumptions associated with energy expenditure (EE)-based estimation procedures are a source of uncertainty in inhalation rate estimates.
Medium
Evaluation and Review Peer Review
Number and Agreement of Studies
Three of the key studies appeared in peer-reviewed journals, and one key study is a U.S. EPA peer-reviewed report.
There are four key studies. The results of studies from different researchers are in general agreement.
High
Overall Rating Medium
Page Exposure Factors Handbook September 2011 6-6

Exposure Factors Handbook
Chapter 6—Inhalation Rates 6.3. KEY INHALATION RATE STUDIES 6.3.1. Brochu et al. (2006b)—Physiological
Daily Inhalation Rates for Free-Living Individuals Aged 1 Month to 96 Years, Using Data From Doubly Labeled Water Measurements: A Proposal for Air Quality Criteria, Standard Calculations, and Health Risk Assessment
Brochu et al. (2006b) calculated physiological daily inhalation rates (PDIRs) for 2,210 individuals aged 3 weeks to 96 years using the reported disappearance rates of oral doses of doubly labeled water (DLW) (2H2O and H2
18O) in urine, monitored by gas-isotope-ratio mass spectrometry for an aggregate period of more than 30,000 days. DLW data were complemented with indirect calorimetry and nutritional balance measurements.
In the DLW method, the disappearance of the stable isotopes deuterium (2H) and heavy oxygen-18 (18O) are monitored in urine, saliva, or blood samples over a long period of time (from 7 to 21 days) after subjects receive oral doses of 2H2O and H2
18O. The disappearance rate of 2H reflects water output and
18Othat of represents water output plus carbon dioxide (CO2) production rates. The CO2 production rate is then calculated by finding the difference between the two disappearance rates. Total daily energy expenditures (TDEEs) are determined from CO2 production rates using classic respirometry formulas, in which values for the respiratory quotient (RQ = CO2 produced/O2 consumed) are derived from the composition of the diet during the period of time of each study. The DLW method also allows for measurement of the energy cost of growth (ECG). TDEE and ECG measurements can be converted into PDIR values using the following equation developed by Layton (1993):
PDIR = (TDEE + ECG) × H × VQ × 10−3 (Eqn. 6-1)
where:
PDIR = physiological daily inhalation rates (m3/day);
TDEE = total daily energy expenditure (kcal/day);
ECG = stored daily energy cost for growth (kcal/day);
H = oxygen uptake factor, volume of 0.21 L of oxygen (at standard temperature and pressure, dry air) consumed to produce 1 kcal of energy expended;
VQ = ventilatory equivalent (ratio of the minute volume [VE] at body temperature pressure saturation to the oxygen uptake rate [VO2] at standard temperature and pressure, dry air) VE/VO2 = 27; and
10−3 = conversion factor (L/m3).
Brochu et al. (2006b) calculated daily inhalation rates (DIRs) (expressed in m3/day and m3/kg-day) for the following age groups and physiological conditions: (1) healthy newborns aged 3 to 5 weeks old (N = 33), (2) healthy normal-weight males and females aged 2.6 months to 96 years (N = 1,252), (3) low-BMI subjects (underweight women, N = 17; adults from less affluent societies N = 59) and (4) overweight/obese individuals (N = 679), as well as (5) athletes, explorers, and soldiers when reaching very high energy expenditures (N = 170). Published data on BMI, body weight, basal metabolic rate (BMR), ECG, and TDEE measurements (based on DLW method and indirect calorimetry) for subjects aged 2.6 months to 96 years were used. Data for underweight, healthy normal-weight, and overweight/obese individuals were gathered and defined according to BMI cutoffs. Data for newborns were included regardless of BMI values because they were clinically evaluated as being healthy infants.
Table 6-4 to Table 6-8 present the distribution of daily inhalation rates for normal-weight and overweight/obese individuals by sex and age groups. Table 6-9 presents mean inhalation rates for newborns. Due to the insufficient number of subjects, no distributions were derived for this group.
An advantage of this study is that data are provided for age groups of less than 1 year. A limitation of this study is that data for individuals with pre-existing medical conditions were lacking.
6.3.2. Arcus-Arth and Blaisdell (2007)— Statistical Distributions of Daily Breathing Rates for Narrow Age Groups of Infants and Children
Arcus-Arth and Blaisdell (2007) derived daily breathing rates for narrow age ranges of children using the metabolic conversion method of Layton (1993) and energy intake (EI) data adjusted to represent the U.S. population from the Continuing Survey of Food Intake for Individuals (CSFII) 1994−1996, 1998. Normalized (m3/kg-day) and non-normalized (m3/day) breathing rates for children 0−18 years of age were derived using the general
Exposure Factors Handbook Page September 2011 6-7

Exposure Factors Handbook
Chapter 6—Inhalation Rates
equation developed by Layton (1993) to calculate energy-dependent inhalation rates:
VE = H × VQ × EE (Eqn. 6-2)
where:
VE = volume of air breathed per day (m3/day),
H = volume of oxygen consumed to produce 1 kcal of energy (m3/kcal),
VQ = ratio of the volume of air to the volume of oxygen breathed per unit time (unitless), and
EE = energy (kcal) expended per day.
Arcus-Arth and Blaisdell (2007) calculated H values of 0.22 and 0.21 for infants and non-infant children, respectively, using the 1977−1978 Nationwide Food Consumption Survey (NFCS) and CSFII data sets. Ventilatory equivalent (VQ) data, including those for infants, were obtained from 13 studies that reported VQ data for children aged 4−8 years. Separate preadolescent (4−8 years) and adolescent (9−18 years) VQ values were calculated in addition to separate VQ values for adolescent boys and girls. Two-day-averaged daily EI values reported in the CSFII data set were used as a surrogate for EE. CSFII records that did not report body weight and those for children who consumed breast milk or were breast-fed were excluded from their analyses. The EIs of children 9 years of age and older were multiplied by 1.2, the value calculated by Layton (1993) to adjust for potential bias related to under-reporting of dietary intakes by older children. For infants, EI values were adjusted by subtracting the amount of energy put into storage by infants as estimated by Scrimshaw et al. (1996). Self-reported body weights for each individual from the CSFII data set were used to calculate non-normalized (m3/day) and normalized (m3/kg-day) breathing rates, which decreased the variability in the resulting breathing rate data. Daily breathing rates were grouped into three 1-month groups for infants, 1-year age groups for children 1 to 18 years of age, and the age groups recommended by U.S. EPA Supplemental Guidance for Assessing Susceptibility from Early-Life Exposure to Carcinogens (U.S. EPA, 2005b) to receive greater weighting for mutagenic carcinogens (0 to <2 years of age, and 2 to <16 years of age). Data were also presented for adolescent boys and girls, aged 9 to 18 years (see Table 6-10). For each age and age-sex group, Arcus-Arth and Blaisdell (2007) calculated the
arithmetic mean, standard error of the mean, percentiles (50th, 90th, and 95th), geometric mean, standard deviation, and best-fit parametric models of the breathing rate distributions. Overall, the CSFII-derived non-normalized breathing rates progressively increased with age from infancy through 18 years of age, while normalized breathing rates progressively decreased. The data are presented in Table 6-11 in units of m3/day. There were statistical differences between boys and girls 9 to 18 years of age, both for these years combined (p < 0.00) and for each year of age separately (p < 0.05). The authors reasoned that since the fat-free mass (basically muscle mass) of boys typically increases during adolescence, and because fat-free mass is highly correlated to basal metabolism which accounts for the majority of EE, non-normalized breathing rates for adolescent boys may be expected to increase with increasing age. Table 6-11 presents the mean and 95th percentile values for males and females combined, averaged to fit within the standard U.S. EPA age groups.
The CSFII-derived mean breathing rates derived by Arcus-Arth and Blaisdell (2007) were compared to the mean breathing rates estimated in studies that utilized DLW technique EE data that had been coupled with the Layton (1993) method. Infants’ breathing rates estimated using the CSFII data were 15 to 27% greater than the comparison DLW EE breathing rates. In contrast, the children’s CSFII breathing rates ranged from 23% less to 14% greater than comparison rates. Arcus-Arth and Blaisdell (2007) concluded that taking into account the differences in methods, data, and some age definitions between the two sets of breathing rates, the CSFII and comparison rates were similar across age groups.
An advantage of this study is that it provides breathing rates specific to narrow age ranges, which can be useful for assessing inhalation dose during periods of greatest susceptibility. However, the study is limited by the potential for misreporting, underestimating, or overestimating of food intake data in the CSFII. In addition to underreporting of food intake by adolescents, EI values for younger children may be under- or overestimated. Overweight children (or their parents) may also under-report food intakes. In addition, adolescents who misreport food intake may have also misreported body weights.
Page Exposure Factors Handbook September 2011 6-8

Exposure Factors Handbook
Chapter 6—Inhalation Rates 6.3.3. Stifelman (2007)—Using Doubly Labeled
Water Measurements of Human Energy Expenditure to Estimate Inhalation Rates
Stifelman (2007) estimated inhalation rates using DLW energy data. The DLW method administers two forms of stable isotopically labeled water: deuterium-labeled (2H2O) and 18oxygen-labeled (H2
18O). The difference in disappearance rates between the two isotopes represents the energy expended over a period of 1−3 half-lives of the labeled water (Stifelman, 2007). The resulting duration of observation is typically 1−3 weeks, depending on the size and activity level.
The DLW database contains subjects from areas around the world and represents diversity in ethnicity, age, activity, body type, and fitness level. DLW data have been compiled by the Institute of Medicine (IOM) Panel on Macronutrients and the Food and Agriculture Organization of the United Nations. Stifelman (2007) used the equation of Layton (1993) to convert the recommended energy levels of IOM for the active to very-active people to their equivalent inhalation rates. The IOM reports recommend energy expenditure levels organized by sex, age, and body size (Stifelman, 2007).
The equivalent inhalation rates are shown in Table 6-12. Shown in Table 6-13 are the mean values for the IOM “active” energy level category, averaged to fit within the standard U.S. EPA age groups. Stifelman (2007) noted that the estimates based on the DLW are consistent with previous findings of Layton (1993) and the Exposure Factors Handbook (U.S. EPA, 1997) and that inhalation rates based on the IOM active classification are consistent with the mean inhalation rate in the handbook.
The advantages of this study are that the inhalation rates were estimated using the DLW data from a large data set. Stifelman (2007) noted that DLW methods are advantageous; the data are robust, measurements are direct and avoid errors associated with indirect measurements (heart rate [HR]), subjects are free-living, and the period of observation is longer than what is possible from staged activity measures. Observations over a longer period of time reduce the uncertainties associated with using short duration studies to infer long-term inhalation rates. A limitation with the study is that the inhalation rates that are presented are for active/very active persons only.
6.3.4. U.S. EPA (2009a)—Metabolically Derived Human Ventilation Rates: A Revised Approach Based Upon Oxygen Consumption Rates
U.S. EPA (2009a) conducted a study to ascertain inhalation rates for children and adults. S pecifically, U.S. EPA sought to improve upon the methodology used by Layton (1993) and other studies that relied upon the VQ and a linear relationship between oxygen consumption and fitness rate. A revised approach, developed by U.S. EPA’s National Exposure Research Laboratory, was used, in which an individual’s inhalation rate was derived from his or her assumed oxygen consumption rate. U.S. EPA applied this revised approach using body -weight data from the 1999−2002 National Health and Nutrition Examination Survey (NHANES) and metabolic equivalents of work (METS) data from U.S. EPA’s Consolidated Human Activity Database (CHAD). In this database, metabolic cost is given in units of “METS” or “metabolic equivalents of work,” an energy expenditure metric used by exercise physiologists and clinical nutritionists to represent activity levels. An activity’s METS value represents a dimensionless ratio of its metabolic rate (energy expenditure) to a person’s resting, or BMR.
NHANES provided age, sex, and body-weight data for 19,022 individuals from throughout the United States. From these data, BMR was estimated using an age-specific linear equation used in the Exposure Factors Handbook (U.S. EPA, 1997), and in several other studies and reference works.
The CHAD database is a compilation of several databases of human activity patterns. U .S. EPA used one of these studies, the National Human Activity Pattern Survey (NHAPS), as its source for METS values because it was more representative of the entire U.S. population than the other studies in the database. The NHAPS data set included activity data for 9,196 individuals, each of w hich provided 24 hours of activity pattern data using a diary-based questionnaire. While NHAPS was identified as the best available data source for activity patterns, there were some shortcomings in the quality of the data. Study respondents did not provide body weights; instead, body weights were simulated using statistical sampling. Also, t he NHAPS data extracted from CHAD could not be corrected to account for non-random sampling of study participants and survey days.
NHANES and NHAPS data were grouped according to the age categories presented elsewhere in this handbook, with the exception that children under the age of 1 year were placed into a single
Exposure Factors Handbook Page September 2011 6-9

Exposure Factors Handbook
Chapter 6—Inhalation Rates
category to preserve an adequate sample size within the category. For each NHANES participant, a “simulated” 24-hour activity pattern was generated by randomly sampling activity patterns from the set of NHAPS participants with the same sex and age category as the NHANES participant. Twenty such patterns were selected at random for each NHANES participant, resulting in 480 hours of simulated activity data for each NHANES participant. The data were then scaled down to a 24-hour time frame to yield an average 24-hour activity pattern for each of the 19,022 NHANES individuals.
Each activity was assigned a METS value based on statistical sampling of the distribution assigned by CHAD to each activity code. For most codes, these distributions were not age dependent, but age was a factor for some activities for which intensity level varies strongly with age. Using statistical software, equations for METS based on normal, lognormal, exponential, triangular, and uniform distributions were generated as needed for the various activity codes. The METS values were then translated into EE by multiplying the METS by the BMR, which was calculated as a linear function of body weight. The oxygen consumption rate (VO2) was calculated by multiplying EE by H, the volume of oxygen consumed per unit of energy. VO2 was calculated both as volume per time and as volume per time per unit of body weight.
The inhalation rate for each activity within the 24-hour simulated activity pattern for each individual was estimated as a function of VO2, body weight, age, and sex. Following this, the average inhalation rate was calculated for each individual for the entire 24-hour period, as well as for four separate classes of activities based on METS value (sedentary/passive [METS less than or equal to 1.5], light intensity [METS greater than 1.5 and less than or equal to 3.0], moderate intensity [METS greater than 3.0 and less than or equal to 6.0], and high intensity [METS greater than 6.0]). Data for individuals were then used to generate summary tables based on sex and age categories.
U.S. EPA (2009a) also conducted a validation exercise using the Air Pollutants Exposure Model to estimate ventilation rates (VRs) and compared results with recently published estimates of ventilation rates from Brochu et al. (2006b; 2006a) and Arcus-Arth and Blaisdell (2007). The results compared reasonably well when ventilation rates were normalized by BMI.
Table 6-14 through Table 6-22 present data from this study. Table 6-14 and Table 6-15 present, for male and female subjects, respectively, summary statistics for daily average inhalation rate by age
category on a volumetric (m3/day) and body-weight adjusted (m3/day-kg) basis. Table 6-16 presents the mean and 95th percentile values for males, females, and males and females combined. Table 6-17 through Table 6-20 present, for male and female subjects, respectively, mean ventilation rates by age category on a volumetric (m3/minute) and body-weight adjusted (m3/minute-kg) basis for the five different activity level ranges described above. Table 6-21 and Table 6-22 present the number of hours spent per day at each activity level by males and females.
An advantage of this study is the large sample size. In addition, the data sets used, NHAPS and NHANES, are representative of the U.S. general population. One limitation is that the NHAPS data are more than 15 years old. Also, day-to-day variability cannot be characterized because data were collected over a 24-hour period. There is also uncertainty in the METs randomization, all of which were noted by the authors. In addition, the approach does not take into consideration correlations that may exist between body weight and activity patterns. Therefore, high physical activity levels can be associated with individuals of high body weight, leading to unrealistically high inhalation rates at the upper percentile levels. The validation exercise presented in U.S. EPA (2009a) used normal-weight individuals. It is unclear if similar results would be obtained for overweight individuals.
6.3.5. Key Studies Combined In order to provide the recommended long-term
inhalation rates shown in Table 6-1, data from the four key studies were combined. Mean and 95th percentile inhalation rate values for the four key studies are shown in Table 6-23 and Table 6-24, respectively. The data from each study were averaged by sex and grouped according to the age groups selected for use in this handbook, when possible. Table 6-25 shows concordance between the age groupings used in this handbook and the original age groups in the key studies.
6.4. RELEVANT INHALATION RATE STUDIES
6.4.1. International Commission on Radiological Protection (ICRP) (1981)— Report of the Task Group on Reference Man
The International Commission on Radiological Protection (ICRP, 1981) estimated daily inhalation rates for reference adult males and females, children (10 years old), infants (1 year old), and newborn
Page Exposure Factors Handbook 6-10 September 2011

Exposure Factors Handbook
Chapter 6—Inhalation Rates babies by using a time-activity-ventilation approach. This approach for estimating an inhalation rate over a specified period of time was based on calculating a time weighted average of inhalation rates associated with physical activities of varying durations (see Table 6-26). ICRP (1981) compiled reference values (see Table 6-27) of minute volume/inhalation rates from various literature sources. ICRP (1981) assumed that the daily activities of a reference male, female, and child (10 years of age) consisted of 8 hours of rest and 16 hours of light activities. It was also assumed that for adults only, the 16 hours of light activities were divided evenly between occupational and non-occupational activities. It was assumed that a day consisted of 14 hours resting and 10 hours light activity for an infant (1 year). A newborn’s daily activities consisted of 23 hours resting and 1-hour light activity. The estimated inhalation rates were 22.8 m3/day for adult males, 21.1 m3/day for adult females, 14.8 m3/day for children (age 10 years), 3.76 m3/day for infants (age 1 year), and 0.78 m3/day for newborns (see Table 6-26).
The advantages of this study are that they account fairly well for time and activity, and are sex specific. A limitation associated with this study is that it is almost 30 years old. In addition, the validity and accuracy of the inhalation rate data used in the compilation of reference values were not specified. This introduces some degree of uncertainty in the results obtained. Also, the approach used required that assumptions be made regarding the hours spent by various age/sex cohorts in specific activities. These assumptions may over-/under-estimate the inhalation rates obtained.
6.4.2. U.S. EPA (1985)—Development of
Statistical Distributions or Ranges of Standard Factors Used in Exposure Assessment
The U.S. EPA (1985) compiled measured values of minute ventilation for various age/sex cohorts from early studies. The data compiled by the U.S. EPA (1985) for each of the age/sex cohorts were obtained at various activity levels (see Table 6-28). These levels were categorized as light, moderate, or heavy according to the criteria developed by the U.S. EPA Office of Environmental Criteria and Assessment for the Ozone Criteria Document. These criteria were developed for a reference male adult with a body weight of 70 kg (U.S. EPA, 1985). Table 6-29 details the estimated minute ventilation rates for adult males based on these activity level categories.
Table 6-28 presents a summary of inhalation rates by age and activity level. A description of activities included in each activity level is also presented in Table 6-28. Table 6-28 indicates that at rest, the average adult inhalation rate is 0.5 m3/hour. Table 6-28 indicates that at rest, the mean inhalation rate for children, ages 6 and 10 years, is 0.4 m3/hour. Table 6-30 presents activity pattern data aggregated for three microenvironments by activity level for all age groups. The total average hours spent indoors was 20.4, outdoors was 1.77, and in a transportation vehicle was 1.77. Based on the data presented in Table 6-28 and Table 6-30, a daily inhalation rate was calculated for adults and children by using a time-activity-ventilation approach. These data are presented for adults and children in Table 6-31. The calculated average daily inhalation rate is 16 m3/day for adults. The average daily inhalation rate for 6and 10-year-old children is 16.74 and 21.02 m3/day, respectively.
Limitations associated with this study are its age and that many of the values used in the data compilation were from early studies. The accuracy and/or validity of the values used and data collection method were not presented in U.S. EPA (1985). This introduces uncertainty in the results obtained. An advantage of this study is that the data are actual measurement data for a large number of adults and children.
6.4.3. Shamoo et al. (1990)—Improved Quantitation of Air Pollution Dose Rates by Improved Estimation of Ventilation Rate
Shamoo et al. (1990) conducted a study to develop and validate new methods to accurately estimate ventilation rates for typical individuals during their normal activities. Two practical approaches were tested for estimating ventilation rates indirectly: (1) volunteers were trained to estimate their own VR at various controlled levels of exercise; and (2) individual VR and HR relationships were determined in another set of volunteers during supervised exercise sessions (Shamoo et al., 1990). In the first approach, the training session involved 9 volunteers (3 females and 6 males) from 21 to 37 years old. Initially the subjects were trained on a treadmill with regularly increasing speeds. VR measurements were recorded during the last minute of the 3-minute interval at each speed. VR was reported to the subjects as low (1.4 m3/hour), medium (1.5−2.3 m3/hour), heavy (2.4−3.8 m3/hour), and very heavy (3.8 m3/hour or higher) (Shamoo et al., 1990).
Exposure Factors Handbook Page September 2011 6-11

Exposure Factors Handbook
Chapter 6—Inhalation Rates
Following the initial test, treadmill training sessions were conducted on a different day in which 7 different speeds were presented, each for 3 minutes in arbitrary order. VR was measured, and the subjects were given feedback with the four ventilation ranges provided previously. After resting, a treadmill testing session was conducted in which seven speeds were presented in different arbitrary order from the training session. VR was measured, and each subject estimated their own ventilation level at each speed. The correct level was then revealed to each subject after his/her own estimate. Subsequently, two 3-hour outdoor supervised exercise sessions were conducted in the summer on 2 consecutive days. Each hour consisted of 15 minutes each of rest, slow walking, jogging, and fast walking. The subjects’ ventilation level and VR were recorded; however, no feedback was given to the subjects. Electrocardiograms were recorded via direct connection or telemetry, and HR was measured concurrently with ventilation measurement for all treadmill sessions.
The second approach consisted of two protocol phases (indoor/outdoor exercise sessions and field testing). Twenty outdoor adult workers between 19 and 50 years old were recruited. Indoor and outdoor supervised exercises similar to the protocols in the first approach were conducted; however, there were no feedbacks. Also, in this approach, electrocardiograms were recorded, and HR was measured concurrently with VR. During the field testing phase, subjects were trained to record their activities during three different 24-hour periods during 1 week. These periods included their most active working and non-working days. HR was measured quasi-continuously during the 24-hour periods that activities were recorded. The subjects recorded in a diary all changes in physical activity, location, and exercise levels during waking hours. Self-estimated activities in supervised exercises and field studies were categorized as slow (resting, slow walking or equivalent), medium (fast walking or equivalent), and fast (jogging or equivalent).
Inhalation rates were not presented in this study. In the first approach, about 68% of all self-estimates were correct for the 9 subjects sampled (Shamoo et al., 1990). Inaccurate self-estimates occurred in the younger male population who were highly physically fit and were competitive aerobic trainers. This subset of the sample population tended to underestimate their own physical activity levels at higher VR ranges. Shamoo et al. (1990) attributed this to a “macho effect,” in which these younger male subjects were reluctant to report “very heavy” exercise even when it was obvious to an observer, because they considered it an admission of poor physical
condition. In the second approach, a regression analysis was conducted that related the logarithm of VR to HR. The logarithm of VR correlated better with HR than VR itself (Shamoo et al., 1990).
Limitations associated with this study are its age and that the population sampled is not representative of the general U.S. population. Also, ventilation rates were not presented. Training individuals to estimate their VR may contribute to uncertainty in the results because the estimates are subjective. Another limitation is that calibration data were not obtained at extreme conditions; therefore, the VR/HR relationship obtained may be biased. An additional limitation is that training subjects may be too labor-intensive for widespread use in exposure assessment studies. An advantage of this study is that HR recordings are useful in predicting ventilation rates, which, in turn, are useful in estimating exposure.
6.4.4. Shamoo et al. (1991)—Activity Patterns in a Panel of Outdoor Workers Exposed to Oxidant Pollution
Shamoo et al. (1991) investigated summer activity patterns in 20 adult volunteers with potentially high exposure to ambient oxidant pollution. The selected volunteer subjects were 15 men and 5 women ages 19−50 years from the Los Angeles area. All volunteers worked outdoors at least 10 hours per week. The experimental approach involved two stages: (1) indirect objective estimation of VR from HR measurements, and (2) self-estimation of inhalation/ventilation rates recorded by subjects in diaries during their normal activities.
The approach consisted of calibrating the relationship between VR and HR for each test subject in controlled exercise; monitoring by subjects of their own normal activities with diaries and electronic HR recorders; and then relating VR with the activities described in the diaries (Shamoo et al., 1991). Calibration tests were conducted for indoor and outdoor supervised exercises to determine individual relationships between VR and HR. Indoors, each subject was tested on a treadmill at rest and at increasing speeds. HR and VR were measured at the third minute at each 3-minute interval speed. In addition, subjects were tested while walking a 90-meter course in a corridor at 3 self-selected speeds (normal, slower than normal, and faster than normal) for 3 minutes.
Two outdoor testing sessions (1 hour each) were conducted for each subject, 7 days apart. Subjects exercised on a 260-meter asphalt course. A session
Page Exposure Factors Handbook 6-12 September 2011

Exposure Factors Handbook
Chapter 6—Inhalation Rates involved 15 minutes each of rest, slow walking, jogging, and fast walking during the first hour. The sequence was also repeated during the second hour. HR and VR measurements were recorded starting at the 8th minute of each 15-minute segment. Following the calibration tests, a field study was conducted in which subjects self-monitored their activities by filling out activity diary booklets, self-estimated their breathing rates, and their HR. Breathing rates were defined as sleep; slow (slow or normal walking); medium (fast walking); and fast (running) (Shamoo et al., 1991). Changes in location, activity, or breathing rates during three 24-hour periods within a week were recorded. These periods included their most active working and non-working days. Each subject wore Heart Watches, which recorded their HR once per minute during the field study. Ventilation rates were estimated for the following categories: sleep, slow, medium, and fast.
Calibration data were fit to the equation log (VR) = intercept + (slope × HR), each individual’s intercept and slope were determined separately to provide a specific equation that predicts each subject’s VR from measured HR (Shamoo et al., 1991). The average measured VRs were 0.48, 0.90, 1.68, and 4.02 m3/hour for rest, slow walking or normal walking, fast walking, and jogging, respectively (Shamoo et al., 1991). Collectively, the diary recordings showed that sleep occupied about 33% of the subject's time; slow activity 59%; medium activity 7%; and fast activity 1%. The diary data covered an average of 69 hours per subject (Shamoo et al., 1991). Table 6-32 presents the distribution pattern of predicted ventilation rates and equivalent ventilation rates (EVR) obtained at the four activity levels. EVR was defined as the VR per square meter of body surface area, and also as a percentage of the subjects average VR over the entire field monitoring period (Shamoo et al., 1991). The overall mean predicted VR was 0.42 m3/hour for sleep; 0.71 m3/hour for slow activity; 0.84 m3/hour for medium activity; and 2.63 m3/hour for fast activity.
Table 6-33 presents the mean predicted VR and standard deviation, and the percentage of time spent in each combination of VR, activity type (essential and non-essential), and location (indoor and outdoor). Essential activities include income-related work, household chores, child care, study and other school activities, personal care, and destination-oriented travel. Non-essential activities include sports and active leisure, passive leisure, some travel, and social or civic activities (Shamoo et al., 1991). Table 6-33 shows that inhalation rates were higher outdoors than indoors at slow, medium, and fast activity levels.
Also, inhalation rates were higher for outdoor non-essential activities than for indoor non-essential activity levels at slow, medium, and fast self-reported breathing rates (see Table 6-33).
An advantage of this study is that subjective activity diary data can provide exposure modelers with useful rough estimates of VR for groups of generally healthy people. A limitation of this study is its age and that the results obtained show high within-person and between-person variability in VR at each diary-recorded level, indicating that VR estimates from diary reports could potentially be substantially misleading in individual cases. Another limitation of this study is that elevated HR data of slow activity at the second hour of the exercise session reflect persistent effects of exercise and/or heat stress. Therefore, predictions of VR from the VR/HR relationship may be biased.
6.4.5. Linn et al. (1992)—Documentation of Activity Patterns in “High-Risk” Groups Exposed to Ozone in the Los Angeles Area
Linn et al. (1992) conducted a study that estimated the inhalation rates for “high-risk” population groups exposed to ozone in their daily activities in the Los Angeles area. The population surveyed consisted of seven subject panels: Panel 1: 20 healthy outdoor workers (15 males, 5 females, ages 19−50 years); Panel 2: 17 healthy elementary school students (5 males, 12 females, ages 10−12 years); Panel 3: 19 healthy high school students (7 males, 12 females, ages 13−17 years); Panel 4: 49 asthmatic adults (clinically mild, moderate, and severe, 15 males, 34 females, ages 18−50 years); Panel 5: 24 asthmatic adults from 2 neighborhoods of contrasting O3 air quality (10 males, 14 females, ages 19−46 years); Panel 6: 13 young asthmatics (7 males, 6 females, ages 11−16 years); and Panel 7: construction workers (7 males, ages 26−34 years). An initial calibration test was conducted, followed by a training session. Finally, a field study that involved the subjects collecting their own HRs and diary data was conducted. During the calibration tests, VR, breathing rate, and HR were measured simultaneously at each exercise level. From the calibration data, an equation was developed using linear regression analysis to predict VR from measured HR.
In the field study, each subject (except construction workers) recorded in diaries their daily activities, change in locations (indoors, outdoors, or in a vehicle), self-estimated breathing rates during
Exposure Factors Handbook Page September 2011 6-13

Exposure Factors Handbook
Chapter 6—Inhalation Rates
each activity/location, and time spent at each activity/location. Healthy subjects recorded their HR once every 60 seconds using a Heart Watch, an automated system consisting of a transmitter and receiver worn on the body. Asthmatic subjects recorded their diary information once every hour. Subjective breathing rates were defined as slow (walking at their normal pace), medium (faster than normal walking), and fast (running or similarly strenuous exercise). Table 6-34 presents the calibration and field protocols for self-monitoring of activities for each subject panel.
Table 6-35 presents the mean, 99th percentile, and mean VR at each subjective activity level (slow, medium, fast). The mean and 99th percentile VR were derived from all HR recordings that appeared to be valid, without considering the diary data. Each of the three activity levels was determined from both the concurrent diary data and HR recordings by direct calculation or regression. The mean VR for healthy adults was 0.78 m3/hour, while the mean VR for asthmatic adults was 1.02 m3/hour (see Table 6-35). The preliminary data for construction workers indicated that during a 10-hour work shift, their mean VR (1.50 m3/hour) exceeded the VRs of all other subject panels (see Table 6-35). The authors reported that the diary data showed that on a typical day, most individuals spent most of their time indoors at slow activity level. During slow activity, asthmatic subjects had higher VRs than healthy subjects (see Table 6-35). The authors also reported that in every panel, the predicted VR correlated significantly with the subjective estimates of activity levels.
A limitation of this study is that calibration data may overestimate the predictive power of HR during actual field monitoring. The wide variety of exercises in everyday activities may result in greater variation of the VR-HR relationship than was calibrated. Another limitation is the small sample size of each population surveyed. An advantage of this study is that diary data can provide rough estimates of ventilation patterns, which are useful in exposure assessments. Another advantage is that inhalation rates were presented for various populations (i.e., healthy outdoor adult workers, healthy children, asthmatics, and construction workers).
6.4.6. Shamoo et al. (1992)—Effectiveness of Training Subjects to Estimate Their Level of Ventilation
Shamoo et al. (1992) conducted a study where nine non-sedentary subjects in good health were trained on a treadmill to estimate their own ventilation rates at four activity levels: low, medium,
heavy, and very heavy. The purpose of the study was to train the subjects’ self-estimation of ventilation in the field and to assess the effectiveness of the training (Shamoo et al., 1992). The subjects included 3 females and 6 males between 21 to 37 years of age. The tests were conducted in four stages. First, an initial treadmill pretest was conducted indoors at various speeds until the four ventilation levels were experienced by each subject; VR was measured and feedback was given to the subjects. Second, two treadmill training sessions, which involved seven 3-minute segments of varying speeds based on initial tests, were conducted; VR was measured and feedback was given to the subjects. Another similar session was conducted; however, the subjects estimated their own ventilation level during the last 20 seconds of each segment and VR was measured during the last minute of each segment. Immediate feedback was given to the subject’s estimate; and the third and fourth stages involved 2 outdoor sessions of 3 hours each. Each hour comprised 15 minutes each of rest, slow walking, jogging, and fast walking. The subjects estimated their own ventilation level at the middle of each segment. The subject's estimate was verified by a respirometer, which measured VR in the middle of each 15-minute activity. No feedback was given to the subject. The overall percent correct score obtained for all ventilation levels was 68% (Shamoo et al., 1992). Therefore, Shamoo et al. (1992) concluded that this training protocol was effective in training subjects to correctly estimate their minute ventilation levels.
For this handbook, inhalation rates were analyzed from the raw data provided by Shamoo et al. (1992). Table 6-36 presents the mean inhalation rates obtained from this analysis at four ventilation levels in two microenvironments (i.e., indoors and outdoors) for all subjects. The mean inhalation rates for all subjects were 0.93, 1.92, 3.01, and 4.80 m3/hour for low, medium, heavy, and very heavy activities, respectively.
Limitations of this study are its age and the population sample size used in this study was small and was not selected to represent the general U.S. population. The training approach employed may not be cost effective because it was labor intensive; therefore, this approach may not be viable in field studies especially for field studies within large sample sizes.
Page Exposure Factors Handbook 6-14 September 2011

Exposure Factors Handbook
Chapter 6—Inhalation Rates 6.4.7. Spier et al. (1992)—Activity Patterns in
Elementary and High School Students Exposed to Oxidant Pollution
Spier et al. (1992) investigated the activity patterns of 17 elementary school students (10−12 years old) and 19 high school students (13−17 years old) in suburban Los Angeles from late September to October (oxidant pollution season). Calibration tests were conducted in supervised outdoor exercise sessions. The exercise sessions consisted of 5 minutes each of rest, slow walking, jogging, and fast walking. HR and VR were measured during the last 2 minutes of each exercise. Individual VR and HR relationships for each individual were determined by fitting a regression line to HR values and log VR values. Each subject recorded their daily activities, changes in location, and breathing rates in diaries for 3 consecutive days. Self-estimated breathing rates were recorded as slow (slow walking), medium (walking faster than normal), and fast (running). HR was recorded once per minute during the 3 days using a Heart Watch. VR values for each self-estimated breathing rate and activity type were estimated from the HR recordings by employing the VR and HR equation obtained from the calibration tests.
The data shown in Table 6-37 represent HR distribution patterns and corresponding predicted VR for each age group during hours spent awake. At the same self-reported activity levels for both age groups, inhalation rates were higher for outdoor activities than for indoor activities. The total number of hours spent indoors was higher for high school students (21.2 hours) than for elementary school students (19.6 hours). The converse was true for outdoor activities: 2.7 hours for high school students and 4.4 hours for elementary school students (see Table 6-38). Table 6-39 describes the distribution patterns of daily inhalation rates for elementary and high school students grouped by activity level.
A limitation of this study is the small sample size. The results may not be representative of all children in these age groups. Another limitation is that the accuracy of the self-estimated breathing rates reported by younger age groups is uncertain. This may affect the validity of the data set generated. An advantage of this study is that inhalation rates were determined for children and adolescents.
6.4.8. Adams (1993)—Measurement of Breathing Rate and Volume in Routinely Performed Daily Activities, Final Report
Adams (1993) conducted research to accomplish two main objectives: (1) identification of mean and
ranges of inhalation rates for various age/sex cohorts and specific activities, and (2) derivation of simple linear and multiple regression equations that could be used to predict inhalation rates through other measured variables: breathing frequency (fB) and oxygen consumption. A total of 160 subjects participated in the primary study. There were four age-dependent groups: (1) children 6 to 12.9 years old, (2) adolescents between 13 and 18.9 years old, (3) adults between 19 and 59.9 years old, and (4) seniors >60 years old (Adams, 1993). An additional 40 children from 6 to 12.9 years old and 12 young children from 3 to 5.9 years old were identified as subjects for pilot testing purposes.
Resting protocols conducted in the laboratory for all age groups consisted of three phases (25 minutes each) of lying, sitting, and standing. The phases were categorized as resting and sedentary activities. Two active protocols—moderate (walking) and heavy (jogging/running) phases—were performed on a treadmill over a progressive continuum of intensity levels made up of 6-minute intervals at three speeds ranging from slow to moderately fast. All protocols involved measuring VR, HR, fB, and VO2. Measurements were taken in the last 5 minutes of each phase of the resting protocol and the last 3 minutes of the 6-minute intervals at each speed designated in the active protocols.
In the field, all children completed spontaneous play protocols. The older adolescent population (16 to 18 years) completed car driving and riding, car maintenance (males), and housework (females) protocols. All adult females (19 to 60 years) and most of the senior (60 to 77 years) females completed housework, yardwork, and car driving and riding protocols. Adult and senior males completed car driving and riding, yardwork, and mowing protocols. HR, VR, and fB were measured during each protocol. Most protocols were conducted for 30 minutes. All the active field protocols were conducted twice.
During all activities in either the laboratory or field protocols, VR for the children’s group revealed no significant sex differences, but those for the adult groups demonstrated sex differences. Therefore, inhalation rate (IR) data presented in Table 6-40 and Table 6-41 were categorized as young children, children (no sex), and adult female, and adult male, and adult combined by activity type (lying, sitting, standing, walking, and running). These categorized data from Table 6-40 and Table 6-41 are summarized as inhalation rates in Table 6-42 and Table 6-43. Table 6-42 shows the laboratory protocols. Table 6-43 presents the mean inhalation rates by group and for moderate activity levels in field protocols. A comparison of the data shown in
Exposure Factors Handbook Page September 2011 6-15

Exposure Factors Handbook
Chapter 6—Inhalation Rates
Table 6-42 and Table 6-43 suggest that during light and sedentary activities in laboratory and field protocols, similar inhalation rates were obtained for adult females and adult males. Accurate predictions of inhalation rates across all population groups and activity types were obtained by including body SA, HR, and breathing f requency in m ultiple regression analysis (Adams, 1993). Adams (1993) calculated SA from measured he ight and body weight using the equation:
SA = Height(0.725) × Weight(0.425) × 71.84 (Eqn. 6-3)
A limitation associated with this study is that the population does not represent the general U.S. population. Also, the classification of activity types (i.e., laboratory and field protocols) into activity levels may bias the inhalation rates obtained for various age/sex cohorts. Age groups for which data are provided are limited and do not conform to U.S. EPA’s recommended age groups for children. The estimated rates were based on short-term data and may not reflect long-term patterns.
6.4.9. Layton (1993)—Metabolically Consistent
Breathing Rates for Use in Dose Assessments
Layton (1993) presented a method for estimating metabolically consistent inhalation rates for use in quantitative dose assessments of airborne radionuclides. Generally, the approach for estimating the breathing rate for a specified time frame was to calculate a time-weighted-average of ventilation rates associated with physical activities of varying durations. However, in this study, breathing rates were calculated on the basis of oxygen consumption associated with energy expenditures for short (hours) and long (weeks and months) periods of time, using the following general equation to calculate energy-dependent inhalation rates:
VE = E × H × VQ (Eqn. 6-4) where:
V ventilation rate (m3E = /minute or
m3/day); E = energy expenditure rate;
[kilojoules/minute (KJ/minute) or megajoules/hour (MJ/hour)];
H = volume of oxygen (at standard temperature and pressure, dry air
consumed in the production of 1 kilojoule [KJ] of energy expended [L/KJ or m3/MJ]); and
VQ = ventilatory equivalent (ratio of minute volume [m3/minute] to oxygen uptake [m3/minute]) unitless.
Layton (1993) used three approaches to estimate daily chronic (long term) inhalation rates for different age/sex cohorts of the U.S. population using this methodology.
First Approach Inhalation rates were estimated by multiplying
average daily food-energy intakes (EFDs) for different age/sex cohorts, H, and VQ, as shown in the equation above. The average food-energy intake data (see Table 6-44) are based on approximately 30,000 individuals and were obtained from the 1977−1978 USDA-NFCS. The food-energy intakes were adjusted upwards by a constant factor of 1.2 for all individuals 9 years and older. This factor compensated for a consistent bias in USDA-NFCS that was attributed to under-reporting of the foods consumed or the methods used to ascertain dietary intakes. Layton (1993) used a weighted average oxygen uptake of 0.05 L O2/KJ, which was determined from data reported in the 1977−1978 USDA-NFCS and the second NHANES (NHANES II). The survey sample for NHANES II was approximately 20,000 participants. A VQ of 27 used in the calculations was calculated as the geometric mean of VQ data that were obtained from several studies.
The inhalation rate estimation techniques are shown in the footnotes in Table 6-45. Table 6-46 presents the daily inhalation rate for each age/sex cohort. As shown in Table 6-45, the highest daily inhalation rates were 10 m3/day for children between the ages of 6 and 8 years, 17 m3/day for males between 15 and 18 years, and 13 m3/day for females between 9 and 11 years. Estimated average lifetime inhalation rates for males and females are 14 m3/day and 10 m3/day, respectively (see Table 6-45). Inhalation rates were also calculated for active and inactive periods for the various age/sex cohorts.
The inhalation rate for inactive periods was estimated by multiplying the BMR times H times VQ. BMR was defined as “the minimum amount of energy required to support basic cellular respiration while at rest and not actively digesting food” (Layton, 1993). The inhalation rate for active periods was calculated by multiplying the inactive inhalation rate by the ratio of the rate of energy expenditure during active hours to the estimated BMR. This ratio
Page Exposure Factors Handbook 6-16 September 2011

Exposure Factors Handbook
Chapter 6—Inhalation Rates is presented as F in Table 6-45. Table 6-45 also presents these data for active and inactive inhalation rates. For children, inactive and active inhalation rates ranged from 2.35 to 5.95 m3/day and from 6.35 to 13.09 m3/day, respectively. For adult males (19 to 64 years old), the average inactive and active inhalation rates were approximately 10 and 19 m3/day, respectively. Also, the average inactive and active inhalation rates for adult females (19 to 64 years old) were approximately 8 and 12 m3/day, respectively.
Second Approach Inhalation rates were calculated as the product of
the BMR of the population cohorts, the ratio of total daily energy expenditure to daily BMR, H, and VQ. The BMR data obtained from the literature were statistically analyzed, and regression equations were developed to predict BMR from body weights of various age/sex cohorts. Table 6-46 presents the statistical data used to develop the regression equations. Table 6-47 presents the data obtained from the second approach. Inhalation rates for children (6 months−10 years) ranged from 7.3−9.3 m3/day for male and 5.6−8.6 m3/day for female children; for older children (10−18 years), inhalation rates were 15 m3/day for males and 12 m3/day for females. Adult females (18 years and older) ranged from 9.9−11 m3/day and adult males (18 years and older) ranged from 13−17 m3/day. These rates are similar to the daily inhalation rates obtained using the first approach. Also, the inactive inhalation rates obtained from the first approach are lower than the inhalation rates obtained using the second approach. This may be attributed to the BMR multiplier employed in the equation of the second approach to calculate inhalation rates.
Third Approach Inhalation rates were calculated by multiplying
estimated energy expenditures associated with different levels of physical activity engaged in over the course of an average day by VQ and H for each age/sex cohort. The energy expenditure associated with each level of activity was estimated by multiplying BMRs of each activity level by the MET and by the time spent per day performing each activity for each age/sex population. The time-activity data used in this approach were obtained from a survey conducted by Sallis et al. (1985) (Layton, 1993). In that survey, the physical-activity categories and associated MET values used were sleep, MET = 1; light-activity, MET = 1.5; moderate activity, MET = 4; hard activity, MET = 6; and very hard activity, MET = 10.
The physical activities were based on recall by the test subject (Layton, 1993). The survey sample was 2,126 individuals (1,120 women and 1,006 men) ages 20−74 years that were randomly selected from four communities in California. The body weights were obtained from a study conducted by Najjar and Rowland (1987) that randomly sampled individuals from the U.S. population (Layton, 1993). Table 6-48 presents the daily inhalation rates (VE) in m3/day and m3/hour for adult males and females aged 20−74 years at five physical activity levels. The total daily inhalation rates ranged from 13−17 m3/day for adult males and 11−15 m3/day for adult females.
The rates for adult females were higher when compared with the other two approaches. Layton (1993) reported that the estimated inhalation rates obtained from the third approach were particularly sensitive to the MET value that represented the energy expenditures for light activities. Layton (1993) stated further that in the original time-activity survey [i.e., conducted by Sallis et al. (1985)], time spent performing light activities was not presented. Therefore, the time spent at light activities was estimated by subtracting the total time spent at sleep, moderate, heavy, and very heavy activities from 24 hours (Layton, 1993). The range of inhalation rates for adult females were 9.6−11 m3/day, 9.9−11 m3/day, and 11−15 m3/day, for the first, second, and third approaches, respectively. The inhalation rates for adult males ranged from 13−16 m3/day for the first approach, and 13−17 m3/day for the second and third approaches.
Inhalation rates were also obtained for short-term exposures for various age/sex cohorts and five energy-expenditure categories (rest, sedentary, light, moderate, and heavy). BMRs were multiplied by the product of MET, H, and VQ. Table 6-49 presents the inhalation-rate data obtained for short-term exposures.
The major strengths of the Layton (1993) study are that it obtains similar results using three different approaches to estimate inhalation rates in different age groups and that the populations are large, consisting of men, women, and children. Explanations for differences in results due to metabolic measurements, reported diet, or activity patterns are supported by observations reported by other investigators in other studies. Major limitations of this study are (1) the estimated activity pattern levels are somewhat subjective; (2) the explanation that activity pattern differences are responsible for the lower level obtained with the metabolic approach (25%) compared to the activity pattern approach is not well supported by the data; and (3) different
Exposure Factors Handbook Page September 2011 6-17

Exposure Factors Handbook
Chapter 6—Inhalation Rates
populations were used in each approach, which may have introduced error.
6.4.10. Linn et al. (1993)—Activity Patterns in Ozone Exposed Construction Workers
Linn et al. (1993) estimated the inhalation rates of 19 construction workers who perform heavy outdoor labor before and during a typical work shift. The workers (laborers, iron workers, and carpenters) were employed at a site on a hospital campus in suburban Los Angeles. The construction site included a new hospital building and a separate medical office complex. The study was conducted between mid-July and early November, 1991. During this period, ozone (O3) levels were typically high. Initially, each subject was calibrated with a 25-minute exercise test that included slow walking, fast walking, jogging, lifting, and carrying. All calibration tests were conducted in the mornings. VR and HR were measured simultaneously during the test. The data were analyzed using least squares regression to derive an equation for predicting VR at a given HR. Following the calibration tests, each subject recorded the type of activities to be performed during their work shift (i.e., sitting/standing, walking, lifting/carrying, and “working at trade”—defined as tasks specific to the individual’s job classification). Location, and self-estimated breathing rates (“slow” similar to slow walking, “medium” similar to fast walking, and “fast” similar to running) were also recorded in the diary. During work, an investigator recorded the diary information dictated by the subjects. HR was recorded minute by minute for each subject before work and during the entire work shift. Thus, VR ranges for each breathing rate and activity category were estimated from the HR recordings by employing the relationship between VR and HR obtained from the calibration tests.
A total of 182 hours of HR recordings were obtained during the survey from the 19 volunteers; 144 hours reflected actual working time according to the diary records. The lowest actual working hours recorded was 6.6 hours, and the highest recorded for a complete work shift was 11.6 hours (Linn et al., 1993). Table 6-50 presents summary statistics for predicted VR distributions for outdoor workers, and for job- or site-defined subgroups. The data reflect all recordings before and during work, and at break times. For all subjects, the mean inhalation rate was 1.68 m3/hour with a standard deviation of ±0.72 (see Table 6-50). Also, for most subjects, the 1st and 99th percentiles of HR were outside of the calibration range. Therefore, corresponding IR percentiles were
extrapolated using the calibration data (Linn et al., 1993).
The data shown in Table 6-51 represent distribution patterns of mean inhalation rate for each subject, total subjects, and job- or site-defined subgroups by self-estimated breathing rates (slow, medium, or fast) or by type of job activity. All data include working and non-working hours. The mean inhalation rates for most individuals showed statistically significant increases with higher self-estimated breathing rates or with increasingly strenuous job activity (Linn et al., 1993). Inhalation rates were higher in hospital site workers when compared with office site workers (see Table 6-51). In spite of their higher predicted VR workers at the hospital site reported a higher percentage of slow breathing time (31%) than workers at the office site (20%), and a lower percentage of fast breathing time, 3% and 5%, respectively (Linn et al., 1993). Therefore, individuals whose work was objectively heavier than average (from VR predictions) tended to describe their work as lighter than average (Linn et al., 1993). Linn et al. (1993) also concluded that during an O3 pollution episode, construction workers should experience similar microenvironmental O3 exposure concentrations as other healthy outdoor workers, but with approximately twice as high a VR. Therefore, the inhaled dose of O3 should be almost two times higher for typical heavy-construction workers than for typical healthy adults performing less strenuous outdoor jobs.
Limitations associated with this study are its age and the small sample size. Another limitation of this study is that calibration data were not obtained at extreme conditions. Therefore, it was necessary to predict inhalation rate values that were outside the calibration range. This may introduce an unknown amount of uncertainty to the data set. Subjective self-estimated breathing rates may be another source of uncertainty in the inhalation rates estimated. An advantage is that this study provides empirical data useful in exposure assessments for a population thought to be the most highly exposed common occupational group (outdoor workers).
6.4.11. Rusconi et al. (1994)—Reference Values for Respiratory Rate in the First 3 Years of Life
Rusconi et al. (1994) examined a large number of infants and children in Milano, Italy, in order to determine the reference values for respiratory rate in children aged 15 days to 3 years. A total of 618 infants and children (336 males and 282 females), who did not have respiratory infections or any severe
Page Exposure Factors Handbook 6-18 September 2011

Exposure Factors Handbook
Chapter 6—Inhalation Rates disease, were included in the study. Of the 618, a total of 309 were in good health and were observed in daycare centers, while the remaining 309 were seen in hospitals or as outpatients.
Respiratory rates were recorded twice, 30 to 60 minutes apart, listening to breath sounds for 60 seconds with a stethoscope, when the child was awake and calm and when the child was sleeping quietly (sleep not associated with any spontaneous movement, including eye movements or vocalizations) (see Table 6-52). The children were assessed for 1 year in order to determine the repeatability of the recordings, to compare respiratory rate counts obtained by stethoscope and by observation, and to construct reference percentile curves by age in a large number of subjects.
The authors plotted the differences between respiratory rate counts determined by stethoscope at 30- to 60-minute intervals against their mean count in waking and sleeping subjects. The standard deviation of the differences between the two counts was 2.5 and 1.7 breaths/minute, respectively, for waking and sleeping children. This standard deviation yielded 95% repeatability coefficients of 4.9 breaths/minute when the infants and children were awake and 3.3 breaths/minute when they were asleep.
In both waking and sleeping states, the respiratory rate counts determined by stethoscope were found to be higher than those obtained by observation. The mean difference was 2.6 and 1.8 breaths per minute, respectively, in waking and sleeping states. The mean respiratory rate counts were significantly higher in infants and children at all ages when awake and calm than when asleep. A decrease in respiratory rate with increasing age was seen in waking and sleeping infants and children. A scatter diagram of respiratory rate counts by age in waking and sleeping subjects showed that the pattern of respiratory rate decline with age was similar in both states, but it was much faster in the first few months of life. The authors constructed centile curves by first log-transforming the data and then applying a second degree polynormal curve, which allowed excellent fitting to observed data. Figure 6-1 and Figure 6-2 show smoothed percentiles by age in waking and sleeping subjects, respectively. The variability of respiratory rate among subjects was higher in the first few months of life, which may be attributable to biological events that occur during these months, such as maturation of the neurologic control of breathing and changes in lung and chest wall compliance and lung volumes.
An advantage of this study is that it provides distribution data for respiratory rate for children from infancy (less than 2 months) to 36 months old. The
main limitation of this study is that data are provided in breaths/minute for awake and asleep subjects. Activity pattern data for the awake subjects are limited, which prevents characterization of breathing rates for various levels of exertion. These data are not U.S. data; U.S. distributions were not available. Although, there is no reason to believe that the respiratory rates for Italian children would be different from that of U.S. children, this study only provided data for a narrow range of activities.
6.4.12. Price et al. (2003)—Modeling Interindividual Variation in Physiological Factors Used in PBPK Models of Humans
Price et al. (2003) developed a database of values for physiological parameters often used in physiologically based pharmacokinetic (PBPK) models. The database consisted of approximately 31,000 records containing information on volumes and masses of selected organs and tissues, blood flows for the organ and tissues, and total resting cardiac output and average inhalation rates. Records were created based on data from the NHANES III survey.
The study authors note that the database provides a source of data for human physiological parameters where the parameter values for an individual are correlated with one another and capture interindividual variation in populations of a specific sex, race, and age range. A publicly available computer program, Physiological Parameters for PBPK Modeling, was also developed to randomly retrieve records from the database for groups of individuals of specified age ranges, sex, and ethnicities (Lifeline Group, 2006). Price et al. (2003) recommends that output sets be used as inputs to Monte Carlo-based PBPK models of interindividual variation in dose. A limitation of this study is that these data have not been validated against actual physiological data. Ideally, the database records would have been obtained from detailed physiological analyses of individuals, however, such a survey was not conducted for this study.
6.4.13. Brochu et al. (2006a)—Physiological Daily Inhalation Rates for Free-Living Pregnant and Lactating Adolescents and Women Aged 11 to 55 Years, Using Data From Doubly Labeled Water Measurements for Use in Health Risk Assessment
PDIRs were determined by Brochu et al. (2006a) for underweight, normal-weight, and overweight/obese pregnant and lactating females
Exposure Factors Handbook Page September 2011 6-19

Exposure Factors Handbook
Chapter 6—Inhalation Rates
aged 11 to 55 years using published data on total daily energy expenditures, and energy costs for growth, pregnancy and lactation (breast-energy output and maternal milk-energy synthesis) in free-living females. These data were obtained using the DLW methodology in which disappearance rates of predetermined doses of DLW (2H2O and H2
18O) in urine from non-pregnant and non-lactating females (N = 357) and normal-weight males (N = 131) as well as saliva from gravid and breast-feeding females (N = 91) were monitored by gas-isotope-ratio mass spectrometry.
PDIRs were calculated for underweight, normal-weight, and overweight/obese females aged 11 to 55 years in pre-pregnancy, at Weeks 9, 22, and 36 during pregnancy, and Weeks 6 and 27 postpartum. Weight groups were determined by BMI cutoffs settled by the Institute of Medicine for pre-pregnant females. Underweight, normal-weight, and overweight/obese individuals were defined as those having BMIs lower than 19.8 kg/m2, between 19.8 and 26 kg/m2, and greater than 26 kg/m2, respectively. Parameters used for breast-energy output and the extra energy cost for milk synthesis were 539.29 ± 106.26 kcal/day and 107.86 ± 21.25 kcal/day, respectively. Monte Carlo simulations were necessary to integrate total daily energy requirements of non-pregnant and non-lactating females into energy costs and weight changes at the 9th, 22nd, and 36th weeks of pregnancy and at the 6th and 27th
postpartum weeks. A total of 108 sets of 5,000 energetic data were run, resulting in a simulation of 540,000 data, pertaining to 45,000 simulated subjects. Means, standard deviations, and percentiles of energetic values in kcal/day and kcal/kg-day for males and females were converted into PDIRs in m3/day and m3/kg-day by using the equation developed by Layton (1993).
Table 6-53, Table 6-54, and Table 6-55 present the distribution of physiological daily inhalation rate percentiles in m3/day for underweight, normal-weight, and overweight/obese females, respectively, during pregnancy and postpartum weeks. Table 6-56, Table 6-57, and Table 6-58 present physiological daily inhalation rate percentiles in m3/kg-day for the same categories. PDIRs for under-, normal-, and overweight/obese pregnant and lactating females were higher than those for males reported in Brochu et al. (2006b). In normal-weight subjects, inhalation rates are higher by 18 to 41% throughout pregnancy and 23 to 39% during postpartum weeks: actual values were higher in females by 1.13 to 2.01 m3/day at the 9th week of pregnancy, 3.74 to 4.53 m3/day at the 22nd week, and 4.41 to 5.20 m3/day at the 36th week, and by 4.43 to
5.30 m3/day at the 6th postpartum week and 4.22 to 5.11 m3/day at the 27th postpartum week. The highest 99th percentiles were found to be 0.622 m3/kg-day in pregnant females and 0.647 m3/kg-day in lactating females. By comparison, the highest 99th percentile value for individuals aged 2.6 months to 96 years was determined to be 0.725 m3/kg-day (Brochu et al., 2006b). The authors concluded that air quality criteria and standard calculations based on the latter value for non-carcinogenic toxic compounds should, therefore, be protective for virtually all pregnant and lactating females. Brochu et al. (2006a) also noted that the default assumption used by IRIS to derive HECs (total respiratory tract surface of an adult human male of 54.3 m2 is exposed to a total daily air intake of 20 m3) would underestimate exposures to pregnant or lactating females since approximately one pregnant or lactating female out of two is exposed to a total daily air intake of 20 m3 up to the highest 99th
percentile of 47.3 m3. An advantage of this study is that it includes
pregnant and lactating females, and that data are provided for adolescents aged 11 years and older. A limitation of this study is that the study population was partially drawn from Canada and may not represent the general U.S. population. Also, age groups for adolescents for which data are provided do not conform to U.S. EPA’s recommended age groups for children.
6.4.14. Allan et al. (2009)—Inhalation Rates for Risk Assessments Involving Construction Workers in Canada
Allan et al. (2009) generated probability density distributions by performing a Monte Carlo simulation to describe inhalation rates for Canadian male and female construction workers. Construction workers in this study were those involved in the construction or physical maintenance of buildings, structures, or other facilities, and their ages ranged from 16 to 65 years. Information regarding activity patterns and/or inhalation rates was obtained from published literature and used to estimate male construction workers’ hourly inhalation rates. Female construction worker inhalation rates were estimated using the ratio of general public female-to-male inhalation rates and male construction workers’ hourly inhalation rates. Published energy expenditure and inhalation rates were compared by occupation within the construction industry, and these data were used to develop trade-specific scaling factors. All inhalation rates were developed as probability density functions through Monte Carlo simulation. Ten thousand iterations of random sampling were performed, and at
Page Exposure Factors Handbook 6-20 September 2011

Exposure Factors Handbook
Chapter 6—Inhalation Rates the end of the simulation, the results for all 10,000 iterations were summarized into frequency histograms. The mean, standard deviation, and percentiles were calculated based on the frequency counts.
Inhalation rates for male construction workers were represented by a log normal distribution, with a mean rate of 1.40 ± 0.51 m3/hour. Hourly inhalation rates for female construction workers were scaled down from those of their male counterparts, based on relative awake-time inhalation rates for men and women in the general public. Inhalation rates for female construction workers were also represented by a log normal distribution, with a mean rate of 1.25 ± 0.66 m3/hour. Construction trade-specific scaling factors were developed and ranged from 0.78 for electricians to 1.11 for ironworkers.
An advantage of this study is that it provides estimated inhalation rates for a population of construction workers. A limitation of this study is that the construction workers in this study were solely male construction workers; no females were among the cohorts monitored.
6.5. REFERENCES FOR CHAPTER 6 Adams, WC. (1993). Measurement of breathing rate
and volume in routinely performed daily activities [final report]. Adams, WC.
Allan, M; Jones-Otazo, H; Richardson, GM. (2009). Inhalation rates for risk assessments involving construction workers in Canada. Hum Ecol Risk Assess 15: 371-387. http://dx.doi.org/10.1080/108070309027614 45.
Arcus-Arth, A; Blaisdell, RJ. (2007). Statistical distributions of daily breathing rates for narrow age groups of infants and children. Risk Anal 27: 97-110. http://dx.doi.org/10.1111/j.15396924.2006.00862.x.
Basiotis, PP; Thomas, RG; Kelsay, JL; Mertz, W. (1989). Sources of variation in energy intake by men and women as determined from one year's daily dietary records. Am J Clin Nutr 50: 448-453.
Bates, DV. (1989). [Excerpt]. In Respiratory function in disease (3rd ed.). Philadelphia, PA: W.B. Saunders Company.
Bennett, WD; Zeman, KL. (2004). Effect of body size on breathing pattern and fine-particle deposition in children. J Appl Physiol 97: 821-826. http://dx.doi.org/10.1152/japplphysiol.01403 .2003.
Bennett, WD; Zeman, KL; Jarabek, AM. (2008). Nasal contribution to breathing and fine particle deposition in children versus adults. J Toxicol Environ Health A 71: 227-237. http://dx.doi.org/10.1080/152873907015982 00.
Brochu, P; Ducre-Robitaille, JF; Brodeur, J. (2006a). Physiological daily inhalation rates for free-living pregnant and lactating adolescents and women aged 11 to 55 years, using data from doubly labeled water measurements for use in health risk assessment. Hum Ecol Risk Assess 12: 702-735. http://dx.doi.org/10.1080/108070306008015 92.
Brochu, P; Ducré-Robitaille, JF; Brodeur, J. (2006b). Physiological daily inhalation rates for free-living individuals aged 1 month to 96 years, using data from doubly labeled water measurements: A proposal for air quality criteria, standard calculations and health risk assessment. Hum Ecol Risk Assess 12: 675701. http://dx.doi.org/10.1080/108070306008015 50.
Cherniack, RM; Cherniack, L; Naimark, A. (1972). Respiration in health and disease (2nd ed.). Philadelphia, PA: W.B. Saunders Company.
FASEB/LSRO (Federation of American Societies for Experimental Biology, Life Sciences Research Office). (1995). Joint policy on variance estimation and statistical standards on NHANES III and CSFII reports (Appendix III). In Third report on nutrition monitoring in the United States. Washington, DC: Interagency Board for Nutrition Monitoring and Related Research.
Foos, B; Marty, M; Schwartz, J; Bennett, W; Moya, J; Jarabek, AM; Salmon, AG. (2008). Focusing on children's inhalation dosimetry and health effects for risk assessment: An introduction. J Toxicol Environ Health A 71: 149-165. http://dx.doi.org/10.1080/152873907015978 71.
Foos, B; Sonawane, B. (2008). Overview: Workshop on children's inhalation dosimetry and health effects for risk assessment. J Toxicol Environ Health A 71: 147-148. http://dx.doi.org/10.1080/152873907015978 55.
Forster, RE; DuBois, AB; Briscoe, WA; Fisher, AB. (1986). The Lung: Physiologic basis of pulmonary function tests (3rd ed.). Chicago, IL: Year Book Medical Publishers.
Exposure Factors Handbook Page September 2011 6-21

Exposure Factors Handbook
Chapter 6—Inhalation Rates
ICRP (International Commission on Radiological Protection). (1981). Report of the task group on reference man. ICRP publication 23. New York, NY: Pergammon Press.
Layton, DW. (1993). Metabolically consistent breathing rates for use in dose assessments. Health Phys 64: 23-36.
Lifeline Group. (2006). Physiological parameters for PBPK modeling version 1.3 (P3M) [Computer Program]. Retrieved from http://www.thelifelinegroup.org/p3m/index.p hp
Linn, WS; Shamoo, DA; Hackney, JD. (1992). Documentation of activity patterns in 'highrisk' groups exposed to ozone in the Los Angeles area. In RL Berglund (Ed.), Tropospheric ozone and the environment II: Effects, modeling and control (pp. 701-712). Pittsburgh, PA: Air and Waste Management Association.
Linn, WS; Spier, CE; Hackney, JD. (1993). Activity patterns in ozone-exposed construction workers. J Occup Med Toxicol 2: 1-14.
Najjar, MF; Rowland, M. (1987). Anthropometric reference data and prevalence of overweight, United States, 1976-80. 1-73.
Phalen, PD; Landau, LI; Olinsky, A. (1990). Respiratory illness in children (3rd ed.). Oxford, United Kingdom: Blackwell Scientific Publishers.
Price, PS; Conolly, RB; Chaisson, CF; Gross, EA; Young, JS; Mathis, ET; Tedder, DR. (2003). Modeling interindividual variation in physiological factors used in PBPK models of humans. Crit Rev Toxicol 33: 469-503. http://dx.doi.org/10.1080/104084403902423 24.
Ridley, K; Ainsworth, BE; Olds, TS. (2008). Development of a compendium of energy expenditures for youth. Int J Behav Nutr Phys Activ 5: 45. http://dx.doi.org/10.1186/1479-5868-5-45.
Ridley, K; Olds, TS. (2008). Assigning energy costs to activities in children: a review and synthesis. Med Sci Sports Exerc 40: 14391446. http://dx.doi.org/10.1249/MSS.0b013e31817 279ef.
Rusconi, F; Castagneto, M; Gagliardi, L; Leo, G; Pellegatta, A; Porta, N; Razon, S; Braga, M. (1994). Reference values for respiratory rate in the first 3 years of life. Pediatrics 94: 350355.
Sallis, JF; Haskell, WL; Wood, PD; Fortmann, SP; Rogers, T; Blair, SN; Paffenbarger, RS.
(1985). Physical activity assessment methodology in the Five-City Project. Am J Epidemiol 121: 91-106.
Scrimshaw, NS; Waterlow, JC; Schurch, B. (1996). Energy and protein requirements: Proceedings of an IDECG workshop. In NS Scrimshaw; JC Waterlow; B Schurch (Eds.). Basingstoke, UK: Stockton Press.
Shamoo, DA; Johnson, TR; Trim, SC; Little, DE; Linn, WS; Hackney, JD. (1991). Activity patterns in a panel of outdoor workers exposed to oxidant pollution. J Expo Sci Environ Epidemiol 1: 423-438.
Shamoo, DA; Trim, SC; Little, DE; Linn, WS; Hackney, JD. (1990). Improved quantitation of air pollution dose rates by improved estimation of ventilation rate. In Total exposure assessment methodology: A new horizon. Pittsburgh, PA: Air and Waste Management Association.
Shamoo, DA; Trim, SC; Little, DE; Whynot, JD; Linn, WS. (1992). Effectiveness of training subjects to estimate their level of ventilation. J Occup Med Toxicol (US) 1: 55-62.
Speakman, JR; Selman, C. (2003). Physical activity and resting metabolic rate. Proc Nutr Soc 62: 621-634. http://dx.doi.org/10.1079/PNS2003282.
Spier, CE; Little, DE; Trim, SC; Johnson, TR; Linn, WS; Hackney, JD. (1992). Activity patterns in elementary and high school students exposed to oxidant pollution. J Expo Sci Environ Epidemiol 2: 277-293.
Stifelman, M. (2003). Letter to the editor [Letter]. Risk Anal 23: 859-860. http://dx.doi.org/10.1111/1539-6924.00363.
Stifelman, M. (2007). Using doubly-labeled water measurements of human energy expenditure to estimate inhalation rates. Sci Total Environ 373: 585-590. http://dx.doi.org/10.1016/j.scitotenv.2006.11 .041.
Thompson, CM; Johns, DO; Sonawane, B; Barton, HA; Hattis, D; Tardiff, R; Krishnan, K. (2009). Database for physiologically based pharmacokinetic (PBPK) modeling: physiological data for healthy and health-impaired elderly. J Toxicol Environ Health B Crit Rev 12: 1-24. http://dx.doi.org/10.1080/109374008025450 60.
U.S. EPA (U.S. Environmental Protection Agency). (1985). Development of statistical distributions or ranges of standard factors used in exposure assessments.
Page Exposure Factors Handbook 6-22 September 2011

Exposure Factors Handbook
Chapter 6—Inhalation Rates
Exposure Factors Handbook Page September 2011 6-23
(EPA600885010). http://www.ntis.gov/search/product.aspx?A BBR=PB85242667.
U.S. EPA (U.S. Environmental Protection Agency). (1992). Guidelines for exposure assessment. (EPA/600/Z-92/001). Washington, DC: U.S. Environmental Protection Agency, Risk Assessment Forum. http://cfpub.epa.gov/ncea/cfm/recordisplay.c fm?deid=15263.
U.S. EPA (U.S. Environmental Protection Agency). (1994). Methods for derivation of inhalation reference concentrations and application of inhalation dosimetry. (EPA/600/8-90/066F). Research Triangle Park, NC: U.S. Environmental Protection Agency, Office of Research and Development, Office of Health and Environmental Assessment, Environmental Criteria and Assessment Office. http://cfpub.epa.gov/ncea/cfm/recordisplay.c fm?deid=71993.
U.S. EPA (U.S. Environmental Protection Agency). (1997). Exposure factors handbook (final report). (EPA/600/P-95/002Fa-c). Washington, DC: U.S. Environmental Protection Agency, Office of Research and Development, National Center for Environmental Assessment. http://cfpub.epa.gov/ncea/cfm/recordisplay.c fm?deid=12464.
U.S. EPA (U.S. Environmental Protection Agency). (2005a). Guidance on selecting age groups for monitoring and assessing childhood exposures to environmental contaminants (final). (EPA/630/P-03/003F). Washington, DC: U.S. Environmental Protection Agency, Risk Assessment Forum. http://www.epa.gov/raf/publications/guidanc e-on-selecting-age-groups.htm.
U.S. EPA (U.S. Environmental Protection Agency). (2005b). Supplemental guidance for assessing susceptibility from early-life exposure to carcinogens. (EPA/630/R
03/003F). Washington, DC: U.S. Environmental Protection Agency, Risk Assessment Forum. http://www.epa.gov/cancerguidelines/guideli nes-carcinogen-supplement.htm.
U.S. EPA (U.S. Environmental Protection Agency). (2009a). Metabolically derived human ventilation rates: A revised approach based upon oxygen consumption rates (final report) [EPA Report]. (EPA/600/R-06/129F). Washington, DC. http://cfpub.epa.gov/ncea/cfm/recordisplay.c fm?deid=202543.
U.S. EPA (U.S. Environmental Protection Agency). (2009b). Risk assessment guidance for superfund volume I: Human he alth evaluation manual (Part F, supplemental guidance for inhalation risk assessment): Final. (EPA/540/-R-070/002). Washington, DC: U.S. Environmental Protection Agency, Office of Superfund Remediation and Technology Innovation. http://www.epa.gov/oswer/riskassessment/ra gsf/index.htm.
West, JB. (2008a). Pulmonary pa thophysiology: the essentials: Lippincott Williams & Wilkins.
West, JB. (2008b). Respiratory physiology: the essentials: Lippincott Williams & Wilkins.
Westerterp, KR. (2003). Impacts of vigorous and non-vigorous activity on daily energy expenditure. Proc Nutr Soc 62: 645-650. http://dx.doi.org/10.1079/PNS2003279.
WHO (World Health Organization). (1986). Principles for evaluating health risks from chemicals during infancy and early childhood: The need for a special approach [WHO EHC] (pp. 55). Geneva, Switzerland. http://www.inchem.org/documents/ehc/ehc/e hc59.htm.

Table 6-4. Distribution Percentiles of Physiological Daily Inhalation Rates (PDIRs) (m3/day) for Free-Living Normal-Weight Males and Females Aged 2.6 Months to 96 Years
Age Group (years) N
Body Weighta
(kg) Mean ± SD
Physiological Daily Inhalation Ratesb (m3/day)
Mean ± SD Percentilec
5th 10th 25th 50th 75th 90th 95th 99th
Males 0.22 to <0.5 32 6.7 ± 1.0 3.38 ± 0.72 2.19 2.46 2.89 3.38 3.87 4.30 4.57 5.06 0.5 to <1 40 8.8 ± 1.1 4.22 ± 0.79 2.92 3.21 3.69 4.22 4.75 5.23 5.51 6.05 1 to <2 35 10.6 ± 1.1 5.12 ± 0.88 3.68 3.99 4.53 5.12 5.71 6.25 6.56 7.16 2 to <5 25 15.3 ± 3.4 7.60 ± 1.28 5.49 5.95 6.73 7.60 8.47 9.25 9.71 10.59 5 to <7 96 19.8 ± 2.1 8.64 ± 1.23 6.61 7.06 7.81 8.64 9.47 10.21 10.66 11.50 7 to <11 38 28.9 ± 5.6 10.59 ± 1.99 7.32 8.04 9.25 10.59 11.94 13.14 13.87 15.22 11 to <23 30 58.6 ± 13.9 17.23 ± 3.67 11.19 12.53 14.75 17.23 19.70 21.93 23.26 25.76 23 to <30 34 70.9 ± 6.5 17.48 ± 2.81 12.86 13.88 15.59 17.48 19.38 21.08 22.11 24.02 30 to <40 41 71.5 ± 6.8 16.88 ± 2.50 12.77 13.68 15.20 16.88 18.57 20.09 21.00 22.70 40 to <65 33 71.1 ± 7.2 16.24 ± 2.67 11.84 12.81 14.44 16.24 18.04 19.67 20.64 22.46 65 to ≤96 50 68.9 ± 6.7 12.96 ± 2.48 8.89 9.79 11.29 12.96 14.63 16.13 17.03 18.72
Females 0.22 to <0.5 53 6.5 ± 0.9 3.26 ± 0.66 2.17 2.41 2.81 3.26 3.71 4.11 4.36 4.81 0.5 to <1 63 8.5 ± 1.0 3.96 ± 0.72 2.78 3.05 3.48 3.96 4.45 4.88 5.14 5.63 1 to <2 66 10.6 ± 1.3 4.78 ± 0.96 3.20 3.55 4.13 4.78 5.43 6.01 6.36 7.02 2 to <5 36 14.4 ± 3.0 7.06 ± 1.16 5.15 5.57 6.28 7.06 7.84 8.54 8.97 9.76 5 to <7 102 19.7 ± 2.3 8.22 ± 1.31 6.06 6.54 7.34 8.22 9.11 9.90 10.38 11.27 7 to <11 161 28.3 ± 4.4 9.84 ± 1.69 7.07 7.68 8.70 9.84 10.98 12.00 12.61 13.76 11 to <23 87 50.0 ± 8.9 13.28 ± 2.60 9.00 9.94 11.52 13.28 15.03 16.61 17.56 19.33 23 to <30 68 59.2 ± 6.6 13.67 ± 2.28 9.91 10.74 12.13 13.67 15.21 16.59 17.42 18.98 30 to <40 59 58.7 ± 5.9 13.68 ± 1.76 10.78 11.42 12.49 13.68 14.87 15.94 16.58 17.78 40 to <65 58 58.8 ± 5.1 12.31 ± 2.07 8.91 9.66 10.92 12.31 13.70 14.96 15.71 17.12 65 to ≤96 45 57.2 ± 7.3 9.80 ± 2.17 6.24 7.02 8.34 9.80 11.27 12.58 13.37 14.85 a Measured body weight. Normal-weight individuals defined according to the BMI cut-offs. b Physiological daily inhalation rates were calculated using the following equation: (TDEE + ECG) × H ×
(VE/VO2) × 10−3, where H = 0.21 L of O2/Kcal, VE/VO2 = 27 (Layton, 1993) and ECG = stored daily energy cost for growth (kcal/day).
c Percentiles based on a normal distribution assumption for age groups.
N = Number of individuals. SD = Standard deviation.
Source: Brochu et al. (2006b).
Exposure Factors Handbook
Chapter 6—Inhalation Rates
Page Exposure Factors Handbook 6-24 September 2011

Exposure Factors Handbook
Chapter 6—Inhalation Rates
Table 6-5. Mean and 95th Percentile Inhalation Rate Values (m3/day) for Free-Living Normal-Weight Males, Females, and Males and Females Combined
Age Groupa, b N Meanc 95th, c
Males 1 to <3 months 32 3.38 4.57 3 to <6 months 32 3.38 4.57 6 to <12 months 40 4.22 5.51 Birth to <1 year 72 3.85 5.09 1 to <2 years 35 5.12 6.56 2 to <3 years 25 7.60 9.71 3 to <6 years 25 7.60 9.71 6 to <11 years 38 10.59 13.87 11 to <16 years 30 17.23 23.26 16 to <21 years 30 17.23 23.26 21 to <31 years 64 17.36 22.65 31 to <41 years 41 16.88 21.00 41 to <51 years 33 16.24 20.64 51 to <61 years 33 16.24 20.64 61 to <71 years 83 14.26 18.47 71 to <81 years 50 12.96 17.03 ≥81 years 50 12.96 17.03
Females 1 to <3 months 53 3.26 4.36 3 to <6 months 53 3.26 4.36 6 to <12 months 63 3.96 5.14 Birth to <1 year 116 3.64 4.78 1 to <2 years 66 4.78 6.36 2 to <3 years 36 7.06 8.97 3 to <6 years 36 7.06 8.97 6 to <11 years 161 9.84 12.61 11 to <16 years 87 13.28 17.56 16 to <21 years 87 13.28 17.56 21 to <31 years 155 13.45 17.50 31 to <41 years 59 13.68 16.58 41 to <51 years 58 12.31 15.71 51 to <61 years 58 12.31 15.71 61 to <71 years 103 11.21 14.69 71 to <81 years 45 9.80 13.37 ≥81 years 45 9.80 13.37
Exposure Factors Handbook Page September 2011 6-25

Exposure Factors Handbook
Chapter 6—Inhalation Rates
Table 6-5. Mean and 95th Percentile Inhalation Rate Values (m3/day) for Free-Living Normal-Weight Males, Females, and Males and Females Combined (continued)
Age Groupa,b N Meanc 95th,c
Males and Females Combined 1 to <3 months 85 3.31 4.44 3 to <6 months 85 3.31 4.44 6 to <12 months 103 4.06 5.28 Birth to <1 years 188 3.72 4.90 1 to <2 years 101 4.90 6.43 2 to <3 years 61 7.28 9.27 3 to <6 years 61 7.28 9.27 6 to <11 years 199 9.98 12.85 11 to <16 years 117 14.29 19.02 16 to <21 years 117 14.29 19.02 21 to <31 years 219 14.59 19.00 31 to <41 years 100 14.99 18.39 41 to <51 years 91 13.74 17.50 51 to <61 years 91 13.74 17.50 61 to <71 years 186 12.57 16.37 71 to <81 years 95 11.46 15.30 ≥81 years 95 11.46 15.30 a No other age groups from Table 6-4 (Brochu et al., 2006b) fit into the U.S. EPA age groupings. b See Table 6-25 for concordance with U.S. EPA age groupings. c Weighted (where possible) average of reported study means and 95th percentiles.
N = Number of individuals.
Source: Brochu et al. (2006b).
Page Exposure Factors Handbook 6-26 September 2011

Table 6-6. Distribution Percentiles of Physiological Daily Inhalation Rates (PDIRs) (m3/day) for Free-Living Normal-Weight and Overweight/Obese Males and Females Aged 4 to 96 Years
Age Group (years) N
Body Weighta
(kg) Mean ± SD
Physiological Daily Inhalation Ratesb (m3/day)
Mean ± SD
Percentilec
5th 10th 25th 50th 75th 90th 95th 99th
Males—Normal-weight
4 to <5.1 77 19.0 ± 1.9 7.90 ± 0.97 6.31 6.66 7.25 7.90 8.56 9.15 9.50 10.16
5.1 to <9.1 52 22.6 ± 3.5 9.14 ± 1.44 6.77 7.29 8.17 9.14 10.11 10.99 11.51 12.49
9.1 to <18.1 36 41.4 ± 12.1 13.69 ± 3.95 7.19 8.63 11.02 13.69 16.35 18.75 20.19 22.88
18.1 to <40.1 98 71.3 ± 6.1 17.41± 2.70 12.96 13.94 15.58 17.41 19.23 20.87 21.85 23.69
40.1 to <70.1 34 70.0 ± 7.8 15.60 ± 2.89 10.85 11.89 13.65 15.60 17.54 19.30 20.34 22.31
70.1 to ≤96 38 68.9 ± 6.8 12.69 ± 2.33 8.85 9.70 11.11 12.69 14.26 15.68 16.53 18.12
Males—Overweight/obese
4 to <5.1 54 26.5 ± 4.9 9.59 ± 1.26 7.52 7.98 8.74 9.59 10.44 11.21 11.66 12.52
5.1 to <9.1 40 32.5 ± 9.2 10.88 ± 2.49 6.78 7.69 9.20 10.88 12.56 14.07 14.98 16.68
9.1 to <18.1 33 55.8 ± 10.8 14.52 ± 1.98 11.25 11.98 13.18 14.52 15.85 17.06 17.78 19.13
18.1 to <40.1 52 98.1 ± 25.2 20.39 ± 3.62 14.44 15.75 17.95 20.39 22.83 25.03 26.35 28.81
40.1 to <70.1 81 93.2 ± 14.9 17.96 ± 3.71 11.85 13.20 15.45 17.96 20.46 22.71 24.06 26.59
70.1 to ≤96 32 82.3 ± 10.3 14.23 ± 2.94 9.40 10.46 12.25 14.23 16.21 18.00 19.06 21.07
Females—Normal-weight
4 to <5.1 82 18.7 ± 2.0 7.41 ± 0.91 5.92 6.25 6.80 7.41 8.02 8.57 8.90 9.52
5.1 to <9.1 151 25.5 ± 4.1 9.39 ± 1.62 6.72 7.31 8.30 9.39 10.48 11.47 12.05 13.16
9.1 to <18.1 124 42.7 ± 11.1 12.04 ± 2.86 7.34 8.38 10.11 12.04 13.97 15.70 16.74 18.68
18.1 to <40.1 135 59.1 ± 6.3 13.73 ± 2.01 10.41 11.15 12.37 13.73 15.09 16.31 17.04 18.41
40.1 to <70.1 79 59.1 ± 5.3 11.93 ± 2.16 8.38 9.16 10.47 11.93 13.38 14.69 15.48 16.95
70.1 to ≤96 24 54.8 ± 7.5 8.87 ± 1.79 5.92 6.57 7.66 8.87 10.07 11.16 11.81 13.03
Females—Overweight/obese
4 to <5.1 56 26.1 ± 5.5 8.70 ± 1.13 6.84 7.26 7.94 8.70 9.47 10.15 10.56 11.33
5.1 to <9.1 68 34.6 ± 9.9 10.55 ± 2.23 6.88 7.69 9.05 10.55 12.06 13.41 14.22 15.75
9.1 to <18.1 68 59.2 ± 12.8 14.27 ± 2.70 9.83 10.81 12.45 14.27 16.09 17.73 18.71 20.55
18.1 to <40.1 76 84.4 ± 16.3 15.66 ± 2.11 12.18 12.95 14.23 15.66 17.08 18.36 19.13 20.57
40.1 to <70.1 91 81.7 ± 17.2 13.01 ± 2.82 8.37 9.40 11.11 13.01 14.91 16.62 17.64 19.56
70.1 to ≤96 28 69.0 ± 7.8 10.00 ± 1.78 7.07 7.71 8.80 10.00 11.20 12.28 12.93 14.14 a Measured body weight. Normal-weight and overweight/obese males defined according to the BMI cut-offs. b Physiological daily inhalation rates were calculated using the following equation: (TDEE + ECG) × H × (VE/VO2) ×
10−3, where H = 0.21 L of O2/Kcal, VE/VO2 = 27 (Layton, 1993), TDEE = total daily energy expenditure (kcal/day) and ECG = stored daily energy cost for growth (kcal/day).
c Percentiles based on a normal distribution assumption for age groups.
N = Number of individuals. SD = Standard deviation.
Source: Brochu et al. (2006b).
Exposure Factors Handbook
Chapter 6—Inhalation Rates
Exposure Factors Handbook Page September 2011 6-27

Table 6-7. Distribution Percentiles of Physiological Daily Inhalation Rates (PDIRs) per Unit of Body Weight (m3/kg-day) for Free-Living Normal-Weight Males and Females Aged 2.6 Months to 96 Years
Age Group (years)
Physiological Daily Inhalation Ratesa (m3/kg-day)
Mean ± SD
Percentileb
5th 10th 25th 50th 75th 90th 95th 99th
Males
0.22 to <0.5 0.51 ± 0.09 0.36 0.39 0.45 0.51 0.57 0.63 0.66 0.73
0.5 to <1 0.48 ± 0.07 0.36 0.39 0.43 0.48 0.53 0.57 0.60 0.64
1 to <2 0.48 ± 0.06 0.38 0.41 0.44 0.48 0.52 0.56 0.58 0.62
2 to <5 0.44 ± 0.04 0.38 0.39 0.42 0.44 0.47 0.50 0.51 0.54
5 to <7 0.42 ± 0.05 0.34 0.35 0.38 0.42 0.45 0.48 0.49 0.52
7 to <11 0.37 ± 0.06 0.27 0.29 0.33 0.37 0.41 0.45 0.47 0.52
11 to <23 0.30 ± 0.05 0.22 0.24 0.27 0.30 0.33 0.36 0.38 0.41
23 to <30 0.25 ± 0.04 0.18 0.20 0.22 0.25 0.27 0.30 0.31 0.34
30 to <40 0.24 ± 0.03 0.18 0.19 0.21 0.24 0.26 0.28 0.29 0.32
40 to <65 0.23 ± 0.04 0.16 0.18 0.20 0.23 0.26 0.28 0.30 0.33
65 to ≤96 0.19 ± 0.03 0.14 0.15 0.17 0.19 0.21 0.23 0.24 0.26
Females
0.22 to <0.5 0.50 ± 0.09 0.35 0.39 0.44 0.50 0.57 0.62 0.66 0.72
0.5 to <1 0.46 ± 0.06 0.36 0.38 0.42 0.46 0.51 0.55 0.57 0.61
1 to <2 0.45 ± 0.08 0.33 0.35 0.40 0.45 0.50 0.55 0.58 0.63
2 to <5 0.44 ± 0.07 0.32 0.35 0.39 0.44 0.49 0.53 0.56 0.61
5 to <7 0.40 ± 0.05 0.32 0.33 0.36 0.40 0.43 0.46 0.47 0.51
7 to <11 0.35 ± 0.06 0.25 0.27 0.31 0.35 0.39 0.43 0.45 0.50
11 to <23 0.27 ± 0.05 0.19 0.21 0.24 0.27 0.30 0.33 0.35 0.38
23 to <30 0.23 ± 0.04 0.16 0.18 0.20 0.23 0.26 0.29 0.30 0.33
30 to <40 0.24 ± 0.04 0.18 0.19 0.21 0.24 0.26 0.28 0.29 0.32
40 to <65 0.21 ± 0.04 0.15 0.16 0.19 0.21 0.24 0.26 0.27 0.30
65 to ≤96 0.17 ± 0.04 0.11 0.13 0.15 0.17 0.20 0.22 0.23 0.26 a Physiological daily inhalation rates were calculated using the following equation: (TDEE + ECG) ×
H × (VE/VO2) × 10−3, where H = 0.21 L of O2/Kcal, VE/VO2 = 27 (Layton, 1993), TDEE = total daily energy expenditure (kcal/day) and ECG = stored daily energy cost for growth (kcal/day).
b Percentiles based on a normal distribution assumption for age groups.
SD = Standard deviation.
Source: Brochu et al. (2006b).
Exposure Factors Handbook
Chapter 6—Inhalation Rates
Page Exposure Factors Handbook 6-28 September 2011

Table 6-8. Distribution Percentiles of Physiological Daily Inhalation Rates (PDIRs) (m3/kg-day) for Free-Living Normal-Weight and Overweight/Obese Males and Females Aged 4 to 96 Years
Age Group (years)
Physiological Daily Inhalation Ratesa (m3/kg-day)
Mean ± SD
Percentileb
5th 10th 25th 50th 75th 90th 95th 99th
Males—Normal-weight
4 to <5.1 0.42 ± 0.04 0.35 0.36 0.39 0.42 0.45 0.47 0.49 0.52
5.1 to <9.1 0.41 ± 0.06 0.31 0.34 0.37 0.41 0.45 0.48 0.50 0.54
9.1 to <18.1 0.33 ± 0.05 0.26 0.27 0.30 0.33 0.37 0.40 0.41 0.45
18.1 to <40.1 0.25± 0.04 0.18 0.20 0.22 0.25 0.27 0.29 0.31 0.33
40.1 to <70.1 0.22 ± 0.04 0.16 0.17 0.20 0.22 0.25 0.28 0.29 0.32
70.1 to ≤96 0.19 ± 0.03 0.13 0.14 0.16 0.19 0.21 0.23 0.24 0.26
Males—Overweight/obese
4 to <5.1 0.37 ± 0.04 0.30 0.31 0.34 0.37 0.40 0.42 0.44 0.47
5.1 to <9.1 0.35 ± 0.08 0.22 0.25 0.29 0.35 0.40 0.45 0.47 0.53
9.1 to <18.1 0.27 ± 0.04 0.20 0.22 0.24 0.27 0.29 0.32 0.33 0.36
18.1 to <40.1 0.21 ± 0.04 0.15 0.17 0.19 0.21 0.22 0.26 0.27 0.30
40.1 to <70.1 0.19 ± 0.03 0.14 0.15 0.17 0.19 0.22 0.24 0.25 0.28
70.1 to ≤96 0.17 ± 0.03 0.12 0.13 0.15 0.17 0.19 0.21 0.22 0.24
Females—Normal-weight
4 to <5.1 0.40 ± 0.05 0.32 0.34 0.37 0.40 0.43 0.46 0.48 0.51
5.1 to <9.1 0.37 ± 0.06 0.27 0.29 0.33 0.37 0.41 0.45 0.47 0.52
9.1 to <18.1 0.29 ± 0.06 0.20 0.22 0.25 0.29 0.33 0.36 0.38 0.42
18.1 to <40.1 0.23 ± 0.04 0.17 0.19 0.21 0.23 0.26 0.28 0. 30 0.32
40.1 to <70.1 0.20 ± 0.04 0.14 0.15 0.18 0.20 0.23 0.25 0.27 0.29
70.1 to ≤96 0.16 ± 0.04 0.11 0.12 0.14 0.16 0.19 0.20 0.22 0.24
Females—Overweight/obese
4 to <5.1 0.34 ± 0.04 0.27 0.28 0.31 0.34 0.37 0.40 0.41 0.44
5.1 to <9.1 0.32 ± 0.07 0.21 0.23 0.27 0.32 0.36 0.40 0.43 0.47
9.1 to <18.1 0.25 ± 0.05 0.17 0.18 0.21 0.25 0.28 0.31 0.33 0.36
18.1 to <40.1 0.19 ± 0.03 0.14 0.15 0.17 0.19 0.21 0.22 0.23 0.25
40.1 to <70.1 0.16 ± 0.03 0.11 0.12 0.14 0.16 0.18 0.20 0.21 0.23
70.1 to ≤96 0.15 ± 0.03 0.10 0.11 0.13 0.15 0.16 0.18 0.19 0.21 a Physiological daily inhalation rates were calculated using the following equation: (TDEE + ECG) × H ×
(VE/VO2) × 10−3, where H = 0.21 L of O2/Kcal, VE/VO2 = 27 (Layton, 1993), TDEE = total daily energy expenditure (kcal/day) and ECG = stored daily energy cost for growth (kcal/day).
b Percentiles based on a normal distribution assumption for age groups.
SD = Standard deviation. Source: Brochu et al. (2006b).
Exposure Factors Handbook
Chapter 6—Inhalation Rates
Exposure Factors Handbook Page September 2011 6-29

c
Table 6-9. Physiological Daily Inhalation Rates (PDIRs) for Newborns Aged 1 Month or Less Physiological Daily Inhalation Ratesa
Body Weight (kg) Mean ± SD Age Group N Mean ± SD (m3/day) (m3/kg-day)
21 days (3 weeks) 13b,c 1.2 ± 0.2 0.85 ± 0.17d 0.74 ± 0.09d
32 days (~1 month) 10e,f 4.7 ± 0.7 2.45 ± 0.59g 0.53 ± 0.10g
33 days (~1 month) 10b,f 4.8 ± 0.3 2.99 ± 0.47g 0.62 ±0.09g
a Physiological daily inhalation rates were calculated using the following equation: (TDEE + ECG) × H × (VE/VO2) × 10−3, where H = 0.21 L of O2/Kcal, VE/VO2 = 27 (Layton, 1993), TDEE = total daily energy expenditure (kcal/day) and ECG = stored daily energy cost for growth (kcal/day).
b Formula-fed infants. Healthy infants with very low birth weight.
d TDEEs based on nutritional balance measurements during 3-day periods. e Breast-fed infants. f Infants evaluated as being clinically healthy and neither underweight or overweight. g TDEEs based on 2H2O and H2
18O disappearance rates from urine.
N = Number of individuals. SD = Standard deviation.
Source: Brochu et al. (2006b).
Exposure Factors Handbook
Chapter 6—Inhalation Rates
Page Exposure Factors Handbook 6-30 September 2011

Exposure Factors Handbook
Chapter 6—Inhalation Rates
Table 6-10. Non-Normalized Daily Inhalation Rates (m3/day) Derived Using Layton’s (1993) Method and CSFII Energy Intake Data
Age Sample Size
(Non-Weighted) Mean SEM Percentiles SE of 95th
Percentile 50th 90th 95th
Infancy 0 to 2 months 182 3.63 0.14 3.30 5.44 7.10 0.64 3 to 5 months 294 4.92 0.14 4.56 6.86 7.72 0.48 6 to 8 months 261 6.09 0.15 5.67 8.38 9.76 0.86 9 to 11 months 283 7.41 0.20 6.96 10.21 11.77 -0 to 11 months 1,020 5.70 0.10 5.32 8.74 9.95 0.55
Children 1 year 934 8.77 0.08 8.30 12.19 13.79 0.25 2 years 989 9.76 0.10 9.38 13.56 14.81 0.35 3 years 1,644 10.64 0.10 10.28 14.59 16.03 0.27 4 years 1,673 11.40 0.09 11.05 15.53 17.57 0.23 5 years 790 12.07 0.13 11.56 15.72 18.26 0.47 6 years 525 12.25 0.18 11.95 16.34 17.97 0.87 7 years 270 12.86 0.21 12.51 16.96 19.06 1.27 8 years 253 13.05 0.25 12.42 17.46 19.02 1.08 9 years 271 14.93 0.29 14.45 19.68 22.45a 1.35 10 years 234 15.37 0.35 15.19 20.87 22.90a 1.02 11 years 233 15.49 0.32 15.07 21.04 23.91a 1.62 12 years 170 17.59 0.54 17.11 25.07a 29.17a 1.61 13 years 194 15.87 0.44 14.92 22.81a 26.23a 1.11 14 years 193 17.87 0.62 15.90 25.75a 29.45a 4.38 15 years 185 18.55 0.55 17.91 28.11a 29.93a 1.79 16 years 201 18.34 0.54 17.37 27.56 31.01 2.07 17 years 159 17.98 0.96 15.90 31.42a 36.69a -18 years 135 18.59 0.78 17.34 28.80a 35.24a 4.24
Adolescent Boys 9 to 18 years 983 19.27 0.28 17.96 28.78 32.82 1.39
Adolescent Girls 9 to 18 years 992 14.27 0.22 13.99 21.17 23.30 0.61
U.S. EPA Cancer Guidelines’ Age Groups with Greater Weighting 0 through 1 year 1,954 7.50 0.08 7.19 11.50 12.86 0.17 2 through 15 years 7,624 14.09 0.12 13.13 20.99 23.88 0.50 a FASEB/LSRO (1995) convention, adopted by CSFII, denotes a value that might be less statistically reliable
than other estimates due to small cell size. - Denotes unable to calculate.
SEM = Standard error of the mean. SE = Standard error.
Source: Arcus-Arth and Blaisdell (2007).
Exposure Factors Handbook Page September 2011 6-31

Exposure Factors Handbook
Chapter 6—Inhalation Rates
Table 6-11. Mean and 95th Percentile Inhalation Rate Values (m3/day) for Males and Females Combined Age Groupa,b Sample Size Meanc 95th,c
Birth to <1 month 182 3.63 7.10 1 to <3 months 182 3.63 7.10 3 to <6 months 294 4.92 7.72 6 to <12 months 544 6.78 10.81 Birth to <1 year 1,020 5.70 9.95 1 to <2 years 934 8.77 13.79 2 to <3 years 989 9.76 14.81 3 to <6 years 4,107 11.22 17.09 6 to <11 years 1,553 13.42 19.86 11 to <16 years 975 16.98 27.53 16 to <21 years 495 18.29 33.99 a No other age groups from Table 6-10 (Arcus-Arth and Blaisdell, 2007) fit into the U.S. EPA age
groupings. b See Table 6-25 for concordance with U.S. EPA age groupings. c Weighted (where possible) average of reported study means and 95th percentiles.
Source: Arcus-Arth and Blaisdell (2007).
Page Exposure Factors Handbook 6-32 September 2011
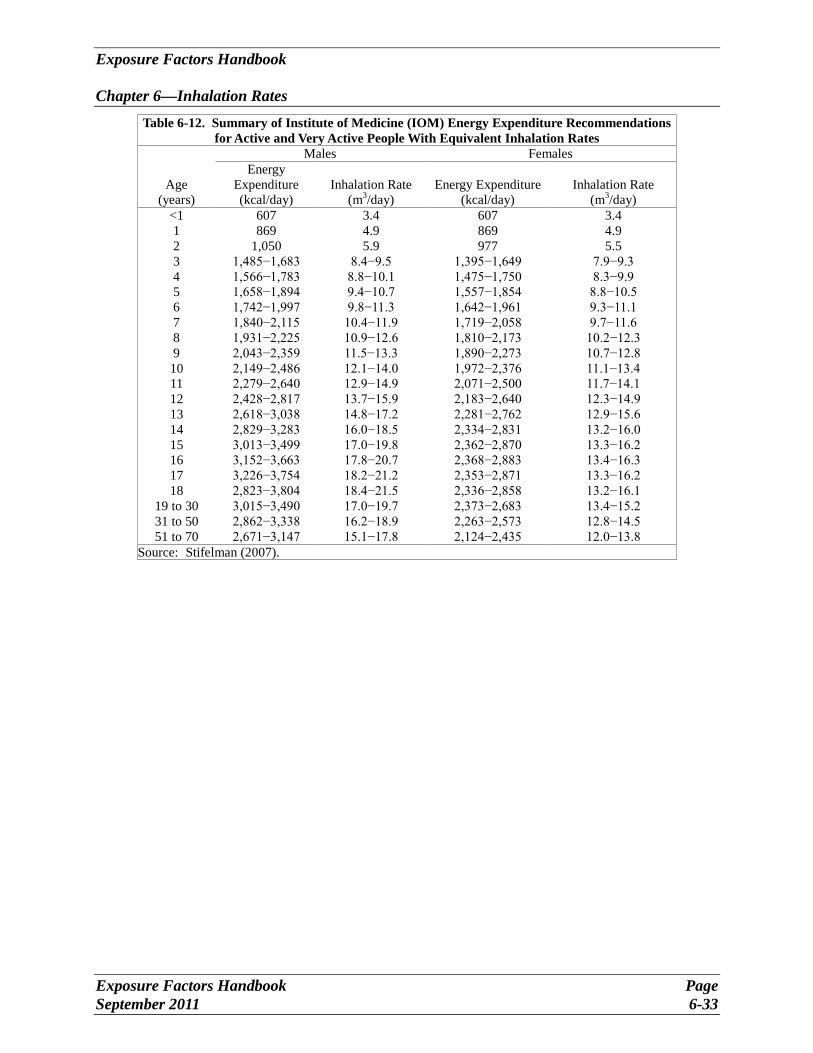
Table 6-12. Summary of Institute of Medicine (IOM) Energy Expenditure Recommendations for Active and Very Active People With Equivalent Inhalation Rates
Males Females Energy
Age Expenditure Inhalation Rate Energy Expenditure Inhalation Rate (years) (kcal/day) (m3/day) (kcal/day) (m3/day)
<1 607 3.4 607 3.4 1 869 4.9 869 4.9 2 1,050 5.9 977 5.5 3 1,485−1,683 8.4−9.5 1,395−1,649 7.9−9.3 4 1,566−1,783 8.8−10.1 1,475−1,750 8.3−9.9 5 1,658−1,894 9.4−10.7 1,557−1,854 8.8−10.5 6 1,742−1,997 9.8−11.3 1,642−1,961 9.3−11.1 7 1,840−2,115 10.4−11.9 1,719−2,058 9.7−11.6 8 1,931−2,225 10.9−12.6 1,810−2,173 10.2−12.3 9 2,043−2,359 11.5−13.3 1,890−2,273 10.7−12.8 10 2,149−2,486 12.1−14.0 1,972−2,376 11.1−13.4 11 2,279−2,640 12.9−14.9 2,071−2,500 11.7−14.1 12 2,428−2,817 13.7−15.9 2,183−2,640 12.3−14.9 13 2,618−3,038 14.8−17.2 2,281−2,762 12.9−15.6 14 2,829−3,283 16.0−18.5 2,334−2,831 13.2−16.0 15 3,013−3,499 17.0−19.8 2,362−2,870 13.3−16.2 16 3,152−3,663 17.8−20.7 2,368−2,883 13.4−16.3 17 3,226−3,754 18.2−21.2 2,353−2,871 13.3−16.2 18 2,823−3,804 18.4−21.5 2,336−2,858 13.2−16.1
19 to 30 3,015−3,490 17.0−19.7 2,373−2,683 13.4−15.2 31 to 50 2,862−3,338 16.2−18.9 2,263−2,573 12.8−14.5 51 to 70 2,671−3,147 15.1−17.8 2,124−2,435 12.0−13.8
Source: Stifelman (2007).
Exposure Factors Handbook
Chapter 6—Inhalation Rates
Exposure Factors Handbook Page September 2011 6-33

Exposure Factors Handbook
Chapter 6—Inhalation Rates
Table 6-13. Mean Inhalation Rate Values (m3/day) for Males, Females, and Males and Females Combineda
Age Groupb,c (years) Malesd Femalesd Combinedd
Birth to <1 3.4 3.4 3.4
1 to <2 4.9 4.9 4.9
2 to <3 5.9 5.5 5.7
3 to <6 9.5 9.1 9.3
6 to <11 11.8 11.2 11.5
11 to <16 16.1 14.0 15.0
16 to <21 19.3 14.6 17.0
21 to <31 18.4 14.3 16.3
31 to <41 17.6 13.7 15.6
41 to <51 17.6 13.7 15.6
51 to <61 16.5 12.9 14.7
61 to <71 16.5 12.9 14.7 a Inhalation rates are for IOM Physical Activity Level (PAL) category “active”; the total number of
subjects for all PAL categories was 3,007. Sample sizes were not reported. b Age groups from Table 6-12 were regrouped to fit into the U.S. EPA age groupings. c See Table 6-25 for concordance with U.S. EPA age groupings. d Weighted (where possible) average of reported study means.
Source: Stifelman (2007).
Page Exposure Factors Handbook 6-34 September 2011

Table 6-14. Descriptive Statistics for Daily Average Inhalation Rate in Males, by Age Categorya
Daily Average Inhalation Rate, Unadjusted for Body Weight (m3/day)
Percentiles Age Group 5th 10th 25th 50th 75th 90th 95th(years) N Mean Maximum
Birth to <1 419 8.76 4.78 5.70 7.16 8.70 10.43 11.92 12.69 17.05 1 to <2 308 13.49 9.73 10.41 11.65 13.12 15.02 17.02 17.90 24.24 2 to <3 261 13.23 9.45 10.21 11.43 13.19 14.50 16.27 17.71 28.17 3 to <6 540 12.64 10.43 10.87 11.39 12.59 13.64 14.63 15.41 19.53 6 to <11 940 13.42 10.08 10.68 11.74 13.09 14.73 16.56 17.73 24.97 11 to <16 1,337 15.32 11.40 12.11 13.28 14.79 16.82 19.54 21.21 28.54 16 to <21 1,241 17.21 12.60 13.41 14.49 16.63 19.17 21.93 23.37 39.21 21 to <31 701 18.82 12.69 13.56 15.49 18.17 21.24 24.57 27.13 43.42 31 to <41 728 20.29 14.00 14.96 16.96 19.83 23.01 26.77 28.90 40.72 41 to <51 753 20.94 14.66 15.54 17.50 20.59 23.89 26.71 28.37 45.98 51 to <61 627 20.91 14.99 16.07 17.60 20.40 23.16 27.01 29.09 38.17 61 to <71 678 17.94 13.91 14.50 15.88 17.60 19.54 21.77 23.50 28.09 71 to <81 496 16.34 13.10 13.61 14.66 16.23 17.57 19.43 20.42 24.52 ≥81 255 15.15 11.95 12.57 13.82 14.90 16.32 18.01 18.69 22.64
Daily Average Inhalation Rate, Adjusted for Body Weight (m3/day-kg)
Percentiles Age Group 5th 10th 25th 50th 75th 90th 95th(years) N Mean Maximum
Birth to <1 419 1.09 0.91 0.94 1.00 1.09 1.16 1.26 1.29 1.48 1 to <2 308 1.19 0.96 1.02 1.09 1.17 1.26 1.37 1.48 1.73 2 to <3 261 0.95 0.78 0.82 0.87 0.94 1.01 1.09 1.13 1.36 3 to <6 540 0.70 0.52 0.56 0.61 0.69 0.78 0.87 0.92 1.08 6 to <11 940 0.44 0.32 0.34 0.38 0.43 0.50 0.55 0.58 0.80 11 to <16 1,337 0.29 0.21 0.22 0.25 0.28 0.32 0.36 0.38 0.51 16 to <21 1,241 0.23 0.17 0.18 0.20 0.23 0.25 0.28 0.30 0.39 21 to <31 701 0.23 0.16 0.17 0.19 0.22 0.26 0.30 0.32 0.51 31 to <41 728 0.24 0.16 0.18 0.20 0.23 0.27 0.31 0.34 0.46 41 to <51 753 0.24 0.17 0.18 0.20 0.23 0.28 0.32 0.34 0.47 51 to <61 627 0.24 0.16 0.18 0.20 0.24 0.27 0.30 0.34 0.43 61 to <71 678 0.21 0.17 0.18 0.19 0.20 0.22 0.24 0.25 0.32 71 to <81 496 0.20 0.17 0.18 0.19 0.20 0.21 0.23 0.24 0.31 ≥81 255 0.20 0.17 0.18 0.19 0.20 0.22 0.23 0.25 0.28 a Individual daily averages are weighted by their 4-year sampling weights as assigned within NHANES 1999−2002
when calculating the statistics in this table. Inhalation rate was estimated using a multiple linear regression model.
N = Number of individuals. BW = Body weight.
Source: U.S. EPA (2009a).
Exposure Factors Handbook
Chapter 6—Inhalation Rates
Exposure Factors Handbook Page September 2011 6-35

Table 6-15. Descriptive Statistics for Daily Average Inhalation Rate in Females, by Age Categorya
Daily Average Inhalation Rate, Unadjusted for Body Weight (m3/day)
Age Group (years) N Mean Percentiles
Maximum 5th 10th 25th 50th 75th 90th 95th
Birth to <1 415 8.52 4.84 5.49 6.84 8.41 9.78 11.65 12.66 26.25 1 245 13.31 9.09 10.12 11.25 13.03 14.64 17.45 18.62 24.77 2 255 12.74 8.91 10.07 11.38 12.60 13.95 15.58 16.36 23.01 3 to <6 543 12.17 9.88 10.38 11.20 12.02 13.02 14.03 14.93 19.74 6 to <11 894 12.41 9.99 10.35 11.02 11.95 13.42 15.13 16.34 20.82 11 to <16 1,451 13.44 10.47 11.12 12.04 13.08 14.54 16.26 17.41 26.58 16 to <21 1,182 13.59 9.86 10.61 11.78 13.20 15.02 17.12 18.29 30.11 21 to <31 1,023 14.57 10.15 10.67 11.94 14.10 16.62 19.32 21.14 30.23 31 to <41 869 14.98 11.07 11.81 13.02 14.69 16.32 18.50 20.45 28.28 41 to <51 763 16.20 12.11 12.57 14.16 15.88 17.96 19.92 21.34 35.88 51 to <61 622 16.19 12.33 12.96 14.07 15.90 17.80 19.93 21.21 25.70 61 to <71 700 12.99 10.40 10.77 11.78 12.92 13.91 15.39 16.14 20.33 71 to <81 470 12.04 9.89 10.20 10.89 11.82 12.96 14.11 15.19 17.70 ≥81 306 11.15 9.19 9.46 10.14 11.02 11.87 12.84 13.94 16.93
Daily Average Inhalation Rate, Adjusted for Body Weight (m3/day-kg)
Age Group (years) N Mean Percentiles
Maximum 5th 10th 25th 50th 75th 90th 95th
Birth to <1 415 1.14 0.91 0.97 1.04 1.13 1.24 1.33 1.38 1.60 1 245 1.20 0.97 1.01 1.10 1.18 1.30 1.41 1.46 1.73 2 255 0.95 0.82 0.84 0.89 0.96 1.01 1.07 1.10 1.23 3 to <6 543 0.69 0.48 0.54 0.60 0.68 0.77 0.88 0.92 1.12 6 to <11 894 0.43 0.28 0.31 0.36 0.43 0.49 0.55 0.58 0.75 11 to <16 1,451 0.25 0.19 0.20 0.22 0.24 0.28 0.31 0.34 0.47 16 to <21 1,182 0.21 0.16 0.17 0.19 0.21 0.23 0.27 0.28 0.36 21 to <31 1,023 0.21 0.14 0.16 0.18 0.20 0.23 0.26 0.28 0.40 31 to <41 869 0.21 0.14 0.15 0.18 0.20 0.23 0.27 0.30 0.43 41 to <51 763 0.22 0.15 0.16 0.19 0.21 0.25 0.28 0.31 0.41 51 to <61 622 0.22 0.15 0.16 0.18 0.21 0.24 0.28 0.30 0.40 61 to <71 700 0.18 0.14 0.15 0.16 0.17 0.19 0.21 0.22 0.27 71 to <81 470 0.18 0.14 0.15 0.16 0.17 0.19 0.21 0.23 0.34 ≥81 306 0.18 0.14 0.15 0.16 0.18 0.20 0.21 0.22 0.28 a Individual daily averages are weighted by their 4-year sampling weights as assigned within NHANES 1999−2002
when calculating the statistics in this table. Inhalation rate was estimated using a multiple linear regression model.
N = Number of individuals.
Source: U.S. EPA (2009a)
Exposure Factors Handbook
Chapter 6—Inhalation Rates
Page Exposure Factors Handbook 6-36 September 2011

Exposure Factors Handbook
Chapter 6—Inhalation Rates
Table 6-16. Mean and 95th Percentile Inhalation Rate Values (m3/day) for Males, Females, and Males and Females Combined
Age Group (years) N Mean 95th
Males
Birth to <1 419 8.76 12.69
1 to <2 308 13.49 17.90
2 to <3 261 13.23 17.71
3 to <6 540 12.64 15.41
6 to <11 940 13.42 17.73
11 to <16 1,337 15.32 21.21
16 to <21 1,241 17.21 23.37
21 to <31 701 18.82 27.13
31 to <41 728 20.29 28.90
41 to <51 753 20.94 28.37
51 to <61 627 20.91 29.09
61 to <71 678 17.94 23.50
71 to <81 496 16.34 20.42
≥81 255 15.15 18.69
Females
Birth to <1 415 8.52 12.66
1 to <2 245 13.31 18.62
2 to <3 255 12.74 16.36
3 to <6 543 12.17 14.93
6 to <11 894 12.41 16.34
11 to <16 1,451 13.44 17.41
16 to <21 1,182 13.59 18.29
21 to <31 1,023 14.57 21.14
31 to <41 869 14.98 20.45
41 to <51 763 16.20 21.34
51 to <61 622 16.19 21.21
61 to <71 700 12.99 16.14
71 to <81 470 12.04 15.19
≥81 306 11.15 13.94
Exposure Factors Handbook Page September 2011 6-37

Exposure Factors Handbook
Chapter 6—Inhalation Rates
Table 6-16. Mean and 95th Percentile Inhalation Rate Values (m3/day) for Males, Females, and Males and Females Combined (continued)
Age Group (years) N Mean 95th
Males and Females Combineda
Birth to <1 834 8.64 12.67
1 to <2 553 13.41 18.22
2 to <3 516 12.99 17.04
3 to <6 1,083 12.40 15.17
6 to <11 1,834 12.93 17.05
11 to <16 2,788 14.34 19.23
16 to <21 2,423 15.44 20.89
21 to <31 1,724 16.30 23.57
31 to <41 1,597 17.40 24.30
41 to <51 1,516 18.55 24.83
51 to <61 1,249 18.56 25.17
61 to <71 1,378 15.43 19.76
71 to <81 966 14.25 17.88
≥81 561 12.97 16.10 a Weighted average of reported male and female means and 95th percentiles.
N = Number of individuals.
Source: U.S. EPA (2009a).
Page Exposure Factors Handbook 6-38 September 2011

Exposure F
actors Handbook
Chapter 6—
Inhalation Rates
Table 6-17. Descriptive Statistics for Average Ventilation Rate, a Unadjusted for Body Weight, While Performing Activities Within the Specified Activity Category, for Males by Age Category
Age Group (years) N
Average Ventilation Rate (m3/minute)
Mean
Percentiles
Maximum 5th 10th 25th 50th 75th 90th 95th
Sleep or nap (Activity ID = 14500)
Birth to <1 419
1 308
2 261
3 to <6 540
6 to <11 940
11 to <16 1,337
16 to <21 1,241
21 to <31 701
31 to <41 728
41 to <51 753
51 to <61 627
61 to <71 678
71 to <81 496
≥81 255
3.08E−03 1.66E−03 1.91E−03 2.45E−03 3.00E−03 3.68E−03 4.35E−03 4.77E−03 7.19E−03
4.50E−03 3.11E−03 3.27E−03 3.78E−03 4.35E−03 4.95E−03 5.90E−03 6.44E−03 1.00E−02
4.61E−03 3.01E−03 3.36E−03 3.94E−03 4.49E−03 5.21E−03 6.05E−03 6.73E−03 8.96E−03
4.36E−03 3.06E−03 3.30E−03 3.76E−03 4.29E−03 4.86E−03 5.54E−03 5.92E−03 7.67E−03
4.61E−03 3.14E−03 3.39E−03 3.83E−03 4.46E−03 5.21E−03 6.01E−03 6.54E−03 9.94E−03
5.26E−03 3.53E−03 3.78E−03 4.34E−03 5.06E−03 5.91E−03 6.94E−03 7.81E−03 1.15E−02
5.31E−03 3.55E−03 3.85E−03 4.35E−03 5.15E−03 6.09E−03 6.92E−03 7.60E−03 1.28E−02
4.73E−03 3.16E−03 3.35E−03 3.84E−03 4.56E−03 5.42E−03 6.26E−03 6.91E−03 1.12E−02
5.16E−03 3.37E−03 3.62E−03 4.23E−03 5.01E−03 5.84E−03 6.81E−03 7.46E−03 1.09E−02
5.65E−03 3.74E−03 4.09E−03 4.73E−03 5.53E−03 6.47E−03 7.41E−03 7.84E−03 1.08E−02
5.78E−03 3.96E−03 4.20E−03 4.78E−03 5.57E−03 6.54E−03 7.74E−03 8.26E−03 1.18E−02
5.98E−03 4.36E−03 4.57E−03 5.13E−03 5.81E−03 6.68E−03 7.45E−03 7.93E−03 1.23E−02
6.07E−03 4.26E−03 4.55E−03 5.17E−03 6.00E−03 6.77E−03 7.65E−03 8.33E−03 1.05E−02
5.97E−03 4.20E−03 4.49E−03 5.23E−03 5.90E−03 6.68E−03 7.36E−03 7.76E−03 1.00E−02
Sedentary and Passive Activities (METS ≤1.5—Includes Sleep or Nap)
Birth to <1 419
1 308
2 261
3 to <6 540
6 to <11 940
11 to <16 1,337
3.18E−03 1.74E−03 1.99E−03 2.50E−03 3.10E−03 3.80E−03 4.40E−03 4.88E−03 7.09E−03
4.62E−03 3.17E−03 3.50E−03 3.91E−03 4.49E−03 5.03E−03 5.95E−03 6.44E−03 9.91E−03
4.79E−03 3.25E−03 3.66E−03 4.10E−03 4.69E−03 5.35E−03 6.05E−03 6.71E−03 9.09E−03
4.58E−03 3.47E−03 3.63E−03 4.07E−03 4.56E−03 5.03E−03 5.58E−03 5.82E−03 7.60E−03
4.87E−03 3.55E−03 3.78E−03 4.18E−03 4.72E−03 5.40E−03 6.03E−03 6.58E−03 9.47E−03
5.64E−03 4.03E−03 4.30E−03 4.79E−03 5.43E−03 6.26E−03 7.20E−03 7.87E−03 1.11E−02
Exposure F
actors Handbook
Page Septem
ber 2011 6-39

Exposure F
actors Handbook
Chapter 6—
Inhalation Rates
Page E
xposure Factors H
andbook 6-40
September 2011
Table 6-17. Descriptive Statistics for Average Ventilation Rate,a Unadjusted for Body Weight, While Performing Activities Within the Specified Activity Category, for Males by Age Category (continued)
Age Group (years) N
Average Ventilation Rate (m3/minute)
Mean
Percentiles
Maximum 5th 10th 25th 50th 75th 90th 95th
16 to <21
21 to <31
31 to <41
41 to <51
51 to <61
61 to <71
71 to <81
≥81
1,241 5.76E−03 4.17E−03 4.42E−03 4.93E−03 5.60E−03 6.43E−03 7.15E−03 7.76E−03 1.35E−02
701 5.11E−03 3.76E−03 3.99E−03 4.33E−03 5.00E−03 5.64E−03 6.42E−03 6.98E−03 1.03E−02
728 5.57E−03 3.99E−03 4.42E−03 4.86E−03 5.45E−03 6.17E−03 6.99E−03 7.43E−03 1.00E−02
753 6.11E−03 4.65E−03 4.92E−03 5.37E−03 6.02E−03 6.65E−03 7.46E−03 7.77E−03 1.05E−02
627 6.27E−03 4.68E−03 5.06E−03 5.50E−03 6.16E−03 6.89E−03 7.60E−03 8.14E−03 1.04E−02
678 6.54E−03 5.02E−03 5.31E−03 5.85E−03 6.47E−03 7.12E−03 7.87E−03 8.22E−03 1.09E−02
496 6.65E−03 5.26E−03 5.55E−03 5.96E−03 6.59E−03 7.18E−03 7.81E−03 8.26E−03 9.9E−03
255 6.44E−03 5.09E−03 5.37E−03 5.82E−03 6.43E−03 7.01E−03 7.57E−03 7.90E−03 9.13E−03
Light Intensity Activities (1.5< METS ≤3.0)
Birth to <1
1
2
3 to <6
6 to <11
11 to <16
16 to <21
21 to <31
31 to <41
41 to <51
51 to <61
61 to <71
71 to <81
≥81
419 7.94E−03 4.15E−03 5.06E−03 6.16E−03 7.95E−03 9.57E−03 1.08E−02 1.19E−02 1.55E−02
308 1.16E−02 8.66E−03 8.99E−03 9.89E−03 1.14E−02 1.29E−02 1.44E−02 1.58E−02 2.11E−02
261 1.17E−02 8.52E−03 9.14E−03 9.96E−03 1.14E−02 1.30E−02 1.47E−02 1.53E−02 1.90E−02
540 1.14E−02 9.20E−03 9.55E−03 1.02E−02 1.11E−02 1.23E−02 1.34E−02 1.40E−02 1.97E−02
940 1.16E−02 8.95E−03 9.33E−03 1.02E−02 1.13E−02 1.28E−02 1.46E−02 1.56E−02 2.18E−02
1,337 1.32E−02 9.78E−03 1.03E−02 1.13E−02 1.28E−02 1.47E−02 1.64E−02 1.87E−02 2.69E−02
1,241 1.34E−02 1.00E−02 1.05E−02 1.15E−02 1.30E−02 1.50E−02 1.70E−02 1.80E−02 2.91E−02
701 1.30E−02 9.68E−03 1.02E−02 1.13E−02 1.24E−02 1.40E−02 1.65E−02 1.77E−02 2.72E−02
728 1.36E−02 1.06E−02 1.11E−02 1.20E−02 1.33E−02 1.48E−02 1.65E−02 1.81E−02 2.55E−02
753 1.44E−02 1.12E−02 1.18E−02 1.30E−02 1.41E−02 1.56E−02 1.74E−02 1.83E−02 2.30E−02
627 1.46E−02 1.11E−02 1.16E−02 1.30E−02 1.44E−02 1.59E−02 1.80E−02 1.94E−02 2.55E−02
678 1.41E−02 1.11E−02 1.17E−02 1.27E−02 1.39E−02 1.54E−02 1.69E−02 1.80E−02 2.05E−02
496 1.39E−02 1.12E−02 1.17E−02 1.27E−02 1.37E−02 1.50E−02 1.62E−02 1.69E−02 2.00E−02
255 1.38E−02 1.10E−02 1.17E−02 1.26E−02 1.38E−02 1.47E−02 1.60E−02 1.67E−02 2.07E−02

Exposure F
actors Handbook
Chapter 6—
Inhalation Rates
Exposure F
actors Handbook
Page Septem
ber 2011 6-41
Table 6-17. Descriptive Statistics for Average Ventilation Rate,a Unadjusted for Body Weight, While Performing Activities Within the Specified Activity Category, for Males by Age Category (continued)
Age Group (years) N
Average Ventilation Rate (m3/minute)
Mean
Percentiles
Maximum 5th 10th 25th 50th 75th 90th 95th
Moderate Intensity Activities (3.0< METS ≤6.0)
Birth to <1
1
2
3 to <6
6 to <11
11 to <16
16 to <21
21 to <31
31 to <41
41 to <51
51 to <61
61 to <71
71 to <81
≥81
419 1.45E−02 7.41E−03 8.81E−03 1.15E−02 1.44E−02 1.70E−02 2.01E−02 2.25E−02 3.05E−02
308 2.14E−02 1.45E−02 1.59E−02 1.80E−02 2.06E−02 2.41E−02 2.69E−02 2.89E−02 3.99E−02
261 2.15E−02 1.54E−02 1.67E−02 1.84E−02 2.08E−02 2.41E−02 2.69E−02 2.97E−02 5.09E−02
540 2.10E−02 1.63E−02 1.72E−02 1.87E−02 2.06E−02 2.29E−02 2.56E−02 2.71E−02 3.49E−02
940 2.23E−02 1.64E−02 1.72E−02 1.93E−02 2.16E−02 2.50E−02 2.76E−02 2.95E−02 4.34E−02
1,337 2.64E−02 1.93E−02 2.05E−02 2.26E−02 2.54E−02 2.92E−02 3.38E−02 3.69E−02 5.50E−02
1,241 2.90E−02 2.03E−02 2.17E−02 2.45E−02 2.80E−02 3.17E−02 3.82E−02 4.21E−02 6.74E−02
701 2.92E−02 1.97E−02 2.10E−02 2.42E−02 2.79E−02 3.30E−02 3.88E−02 4.31E−02 7.17E−02
728 3.03E−02 2.14E−02 2.27E−02 2.51E−02 2.91E−02 3.41E−02 3.96E−02 4.35E−02 5.77E−02
753 3.16E−02 2.26E−02 2.44E−02 2.72E−02 3.04E−02 3.51E−02 4.03E−02 4.50E−02 6.34E−02
627 3.27E−02 2.24E−02 2.40E−02 2.80E−02 3.14E−02 3.70E−02 4.17E−02 4.58E−02 7.05E−02
678 2.98E−02 2.25E−02 2.40E−02 2.61E−02 2.92E−02 3.23E−02 3.69E−02 4.00E−02 5.23E−02
496 2.93E−02 2.28E−02 2.39E−02 2.61E−02 2.88E−02 3.20E−02 3.57E−02 3.73E−02 4.49E−02
255 2.85E−02 2.25E−02 2.34E−02 2.55E−02 2.82E−02 3.10E−02 3.34E−02 3.55E−02 4.11E−02
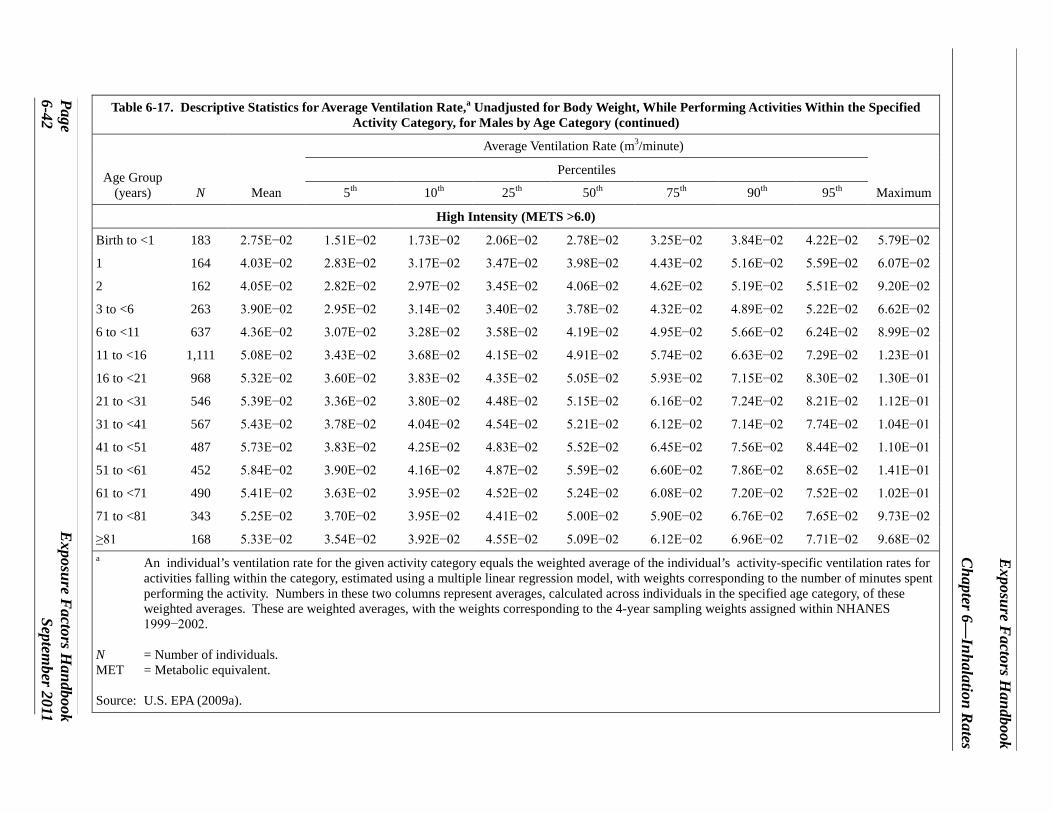
Exposure F
actors Handbook
Chapter 6—
Inhalation Rates
Page E
xposure Factors H
andbook 6-42
September 2011
Table 6-17. Descriptive Statistics for Average Ventilation Rate,a Unadjusted for Body Weight, While Performing Activities Within the Specified Activity Category, for Males by Age Category (continued)
Age Group (years) N
Average Ventilation Rate (m3/minute)
Mean
Percentiles
Maximum 5th 10th 25th 50th 75th 90th 95th
High Intensity (METS >6.0)
Birth to <1 183 2.75E−02 1.51E−02 1.73E−02 2.06E−02 2.78E−02 3.25E−02 3.84E−02 4.22E−02 5.79E−02
1 164 4.03E−02 2.83E−02 3.17E−02 3.47E−02 3.98E−02 4.43E−02 5.16E−02 5.59E−02 6.07E−02
2 162 4.05E−02 2.82E−02 2.97E−02 3.45E−02 4.06E−02 4.62E−02 5.19E−02 5.51E−02 9.20E−02
3 to <6 263 3.90E−02 2.95E−02 3.14E−02 3.40E−02 3.78E−02 4.32E−02 4.89E−02 5.22E−02 6.62E−02
6 to <11 637 4.36E−02 3.07E−02 3.28E−02 3.58E−02 4.19E−02 4.95E−02 5.66E−02 6.24E−02 8.99E−02
11 to <16 1,111 5.08E−02 3.43E−02 3.68E−02 4.15E−02 4.91E−02 5.74E−02 6.63E−02 7.29E−02 1.23E−01
16 to <21 968 5.32E−02 3.60E−02 3.83E−02 4.35E−02 5.05E−02 5.93E−02 7.15E−02 8.30E−02 1.30E−01
21 to <31 546 5.39E−02 3.36E−02 3.80E−02 4.48E−02 5.15E−02 6.16E−02 7.24E−02 8.21E−02 1.12E−01
31 to <41 567 5.43E−02 3.78E−02 4.04E−02 4.54E−02 5.21E−02 6.12E−02 7.14E−02 7.74E−02 1.04E−01
41 to <51 487 5.73E−02 3.83E−02 4.25E−02 4.83E−02 5.52E−02 6.45E−02 7.56E−02 8.44E−02 1.10E−01
51 to <61 452 5.84E−02 3.90E−02 4.16E−02 4.87E−02 5.59E−02 6.60E−02 7.86E−02 8.65E−02 1.41E−01
61 to <71 490 5.41E−02 3.63E−02 3.95E−02 4.52E−02 5.24E−02 6.08E−02 7.20E−02 7.52E−02 1.02E−01
71 to <81 343 5.25E−02 3.70E−02 3.95E−02 4.41E−02 5.00E−02 5.90E−02 6.76E−02 7.65E−02 9.73E−02
≥81 168 5.33E−02 3.54E−02 3.92E−02 4.55E−02 5.09E−02 6.12E−02 6.96E−02 7.71E−02 9.68E−02 a An individual’s ventilation rate for the given activity category equals the weighted average of the individual’s activity-specific ventilation rates for
activities falling within the category, estimated using a multiple linear regression model, with weights corresponding to the number of minutes spent performing the activity. Numbers in these two columns represent averages, calculated across individuals in the specified age category, of these weighted averages. These are weighted averages, with the weights corresponding to the 4-year sampling weights assigned within NHANES 1999−2002.
N = Number of individuals. MET = Metabolic equivalent.
Source: U.S. EPA (2009a).

Exposure F
actors Handbook
Chapter 6—
Inhalation Rates
Exposure F
actors Handbook
Page Septem
ber 2011 6-43
Table 6-18. Descriptive Statistics for Average Ventilation Rate, a Adjusted for Body Weight, While Performing Activities Within the Specified Activity Category, for Males by Age Category
Age Group (years) N
Average Ventilation Rate (m3/minute-kg)
Mean
Percentiles
Maximum 5th 10th 25th 50th 75th 90th 95th
Sleep or nap (Activity ID = 14500)
Birth to <1 419 3.85E−04 2.81E−04 3.01E−04 3.37E−04 3.80E−04 4.27E−04 4.65E−04 5.03E−04 6.66E−04
1 308 3.95E−04 2.95E−04 3.13E−04 3.45E−04 3.84E−04 4.41E−04 4.91E−04 5.24E−04 6.26E−04
2 261 3.30E−04 2.48E−04 2.60E−04 2.89E−04 3.26E−04 3.62E−04 4.05E−04 4.42E−04 5.38E−04
3 to <6 540 2.43E−04 1.60E−04 1.74E−04 1.98E−04 2.37E−04 2.79E−04 3.14E−04 3.50E−04 4.84E−04
6 to <11 940 1.51E−04 1.02E−04 1.09E−04 1.25E−04 1.48E−04 1.74E−04 2.00E−04 2.15E−04 3.02E−04
11 to <16 1,337 9.80E−05 6.70E−05 7.20E−05 8.10E−05 9.40E−05 1.10E−04 1.29E−04 1.41E−04 2.08E−04
16 to <21 1,241 7.10E−05 4.70E−05 5.20E−05 6.10E−05 6.90E−05 8.00E−05 9.00E−05 9.80E−05 1.47E−04
21 to <31 701 5.80E−05 3.80E−05 4.20E−05 4.80E−05 5.60E−05 6.60E−05 7.60E−05 8.30E−05 1.32E−04
31 to <41 728 6.10E−05 3.80E−05 4.30E−05 5.00E−05 6.00E−05 7.00E−05 8.00E−05 8.60E−05 1.27E−04
41 to <51 753 6.50E−05 4.40E−05 4.70E−05 5.40E−05 6.40E−05 7.40E−05 8.60E−05 9.20E−05 1.37E−04
51 to <61 627 6.60E−05 4.50E−05 4.90E−05 5.50E−05 6.40E−05 7.60E−05 8.60E−05 9.30E−05 1.41E−04
61 to <71 678 6.90E−05 5.10E−05 5.40E−05 6.00E−05 6.80E−05 7.60E−05 8.60E−05 9.30E−05 1.17E−04
71 to <81 496 7.50E−05 5.50E−05 5.80E−05 6.40E−05 7.30E−05 8.30E−05 9.30E−05 9.90E−05 1.25E−04
≥81 255 8.00E−05 6.10E−05 6.40E−05 7.10E−05 7.80E−05 8.80E−05 9.70E−05 1.11E−04 1.22E−04
Sedentary and Passive Activities (METS ≤1.5—Includes Sleep or Nap)
Birth to <1 419 3.97E−04 3.03E−04 3.17E−04 3.51E−04 3.91E−04 4.37E−04 4.70E−04 4.98E−04 6.57E−04
1 308 4.06E−04 3.21E−04 3.31E−04 3.63E−04 3.97E−04 4.48E−04 4.88E−04 5.25E−04 6.19E−04
2 261 3.43E−04 2.74E−04 2.86E−04 3.09E−04 3.40E−04 3.69E−04 4.05E−04 4.46E−04 5.10E−04
3 to <6 540 2.55E−04 1.78E−04 1.93E−04 2.15E−04 2.50E−04 2.88E−04 3.27E−04 3.46E−04 4.54E−04
6 to <11 940 1.60E−04 1.13E−04 1.18E−04 1.35E−04 1.57E−04 1.80E−04 2.09E−04 2.18E−04 2.89E−04
11 to <16 1,337 1.05E−04 7.70E−05 8.00E−05 8.80E−05 1.01E−04 1.18E−04 1.35E−04 1.42E−04 1.95E−04

Exposure F
actors Handbook
Chapter 6—
Inhalation Rates
Page E
xposure Factors H
andbook 6-44
September 2011
Table 6-18. Descriptive Statistics for Average Ventilation Rate,a Adjusted for Body Weight, While Performing Activities Within the Specified Activity Category, for Males by Age Category (continued)
Age Group (years) N
Average Ventilation Rate (m3/minute-kg)
Mean
Percentiles
Maximum 5th 10th 25th 50th 75th 90th 95th
16 to <21
21 to <31
31 to <41
41 to <51
51 to <61
61 to <71
71 to <81
≥81
1,241 7.70E−05 5.50E−05 6.00E−05 6.80E−05 7.60E−05 8.50E−05 9.50E−05 1.02E−04 1.32E−04
701 6.20E−05 4.70E−05 4.90E−05 5.50E−05 6.10E−05 6.90E−05 7.70E−05 8.20E−05 1.18E−04
728 6.60E−05 4.60E−05 5.00E−05 5.70E−05 6.50E−05 7.40E−05 8.20E−05 8.60E−05 1.19E−04
753 7.10E−05 5.40E−05 5.70E−05 6.20E−05 7.00E−05 7.80E−05 8.60E−05 9.10E−05 1.29E−04
627 7.20E−05 5.50E−05 5.80E−05 6.30E−05 7.10E−05 7.90E−05 8.80E−05 9.20E−05 1.35E−04
678 7.60E−05 6.10E−05 6.40E−05 6.90E−05 7.50E−05 8.10E−05 8.90E−05 9.40E−05 1.11E−04
496 8.20E−05 6.70E−05 7.00E−05 7.50E−05 8.10E−05 8.80E−05 9.40E−05 9.80E−05 1.15E−04
255 8.60E−05 7.10E−05 7.50E−05 8.00E−05 8.60E−05 9.20E−05 9.90E−05 1.06E−04 1.15E−04
Light Intensity Activities (1.5< METS ≤3.0)
Birth to <1
1
2
3 to <6
6 to <11
11 to <16
16 to <21
21 to <31
31 to <41
41 to <51
51 to <61
61 to <71
71 to <81
≥81
419 9.88E−04 7.86E−04 8.30E−04 8.97E−04 9.72E−04 1.07E−03 1.17E−03 1.20E−03 1.44E−03
308 1.02E−03 8.36E−04 8.59E−04 9.18E−04 1.01E−03 1.10E−03 1.22E−03 1.30E−03 1.49E−03
261 8.37E−04 6.83E−04 7.16E−04 7.61E−04 8.26E−04 8.87E−04 9.95E−04 1.03E−03 1.18E−03
540 6.33E−04 4.41E−04 4.80E−04 5.44E−04 6.26E−04 7.11E−04 7.94E−04 8.71E−04 1.08E−03
940 3.84E−04 2.67E−04 2.86E−04 3.24E−04 3.77E−04 4.37E−04 4.93E−04 5.29E−04 7.09E−04
1,337 2.46E−04 1.76E−04 1.87E−04 2.09E−04 2.38E−04 2.82E−04 3.11E−04 3.32E−04 4.42E−04
1,241 1.79E−04 1.37E−04 1.44E−04 1.56E−04 1.78E−04 1.99E−04 2.18E−04 2.30E−04 3.32E−04
701 1.58E−04 1.24E−04 1.30E−04 1.42E−04 1.54E−04 1.71E−04 1.90E−04 2.07E−04 2.90E−04
728 1.61E−04 1.18E−04 1.28E−04 1.40E−04 1.57E−04 1.77E−04 1.98E−04 2.09E−04 2.81E−04
753 1.66E−04 1.26E−04 1.33E−04 1.47E−04 1.64E−04 1.81E−04 2.00E−04 2.14E−04 3.32E−04
627 1.67E−04 1.27E−04 1.35E−04 1.48E−04 1.65E−04 1.83E−04 2.01E−04 2.16E−04 2.87E−04
678 1.64E−04 1.37E−04 1.41E−04 1.50E−04 1.63E−04 1.75E−04 1.87E−04 1.95E−04 2.69E−04
496 1.71E−04 1.43E−04 1.48E−04 1.58E−04 1.70E−04 1.82E−04 1.95E−04 2.03E−04 2.63E−04
255 1.85E−04 1.52E−04 1.60E−04 1.68E−04 1.83E−04 1.98E−04 2.12E−04 2.24E−04 2.47E−04

Exposure F
actors Handbook
Chapter 6—
Inhalation Rates
Exposure F
actors Handbook
Page Septem
ber 2011 6-45
Table 6-18. Descriptive Statistics for Average Ventilation Rate,a Adjusted for Body Weight, While Performing Activities Within the Specified Activity Category, for Males by Age Category (continued)
Age Group (years) N
Average Ventilation Rate (m3/minute-kg)
Mean
Percentiles
Maximum 5th 10th 25th 50th 75th 90th 95th
Moderate Intensity Activities (3.0< METS ≤6.0)
Birth to <1
1
2
3 to <6
6 to <11
11 to <16
16 to <21
21 to <31
31 to <41
41 to <51
51 to <61
61 to <71
71 to <81
≥81
419 1.80E−03 1.40E−03 1.49E−03 1.62E−03 1.78E−03 1.94E−03 2.18E−03 2.28E−03 3.01E−03
308 1.88E−03 1.41E−03 1.50E−03 1.65E−03 1.82E−03 2.02E−03 2.34E−03 2.53E−03 3.23E−03
261 1.55E−03 1.21E−03 1.28E−03 1.40E−03 1.54E−03 1.66E−03 1.84E−03 2.02E−03 2.29E−03
540 1.17E−03 8.05E−04 8.83E−04 9.99E−04 1.12E−03 1.31E−03 1.56E−03 1.68E−03 2.10E−03
940 7.36E−04 5.03E−04 5.45E−04 6.18E−04 7.14E−04 8.34E−04 9.58E−04 1.04E−03 1.43E−03
1,337 4.91E−04 3.59E−04 3.75E−04 4.18E−04 4.73E−04 5.52E−04 6.35E−04 6.81E−04 1.06E−03
1,241 3.87E−04 2.81E−04 2.96E−04 3.34E−04 3.80E−04 4.31E−04 4.86E−04 5.18E−04 7.11E−04
701 3.57E−04 2.43E−04 2.64E−04 2.96E−04 3.45E−04 4.04E−04 4.68E−04 5.09E−04 8.24E−04
728 3.57E−04 2.42E−04 2.65E−04 3.00E−04 3.44E−04 4.00E−04 4.71E−04 5.21E−04 7.62E−04
753 3.66E−04 2.55E−04 2.72E−04 3.10E−04 3.53E−04 4.08E−04 4.69E−04 5.18E−04 7.16E−04
627 3.76E−04 2.59E−04 2.78E−04 3.13E−04 3.66E−04 4.31E−04 4.82E−04 5.49E−04 7.64E−04
678 3.44E−04 2.72E−04 2.84E−04 3.13E−04 3.42E−04 3.71E−04 3.99E−04 4.24E−04 5.73E−04
496 3.60E−04 2.91E−04 3.06E−04 3.28E−04 3.59E−04 3.88E−04 4.18E−04 4.36E−04 5.49E−04
255 3.83E−04 3.12E−04 3.23E−04 3.47E−04 3.77E−04 4.16E−04 4.47E−04 4.70E−04 5.29E−04

Exposure F
actors Handbook
Chapter 6—
Inhalation Rates
Page E
xposure Factors H
andbook 6-46
September 2011
Table 6-18. Descriptive Statistics for Average Ventilation Rate,a Adjusted for Body Weight, While Performing Activities Within the Specified Activity Category, for Males by Age Category (continued)
Age Group (years) N
Average Ventilation Rate (m3/minute-kg)
Mean
Percentiles
Maximum 5th 10th 25th 50th 75th 90th 95th
High Intensity (METS >6.0)
Birth to <1 183 3.48E−03 2.70E−03 2.93E−03 3.10E−03 3.46E−03 3.81E−03 4.14E−03 4.32E−03 5.08E−03
1 164 3.52E−03 2.52E−03 2.89E−03 3.22E−03 3.57E−03 3.91E−03 4.11E−03 4.34E−03 4.86E−03
2 162 2.89E−03 2.17E−03 2.34E−03 2.58E−03 2.87E−03 3.20E−03 3.43E−03 3.54E−03 4.30E−03
3 to <6 263 2.17E−03 1.55E−03 1.66E−03 1.81E−03 2.11E−03 2.50E−03 2.73E−03 2.98E−03 3.62E−03
6 to <11 637 1.41E−03 9.36E−04 1.03E−03 1.19E−03 1.38E−03 1.59E−03 1.83E−03 1.93E−03 2.68E−03
11 to <16 1,111 9.50E−04 6.35E−04 6.96E−04 7.90E−04 9.09E−04 1.09E−03 1.27E−03 1.36E−03 1.98E−03
16 to <21 968 7.11E−04 4.75E−04 5.27E−04 5.99E−04 6.91E−04 8.02E−04 9.17E−04 9.97E−04 1.94E−03
21 to <31 546 6.60E−04 4.49E−04 4.74E−04 5.43E−04 6.44E−04 7.49E−04 8.55E−04 9.73E−04 1.27E−03
31 to <41 567 6.44E−04 4.42E−04 4.70E−04 5.33E−04 6.25E−04 7.31E−04 8.53E−04 9.30E−04 1.23E−03
41 to <51 487 6.55E−04 4.38E−04 4.85E−04 5.48E−04 6.25E−04 7.41E−04 8.56E−04 9.44E−04 1.77E−03
51 to <61 452 6.75E−04 4.46E−04 4.81E−04 5.47E−04 6.43E−04 7.67E−04 9.13E−04 1.02E−03 1.32E−03
61 to <71 490 6.24E−04 4.41E−04 4.70E−04 5.31E−04 6.12E−04 7.03E−04 7.88E−04 8.55E−04 1.08E−03
71 to <81 343 6.46E−04 4.66E−04 5.02E−04 5.53E−04 6.26E−04 7.16E−04 8.49E−04 9.10E−04 1.04E−03
≥81 168 7.16E−04 5.05E−04 5.44E−04 6.02E−04 7.00E−04 8.05E−04 9.42E−04 9.91E−04 1.35E−03 a An individual’s ventilation rate for the given activity category equals the weighted average of the individual’s activity-specific ventilation rates for
activities falling within the category, estimated using a multiple linear regression model, with weights corresponding to the number of minutes spent performing the activity. Numbers in these two columns represent averages, calculated across individuals in the specified age category, of these weighted averages. These are weighted averages, with the weights corresponding to the 4-year sampling weights assigned within NHANES 1999−2002.
N = Number of individuals. MET = Metabolic equivalent.
Source: U.S. EPA (2009a).

Exposure F
actors Handbook
Chapter 6—
Inhalation Rates
Exposure F
actors Handbook
Page Septem
ber 2011 6-47
Table 6-19. Descriptive Statistics for Average Ventilation Rate,a Unadjusted for Body Weight, While Performing Activities Within the Specified Activity Category, for Females by Age Category
Age Group (years) N
Average Ventilation Rate (m3/minute)
Mean
Percentiles
Maximum 5th 10th 25th 50th 75th 90th 95th
Sleep or nap (Activity ID = 14500)
Birth to <1 415
1 245
2 255
3 to <6 543
6 to <11 894
11 to <16 1,451
16 to <21 1,182
21 to <31 1,023
31 to <41 869
41 to <51 763
51 to <61 622
61 to <71 700
71 to <81 470
≥81 306
2.92E−03 1.54E−03 1.72E−03 2.27E−03 2.88E−03 3.50E−03 4.04E−03 4.40E−03 8.69E−03
4.59E−03 3.02E−03 3.28E−03 3.76E−03 4.56E−03 5.32E−03 5.96E−03 6.37E−03 9.59E−03
4.56E−03 3.00E−03 3.30E−03 3.97E−03 4.52E−03 5.21E−03 5.76E−03 6.15E−03 9.48E−03
4.18E−03 2.90E−03 3.20E−03 3.62E−03 4.10E−03 4.71E−03 5.22E−03 5.73E−03 7.38E−03
4.36E−03 2.97E−03 3.17E−03 3.69E−03 4.24E−03 4.93E−03 5.67E−03 6.08E−03 8.42E−03
4.81E−03 3.34E−03 3.57E−03 3.99E−03 4.66E−03 5.39E−03 6.39E−03 6.99E−03 9.39E−03
4.40E−03 2.78E−03 2.96E−03 3.58E−03 4.26E−03 5.05E−03 5.89E−03 6.63E−03 1.23E−02
3.89E−03 2.54E−03 2.74E−03 3.13E−03 3.68E−03 4.44E−03 5.36E−03 6.01E−03 9.58E−03
4.00E−03 2.66E−03 2.86E−03 3.31E−03 3.89E−03 4.54E−03 5.28E−03 5.77E−03 8.10E−03
4.40E−03 3.00E−03 3.23E−03 3.69E−03 4.25E−03 4.95E−03 5.66E−03 6.25E−03 8.97E−03
4.56E−03 3.12E−03 3.30E−03 3.72E−03 4.41E−03 5.19E−03 6.07E−03 6.63E−03 8.96E−03
4.47E−03 3.22E−03 3.35E−03 3.78E−03 4.38E−03 4.99E−03 5.72E−03 6.37E−03 9.57E−03
4.52E−03 3.31E−03 3.47E−03 3.89E−03 4.40E−03 5.11E−03 5.67E−03 6.06E−03 7.35E−03
4.49E−03 3.17E−03 3.49E−03 3.82E−03 4.39E−03 4.91E−03 5.61E−03 6.16E−03 8.27E−03
Sedentary and Passive Activities (METS ≤1.5—Includes Sleep or Nap)
Birth to <1 415
1 245
2 255
3 to <6 543
6 to <11 894
11 to <16 1,451
3.00E−03 1.60E−03 1.80E−03 2.32E−03 2.97E−03 3.58E−03 4.11E−03 4.44E−03 9.59E−03
4.71E−03 3.26E−03 3.44E−03 3.98E−03 4.73E−03 5.30E−03 5.95E−03 6.63E−03 9.50E−03
4.73E−03 3.34E−03 3.53E−03 4.19E−03 4.67E−03 5.25E−03 5.75E−03 6.22E−03 9.42E−03
4.40E−03 3.31E−03 3.49E−03 3.95E−03 4.34E−03 4.84E−03 5.29E−03 5.73E−03 7.08E−03
4.64E−03 3.41E−03 3.67E−03 4.04E−03 4.51E−03 5.06E−03 5.88E−03 6.28E−03 8.31E−03
5.21E−03 3.90E−03 4.16E−03 4.53E−03 5.09E−03 5.68E−03 6.53E−03 7.06E−03 9.07E−03
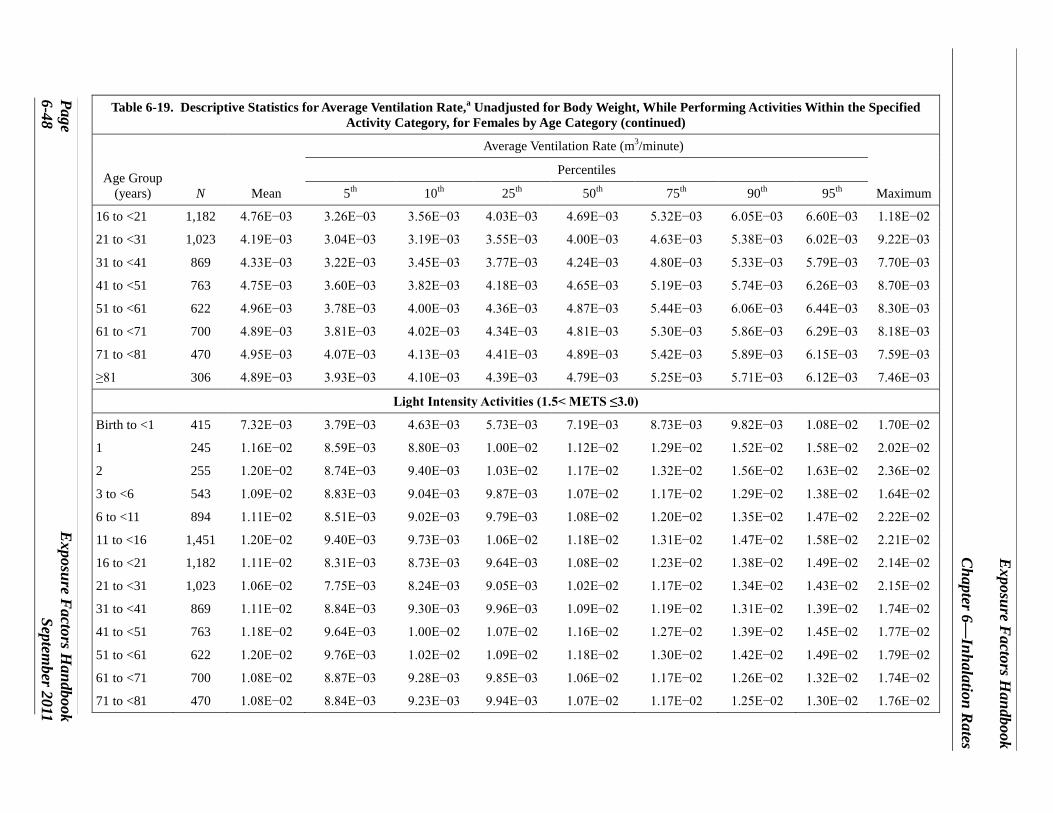
Exposure F
actors Handbook
Chapter 6—
Inhalation Rates
Page E
xposure Factors H
andbook 6-48
September 2011
Table 6-19. Descriptive Statistics for Average Ventilation Rate,a Unadjusted for Body Weight, While Performing Activities Within the Specified Activity Category, for Females by Age Category (continued)
Age Group (years) N
Average Ventilation Rate (m3/minute)
Mean
Percentiles
Maximum 5th 10th 25th 50th 75th 90th 95th
16 to <21
21 to <31
31 to <41
41 to <51
51 to <61
61 to <71
71 to <81
≥81
1,182 4.76E−03 3.26E−03 3.56E−03 4.03E−03 4.69E−03 5.32E−03 6.05E−03 6.60E−03 1.18E−02
1,023 4.19E−03 3.04E−03 3.19E−03 3.55E−03 4.00E−03 4.63E−03 5.38E−03 6.02E−03 9.22E−03
869 4.33E−03 3.22E−03 3.45E−03 3.77E−03 4.24E−03 4.80E−03 5.33E−03 5.79E−03 7.70E−03
763 4.75E−03 3.60E−03 3.82E−03 4.18E−03 4.65E−03 5.19E−03 5.74E−03 6.26E−03 8.70E−03
622 4.96E−03 3.78E−03 4.00E−03 4.36E−03 4.87E−03 5.44E−03 6.06E−03 6.44E−03 8.30E−03
700 4.89E−03 3.81E−03 4.02E−03 4.34E−03 4.81E−03 5.30E−03 5.86E−03 6.29E−03 8.18E−03
470 4.95E−03 4.07E−03 4.13E−03 4.41E−03 4.89E−03 5.42E−03 5.89E−03 6.15E−03 7.59E−03
306 4.89E−03 3.93E−03 4.10E−03 4.39E−03 4.79E−03 5.25E−03 5.71E−03 6.12E−03 7.46E−03
Light Intensity Activities (1.5< METS ≤3.0)
Birth to <1
1
2
3 to <6
6 to <11
11 to <16
16 to <21
21 to <31
31 to <41
41 to <51
51 to <61
61 to <71
71 to <81
415 7.32E−03 3.79E−03 4.63E−03 5.73E−03 7.19E−03 8.73E−03 9.82E−03 1.08E−02 1.70E−02
245 1.16E−02 8.59E−03 8.80E−03 1.00E−02 1.12E−02 1.29E−02 1.52E−02 1.58E−02 2.02E−02
255 1.20E−02 8.74E−03 9.40E−03 1.03E−02 1.17E−02 1.32E−02 1.56E−02 1.63E−02 2.36E−02
543 1.09E−02 8.83E−03 9.04E−03 9.87E−03 1.07E−02 1.17E−02 1.29E−02 1.38E−02 1.64E−02
894 1.11E−02 8.51E−03 9.02E−03 9.79E−03 1.08E−02 1.20E−02 1.35E−02 1.47E−02 2.22E−02
1,451 1.20E−02 9.40E−03 9.73E−03 1.06E−02 1.18E−02 1.31E−02 1.47E−02 1.58E−02 2.21E−02
1,182 1.11E−02 8.31E−03 8.73E−03 9.64E−03 1.08E−02 1.23E−02 1.38E−02 1.49E−02 2.14E−02
1,023 1.06E−02 7.75E−03 8.24E−03 9.05E−03 1.02E−02 1.17E−02 1.34E−02 1.43E−02 2.15E−02
869 1.11E−02 8.84E−03 9.30E−03 9.96E−03 1.09E−02 1.19E−02 1.31E−02 1.39E−02 1.74E−02
763 1.18E−02 9.64E−03 1.00E−02 1.07E−02 1.16E−02 1.27E−02 1.39E−02 1.45E−02 1.77E−02
622 1.20E−02 9.76E−03 1.02E−02 1.09E−02 1.18E−02 1.30E−02 1.42E−02 1.49E−02 1.79E−02
700 1.08E−02 8.87E−03 9.28E−03 9.85E−03 1.06E−02 1.17E−02 1.26E−02 1.32E−02 1.74E−02
470 1.08E−02 8.84E−03 9.23E−03 9.94E−03 1.07E−02 1.17E−02 1.25E−02 1.30E−02 1.76E−02

Exposure F
actors Handbook
Chapter 6—
Inhalation Rates
Exposure F
actors Handbook
Page Septem
ber 2011 6-49
Table 6-19. Descriptive Statistics for Average Ventilation Rate,a Unadjusted for Body Weight, While Performing Activities Within the Specified Activity Category, for Females by Age Category (continued)
Age Group (years) N
Average Ventilation Rate (m3/minute)
Mean
Percentiles
Maximum 5th 10th 25th 50th 75th 90th 95th
≥81 306 1.04E−02 8.69E−03 8.84E−03 9.36E−03 1.03E−02 1.14E−02 1.21E−02 1.26E−02 1.61E−02
Moderate Intensity Activities (3.0< METS ≤6.0)
Birth to <1
1
2
3 to <6
6 to <11
11 to <16
16 to <21
21 to <31
31 to <41
41 to <51
51 to <61
61 to <71
71 to <81
≥81
415 1.40E−02 7.91E−03 9.00E−03 1.12E−02 1.35E−02 1.63E−02 1.94E−02 2.23E−02 4.09E−02
245 2.10E−02 1.56E−02 1.63E−02 1.79E−02 2.01E−02 2.35E−02 2.71E−02 2.93E−02 3.45E−02
255 2.13E−02 1.42E−02 1.56E−02 1.82E−02 2.15E−02 2.39E−02 2.76E−02 2.88E−02 3.76E−02
543 2.00E−02 1.53E−02 1.63E−02 1.78E−02 1.98E−02 2.16E−02 2.38E−02 2.59E−02 3.29E−02
894 2.10E−02 1.60E−02 1.68E−02 1.85E−02 2.04E−02 2.30E−02 2.61E−02 2.81E−02 4.31E−02
1,451 2.36E−02 1.82E−02 1.95E−02 2.08E−02 2.30E−02 2.54E−02 2.84E−02 3.14E−02 4.24E−02
1,182 2.32E−02 1.66E−02 1.76E−02 1.96E−02 2.24E−02 2.61E−02 3.03E−02 3.20E−02 5.25E−02
1,023 2.29E−02 1.56E−02 1.67E−02 1.90E−02 2.19E−02 2.60E−02 3.00E−02 3.28E−02 5.42E−02
869 2.27E−02 1.69E−02 1.76E−02 1.95E−02 2.20E−02 2.48E−02 2.89E−02 3.11E−02 4.73E−02
763 2.45E−02 1.76E−02 1.89E−02 2.08E−02 2.39E−02 2.74E−02 3.08E−02 3.36E−02 5.07E−02
622 2.52E−02 1.88E−02 1.98E−02 2.18E−02 2.43E−02 2.81E−02 3.19E−02 3.50E−02 4.62E−02
700 2.14E−02 1.69E−02 1.77E−02 1.92E−02 2.09E−02 2.32E−02 2.57E−02 2.73E−02 3.55E−02
470 2.11E−02 1.69E−02 1.76E−02 1.89E−02 2.07E−02 2.29E−02 2.49E−02 2.64E−02 3.44E−02
306 2.09E−02 1.65E−02 1.75E−02 1.91E−02 2.06E−02 2.25E−02 2.46E−02 2.60E−02 2.93E−02

Exposure F
actors Handbook
Chapter 6—
Inhalation Rates
Page E
xposure Factors H
andbook 6-50
September 2011
Table 6-19. Descriptive Statistics for Average Ventilation Rate,a Unadjusted for Body Weight, While Performing Activities Within the Specified Activity Category, for Females by Age Category (continued)
Age Group (years) N
Average Ventilation Rate (m3/minute)
Mean
Percentiles
Maximum 5th 10th 25th 50th 75th 90th 95th
High Intensity (METS >6.0)
Birth to <1 79 2.42E−02 1.24E−02 1.33E−02 1.72E−02 2.25E−02 2.93E−02 3.56E−02 4.07E−02 7.46E−02
1 55 3.65E−02 2.59E−02 2.62E−02 3.04E−02 3.61E−02 4.20E−02 4.73E−02 4.86E−02 7.70E−02
2 130 3.76E−02 2.90E−02 3.05E−02 3.23E−02 3.64E−02 4.08E−02 4.81E−02 5.14E−02 7.30E−02
3 to <6 347 3.45E−02 2.70E−02 2.82E−02 3.00E−02 3.33E−02 3.76E−02 4.32E−02 4.47E−02 5.66E−02
6 to <11 707 3.94E−02 2.86E−02 3.01E−02 3.37E−02 3.80E−02 4.41E−02 5.05E−02 5.46E−02 8.29E−02
11 to <16 1,170 4.66E−02 3.11E−02 3.38E−02 3.88E−02 4.53E−02 5.29E−02 6.08E−02 6.63E−02 1.02E−01
16 to <21 887 4.41E−02 2.87E−02 3.06E−02 3.65E−02 4.27E−02 5.02E−02 5.82E−02 6.34E−02 1.09E−01
21 to <31 796 4.57E−02 2.88E−02 3.12E−02 3.67E−02 4.31E−02 5.22E−02 6.19E−02 6.89E−02 1.08E−01
31 to <41 687 4.44E−02 3.03E−02 3.29E−02 3.70E−02 4.22E−02 5.05E−02 5.95E−02 6.53E−02 8.95E−02
41 to <51 515 4.70E−02 3.10E−02 3.40E−02 3.84E−02 4.56E−02 5.41E−02 6.15E−02 6.74E−02 8.87E−02
51 to <61 424 4.74E−02 3.15E−02 3.48E−02 3.94E−02 4.57E−02 5.41E−02 6.23E−02 6.88E−02 8.44E−02
61 to <71 465 4.00E−02 2.76E−02 3.06E−02 3.46E−02 3.87E−02 4.53E−02 5.08E−02 5.64E−02 7.13E−02
71 to <81 304 4.06E−02 2.85E−02 3.01E−02 3.43E−02 3.96E−02 4.70E−02 5.20E−02 5.41E−02 7.53E−02
≥81 188 4.19E−02 2.85E−02 3.09E−03 3.44E−02 4.14E−02 4.76E−02 5.56E−02 5.83E−02 7.21E−02 a An individual’s ventilation rate for the given activity category equals the weighted average of the individual’s activity-specific ventilation rates for
activities falling within the category, estimated using a multiple linear regression model, with weights corresponding to the number of minutes spent performing the activity. Numbers in these two columns represent averages, calculated across individuals in the specified age category, of these weighted averages. These are weighted averages, with the weights corresponding to the 4-year sampling weights assigned within NHANES 1999−2002.
N = Number of individuals. MET = Metabolic equivalent.
Source: U.S. EPA (2009a).

Exposure F
actors Handbook
Chapter 6—
Inhalation Rates
Exposure F
actors Handbook
Page Septem
ber 2011 6-51
Table 6-20. Descriptive Statistics for Average Ventilation Rate,a Adjusted for Body Weight, While Performing Activities Within the Specified Activity Category, for Females by Age Category
Age Group (years) N
Average Ventilation Rate (m3/minute-kg)
Mean
Percentiles
Maximum 5th 10th 25th 50th 75th 90th 95th
Sleep or nap (Activity ID = 14500)
Birth to <1 415 3.91E−04 2.80E−04 3.01E−04 3.35E−04 3.86E−04 4.34E−04 4.79E−04 5.17E−04 7.39E−04
1 245 4.14E−04 3.15E−04 3.29E−04 3.61E−04 4.05E−04 4.64E−04 5.21E−04 5.36E−04 6.61E−04
2 255 3.42E−04 2.58E−04 2.71E−04 2.93E−04 3.33E−04 3.91E−04 4.25E−04 4.53E−04 4.94E−04
3 to <6 543 2.38E−04 1.45E−04 1.63E−04 1.95E−04 2.33E−04 2.75E−04 3.20E−04 3.53E−04 5.19E−04
6 to <11 894 1.51E−04 8.90E−05 9.70E−05 1.20E−04 1.46E−04 1.76E−04 2.11E−04 2.29E−04 2.97E−04
11 to <16 1,451 9.00E−05 5.90E−05 6.50E−05 7.50E−05 8.70E−05 1.02E−04 1.18E−04 1.30E−04 1.76E−04
16 to <21 1,182 6.90E−05 4.40E−05 4.70E−05 5.70E−05 6.70E−05 8.00E−05 9.30E−05 1.02E−04 1.52E−04
21 to <31 1,023 5.50E−05 3.50E−05 3.80E−05 4.50E−05 5.40E−05 6.50E−05 7.40E−05 8.20E−05 9.80E−05
31 to <41 869 5.60E−05 3.40E−05 3.70E−05 4.50E−05 5.40E−05 6.50E−05 7.60E−05 8.20E−05 1.15E−04
41 to <51 763 6.00E−05 3.90E−05 4.10E−05 4.80E−05 5.70E−05 7.00E−05 8.40E−05 9.00E−05 1.14E−04
51 to <61 622 6.10E−05 3.90E−05 4.20E−05 5.00E−05 5.90E−05 7.10E−05 8.30E−05 8.80E−05 1.35E−04
61 to <71 700 6.10E−05 4.30E−05 4.60E−05 5.20E−05 5.90E−05 6.70E−05 7.60E−05 8.10E−05 1.01E−04
71 to <81 470 6.60E−05 4.70E−05 5.10E−05 5.60E−05 6.40E−05 7.40E−05 8.40E−05 9.00E−05 1.25E−04
≥81 306 7.20E−05 5.10E−05 5.60E−05 6.30E−05 7.00E−05 7.90E−05 9.10E−05 9.60E−05 1.15E−04
Sedentary and Passive Activities (METS ≤1.5—Includes Sleep or Nap)
Birth to <1 415 4.02E−04 2.97E−04 3.16E−04 3.52E−04 3.96E−04 4.46E−04 4.82E−04 5.19E−04 7.19E−04
1 245 4.25E−04 3.35E−04 3.48E−04 3.76E−04 4.18E−04 4.69E−04 5.12E−04 5.43E−04 6.42E−04
2 255 3.55E−04 2.85E−04 2.96E−04 3.20E−04 3.48E−04 3.91E−04 4.20E−04 4.42E−04 4.85E−04
3 to <6 543 2.51E−04 1.64E−04 1.79E−04 2.11E−04 2.48E−04 2.84E−04 3.28E−04 3.58E−04 4.89E−04
6 to <11 894 1.60E−04 9.90E−05 1.10E−04 1.31E−04 1.57E−04 1.85E−04 2.12E−04 2.34E−04 2.93E−04
11 to <16 1,451 9.70E−05 7.10E−05 7.50E−05 8.30E−05 9.50E−05 1.09E−04 1.23E−04 1.33E−04 1.74E−04

Exposure F
actors Handbook
Chapter 6—
Inhalation Rates
Page E
xposure Factors H
andbook 6-52
September 2011
Table 6-20. Descriptive Statistics for Average Ventilation Rate,a Adjusted for Body Weight, While Performing Activities Within the Specified Activity Category, for Females by Age Category (continued)
Age Group (years) N
Average Ventilation Rate (m3/minute-kg)
Mean
Percentiles
Maximum 5th 10th 25th 50th 75th 90th 95th
16 to <21
21 to <31
31 to <41
41 to <51
51 to <61
61 to <71
71 to <81
≥81
1,182 7.50E−05 5.30E−05 5.70E−05 6.30E−05 7.40E−05 8.50E−05 9.60E−05 1.04E−04 1.41E−04
1,023 6.00E−05 4.30E−05 4.50E−05 5.10E−05 5.90E−05 6.70E−05 7.50E−05 8.00E−05 9.90E−05
869 6.00E−05 4.00E−05 4.20E−05 5.10E−05 5.90E−05 6.90E−05 7.80E−05 8.30E−05 1.05E−04
763 6.50E−05 4.40E−05 4.80E−05 5.50E−05 6.30E−05 7.30E−05 8.30E−05 9.10E−05 1.14E−04
622 6.70E−05 4.60E−05 5.10E−05 5.70E−05 6.50E−05 7.60E−05 8.30E−05 9.00E−05 1.18E−04
700 6.60E−05 5.20E−05 5.40E−05 5.90E−05 6.60E−05 7.20E−05 7.80E−05 8.40E−05 1.04E−04
470 7.20E−05 5.50E−05 6.00E−05 6.50E−05 7.10E−05 7.80E−05 8.80E−05 9.20E−05 1.48E−04
306 7.80E−05 6.30E−05 6.50E−05 7.00E−05 7.70E−05 8.60E−05 9.30E−05 9.60E−05 1.12E−04
Light Intensity Activities (1.5< METS ≤3.0)
Birth to <1
1
2
3 to <6
6 to <11
11 to <16
16 to <21
21 to <31
31 to <41
41 to <51
51 to <61
61 to <71
71 to <81
≥81
415 9.78E−04 7.91E−04 8.17E−04 8.80E−04 9.62E−04 1.05E−03 1.18E−03 1.23E−03 1.65E−03
245 1.05E−03 8.45E−04 8.68E−04 9.49E−04 1.04E−03 1.14E−03 1.25E−03 1.27E−03 1.64E−03
255 8.97E−04 7.30E−04 7.63E−04 8.19E−04 8.93E−04 9.64E−04 1.04E−03 1.10E−03 1.26E−03
543 6.19E−04 4.48E−04 4.84E−04 5.37E−04 5.99E−04 6.98E−04 7.83E−04 8.28E−04 1.02E−03
894 3.82E−04 2.52E−04 2.70E−04 3.15E−04 3.76E−04 4.42E−04 5.03E−04 5.39E−04 7.10E−04
1,451 2.25E−04 1.63E−04 1.74E−04 1.96E−04 2.17E−04 2.49E−04 2.84E−04 3.05E−04 3.96E−04
1,182 1.74E−04 1.29E−04 1.38E−04 1.54E−04 1.73E−04 1.93E−04 2.13E−04 2.24E−04 2.86E−04
1,023 1.49E−04 1.16E−04 1.23E−04 1.34E−04 1.49E−04 1.63E−04 1.78E−04 1.90E−04 2.27E−04
869 1.54E−04 1.07E−04 1.15E−04 1.33E−04 1.54E−04 1.76E−04 1.92E−04 2.02E−04 2.67E−04
763 1.61E−04 1.14E−04 1.23E−04 1.38E−04 1.58E−04 1.82E−04 2.03E−04 2.16E−04 2.83E−04
622 1.61E−04 1.20E−04 1.27E−04 1.41E−04 1.58E−04 1.80E−04 1.99E−04 2.10E−04 2.65E−04
700 1.47E−04 1.17E−04 1.22E−04 1.32E−04 1.45E−04 1.61E−04 1.73E−04 1.82E−04 2.44E−04
470 1.58E−04 1.24E−04 1.30E−04 1.43E−04 1.56E−04 1.69E−04 1.88E−04 2.02E−04 2.77E−04
306 1.67E−04 1.31E−04 1.38E−04 1.50E−04 1.64E−04 1.82E−04 1.97E−04 2.08E−04 2.34E−04

Exposure F
actors Handbook
Chapter 6—
Inhalation Rates
Exposure F
actors Handbook
Page Septem
ber 2011 6-53
Table 6-20. Descriptive Statistics for Average Ventilation Rate,a Adjusted for Body Weight, While Performing Activities Within the Specified Activity Category, for Females by Age Category (continued)
Age Group (years) N
Average Ventilation Rate (m3/minute-kg)
Mean
Percentiles
Maximum 5th 10th 25th 50th 75th 90th 95th
Moderate Intensity Activities (3.0< METS ≤6.0)
Birth to <1
1
2
3 to <6
6 to <11
11 to <16
16 to <21
21 to <31
31 to <41
41 to <51
51 to <61
61 to <71
71 to <81
≥81
415 1.87E−03 1.47E−03 1.52E−03 1.67E−03 1.85E−03 2.01E−03 2.25E−03 2.40E−03 2.83E−03
245 1.90E−03 1.52E−03 1.62E−03 1.73E−03 1.87E−03 2.02E−03 2.24E−03 2.37E−03 3.24E−03
255 1.60E−03 1.27E−03 1.31E−03 1.44E−03 1.58E−03 1.75E−03 1.92E−03 2.02E−03 2.59E−03
543 1.14E−03 7.92E−04 8.53E−04 9.64E−04 1.11E−03 1.31E−03 1.45E−03 1.56E−03 1.93E−03
894 7.23E−04 4.62E−04 5.12E−04 5.98E−04 7.15E−04 8.38E−04 9.42E−04 1.01E−03 1.37E−03
1,451 4.41E−04 3.17E−04 3.38E−04 3.80E−04 4.31E−04 4.92E−04 5.51E−04 6.11E−04 9.86E−04
1,182 3.65E−04 2.67E−04 2.82E−04 3.10E−04 3.51E−04 4.07E−04 4.63E−04 4.94E−04 6.50E−04
1,023 3.25E−04 2.35E−04 2.45E−04 2.81E−04 3.16E−04 3.60E−04 4.16E−04 4.52E−04 6.57E−04
869 3.16E−04 2.13E−04 2.31E−04 2.68E−04 3.04E−04 3.50E−04 4.10E−04 4.60E−04 7.08E−04
763 3.33E−04 2.21E−04 2.36E−04 2.76E−04 3.25E−04 3.76E−04 4.41E−04 4.88E−04 6.20E−04
622 3.39E−04 2.35E−04 2.54E−04 2.83E−04 3.26E−04 3.83E−04 4.38E−04 4.86E−04 3.69E−04
700 2.92E−04 2.24E−04 2.38E−04 2.59E−04 2.85E−04 3.20E−04 3.51E−04 3.71E−04 5.11E−04
470 3.08E−04 2.40E−04 2.50E−04 2.70E−04 2.99E−04 3.40E−04 3.75E−04 4.07E−04 6.77E−04
306 3.35E−04 2.47E−04 2.66E−04 2.98E−04 3.33E−04 3.72E−04 4.02E−04 4.20E−04 5.20E−04

Exposure F
actors Handbook
Chapter 6—
Inhalation Rates
Page E
xposure Factors H
andbook 6-54
September 2011
Table 6-20. Descriptive Statistics for Average Ventilation Rate,a Adjusted for Body Weight, While Performing Activities Within the Specified Activity Category, for Females by Age Category (continued)
Age Group (years) N
Average Ventilation Rate (m3/minute-kg)
Mean
Percentiles
Maximum 5th 10th 25th 50th 75th 90th 95th
High Intensity (METS >6.0)
Birth to <1 79 3.26E−03 2.53E−03 2.62E−03 2.89E−03 3.23E−03 3.63E−03 3.96E−03 4.08E−03 5.02E−03
1 55 3.38E−03 2.57E−03 2.75E−03 2.97E−03 3.24E−03 3.71E−03 4.16E−03 4.87E−03 4.88E−03
2 130 2.80E−03 2.20E−03 2.31E−03 2.48E−03 2.81E−03 3.13E−03 3.36E−03 3.48E−03 3.88E−03
3 to <6 347 1.98E−03 1.36E−03 1.51E−03 1.69E−03 1.90E−03 2.19E−03 2.50E−03 2.99E−03 3.24E−03
6 to <11 707 1.33E−03 8.85E−04 9.67E−04 1.12E−03 1.33E−03 1.52E−03 1.72E−03 1.81E−03 2.22E−03
11 to <16 1,170 8.79E−04 5.89E−04 6.25E−04 7.12E−04 8.53E−04 1.01E−03 1.18E−03 1.31E−03 2.05E−03
16 to <21 887 6.96E−04 4.52E−04 4.96E−04 5.67E−04 6.86E−04 7.93E−04 9.16E−04 1.00E−03 1.50E−03
21 to <31 796 6.50E−04 4.17E−04 4.62E−04 5.46E−04 6.27E−04 7.30E−04 8.84E−04 9.39E−04 1.30E−03
31 to <41 687 6.13E−04 3.84E−04 4.20E−04 4.96E−04 5.90E−04 7.08E−04 8.35E−04 9.05E−04 1.55E−03
41 to <51 515 6.35E−04 3.79E−04 4.44E−04 5.17E−04 6.41E−04 7.65E−04 8.79E−04 9.50E−04 1.61E−03
51 to <61 424 6.34E−04 3.93E−04 4.31E−04 5.07E−04 6.12E−04 7.55E−04 8.51E−04 9.28E−04 1.37E−03
61 to <71 465 5.44E−04 3.64E−04 4.04E−04 4.49E−04 5.29E−04 6.10E−04 7.18E−04 8.03E−04 1.11E−03
71 to <81 304 5.94E−04 3.95E−04 4.45E−04 4.98E−04 5.80E−04 6.75E−04 7.76E−04 8.29E−04 1.26E−03
≥81 188 6.66E−04 4.54E−04 4.80E−04 5.43E−04 6.26E−04 7.68E−04 9.32E−04 9.72E−04 1.22E−03 a An individual’s ventilation rate for the given activity category equals the weighted average of the individual’s activity-specific ventilation rates for
activities falling within the category, estimated using a multiple linear regression model, with weights corresponding to the number of minutes spent performing the activity. Numbers in these two columns represent averages, calculated across individuals in the specified age category, of these weighted averages. These are weighted averages, with the weights corresponding to the 4-year sampling weights assigned within NHANES 1999−2002.
N = Number of individuals. MET = Metabolic equivalent.
Source: U.S. EPA (2009a).

Exposure Factors Handbook
Chapter 6—Inhalation Rates
Table 6-21. Descriptive Statistics for Duration of Time (hours/day) Spent Performing Activities Within the Specified Activity Category, by Age for Malesa
Age Group (years) N
Duration (hours/day) Spent at Activity
Mean
Percentiles
5th 10th 25th 50th 75th 90th 95th Maximum
Sleep or nap (Activity ID = 14500)
Birth to <1
1
2
3 to <6
6 to <11
11 to <16
16 to <21
21 to <31
31 to <41
41 to <51
51 to <61
61 to <71
71 to <81
≥81
419 13.51 12.63 12.78 13.19 13.53 13.88 14.24 14.46
308 12.61 11.89 12.15 12.34 12.61 12.89 13.13 13.29
261 12.06 11.19 11.45 11.80 12.07 12.39 12.65 12.75
540 11.18 10.57 10.70 10.94 11.18 11.45 11.63 11.82
940 10.18 9.65 9.75 9.93 10.19 10.39 10.59 10.72
1,337 9.38 8.84 8.94 9.15 9.38 9.61 9.83 9.95
1,241 8.69 7.91 8.08 8.36 8.67 9.03 9.34 9.50
701 8.36 7.54 7.70 8.02 8.36 8.67 9.03 9.23
728 8.06 7.36 7.50 7.77 8.06 8.36 8.59 8.76
753 7.89 7.15 7.30 7.58 7.88 8.17 8.48 8.68
627 7.96 7.29 7.51 7.69 7.96 8.23 8.48 8.66
678 8.31 7.65 7.78 8.01 8.30 8.6 8.83 9.01
496 8.51 7.80 8.02 8.27 8.53 8.74 8.99 9.10
255 9.24 8.48 8.64 8.97 9.25 9.54 9.74 9.96
15.03
13.79
13.40
12.39
11.24
10.33
10.44
9.77
9.82
9.38
9.04
9.66
9.89
10.69
Sedentary and Passive Activities (METS ≤1.5—Includes Sleep or Nap)
Birth to <1
1
2
3 to <6
6 to <11
11 to <16
16 to <21
21 to <31
31 to <41
41 to <51
51 to <61
61 to <71
71 to <81
≥81
419 14.95 13.82 14.03 14.49 14.88 15.44 15.90 16.12
308 14.27 13.22 13.33 13.76 14.25 14.74 15.08 15.38
261 14.62 13.52 13.67 14.11 14.54 15.11 15.60 15.77
540 14.12 13.01 13.18 13.54 14.03 14.53 15.26 15.62
940 13.51 12.19 12.45 12.86 13.30 13.85 14.82 15.94
1,337 13.85 12.39 12.65 13.06 13.61 14.30 15.41 16.76
1,241 13.21 11.39 11.72 12.32 13.08 13.97 14.83 15.44
701 12.41 10.69 11.06 11.74 12.39 13.09 13.75 14.16
728 12.31 10.73 10.98 11.61 12.24 12.98 13.63 14.05
753 12.32 10.56 11.00 11.67 12.30 12.95 13.67 13.98
627 13.06 11.47 11.86 12.36 13.03 13.72 14.38 14.76
678 14.49 12.96 13.24 13.76 14.48 15.16 15.72 16.24
496 15.90 14.22 14.67 15.25 15.94 16.65 17.11 17.46
255 16.58 15.13 15.45 15.92 16.64 17.21 17.7 18.06
17.48
16.45
17.28
17.29
19.21
18.79
18.70
15.35
15.58
15.48
15.95
17.50
18.47
18.76
Exposure Factors Handbook Page September 2011 6-55

Exposure Factors Handbook
Chapter 6—Inhalation Rates
Table 6-21. Descriptive Statistics for Duration of Time (hours/day) Spent Performing Activities Within the Specified Activity Category, by Age for Malesa (continued)
Age Group (years) N
Duration (hours/day) Spent at Activity
Mean
Percentiles
Maximum 5th 10th 25th 50th 75th 90th 95th
Light Intensity Activities (1.5< METS ≤3.0)
Birth to <1
1
2
3 to <6
6 to <11
11 to <16
16 to <21
21 to <31
31 to <41
41 to <51
51 to <61
61 to <71
71 to <81
≥81
419 5.30 2.97 3.25 3.71 4.52 7.29 8.08 8.50 9.91
308 5.52 2.68 2.89 3.37 4.31 8.23 9.04 9.73 10.90
261 5.48 3.06 3.26 3.85 4.58 7.58 8.83 9.04 9.92
540 6.60 3.86 4.25 5.16 6.20 8.26 9.31 9.70 10.74
940 7.62 5.07 5.57 6.63 7.63 8.72 9.78 10.12 11.59
1,337 7.50 4.48 5.59 6.75 7.67 8.51 9.19 9.63 10.91
1,241 7.13 4.37 4.97 6.00 7.02 8.29 9.43 10.03 11.50
701 6.09 3.15 3.50 4.20 5.08 8.49 9.96 10.47 12.25
728 5.72 2.80 3.12 3.70 4.64 8.34 9.87 10.49 12.10
753 6.07 2.97 3.41 3.92 4.82 8.56 10.19 10.79 12.68
627 5.64 3.21 3.44 4.03 4.79 7.59 8.94 9.75 12.09
678 5.49 3.50 3.82 4.58 5.29 6.41 7.40 7.95 10.23
496 4.96 3.45 3.75 4.29 4.81 5.59 6.26 6.59 9.90
255 4.86 3.54 3.71 4.17 4.74 5.39 6.33 6.59 7.56
Moderate Intensity Activities (3.0< METS ≤6.0)
Birth to <1
1
2
3 to <6
6 to <11
11 to <16
16 to <21
21 to <31
31 to <41
41 to <51
51 to <61
61 to <71
71 to <81
≥81
419 3.67 0.63 0.97 1.74 4.20 5.20 5.80 6.21 7.52
308 4.04 0.45 0.59 1.14 5.29 6.06 6.61 6.94 7.68
261 3.83 0.59 0.76 1.23 4.74 5.37 5.82 6.15 7.40
540 3.15 0.55 0.75 1.30 3.80 4.52 5.11 5.32 6.30
940 2.66 0.65 0.92 1.65 2.68 3.57 4.36 4.79 5.95
1,337 2.35 0.88 1.09 1.66 2.30 3.02 3.62 3.89 5.90
1,241 3.35 1.13 1.42 2.19 3.45 4.37 5.24 5.59 6.83
701 5.24 1.15 1.58 2.52 6.01 7.15 7.95 8.39 9.94
728 5.69 1.26 1.65 2.84 6.67 7.75 8.45 8.90 9.87
753 5.40 1.21 1.55 2.39 6.46 7.57 8.40 8.85 10.52
627 5.00 1.29 1.63 2.72 5.68 6.75 7.60 8.01 9.94
678 3.73 1.62 1.97 2.81 3.70 4.67 5.45 6.01 7.45
496 2.87 1.56 1.83 2.28 2.86 3.45 3.95 4.31 5.44
255 2.35 1.32 1.45 1.79 2.29 2.85 3.28 3.61 4.37
Page Exposure Factors Handbook 6-56 September 2011

Exposure Factors Handbook
Chapter 6—Inhalation Rates
Table 6-21. Descriptive Statistics for Duration of Time (hours/day) Spent Performing Activities Within the Specified Activity Category, by Age for Malesa (continued)
Age Group (years) N
Duration (hours/day) Spent at Activity
Mean
Percentiles
Maximum 5th 10th 25th 50th 75th 90th 95th
High Intensity (METS >6.0)
Birth to <1 183 0.20 0.00 0.00 0.01 0.14 0.28 0.50 0.59 0.96
1 164 0.31 0.01 0.01 0.03 0.22 0.56 0.78 0.93 1.52
2 162 0.10 0.00 0.01 0.03 0.05 0.14 0.25 0.33 0.48
3 to <6 263 0.27 0.02 0.03 0.04 0.13 0.33 0.75 1.16 1.48
6 to <11 637 0.32 0.01 0.01 0.03 0.13 0.38 1.10 1.50 3.20
11 to <16 1,111 0.38 0.03 0.04 0.10 0.21 0.47 1.03 1.34 2.35
16 to <21 968 0.40 0.03 0.04 0.14 0.27 0.53 0.99 1.29 2.59
21 to <31 546 0.33 0.02 0.05 0.11 0.27 0.45 0.69 0.85 1.95
31 to <41 567 0.38 0.03 0.07 0.14 0.28 0.51 0.83 1.03 1.77
41 to <51 487 0.34 0.03 0.05 0.09 0.23 0.50 0.78 1.00 2.40
51 to <61 452 0.41 0.03 0.05 0.13 0.34 0.59 0.87 1.13 1.95
61 to <71 490 0.37 0.03 0.05 0.13 0.28 0.49 0.80 1.08 2.21
71 to <81 343 0.39 0.01 0.03 0.10 0.29 0.57 0.90 1.11 2.06
≥81 168 0.32 0.02 0.03 0.08 0.25 0.47 0.71 0.88 1.76 a Individual measures are weighted by their 4-year sampling weights as assigned within NHANES
1999−2000 when calculating the statistics in this table. Ventilation rate was estimated using a multiple linear regression model.
N = Number of individuals. MET = Metabolic equivalent.
Source: U.S. EPA (2009a).
Exposure Factors Handbook Page September 2011 6-57

Exposure Factors Handbook
Chapter 6—Inhalation Rates
Table 6-22. Descriptive Statistics for Duration of Time (hours/day) Spent Performing Activities Within the Specified Activity Category, by Age for Femalesa
Age Group (years) N
Duration (hours/day) Spent at Activity
Mean
Percentiles
Maximum 5th 10th 25th 50th 75th 90th 95th
Sleep or nap (Activity ID = 14500)
Birth to <1 415 12.99 12.00 12.16 12.53 12.96 13.44 13.82 14.07 14.82
1 245 12.58 11.59 11.88 12.29 12.63 12.96 13.16 13.31 14.55
2 255 12.09 11.45 11.68 11.86 12.08 12.34 12.57 12.66 13.48
3 to <6 543 11.13 10.45 10.70 10.92 11.12 11.38 11.58 11.75 12.23
6 to <11 894 10.26 9.55 9.73 10.01 10.27 10.54 10.74 10.91 11.43
11 to <16 1,451 9.57 8.82 8.97 9.27 9.55 9.87 10.17 10.31 11.52
16 to <21 1,182 9.08 8.26 8.44 8.74 9.08 9.39 9.79 10.02 11.11
21 to <31 1,023 8.60 7.89 7.99 8.26 8.59 8.90 9.20 9.38 10.35
31 to <41 869 8.31 7.54 7.70 7.98 8.28 8.59 8.92 9.17 10.22
41 to <51 763 8.32 7.58 7.75 7.99 8.31 8.63 8.93 9.13 10.02
51 to <61 622 8.12 7.36 7.53 7.81 8.11 8.43 8.73 8.85 9.29
61 to <71 700 8.40 7.67 7.88 8.15 8.40 8.68 8.93 9.09 9.80
71 to <81 470 8.58 7.85 8.01 8.26 8.55 8.89 9.19 9.46 10.34
≥81 306 9.11 8.35 8.53 8.84 9.10 9.34 9.73 10.04 10.55
Sedentary and Passive Activities (METS ≤1.5—Includes Sleep or Nap)
Birth to <1 415 14.07 12.86 13.05 13.53 14.08 14.54 15.08 15.49 16.14
1 245 14.32 13.02 13.25 13.73 14.31 14.88 15.36 15.80 16.40
2 255 14.86 13.81 13.95 14.44 14.81 15.32 15.78 16.03 16.91
3 to <6 543 14.27 12.88 13.15 13.56 14.23 14.82 15.43 15.85 17.96
6 to <11 894 13.97 12.49 12.74 13.22 13.82 14.50 15.34 16.36 18.68
11 to <16 1,451 14.19 12.38 12.76 13.34 14.05 14.82 15.87 16.81 19.27
16 to <21 1,182 13.58 11.80 12.17 12.79 13.52 14.29 15.08 15.67 16.96
21 to <31 1,023 12.59 10.97 11.29 11.88 12.60 13.21 13.75 14.19 16.24
31 to <41 869 12.29 10.91 11.14 11.61 12.24 12.91 13.50 13.90 15.18
41 to <51 763 12.22 10.78 11.08 11.56 12.18 12.82 13.40 13.79 15.17
51 to <61 622 12.66 11.08 11.40 12.08 12.64 13.30 13.89 14.12 15.80
61 to <71 700 14.25 12.89 13.16 13.68 14.22 14.86 15.38 15.69 17.14
71 to <81 470 15.38 13.66 14.20 14.76 15.41 16.05 16.62 16.94 17.90
≥81 306 16.48 14.87 15.09 15.80 16.59 17.15 17.71 18.07 19.13
Page Exposure Factors Handbook 6-58 September 2011

Exposure Factors Handbook
Chapter 6—Inhalation Rates
Table 6-22. Descriptive Statistics for Duration of Time (hours/day) Spent Performing Activities Within the Specified Activity Category, by Age for Femalesa (continued)
Age Group (years) N
Duration (hours/day) Spent at Activity
Mean
Percentiles
Maximum 5th 10th 25th 50th 75th 90th 95th
Light Intensity Activities (1.5< METS ≤3.0)
Birth to <1
1
2
3 to <6
6 to <11
11 to <16
16 to <21
21 to <31
31 to <41
41 to <51
51 to <61
61 to <71
71 to <81
≥81
415 6.00 3.49 3.70 4.26 5.01 8.43 9.31 9.77 10.53
245 5.61 2.83 2.94 3.46 4.39 8.28 9.03 9.39 10.57
255 5.78 3.20 3.54 4.29 5.33 7.48 8.46 8.74 9.93
543 6.25 3.78 4.10 4.79 5.84 7.86 8.84 9.38 10.32
894 7.27 4.63 5.46 6.33 7.17 8.34 9.42 9.79 11.06
1,451 7.55 4.89 5.62 6.75 7.67 8.55 9.27 9.57 10.85
1,182 6.98 4.60 5.08 5.91 6.85 7.96 9.16 9.57 12.29
1,023 6.42 3.66 4.09 4.84 5.82 8.18 9.56 10.14 12.11
869 6.51 4.06 4.33 5.06 5.98 8.14 9.46 9.93 13.12
763 6.56 3.99 4.30 4.97 5.90 8.40 9.75 10.18 11.83
622 6.52 4.09 4.42 5.19 6.05 7.95 9.12 9.43 11.58
700 6.23 4.40 4.74 5.47 6.23 6.96 7.67 8.17 11.13
470 5.96 4.22 4.51 5.24 5.92 6.63 7.46 7.91 9.43
306 5.3 3.67 3.96 4.63 5.16 6.00 6.70 7.01 8.78
Moderate Intensity Activities (3.0< METS ≤6.0)
Birth to <1
1
2
3 to <6
6 to <11
11 to <16
16 to <21
21 to <31
31 to <41
41 to <51
51 to <61
61 to <71
71 to <81
≥81
415 3.91 0.53 0.74 1.10 4.87 5.77 6.27 6.54 7.68
245 4.02 0.52 0.73 1.08 5.14 6.10 7.00 7.37 8.07
255 3.27 0.50 0.78 1.22 4.01 4.88 5.35 5.57 6.93
543 3.35 0.70 0.89 1.61 3.88 4.71 5.29 5.65 7.58
894 2.57 0.65 0.95 1.82 2.66 3.41 3.95 4.32 6.10
1,451 2.01 0.89 1.08 1.45 1.96 2.51 3.03 3.28 4.96
1,182 3.26 1.27 1.48 2.21 3.39 4.24 4.74 5.07 6.68
1,023 4.80 1.62 1.94 2.78 5.37 6.42 7.19 7.52 9.21
869 5.00 1.71 2.06 3.09 5.41 6.60 7.31 7.58 9.59
763 5.05 1.75 2.00 2.97 5.48 6.66 7.50 7.97 10.16
622 4.58 1.71 2.13 3.10 4.79 5.98 6.89 7.14 8.97
700 3.31 1.65 1.97 2.56 3.34 4.01 4.61 5.01 6.90
470 2.48 1.19 1.36 1.82 2.48 2.99 3.64 4.01 5.63
306 2.06 1.01 1.25 1.55 1.99 2.51 3.07 3.44 4.68
Exposure Factors Handbook Page September 2011 6-59

Exposure Factors Handbook
Chapter 6—Inhalation Rates
Table 6-22. Descriptive Statistics for Duration of Time (hours/day) Spent Performing Activities Within the Specified Activity Category, by Age for Femalesa (continued)
Age Group (years) N
Duration (hours/day) Spent at Activity
Mean
Percentiles
Maximum 5th 10th 25th 50th 75th 90th 95th
High Intensity (METS >6.0)
Birth to <1 79 0.17 0.03 0.05 0.09 0.14 0.21 0.33 0.40 0.58
1 55 0.22 0.03 0.05 0.09 0.18 0.35 0.40 0.43 0.48
2 130 0.15 0.00 0.01 0.03 0.08 0.16 0.48 0.65 1.01
3 to <6 347 0.19 0.01 0.02 0.05 0.10 0.22 0.46 0.73 1.43
6 to <11 707 0.24 0.02 0.03 0.06 0.12 0.26 0.67 0.98 1.71
11 to <16 1,170 0.30 0.03 0.04 0.08 0.19 0.40 0.66 0.96 3.16
16 to <21 887 0.24 0.01 0.03 0.08 0.18 0.34 0.51 0.60 1.61
21 to <31 796 0.26 0.03 0.05 0.10 0.19 0.36 0.56 0.67 1.40
31 to <41 687 0.25 0.03 0.05 0.09 0.19 0.33 0.52 0.72 1.40
41 to <51 515 0.26 0.03 0.04 0.09 0.20 0.36 0.55 0.68 1.49
51 to <61 424 0.34 0.03 0.04 0.12 0.28 0.50 0.74 0.85 1.58
61 to <71 465 0.32 0.03 0.04 0.10 0.23 0.46 0.68 0.89 1.77
71 to <81 304 0.29 0.03 0.05 0.10 0.25 0.43 0.60 0.71 1.24
≥81 188 0.26 0.02 0.03 0.09 0.21 0.38 0.59 0.71 1.23 a Individual measures are weighted by their 4-year sampling weights as assigned within NHANES
1999−2000 when calculating the statistics in this table. Ventilation rate was estimated using a multiple linear regression model.
N = Number of individuals. MET = Metabolic equivalent.
Source: U.S. EPA (2009a).
Page Exposure Factors Handbook 6-60 September 2011

Table 6-23. Mean Inhalation Rate Values (m3/day) From Key Studies for Males and Females Combined
Age Groupa U.S. EPA (2009a)b
Brochu et al. (2006b)b
Arcus-Arth and Blaisdell (2007)b Stifelman (2007)c
Combined Key Studiesd
Nc Mean N Mean N Mean N Mean N Mean
Birth to <1 month
- - - - 182 3.63 - - 182 3.63
1 to <3 months - - 85 3.31 182 3.63 - - 267 3.47
3 to <6 months - - 85 3.31 294 4.92 - - 379 4.11
6 to <12 months - - 103 4.06 544 6.78 - - 647 5.42
Birth to <1 year 834 8.64 188 3.72 1,020 5.70 - 3.4 2,042 5.36
1 to <2 years 553 13.41 101 4.90 934 8.77 - 4.9 1,588 7.99
2 to <3 years 516 12.99 61 7.28 989 9.76 - 5.7 1,566 8.93
3 to <6 years 1,083 12.40 61 7.28 4,107 11.22 - 9.3 5,251 10.05
6 to <11 years 1,834 12.93 199 9.98 1,553 13.42 - 11.5 3,586 11.96
11 to <16 years 2,788 14.34 117 14.29 975 16.98 - 15.0 3,880 15.17
16 to <21 years 2,423 15.44 117 14.29 495 18.29 - 17.0 3,035 16.25
21 to <31 years 1,724 16.30 219 14.59 - - - 16.3 1,943 15.74
31 to <41 years 1,597 17.40 100 14.99 - - - 15.6 1,697 16.00
41 to <51 years 1,516 18.55 91 13.74 - - - 15.6 1,607 15.96
51 to <61 years 1,249 18.56 91 13.74 - - - 14.7 1,340 15.66
61 to <71 years 1,378 15.43 186 12.57 - - - 14.7 1,564 14.23
71 to <81 years 966 14.25 95 11.46 - - - - 1,061 12.86
≥81 years 561 12.97 95 11.46 - - - - 656 12.21 a When age groupings in the original reference did not match the U.S. EPA groupings used for this
handbook, means from all age groupings in the original reference that overlapped U.S. EPA’s age groupings by more than 1 year were averaged, weighted by the number of observations contributed from each age group. See Table 6-25 for concordance with U.S. EPA age groupings.
b Weighted (where possible) average of reported study means. c The total number of subjects for Stifelman (2007) was 3,007. d Unweighted average of means from key studies.
Exposure Factors Handbook
Chapter 6—Inhalation Rates
Exposure Factors Handbook Page September 2011 6-61

Table 6-24. 95th Percentile Inhalation Rate Values (m3/day) From Key Studies for Males and Females Combined
Age Groupa U.S. EPA (2009a)b
Brochu et al. (2006b)b
Arcus-Arth and Blaisdell (2007)b Stifelman (2007)c
Combined Key Studiesd
Na 95th N 95th N 95th N 95th N 95th
Birth to <1 month -b - - - 182 7.10 - - 182 7.10
1 to <3 months - - 85 4.44 182 7.10 - - 267 5.77
3 to <6 months - - 85 4.44 294 7.72 - - 379 6.08
6 to <12 months - - 103 5.28 544 10.81 - - 647 8.04
Birth to <1 year 834 12.67 188 4.90 1,020 9.95 - - 2,042 9.17
1 to <2 years 553 18.22 101 6.43 934 13.79 - - 1,588 12.81
2 to <3 years 516 17.04 61 9.27 989 14.81 - - 1,566 13.71
3 to <6 years 1,083 15.17 61 9.27 4,107 17.09 - - 5,251 13.84
6 to <11 years 1,834 17.05 199 12.85 1,553 19.86 - - 3,586 16.59
11 to <16 years 2,788 19.23 117 19.02 975 27.53 - - 3,880 21.93
16 to <21 years 2,423 20.89 117 19.02 495 33.99 - - 3,035 24.63
21 to <31 years 1,724 23.57 219 19.00 - - - - 1,943 21.29
31 to <41 years 1,597 24.30 100 18.39 - - - - 1,697 21.35
41 to <51 years 1,516 24.83 91 17.50 - - - - 1,607 21.16
51 to <61 years 1,249 25.17 91 17.50 - - - - 1,340 21.33
61 to <71 years 1,378 19.76 186 16.37 - - - - 1,564 18.07
71 to <81 years 966 17.88 95 15.30 - - - - 1,061 16.59
≥81 years 561 16.10 95 15.30 - - - - 656 15.70 a When age groupings in the original reference did not match the U.S. EPA groupings used for this
handbook, 95th percentiles from all age groupings in the original reference that overlapped U.S. EPA’s age groupings by more than 1 year were averaged, weighted by the number of observations contributed from each age group. See Table 6-25 for concordance with U.S. EPA age groupings.
b Weighted (where possible) average of reported study 95th percentiles. c The total number of subjects for Stifelman (2007) was 3,007. d Unweighted average of 95th percentiles from key studies.
Exposure Factors Handbook
Chapter 6—Inhalation Rates
Page Exposure Factors Handbook 6-62 September 2011

Exposure Factors Handbook
Chapter 6—Inhalation Rates
Table 6-25. Concordance of Age Groupings Among Key Studies
Age Groupa U.S. EPA (2009a) Brochu et al.
(2006b) Arcus-Arth and Blaisdell
(2007) Stifelman (2007)
Birth to <1 month — — 0 to 2 months — 1 to <3 months — 0.22 to <0.5 year 0 to 2 months — 3 to <6 months — 0.22 to <0.5 year 3 to 5 months — 6 to <12 months — 0.5 to <1 year 6 to 8 months —
— — 9 to 11 months — Birth to <1 year Birth to <1 year 0.22 to <0.5 year 0 to 11 months <1 year
— 0.5 to <1 year — — 1 to <2 years 1 to <2 years 1 to <2 years 1 year 1 year 2 to <3 years 2 to <3 years 2 to <5 years 2 years 2 years 3 to <6 years 3 to <6 years 2 to <5 years 3 years 3 years
— — 4 years 4 years — — 5 years 5 years
6 to <11 years 6 to <11 years 7 to <11 years 6 years 6 years — — 7 years 7 years — — 8 years 8 years — — 9 years 9 years — — 10 years 10 years
11 to <16 years 11 to <16 years 11 to <23 years 11 years 11 years — — 12 years 12 years — — 13 years 13 years — — 14 years 14 years — — 15 years 15 years
16 to <21 years 16 to <21 years 11 to <23 years 16 years 16 years — — 17 years 17 years — — 18 years 18 years — — — 19 to 30 years
21 to <31 years 21 to <31 years 11 to <23 years — 19 to 30 years — 23 to <30 years — —
31 to <41 years 31 to <41 years 30 to <40 years — 31 to 50 years 41 to <51 years 41 to <51 years 40 to <65 years — 31 to 50 years 51 to <61 years 51 to <61 years 40 to <65 years — 51 to 70 years 61 to <71 years 61 to <71 years 40 to <65 years — 51 to 70 years
— 65 to ≤96 years — — 71 to <81 years 71 to <81 years 65 to ≤96 years — — ≥81 years ≥81 years 65 to ≤96 years — — a When age groups in the original reference did not match the U.S. EPA groupings used for this handbook, statistics
were averaged from all age groupings in the original reference that overlapped U.S. EPA’s age groupings by more than 1 year, weighted by the number of observations contributed from each age group. For example, Brochu et al. (2006b) contributes its 2 to <5-year age group data to both U.S. EPA’s 2 to <3-year and 3 to <6-year age groups.
Exposure Factors Handbook Page September 2011 6-63

Exposure Factors Handbook
Chapter 6—Inhalation Rates
Table 6-26. Time Weighted Average of Daily Inhalation Rates (DIRs) Estimated From Daily Activitiesa
Subject
Inhalation Rate (m3/hour) DIRb
(m3/day) Resting Light Activity
Adult Man 0.45 1.2 22.8
Adult Woman 0.36 1.14 21.1
Child (10 years) 0.29 0.78 14.8
Infant (1 year) 0.09 0.25 3.76
Newborn 0.03 0.09 0.78 a Assumptions made were based on 8 hr resting and 16 hr light activity for adults and children (10 years);
14 hr resting and 10 hr light activity for infants (1 year); 23 hr resting and 1 hr light activity for newborns.
b
1
1 K
i i i
DIR IR t T =
= ∑
DIR = Daily Inhalation Rate, IRi = Corresponding inhalation rate at ith activity, ti = Hours spent during the ith activity, k = Number of activity periods, and T = Total time of the exposure period (i.e., a day).
Source: ICRP (1981).
Page Exposure Factors Handbook 6-64 September 2011

September 2011
Exposure F
actors Handbook
Exposur
Chapter e F6—
In actors Handbook
halation Rates
Table 6-27. Selected Inhalation Rate Values During Different Activity Levels Obtained From Various Literature Sources
Maximal Work Resting Light Activity Heavy Work During Exercise
Subject BW (kg) f VT V* f VT V* f VT V* f VT V*
Adolescent Male, 14−16 years 16 330 5.2 53 2,520 113 Male, 14−15 years 59.4 Female, 14−16 years 15 300 4.5 Female, 14−15 years; 164.9 cm L 56 52 1,870 88
Children 10 year; 140 cm L 16 300 4.8 24 600 14 Males, 10−11 years 36.5 58 1,330 71 Males, 10−11 years; 140.6 cm L 32.5 61 1,050 61 Females, 4−6 years 20.8 70 600 40 Females, 4−6 years; 111.6 cm L 18.4 66 520 34 Infant, 1 year 30 48 1.4a
Newborn 2.5 34 15 0.5 20 hours−13 weeks 2.5−5.3 68b 51a,b 3.5b
9.6 hours 3.6 25 21 0.5 6.6 days 3.7 29 21 0.6
Adult Man
1.7 m2 SA 68.5 12
12 750 500
7.4 6
17 1,670 29 21 2,030 43
30 years; 170 cm L 15 500 7.5 16 1,250 20 20−33 years 70.4 40 3,050 111
Woman 54 12 340 4.5 19 860 16 30 880 25 30 years; 160 cm L 15 400 6 20 940 19 20−25 years; 165.8 cm L Pregnant (8th month)
60.3 16 650 10
46 2,100 90
a Calculated from V* = f × VT. b Crying.
BW = body weights. f = frequency (breaths/minute). VT = tidal volume (mL). V* = minute volume (L/minute). cm L = length/height.
Source: ICRP (1981).

Exposure Factors Handbook
Chapter 6—Inhalation Rates
Table 6-28. Summary of Human Inhalation Rates by Activity Level (m3/hour)a
Nb Restingc Nb Lightd Nb Moderatee Nb Heavyf
Child, 6 years 8 0.4 16 0.8 4 2.0 5 2.3
Child, 10 years 10 0.4 40 1.0 29 3.2 43 3.9
Adult male 454 0.7 102 0.8 102 2.5 267 4.8
Adult female 595 0.3 786 0.5 106 1.6 211 2.9
Average adult 1,049 0.5 888 0.6 208 2.1 478 3.9 a Values of inhalation rates for children (male and female) presented in this table represent the mean of
values reported for each activity level in 1985. b Number of observations at each activity level. c Includes watching television, reading, and sleeping. d Includes most domestic work, attending to personal needs and care, hobbies, and conducting minor indoor
repairs and home improvements. e Includes heavy indoor cleanup, performance of major indoor repairs and alterations, and climbing stairs. f Includes vigorous physical exercise and climbing stairs carrying a load.
Source: Adapted from U.S. EPA (1985).
Table 6-29. Estimated Minute Ventilation Associated With Activity Level for Average Male Adulta
Level of work L/minute Representative activities Light 13 Level walking at 2 mph; washing clothes Light 19 Level walking at 3 mph; bowling; scrubbing floors Light 25 Dancing; pushing wheelbarrow with 15-kg load; simple construction; stacking
firewood Moderate 30 Easy cycling; pushing wheelbarrow with 75-kg load; using sledgehammer Moderate 35 Climbing stairs; playing tennis; digging with spade Moderate 40 Cycling at 13 mph; walking on snow; digging trenches Heavy Heavy Very heavy
55 63 72
Cross-country skiing; rock climbing; stair climbing with load; playing squash or handball; chopping with axe
Very heavy 85 Level running at 10 mph; competitive cycling Severe 100+ Competitive long distance running; cross-country skiing a Average adult assumed to weigh 70 kg.
Source: Adapted from U.S. EPA (1985).
Page Exposure Factors Handbook 6-66 September 2011

Exposure Factors Handbook
Chapter 6—Inhalation Rates
Table 6-30. Activity Pattern Data Aggregated for Three Microenvironments by Activity Level for All Age Groups
Microenvironment Activity Level
Average Hours Per Day in Each Microenvironment at Each
Activity Level Indoors
Outdoors
In Transportation Vehicle
Resting Light
Moderate Heavy
TOTAL
Resting Light
Moderate Heavy
TOTAL
Resting Light
Moderate Heavy
TOTAL
9.82 9.82 0.71 0.10 20.4
0.51 0.51 0.65 0.12 1.77
0.86 0.86 0.05
0.0012 1.77
Source: Adapted from U.S. EPA (1985).
Table 6-31. Summary of Daily Inhalation Rates (DIRs) Grouped by Age and Activity Level
Subject
Daily Inhalation Rate (m3/day)a Total Daily IRb
(m3/day) Resting Light Moderate Heavy
Child, 6 years 4.47 8.95 2.82 0.50 16.74
Child, 10 years 4.47 11.19 4.51 0.85 21.02
Adult Male 7.83 8.95 3.53 1.05 21.4
Adult Female 3.35 5.59 2.26 0.64 11.8
Adult Average 5.60 6.71 2.96 0.85 16 a Daily inhalation rate was calculated using the following equation:
∑ =
= k
i IRtiT
IR 1
1
IRi = Inhalation rate at ith activity, ti = Hours spent per day during ith activity, k = Number of activity periods, and T = Total time of the exposure period (e.g., a day).
b Total daily inhalation rate was calculated by summing the specific activity (resting, light, moderate, heavy) and dividing them by the total amount of time spent on all activities.
Source: Generated using the data from U.S. EPA (1985) as shown in Table 6-28 and Table 6-30.
Exposure Factors Handbook Page September 2011 6-67

Table 6-32. Distribution Pattern of Predicted Ventilation Rate (VR) and Equivalent Ventilation Rate (EVR) for 20 Outdoor Workers
VR (m3/hour)a EVRb (m3/hour/m2 body surface) Self-Reported Activity Level Nc
Arithmetic Mean ± SD
Geometric Mean ± SD
Arithmetic Mean ± SD
Geometric Mean ± SD
Sleep 18,597 0.42 ± 0.16 0.39 ± 0.08 0.23 ± 0.08 0.22 ± 0.08 Slow 41,745 0.71 ± 0.4 0.65 ± 0.09 0.38 ± 0.20 0.35 ± 0.09 Medium 3,898 0.84 ± 0.47 0.76 ± 0.09 0.48 ± 0.24 0.44 ± 0.09 Fast 572 2.63 ± 2.16 1.87 ± 0.14 1.42 ± 1.20 1.00 ± 0.14
Percentile Rankings, VR 1 5 10 50 90 95 99 99.9
Sleep Slow Medium Fast
0.18 0.30 0.36 0.42
0.18 0.36 0.42 0.54
0.24 0.36 0.48 0.60
0.36 0.66 0.72 1.74
0.66 1.08 1.32 5.70
0.72 1.32 1.68 6.84
0.90 1.98 2.64 9.18
1.20 4.38 3.84
10.26 Percentile Rankings, EVR
1 5 10 50 90 95 99 99.9 Sleep Slow Medium Fast
0.12 0.18 0.18 0.24
0.12 0.18 0.24 0.30
0.12 0.24 0.30 0.36
0.24 0.36 0.42 0.90
0.36 0.54 0.72 3.24
0.36 0.66 0.90 3.72
0.48 1.08 1.38 4.86
0.60 2.40 2.28 5.52
a Data presented by Shamoo et al. (1991) in L/minute were converted to m3/hour. b EVR = VR per square meter of body surface area. c Number of minutes with valid appearing heart rate records and corresponding daily records of breathing
rate.
Source: Shamoo et al. (1991).
Exposure Factors Handbook
Chapter 6—Inhalation Rates
Page Exposure Factors Handbook 6-68 September 2011

Exposure Factors Handbook
Chapter 6—Inhalation Rates
Table 6-33. Distribution Pattern of Inhalation Rate by Location and Activity Type for 20 Outdoor Workers
Location Activity Typea Self-Reported Activity Level % of Time
Inhalation rate (m3/hour)b
± SD % of Avg.c
Indoor Essential Sleep Slow Medium Fast
28.7 29.5 2.4 0
0.42 ± 0.12 0.72 ± 0.36 0.72 ± 0.30
0
69 ± 15 106 ± 43 129 ± 38
0 Indoor Non-essential Slow
Medium Fast
20.4 0.9 0.2
0.66 ± 0.36 0.78 ± 0.30 1.86 ± 0.96
98 ± 36 120 ± 50
278 ± 124 Outdoor Essential Slow
Medium Fast
11.3 1.8 0
0.78 ± 0.36 0.84 ± 0.54
0
117 ± 42 130 ± 56
0 Outdoor Non-essential Slow
Medium Fast
3.2 0.8 0.7
0.90 ± 0.66 1.26 ± 0.60 2.82 ± 2.28
136 ± 90 213 ± 91
362 ± 275 a Essential activities include income-related work, household chores, child care, study and other school
activities, personal care, and destination-oriented travel; Non-essential activities include sports and active leisure, passive leisure, some travel, and social or civic activities.
b Data presented by Shamoo et al. (1991) in L/min were converted to m3/hour. c Statistic was calculated by converting each VR for a given subject to a percentage of her/his overall
average.
Source: Adapted from Shamoo et al. (1991).
Exposure Factors Handbook Page September 2011 6-69

Exposure Factors Handbook
Chapter 6—Inhalation Rates
Table 6-34. Calibration and Field Protocols for Self-Monitoring of Activities Grouped by Subject Panels
Panel Calibration Protocol Field Protocol
Panel 1: Healthy Outdoor Workers—15 female, 5 male, age 19−50
Laboratory treadmill exercise tests, indoor hallway walking tests at different self-chosen speeds, 2 outdoor tests consisted of 1-hour cycles each of rest, walking, and jogging.
3 days in 1 typical summer week (included most active workday and most active day off); HR recordings and activity diary during waking hours.
Panel 2: Healthy Elementary School Students—5 male, 12 female, ages 10−12
Outdoor exercises each consisted of 20 minute rest, slow walking, jogging and fast walking.
Saturday, Sunday and Monday (school day) in early autumn; heart rate recordings and activity diary during waking hours and during sleep.
Panel 3: Healthy High School Students—7 male, 12 female, ages 13−17
Outdoor exercises each consisted of 20 minute rest, slow walking, jogging and fast walking.
Same as Panel 2, however, no heart rate recordings during sleep for most subjects.
Panel 4: Adult Asthmatics, clinically mild, moderate, and severe—15 male, 34 female, age 18−50
Treadmill and hallway exercise tests.
1 typical summer week, 1 typical winter week; hourly activity/health diary during waking hours; lung function tests 3 times daily; HR recordings during waking hours on at least 3 days (including most active work day and day off).
Panel 5: Adult Asthmatics from 2 neighborhoods of contrasting O3 air quality—10 male, 14 female, age 19−46
Treadmill and hallway exercise tests.
Similar to Panel 4, personal NO2 and acid exposure monitoring included. (Panels 4 and 5 were studied in different years, and had 10 subjects in common).
Panel 6: Young Asthmatics— 7 male, 6 female, ages 11−16
Laboratory exercise tests on bicycles and treadmills.
Summer monitoring for 2 successive weeks, including 2 controlled exposure studies with few or no observable respiratory effects.
Panel 7: Construction Workers— 7 male, age 26−34
Performed similar exercises as Panel 2 and 3, and also performed job-related tests including lifting and carrying a 9-kg pipe.
HR recordings and diary information during 1 typical summer work day.
Source: Linn et al. (1992).
Page Exposure Factors Handbook 6-70 September 2011

c
Table 6-35. Subject Panel Inhalation Rates by Mean Ventilation Rate (VR), Upper Percentiles, and Self-Estimated Breathing Rates
Inhalation Rates (m3/hour)
Mean VR at Activity Levelsb Panel Number 99th Percentile
and Description Na Mean VR VR Slow Medium Fast
Healthy 1—Adults 20 0.78 2.46 0.72 1.02 3.06 2—Elementary School Students 17 0.90 1.98 0.84 0.96 1.14 3—High School Students 19 0.84 2.22 0.78 1.14 1.62 7—Construction Workersc 7 1.50 4.26 1.26 1.50 1.68
Asthmatics 4—Adults 49 1.02 1.92 1.02 1.68 2.46 5—Adultsd 24 1.20 2.40 1.20 2.04 4.02 6—Elementary and High School 13 1.20 2.40 1.20 1.20 1.50
Students a Number of individuals in each survey panel. b Some subjects did not report medium and/or fast activity. Group means were calculated from individual
means (i.e., give equal weight to each individual who recorded any time at the indicated activity level). Construction workers recorded only on 1 day, mostly during work, while others recorded on ≥1 work or school day and ≥1 day off.
d Excluding subjects also in Panel 4.
VR = Ventilation rate.
Source: Linn et al. (1992).
Table 6-36. Actual Inhalation Rates Measured at Four Ventilation Levels Mean Inhalation Ratea (m3/hour)
Subject Location Low Medium Heavy Very Heavy All Indoor (treadmill post) 1.23 1.83 3.13 4.13 subjects Outdoor 0.88 1.96 2.93 4.90
Total 0.93 1.92 3.01 4.80 a Original data were presented in L/minute. Conversion to m3/hour was obtained as follows:
L/minute × 0.001 m3/L × 60 minute/hour = m3/hour
Source: Adapted from Shamoo et al. (1992).
Exposure Factors Handbook
Chapter 6—Inhalation Rates
Exposure Factors Handbook Page September 2011 6-71

c
Table 6-37. Distribution of Predicted Inhalation Rates by Location and Activity Levels for Elementary and High School Students
Inhalation Rates (m3/hour) Activity % Recorded Percentile Rankingsb
Age (years) Student Location Level Timea Mean ± SD 1st 50th 99.9th
10−12 ELc Indoors slow 49.6 0.84 ± 0.36 0.18 0.78 2.34 (Nd = 17) medium 23.6 0.96 ± 0.36 0.24 0.84 2.58
fast 2.4 1.02 ± 0.60 0.24 0.84 3.42 Outdoors slow 8.9 0.96 ± 0.54 0.36 0.78 4.32
medium 11.2 1.08 ± 0.48 0.24 0.96 3.36 fast 4.3 1.14 ± 0.60 0.48 0.96 3.60
13−17 HSc Indoors slow 70.7 0.78 ± 0.36 0.30 0.72 3.24 (Nd = 19) medium 10.9 0.96 ± 0.42 0.42 0.84 4.02
fast 1.4 1.26 ± 0.66 0.54 1.08 6.84e
Outdoors slow 8.2 0.96 ± 0.48 0.42 0.90 5.28 medium 7.4 1.26 ± 0.78 0.48 1.08 5.70
fast 1.4 1.44 ± 1.08 0.48 1.02 5.94 a Recorded time averaged about 23 hours per elementary school student and 33 hours per high school
student over 72-hour periods. b Geometric means closely approximated 50th percentiles; geometric standard deviations were 1.2−1.3 for
HR, 1.5−1.8 for VR. Elementary school student (EL) or high school student (HS).
d Number of students that participated in survey. e Highest single value.
SD = Standard deviation.
Source: Spier et al. (1992).
Exposure Factors Handbook
Chapter 6—Inhalation Rates
Page Exposure Factors Handbook 6-72 September 2011

c
Table 6-39. Distribution Patterns of Daily Inhalation Rates (DIRs) for Elementary (EL) and High School (HS) Students Grouped by Activity Level
Age Mean IRb Percentile Rankings a 1stStudents (years) Location Activity Type (m3/day) 50th 99.9th
EL (Nc = 17) 10 to 12 Indoor Light 13.7 2.93 12.71 38.14 Moderate 2.8 0.70 2.44 7.48
Heavy 0.4 0.10 0.34 1.37 EL Outdoor Light 2.1 0.79 1.72 9.5
Moderate 1.84 0.41 1.63 5.71 Heavy 0.57 0.24 0.48 1.80
HS (N = 19) 13 to 17 Indoor Light 15.2 5.85 14.04 63.18 Moderate 1.4 0.63 1.26 6.03
Heavy 0.25 0.11 0.22 1.37 HS Outdoor Light 1.15 0.5 1.08 6.34
Moderate 1.64 0.62 1.40 7.41 Heavy 0.29 0.10 0.20 1.19
a For this report, activity type presented in Table 6-37 and Table 6-38 was redefined as light activity for slow, moderate activity for medium, and heavy activity for fast.
b Daily inhalation rate was calculated by multiplying the hours spent at each activity level (see Table 6-38) by the corresponding inhalation rate (see Table 6-37). Number of elementary (EL) and high school students (HS).
Source: Adapted from Spier et al. (1992) (Generated using data from Table 6-37 and Table 6-38).
Exposure Factors Handbook
Chapter 6—Inhalation Rates Table 6-38. Average Hours Spent per Day in a Given Location and Activity Level for Elementary and
High School Students
Students Location Activity Level Total Time Spent
(hours/day) Slow Medium Fast Elementary school, ages 10 to 12 years (N = 17)
Indoors 16.3 2.9 0.4 19.6 Outdoors 2.2 1.7 0.5 4.4
High school, ages 13 to 17 years (N = 19)
Indoors 19.5 1.5 0.2 21.2 Outdoors 1.2 1.3 0.2 2.7
N = Number of students that participated in survey.
Source: Spier et al. (1992).
Exposure Factors Handbook Page September 2011 6-73

Exposure Factors Handbook
Chapter 6—Inhalation Rates
Table 6-40. Mean Minute Inhalation Rate (m3/minute) by Group and Activity for Laboratory Protocols
Activity Young Childrena Childrena Adult Femalesa Adult Malesa Adults (combined)a
Lying Sitting Standing
6.19E−03 6.48E−03 6.76E−03
7.51E−03 7.28E−03 8.49E−03
7.12E−03 7.72E−03 8.36E−03
8.93E−03 9.30E−03
10.65E−03
8.03E−03 8.51E−03 9.51E−03
Walking
1.5 mph 1.875 mph 2.0 mph 2.25 mph 2.5 mph 3.0 mph 3.3 mph 4.0 mph
1.03E−02 1.05E−02
DNP 1.17E−02
DNP DNP DNP DNP
DNPb
DNP 1.41E−02
DNP 1.56E−02 1.78E−02
DNP DNP
DNP DNP DNP DNP
2.03E−02 2.42E−02
DNP DNP
DNP DNP DNP DNP
2.41E−02 DNP
2.79E−02 3.65E−02
DNP DNP DNP DNP
2.22E−02 DNP DNP DNP
Running
3.5 mph 4.0 mph 4.5 mph 5.0 mph 6.0 mph
DNP DNP DNP DNP DNP
2.68E−02 3.12E−02 3.72E−02
DNP DNP
DNP 4.60E−02b
4.79E−02b
5.08E−02b
DNP
DNP DNP
5.73E−02 5.85E−02 6.57E−02b
DNP DNP
5.26E−02 5.47E−02
DNP a Young children, male and female 3−5.9 year olds; children, male and female 6−12.9 year olds; adult females,
adolescent, young to middle-aged, and older adult females; adult males, adolescent, young to middle-aged, and older adult males. DNP, group did not perform this protocol or N was too small for appropriate mean comparisons.
b Older adults not included in the mean value since they did not perform running protocol at particular speeds.
Source: Adams (1993).
Table 6-41. Mean Minute Inhalation Rate (m3/minute) by Group and Activity for Field Protocols Activity Young Childrena Childrena Adult Femalesa Adult Malesa Adults (combined) a
Play Car Driving Car Riding Yardwork Housework Car Maintenance Mowing Woodworking
1.13E−02 DNP DNP DNP DNP DNP DNP DNP
1.79E−02 DNP DNP DNP DNP DNP DNP DNP
DNP 8.95E−03 8.19E−03 1.92E−02b
1.74E−02 DNP DNP DNP
DNP 1.08E−02 9.83E−03
2.61E−02c/3.19E−02d
DNP 2.32E−02e
3.66E−02b
2.44E−02b
DNP 9.87E−03 9.01E−03
2.27E−02c/2.56E−02d
DNP DNP DNP DNP
a Young children, male and female 3−5.9 year olds; children, male and female 6−12.9 year olds; adult females, adolescent, young to middle-aged, and older adult females; adult males, adolescent, young to middle-aged, and older adult males; DNP, group did not perform this protocol or N was too small for appropriate mean comparisons.
b Adolescents not included in mean value since they did not perform this activity. c Mean value for young to middle-aged adults only. d Mean value for older adults only. e Older adults not included in the mean value since they did not perform this activity. Source: Adams (1993).
Page Exposure Factors Handbook 6-74 September 2011

c
Table 6-42. Summary of Average Inhalation Rates (m3/hour) by Age Group and Activity Levels for Laboratory Protocols
Activity Level
Age Group Restinga Sedentaryb Lightc Moderated Heavye
Young Children (3−5.9 years) Average inhalation rate (m3/hour) (N = 12, sex not specified)
0.37 0.40 0.65 DNPf DNP
Children (6−12.9 years) Average inhalation rate (m3/hour) (N = 40, 20 male and 20 female)
0.45 0.47 0.95 1.74 2.23
Adults (females) (Adolescent, young to middle aged, and older adult females) (N = 37)
0.43 0.48 1.33 2.76 2.96g
Adults (males) (Adolescent, young to middle aged, and older adult males) (N = 39)
0.54 0.60 1.45 1.93 3.63
Adults (combined) 0.49 0.54 1.38 2.35 3.30 (N = 76)
a Resting defined as lying (see Table 6-40 for original data). b Sedentary defined as sitting and standing (see Table 6-40 for original data).
Light defined as walking at speed level 1.5−3.0 mph (see Table 6-40 for original data). d Moderate defined as fast walking (3.3−4.0 mph) and slow running (3.5−4.0 mph) (see Table 6-40 for original
data). e Heavy defined as fast running (4.5−6.0 mph) (see Table 6-40 for original data). f Group did not perform (DNP) this protocol or N was too small for appropriate mean comparisons. All young
children did not run. g Older adults not included in mean value since they did not perform running protocols at particular speeds.
Source: Adapted from Adams (1993).
Exposure Factors Handbook
Chapter 6—Inhalation Rates
Exposure Factors Handbook Page September 2011 6-75

Exposure Factors Handbook
Chapter 6—Inhalation Rates
Table 6-43. Summary of Average Inhalation Rates (m3/hour) by Age Group And Activity Levels in Field Protocols
Age Group Sedentary Activitya
Light Activityb Moderate Activityc
Young Children (3 to 5.9 years) Average inhalation rate (m3/hour) (N = 12, sex not specified)
DNP DNPd 0.68
Children (6 to 12.9 years) Average inhalation rate (m3/hour) (N = 40, 20 male and 20 female)
DNP DNP 1.07
Adults (females) (Adolescent, young to middle aged, and older adult females) (N = 37)
0.51 1.10e DNP
Adults (males) (Adolescent, young to middle aged, and older adult males) (N = 39)
0.62 1.40 1.78f
Adults (combined) (N = 76)
0.57 1.25 DNP
a Sedentary activity was defined as car driving and riding (both sexes) (see Table 6-41 for original data). b Light activity was defined as car maintenance (males), housework (females), and yard work (females) (see
Table 6-41 for original data). c Moderate activity was defined as mowing (males); wood working (males); yard work (males); and play
(children) (see Table 6-41 for original data). d DNP. Group did not perform this protocol or N was too small for appropriate mean comparisons. e Older adults not included in mean value since they did not perform this activity. f Adolescents not included in mean value since they did not perform this activity.
N = Number of individuals.
Source: Adams (1993).
Page Exposure Factors Handbook 6-76 September 2011

Exposure Factors Handbook
Chapter 6—Inhalation Rates
Table 6-44. Comparisons of Estimated Basal Metabolic Rates (BMR) With Average Food-Energy Intakes (EFDs) for Individuals Sampled in the 1977−1978 NFCS
Cohort/Age (years)
Body Weight (kg)
BMRa EFD Ratio
EFDd/BMR MJ/dayb Kcal/dayc MJ/day Kcal/day
Males and Females
<1 7.6 1.74 416 3.32 793 1.90
1 to 2 13 3.08 734 5.07 1,209 1.65
3 to 5 18 3.69 881 6.14 1,466 1.66
6 to 8 26 4.41 1,053 7.43 1,774 1.68
Males
9 to 11 36 5.42 1,293 8.55 2,040 1.58
12 to 14 50 6.45 1,540 9.54 2,276 1.48
15 to 18 66 7.64 1,823 10.8 2,568 1.41
19 to 22 74 7.56 1,804 10.0 2,395 1.33
23 to 34 79 7.87 1,879 10.1 2,418 1.29
35 to 50 82 7.59 1,811 9.51 2,270 1.25
51 to 64 80 7.49 1,788 9.04 2,158 1.21
65 to 74 76 6.18 1,476 8.02 1,913 1.30
≥75 71 5.94 1,417 7.82 1,866 1.32
Females
9 to 11 36 4.91 1,173 7.75 1,849 1.58
12 to 14 49 5.64 1,347 7.72 1,842 1.37
15 to 18 56 6.03 1,440 7.32 1,748 1.21
19 to 22 59 5.69 1,359 6.71 1,601 1.18
23 to 34 62 5.88 1,403 6.72 1,603 1.14
35 to 50 66 5.78 1,380 6.34 1,514 1.10
51 to 64 67 5.82 1,388 6.40 1,528 1.10
65 to 74 66 5.26 1,256 5.99 1,430 1.14
≥75 62 5.11 1,220 5.94 1,417 1.16 a Calculated from the appropriate age and sex-based BMR equations given in Table 6-46. b MJ/day = megajoules/day. c Kcal/day = kilocalories/day. d Food-energy intake (Kcal/day) or (MJ/day).
Source: Layton (1993).
Exposure Factors Handbook Page September 2011 6-77

c
Table 6-45. Daily Inhalation Rates (DIRs) Calculated From Food-Energy Intakes (EFDs) METa Value Inhalation Rates
Cohort/Age (years) Lb Daily Inhalation Ratec
(m3/day) Sleep
(hours) Ad Fe Inactivef
(m3/day) Activef
(m3/day)
Males and Females
<1 1 4.5 11 1.9 2.7 2.35 6.35 1 to 2 2 6.8 11 1.6 2.2 4.16 9.15 3 to 5 3 8.3 10 1.7 2.2 4.98 10.96 6 to 8 3 10 10 1.7 2.2 5.95 13.09
Males
9 to 11 3 14 9 1.9 2.5 7.32 18.3 12 to 14 3 15 9 1.8 2.2 8.71 19.16 15 to 18 4 17 8 1.7 2.1 10.31 21.65 19 to 22 4 16 8 1.6 1.9 10.21 19.4 23 to 34 11 16 8 1.5 1.8 10.62 19.12 35 to 50 16 15 8 1.5 1.8 10.25 18.45 51 to 64 14 15 8 1.4 1.7 10.11 17.19 65 to 74 10 13 8 1.6 1.8 8.34 15.01 ≥75 1 13 8 1.6 1.9 8.02 15.24 Lifetime averageg 14
Females
9 to 11 3 13 9 1.9 2.5 6.63 16.58 12 to 14 3 12 9 1.6 2.0 7.61 15.22 15 to 18 4 12 8 1.5 1.7 8.14 13.84 19 to 22 4 11 8 1.4 1.6 7.68 12.29 23 to 34 11 11 8 1.4 1.6 7.94 12.7 35 to 50 16 10 8 1.3 1.5 7.80 11.7 51 to 64 14 10 8 1.3 1.5 7.86 11.8 65 to 74 10 9.7 8 1.4 1.5 7.10 10.65 ≥75 1 9.6 8 1.4 1.6 6.90 11.04 Lifetime averageg 10 a MET = Metabolic equivalent. b L is the number of years for each age cohort.
Daily inhalation rate was calculated by multiplying the EFD values (see Table 6-44) by H × VQ × (m3 1,000 L−1) for subjects under 9 years of age and by 1.2 × H × VQ × (m3 1,000 L−1) (for subjects 9 years of age and older (see text for explanation).
where: EFD = (Kcal/day) or (MJ/day), H = Oxygen uptake = 0.05 L O2/KJ or 0.21 L O2/Kcal, and VQ = Ventilation equivalent = 27 = geometric mean of VQs (unitless).
d For individuals 9 years of age and older, A was calculated by multiplying the ratio for EFD/BMR (unitless) (see Table 6-44) by the factor 1.2 (see text for explanation).
e F = (24A − S)/(24 − S) (unitless), ratio of the rate of energy expenditure during active hours to the estimated BMR (unitless).
where: S = Number of hours spent sleeping each day (hours).
f Inhalation rate for inactive periods was calculated as BMR × H × VQ × (d 1,440 minute−1) and for active periods by multiplying inactive inactive inhalation rate by F (See footnote e); BMR values are from Table 6-44.
where: BMR = Basal metabolic rate (MJ/day) or (kg/hour).
g Lifetime average was calculated by multiplying individual inhalation rate by corresponding L values summing the products across cohorts and dividing the result by 75, the total of the cohort age spans.
Source: Layton (1993).
Exposure Factors Handbook
Chapter 6—Inhalation Rates
Page Exposure Factors Handbook 6-78 September 2011

Exposure Factors Handbook
Chapter 6—Inhalation Rates
Table 6-46. Statistics of the Age/Sex Cohorts Used to Develop Regression Equations for Predicting Basal Metabolic Rates (BMR)
Sex, Age (years)
BMR
CV Body Weight
(kg) N BMR Equationa rMJ d−1 SD
Males Under 3 3 to <10 10 to <18 18 to <30 30 to <60 ≥60
1.51 4.14 5.86 6.87 6.75 5.59
0.92 0.50 1.17 0.84 0.87 0.93
0.61 0.12 0.20 0.12 0.13 0.17
6.6 21 42 63 64 62
162 338 734
2,879 646 50
0.249 BW − 0.127 0.095 BW + 2.110 0.074 BW + 2.754 0.063 BW + 2.896 0.048 BW + 3.653 0.049 BW + 2.459
0.95 0.83 0.93 0.65 0.60 0.71
Females Under 3 3 to <10 10 to <18 18 to <30 30 to <60 ≥60
1.54 3.85 5.04 5.33 5.62 4.85
0.92 0.49 0.78 0.72 0.63 0.61
0.59 0.13 0.15 0.14 0.11 0.12
6.9 21 38 53 61 56
137 413 575 829 372 38
0.244 BW − 0.130 0.085 BW + 2.033 0.056 BW + 2.898 0.062 BW + 2.036 0.034 BW + 3.538 0.038 BW + 2.755
0.96 0.81 0.80 0.73 0.68 0.68
a Body weight (BW) in kg. SD = Standard deviation. CV = Coefficient of variation (SD/mean). N = Number of observations. r = Coefficient of correlation.
Source: Layton (1993).
Table 6-47. Daily Inhalation Rates (DIRs) Obtained From the Ratios of Total Energy Expenditure to Basal Metabolic Rate (BMR)
Sex/Age (years)
Body Weighta
(kg) BMRb
(MJ/day) VQ Ac H
(m3O2/MJ) Inhalation Rate, VE
(m3/day)d
Males 0.5 to <3 3 to <10 10 to <18 18 to <30 30 to <60 ≥60
14 23 53 76 80 75
3.4 4.3 6.7 7.7 7.5 6.1
27 27 27 27 27 27
1.6 1.6 1.7
1.59 1.59 1.59
0.05 0.05 0.05 0.05 0.05 0.05
7.3 9.3 15 17 16 13
Females 0.5 to <3 3 to <10 10 to <18 18 to <30 30 to <60 ≥60
11 23 50 62 68 67
2.6 4.0 5.7 5.9 5.8 5.3
27 27 27 27 27 27
1.6 1.6 1.5
1.38 1.38 1.38
0.05 0.05 0.05 0.05 0.05 0.05
5.6 8.6 12 11 11 9.9
a Body weight was based on the average weights for age/sex cohorts in the U.S. population. b The BMRs are calculated using the respective body weights and BMR equations (see Table 6-46). c The values of the BMR multiplier (EFD/BMR) for those 18 years and older were derived from the Basiotis et al. (1989)
study: male = 1.59, female = 1.38. For males and females under 10 years old, the mean BMR multiplier used was 1.6. For males and females aged 10 to <18 years, the mean values for A given in Table 6-45 for 12−14 years and 15−18 years, age brackets for males and females were used: male = 1.7 and female = 1.5.
d Inhalation rate = BMR × A × H × VQ; VQ = ventilation equivalent and H = oxygen uptake.
Source: Layton (1993).
Exposure Factors Handbook Page September 2011 6-79

Exposure F
actors Handbook
Chapter 6 -Inhalation Rates
Page E
xposure Factors H
andbook 6-80
September 2011
Table 6-48. Daily Inhalation Rates (DIRs) Based on Time-Activity Survey
Age (years) and Activity MET
Males Females
Body Weighta
(kg) BMRb
(KJ/hour) Durationc
(hour/day) Ed
(MJ/day) VE
e
(m3/day) VE
f
(m3/hour) Body Weighta
(kg) BMRb
(KJ/hour) Durationc
(hour/day) Ed
(MJ/day) VE
e
(m3/day) VE
f
(m3/hour)
20−34 Sleep Light Moderate Hard Very Hard Totals
1 1.5 4 6 10
76 76 76 76 76
320 320 320 320 320
7.2 14.5 1.2
0.64 0.23 24
2.3 7.0 1.5 1.2 0.74 17
3.1 9.4 2.1 1.7 1.0 17
0.4 0.7 1.7 2.6 4.3
62 62 62 62 62
283 283 283 283 283
7.2 14.5 1.2
0.64 0.23 24
2.0 6.2 1.4 1.1 0.65 11
2.8 8.3 1.8 1.5 0.88 15
0.4 0.6 1.5 2.3 3.8
35−49 Sleep Light Moderate Hard Very Hard Totals
1 1.5 4 6 10
81 81 81 81 81
314 314 314 314 314
7.1 14.6 1.4
0.59 0.29 24
2.2 6.9 1.8 1.1 0.91 13
3.0 9.3 2.4 1.5 1.2 17
0.4 0.6 1.7 2.5 4.2
67 67 67 67 67
242 242 242 242 242
7.1 14.6 1.4
0.59 0.29 24
1.7 5.3 1.4 0.9 0.70 9.9
2.3 7.2 1.8 1.2 0.95 13
0.3 0.5 1.3 2.0 3.2
50−64 Sleep Light Moderate Hard Very Hard Totals
1 1.5 4 6 10
80 80 80 80 80
312 312 312 312 312
7.3 14.9 1.1
0.50 0.14 24
2.3 7.0 1.4 0.94 0.44 12
3.1 9.4 1.9 1.3 0.6 16
0.4 0.6 1.7 2.5 4.2
68 68 68 68 68
244 244 244 244 244
7.3 14.9 1.1 0.5
0.14 24
1.8 5.4 1.1 0.7 0.34 9.4
2.4 7.4 1.4 1.0 0.46 13
0.3 0.5 1.3 2.0 3.3
65−74 Sleep Light Moderate Hard Very Hard Totals
1 1.5 4 6 10
75 75 75 75 75
256 256 256 256 256
7.3 14.9 1.1 0.5
0.14 24
1.9 5.7 1.1 0.8 0.36 9.8
2.5 7.7 1.5 1.0
0.48 13
0.3 0.5 1.4 2.1 3.5
67 67 67 67 67
221 221 221 221 221
7.3 14.9 1.1 0.5
0.14 24
1.6 4.9 1.0 0.7 0.31 8.5
2.2 6.7 1.3 0.9 0.42 11
0.3 0.4 1.2 1.8 3.0
a Body weights were obtained from Najjar and Rowland (1987). b The BMRs for the age/sex cohorts were calculated using the respective body weights and the BMR equations (see Table 6-46). c Duration of activities were obtained from Sallis et al. (1985). d Energy expenditure rate (E) was calculated by multiplying BMR (KJ/hour) × (MJ/1,000 KJ) × duration (hour/day) × MET. e VE (inhalation rate) was calculated by multiplying E (MJ/day) by H (0.05 m3 oxygen/MJ) by VQ (27). f VE (m3/hour) was calculated by multiplying BMR (KJ/hour) × (MJ/1,000 KJ) × MET × H (0.05 m3 oxygen/MJ) × VQ (27).
Source: Layton (1993).

Table 6-49. Inhalation Rates for Short-Term Exposures
Activity Type
Rest Sedentary Light Moderate Heavy
MET (BMR Multiplier)
Sex/Age (years)
Body Weight (kg)a
BMRb
(MJ/day)
1 1.2 2c 4d
Inhalation Rate (m3/minute)f,g
10e
Males 0.5 to <3 14 3.40 3.2E−03 3.8E−03 6.3E−03 1.3E−02 –h
3 to <10 23 4.30 4.0E−03 4.8E−03 8.2E−03 1.6E−02 –h
10 to <18 53 6.70 6.3E−03 7.5E−03 1.3E−02 2.5E−02 6.3E−02 18 to <30 76 7.70 7.2E−03 8.7E−03 1.4E−02 2.9E−02 7.2E−02 30 to <60 80 7.50 7.0E−03 8.3E−03 1.4E−02 2.8E−02 7.0E−02 ≥60 75 6.10 5.7E−03 6.8E−03 1.1E−02 2.3E−02 5.7E−02
Females 0.5 to <3 11 2.60 2.4E−03 2.8E−03 4.8E−03 1.0E−02 –h
3 to <10 23 4.00 3.8E−03 4.5E−03 7.5E−03 1.5E−02 –h
10 to <18 50 5.70 5.3E−03 6.3E−03 1.1E−02 2.1E−02 5.3E−02 18 to <30 62 5.90 5.5E−03 6.7E−03 1.1E−02 2.2E−02 5.5E−02 30 to <60 68 5.80 5.3E−03 6.5E−03 1.1E−02 2.2E−02 5.4E−02 ≥60 67 5.30 5.0E−03 6.0E−03 9.8E−03 2.0E−02 5.0E−02
a Body weights were based on average weights for age/sex cohorts of the U.S. population. b The BMRs for the age/sex cohorts were calculated using the respective body weights and the BMR
equations (see Table 6-46). c Range = 1.5−2.5. d Range = 3−5. e Range = >5−20. f The inhalation rate was calculated as IR = BMR (MJ/day) × H (0.05 L/KJ) × MET × VQ (27) ×
(day/1,440 minutes). g 3Original data were presented in L/minute. Conversion to m3/minute was obtained as follows: m
× L
1000L min h The maximum possible MET sustainable for more than 5 minutes does not reach 10 for females and males
until ages 13 and 12, respectively. Therefore, an MET of 10 is not possible for this age category.
Source: Layton (1993).
Exposure Factors Handbook
Chapter 6—Inhalation Rates
Exposure Factors Handbook Page September 2011 6-81

c
Table 6-50. Distributions of Individual and Group Inhalation/Ventilation Rate (VR) for Outdoor Workers VR (m3/hour)
Percentile 1st 99thPopulation Group and Subgroupa Mean ± SD 50th
All Subjects (Nb= 19) 1.68 ± 0.72 0.66 1.62 3.90 Job
GCWc/Laborers (N = 5) 1.44 ± 0.66 0.48 1.32 3.66 Iron Workers (N = 3) 1.62 ± 0.66 0.60 1.56 3.24 Carpenters (N = 11) 1.86 ± 0.78 0.78 1.74 4.14
Site Medical Office Site (N = 7) 1.38 ± 0.66 0.60 1.20 3.72 Hospital Site (N = 12) 1.86 ± 0.78 0.72 1.80 3.96
a Each group or subgroup mean was calculated from individual means, not from pooled data. b N = number of individuals performing specific jobs or number of individuals at survey sites.
GCW = general construction worker.
Source: Linn et al. (1993).
Table 6-51. Individual Mean Inhalation Rate (m3/hour) by Self-Estimated Breathing Rate or Job Activity Category for Outdoor Workers
Self-Estimated Breathing Rate (m3/hour) Job Activity Category (m3/hour)
Population Group and Subgroup Slow Medium Fast Sit/Stand Walk Carry Tradea
All Subjects (N = 19) 1.44 1.86 2.04 1.56 1.80 2.10 1.92
Job
GCWb/Laborers (N = 5) 1.20 1.56 1.68 1.26 1.44 1.74 1.56
Iron Workers (N = 3) 1.38 1.86 2.10 1.62 1.74 1.98 1.92
Carpenters (N = 11) 1.62 2.04 2.28 1.62 1.92 2.28 2.04
Site
Office Site (N = 12) 1.14 1.44 1.62 1.14 1.38 1.68 1.44
Hospital Site (N = 12) 1.62 2.16 2.40 1.80 2.04 2.34 2.16 a Trade = “Working at Trade” (i.e., tasks specific to the individual’s job classification). b GCW = general construction worker.
Source: Linn et al. (1993).
Exposure Factors Handbook
Chapter 6—Inhalation Rates
Page Exposure Factors Handbook 6-82 September 2011

Table 6-52. Mean, Median, and SD of Inhalation Rate According to Waking or Sleeping in 618 Infants and Children Grouped in Classes of Age
Age (months) N <2 104 48.0 ± 9.1 47 39.8 ± 8.7 39 2 to <6 106 44.1 ± 9.9 42 33.4 ± 7.0 32 6 to <12 126 39.1 ± 8.5 38 29.6 ± 7.0 28 12 to <18 77 34.5 ± 5.8 34 27.2 ± 5.6 26 18 to <24 65 32.0 ± 4.8 32 25.3 ± 4.6 24 24 to <30 79 30.0 ± 6.2 30 23.1 ± 4.6 23 30 to 36 61 27.1 ± 4.1 28 21.5 ± 3.7 21 SD = Standard deviation. N = Number of individuals.
Source: Rusconi et al. (1994).
Inhalation Rate (breaths/minute) Waking Sleeping
Mean ± SD Median Mean ± SD Median
Exposure Factors Handbook
Chapter 6—Inhalation Rates
Exposure Factors Handbook Page September 2011 6-83

Exposure F
actors Handbook
Chapter 6—
Inhalation Rates
Page E
xposure Factors H
andbook Septem
ber 2011 6-84
c
Table 6-53. Distribution of Physiological Daily Inhalation Rate (PDIR) (m3/day) Percentiles for Free-Living Underweighta Adolescents and Women Aged 11 to 55 Years During Pregnancy and Postpartum Weeks
Physiological Daily Inhalation Ratesc (m3/day) Number of
Age Group (years)
Progression of the Reproductive Cycle
Subjectsb
NExp or NSim Mean ± SD 5th 10th 25th
Percentile
50th 75th 90th 95th 99th
11 to <23 Non-pregnant females 50 12.18 ± 2.08 8.76 9.52 10.78 12.18 13.58 14.84 15.60 17.02
Pre-pregnancy 0 week 5,000 12.27 ± 1.95 9.35 9.74 10.79 12.18 13.72 14.63 15.48 16.90
Pregnancy 9th week 5,000 17.83 ± 4.52 13.20 13.91 15.40 17.34 19.55 21.38 23.13 27.40
Pregnancy 22nd week 5,000 17.98 ± 4.77 13.19 13.95 15.47 17.46 19.73 22.09 23.90 30.69
Pregnancy 36th week 5,000 18.68 ± 4.73 13.44 14.25 15.96 17.88 20.24 23.01 25.59 34.45
Postpartum 6th week 5,000 20.39 ± 2.69 16.31 17.02 18.47 20.31 22.22 23.79 24.82 26.62
Postpartum 27th week 5,000 20.21 ± 2.66 16.17 16.88 18.31 20.14 22.02 23.58 24.61 26.39
23 to <30 Non-pregnant females 17 13.93 ± 2.27 10.20 11.02 12.40 13.93 13.93 16.83 17.65 19.20
Pre-pregnancy 0 week 5,000 13.91 ± 2.17 11.41 11.50 12.08 13.92 15.32 16.01 17.81 19.97
Pregnancy 9th week 5,000 20.03 ± 5.01 15.83 16.17 17.08 19.75 21.60 23.76 26.94 34.21
Pregnancy 22nd week 5,000 20.15 ± 4.24 15.81 16.16 17.07 19.80 21.67 24.49 27.46 32.69
Pregnancy 36th week 5,000 20.91 ± 5.37 15.97 16.37 17.56 20.29 22.31 26.42 28.95 38.26
Postpartum 6th week 5,000 22.45 ± 2.91 18.70 19.15 20.14 22.23 24.15 25.65 27.68 30.57
Postpartum 27th week 5,000 22.25 ± 2.89 18.53 18.98 19.96 22.04 23.94 25.42 27.44 30.30
30 to 55 Non-pregnant females 14 12.89 ± 1.40 10.58 11.09 11.94 12.89 12.89 14.69 15.20 16.16
Pre-pregnancy 0 week 5,000 12.91 ± 1.36 10.85 11.28 11.99 12.49 13.98 14.99 15.13 15.18
Pregnancy 9th week 5,000 18.68 ± 3.95 15.33 15.93 16.79 18.05 20.22 21.39 22.69 27.38
Pregnancy 22nd week 5,000 18.84 ± 4.08 15.30 15.93 16.80 18.07 20.23 21.52 23.20 30.80
Pregnancy 36th week 5,000 19.60 ± 4.66 15.54 16.14 17.03 18.73 20.74 23.04 25.58 34.26
Postpartum 6th week 5,000 21.19 ± 1.96 18.30 18.86 19.79 20.92 22.58 23.98 24.53 25.28
Postpartum 27th week 5,000 21.01 ± 1.94 18.14 18.69 19.62 20.74 22.39 23.77 24.31 25.07 a Underweight females are defined as those having a body mass index lower than 19.8 kg/m2 in pre-pregnancy. b NExp = number of experimental non-pregnant and non-lactating females; NSim = number of simulated females.
Resulting total energy requirements (TDERs) from the integration of energetic measurements in underweight non-pregnant and non-lactating females with those during pregnancy and lactation by Monte Carlo simulations were converted into physiological daily inhalation rates by the following equation: TDER × H × (VE/VO2) × 10-3. TDER = total energy requirement (ECG + TDEE). ECG = stored daily energy cost for growth; TDEE = total daily energy.
SD = Standard deviation.
Source: Brochu et al. (2006a).

Table 6-54. Distribution of Physiological Daily Inhalation Rate (PDIR) (m3/day) Percentiles for Free-Living Normal-Weighta Adolescents and Women Aged 11 to 55 Years During Pregnancy and Postpartum Weeks
Age Group (years)
Progression of the Reproductive Cycle
Number of Subjectsb
NExp or NSim
Physiological Daily Inhalation Ratesc (m3/day)
Percentile
Mean ± SD 5th 10th 25th 50th 75th 90th 95th 99th
11 to <23 Non-pregnant females 57 14.55 ± 2.70 10.11 11.09 12.73 14.55 16.37 18.01 18.99 20.83
Pre-pregnancy 0 week 5,000 14.55 ± 2.69 9.71 10.83 13.29 14.78 15.89 17.34 18.71 20.91
Pregnancy 9th week 5,000 19.99 ± 3.89 13.32 14.84 18.32 20.26 21.86 23.86 25.89 28.75
Pregnancy 22nd week 5,000 22.59 ± 4.83 15.35 17.09 20.06 22.27 24.69 28.25 30.75 35.88
Pregnancy 36th week 5,000 23.27 ± 4.63 16.01 17.76 20.69 23.10 25.55 28.77 31.07 35.65
Postpartum 6th week 5,000 23.28 ± 3.60 16.91 18.36 21.40 23.56 25.24 27.17 28.98 31.80
Postpartum 27th week 5,000 23.08 ± 3.56 16.76 18.20 21.21 23.36 25.02 26.93 28.73 31.52
23 to <30 Non-pregnant females 54 13.59 ± 2.23 9.92 10.73 12.09 13.59 15.09 16.45 17.26 18.78
Pre-pregnancy 0 week 5,000 13.66 ± 2.29 10.19 10.64 12.12 13.73 14.90 16.49 17.87 19.09
Pregnancy 9th week 5,000 19.00 ± 9.98 13.92 14.55 16.55 18.76 20.49 22.80 24.49 27.04
Pregnancy 22nd week 5,000 21.36 ± 4.36 15.54 16.70 18.63 20.89 23.58 26.59 28.43 33.98
Pregnancy 36th week 5,000 22.14 ± 4.13 16.21 17.34 19.35 21.69 24.55 27.59 29.27 32.77
Postpartum 6th week 5,000 22.15 ± 30.5 17.37 18.26 20.11 22.11 23.96 26.21 27.53 29.21
Postpartum 27th week 5,000 21.96 ± 3.02 17.22 18.10 19.93 21.91 23.75 25.98 27.29 28.96
30 to 55 Non-pregnant females 61 13.82 ± 1.91 10.67 11.37 12.53 13.82 15.12 16.28 16.97 18.28
Pre-pregnancy 0 week 5,000 13.79 ± 1.83 11.07 11.48 12.54 13.61 14.91 16.40 17.02 18.32
Pregnancy 9th week 5,000 19.02 ± 3.81 15.18 15.74 17.14 18.63 20.46 22.45 23.38 27.39
Pregnancy 22nd week 5,000 21.53 ± 4.06 16.71 17.56 19.01 20.85 23.45 26.03 28.30 33.44
Pregnancy 36th week 5,000 22.20 ± 3.68 17.45 18.19 19.69 21.73 24.16 26.78 28.53 32.75
Postpartum 6th week 5,000 22.31 ± 2.50 18.72 19.35 20.58 22.09 23.84 25.70 26.70 28.39
Postpartum 27th week 5,000 22.12 ± 2.48 18.55 19.18 20.40 21.90 23.64 25.47 26.47 28.14 a Normal-weight females are defined as those having a body mass index varying between 19.8 and 26 kg/m2 in pre-pregnancy. b NExp = number of experimental non-pregnant and non-lactating females; NSim = number of simulated females. c Resulting TDERs from the integration of energetic measurements in underweight non-pregnant and non-lactating females with those during pregnancy and lactation by Monte Carlo
simulations were converted into physiological daily inhalation rates by the following equation: TDER × H × (VE/VO2) × 10-3 . TDER = total energy requirement (ECG + TDEE). ECG = stored daily energy cost for growth; TDEE = total daily energy.
SD = Standard deviation. Source: Brochu et al. (2006a).
Exposure F
actors Handbook
Chapter 6—
Inhalation Rates
Exposure F
actors Handbook
Page Septem
ber 2011 6-85

Exposure F
actors Handbook
Chapter 6—
Inhalation Rates
Page E
xposure Factors H
andbook 6-86
September 2011
Table 6-55. Distribution of Physiological Daily Inhalation Rate (PDIR) (m3/day) Percentiles for Free-Living Overweight/Obesea Adolescents and Women Aged 11 to 55 Years During Pregnancy and Postpartum Weeks
Age Group (years)
Progression of the Reproductive Cycle
Number of Subjectsb
NExp or NSim
Physiological Daily Inhalation Ratesc (m3/day)
Percentile
Mean ± SD 5th 10th 25th 50th 75th 90th 95th 99th
11 to <23 Non-pregnant females 15 16.62 ± 2.91 11.82 12.88 14.65 16.62 18.58 20.35 21.41 23.39
Pre-pregnancy 0 week 5,000 16.64 ± 2.81 10.21 12.13 15.52 17.22 18.52 19.68 20.06 20.16
Pregnancy 9th week 5,000 25.51 ± 6.48 16.11 19.09 23.04 25.38 27.85 30.62 33.32 41.61
Pregnancy 22nd week 5,000 26.10 ± 6.96 16.38 19.29 23.12 25.65 28.17 31.56 34.93 45.94
Pregnancy 36th week 5,000 25.71 ± 8.09 15.67 18.78 22.73 25.23 27.84 31.14 34.95 46.76
Postpartum 6th week 5,000 25.93 ± 3.70 17.94 20.12 24.52 26.61 28.38 29.87 30.53 31.27
Postpartum 27th week 5,000 25.71 ± 3.67 17.79 19.94 24.30 26.38 28.13 29.61 30.26 31.00
23 to <30 Non-pregnant females 25 15.45 ± 2.32 11.63 12.47 13.88 15.45 17.02 18.43 19.27 20.86
Pre-pregnancy 0 week 5,000 15.47 ± 2.27 11.94 13.12 14.36 15.50 16.86 17.96 19.46 20.41
Pregnancy 9th week 5,000 23.93 ± 5.94 17.75 19.13 21.08 23.22 25.62 29.09 31.77 40.74
Pregnancy 22nd week 5,000 24.44 ± 6.24 18.06 19.45 21.32 23.51 26.44 29.92 33.49 44.56
Pregnancy 36th week 5,000 24.15 ± 6.82 17.60 19.00 20.91 23.05 26.02 30.04 34.18 47.31
Postpartum 6th week 5,000 24.47 ± 3.04 19.31 21.07 22.80 24.45 26.16 27.93 29.43 31.08
Postpartum 27th week 5,000 24.25 ± 3.02 19.14 20.88 22.60 24.23 25.93 27.68 29.17 30.81
30 to 55 Non-pregnant females 64 15.87 ± 2.52 11.72 12.63 14.17 15.87 17.57 19.10 20.01 21.73
Pre-pregnancy 0 week 5,000 15.83 ± 2.46 11.92 12.79 14.30 15.79 17.19 18.78 19.47 22.03
Pregnancy 9th week 5,000 24.47 ± 5.68 17.87 19.17 21.38 23.77 26.37 29.77 33.08 41.49
Pregnancy 22nd week 5,000 25.02 ± 6.65 18.13 19.41 21.44 23.92 26.93 30.98 35.01 46.88
Pregnancy 36th week 5,000 24.46 ± 6.24 17.67 18.83 20.92 23.40 26.37 30.32 34.27 45.08
Postpartum 6th week 5,000 24.91 ± 3.28 19.82 20.92 22.82 24.91 26.81 28.70 29.75 32.94
Postpartum 27th week 5,000 24.70 ± 3.25 19.65 20.74 22.63 24.69 26.58 28.45 29.50 32.65 a Overweight/obese females are defined as those having a body mass index higher than 26 kg/m2 in pre-pregnancy. b NExp = number of experimental non-pregnant and non-lactating females; NSim = number of simulated females. c Resulting TDERs from the integration of energetic measurements in underweight non-pregnant and non-lactating females with those during pregnancy and lactation by Monte Carlo
simulations were converted into physiological daily inhalation rates by the following equation: TDER × H × (VE/VO2) × 10-3 . TDER = total energy requirement (ECG + TDEE). ECG = stored daily energy cost for growth; TDEE = total daily energy.
SD = Standard deviation. Source: Brochu et al. (2006a).

Exposure F
actors Handbook
Chapter 6—
Inhalation Rates
Exposure F
actors Handbook
Page Septem
ber 2011 6-87
Table 6-56. Distribution of Physiological Daily Inhalation Rate (PDIR) (m3/kg-day) Percentiles for Free-Living Underweighta Adolescents and Women Aged 11 to 55 Years During Pregnancy and Postpartum Weeks
Age Group (years)
Progression of the Reproductive Cycle
Number of Subjectsb
NExp or NSim
Physiological Daily Inhalation Ratesc (m3/kg-day)
Percentile
Mean ± SD 5th 10th 25th 50th 75th 90th 95th 99th
11 to <23 Non-pregnant females 50 0.277 ± 0.046 0.201 0.218 0.246 0.277 0.277 0.335 0.352 0.383
Pre-pregnancy 0 week 5,000 0.276 ± 0.045 0.209 0.218 0.238 0.277 0.313 0.337 0.345 0.368
Pregnancy 9th week 5,000 0.385 ± 0.110 0.278 0.291 0.327 0.377 0.428 0.474 0.504 0.622
Pregnancy 22nd week 5,000 0.343 ± 0.093 0.246 0.259 0.291 0.335 0.378 0.419 0.455 0.602
Pregnancy 36th week 5,000 0.323 ± 0.083 0.230 0.243 0.274 0.314 0.357 0.404 0.452 0.575
Postpartum 6th week 5,000 0.368 ± 0.058 0.321 0.337 0.370 0.414 0.467 0.517 0.548 0.596
Postpartum 27th week 5,000 0.383 ± 0.064 0.329 0.348 0.383 0.433 0.491 0.549 0.584 0.647
23 to <30 Non-pregnant females 17 0.264 ± 0.047 0.186 0.203 0.232 0.264 0.264 0.325 0.342 0.374
Pre-pregnancy 0 week 5,000 0.264 ± 0.046 0.206 0.212 0.228 0.257 0.284 0.342 0.361 0.362
Pregnancy 9th week 5,000 0.366 ± 0.098 0.277 0.287 0.311 0.351 0.400 0.468 0.501 0.591
Pregnancy 22nd week 5,000 0.332 ± 0.076 0.250 0.260 0.282 0.318 0.362 0.421 0.452 0.532
Pregnancy 36th week 5,000 0.317 ± 0.086 0.233 0.242 0.266 0.301 0.346 0.402 0.439 0.582
Postpartum 6th week 5,000 0.352 ± 0.056 0.307 0.320 0.348 0.385 0.431 0.486 0.518 0.573
Postpartum 27th week 5,000 0.364 ± 0.061 0.316 0.330 0.357 0.397 0.449 0.508 0.545 0.606
30 to 55 Non-pregnant females 14 0.249 ± 0.027 0.204 0.214 0.231 0.249 0.249 0.283 0.293 0.312
Pre-pregnancy 0 week 5,000 0.249 ± 0.026 0.208 0.220 0.232 0.242 0.268 0.286 0.294 0.299
Pregnancy 9th week 5,000 0.347 ± 0.075 0.279 0.291 0.311 0.337 0.370 0.405 0.431 0.529
Pregnancy 22nd week 5,000 0.315 ± 0.071 0.252 0.262 0.280 0.305 0.335 0.368 0.401 0.529
Pregnancy 36th week 5,000 0.301 ± 0.074 0.233 0.243 0.260 0.287 0.321 0.360 0.404 0.529
Postpartum 6th week 5,000 0.337 ± 0.038 0.312 0.326 0.347 0.376 0.408 0.439 0.457 0.489
Postpartum 27th week 5,000 0.349 ± 0.042 0.320 0.333 0.357 0.389 0.425 0.462 0.483 0.518 a Underweight females are defined as those having a body mass index lower than 19.8 kg/m2 in pre-pregnancy. b NExp = number of experimental non-pregnant and non-lactating females; NSim = number of simulated females. c Resulting TDERs from the integration of energetic and weight measurements in normal-weight non-pregnant and non-lactating females with those during pregnancy and lactation by
Monte Carlo simulations were converted into physiological daily inhalation rates by the following equation: TDER × H × (VE/VC > 2) × 10-3 . TDER = total energy requirement (ECG + TDEE). ECG = stored daily energy cost for growth; TDEE = total daily energy expenditure.
SD = Standard deviation. Source: Brochu et al. (2006a).
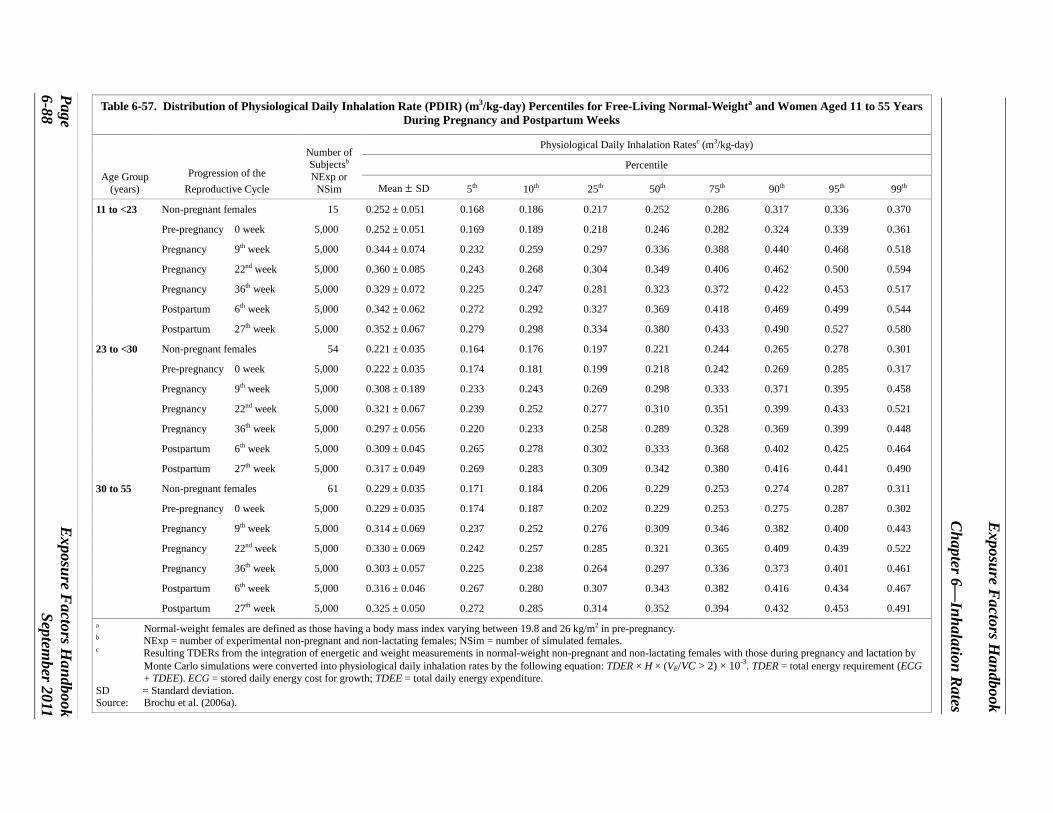
Exposure F
actors Handbook
Chapter 6—
Inhalation Rates
Page E
xposure Factors H
andbook 6-88
September 2011
Table 6-57. Distribution of Physiological Daily Inhalation Rate (PDIR) (m3/kg-day) Percentiles for Free-Living Normal-Weighta and Women Aged 11 to 55 Years During Pregnancy and Postpartum Weeks
Age Group (years)
Progression of the Reproductive Cycle
Number of Subjectsb
NExp or NSim
Physiological Daily Inhalation Ratesc (m3/kg-day)
Percentile
Mean ± SD 5th 10th 25th 50th 75th 90th 95th 99th
11 to <23 Non-pregnant females 15 0.252 ± 0.051 0.168 0.186 0.217 0.252 0.286 0.317 0.336 0.370
Pre-pregnancy 0 week 5,000 0.252 ± 0.051 0.169 0.189 0.218 0.246 0.282 0.324 0.339 0.361
Pregnancy 9th week 5,000 0.344 ± 0.074 0.232 0.259 0.297 0.336 0.388 0.440 0.468 0.518
Pregnancy 22nd week 5,000 0.360 ± 0.085 0.243 0.268 0.304 0.349 0.406 0.462 0.500 0.594
Pregnancy 36th week 5,000 0.329 ± 0.072 0.225 0.247 0.281 0.323 0.372 0.422 0.453 0.517
Postpartum 6th week 5,000 0.342 ± 0.062 0.272 0.292 0.327 0.369 0.418 0.469 0.499 0.544
Postpartum 27th week 5,000 0.352 ± 0.067 0.279 0.298 0.334 0.380 0.433 0.490 0.527 0.580
23 to <30 Non-pregnant females 54 0.221 ± 0.035 0.164 0.176 0.197 0.221 0.244 0.265 0.278 0.301
Pre-pregnancy 0 week 5,000 0.222 ± 0.035 0.174 0.181 0.199 0.218 0.242 0.269 0.285 0.317
Pregnancy 9th week 5,000 0.308 ± 0.189 0.233 0.243 0.269 0.298 0.333 0.371 0.395 0.458
Pregnancy 22nd week 5,000 0.321 ± 0.067 0.239 0.252 0.277 0.310 0.351 0.399 0.433 0.521
Pregnancy 36th week 5,000 0.297 ± 0.056 0.220 0.233 0.258 0.289 0.328 0.369 0.399 0.448
Postpartum 6th week 5,000 0.309 ± 0.045 0.265 0.278 0.302 0.333 0.368 0.402 0.425 0.464
Postpartum 27th week 5,000 0.317 ± 0.049 0.269 0.283 0.309 0.342 0.380 0.416 0.441 0.490
30 to 55 Non-pregnant females 61 0.229 ± 0.035 0.171 0.184 0.206 0.229 0.253 0.274 0.287 0.311
Pre-pregnancy 0 week 5,000 0.229 ± 0.035 0.174 0.187 0.202 0.229 0.253 0.275 0.287 0.302
Pregnancy 9th week 5,000 0.314 ± 0.069 0.237 0.252 0.276 0.309 0.346 0.382 0.400 0.443
Pregnancy 22nd week 5,000 0.330 ± 0.069 0.242 0.257 0.285 0.321 0.365 0.409 0.439 0.522
Pregnancy 36th week 5,000 0.303 ± 0.057 0.225 0.238 0.264 0.297 0.336 0.373 0.401 0.461
Postpartum 6th week 5,000 0.316 ± 0.046 0.267 0.280 0.307 0.343 0.382 0.416 0.434 0.467
Postpartum 27th week 5,000 0.325 ± 0.050 0.272 0.285 0.314 0.352 0.394 0.432 0.453 0.491 a Normal-weight females are defined as those having a body mass index varying between 19.8 and 26 kg/m2 in pre-pregnancy. b NExp = number of experimental non-pregnant and non-lactating females; NSim = number of simulated females. c Resulting TDERs from the integration of energetic and weight measurements in normal-weight non-pregnant and non-lactating females with those during pregnancy and lactation by
Monte Carlo simulations were converted into physiological daily inhalation rates by the following equation: TDER × H × (VE/VC > 2) × 10-3 . TDER = total energy requirement (ECG + TDEE). ECG = stored daily energy cost for growth; TDEE = total daily energy expenditure.
SD = Standard deviation. Source: Brochu et al. (2006a).

Exposure F
actors Handbook
Chapter 6—
Inhalation Rates
Exposure F
actors Handbook
Page Septem
ber 2011 6-89
Table 6-58. Distribution of Physiological Daily Inhalation Rate (PDIR) (m3/kg-day) Percentiles for Free-Living Overweight/Obesea Adolescents and Women Aged 11 to 55 Years During Pregnancy and Postpartum Weeks
Age Group (years)
Progression of the Reproductive Cycle
Number of Subjectsb
NExp or NSim
Physiological Daily Inhalation Ratesc (m3/kg-day)
Percentile
Mean ± SD 5th 10th 25th 50th 75th 90th 95th 99th
11 to <23 Non-pregnant females 15 0.206 ± 0.033 0.151 0.163 0.184 0.206 0.229 0.249 0.261 0.284
Pre-pregnancy 0 week 5,000 0.207 ± 0.032 0.146 0.153 0.188 0.214 0.227 0.240 0.253 0.259
Pregnancy 9th week 5,000 0.302 ± 0.075 0.205 0.223 0.263 0.298 0.329 0.368 0.401 0.515
Pregnancy 22nd week 5,000 0.287 ± 0.079 0.191 0.206 0.246 0.279 0.314 0.357 0.391 0.512
Pregnancy 36th week 5,000 0.270 ± 0.090 0.179 0.193 0.225 0.259 0.296 0.337 0.377 0.521
Postpartum 6th week 5,000 0.280 ± 0.050 0.213 0.230 0.266 0.301 0.337 0.372 0.395 0.444
Postpartum 27th week 5,000 0.285 ± 0.053 0.214 0.233 0.269 0.307 0.344 0.381 0.409 0.464
23 to <30 Non-pregnant females 54 0.186 ± 0.025 0.144 0.153 0.169 0.186 0.203 0.218 0.227 0.244
Pre-pregnancy 0 week 5,000 0.186 ± 0.025 0.143 0.155 0.172 0.183 0.201 0.222 0.233 0.236
Pregnancy 9th week 5,000 0.274 ± 0.068 0.203 0.217 0.238 0.263 0.298 0.337 0.374 0.476
Pregnancy 22nd week 5,000 0.261 ± 0.069 0.193 0.205 0.224 0.248 0.283 0.323 0.360 0.466
Pregnancy 36th week 5,000 0.245 ± 0.074 0.175 0.185 0.205 0.231 0.268 0.314 0.360 0.498
Postpartum 6th week 5,000 0.256 ± 0.042 0.205 0.217 0.241 0.271 0.304 0.338 0.360 0.406
Postpartum 27th week 5,000 0.260 ± 0.046 0.209 0.222 0.246 0.277 0.311 0.349 0.372 0.426
30 to 55 Non-pregnant females 61 0.184 ± 0.031 0.132 0.144 0.163 0.184 0.205 0.224 0.235 0.257
Pre-pregnancy 0 week 5,000 0.184 ± 0.031 0.127 0.141 0.166 0.185 0.205 0.221 0.226 0.246
Pregnancy 9th week 5,000 0.272 ± 0.068 0.184 0.203 0.234 0.263 0.299 0.343 0.378 0.465
Pregnancy 22nd week 5,000 0.259 ± 0.071 0.176 0.194 0.222 0.249 0.282 0.322 0.363 0.490
Pregnancy 36th week 5,000 0.242 ± 0.068 0.162 0.177 0.201 0.230 0.265 0.313 0.351 0.455
Postpartum 6th week 5,000 0.253 ± 0.048 0.188 0.205 0.237 0.270 0.305 0.340 0.364 0.404
Postpartum 27th week 5,000 0.257 ± 0.051 0.191 0.208 0.239 0.273 0.310 0.348 0.374 0.430 a Overweight/obese females are defined as those having a body mass index higher than 26 kg/m2 in pre-pregnancy. b NExp = number of experimental non-pregnant and non-lactating females; NSim = number of simulated females. c Resulting TDERs from the integration of energetic and weight measurements in normal-weight non-pregnant and non-lactating females with those during pregnancy and lactation by
Monte Carlo simulations were converted into physiological daily inhalation rates by the following equation: TDER × H × (VE/VC > 2) × 10-3 . TDER = total energy requirement (ECG + TDEE). ECG = stored daily energy cost for growth; TDEE = total daily energy expenditure.
SD = Standard deviation. Source: Brochu et al. (2006a).

Exposure Factors Handbook
Chapter 6—Inhalation Rates
Figure 6-1. 5th, 10th, 25th, 50th, 75th, 90th, and 95th Smoothed Centiles by Age in Awake Subjects. RR = respiratory rate. Source: Rusconi et al. (1994).
Figure 6-2. 5th, 10th, 25th, 50th, 75th, 90th, and 95th Smoothed Centiles by Age in Asleep Subjects. RR = respiratory rate.
Source: Rusconi et al. (1994).
Page Exposure Factors Handbook 6-90 September 2011