Embed Size (px)
Citation preview

Bushfire exposure and impacts
i The Australian National University Centre for Social Research and Methods
Exposure and the impact on attitudes of the 2019-20 Australian Bushfires
ANU Centre for Social Research and Methods
Professor Nicholas Biddle1, A/Prof Ben Edwards1, Diane Herz2, and Emeritus Prof Toni Makkai1
1 ANU Centre for Social Research and Methods
2 Social Research Centre
Australian National University
ANUPoll #32 (collected January 2020) - http://dx.doi.org/10.26193/S1S9I9 February 2020
Bushfire exposure and impacts
ii The Australian National University Centre for Social Research and Methods
Abstract
The bushfires that occurred over the 2019/20 Australian spring and summer were unprecedented in scale and wide in their geographic impact. Between 20 January and 3 February 2020, the ANU Centre for Social Research and Methods and the Social Research Centre collected data from more than three thousand Australian adults about their exposure to the bushfires, as well as a range of other attitudes and beliefs. We estimate that the vast majority of Australians (78.6 per cent) were impacted in one way or another either directly, through their family/friends, or through the physical effects of smoke. Furthermore, we estimate that around 2.9 million adult Australians had their property damaged, their property threatened, or had to be evacuated. This is the first estimate of self-reported impacts on that scale from a nationally representative, probability-based survey. Our survey findings also show that subjective wellbeing amongst the Australian population has declined since the start of spring 2019, people are less satisfied with the direction of the country, and have less confidence in the Federal Government. People are more likely, however, to think that the environment and climate change are issues and a potential threat to them, with a significant decline in the proportion of people who support new coal mines. By linking individuals through time, we are also able to show that some of these changes are attributable to exposure to the bushfires.
Acknowledgements
The authors would like to thank a number of people who were involved in the development of the January 2020 ANUpoll questionnaire, including Dr Benjamin Phillips, Dr Paul Myers and Charles Dove from the Social Research Centre, as well as Prof Ian McAllister and Prof Matthew Gray from the ANU. In addition to the above, the authors would also like to thank Darren Pennay for comments on an earlier draft of the paper. Finally, the author would like to thank Life in AustraliaTM participants for the generous contribution they made in terms of time and thoughtful responses.

Bushfire exposure and impacts
iii The Australian National University Centre for Social Research and Methods
Executive summary The 2019/20 Australian bushfires were unprecedented in scale, global in impact, and appear to have had wide ranging political and attitudinal impacts. In the January 2020, the ANU Centre for Social Research and Methods and the Social Research Centre collected data from more than three thousand Australian adults from the probability sample ‘Life in Australia’TM about their exposure to the bushfires that occurred across the spring and summer of late 2019 and into early 2020. We also asked about a range of attitudes towards the environment, institutions, and political issues. Data from the January 2020 ANUpoll was able to be linked to previous polls at the individual level. Levels of exposure
There was widespread exposure to the 2019/20 spring and summer bushfires.
Around 14.4 per cent of the adult population reported direct exposure either through their property being damaged, their property being threatened, or being told to evacuate. This equates to around 2.9 million adult Australians.
Around 77.8 per cent of the population reported indirect exposure, by having a friend or family member that had property damage; friend/family that had property threatened; had their travel/holiday plans affected; were exposed to the physical effects of smoke; or felt anxious or worried. This equates to around 15.4 million adults. Socio-demographic factors associated with exposure
Those who lived in a capital city reported less direct exposure. There were no other demographic or socioeconomic variables (as measured in our survey) that predicted direct exposure. The direct impact of the bushfires appears to have been an ‘exogenous shock’, truly random with respect to individual’s demographic and social backgrounds.
For indirect exposure there were large differences. Females and those aged 18 to 24 had a higher probability of indirect exposure than comparison groups. While those who had not completed Year 12 or who lived in more disadvantaged neighbourhoods all reported lower levels of indirect exposure. Psychological factors associated with exposure
The strongest predictor of being anxious or worried due to the bushfires was a person’s friend or family having their home or property threatened, not having directly experienced the impacts of the bushfires.
Controlling for other forms of bushfire exposure, males and those who lived in non-capital cities were also less likely to report anxiety or worry. General satisfaction with life before and after the bushfire season
In the October 2019 ANUpoll 65.2 per cent said they were either satisfied or very satisfied with the way the country is heading. By January 2020 this had declined to 59.5 per cent of adult Australians.
Over the same period, there was a small (but significant) average decline in life satisfaction from 7.05 (on a scale from 0 to 10) to 6.9. Levels of confidence in institutions
Confidence in the federal government declined by 10.9 percentage points from October 2019

Bushfire exposure and impacts
iv The Australian National University Centre for Social Research and Methods
to 27.3 per cent by January 2020.
Confidence in other institutions was quite stable over the period, and higher than for the Federal Government. In January 2020:
• 48.8 per cent of the population had confidence in the public service (52.1 per cent in October 2019);
• 73.8 per cent had confidence in the police (75.8 per cent in October 2019);
• 40.4 per cent had confidence in the State/Territory Government where they lived (not asked in 2019); and
• 93.0 per cent reported confidence in organisations responsible for firefighting in regional or rural areas (not asked in 2019).
Voting patterns between October 2019 and January 2020
The per cent of people who said they would vote for the Coalition if an election was held that day declined from 40.4 per cent in October 2019 to 34.8 per cent in January 2020.
The largest relative increase (8.8 per cent to 10.5 per cent) was for those who would vote for a party other than the Coalition, Labor, or the Greens. Views on party leaders between June 2019 and January 2020
Prime Minister Scott Morrison’s average rating declined from 5.25 to 3.92 out of 10.
Leader of the Opposition Anthony Albanese’s average rating increased from 4.87 to 5.04. Changes in attitudes towards the environment
49.7 per cent of people reported aspects of the environment as the most important issue or second most important issue facing Australia in January 2020 compared to 41.5 per cent in October 2019.
Reporting fires, natural disasters or extreme weather as the most or second most important issue were close to non-existent in October 2019. This increased to 10.2 percent by January 2020.
Concern about most specific issues increased from 2008 to January 2020, with the greatest increase for:
• loss of native vegetation or animal species or biodiversity (a 13 percentage point increase);
• drought and drying (a 9 percentage point increase).
Support for new coal mines have declined since the May 2019 election. In June 2019 45.3 per cent said yes to the question ‘In your opinion, should the Government allow the opening of news coal mines?’. This had declined to 37.0 per cent in January 2020. Capital cities versus the rest
There is majority support by residents in both capital and those living outside of capital cities that global warming is very serious, and that global warming will be a threat to them. These views are more strongly held by capital city residents.
Only 35.6 per cent of capital and 40.1 per cent of non-capital city residents support new coal
Bushfire exposure and impacts
v The Australian National University Centre for Social Research and Methods
mines and there is no statistically significant difference in views between the two. Did exposure to the bushfires affect changes in satisfaction, confidence or voting
intentions?
Direct or indirect exposure to bushfires did not statistically affect changes in life satisfaction between October and January.
Indirect exposure to the bushfires affected levels of confidence in government and satisfaction with the direction of the country. Those exposed reported greater declines in both confidence and satisfaction.
Although there was no significant direct affect from the bushfires on reporting a change in voting intention, exposure to the bushfires was associated with a significant decline in the likeability of Prime Minister Scott Morrison. Did exposure to the bushfires affect changes in environmental attitudes?
Direct exposure to the bushfires did not significantly affect perceptions that the environment is the most important issue. However indirect exposure increased perceptions that the environment was the first or second most important issue facing Australia in January 2020.
However, the drop in support for new coal mines does not appear to have been driven by exposure to bushfires. Those who supported new coal mines in June 2019, and who were subsequently directly exposed to the bushfires, were more likely to support new coal mines. Voter volatility and likeability of the Prime Minister
20.2 per cent of respondents said they would vote for a different party in January 2020 compared to October 2019.
Focusing on changes in the coalition vote:
• Females were more likely to change their votes from the coalition (relative to males).
• Those at the upper end of the age distribution (particularly those aged 75 years and over) were less likely to have changed their vote from the Coalition.
• Those who had a degree declined in their support for the coalition.
• Those who lived outside of a capital city were far more likely to have changed their vote from the Coalition, with an estimated probability more than twice as large as those in capital cities (all else being equal) – 21.2 per cent compared to 10.4 per cent.
Declines in likability of the Prime Minister were associated with:
• age (younger people had a greater decline),
• country of birth (those born overseas had a greater decline), and
• language spoken at home (non-English speakers had a greater increase).

Bushfire exposure and impacts
1 The Australian National University Centre for Social Research and Methods
1 Introduction and overview The bushfires that occurred over the 2019/20 Australian spring and summer were unprecedented in scale, global in impact, and appear to have had wide ranging political and attitudinal impacts. At the time of writing, more than 11 million hectares (110,000 sq km or 27.2 million acres) have been burnt1 and according to the Australian Academy of Science,2 Australia appears to have lost over a billion birds, mammals and reptiles, with additional loss of life of insects, amphibians and fish.
While the loss of human life in the current bushfire season has not been as large as with the deadliest fires that have occurred in Australia’s history, at least 33 people have been killed. Previous natural disasters have resulted in significant physical and emotional trauma beyond the loss of life (Bryant, Waters et al. 2014), with media reports3 giving an early indication that the current fires may have similar effects. There was also significant property damage, with almost 3,000 houses destroyed, and much more property damaged or threatened.4
A number of initial polls of public opinion related to the bushfires and the political ramifications are beginning to emerge. In the 12 January Newspoll, Labor had taken a slight lead over the Coalition in two-party preferred terms (51 to 49) for the first time since prior to the May 2019 election. By 2 February, this lead had widened to 52 to 48 in favour of Labor.
A number of specific polls on the fires have also been published. The Australia Institute (2020) published data (with a sample size of 1,033, conducted on the opt-in YouGov panel between 8 and 22 January) on self-reported impacts of the fires and views on climate related issues, making some comparisons with previous surveys on related issues. They found relatively high levels of reported impacts, with the most common being people changing their routine (33 per cent), with more severe impacts (missing work, home or property being unsuitable to live in) having relatively low incidence (8-9 per cent).
A separate report on the poll from the Australia Institute also found that there was a 10 percentage point increase in those who were very concerned about climate change (from 37 per cent in July 2019 to 47 per cent in January 2020) and a 14 percentage point increase in those who said that we are experiencing a lot of the impacts of climate change (The Australia Institute (2020). It should be noted though that much of that change appears to have come from a decrease in those who thought we were experiencing a little of the impacts of climate change, rather than those who thought we were experiencing not very much or not at all (which stayed relatively stable).
While potentially indicative and highly informative, all of the existing published public opinion suffer from one or more important limitations. Sample sizes tend to be small; the
1 https://www.bbc.com/news/world-australia-50951043 2 https://www.science.org.au/news-and-events/news-and-media-releases/australian-bushfires-why-they-are-unprecedented 3 https://www.smh.com.au/politics/nsw/andrew-constance-fears-for-community-s-mental-health-after-bushfire-disaster-20200203-p53xco.html 4 https://www.theguardian.com/environment/ng-interactive/2020/feb/11/counting-the-cost-of-australias-summer-of-dread

Bushfire exposure and impacts
2 The Australian National University Centre for Social Research and Methods
representativeness of the samples is questionable; they are commissioned and reported on by organisations with pre-existing political agendas (some pro- some anti-environmental policy); do not include validated measures; or are relatively early in the bushfire season. Furthermore, there is currently no public opinion data that is based on a longitudinal sample, which would allow pre-existing attitudes and beliefs to be held constant when looking at the effect of direct or indirect exposure to the bushfires on attitudes or measures of wellbeing. The aim of this paper is to fill this gap with a unique and targeted dataset.
In the January 2020 ANUpoll (Biddle 2020), the ANU Centre for Social Research and Methods and the Social Research Centre collected data from more than three thousand Australian adults about their exposure to the bushfires that occurred across the spring and summer of late 2019 and into early 2020. The data was obtained using a representative sample of 3,249 respondents from the probability sample ‘Life in Australia’TM (Kaczmirek, Phillips et al. 2019). Interviews commenced on 20 January 2020, and continued for a two-week collection period. More details on the survey are given at the end of the paper.
2 Exposure to bushfires There are two ways to capture bushfire exposure in the data used in this analysis. An indirect measure that we do not use in this paper is through the postcode of a person’s place of usual residence, which we can match against the postcodes identified by the Australian Tax Office as being in the disaster relief area, or against air quality data that is captured through various government and non-government monitoring stations. These geocoded variables will be available for future analysis.
These geocoded variables will identify those who live in areas that were directly or indirectly affected by the fires. Not every individual who lives in a bushfire area is likely to have been directly affected though (the postcodes are geographically quite large), and there are likely to be people who live outside those areas who were either directly or indirectly affected. This could be because of second homes, travel to those areas during bushfire periods (i.e. direct effects), or because they have close family/friends in those areas or were affected by smoke from the fires (i.e. indirect effects).
In this first paper of results from the January ANUpoll, we therefore use a set of variables based on asking people explicitly about a range of exposure measures. Specifically, we asked respondents:
We would now like to ask you some questions about your experiences with bushfires. Thinking first about the bushfires that have occurred / are currently occurring over this spring and summer in Australia. Which of the following, if any, have you experienced?
We asked about eight forms of exposure, with varying degrees of severity. These are listed below with the labels used in the remainder of the analysis.
a) Direct damage - Your home or property (including pets or livestock) has been damaged or destroyed by the fires
b) Direct threatened - Your home or property has been threatened but not damaged or destroyed by the fires
c) Friend/family damage - The home or property of a close family member or friend has been damaged or destroyed by the fires

Bushfire exposure and impacts
3 The Australian National University Centre for Social Research and Methods
d) Friend/family threatened - The home or property of a close family member or friend has been threatened but not damaged or destroyed by the fires
e) Evacuated - You were advised by emergency services (directly or indirectly via media) to evacuate from the area in which you live or were staying in due to the fires
f) Travel/holiday - Your travel or holiday itself, or travel and holiday plans have been affected by the fires
g) Smoke - You felt physically affected by smoke from the fires h) Anxious or worried - You felt anxious or worried for the safety of yourself, close family
members or friends, due to the fires.
It should be kept in mind that there is considerable uncertainty around the estimates based on these questions. First, we do not have a measure of severity and a number of the terms in the questions are open to interpretation (damaged; close family; advised by; affected). Our intention is to undertake a follow-up survey with respondents to identify the severity of the exposure, but for the current survey it should be kept in mind that results are based on the respondents’ own interpretation. A second form of uncertainty is the standard errors associated with sample surveys. For all our figures we add 95 per cent confidence intervals around our estimates, and include confidence intervals around the numerical estimates for exposure. However, it is particularly difficult in sample surveys to obtain precise estimates of outcomes with relatively low incidence.
A third form of uncertainty is the timing of the survey. It predated some of the fires (including in and around Canberra), but was also a number of months after the start of the fire season, leading to potential issues of recall bias. Finally, the fires themselves may have impacted on survey response rates. It is difficult to ascertain the size and direction of some of these potential sources of error, though we do not think that any of the conclusions are likely to be affected.
In total, 78.6 per cent reported at least one form of exposure, with Figure 1 giving the percentages for each of the individual types of exposure, as well as the uncertainty around those estimates (as 95 per cent confidence intervals). The most severe form of exposure, having one’s home or property damaged or destroyed, was only estimated to have been experienced by 1.0 per cent of the adult population. However, it should be noted that this may be an undercount as survey non-response could have been affected by exposure to the bushfire.5 Furthermore, this still equates to between 120,000 and 280,000 adults who reported some form of damage from the bushfires (Table 1), with our best estimate being around 200,000 adult Australians directly affected, based on their self-reported experience.6
5 This undercount is an area of ongoing analysis, through linking the postcode of usual residence of the total panel population and comparing whether the response rates for this particular survey vary between bushfire effected and non-effected regions. In this initial paper, we control for this undercount by weighting to population benchmarks, including geographic identifiers. 6 Initial analysis of the geographic location of those who reported that they were directly affected by the bushfires suggests that the majority lived, at the time of recruitment to the panel or most recent update of place of usual residence, in areas that were affected by the fires. There were relatively few respondents who lived outside of the affected areas based on the most recent geographic information, and many of these may have second homes or have subsequently moved into the areas. Future analyses will make greater use of this geographic information.

Bushfire exposure and impacts
4 The Australian National University Centre for Social Research and Methods
Combining those who had property damage, property threatened, or had to be evacuated, around 14.4 per cent of the Australian population report at least one of what we could classify as the most severe forms of exposure. This equates to around 2.9 million adults in Australia.
Not surprisingly, the vast majority of people who reported severe or direct exposure also experienced one of the other forms of exposure (94.9 per cent). One of the characteristics of the bushfires over the 2019/20 Australian spring and summer is their very large geographic range, the length of time that they lasted (many have only just been extinguished at the time of this report’s publication) and the large amount of smoke haze that spread across some of Australia’s largest cities and regional towns. It is perhaps not surprising then that there are many more people who reported indirect exposure, with more than three quarters of the population reporting some other form of indirect or secondary exposure. Looking at individual items, more than half of the adult population (57.0 per cent), or around 11.2 million adults were estimated to have felt physically affected by the smoke from the fires. This exposure undoubtedly varied in its severity, but this highlights the complex economic and public health challenges from the current fires.
The final exposure measure that we ask about in the poll is whether someone felt anxious or worried due to the fires. More than half of Australian adults (53.6 per cent) estimated to have reported that they felt anxious or worried due to the bushfires. This variable in particular is likely to mask a large degree of severity, and there are likely to be important factors that predict the degree of anxiety and worry, conditional on the person’s specific experience (a point we return to later in the paper). Nonetheless, it does demonstrate the very wide population coverage of those who had a subject negative experience.
While our estimates suggest a large number of Australian’s were exposed to the 2019/20 bushfires, official statistics of the resident population and the number of domestic visitors to the area support these findings. Estimates from the National Visitors Survey of domestic overnight visitors suggests that in 2018 there were almost 19 million domestic overnight visitors to bushfire affected local government areas.7 If we take the conservative monthly estimate of the annual figure, this equates to 1.58 million domestic visitors for a given month. Combined with an Estimated Resident Population as of 2018 of 1.7 million adults, this suggest that there were likely to be at least 3 million people in bushfire affected areas8.
Unfortunately, it is not possible in ANUpoll to measure exposure of children to the 2019/20 Australian bushfires. However, even with just being able to look at the adult population, it is clear that the fires had a wide population impact, with most Australians either directly or indirectly affected.
7 For Local Government Areas affected see: https://www.pm.gov.au/media/immediate-financial-support-bushfire-affected-communities 8 At this time, it is more difficult to obtain estimates of damage to properties, estimates of property damage. The Insurance Council of Australia reported that on 10 January 2020 11,500 bushfire related insurance claims since September 2019. In a 20 January 2020 ABC story it was reported that Suncorp had over 7,000 claims. These are likely to be a lower bound for property damage as many people would have not yet made claims, and some damage would not be claimed through insurance. Furthermore, property damage estimates need to be multiplied by 2.6 to get an estimate of the number of people in those properties.

Bushfire exposure and impacts
5 The Australian National University Centre for Social Research and Methods
Figure 1 Exposure to bushfires and related events
Source: January 2020 ANUpoll.
Table 1 Exposure to bushfires and related events – Percentages and population estimates
Exposure type Estimated per cent Estimated number (millions)
Lower bound Point estimate Upper bound
All 78.6 15.2 15.5 15.9
Severe/Direct 14.4 2.5 2.9 3.2
Indirect/secondary 77.8 15.0 15.4 15.7
Direct damage 1.0 0.1 0.2 0.3
Direct threatened 10.1 1.7 2.0 2.3
Friend/family damage 13.0 2.3 2.6 2.9
Friend/family threatened 38.7 7.2 7.7 8.1
Evacuated 8.9 1.5 1.8 2.0
Travel/holiday 21.2 3.8 4.2 4.6
Smoke 57.0 10.8 11.3 11.7
Anxious or worried 53.6 10.2 10.6 11.0
Source: January 2020 ANUpoll.
It is perhaps not surprising that those who report that they were exposed to one form of negative effect of the fires were more likely to report other types of exposure. We can see this
1.0
10.1
13.0
38.7
8.9
21.2
57.0
53.6
0.0 10.0 20.0 30.0 40.0 50.0 60.0 70.0
Direct damage
Direct threatened
Friend/family damage
Friend/family threatened
Evacuated
Travel/holiday
Smoke
Anxious or worried
Per cent of Australian adults exposed

Bushfire exposure and impacts
6 The Australian National University Centre for Social Research and Methods
first by looking at the pairwise correlation between the exposure variables (Table 2). The two types of exposure that have the strongest correlation are being directly threatened oneself and having been evacuated (correlation coefficient = 0.456) and having a friend or family directly threatened and feeling anxious or worried (correlation coefficient = 0.426).

Bushfire exposure and impacts
7 The Australian National University Centre for Social Research and Methods
Table 2 Correlation between bushfire exposure items
Direct damage Direct threatened
Friend/family damage
Friend/family threatened
Evacuated Travel/holiday Smoke Anxious or worried
Direct damage
Direct threatened 0.19
Friend/family damage 0.18 0.25
Friend/family threatened 0.07 0.27 0.37
Evacuated 0.13 0.45 0.18 0.17
Travel/holiday 0.03 0.12 0.20 0.18 0.16
Smoke 0.02 0.12 0.15 0.19 0.14 0.23
Anxious or worried 0.06 0.19 0.26 0.40 0.18 0.23 0.33
Source: January 2020 ANUpoll.
Bushfire exposure and impacts
8 The Australian National University Centre for Social Research and Methods
While there is a strong correlation between some of the exposure variables (a point we return to later in this section), one of the interesting findings is that there is very little association between the standard demographic and socioeconomic variables and exposure to the more severe, personal exposure we asked about (those who had property damage, property threatened, or had to be evacuated). In a regression analysis (Table 3), we found no association with sex, age, Indigenous status, and the socioeconomic characteristics of the area in which a person lived. There was a small association with country of birth (those born overseas less likely to be exposed) and education (those with a postgraduate degree more likely to be exposed). Not surprisingly though a strong association with the type of area in which a person lived, with those who lived in a non-capital city more than 50 per cent more likely to have been exposed than those who lived in a capital city (19.6 per cent compared to 11.9 per cent).
There was, however, a number of variables that were associated with indirect or secondary exposure to the fires (which we define as friend/family damage; friend/family threatened; travel/holiday; smoke; anxious or worried). Specifically, in Table 3 we show that controlling for other variables, females and the youngest adults in the sample (aged 18 to 24) were all more likely to report that they had indirect or secondary exposure to the bushfires compared to the base case individual. Those who have not completed Year 12 or who lived in more disadvantaged neighbourhoods all reported lower levels of exposure. Results are presented as marginal effects, or the difference in probability of exposure, holding all other characteristics constant at their baseline value (as described under the table).
There are a number of potential reasons for this variation, all of which are difficult to test with the current data. Past research shows females and the relatively young tend to have higher rates of anxiety in general (McLean, Asnaani et al. 2011), but they may also have greater social networks (in-person and virtual) that increase the extent to which they are exposed to news and information about the bushfires in general, as well as friends and family who may be directly impacted. Those with relatively high rates of education and those who live in relatively advantaged areas have greater engagement with certain forms of media (Campbell 2009) and may also have the economic resources that allow them to purchase second homes (in the areas where bushfires occurred) or would have enabled them to travel to areas that were affected. These determinants of indirect/secondary exposure, conditional on direct exposure are an important area of further analysis.
One of the interesting findings from the analysis is that there was no association between living outside of a capital city and secondary exposure. This highlights, once again, the very wide geographic spread of indirect exposure to the bushfires, through the impacts on friends and family, having one’s travel affected, exposure to smoke, or more general anxiety and worry. Unlike other fires in previous years that may have had greater loss of life in concentrated areas, the bushfires of 2019/20 had very wide exposure.

Bushfire exposure and impacts
9 The Australian National University Centre for Social Research and Methods
Table 3 Factors associated with bushfire exposure – Severe/direct exposure and indirect/secondary exposure
Variable Severe/direct Indirect/secondary
Marginal effect
Signific. Marginal effect
Signific.
Female -0.006 0.072 ***
Aged 18 to 24 0.015 0.125 ***
Aged 25 to 34 0.011 -0.002
Aged 45 to 54 0.006 -0.028
Aged 55 to 64 0.000 -0.076 **
Aged 65 to 74 0.029 0.011
Aged 75 plus 0.010 0.030
Indigenous -0.025 -0.004
Born overseas in a main English-speaking country -0.031 ** -0.006
Born overseas in a non-English speaking country -0.029 -0.036
Speaks a language other than English at home -0.005 0.055
Has not completed Year 12 or post-school qualification 0.011 -0.089 **
Has a post graduate degree 0.049 ** 0.056
Has an undergraduate degree 0.021 0.014
Has a Certificate III/IV, Diploma or Associate Degree 0.044 ** 0.040
Lives in the most disadvantaged areas (1st quintile) 0.009 -0.085 **
Lives in next most disadvantaged areas (2nd quintile) 0.003 -0.029
Lives in next most advantaged areas (4th quintile) 0.002 -0.021
Lives in the most advantaged areas (5th quintile) 0.022 0.021
Lives in a non-capital city 0.065 *** 0.012
Probability of base case 0.093 0.748
Sample size 3,077 3.077
Source: January 2020 ANUpoll.
Notes: The base case individual is female; aged 35 to 44; non-Indigenous; born in Australia; does not speak a language other than English at home; has completed Year 12 but does not have a post-graduate degree; lives in neither an advantaged or disadvantaged suburb ( third quintile); and lives in a capital city
Those coefficients that are statistically significant at the 1 per cent level of significance are labelled ***; those significant at the 5 per cent level of significance are labelled **, and those significant at the 10 per cent level of significance are labelled *.
Of the eight questions we asked about exposure to the bushfires, the most subjective was the last – You felt anxious or worried for the safety of yourself, close family members or friends, due to the fires. Being a subjective question does not make it less real, and as will be shown later in this paper, the more indirect measures seem to be more predictive of changes in other attitudes, both towards the environment and towards political issues. We did, however, ask that question last intentionally as we wanted to be able to explicitly capture the relationship between it and the less subjective measures.

Bushfire exposure and impacts
10 The Australian National University Centre for Social Research and Methods
Table 4 shows that there is a very strong relationship between other forms of bushfire exposure and a person reporting that they felt anxious or worried. However, in a multivariate model, there were some forms of exposure that had a greater association than others. There was no association between what one might think as the most severe form of exposure – having a home or property (including pets or livestock) that has been damaged or destroyed by the fires. Though, as mentioned, this is a relatively small share of the sample and therefore hard to obtain precise predictions. All the other forms of exposure had a positive and significant association, with the largest marginal effect for those who had a friend or family member having their home or property threatened. Compared to the base case, and holding all other variables constant, someone with this form of exposure was more than three times as likely to report feeling anxious or worried.
Like when we looked at the broader category of indirect exposure, females (in particular) and the young were more likely to report anxiety or worry. What is quite important from a policy perspective is that those who live outside a capital city (a proxy for living in a regional or rural area) were less likely to report anxiety or worry compared to those who live in a capital city (p-value = 0.051). While this may fit into the stereotype of stoicism we often associate with the bush, it does highlight a potential level of under-reporting or a potential under-accessing of mental health services for some who live in the most exposed areas in Australia (McColl 2007).

Bushfire exposure and impacts
11 The Australian National University Centre for Social Research and Methods
Table 4 Factors associated with feeling anxious or worried, including severe/direct exposure and indirect/secondary exposure
Variable Marginal effect
Signific.
Direct damage 0.038
Direct threatened 0.090 ***
Friend/family damage 0.175 ***
Friend/family threatened 0.295 ***
Evacuated 0.092 **
Travel/holiday 0.108 ***
Smoke 0.177 ***
Female 0.098 ***
Aged 18 to 24 0.064
Aged 25 to 34 0.055 *
Aged 45 to 54 0.019
Aged 55 to 64 -0.041 *
Aged 65 to 74 0.010
Aged 75 plus -0.009
Indigenous -0.038
Born overseas in a main English-speaking country 0.025
Born overseas in a non-English speaking country 0.126 ***
Speaks a language other than English at home -0.017
Has not completed Year 12 or post-school qualification -0.029
Has a post graduate degree -0.040
Has an undergraduate degree -0.022
Has a Certificate III/IV, Diploma or Associate Degree 0.006
Lives in the most disadvantaged areas (1st quintile) 0.014
Lives in next most disadvantaged areas (2nd quintile) 0.029
Lives in next most advantaged areas (4th quintile) -0.002
Lives in the most advantaged areas (5th quintile) 0.045 *
Lives in a non-capital city -0.032 *
Probability of base case 0.140
Sample size 3,073
Source: January 2020 ANUpoll.
Notes: The base case individual did not report any of the forms of exposure; is female; aged 35 to 44; non-Indigenous; born in Australia; does not speak a language other than English at home; has completed Year 12 but does not have a post-graduate degree; lives in neither an advantaged or disadvantaged suburb ( third quintile); and lives in a capital city

Bushfire exposure and impacts
12 The Australian National University Centre for Social Research and Methods
Those coefficients that are statistically significant at the 1 per cent level of significance are labelled ***; those significant at the 5 per cent level of significance are labelled **, and those significant at the 10 per cent level of significance are labelled *.
3 Wellbeing and views on the country There are a number of potential effects of exposure to bushfires, either directly, indirectly through close friends and families, or through exposure to smoke and haze. Experiences of trauma (Bryant, Waters et al. 2014) and public health effects of smoke (Morgan, Sheppeard et al. 2010) are difficult to detect in nationally representative surveys like ANUpoll (due to lack of clinical measures and relatively small samples of people with direct extreme exposure), though they may be collected in subsequent waves of Life in Australia™. It is possible, however, to look at the relationship between bushfire exposure and more subjective measures of wellbeing.
At the start of the January 2020 ANUpoll and before any questions on bushfire exposure, we asked respondents ‘Firstly, a general question about your views on living in Australia. All things considered, are you satisfied or dissatisfied with the way the country is heading?’, with response options of very satisfied; satisfied; neither satisfied nor dissatisfied; dissatisfied; and very dissatisfied. After asking a couple of questions on political views (which we will return to later in this paper) we then asked respondents ‘The following question asks how satisfied you feel about life in general, on a scale from 0 to 10. Zero means you feel 'not at all satisfied' and 10 means 'completely satisfied'. Overall, how satisfied are you with life as a whole these days?’
We estimate that 59.5 per cent of adult Australians were either satisfied or very satisfied with the way the country is heading. This is a significant and substantial decline from 65.2 per cent in the October 2019 ANUpoll, the last time the question was asked on Life in AustraliaTM. On a range of 0 to 10, life satisfaction in January 2020 was 6.90, also a decline since the October 2019 value of 7.05.9
Because of the widespread nature of the fires, as well as the national and international coverage in the media, views on the direction of the country can still be affected by bushfires even if an individual is not directly exposed. However, this cannot be tested with the current data. It is possible, however, to look at the relationship between self- reported bushfire exposure and the wellbeing measures. We return to this in a longitudinal sense later in this paper with the linked sample. In this section though, we look at cross-sectional relationships using the full January 2020 sample.
There were some significant differences in satisfaction with the direction of the country and life satisfaction by exposure to the bushfires (Figure 2, with life satisfaction rescaled to 0 to 100). Looking first at differences by direct exposure (those who had property damage, property threatened, or had to be evacuated), those who were directly exposed had lower levels of satisfaction with the direction of the country, but no difference in life satisfaction. For indirect exposure, on the other hand, those who reported indirect exposure (Friend/family damage; Friend/family threatened; Travel/holiday; Smoke; Anxious or worried) had lower rates of both life satisfaction and satisfaction with the direction of the country than those who weren’t indirectly exposed.
9 The standard deviation for Life Satisfaction in January 2020 was 1.82, meaning the change over the three months was a decline of 8.2 per cent of one standard deviation.

Bushfire exposure and impacts
13 The Australian National University Centre for Social Research and Methods
We will return to these two issues in the final section of the paper by looking at the relationship between bushfire exposure and change through time in the wellbeing measures, a more direct measure of a causal relationship.
Figure 2 Satisfaction with direction of country and life satisfaction by bushfire exposure
Source: January 2020 ANUpoll.
4 Views on the Commonwealth Government’s handling of the bushfire crisis
One of the defining characteristics of the most recent bushfire season is the criticism received by the Prime Minister Scott Morrison in particular, and the Commonwealth Government in general. This is in contrast to previous national crises in Australia or abroad where support for leaders and the party in power often grows (Gillman 2010). The response to the 2019/20 bushfires is, however, closer to the criticism of President George W. Bush during and after Hurricane Katrina, with Boin, HART et al. (2010) concluding that ‘President George W. Bush received most of the blame for the slow and ineffective response. His attempts to deflect blame (from the ‘unforseeability’ of the levees being breached through to the failings of state and city officials) only made things worse, creating the impression of an out-of-touch and insensitive president.’
Some of this criticism reflects dissatisfaction with the way in which the Government has handled the causes of the fires or the things that make them more likely (including climate change, but also hazard reduction). However, there has also been criticism of the way the Government handled the fires once they had started, including the decision by the Prime Minister to take and continue (before cutting short by a day) a holiday in Hawaii. This dissatisfaction is reflected in the ANUpoll data through both direct and indirect questions.
60.5
53.7
69.7
56.6
69.2
68.0
70.7
68.5
0.0 10.0 20.0 30.0 40.0 50.0 60.0 70.0 80.0
No direct exposure
Direct exposure
No indirect exposure
Indirect exposure
Satisfaction with country (per cent) Life satisfaction (0-100)

Bushfire exposure and impacts
14 The Australian National University Centre for Social Research and Methods
4.1 Government handling of the bushfires
Directly, we asked half the sample ‘Now thinking about the performance of Scott Morrison during the spring and summer bushfires, how good or bad a job do you think the Government has done. Would you say a…?’, with the options being 1) Very good job 2) Good job 3) Bad job 4) Very bad job. For the other half of the sample, we asked ‘Now thinking about the performance of the Government in Canberra during the spring and summer bushfires, how good or bad a job do you think the Government has done. Would you say a…?’, with the same response options.
When prompted to think about Prime Minister Scott Morrison specifically, 36.4 per cent of adults Australians thought the Government had done a very bad job, and a further 28.1 per cent though the Government had done a bad job (64.5 per cent disapproval). Only 7.5 per cent thought the Government had done a very good job when prompted to think about Prime Minister Scott Morrison.
When prompted to think about the Government in general, 29.8 per cent thought the Government had done a very bad job and 29.6 per cent thought the Government had done a bad job (59.4 per cent disapproval). Only 8.4 per cent thought the Government did a very good job (when not prompted to think about the Prime Minister).
The differences in disapproval based on whether the question specifically refers to Prime Minister Scott Morrison are statistically significant. However, both are significantly and substantially larger than 50 per cent, showing that there was quite strong disapproval for the Government’s handling of the bushfires, with particular disapproval for Scott Morrison.
There were large differences in the disapproval of the Government, depending on the person’s self-reported exposure to the bushfires. However, the direction and significance of this difference depends on whether the question was framed around Scott Morrison, or whether it was framed around the Government more generally, as well as whether we look at differences by direct or indirect exposure.10 The relationship is complicated.
As shown in Figure 3, those who had direct exposure to the bushfires were slightly less likely to disapprove of the job the Government has done than those who did not report direct exposure, but this difference was not statistically significant.
Regardless of the framing of the question, there were quite large differences in approval by indirect or secondary exposure. Specifically, when framed around the Government in general, 61.8 per cent of those who reported indirect exposure thought the Government has done a bad or very bad job, compared to 50.7 per cent of those who did not report indirect exposure (a 11.1 percentage point difference). When framed around Scott Morrison, on the other hand, 67.4 per cent of those who reported indirect exposure though that the Government has done a bad or very bad job compared to 54.4 per cent of those who didn’t report indirect exposure (a 12.9 percentage point difference).
10 The bivariate differences (or lack thereof) summarised in Figure 3 hold when included in a multivariate model, controlling for demographic, socioeconomic and geographic characteristics.

Bushfire exposure and impacts
15 The Australian National University Centre for Social Research and Methods
Figure 3 Disapproval of Government by exposure
Source: January 2020 ANUpoll.
4.2 Confidence in institutions
At the start of the survey (and prior to asking about bushfire exposure) we asked respondents ‘How much confidence do you have in the following institutions…?’ with five institutions asked about11, and response options being A great deal of confidence; Quite a lot of confidence; Not very much confidence; and None at all. One of the institutions that we asked about was ‘The Federal Government in Canberra.’
One of the more urgent issues being analysed within the field of political science (and the social sciences in general) is decline in trust or confidence in government. The long-running Australian Election Study has shown that confidence in the Federal Government has declined substantially over the last few decades (Cameron and McAllister 2019). Other data has shown that low rates of trust are associated with lower rates of democratic participation (Lee and Schachter 2019). Crises like the 2019/20 spring and summer bushfires have the potential to restore some of this trust, if dealt with effectively and transparently. However, the effect appears to have been in the opposite direction.
Figure 4 shows (through the first grey bar) that only 27.3 per cent of respondents reported that they were confident or very confident in the Government, the lowest out of all five institutions we asked about. This was a decline by 10.9 percentage points from the last time we asked this question (in October 2019 the hollow bars), a difference that was statistically significant at any sensible level of significance, and almost unprecedented in scale given the very short time difference between the two surveys.
Looking at the remainder of the January 2020 results, respondents were more confident in State/Territory governments (40.4 per cent), the public service (48.8 per cent), and the police 11 The order in which the institutions were given was randomised.
59.3
64.5
59.9
55.9
65.3
60.0
50.7
61.8
54.4
67.4
0.0 10.0 20.0 30.0 40.0 50.0 60.0 70.0 80.0
Total - Government
Total - Scott Morrison
No direct exposure - Government
Direct exposure - Government
No direct exposure - Scott Morrison
Direct exposure - Scott Morrison
No indirect exposure - Government
Indirect exposure - Government
No indirect exposure - Scott Morrison
Indirect exposure - Scott Morrison
Per cent who think the government has done a bad or very bad job

Bushfire exposure and impacts
16 The Australian National University Centre for Social Research and Methods
(73.8 per cent). The highest level of confidence is ‘Organisations responsible for firefighting in regional or rural areas’ (92.5 per cent).12
Of the other two institutions that we had asked about in October (the public service and the police), there was a small decline in both, (by 3.3 percentage points and 2.0 percentage points respectively). Neither of these two changes, however, were outside of the relevant confidence intervals or statistically significant at the 5 per cent level of significance. While it is not possible to attribute this change directly to the bushfires, it is clear that confidence in the Federal Government has declined quite substantially over the spring/summer, and that this is not just because confidence in all institutions has declined (as shown by relatively the constant views in the other two institutions).
Figure 4 Confidence in institutions, January 2020 and October 2019
Source: January 2020 and October 2019 ANUpolls.
4.3 Voting intentions
Ultimately, the most important measure from a political party’s point of view is who someone is likely to vote for. As mentioned earlier, for the first time since prior to the May 2019 election the Labor party was ahead in two party preferred terms in Newspoll, and ‘If an election was held today, [a] +3.53 swing towards Labor.’13 In all ANUpolls, we ask respondents ‘If a Federal Election for the House of Representatives was held today, which one of the following parties would you vote for?’ with Liberal; Nationals; Labor; and Greens as pre-coded options (as well as Liberal National Party in Queensland), and respondents able to specify other parties or report that they do not know or are not sure.
12 When asked about firefighting in regional rural areas, the following examples were given: Rural Fire Service, Country Fire Authority, Country Fire Service, and Bush Fire Brigades. 13 https://www.theaustralian.com.au/nation/newspoll
27.3
48.8
73.8
40.4
92.5
38.2
52.1
75.8
0.0 20.0 40.0 60.0 80.0 100.0
The Federal Government in Canberra
The public service
The police
The State / Territory Government where you live
Organisations responsible for firefight ing in regional or rural areas
Per cent who are confident or very confident in the institution
January 2020 ANUpoll October 2019 ANUpol l

Bushfire exposure and impacts
17 The Australian National University Centre for Social Research and Methods
Figure 5 gives the per cent of people who said they would vote for five party groupings when asked in January 2020 including the ‘Don’t know’ category (hollow bars), as well as in October 2019 (the grey bars). Although we do not ask for second or later preferences and do not allocate minor parties to obtain a two-party preferred comparison, comparing the cross-sectional results in October 2019 and January 2020 shows a significant and substantial decline in the per cent of people who would vote for the Coalition if an election was held that day, from 40.4 per cent to 34.8 per cent. It would appear that a very large proportion of that decline was picked up by ‘Other’ parties, but there were also small increases in the proportion of people who said they would vote Labor and the Greens, albeit increases that were not statistically significant.
Figure 5 Voting intention – October 2019 and January 2020
Source: January 2020 and October 2019 ANUpolls.
One of the characteristics that feeds into voting intentions is views on Party Leaders. In the January 2020 poll, respondents were also asked directly about their views on Party Leaders, with the specific question being ‘What do you think of the party leaders? For each party leader, please rate them on a scale from 0 to 10, where 0 means you strongly dislike that leader and 10 means that you strongly like that leader.’ For Scott Morrison, the average score was 3.92 out of 10, indicating a net negative view of the Prime Minister. This was a significant and substantial decline from 5.25 when the question was asked in June 2019 (McAllister 2019) (McAllister et al. 2019). For the Leader of the Opposition Anthony Albanese, on the other hand, the average score in January 2020 was 4.93, a figure that was not significantly different from that immediately after the May 2019 election when Mr Albanese first took on the role of Opposition Leader (4.87).
The June 2019 survey took place immediately after the 2019 Federal Election, which was won by the Coalition despite being behind in the polls leading up to the Election. Scott Morrison had only been Prime Minister for a relatively short period of time at that stage, and a number
34.8
33.4
14.7
10.5
4.9
40.4
32.0
13.7
8.8
3.5
0.0 5.0 10.0 15.0 20.0 25.0 30.0 35.0 40.0 45.0 50.0
Coalition
Labor
Greens
Other' party
Don't know
Per cent who would vote for particular party if election held on day of interview
January 2020 October 2019

Bushfire exposure and impacts
18 The Australian National University Centre for Social Research and Methods
of other things have occurred since then that may have led to a decline in views towards the Prime Minister. It is not possible, therefore, to directly attribute the decline in support to the Bushfires alone. However, given the size of the decline, the significant criticism that has taken place of the Prime Minister, and the consistent views towards the Opposition Leader, it is likely that some of the decline in support is attributable to the Prime Minister’s handling of the bushfires.
5 Views on the environment There is significant debate about the specific contribution of different causes to the spring/summer bushfire crises, including the role of arson and hazard reduction.14 There is a very strong scientific consensus though that climate change or global warming/heating is making such events more likely, last longer, and more intense (IPCC 2014). This is not only because of the direct effect of high temperatures on combustibility during the fire season, but also because of the difficulties of hazard reduction during hotter than average years and the decreased moisture due to prolonged drought (Garnaut 2019).
We asked a number of questions related to the environment in the January 2020 ANUpoll, some of which were repeated from recent surveys, with others repeated from much earlier surveys. In every ANUpoll, we ask respondents ‘What do you think is the most important problem facing Australia today?’, with a follow-up question of ‘And, what do you think is the second most important problem facing Australia today?’ These are coded to 37 possible options, held consistent through time, with a final coded category for ‘other’.
Using this consistent coding, 49.7 per cent of Australian adults were estimated to think that one of three environmental issues were the most or the second most important issue facing Australia.15 This was a significant and substantial increase from October 2019, when only 41.5 per cent of respondents thought the environment was the most or second most important issue. In January 2020, however, there was a dramatic increase in the number of people who could not be coded in one of the pre-existing categories, with many of these reporting issues related to bushfires, natural disasters or extreme weather. When these responses are combined with the existing environmental codes, 59.9 per cent of Australians were estimated to have thought that environmental issues or issues related to bushfires were the most or second most important currently facing Australia.
It should of course be kept in mind that two people can both think that environmental issues or bushfires are important issues, and yet disagree on why they are issues or what the response should be. For example, one verbatim response for the first most important issue was ‘The bushfire crisis and not taking enough action on climate change.’ However, another verbatim response was ‘The Greenies. Not letting the cattle and the horses eat the grass to stop these fires.’ Clearly, we should not assume that people who think environmental issues or bushfires are important are going to be for particular pro-environment policies.
In addition to the questions about most important issues, we asked a number of explicit questions about environmental issues. First, we asked the following question: ‘We are now going to ask you some questions about the environment. How serious do you consider each of the following to be for Australia?’, with the following eight potential environmental issues:
14 https://www.abc.net.au/news/2020-01-11/australias-fires-reveal-arson-not-a-major-cause/11855022 15 The specific coded categories were: Environment / global warming; Water management; or Carbon Tax.

Bushfire exposure and impacts
19 The Australian National University Centre for Social Research and Methods
a) Global warming or the greenhouse effect b) Loss of native vegetation or animal species or biodiversity c) Degradation of rivers, lakes and oceans d) Soil salinity and erosion e) Environmental damage resulting from logging of native forests f) Drought and drying g) Bushfires h) Tropical cyclones
We provided four potential response options – very serious; somewhat serious; not very serious; and not serious at all. Combining the first two response options, all of the potential issues were rated as being somewhat or very serious by more than three quarters of the population, ranging from 78.6 per cent for tropical cyclones to 98.2 per cent for drought and drying. Clearly, environmental issues are very salient for a very large proportion of Australians. There is, however, more variation in the proportion of people who thought the issues were very serious. Furthermore, by looking at the very serious category only, we are able to make comparisons for the first six of the environmental issues with when the question was last asked in the September 2008 ANUpoll (McAllister 2008), as shown in Figure 6.
For all issues that were asked in both 2008 and 2020, apart from soil salinity and erosion, there has been an increase in the proportion of people who think that the particular environmental issues are very serious, though not all of these changes are statistically significant. The two biggest percentage point increases were for loss of native vegetation or animal species or biodiversity (a 13.0 percentage point increase) and drought and drying (a 9.0 percentage point increase). Both of these may have been exacerbated or made more salient by the bushfires.

Bushfire exposure and impacts
20 The Australian National University Centre for Social Research and Methods
Figure 6 Per cent of population who think specific environmental issues are very serious – January 2020 and September 2008
Source: January 2020 and October 2019 ANUpolls.
There were no significant differences in belief in the seriousness of any of the environmental issues between those who reported direct exposure to the bushfires and those who did not. There were, however, large differences between those who reported indirect exposure and those who did not, with the former tending to be far more likely to feel that the environmental issues are serious. These results hold when we control for the standard demographic, socioeconomic and geographic variables we include in Table 3.
It might seem counterintuitive that those who had the greatest, or at least most severe, exposure to the bushfires did not have as strong a view on issues related to the environment, and bushfires in particular. However, there are a number of potential explanations including pre-existing beliefs. We attempt to control for this later in the paper with the longitudinal data. There is also public debate about the link between bushfires and climate change, even if the scientific consensus is that the latter definitely increases the probability of the former. However, the fact that direct bushfire exposure is not more closely related to environmental issue salience fits in the general literature including on fear of crime and fear of terrorism that those who are most directly impacted aren’t always those who are most concerned (Ditton and Farrall 2017).
While there has only been a modest increase in the proportion of people who think that ‘global warming or the greenhouse effect’ is a serious issue, there was a much larger increase in the proportion of people who feel it will have a specific effect on them. In 2008, respondents were asked ‘Do you think that global warming will pose a serious threat to you or your way of life in your lifetime?’ We asked the same question of a random sample of 70 per cent of respondents in the January 2020 poll (2,269 respondents) with 72.3 per cent of those who were asked
58.8
69.0
69.9
48.7
50.5
82.0
82.0
27.3
56.0
56.0
69.0
56.0
48.0
73.0
0.0 10.0 20.0 30.0 40.0 50.0 60.0 70.0 80.0 90.0
Global warming or the greenhouse effect
Loss of native vegetation or animal species or biodiversity
Degradation of rivers, lakes and oceans
Soil salinity and erosion
Environmental damage resulting from logging of native forests
Drought and drying
Bushfires
Tropical cyclones
Per cent of adult Australians who think issue is very serious
January 2020 September 2008

Bushfire exposure and impacts
21 The Australian National University Centre for Social Research and Methods
saying that global warming posed a very serious or fairly serious threat, a very large increase from the 56 per cent of respondents who said so in 2008.16 The biggest increase was for those who said it was a very serious threat, increasing from 20 per cent in 2008 to 33.0 per cent in 2020.
While not directly related to bushfires, there are many who argue that Australia needs to reduce the level of coal mining and therefore coal mines, in order to decrease CO2 emissions (including through coal that is exported) and slow the rate of temperature increase, which is directly related to bushfire activity. The January 2020 ANUpoll asked respondents ‘In your opinion, should the Government allow the opening of new coal mines?’ with only 37.0 per cent of respondents answering certainly yes or probably yes. This was a significant and substantial decline from 45.3 per cent of respondents who answered yes when the same question was asked in June 2019, immediately following the 2019 Australian Federal Election (McAllister 2019).
At the start of the bushfire season and before the eventual scale and level of destruction was reached, there was considerable heated debates between politicians and across the media about the extent to which concern with regards to climate change and its impact on bushfires was shared by those outside of the most urban parts of the country. This was exemplified in November 2019 with the Deputy Prime Minister and leader of the National Party of Australia stating that climate change concerns were an exclusive focus of ‘inner-city raving lunatics’ and that ‘We've had fires in Australia since time began, and what people need now is a little bit of sympathy, understanding and real assistance - they need help, they need shelter.’17
There are clearly differences in views towards the environment and mining by geography in Australia with those in non-capital cities less likely to see global warming/climate change as an issue or threat, and more supportive of new coal mines. However, the data from the January 2020 ANUpoll suggests that these differences are a matter of degrees, rather than direction.
While a capital city/non-capital city comparison is not always the best split by geography (there are highly urban non-capital cities like Newcastle and Geelong, or relatively remote capital cities like Darwin), it is one binary measure to split the population by geography. As shown in Figure 7, of the three main environmental questions we asked in the January ANUpoll, the majority of respondents in non-capital cities have the same view as the majority of respondents in capital cities. Specifically, more than half of those who live in non-capital cities think that global warming or the greenhouse effect is very serious, almost two-thirds think global warming will be a threat to them, and only two-fifths think that there should be new coal mines.
16 Of the remainder of the sample, 15 per cent were asked about ‘climate change’ rather than ‘global warming’, with 73.8 per cent saying that it was a fairly or very serious threat. The other 15 per cent were asked about ‘global heating’ rather ‘global warming’, with 67.3 per cent saying it was a fairly or very serious threat. This is an important area of ongoing research on how framing effects views. It would appear that, counter to expectations (and counter to the practice of the broadly pro-climate action media organisation The Guardian) that changing the language from ‘global warming’ to ‘global heating’ may, at least in the short term, have the opposite effect of what is intended. 17 https://www.smh.com.au/politics/federal/raving-inner-city-lunatics-michael-mccormack-dismisses-link-between-climate-change-and-bushfires-20191111-p539ap.html

Bushfire exposure and impacts
22 The Australian National University Centre for Social Research and Methods
Figure 7 Views on the environment by capital/non-capital city
Source: January 2020 ANUpoll.
6 Analysis of individual-level change in wellbeing and attitudes The previous sections have documented a number of changes in attitudes and beliefs from when similar questions were asked in previous surveys, as well as differences in these attitudes and beliefs depending on a person’s reported exposure to bushfires in the 2019/20 Australian spring and summer. It is difficult to attribute all or any of this change or variation to the bushfires, as many other things also occurred between surveys that are likely to have impacted on attitudes. Furthermore, exposure is not a completely exogenous event, and some of the things that predict exposure (particularly the more subjective, indirect measures) may also predict attitudes and beliefs.
It is not possible to control for some of these pre-exposure measures when looking at longer term change (i.e. those questions that were last asked in 2008) as the individuals who completed those surveys are highly unlikely to be the same individuals who completed the January 2020 survey, due to repeated sampling. However, as the more recent surveys were undertaken on Life in AustraliaTM it is possible to link individual responses for the subset of the sample that completed multiple waves. With this linked sample, explained in more detail at the end of this paper, we first look at the longitudinal determinants of bushfire exposure (Section 6.1). This is followed by analysis of change in wellbeing measures and views on the direction of the country (6.2), then political views (6.3) with the final sub-section (6.4) looking at changes in attitudes towards environmental issues.
62.0
74.9
35.6
52.0
65.5
40.1
0.0 10.0 20.0 30.0 40.0 50.0 60.0 70.0 80.0 90.0
Global warming or the greenhouse effect very serious
Global warming a threat
Supports new coal mines
Capital city Non-Capital city

Bushfire exposure and impacts
23 The Australian National University Centre for Social Research and Methods
6.1 Longitudinal predictors of exposure
Earlier in this paper, we looked at the factors that predict whether or not a person reported that they were exposed in different ways to the 2019/20 spring and summer Bushfires. We showed that there were very few demographic, socioeconomic and geographic measures that predicted direct exposure. The only exception was living outside of a capital city. There were, however, a larger subset of variables that were highly predictive of indirect or secondary exposure, including sex, age, education, and the socioeconomic characteristics of the area in which a person lives. It is improbable that these measures were affected by bushfire exposure. There may, however, be other variables that were associated with these measures that may predict exposure.
One way to get closer to being able to infer a causal relationship is by controlling for a broader range of predictor variables, as observed prior to exposure. While this won’t prove causality, it will give some indication as to the temporal nature of the association. We analysed the relationship between three variables as observed in October 2019 and reported bushfire exposure in January 2020 – life satisfaction, confidence in government, and satisfaction with the direction of the country. This association was analysed using a lagged independent variable model, where we also controlled for the demographic, socioeconomic, and demographic measures presented in Table 3, but observed in October 2019.
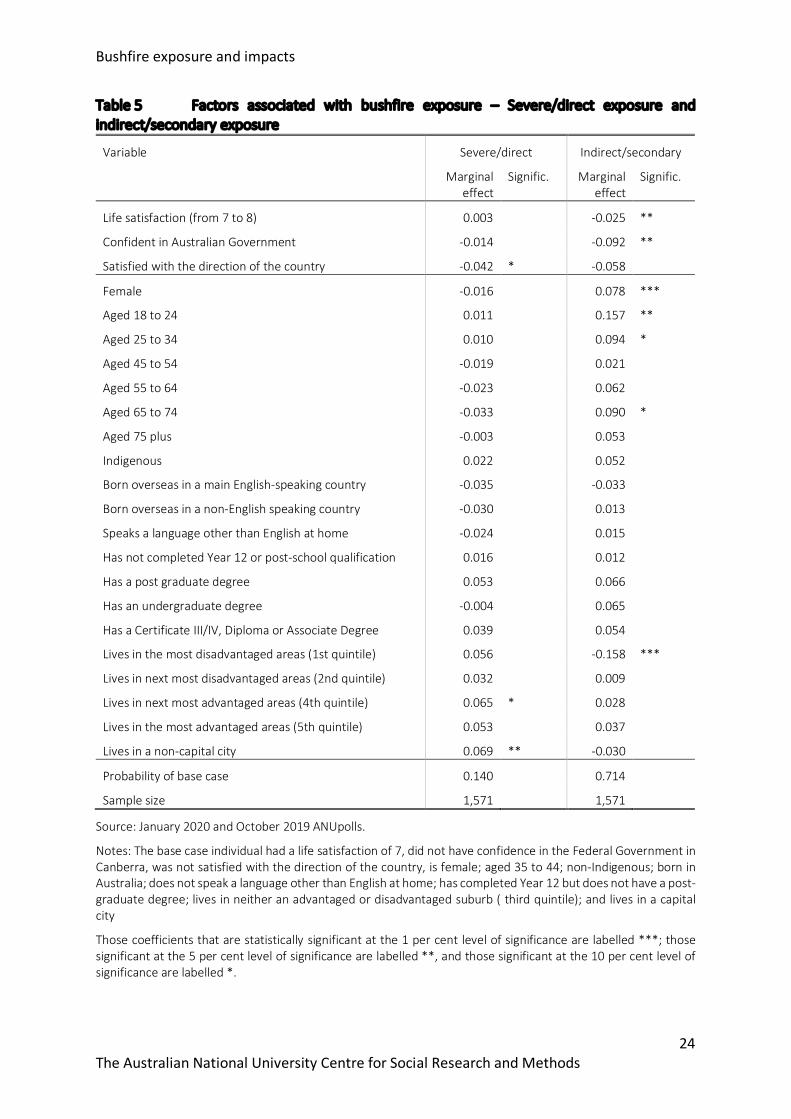
Table 5 shows that there were no substantial changes in the predictors of severe or indirect exposure once Wave 31 (October 2019) characteristics were controlled for. There was however a weak association with one of the subjective measures, with those who were satisfied with the direction of the country slightly less likely to report direct exposure (p-value = 0.061). There was no association with the other two measures though, once again highlighting that direct bushfire exposure was a largely exogenous event, or truly random with respect to individual’s demographic and social backgrounds.
There was, however, a far stronger association between the subjective measures observed in October 2019 and the indirect/secondary bushfire exposure measure observed in January 2020. Specifically, those individuals who had higher life satisfaction and were more confident in the Federal Government were less likely to report secondary/indirect exposure (p-value of 0.024 and 0.015 respectively), with weak evidence that those who were more satisfied with the direction of the country were also less likely to report direct exposure (p-value = 0.128).
Bushfire exposure and impacts
24 The Australian National University Centre for Social Research and Methods
Table 5 Factors associated with bushfire exposure – Severe/direct exposure and indirect/secondary exposure
Variable Severe/direct Indirect/secondary
Marginal effect
Signific. Marginal effect
Signific.
Life satisfaction (from 7 to 8) 0.003 -0.025 **
Confident in Australian Government -0.014 -0.092 **
Satisfied with the direction of the country -0.042 * -0.058
Female -0.016 0.078 ***
Aged 18 to 24 0.011 0.157 **
Aged 25 to 34 0.010 0.094 *
Aged 45 to 54 -0.019 0.021
Aged 55 to 64 -0.023 0.062
Aged 65 to 74 -0.033 0.090 *
Aged 75 plus -0.003 0.053
Indigenous 0.022 0.052
Born overseas in a main English-speaking country -0.035 -0.033
Born overseas in a non-English speaking country -0.030 0.013
Speaks a language other than English at home -0.024 0.015
Has not completed Year 12 or post-school qualification 0.016 0.012
Has a post graduate degree 0.053 0.066
Has an undergraduate degree -0.004 0.065
Has a Certificate III/IV, Diploma or Associate Degree 0.039 0.054
Lives in the most disadvantaged areas (1st quintile) 0.056 -0.158 ***
Lives in next most disadvantaged areas (2nd quintile) 0.032 0.009
Lives in next most advantaged areas (4th quintile) 0.065 * 0.028
Lives in the most advantaged areas (5th quintile) 0.053 0.037
Lives in a non-capital city 0.069 ** -0.030
Probability of base case 0.140 0.714
Sample size 1,571 1,571
Source: January 2020 and October 2019 ANUpolls.
Notes: The base case individual had a life satisfaction of 7, did not have confidence in the Federal Government in Canberra, was not satisfied with the direction of the country, is female; aged 35 to 44; non-Indigenous; born in Australia; does not speak a language other than English at home; has completed Year 12 but does not have a post-graduate degree; lives in neither an advantaged or disadvantaged suburb ( third quintile); and lives in a capital city
Those coefficients that are statistically significant at the 1 per cent level of significance are labelled ***; those significant at the 5 per cent level of significance are labelled **, and those significant at the 10 per cent level of significance are labelled *.

Bushfire exposure and impacts
25 The Australian National University Centre for Social Research and Methods
6.2 Relationship between bushfire exposure and changes in satisfaction and confidence
One of the other benefits of having access to longitudinal data is that we can look at how bushfire exposure predicts changes in satisfaction (with one’s own life and the direction of the country) or confidence in institutions, whilst holding constant pre-existing views. That is, rather than using these variables as observed in October 2019 to predict bushfire exposure, we use bushfire exposure to predict change in the subjective measures. This is still not quite a causal relationship, as there may be other characteristics that changed at the same time as bushfire exposure that are driving the change in satisfaction or confidence. Nonetheless, it does allow us to abstract from (or hold constant) the relationship between pre-existing attitudes and exposure documented in Table 5.
To analyse the relationship with change through time, we estimate a number of different models (five in total), depending on the nature of the main variable of interest. Specifically:
• Model 1 – We look at the relationship between bushfire exposure and life satisfaction in January 2020, holding constant life satisfaction at baseline, as well as demographic, socioeconomic, and geographic variables.
• Models 2 and 3 – We look at the relationship between bushfire exposure and the probability of being satisfied with the direction of the country separately for those who were not satisfied with the direction in October 2019 (Model 2) and those who were satisfied with the direction (Model 3), holding constant demographic, socioeconomic, and geographic variables.
• Models 4 and 5 – We look at the relationship between bushfire exposure and the probability of being confident in the Federal Government separately for those who were not confident in October 2019 (Model 4) and those who were confident (Model 5), holding constant demographic, socioeconomic, and geographic variables.
Beginning with life satisfaction, there was no statistically significant difference in the change in life satisfaction between October and January between those who reported either direct or indirect exposure to bushfires and those who did not. There was a very large proportion of respondents (60.5 per cent) whose life satisfaction was different in January 2020 compared to October 2019. This change, however, did not appear to be influenced by exposure to bushfires.
These results do not mean that changes in life satisfaction were not influenced by the bushfires, as the repeated cross-sectional analysis did show a significant decline over the period. Rather, the results imply that the bushfires either do not appear to have had a greater effect on this change in satisfaction for those who had direct or indirect exposure (as opposed to simply living in Australia during a time of national emergency) or there were other factors that were driving that change separate to the bushfires. Unfortunately, it is not possible to separately identify the potential effects with the data available (or any other conceivable dataset).
There was, however, a strong association between exposure to the bushfires and change in confidence in government, and a weaker association with change in satisfaction with the direction of the country (Table 6 and Table 7). Specifically, when we separate the longitudinal respondents into those who were and were not satisfied with the direction of the country in October 2019, there was an association between indirect bushfire exposure between the two periods and satisfaction in January 2020. This difference was relatively weak for those who

Bushfire exposure and impacts
26 The Australian National University Centre for Social Research and Methods
were not satisfied in October (p-value = 0.128), but stronger for those who were satisfied (p-value = 0.045). There was a weak relationship with the measure of direct exposure for those who were satisfied in October 2019, with those reporting direct exposure being more likely to report satisfaction again in January 2020 (p-value = 0.091).
While these results hold using a modelling approach, the unconditional differences highlight the size of the association. Specifically, with regards to those satisfied in 2019, only 78.3 per cent of those who were indirectly exposed to bushfires reported satisfaction in 2020 compared to 84.9 per cent of those who were not exposed. The raw difference was greater for those who were not satisfied in 2019 – 19.0 per cent satisfaction for those indirectly exposed to bushfires compared to 30.8 per cent for those not exposed.
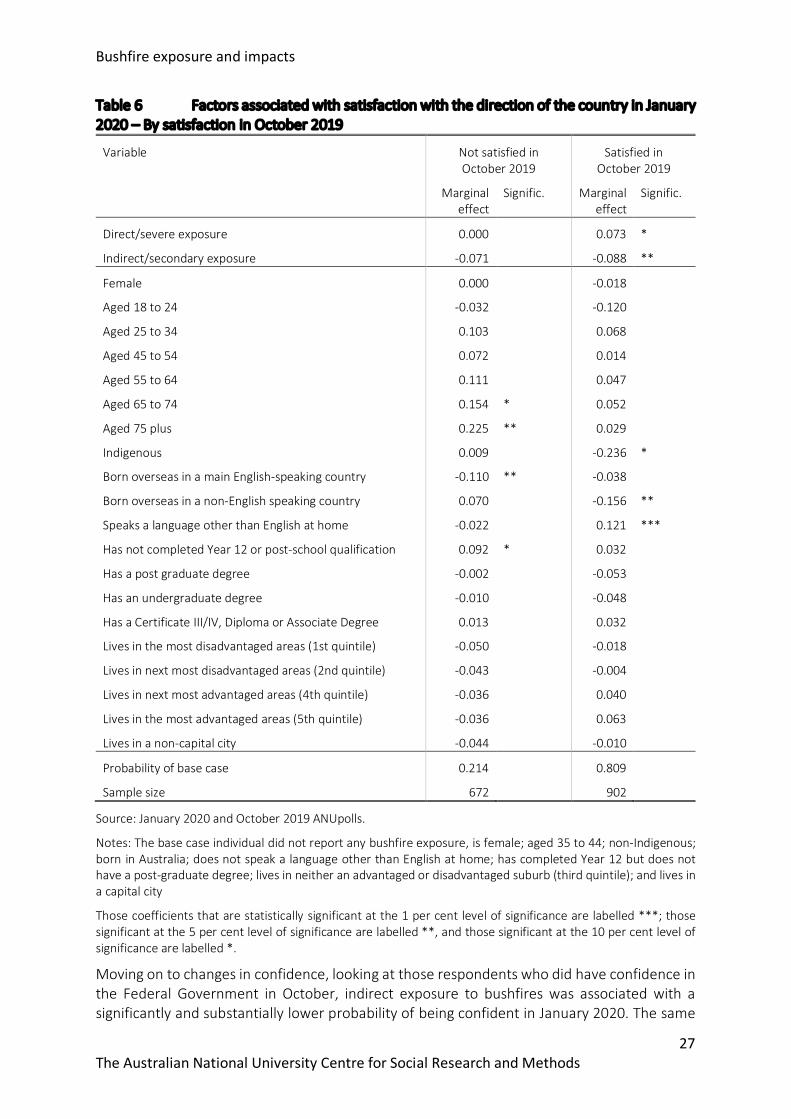
Bushfire exposure and impacts
27 The Australian National University Centre for Social Research and Methods
Table 6 Factors associated with satisfaction with the direction of the country in January 2020 – By satisfaction in October 2019
Variable Not satisfied in October 2019
Satisfied in October 2019
Marginal effect
Signific. Marginal effect
Signific.
Direct/severe exposure 0.000 0.073 *
Indirect/secondary exposure -0.071 -0.088 **
Female 0.000 -0.018
Aged 18 to 24 -0.032 -0.120
Aged 25 to 34 0.103 0.068
Aged 45 to 54 0.072 0.014
Aged 55 to 64 0.111 0.047
Aged 65 to 74 0.154 * 0.052
Aged 75 plus 0.225 ** 0.029
Indigenous 0.009 -0.236 *
Born overseas in a main English-speaking country -0.110 ** -0.038
Born overseas in a non-English speaking country 0.070 -0.156 **
Speaks a language other than English at home -0.022 0.121 ***
Has not completed Year 12 or post-school qualification 0.092 * 0.032
Has a post graduate degree -0.002 -0.053
Has an undergraduate degree -0.010 -0.048
Has a Certificate III/IV, Diploma or Associate Degree 0.013 0.032
Lives in the most disadvantaged areas (1st quintile) -0.050 -0.018
Lives in next most disadvantaged areas (2nd quintile) -0.043 -0.004
Lives in next most advantaged areas (4th quintile) -0.036 0.040
Lives in the most advantaged areas (5th quintile) -0.036 0.063
Lives in a non-capital city -0.044 -0.010
Probability of base case 0.214 0.809
Sample size 672 902
Source: January 2020 and October 2019 ANUpolls.
Notes: The base case individual did not report any bushfire exposure, is female; aged 35 to 44; non-Indigenous; born in Australia; does not speak a language other than English at home; has completed Year 12 but does not have a post-graduate degree; lives in neither an advantaged or disadvantaged suburb (third quintile); and lives in a capital city
Those coefficients that are statistically significant at the 1 per cent level of significance are labelled ***; those significant at the 5 per cent level of significance are labelled **, and those significant at the 10 per cent level of significance are labelled *.
Moving on to changes in confidence, looking at those respondents who did have confidence in the Federal Government in October, indirect exposure to bushfires was associated with a significantly and substantially lower probability of being confident in January 2020. The same

Bushfire exposure and impacts
28 The Australian National University Centre for Social Research and Methods
was true for those who did not have confidence in the Federal Government in October. There was not, however, any association with direct exposure to bushfires and confidence in the government.
Once again, the scale of the difference is highlighted by the unconditional differences (that is, percentage differences without controlling for observed characteristics). Looking at those who were confident in 2019, only 57.4 per cent of those who reported indirect exposure to the bushfires reported confidence in the Federal Government in 2020 compared to 68.7 per cent of those who were not exposed. There was an even larger difference again for those who started out not confident in 2019 – 6.1 per cent confidence in January 2020 for those exposed compared to 19.2 per cent confidence for those not exposed.

Bushfire exposure and impacts
29 The Australian National University Centre for Social Research and Methods
Table 7 Factors associated with Confidence in the Federal Government in January 2020 – By confidence in October 2019
Variable Not confident in October 2019
Confident in October 2019
Marginal effect
Signific. Marginal effect
Signific.
Direct/severe exposure 0.021 -0.019
Indirect/secondary exposure -0.060 *** -0.104 *
Female -0.032 * -0.032
Aged 18 to 24 0.002 -0.304 *
Aged 25 to 34 0.057 -0.260 **
Aged 45 to 54 0.035 0.051
Aged 55 to 64 0.038 -0.036
Aged 65 to 74 0.085 0.116
Aged 75 plus 0.073 0.073
Indigenous 0.030 -0.228
Born overseas in a main English-speaking country 0.004 -0.029
Born overseas in a non-English speaking country 0.015 0.041
Speaks a language other than English at home 0.100 ** 0.014
Has not completed Year 12 or post-school qualification 0.021 -0.008
Has a post graduate degree -0.065 *** 0.078
Has an undergraduate degree 0.006 -0.062
Has a Certificate III/IV, Diploma or Associate Degree 0.030 0.010
Lives in the most disadvantaged areas (1st quintile) 0.051 -0.175 *
Lives in next most disadvantaged areas (2nd quintile) -0.032 -0.162 *
Lives in next most advantaged areas (4th quintile) -0.005 -0.011
Lives in the most advantaged areas (5th quintile) 0.053 -0.025
Lives in a non-capital city 0.031 0.045
Probability of base case 0.080 0.763
Sample size 1,031 539
Source: January 2020 and October 2019 ANUpolls.
Notes: The base case individual did not report any bushfire exposure, is female; aged 35 to 44; non-Indigenous; born in Australia; does not speak a language other than English at home; has completed Year 12 but does not have a post-graduate degree; lives in neither an advantaged or disadvantaged suburb (third quintile); and lives in a capital city
Those coefficients that are statistically significant at the 1 per cent level of significance are labelled ***; those significant at the 5 per cent level of significance are labelled **, and those significant at the 10 per cent level of significance are labelled *.

Bushfire exposure and impacts
30 The Australian National University Centre for Social Research and Methods
6.3 Changes in voting intentions/political satisfaction and bushfire exposure
Earlier in the paper, we showed that there was a large decline in the per cent of people who said that they would have voted for the Coalition if an election was held in January 2020, relative to the per cent of people who said they would have voted for the Coalition if an election was held in October 2019. It is possible however, by linking individuals through time, to look at the factors that predict that voter change. In total, 20.2 per cent of linked respondents said that they would vote for a different party in January 2020 compared to October 2019, a similar level of intra-election voter volatility observed over similar periods using the Panel in the past.
Given the declines in the Coalition vote presented in Figure 5, it is worth focusing on changes in those who said they would vote for the Coalition in October 2019. In total, 17.7 per cent of the linked sample who said they would have voted for the Coalition in October 2019 said that they would have voted for a different party in January 2020. This is somewhat higher than the rate of voter change for those who said they would have voted Labor (15.9 per cent), but lower than the rate of change for those who said they would have voted Greens (26.5 per cent), an ‘Other’ party (24.6 per cent) or who didn’t know who they were going to vote for (47.8 per cent).
Less than half of the outflow from the Coalition went to the Labor Party though. Specifically, of those who did change from saying they were going to vote for the Coalition, 43.9 per cent said they would vote Labor in January 2020, 14.3 per cent said they would vote for the Greens, 24.7 per cent said they would vote for an ‘Other’ party, and 17.1 per cent did not know who they would vote for.
In Table 8, we look at the factors associated with changing vote from the Coalition. That is, we look at the probability of voting for one of the four other parties or party groupings in January 2020, conditional on intending to vote for the Coalition in October 2019. As there were only 618 respondents in the linked sample who said they would have voted Coalition in October, the uncertainty around the estimates is quite large. There is some weak evidence that those who were directly exposed to the bushfires were more likely to change their vote from the Coalition. However, the p-value is quite large (0.633), meaning it is not possible to make definitive conclusions.
Looking at the other demographic variables, females were more likely to change their votes from the Coalition, relative to males. There were some other categories that also had a large positive marginal effect (being relatively young, Indigenous, and born overseas), but these differences were not statistically significant. Those at the upper end of the age distribution (particularly those aged 75 years and over) were less likely to have changed their vote from the Coalition, as were those who had a degree. Perhaps the most interesting finding though is that those who live in a non-capital city were more likely to have changed their vote from the Coalition, with an estimated probability of 0.212 compared to the base case of 0.104 (all else being equal)

Bushfire exposure and impacts
31 The Australian National University Centre for Social Research and Methods
Table 8 Factors associated with changing vote from the Coalition
Variable Marginal effect
Signific.
Direct/severe exposure 0.019
Indirect/secondary exposure -0.004
Female 0.063 *
Aged 18 to 24 0.115
Aged 25 to 34 0.074
Aged 45 to 54 -0.067 **
Aged 55 to 64 -0.038
Aged 65 to 74 -0.030
Aged 75 plus -0.099 ***
Indigenous 0.092
Born overseas in a main English-speaking country 0.068
Born overseas in a non-English speaking country 0.077
Speaks a language other than English at home -0.048
Has not completed Year 12 or post-school qualification -0.004
Has a post graduate degree -0.020
Has an undergraduate degree -0.057 *
Has a Certificate III/IV, Diploma or Associate Degree -0.013
Lives in the most disadvantaged areas (1st quintile) -0.018
Lives in next most disadvantaged areas (2nd quintile) 0.082
Lives in next most advantaged areas (4th quintile) 0.102 *
Lives in the most advantaged areas (5th quintile) 0.128 **
Lives in a non-capital city 0.108 **
Probability of base case 0.104
Sample size 618
Source: January 2020 and October 2019 ANUpolls.
Notes: The base case individual did not report any bushfire exposure, is female; aged 35 to 44; non-Indigenous; born in Australia; does not speak a language other than English at home; has completed Year 12 but does not have a post-graduate degree; lives in neither an advantaged or disadvantaged suburb (third quintile); and lives in a capital city
Those coefficients that are statistically significant at the 1 per cent level of significance are labelled ***; those significant at the 5 level of significance are labelled **, and those significant at the 10 per cent level of significance are labelled *.
A very large part of the success of the Coalition government at the May 2019 election was attributed to Prime Minister Scott Morrison (Biddle 2019).18 It is not surprising then, that the shift in voting intention from the Coalition coincided with a decline in the support for the Prime 18 https://theconversation.com/coalition-wins-election-but-abbott-loses-warringah-plus-how-the-polls-got-it-so-wrong-116804
Bushfire exposure and impacts
32 The Australian National University Centre for Social Research and Methods
Minister. Using the linked sample from June 2019 to January 2020, the average decline in support for the Prime Minister was -1.19, on a scale from 0 to 10. Without controlling for other characteristics, this decline was not significantly different for those who voted for the Coalition in the May 2019 election (-1.31),19 compared to the rest of the sample (including those who voted Labor, -1.20).
A slightly different picture emerges though when we take into account where voters started from in June 2019. Specifically, in Table 9 we look at the factors associated with likeability of Prime Minister Morrison in January 2020, controlling for observed characteristics as of June 2019. As the likeability scale is bounded by 0 and 10, those who had a relatively high likeability rating for the Prime Minister in June 2019 have a greater capacity for a large negative drop between then and January 2020. On the flipside, those who had lower likeability had a greater capacity for a large positive increase in likeability. For this reason, we hold constant likeability in June 2019 in our model. In the model we focus on the relationship between both bushfire exposure and May 2019 voting patterns and likeability, as well as the association with the main demographic, socioeconomic and geographic variables. By holding constant likeability in June 2019, we are essentially estimating what predicts change in likeability over the period.
As expected, the higher a person’s likeability rating of the Prime Minister in June 2019, the greater the likeability score in January 2020. While this is not surprising, it is important to keep in mind that this relationship is held constant in the analysis.
Indirect exposure to the bushfires was associated with significantly lower likeability in January 2020 compared to June 2019. That is, if someone reported indirect exposure (friend/family damage; friend/family threatened; travel/holiday; smoke; anxious or worried) then the extent to which they reported Prime Minister Scott Morrison as likeable declined between June 2019 and January 2020, holding other characteristics constant.
While there was not any statistically significant association between direct bushfire exposure and change in likeability, the coefficient was positive and had a p-value of 0.144. That is, there is weak evidence that, if anything, those who had direct exposure to the bushfires increased their likeability rating for Prime Minister Scott Morrison, holding constant their rating in June 2019 and other demographic, socioeconomic and geographic characteristics.
Other factors that were associated with a change in likeability were age (younger people had a greater decline), country of birth (those born overseas had a greater decline), and language spoken at home (non-English speakers had a greater increase).
19 The June 2019 survey did not ask respondents who they would have voted for if an election was held that day. Rather, respondents were asked who they voted for in the election in the previous month.

Bushfire exposure and impacts
33 The Australian National University Centre for Social Research and Methods
Table 9 Factors associated with likeability of Prime Minister Scott Morrison
Variable Coefficient Signific.
Likeability in June 2019 0.706 ***
Direct/severe exposure 0.241
Indirect/secondary exposure -0.541 ***
Female -0.044
Aged 18 to 24 -0.455
Aged 25 to 34 -0.643 **
Aged 45 to 54 0.306
Aged 55 to 64 0.268
Aged 65 to 74 0.595 **
Aged 75 plus 0.842 ***
Indigenous -0.428
Born overseas in a main English-speaking country -0.226
Born overseas in a non-English speaking country -0.433 **
Speaks a language other than English at home 0.575 **
Has not completed Year 12 or post-school qualification -0.029
Has a post graduate degree -0.076
Has an undergraduate degree -0.070
Has a Certificate III/IV, Diploma or Associate Degree 0.029
Lives in the most disadvantaged areas (1st quintile) -0.012
Lives in next most disadvantaged areas (2nd quintile) 0.158
Lives in next most advantaged areas (4th quintile) 0.308
Lives in the most advantaged areas (5th quintile) 0.106
Lives in a non-capital city -0.058
Constant 0.569
Sample size 1,659
R-Squared 0.5988
Source: January 2020 ANUpoll and June 2019 Comparative Study of Electoral Systems.
Notes: The base case individual did not report any bushfire exposure, is female; aged 35 to 44; non-Indigenous; born in Australia; does not speak a language other than English at home; has completed Year 12 but does not have a post-graduate degree; lives in neither an advantaged or disadvantaged suburb ( third quintile); and lives in a capital city
Those coefficients that are statistically significant at the 1 per cent level of significance are labelled ***; those significant at the 5 per cent level of significance are labelled **, and those significant at the 10 per cent level of significance are labelled *.
6.4 Changes in environmental attitudes and bushfire exposure.
A consistent finding with regards to research on views towards climate change is that attitudes are shaped as much or even more by political preference, as voting patterns are shaped by views on climate change. This was summarised well by Matthew Yglesias writing for Vox (albeit

Bushfire exposure and impacts
34 The Australian National University Centre for Social Research and Methods
in the US)20, who concluded that ‘For practical purposes, most of what you need to know about people’s beliefs on climate change you can glean from their partisan affiliation.’
While this is a reasonably depressing view of how people make judgements on such a serious issue as climate change, the repeated cross-sectional data presented earlier in this paper shows that views can change over the short or long term. Furthermore, there is a small but growing body of literature that suggests that exposure to extreme natural events (like that documented in this paper) can shift views, albeit mostly in the short term (Konisky, Hughes et al. 2016, Ray, Hughes et al. 2017).
In a review article, Howe, Marlon et al. (2019) concluded that they ‘find mixed evidence that weather shapes climate opinions. Although there is some support for a weak effect of local temperature and extreme weather events on climate opinion, the heterogeneity of independent variables, dependent variables, study populations, and research designs complicate systematic comparison.’ While a detailed analysis of the effects of extreme weather (in this case bushfires) is beyond the scope of this initial summary paper, we are able to make an initial contribution to the literature by filling two of the gaps identified in , Howe, Marlon et al. (2019) – analysing a population outside the US, and making use of longitudinal data.
The two environmental measures that we have longitudinal data for are whether the environment is seen as the most or second most important issue, and views on coal mines. Beginning with issue salience, Table 10 looks at the probability of reporting that the environment was the most important or second most important issue facing Australia in January 2020, analysed separately by views in October 2019.21 There was no association between direct exposure and change in views. There was, however, a significant association with indirect exposure with those who reported indirect exposure being more likely to report that they thought the environment was the most or second most important issue, holding constant their views in October 2019. Females, and the relatively young (particularly under 35) were more likely to change from the environment not being seen to be a major issue to seeing it as a major issue.
20 https://www.vox.com/science-and-health/2017/3/23/15032488/climate-beliefs-2016-election-votes 21 The main results hold when we combine those who think that the fires, natural events or extreme weather were the main issues in addition to those who thought the environment were the main issues.

Bushfire exposure and impacts
35 The Australian National University Centre for Social Research and Methods
Table 10 Factors associated with whether environment seen as important issue in January 2020 – By views in October 2019
Variable Not major issue in October 2019
Major issue in October 2019
Marginal effect
Signific. Marginal effect
Signific.
Direct/severe exposure 0.025 -0.060
Indirect/secondary exposure 0.087 *** 0.123 ***
Female 0.074 *** 0.033
Aged 18 to 24 0.143 * 0.006
Aged 25 to 34 0.160 ** 0.022
Aged 45 to 54 0.096 ** -0.073
Aged 55 to 64 0.071 -0.052
Aged 65 to 74 0.087 * -0.107
Aged 75 plus 0.021 -0.208 **
Indigenous -0.062 -0.059
Born overseas in a main English-speaking country -0.001 0.010
Born overseas in a non-English speaking country -0.023 -0.043
Speaks a language other than English at home 0.008 -0.044
Has not completed Year 12 or post-school qualification -0.023 -0.049
Has a post graduate degree 0.031 0.159 ***
Has an undergraduate degree 0.016 0.032
Has a Certificate III/IV, Diploma or Associate Degree 0.005 0.006
Lives in the most disadvantaged areas (1st quintile) -0.041 -0.062
Lives in next most disadvantaged areas (2nd quintile) -0.005 -0.087
Lives in next most advantaged areas (4th quintile) -0.003 -0.045
Lives in the most advantaged areas (5th quintile) 0.004 0.042
Lives in a non-capital city -0.031 0.025
Probability of base case 0.099 0.734
Sample size 801 711
Source: January 2020 and October 2019 ANUpolls.
Notes: The base case individual did not report any bushfire exposure, is female; aged 35 to 44; non-Indigenous; born in Australia; does not speak a language other than English at home; has completed Year 12 but does not have a post-graduate degree; lives in neither an advantaged or disadvantaged suburb ( third quintile); and lives in a capital city
Those coefficients that are statistically significant at the 1 per cent level of significance are labelled ***; those significant at the 5 per cent level of significance are labelled **, and those significant at the 10 per cent level of significance are labelled *.
While there has been an overall decline in support for new coal mines, the relationship with exposure to the bushfires is somewhat complicated. For those who didn’t support new coal mines when asked in June 2019, indirect exposure was associated with a small further decline

Bushfire exposure and impacts
36 The Australian National University Centre for Social Research and Methods
in the probability of supporting new coal mines when asked in January 2020 (marginal effect of -0.052 and a p-value of 0.058). When focusing on those who did support new coal mines in June 2019, on the other hand, those who had direct exposure to the bushfires were more likely to support new coal mines than those who didn’t have direct exposure. The marginal effect of this difference was reasonably large (0.108) and the p-value was reasonably small (0.034).
There were also large declines in support for females, and the relatively young (aged 18 to 24 years).
Table 11 Factors associated with support for new coal mines in January 2020 – By views in June 2019
Variable Not supportive of coal mines in June 2019
Supportive of coal mines in June 2019
Marginal effect
Signific. Marginal effect
Signific.
Direct/severe exposure 0.011 0.108 **
Indirect/secondary exposure -0.052 * -0.053
Female 0.049 -0.101 **
Aged 18 to 24 -0.042 -0.464 **
Aged 25 to 34 -0.017 -0.016
Aged 45 to 54 -0.032 0.039
Aged 55 to 64 -0.003 0.052
Aged 65 to 74 -0.036 0.068
Aged 75 plus -0.068 0.102
Indigenous 0.000 0.086
Born overseas in a main English-speaking country -0.039 -0.091
Born overseas in a non-English speaking country 0.164 *** -0.213 **
Speaks a language other than English at home 0.014 0.111
Has not completed Year 12 or post-school qualification 0.069 * -0.070
Has a post graduate degree -0.049 0.063
Has an undergraduate degree -0.032 -0.103
Has a Certificate III/IV, Diploma or Associate Degree 0.003 0.014
Lives in the most disadvantaged areas (1st quintile) 0.045 0.075
Lives in next most disadvantaged areas (2nd quintile) 0.084 0.089
Lives in next most advantaged areas (4th quintile) 0.089 0.017
Lives in the most advantaged areas (5th quintile) 0.029 0.041
Lives in a non-capital city -0.026 -0.007
Probability of base case 0.099 0.715
Sample size 915 728
Source: January 2020 ANUpoll and June 2019 Comparative Study of Electoral Systems.
Notes: The base case individual did not report any bushfire exposure, is female; aged 35 to 44; non-Indigenous; born in Australia; does not speak a language other than English at home; has completed Year 12 but does not
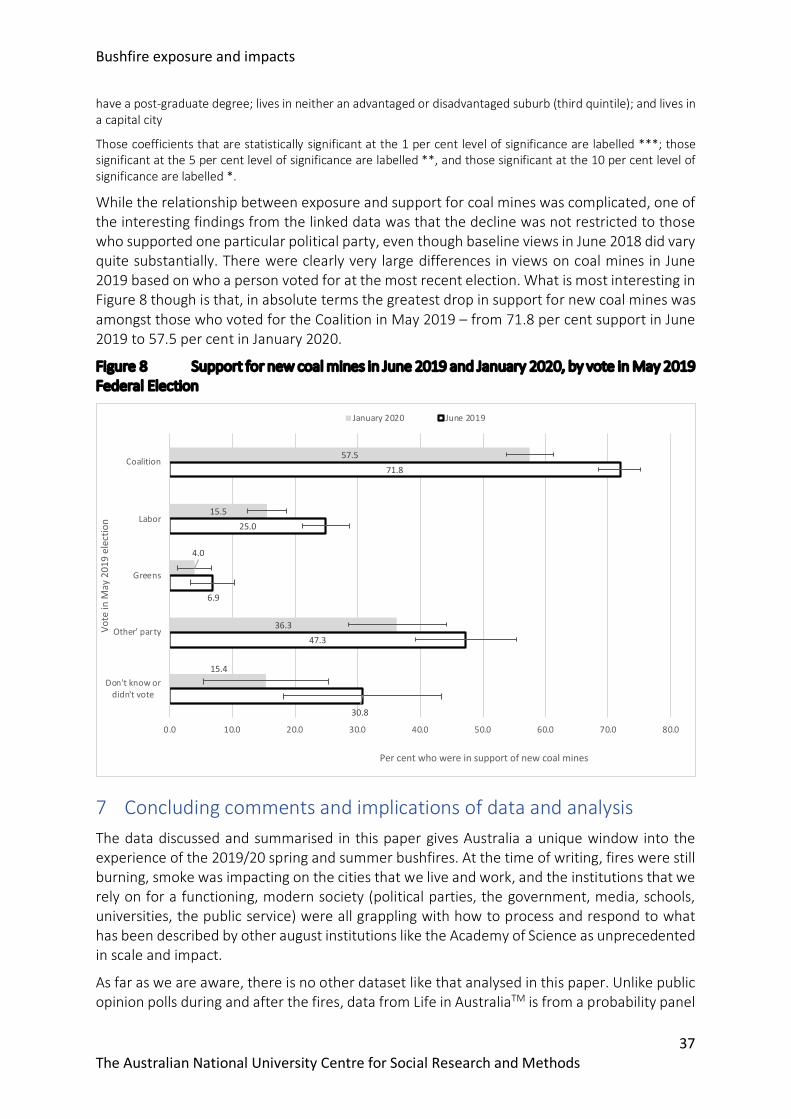
Bushfire exposure and impacts
37 The Australian National University Centre for Social Research and Methods
have a post-graduate degree; lives in neither an advantaged or disadvantaged suburb (third quintile); and lives in a capital city
Those coefficients that are statistically significant at the 1 per cent level of significance are labelled ***; those significant at the 5 per cent level of significance are labelled **, and those significant at the 10 per cent level of significance are labelled *.
While the relationship between exposure and support for coal mines was complicated, one of the interesting findings from the linked data was that the decline was not restricted to those who supported one particular political party, even though baseline views in June 2018 did vary quite substantially. There were clearly very large differences in views on coal mines in June 2019 based on who a person voted for at the most recent election. What is most interesting in Figure 8 though is that, in absolute terms the greatest drop in support for new coal mines was amongst those who voted for the Coalition in May 2019 – from 71.8 per cent support in June 2019 to 57.5 per cent in January 2020.
Figure 8 Support for new coal mines in June 2019 and January 2020, by vote in May 2019 Federal Election
7 Concluding comments and implications of data and analysis The data discussed and summarised in this paper gives Australia a unique window into the experience of the 2019/20 spring and summer bushfires. At the time of writing, fires were still burning, smoke was impacting on the cities that we live and work, and the institutions that we rely on for a functioning, modern society (political parties, the government, media, schools, universities, the public service) were all grappling with how to process and respond to what has been described by other august institutions like the Academy of Science as unprecedented in scale and impact.
As far as we are aware, there is no other dataset like that analysed in this paper. Unlike public opinion polls during and after the fires, data from Life in AustraliaTM is from a probability panel
57.5
15.5
4.0
36.3
15.4
71.8
25.0
6.9
47.3
30.8
0.0 10.0 20.0 30.0 40.0 50.0 60.0 70.0 80.0
Coalition
Labor
Greens
Other' party
Don't know ordidn't vote
Per cent who were in support of new coal mines
Vot
e in
May
201
9 el
ecti
on
January 2020 June 2019

Bushfire exposure and impacts
38 The Australian National University Centre for Social Research and Methods
that can be weighted to be representative of the Australian population and that can have robust standard errors calculated in order to measure uncertainty. It is also a relatively large sample. Unlike cross-sectional surveys that must surely be in the planning stage, we have data on the same individuals prior to the fires, with consistently asked questions and control variables. Unlike other non-targeted longitudinal surveys, we have self-reported measures of exposure.
The results presented in this paper show varying degrees of exposure, with a small proportion of the population having their property damaged or destroyed, but a slightly larger percentage having their property threatened, or being evacuated. There was a very large proportion of the population – around three quarters – that reported some form of indirect exposure, with the most common form of exposure being physically affected by smoke or feeling anxious or worried. While some of our estimates are large, official statistics about the number of people who were residents and domestic overnight visitors seem make it likely there were over 3 million people in bushfire affected areas at the time.
Our analysis documents quite significant changes in attitudes regarding the bushfires. Australians have become less satisfied with the direction of the country, less satisfied with their own life, and less confident in the Federal Government. They are much less likely to say that they would vote for the Coalition, and give far lower ratings for Prime Minister Scott Morrison. They are more likely to think that climate change or global warming is a serious issue, more likely to think that it is a threat to them, and less likely to support new coal mines.
These results are not because of changes in the composition of our sample, a statement that cannot be made with repeated cross-sectional data. Rather, we have shown that attitudes of a sample of individual Australians has changed in the directions outlined above, with many of these changes predicted by exposure to the bushfires.
The results presented in this paper have implications for a number of actors in Australian society.
For those responding to the bushfires through the delivery of services, it is clear that there are very large levels of exposure, and that indirect exposure can be as important for certain outcomes as direct exposure. There is also some evidence that particular population groups – males and those in non-capital cities – may be underreporting anxiety or worry, and therefore missing out on mental health services following the fires.
For the Coalition Government, the results suggest that changes in attitudes are not restricted to those who would not have voted for the Coalition in the first place. The change in voting intention is as substantial as other reporting would suggest. There is good news though, in that those who had more direct forms of exposure to the bushfire were no more likely to have changed their vote away from the Coalition than those who weren’t exposed. They weren’t less likely to have though.
There are also implications for the two main opposition parties. Swings away from the Coalition between October 2019 and January 2020 did not result in large swings towards Labor or the Greens. These two parties need to engage with those who currently don’t know who they would vote for or who would vote for an ‘Other’ party if they want to capitalise on the ill feeling towards the Coalition and Prime Minister Scott Morrison. A disproportionate amount of the swing did occur outside of the capital cities, likely to be key battlegrounds between now and the next election.

Bushfire exposure and impacts
39 The Australian National University Centre for Social Research and Methods
For those who are supportive of action on climate change, there are more Australians who see global warming as an issue, more who see it as a threat to them, and more who think that there should be no new coal mines. Some of this change appears to be attributable to exposure to the bushfires. While these are now strongly majority views, there is still a large minority of Australians who do not agree. Furthermore, while there has been some convergence (some of the largest changes have been among Coalition supporters), views still do correlate strongly with voting intention. Given the evidence that people continue to take their cue on environmental issues from those who they support politically, those who would like to see a greater shift in support for action on climate change can’t rely on natural disasters, must continue to engage with issues of identity, and must continue to engage with all sides of politics.
Finally, the data summarised in this paper provides opportunities for future research and new insights. The data will be made available through the Australian Data Archive and there is far more analysis that could be done on the data. The verbatim responses on the major issue facing Australia could be analysed using more qualitative techniques. There are many more longitudinal (and cross-sectional) variables that could be analysed alongside bushfire exposure and changes in attitudes. And future waves of ANUpoll could test for changes in additional variables, and test the persistence of the changes presented in this paper.
Ultimately, if the 2019/20 Australian spring and summer bushfires were unprecedented in scale, then they require an unprecedented social research response.
8 About the survey Interviews commenced on 20 January 2020, and continued for a two-week collection period. However, 58.5 per cent of the sample were collected in the first four days of data collection. A total of 4,009 active panel members were invited to take part in the survey, leading to a completion rate of 81.0 per cent for the survey.
For those respondents who were in the panel prior to January 2020, ANUpoll for the month was linked to previous polls at the individual level. Between October-December 2019, the panel was refreshed with n = 347 panellists being retired and n = 1,810 new panellists being recruited. This recruitment used a G-NAF (Geocoded National Address File) sample frame and push-to-web methodology. Only online participants were recruited in order to balance the demographics (the age profile of panel members was older and more educated than that of the Australian population). The recruitment rate (RECR) for the replenishment was 12.1%. This boosted sample means that longitudinal analysis is restricted to the original panel members or previous sample refreshes.
The Social Research Centre collected data online and through Computer Assisted Telephone Interviewing (CATI) in order to ensure representation from the offline Australian population. Around 6.5 per cent of interviews were collected via CATI.
The contact methodology adopted for online Life in Australia™ members is an initial survey invitation via email and SMS (where available), followed by multiple email reminders and a reminder SMS. Telephone non-response of panel members who have not yet competed the survey commences in the second week of fieldwork and consists of reminder calls encouraging completion of the online survey.

Bushfire exposure and impacts
40 The Australian National University Centre for Social Research and Methods
The contact methodology for offline Life in Australia™ members was an initial SMS (where available), followed by an extended call-cycle over a two-week period. A reminder SMS was also sent in the second week of field.
Taking into account recruitment to the panel, the cumulative response rate for this survey is 8.3 per cent.
Unless otherwise stated, data in the paper is weighted to population benchmarks.For Life in Australia™, the approach for deriving weights generally consists of the following steps:
1. Compute a base weight for each respondent as the product of two weights:
a. Their enrolment weight, accounting for the initial chances of selection and subsequent post-stratification to key demographic benchmarks
b. Their response propensity weight, estimated from enrolment information available for both respondents and non-respondents to the present wave.
2. Adjust the base weights so that they satisfy the latest population benchmarks for several demographic characteristics.

Bushfire exposure and impacts
41 The Australian National University Centre for Social Research and Methods
References Biddle, N. (2019). "Predicting the unpredicted: what longitudinal data can tell us about the 2019 federal election." CSRM Working Paper 6.
Biddle, N., Edwards, B., Herz, D., Makkai, T., McAllister, I. (2020). Bushfires, the environment, and optimism for the future.
Boin, A., P. T. HART, A. McConnell and T. Preston (2010). "Leadership style, crisis response and blame management: The case of Hurricane Katrina." Public Administration 88(3): 706-723.
Bryant, R. A., E. Waters, L. Gibbs, H. C. Gallagher, P. Pattison, D. Lusher, C. MacDougall, L. Harms, K. Block and E. Snowdon (2014). "Psychological outcomes following the Victorian Black Saturday bushfires." Australian & New Zealand Journal of Psychiatry 48(7): 634-643.
Cameron, S. M. and I. McAllister (2019). "Trends in Australian political opinion: results from the Australian Election Study 1987–2019." Canberra: School of Politics and International Relations, The Australian National University.
Campbell, D. E. (2009). "Civic engagement and education: An empirical test of the sorting model." American Journal of Political Science 53(4): 771-786.
Ditton, J. and S. Farrall (2017). The fear of crime, Routledge.
Garnaut, R. (2019). Superpower: Australia's Low-Carbon Opportunity, Schwartz Publishing Pty, Limited.
Gillman, S. (2010). "Heroes, mates and family: How tragedy teaches us about being Australian." Cultural Studies Review 16(1): 240–250-240–250.
Howe, P. D., J. R. Marlon, M. Mildenberger and B. S. Shield (2019). "How will climate change shape climate opinion?" Environmental Research Letters 14(11): 113001.
IPCC (2014) "Climate Change 2014: Synthesis Report. Contribution of Working Groups I, II and III to the Fifth Assessment Report of the Intergovernmental Panel on Climate Change [Core Writing Team, R.K. Pachauri and L.A. Meyer (eds.)]."
Kaczmirek, L., B. Phillips, D. Pennay, P. Lavrakas and D. Neiger (2019). "Building a probability-based online panel: Life in Australia™." CSRM and SRC Methods Paper.
Konisky, D. M., L. Hughes and C. H. Kaylor (2016). "Extreme weather events and climate change concern." Climatic change 134(4): 533-547.
Lee, Y. and H. L. Schachter (2019). "Exploring the relationship between trust in government and citizen participation." International Journal of Public Administration 42(5): 405-416.
McAllister, I. (2008). Public opinion towards the environment. Results from the ANU poll. ANUpoll Report. 3.
McAllister, I. B., Clive; Gibson, Rachel; Makkai, Toni; Cameron, Sarah; Sheppard, Jill (2019). The Comparative Study of Electoral Systems Survey (Australia), 2019.
McColl, L. (2007). "The influence of bush identity on attitudes to mental health in a Queensland community." Rural Society 17(2): 107-124.

Bushfire exposure and impacts
42 The Australian National University Centre for Social Research and Methods
McLean, C. P., A. Asnaani, B. T. Litz and S. G. Hofmann (2011). "Gender differences in anxiety disorders: prevalence, course of illness, comorbidity and burden of illness." Journal of psychiatric research 45(8): 1027-1035.
Morgan, G., V. Sheppeard, B. Khalaj, A. Ayyar, D. Lincoln, B. Jalaludin, J. Beard, S. Corbett and T. Lumley (2010). "Effects of bushfire smoke on daily mortality and hospital admissions in Sydney, Australia." Epidemiology: 47-55.
Ray, A., L. Hughes, D. M. Konisky and C. Kaylor (2017). "Extreme weather exposure and support for climate change adaptation." Global Environmental Change 46: 104-113.
The_Australia_Institute (2020) "Polling – Bushfire crisis and concern about climate change."
The_Australia_Institute (2020) "Polling – Climate change concern ".