Embed Size (px)
Citation preview
International Journal of Scientific and Research Publications, Volume 8, Issue 1, January 2018 355
ISSN 2250-3153
www.ijsrp.org
Measuring the Intensity of Competition among Rice
Exporters to Saudi Arabia1
Yosef Alamri* and Sayed Saghaian*
*Department of Agricultural Economics, University of Kentucky
Abstract: The objective of this research is to estimate the residual demand elasticity that rice exporters face in Saudi Arabia. The inverse
residual demand methods as proposed by Reed and Saghain 2004, for rice exporters to Saudi Arabia during the period 1993-2014, was
specified and estimated. The results show that India had the largest market share and penetration rate compared to another exporter.
Estimation results of the elasticities of the residual demand indicate that Australia, India, and Pakistan, enjoy market power.
Keywords: inverse demand, residual demand, Saudi Arabia, imperfect competition, rice, market share.
I. INTRODUCTION
Rice is one of the major crops in the world, and regarding area planted and production, it is ranked third in importance after wheat and
corn crops, where it is estimated that more than 470 million metric tons of rice were consumed in 2015 (USDA DATA, 2016). The most
important countries in the world in rice production are China, India, and Indonesia, as they accounted for 59% of the global rice
production in 2013. The global rice production was increased by 108% during the period 2009-2013, from 686.9 million tons to 740.96
million tons (FAO, 2016).
The world rice export is concentrated within five exporting countries which are namely, India, Thailand, Vietnam, Pakistan and the
United States, accounting for 70% of the world’s rice exportation in 2013. During the period of 2009-2013, the global rice exports
increased 123% from 30.2 million tons to 37.1 million tons (FAO, 2016). Moreover, the global rice imports also increased 129% from
29.3 million tons in 2009 to 37.8 Million tons in 2013.
Saudi Arabia was the seventh main destination of rice imports in the world (3%) and accounted for 1.26 million tons in 2013 (FAO,
2016). Rice cultivation is unsuitable in Saudi Arabia because of the climate, and this has necessitated the import of all of her rice from
abroad. The imports quantity accounted for 4% of the total world imports (1.6 million tons) in 2015 (USDA DATA, 2016). For the
period from 2009-2013, Saudi Arabia ranked fourth among the global rice importers (4%), and was also ranked second for the value of
the world rice imports (5%). This demonstrates the high-quality rice required for consumption in Saudi Arabia, where it ranked the
second highest rice- price imports for the same period compared to other countries in the world.
Rice is the primary food in Saudi Arabia. From the data, it is shown that rice consumption quantity is one of the highest compared to
other crops. It accounted for 1.6 million tons (8%) of the total crop consumption in Saudi Arabia in 2015 (USDA DATA, 2016). In the
Saudi market, the aromatic thin, long-grained product, which is known as Basmati, is the most popular rice variety. The American long
1 Paper presented at the Southern Agricultural Economics Association’s 2017 Annual Meeting, Mobile, Alabama, February 4-7, 2017
International Journal of Scientific and Research Publications, Volume 8, Issue 1, January 2018 356
ISSN 2250-3153
www.ijsrp.org
parboiled grain rice imported from the U.S. and medium grain Calrose rice imported from the U.S. and Australia come in second and
third, respectively (USDA, FAS 2015). The objective of this study is to analyze the intensity of competition among the main rice
exporting countries to Saudi Arabia.
II. THE SAUDI ARABIAN RICE MARKET
In 2014, the total rice consumption in Saudi Arabia reached 45kg per capita. On average, each Saudi consumed 12 kg more compared
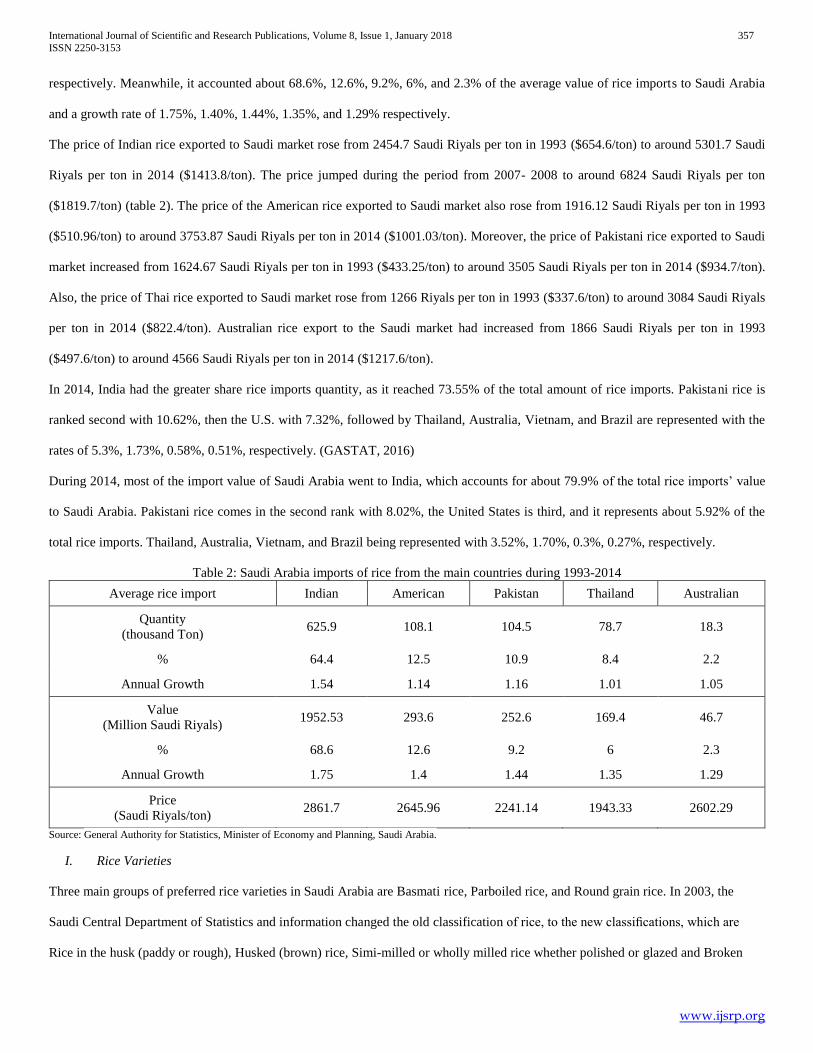
to 1995 (USDA and World Bank). Table 1 shows the amount of rice volume and value imports are, on average, around 952.47 thousand
tons and 2752.18 million Saudi Riyals ($733.9 million), and have an annual growth rate of 1.0% and 1.086%, respectively. The volume
and value of rice imports increased annually by an estimated 41.41 thousand tons and 235.25 million Saudi Riyals ($62.73 million)
(figure 1).
Import rice price increased fluctuated during the study period, on an average of around 2664.15 Saudi Riyals/ton ($710.44/ton), having
an annual growth rate of 1.039%. The price of rice import is also increased annually by an estimated 115.69 Saudi Riyals/ton
($30.85/ton).
Table 1: Rice imports in Saudi Arabia during the period (1993 -2014)
Quantity
1000 Ton
Value
Million Saudi Riyals
Price
Saudi Riyals/Ton
Average 952.47 2752.18 2664.15
Annual growth rate 1.043 1.086 1.039
Annual change rate 4% 9% 4%
Source: Central Department of Statistics & Information (CDSI). Ministry of Economy and Planning Annual Statistics Book. Saudi Arabia
Figure 1: Trend of rice imported quantity, value, and price in Saudi Arabia during the period 1993-2014
The amount of Saudi Arabia's rice imports from India, the U.S., Pakistan, Thailand, and Australian rice, which was characterized by
fluctuation and relative instability trend increased during the period 1993 -2014 (table 2). On average, it accounted for about 64.4%,
12.5%, 10.9%, 8.4%, and 2.2% of the total rice imports to Saudi Arabia, and the growth rates reached 1.54%, 1.1%, 1.2%, 1%, and 1%,
200
400
600
800
1000
1200
1400
1600
0
1000
2000
3000
4000
5000
6000
7000
19
93
19
94
19
95
19
96
19
97
19
98
19
99
20
00
20
01
20
02
20
03
20
04
20
05
20
06
20
07
20
08
20
09
20
10
20
11
20
12
20
13
20
14
Qu
anti
ty (
10
00
To
n)
Val
ue
(M
illio
n S
aud
i Riy
als)
Pri
ce (
Sau
di R
iyal
s/To
n)
Value Million Saudi Rail Price Saudi Rail/Ton Quantity 1000 Ton
International Journal of Scientific and Research Publications, Volume 8, Issue 1, January 2018 357
ISSN 2250-3153
www.ijsrp.org
respectively. Meanwhile, it accounted about 68.6%, 12.6%, 9.2%, 6%, and 2.3% of the average value of rice imports to Saudi Arabia
and a growth rate of 1.75%, 1.40%, 1.44%, 1.35%, and 1.29% respectively.
The price of Indian rice exported to Saudi market rose from 2454.7 Saudi Riyals per ton in 1993 ($654.6/ton) to around 5301.7 Saudi
Riyals per ton in 2014 ($1413.8/ton). The price jumped during the period from 2007- 2008 to around 6824 Saudi Riyals per ton
($1819.7/ton) (table 2). The price of the American rice exported to Saudi market also rose from 1916.12 Saudi Riyals per ton in 1993
($510.96/ton) to around 3753.87 Saudi Riyals per ton in 2014 ($1001.03/ton). Moreover, the price of Pakistani rice exported to Saudi
market increased from 1624.67 Saudi Riyals per ton in 1993 ($433.25/ton) to around 3505 Saudi Riyals per ton in 2014 ($934.7/ton).
Also, the price of Thai rice exported to Saudi market rose from 1266 Riyals per ton in 1993 ($337.6/ton) to around 3084 Saudi Riyals
per ton in 2014 ($822.4/ton). Australian rice export to the Saudi market had increased from 1866 Saudi Riyals per ton in 1993
($497.6/ton) to around 4566 Saudi Riyals per ton in 2014 ($1217.6/ton).
In 2014, India had the greater share rice imports quantity, as it reached 73.55% of the total amount of rice imports. Pakistani rice is
ranked second with 10.62%, then the U.S. with 7.32%, followed by Thailand, Australia, Vietnam, and Brazil are represented with the
rates of 5.3%, 1.73%, 0.58%, 0.51%, respectively. (GASTAT, 2016)
During 2014, most of the import value of Saudi Arabia went to India, which accounts for about 79.9% of the total rice imports’ value
to Saudi Arabia. Pakistani rice comes in the second rank with 8.02%, the United States is third, and it represents about 5.92% of the
total rice imports. Thailand, Australia, Vietnam, and Brazil being represented with 3.52%, 1.70%, 0.3%, 0.27%, respectively.
Table 2: Saudi Arabia imports of rice from the main countries during 1993-2014
Average rice import Indian American Pakistan Thailand Australian
Quantity
(thousand Ton) 625.9 108.1 104.5 78.7 18.3
% 64.4 12.5 10.9 8.4 2.2
Annual Growth 1.54 1.14 1.16 1.01 1.05
Value
(Million Saudi Riyals) 1952.53 293.6 252.6 169.4 46.7
% 68.6 12.6 9.2 6 2.3
Annual Growth 1.75 1.4 1.44 1.35 1.29
Price
(Saudi Riyals/ton) 2861.7 2645.96 2241.14 1943.33 2602.29
Source: General Authority for Statistics, Minister of Economy and Planning, Saudi Arabia.
I. Rice Varieties
Three main groups of preferred rice varieties in Saudi Arabia are Basmati rice, Parboiled rice, and Round grain rice. In 2003, the
Saudi Central Department of Statistics and information changed the old classification of rice, to the new classifications, which are
Rice in the husk (paddy or rough), Husked (brown) rice, Simi-milled or wholly milled rice whether polished or glazed and Broken
International Journal of Scientific and Research Publications, Volume 8, Issue 1, January 2018 358
ISSN 2250-3153
www.ijsrp.org
Rice. (Consulate General of Pakistan, 2013; USDA, FAS 2015; CDSI, 2016; GASTAT, 2015; Ismaiel and Al-rwis, 2009; Baazeem,
2007)
In this paper, we use this new classification. Also, we choose the six largest rice exporting countries to Saudi Arabia during the period
2009 to 2013. 65% of all rice imported by Saudi Arabia is from India, Pakistan is 13%, the USA 10%, Thailand 9%, Egypt 1% and
Australia 1% (We have deliberately omitted Egypt from our model because of lack of data for the study period).
II. RESEARCH METHODOLOGY
A. Market Power and Measurable Standards
This study adopted the following methods in achieving its objectives for both descriptive and quantitative analysis:
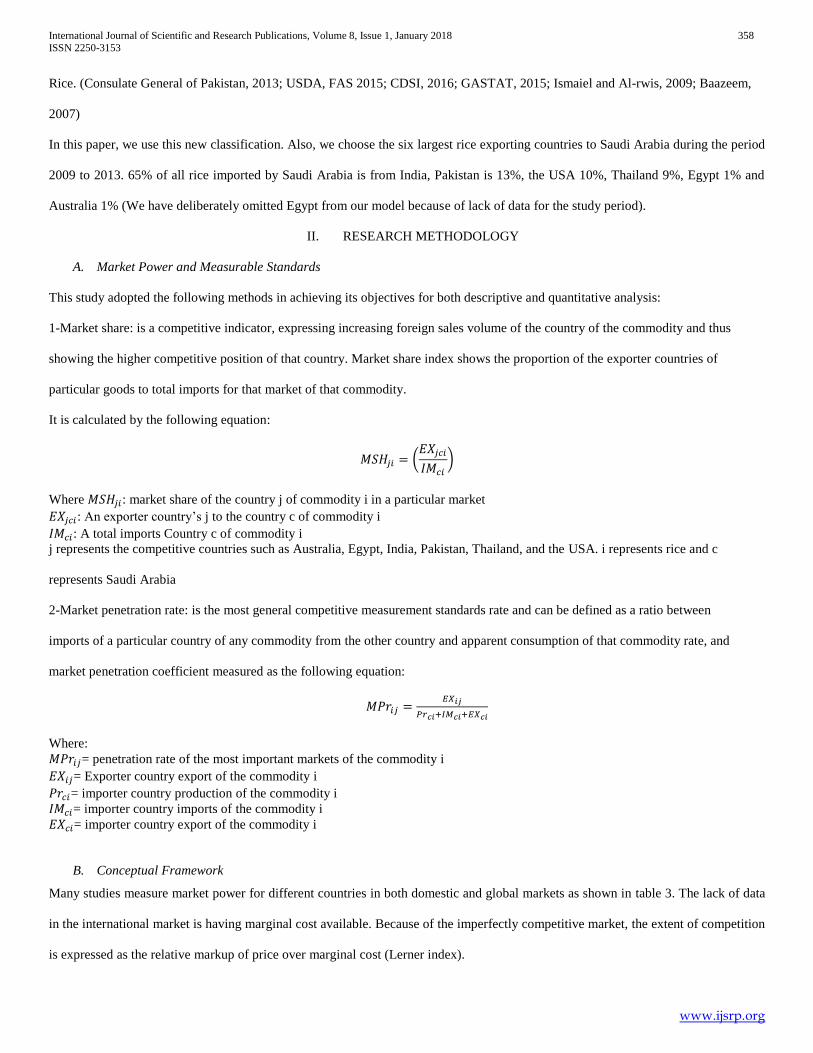
1-Market share: is a competitive indicator, expressing increasing foreign sales volume of the country of the commodity and thus
showing the higher competitive position of that country. Market share index shows the proportion of the exporter countries of
particular goods to total imports for that market of that commodity.
It is calculated by the following equation:
𝑀𝑆𝐻𝑗𝑖 = (𝐸𝑋𝑗𝑐𝑖
𝐼𝑀𝑐𝑖
)
Where 𝑀𝑆𝐻𝑗𝑖: market share of the country j of commodity i in a particular market
𝐸𝑋𝑗𝑐𝑖: An exporter country’s j to the country c of commodity i
𝐼𝑀𝑐𝑖: A total imports Country c of commodity i
j represents the competitive countries such as Australia, Egypt, India, Pakistan, Thailand, and the USA. i represents rice and c
represents Saudi Arabia
2-Market penetration rate: is the most general competitive measurement standards rate and can be defined as a ratio between
imports of a particular country of any commodity from the other country and apparent consumption of that commodity rate, and
market penetration coefficient measured as the following equation:
𝑀𝑃𝑟𝑖𝑗 =𝐸𝑋𝑖𝑗
𝑃𝑟𝑐𝑖+𝐼𝑀𝑐𝑖+𝐸𝑋𝑐𝑖
Where:
𝑀𝑃𝑟𝑖𝑗= penetration rate of the most important markets of the commodity i
𝐸𝑋𝑖𝑗= Exporter country export of the commodity i
𝑃𝑟𝑐𝑖= importer country production of the commodity i
𝐼𝑀𝑐𝑖= importer country imports of the commodity i
𝐸𝑋𝑐𝑖= importer country export of the commodity i
B. Conceptual Framework
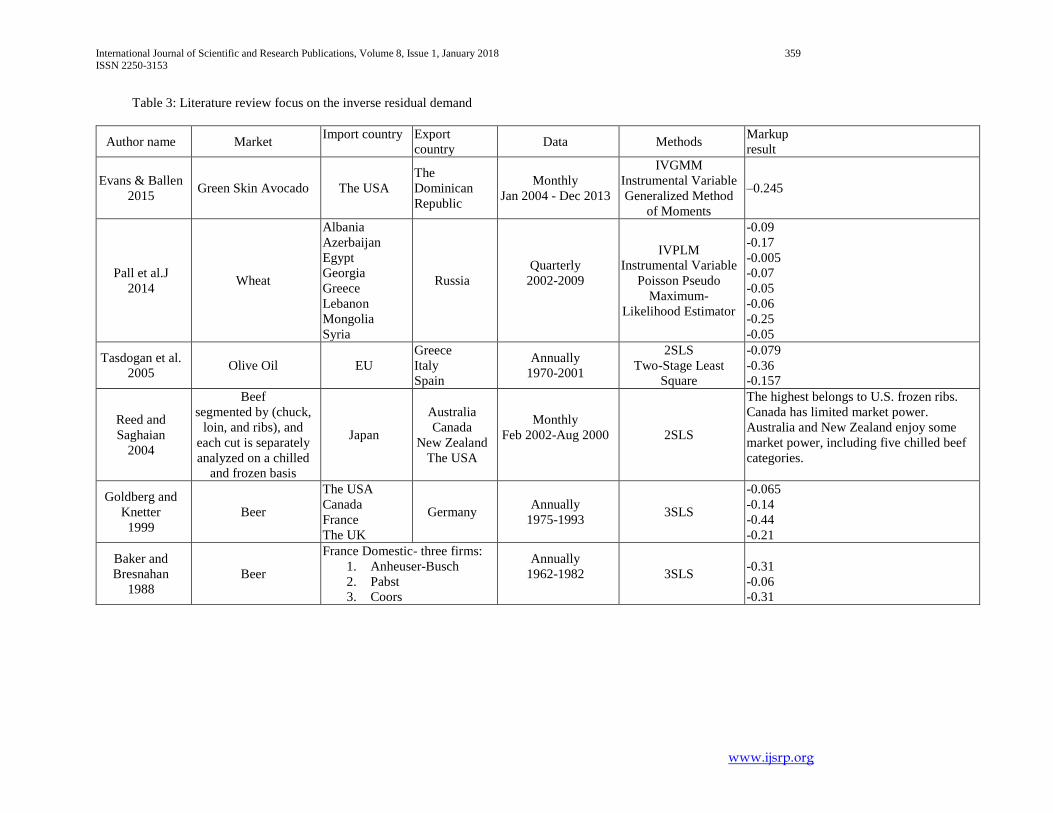
Many studies measure market power for different countries in both domestic and global markets as shown in table 3. The lack of data
in the international market is having marginal cost available. Because of the imperfectly competitive market, the extent of competition
is expressed as the relative markup of price over marginal cost (Lerner index).
International Journal of Scientific and Research Publications, Volume 8, Issue 1, January 2018 359 ISSN 2250-3153
www.ijsrp.org
Table 3: Literature review focus on the inverse residual demand
Author name Market Import country Export
country Data Methods
Markup
result
Evans & Ballen
2015 Green Skin Avocado The USA
The
Dominican
Republic
Monthly
Jan 2004 - Dec 2013
IVGMM
Instrumental Variable
Generalized Method
of Moments
–0.245
Pall et al.J
2014 Wheat
Albania
Azerbaijan
Egypt
Georgia
Greece
Lebanon
Mongolia
Syria
Russia
Quarterly
2002-2009
IVPLM
Instrumental Variable
Poisson Pseudo
Maximum-
Likelihood Estimator
-0.09
-0.17
-0.005
-0.07
-0.05
-0.06
-0.25
-0.05
Tasdogan et al.
2005 Olive Oil EU
Greece
Italy
Spain
Annually
1970-2001
2SLS
Two-Stage Least
Square
-0.079
-0.36
-0.157
Reed and
Saghaian
2004
Beef
segmented by (chuck,
loin, and ribs), and
each cut is separately
analyzed on a chilled
and frozen basis
Japan
Australia
Canada
New Zealand
The USA
Monthly
Feb 2002-Aug 2000
2SLS
The highest belongs to U.S. frozen ribs.
Canada has limited market power.
Australia and New Zealand enjoy some
market power, including five chilled beef
categories.
Goldberg and
Knetter
1999
Beer
The USA
Canada
France
The UK
Germany Annually
1975-1993 3SLS
-0.065
-0.14
-0.44
-0.21
Baker and
Bresnahan
1988
Beer
France Domestic- three firms:
1. Anheuser-Busch
2. Pabst
3. Coors
Annually
1962-1982
3SLS
-0.31
-0.06
-0.31
International Journal of Scientific and Research Publications, Volume 8, Issue 1, January 2018 360 ISSN 2250-3153
360
For the purpose of maximizing profit, marginal revenue (MR) equals marginal cost (MC): MR = MC. It is known as: )1
1(E
PMR
Thus, the Lerner index follows (Lerner, 1934):
EEP
EPP
P
MRP 1111
11
where P is the price and E is price elasticity.
The results from Lerner index are:
1. In the case of perfect competition, Lerner index equal to zero.
2. Lerner index increases with increased market power.
3. Lerner index varies inversely with the elasticity of demand.
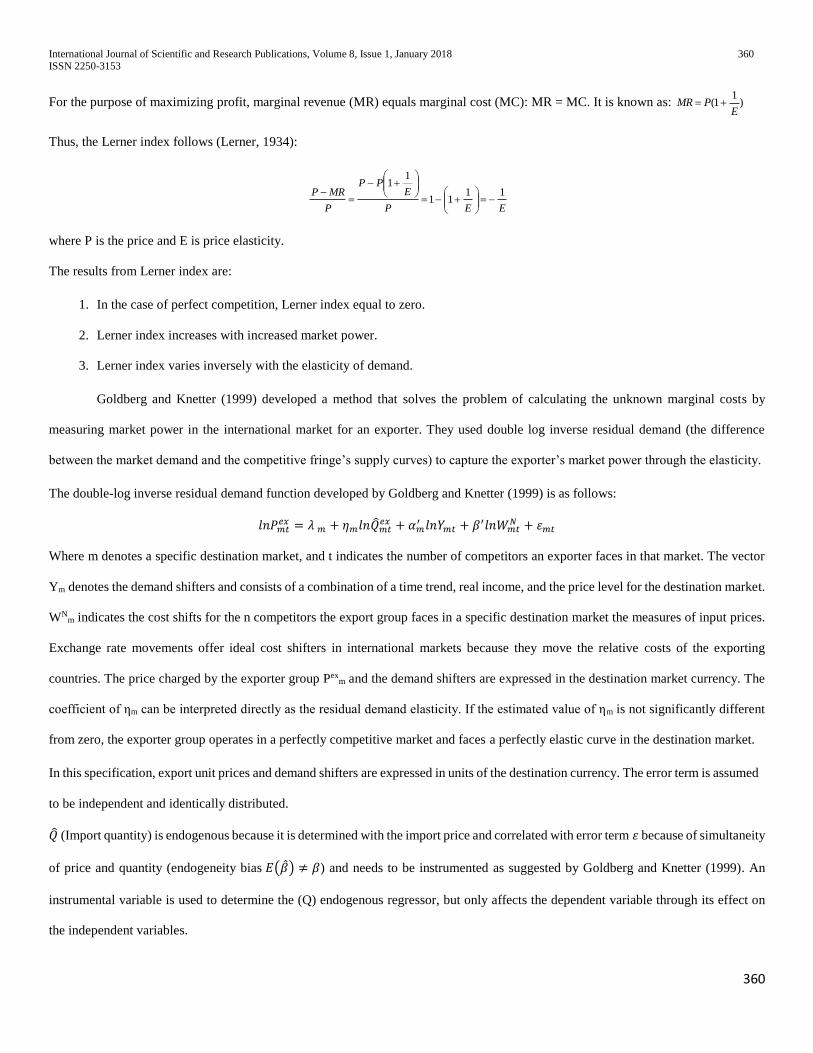
Goldberg and Knetter (1999) developed a method that solves the problem of calculating the unknown marginal costs by
measuring market power in the international market for an exporter. They used double log inverse residual demand (the difference
between the market demand and the competitive fringe’s supply curves) to capture the exporter’s market power through the elasticity.
The double-log inverse residual demand function developed by Goldberg and Knetter (1999) is as follows:
𝑙𝑛𝑃𝑚𝑡𝑒𝑥 = 𝜆 𝑚 + 𝜂𝑚𝑙𝑛�̂�𝑚𝑡
𝑒𝑥 + 𝛼𝑚′ 𝑙𝑛𝑌𝑚𝑡 + 𝛽′𝑙𝑛𝑊𝑚𝑡
𝑁 + 휀𝑚𝑡
Where m denotes a specific destination market, and t indicates the number of competitors an exporter faces in that market. The vector
Ym denotes the demand shifters and consists of a combination of a time trend, real income, and the price level for the destination market.
WNm indicates the cost shifts for the n competitors the export group faces in a specific destination market the measures of input prices.
Exchange rate movements offer ideal cost shifters in international markets because they move the relative costs of the exporting
countries. The price charged by the exporter group Pexm and the demand shifters are expressed in the destination market currency. The
coefficient of ηm can be interpreted directly as the residual demand elasticity. If the estimated value of ηm is not significantly different
from zero, the exporter group operates in a perfectly competitive market and faces a perfectly elastic curve in the destination market.
In this specification, export unit prices and demand shifters are expressed in units of the destination currency. The error term is assumed
to be independent and identically distributed.
�̂� (Import quantity) is endogenous because it is determined with the import price and correlated with error term 휀 because of simultaneity
of price and quantity (endogeneity bias 𝐸(�̂�) ≠ 𝛽) and needs to be instrumented as suggested by Goldberg and Knetter (1999). An
instrumental variable is used to determine the (Q) endogenous regressor, but only affects the dependent variable through its effect on
the independent variables.
International Journal of Scientific and Research Publications, Volume 8, Issue 1, January 2018 361 ISSN 2250-3153
361
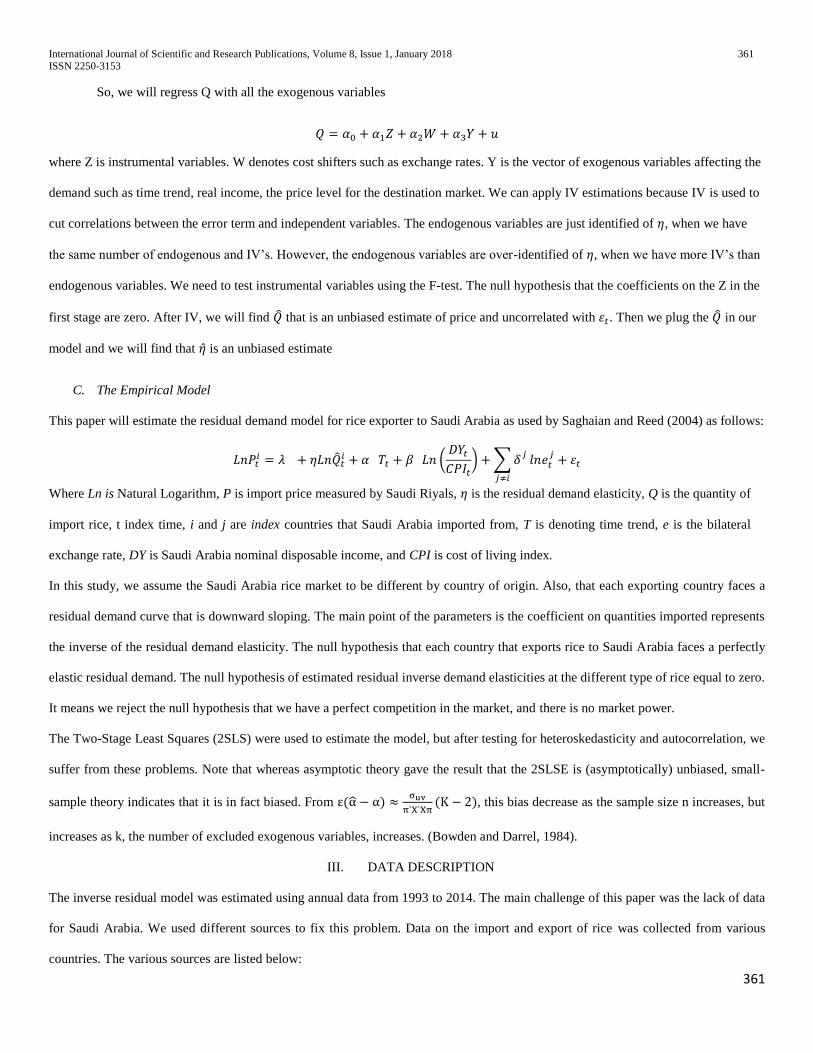
So, we will regress Q with all the exogenous variables
𝑄 = 𝛼0 + 𝛼1𝑍 + 𝛼2𝑊 + 𝛼3𝑌 + 𝑢
where Z is instrumental variables. W denotes cost shifters such as exchange rates. Y is the vector of exogenous variables affecting the
demand such as time trend, real income, the price level for the destination market. We can apply IV estimations because IV is used to
cut correlations between the error term and independent variables. The endogenous variables are just identified of 𝜂, when we have
the same number of endogenous and IV’s. However, the endogenous variables are over-identified of 𝜂, when we have more IV’s than
endogenous variables. We need to test instrumental variables using the F-test. The null hypothesis that the coefficients on the Z in the
first stage are zero. After IV, we will find �̂� that is an unbiased estimate of price and uncorrelated with 휀𝑡. Then we plug the �̂� in our
model and we will find that �̂� is an unbiased estimate
C. The Empirical Model
This paper will estimate the residual demand model for rice exporter to Saudi Arabia as used by Saghaian and Reed (2004) as follows:
𝐿𝑛𝑃𝑡𝑖 = 𝜆 + 𝜂𝐿𝑛�̂�𝑡
𝑖 + 𝛼 𝑇𝑡 + 𝛽 𝐿𝑛 (𝐷𝑌𝑡
𝐶𝑃𝐼𝑡
) + ∑ 𝛿𝑗
𝑙𝑛𝑒𝑡𝑗
+ 휀𝑡
𝑗≠𝑖
Where Ln is Natural Logarithm, P is import price measured by Saudi Riyals, 𝜂 is the residual demand elasticity, Q is the quantity of
import rice, t index time, i and j are index countries that Saudi Arabia imported from, T is denoting time trend, e is the bilateral
exchange rate, DY is Saudi Arabia nominal disposable income, and CPI is cost of living index.
In this study, we assume the Saudi Arabia rice market to be different by country of origin. Also, that each exporting country faces a
residual demand curve that is downward sloping. The main point of the parameters is the coefficient on quantities imported represents
the inverse of the residual demand elasticity. The null hypothesis that each country that exports rice to Saudi Arabia faces a perfectly
elastic residual demand. The null hypothesis of estimated residual inverse demand elasticities at the different type of rice equal to zero.
It means we reject the null hypothesis that we have a perfect competition in the market, and there is no market power.
The Two-Stage Least Squares (2SLS) were used to estimate the model, but after testing for heteroskedasticity and autocorrelation, we
suffer from these problems. Note that whereas asymptotic theory gave the result that the 2SLSE is (asymptotically) unbiased, small-
sample theory indicates that it is in fact biased. From ε(α̂ − α) ≈σuv
π`X`Xπ(K − 2), this bias decrease as the sample size n increases, but
increases as k, the number of excluded exogenous variables, increases. (Bowden and Darrel, 1984).
III. DATA DESCRIPTION
The inverse residual model was estimated using annual data from 1993 to 2014. The main challenge of this paper was the lack of data
for Saudi Arabia. We used different sources to fix this problem. Data on the import and export of rice was collected from various
countries. The various sources are listed below:
International Journal of Scientific and Research Publications, Volume 8, Issue 1, January 2018 362 ISSN 2250-3153
362
1- National Economy and Finance ministries and other official authorities in Saudi Arabia.
2- United States Department of Agriculture (USDA), UN Comtrade Database from United Nations Statistics Division and Food and
Agriculture Organization (FAO) of the United Nations-Statistics Division websites 1993-2013.
3-The Government of Pakistan, Statistics Division-Pakistan Bureau of Statistics data for the year 1997.
The nominal disposable income and CPI are based on available secondary data from the Statistical, Economic and Social Research and
Training Centre for Islamic Countries (SESRIC), as well as, World Development Indicators- World Data Bank. However, Exchange
rate data is from the World Development Indicators.
IV. RESULTS AND DISCUSSION
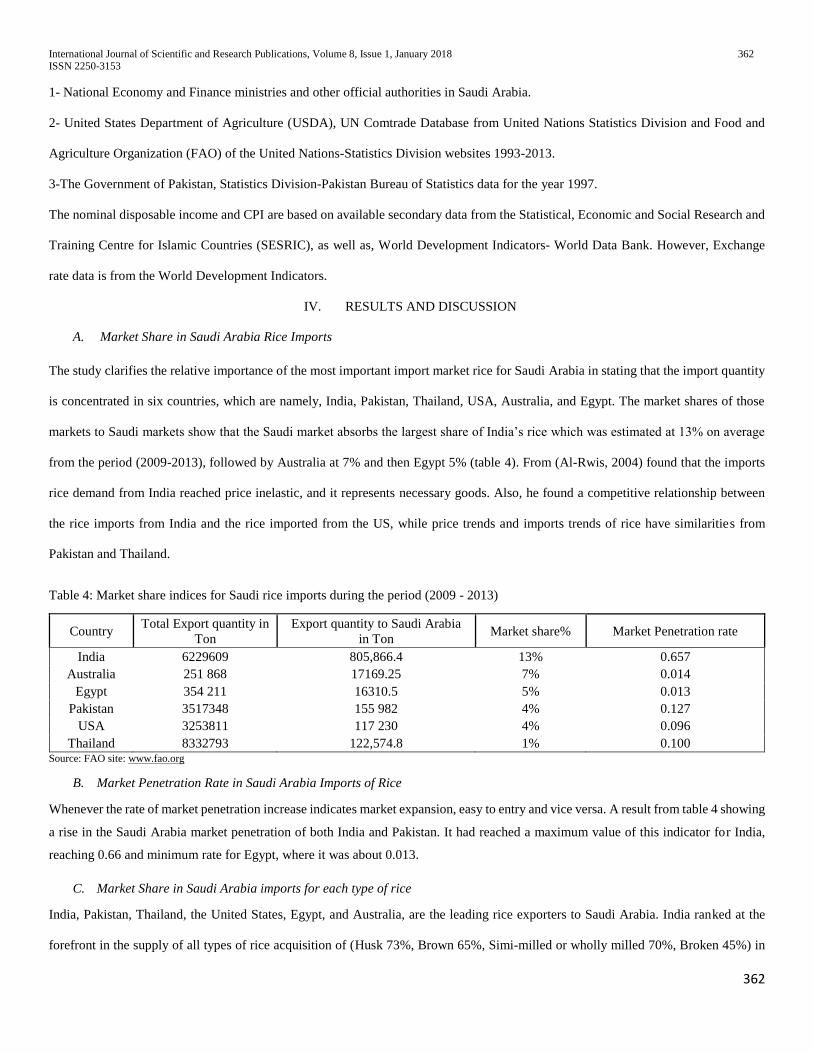
A. Market Share in Saudi Arabia Rice Imports
The study clarifies the relative importance of the most important import market rice for Saudi Arabia in stating that the import quantity
is concentrated in six countries, which are namely, India, Pakistan, Thailand, USA, Australia, and Egypt. The market shares of those
markets to Saudi markets show that the Saudi market absorbs the largest share of India’s rice which was estimated at 13% on average
from the period (2009-2013), followed by Australia at 7% and then Egypt 5% (table 4). From (Al-Rwis, 2004) found that the imports
rice demand from India reached price inelastic, and it represents necessary goods. Also, he found a competitive relationship between
the rice imports from India and the rice imported from the US, while price trends and imports trends of rice have similarities from
Pakistan and Thailand.
Table 4: Market share indices for Saudi rice imports during the period (2009 - 2013)
Country Total Export quantity in
Ton
Export quantity to Saudi Arabia
in Ton Market share% Market Penetration rate
India 6229609 805,866.4 13% 0.657
Australia 251 868 17169.25 7% 0.014
Egypt 354 211 16310.5 5% 0.013
Pakistan 3517348 155 982 4% 0.127
USA 3253811 117 230 4% 0.096
Thailand 8332793 122,574.8 1% 0.100 Source: FAO site: www.fao.org
B. Market Penetration Rate in Saudi Arabia Imports of Rice
Whenever the rate of market penetration increase indicates market expansion, easy to entry and vice versa. A result from table 4 showing
a rise in the Saudi Arabia market penetration of both India and Pakistan. It had reached a maximum value of this indicator for India,
reaching 0.66 and minimum rate for Egypt, where it was about 0.013.
C. Market Share in Saudi Arabia imports for each type of rice
India, Pakistan, Thailand, the United States, Egypt, and Australia, are the leading rice exporters to Saudi Arabia. India ranked at the
forefront in the supply of all types of rice acquisition of (Husk 73%, Brown 65%, Simi-milled or wholly milled 70%, Broken 45%) in
International Journal of Scientific and Research Publications, Volume 8, Issue 1, January 2018 363 ISSN 2250-3153
363
comparison with the six other largest exporting countries of rice to Saudi Arabia. Also, it followed by the USA in rice type of Husk
13%, Brown 22% and Broken 39%. However, Pakistan is competitive with India in the preferred type of rice in Saudi Arabia that is
Simi-milled or wholly milled rice by the acquisition of 11%, in the average period 2012-2014 (Table 5).
Table 5: Market share in Saudi Arabia imports for each type of rice, during the period (2012 - 2014), in percentage.
Country
Rice in the husk
(paddy or rough) Husked (brown) rice
Simi-milled or wholly milled rice whether
or not polished or glaze Broken rice
Import
Quantity
Import
Value
Import
Quantity
Import
Value Import Quantity Import Value
Import
Quantity
Import
Value
Pakistan 3% 2% 6% 6% 11% 9% 9% 6%
India 73% 77% 65% 66% 70% 75% 45% 47%
Thailand 5% 5% 3% 2% 6% 5% 3% 2%
U.S.A 13% 10% 22% 22% 9% 8% 39% 41%
Egypt 6% 5% 0% 0% 0% 0% 4% 4%
Australia 0% 0% 0% 0% 2% 2% 0% 0%
Other
Countries 1% 1% 4% 4% 1% 1% 1% 1%
Source: compiled and calculated by: USDA(FAS) Website: http://apps.fas.usda.gov/gats/ExpressQuery1.aspx
UKComtrade Website: http://comtrade.un.org/data/
D. The Inverse Residual Demand Estimation
Because of the lack of data, the study tried to reach the best estimates of the residual demand model of rice exporting countries to Saudi
Arabia. However, since the objective of this study is to examine the market power of the rice exporter to Saudi Arabia, inverse residual
demand was estimated to determine which countries have market power.
Table (6) display the estimated parameters of rice imports of the residual demand model from the leading exporting countries to Saudi
Arabia in the double logarithmic during the period 1993-2014. We applied instrumental variable estimations because IV is used to cut
correlation between the error term and independent variables. We also included the total of Pakistan and the U.S.A rice export to the
world as instrumental variables for Australia and Thailand. In the case of India, we included the total of Pakistan and US rice export to
the world. In the case of Pakistan and the US, we included the total US rice production as an instrument.
We tested for whether variable Q is endogenous by using the Hausman test, the result showed that we failed to reject the null hypothesis
for exporter countries at the 5% level of significance, except the India model. So, the OLS estimation applied to estimate the residual
demand equation for all exporting rice countries to Saudi Arabia except India, we also applied the two-stage least squares 2SLS. We
used the two-stage least square (2SLS) in India model rather than OLS (Q correlated with 휀𝑡 and 𝐸(�̂�) ≠ 𝛽 bias estimate) because of
endogeneity problem.
According to the result that the estimated residual model for each exporter was significant at 1% level for India, Pakistan, and the USA,
and significant at 5% level for Australia and Thailand. In all inverse residual demand model, R-square indicates the percentage of the
International Journal of Scientific and Research Publications, Volume 8, Issue 1, January 2018 364 ISSN 2250-3153
364
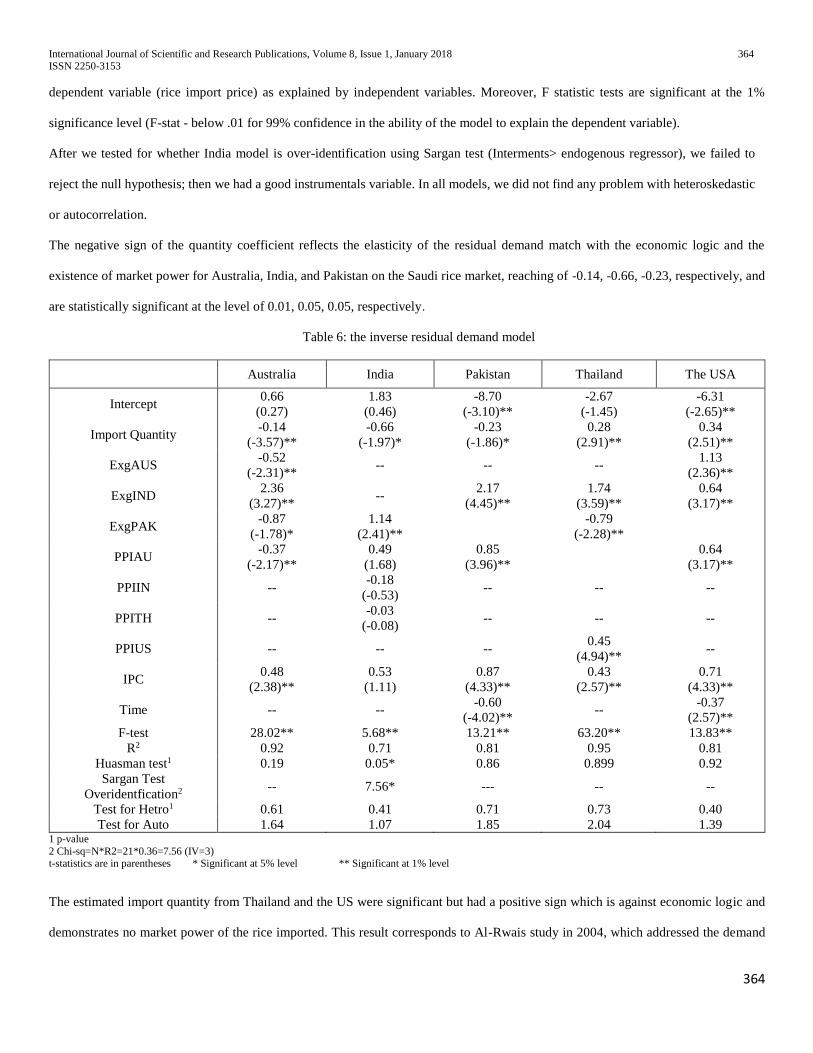
dependent variable (rice import price) as explained by independent variables. Moreover, F statistic tests are significant at the 1%
significance level (F-stat - below .01 for 99% confidence in the ability of the model to explain the dependent variable).
After we tested for whether India model is over-identification using Sargan test (Interments> endogenous regressor), we failed to
reject the null hypothesis; then we had a good instrumentals variable. In all models, we did not find any problem with heteroskedastic
or autocorrelation.
The negative sign of the quantity coefficient reflects the elasticity of the residual demand match with the economic logic and the
existence of market power for Australia, India, and Pakistan on the Saudi rice market, reaching of -0.14, -0.66, -0.23, respectively, and
are statistically significant at the level of 0.01, 0.05, 0.05, respectively.
Table 6: the inverse residual demand model
Australia India Pakistan Thailand The USA
Intercept 0.66
(0.27)
1.83
(0.46)
-8.70
(-3.10)**
-2.67
(-1.45)
-6.31
(-2.65)**
Import Quantity -0.14
(-3.57)**
-0.66
(-1.97)*
-0.23
(-1.86)*
0.28
(2.91)**
0.34
(2.51)**
ExgAUS -0.52
(-2.31)** -- -- --
1.13
(2.36)**
ExgIND 2.36
(3.27)** --
2.17
(4.45)**
1.74
(3.59)**
0.64
(3.17)**
ExgPAK -0.87
(-1.78)*
1.14
(2.41)**
-0.79
(-2.28)**
PPIAU -0.37
(-2.17)**
0.49
(1.68)
0.85
(3.96)**
0.64
(3.17)**
PPIIN -- -0.18
(-0.53) -- -- --
PPITH -- -0.03
(-0.08) -- -- --
PPIUS -- -- -- 0.45
(4.94)** --
IPC 0.48
(2.38)**
0.53
(1.11)
0.87
(4.33)**
0.43
(2.57)**
0.71
(4.33)**
Time -- -- -0.60
(-4.02)** --
-0.37
(2.57)**
F-test 28.02** 5.68** 13.21** 63.20** 13.83**
R2 0.92 0.71 0.81 0.95 0.81
Huasman test1 0.19 0.05* 0.86 0.899 0.92
Sargan Test
Overidentfication2 -- 7.56* --- -- --
Test for Hetro1 0.61 0.41 0.71 0.73 0.40
Test for Auto 1.64 1.07 1.85 2.04 1.39 1 p-value
2 Chi-sq=N*R2=21*0.36=7.56 (IV=3) t-statistics are in parentheses * Significant at 5% level ** Significant at 1% level
The estimated import quantity from Thailand and the US were significant but had a positive sign which is against economic logic and
demonstrates no market power of the rice imported. This result corresponds to Al-Rwais study in 2004, which addressed the demand
International Journal of Scientific and Research Publications, Volume 8, Issue 1, January 2018 365 ISSN 2250-3153
365
Saudi rice imported of analysis pattern from India was an inelastic price. As well as Ismail and Al-Rwais study in 2009, which showed
that each of India and Pakistan had market power in the rice export to Saudi Arabia. The elasticity of the residual demand in both
countries - 0.13, and were statistically significant at the 0.05 level, while the US, Australia, Thailand, and Egypt face a perfectly elastic
demand.
V. CONCLUSIONS
The Saudi Arabia rice imports increased annually by 14 thousand ton of rice during the study period. Saudi rice imports are concentrated
in six rice exporting countries of India, Pakistan, the US, Thailand, Australia, and Egypt, and it accounted for about 66%, 12%, 10%,
9%, 1% and 1% of the total Saudi rice imports respectively from the period 2010 to 2014. Saudi rice imports are concentrated in 4 main
rice varieties, Rice in the husk (paddy or rough), Husked (brown) rice, Simi-milled or wholly milled rice and Broken Rice.
The objective of the Study is to analyze the intensity of competition among the main rice exporting countries to Saudi Arabia. To
achieve the objective of this study the structure and trends of Saudi rice imports were measured. Market share and penetration were
analyzed. Finally, the inverse residual demand rice imports from competitive rice exporters to the Saudi were estimated to indicate the
extent of market power.
The inverse residual model was estimated using the annual data from 1993 to 2014. Data imported quantity from different countries
and import price was collected from various sources such as National Economy and Finance ministries, other official authorities in
Saudi Arabia, USDA, UN Comtrade Database from United Nations Statistics Division and Food and Agriculture Organization of the
United Nations-Statistics Division websites 1993-2014. Nominal disposable income and CPI will be based on available secondary data
from The Statistical, Economic and Social Research and Training Centre for Islamic Countries (SESRIC), as well as, World
Development Indicators- World Data Bank. However, Exchange rates will be from the World Development Indicators.
The value of Saudi Arabia rice import represents about 7% of the value of agriculture imports over the average period of 2009-2014.
The study result shows that India received the highest increase rate among competitive countries in quantity, value, and import price.
The largest market share of the exporter countries to Saudi Arabia was India by 13% then Australia, Egypt, Pakistan, US, and Thailand
on the average period from 2009-2014. There was a rise in market penetration of both India and Pakistan due to the type of Basmati
rice that is preferred to the Saudi consumers. When we study the market share of the four types of rice, the result shows that India still
has the largest impact comparing to another exporter.
The results of the residual-demand models for rice exporters to Saudi Arabia, specifically the estimated inverse residual demand
elasticities of all competitive rice exporters to Saudi Arabia, approximates the markup of price over marginal cost or Lerner index,
indicate that Australia, India, and Pakistan enjoy market power in Saudi rice importing market. The inverse residual demand for
International Journal of Scientific and Research Publications, Volume 8, Issue 1, January 2018 366 ISSN 2250-3153
366
countries was estimated and amounted to -0.14, -0.66 and -0.23 respectively, and statistically significant at the 0.05 level. However,
Thailand and the US face a perfectly elastic demand.
Based on of the above, the study recommends doing another study on importing companies to anticipate the possibility of the existence
of agreements for joint optimization of the monopolistic profits. As well as diversifying the base countries that Saudi import from, in
order to reduce the concentration of imports in certain countries.
REFERENCES
Al-Rwis, Khalid. “AIDS Model for Estimating Rice Imports from the Major Sources in Saudi Arabia.” Journal of Agriculture Science. Colle. Agric. Cairo Univ., Egypt, 2004. 2(55): 205-216.
[Arabic]
Baazeem, Hisham Abdullah. “Market Power among Rice Exporters to the Kingdom of Saudi Arabia.” Master thesis, Department of Agricultural Economics, Foods Sciences and Agriculture
College, King Saud University. 2007.
Central Department of Statistics & Information (CDSI). Ministry of Economy and Planning Annual Statistics Book. Saudi Arabia (1993-2014)
Consulate General of Pakistan. 2013. “Report: Rice Market of Saudi Arabia.” Jeddah, Saudi Arabia.
Evans, Edward A. and Ballen, Fredy H. “Competitive Behavior in the U.S. Green Skin Avocado Market”. Journal of Food Distribution Research. Volume 46. Issue 3, Nov 2015.
Food and Agriculture Organization of the United Nations (FAO). Statistics Division. http://faostat3.fao.org/home/E
General Authority for statistics (GASTAT). Kingdom of Saudi Arabia. http://www.stats.gov.sa/en/
Goldberg, P.K., Knetter, M.M. “Measuring the intensity of competition in export markets”. Journal International Economics. 1999. 47(1), 27–60.
Ismaiel, Sobhy M., and Al-Rwis, Khalid. “Measuring the Degree of Market Power among Main Countries Exporting Rice to the Kingdom of Saudi Arabia.” Journal Agriculture Science
studies. Univ. of Jordan. Deanship of Academic Res. 2009. 1(36) [Arabic]
Pall, Z., Perekhozhuk, O., Glauben, T., Prehn, S., Teuber, R. “Residual demand measures of market power of Russian wheat exporters”. Agricultural Economics. 2014. 45(3), 381-391.
Reed, Michael R. and Saghaian, Sayed H. “Measuring the Intensity of Competition in the Japanese Beef Market.” Journal of Agricultural and Applied Economics. Volume 36, Number 01,
113-121, April 2004.
Tasdogan, Celal, Tsakiridou, Efthimia and Mattas, Konstantinos. “Country Market Power in EU Olive Oil Trade”, South-Eastern Europe Journal of Economics, 2005. 3, issue 2, p. 211-219,
http://EconPapers.repec.org/RePEc:seb:journl:v:3:y:2005:i:2:p:211-219.
U.S. Department of Agriculture. (FAS). Global Agricultural Trade System Online (GATS): Standard query. 2016. Online: http://apps.fas.usda.gov/gats/ExpressQuery1.aspx
U.S. Department of Agriculture. (FAS). Production, Supply, and Distribution (PSD): Standard query. 2016. http://apps.fas.usda.gov/psdonline/psdQuery.aspx
United States Department of Agriculture (USDA). Foreign Agricultural Service (FAS). Grain and Feed Annual Saudi Arabia - GAIN Report Number: SA1502 Date: 5/14/2015
Zsombor Pall, Oleksandr Perekhozhuk, Thomas Glauben, S¨oren Prehn, Ramona Teuber. “Residual demand measures of market power of Russian wheat exporters.” Agricultural
Economics.2014. 45: 381–391
AUTHORS
First Author- Yosef Alamri is a Ph.D. student, Department of Agricultural Economics, University of Kentucky, Lexington,
KY. Email: [email protected].
Second Author - Sayed H. Saghain is a professor, Department of Agricultural Economics, University of Kentucky. Email:


![[PPT]PowerPoint Presentation - Thompson Rivers University · Web viewSaudi education: in the classroom In the 2007, Saudi schoolchildren ranked near the bottom of the 48 countriessurveyed](https://img.pdfslide.us/doc/110x75/5adaaf4f7f8b9afc0f8cd149/pptpowerpoint-presentation-thompson-rivers-university-viewsaudi-education-in.jpg)