Embed Size (px)
Citation preview

Export Potential in Lao PDR Processed Wood and Specialty Agriculture
International Trade Centre1
21 June 2019
1 This document has not been formally edited by the International Trade Centre.

2
Executive Summary
Environmental and economic sustainability is a key challenge for the Laotian
economy and its strategy towards exports
In the wood sector, the country needs to transition from large-scale logging and exports of natural,
unprocessed wood to a sustainable supply of plantation wood and exports of products with higher
domestic value-added. In the agricultural sector, there are products that have important export
potential, but leave a large environmental footprint (in particular, manioc).
Considering these aspects is important to protect the environment, but also to ensure production
capacity in the long-run. In devising its export strategy, Lao PDR needs to make sure that today’s export
successes do not harm tomorrow’s environment and economy.
The EU is a promising market for sustainable exports, but frictions need to be
addressed
The overall export potential of the country is larger in ASEAN and China than in the European Union
(EU). However, the EU is an important market for the more sustainable products in the two priority
sectors studied in this report. Increasing exports to the EU may thus be one pillar of a sustainable
export growth strategy for Lao PDR.
The additional exports that seem possible in ASEAN and China are predominantly driven by the
expected demand growth in these markets. Benefitting from it requires investing in promising sectors
to ensure that productive capacity is in line with increased demand. Opportunities for export growth
in the EU market, on the other hand, result from the fact that frictions are currently inhibiting higher
exports. Realizing export opportunities requires identifying and addressing those frictions.
Exports in the processed wood sector could grow by $31 million – and more if
the country diversifies its exports of furniture and other products
The total untapped export potential for processed wood products that the country already exports
(wood charcoal, sheets for veneering, parquet flooring, certain types of furniture) is $31 million. The
most important product is wood charcoal for which $19 million of additional exports seem possible
by 2023. Opportunities to diversify and start exporting new products that use domestic inputs from
the wood sector include other types of furniture as well as articles for sports and outdoor games.
The agricultural sector presents important opportunities for high-quality niche
products – existing ones, like coffee, and new ones, like black tea and flowers
Exports in the specialty agriculture sector (broadly defined) have the potential to grow by $447 million.
Topping the list of the most promising and sustainable crops in the sector, coffee has an estimated
export growth potential of $62 million. Diversification opportunities include black tea and fresh
flowers as well as preserved, frozen or dried vegetables that would allow Lao PDR to increase the
domestic value-added of its exports.

3
Table of Contents Executive Summary ................................................................................................................................. 2
Abbreviations .......................................................................................................................................... 4
Priority sectors ........................................................................................................................................ 5
Methodology ........................................................................................................................................... 5
Export potential indicator ................................................................................................................... 5
Product diversification indicator ......................................................................................................... 5
Value chain indicator .......................................................................................................................... 6
Export potential and employment ...................................................................................................... 6
Data ..................................................................................................................................................... 7
Interviews............................................................................................................................................ 7
Overall export potential by region .......................................................................................................... 8
Processed Wood ..................................................................................................................................... 9
The wood sector in Lao PDR ............................................................................................................... 9
Export Potential ................................................................................................................................ 10
Opportunities for Value Chain Development ................................................................................... 14
Specialty Agriculture ............................................................................................................................. 19
The agricultural sector in Lao PDR .................................................................................................... 19
Export Potential ................................................................................................................................ 19
Diversification Opportunities ............................................................................................................ 26
Opportunities for Value Chain Development ................................................................................... 30
References ............................................................................................................................................ 32
Annex .................................................................................................................................................... 33
Annex 1: List of products in sector “Processed Wood” .................................................................... 33
Annex 2: List of products in sector “Specialty Agriculture” .............................................................. 34

4
Abbreviations
ASEAN Association of Southeast Asian Nations
EPI Export potential indicator
EU European Union
FLEGT Forest Law Enforcement, Governance and Trade
GDP Gross domestic product
FDI Foreign direct investment
GTAP Global Trade Analysis Project
HS Harmonized System
IMF International Monetary Fund
ITC International Trade Centre
LFS Labour Force Survey
PDI Product diversification indicator
RoW Rest of the world (all other countries)
VCI Value chain indicator

5
Priority sectors This report focuses on two priority sectors: processed wood and specialty agriculture. The processed
wood sector comprises 55 products, the specialty agriculture sector 288 products.
Methodology This report analyses export opportunities using three different indicators: the export potential
indicator (EPI), the product diversification indicator (PDI) and the value chain indicator (VCI). This
section provides a brief explanation of each indicator and the underlying methodology. For more
details, please refer to Decreux and Spies (2016) for the EPI and PDI, to ITC (2018a) for the VCI, and to
ITC (2018b) for the employment potential methodology.
Export potential indicator The EPI serves countries that aim to support established export sectors in increasing their exports to
existing and new markets. It identifies potential export values based on supply capacities in the
exporting country, demand conditions in the target market and bilateral linkages between the two.
The EPI is computed for each product-destination combination, but only for products, which the
country already exports.2 The EPI goes beyond commonly used measures of comparative advantage
by including additional variables, such as gross domestic product (GDP) and population growth
prospects (until 2023), tariffs, and geographical distance. This allows accounting for expected
increases in domestic supply and market demand, for a country’s tariff advantage, and its distance to
the target market.
Any gap between a country’s export potential and its actual exports can result from two sources: first,
future economic growth in the country itself or demand growth in the target market (dynamic, or
growth-based export potential), and second, factors that trade advisors may address together with
local companies, such as lacking information about the rules and regulations of the target market or
difficulties to comply with them or to meet the (quality) preferences of its consumers (static, or
friction-based export potential).
This report provides information on the value of export potential in each priority sector in the EU,
ASEAN, China, and the rest of the world. It distinguishes between export potential that is already used,
static export potential that is not used due to some type of frictions, and dynamic export potential
that may be realized in view of the expected economic and demand growth until 2023.
Product diversification indicator The PDI serves countries that aim to diversify and develop new export sectors. Based on Hausmann
and Hidalgo's notion of the product space, the PDI identifies products that the country does not yet
export competitively, but which seem feasible given the country's current export basket and the
export baskets of similar countries.
The PDI starts from a country’s current supply capacities and identifies new export products into which
the country could diversify. It uses the concept of product space: the idea that a country with a certain
export portfolio can relatively easily diversify into new products currently exported by other countries
that have a similar export portfolio, as these countries are likely to have a similar set of production
capabilities. The PDI methodology improves the product space measure by accounting for natural
2 Lists of all products in the priority sectors are included in the Annex. They specify whether the Lao People’s Democratic Republic has export potential in each product or not.

6
endowments that are pivotal for a country to produce certain products and by incorporating demand
and market access information.
While the EPI predicts the potential value of exports, the PDI methodology yields a ranking of products
for export diversification. This report provides information on the highly ranked diversification
opportunities in specialty agriculture,3 and the current and projected market imports for these goods
in the EU, ASEAN, China, and the rest of the world.
Value chain indicator The VCI serves countries that aim to diversify and develop new export sectors that promote the
transformation of domestic products. It identifies vertical diversification opportunities with a high
probability of export success.
The VCI combines information on the input-output links between different sectors and the supply
capabilities revealed by the country’s current export basket.
- Input-output links: the VCI leverages data from input-output tables that represent inter-
sectoral relations, production and consumption in the entire economy.4 In particular, it uses
“technical coefficients” that capture the share of each sector’s input required to produce the
output of another sector.
- Supply capabilities: as the PDI described above, the VCI uses the concept of the product space
to capture the capabilities to supply new products by looking at how often other countries
export these new products jointly with products exported by the Lao People’s Democratic
Republic.
Similar to the PDI, the VCI methodology does not yield a value for potential exports, but a ranking of
vertical diversification opportunities. This report provides information on the diversification
opportunities that promote value chain development in the priority sectors.
Export potential and employment This ITC methodology quantifies the expected employment impacts of export growth. It connects a
country’s untapped export potential to an assessment of the number of jobs that could be created if
that potential was realized. The methodology considers job creation within each export sector (direct
effects) as well as linkages between sectors. Using input-output analysis, it also measures employment
created through increased demand for intermediate goods from upstream industries (indirect effects)
and greater consumption (induced effects). Accounting for these linkages is important as they tend to
prioritize sectors in which local value addition and wages are relatively high. In such sectors, the
induced effects from an increase in exports may be greater than the direct and/or indirect effects on
employment. The methodology estimates employment effects for the entire population and
disaggregated by gender.
3 The PDI is computed for specialty agriculture, but not for processed wood. The VCI is more pertinent than the PDI in the context of processed wood, as it helps identify opportunities for transforming existing products. 4 Input-output tables are not available for all countries. This report uses input-output tables of the United States, Mexico and the Philippines, as they reflect a range of different production structures and are sufficiently detailed to capture how Lao PDemocratic Republic may transform existing commodities into value-added export products.

7
Data The computations of the EPI, PDI and VCI use weighted five-year averages (2013-17) of trade data
from the ITC Trade Map.5 Information for tariff data comes from the ITC Market Access Map for the
latest available year. Geographic distance, a proxy for transport costs, is taken from a database
prepared by the Centre d’études prospectives et d’informations internationals (CEPII), gross domestic
product (GDP) from the International Monetary Fund (IMF) World Economic Outlook, and population
projections from the World Bank’s World Development Indicators database.
The export potential database comprises more than 4,000 product groups based on the six-digit level
of the Harmonized System (HS) classification. Certain products not compatible with international
conventions, highly dependent on natural resources or not in line with the ITC work program are
excluded, and some HS 6-digit codes are aggregated into a product group to allow for consistency
across HS revisions. The processed wood sector as defined in this report comprises 55 products,
whereas the specialty agriculture sector comprises 288 products. The respective lists of products are
included in annexes 1 and 2.
Employment results have been computed using ILO Labour Force Survey (LFS) data and an input-
output table built by Menon and Warr using 2002 data and covering three agricultural industries:
crops, livestock and poultry and forestry and logging.6
Interviews The qualitative analysis and its findings were complemented by interviews with local sector experts
from both the public and private sector (four interviews per sector). Interviews were conducted by
phone.
5 Trade data reported by the Lao People’s Democratic Republic is available for 2010-2016. The comparison of the country’s direct reports with mirror reports at sector-level reveals considerable differences. The country’s reliability score is ~0.3, while the threshold used to determine reliability is >0.5. Hence, for Lao PDR’s trade with a reliable reporter, only mirror data is used, while for trade with an unreliable reporter, an average of direct and mirror data is used for flows that are reported by both sides. 6 Should a more recent and sufficiently disaggregate input-output table for Lao PDR become available, employment results should be updated.

8
Overall export potential by region The total export potential of Lao PDR is about $9 billion. The largest share of this export potential lies
in the ASEAN region (close to $6 billion), whereas export potential in the EU is significantly smaller
($450 million). Exports to China also have a strong potential, of more than $2 billion (see figure 1). All
other countries combined (the rest of the world (RoW)) account for only $530 million.
As demand in ASEAN and China is expected to increase strongly over the coming years, the potential
for dynamic export growth is high, corresponding to 64% and 52% of total export potential,
respectively. Within the remaining current export potential to ASEAN, a large share (86%) is already
used, while only a small share is inhibited by frictions (14%), implying that Laotian exporters already
have good knowledge of the regional market. In order to reap export potential opportunities in ASEAN,
it is therefore crucial to strategically target sectors for which demand growth it high. Demand in the
EU, on the other hand, is expected to grow relatively slowly, and dynamic export growth potential
only corresponds to 29% of total export potential to this region. Current export potential to the EU is
used at only 27%, while 73% remains unused due to frictions. To increase exports to the EU, it is
necessary to identify and address those frictions.
Figure 1: Total export potential, by region
Source: ITC calculations based on ITC Export Potential Map data (2019).
$5.79 billion
$2.23 billion
$0.45 billion$0.53 billion
0
1
2
3
4
5
6
ASEAN China EU RoW
$ b
illio
n
Realized potential Friction-based untapped potential Growth-based untapped potential

9
Processed Wood7
The wood sector in Lao PDR
Lao PDR has a competitive advantage in producing wood, but the sector faces
important sustainability challenges
Lao PDR is recognized for its excellent climatic and soil conditions for agro-forestry. In the past, trade
in the wood sector was largely driven by exports of (almost) unprocessed natural wood8 to
neighbouring markets. To protect its natural resources, the Laotian government has recently
introduced legislation to a) limit the supply of wood to processing industries and b) ban a broad range
of wooden products from being exported. These changes in domestic policy affect the prospects for
processed wood exports from Lao PDR.
Lao PDR is currently enforcing a strict logging ban on natural wood to curb illegal logging activities and
allow natural forests to recover. Areas for plantation wood (wood specifically cultivated for logging
purposes) are still small and serve as a reliable source in the medium run, provided that the
government provides the required land concessions to the private sector. Hence, conversion wood
(e.g. gained from clearing areas for infrastructure projects) currently presents the largest source of
raw material for production purposes. As conversion wood is only irregularly accessible through
auctions and only available as a by-product of regional development projects, it cannot serve as a
sustainable and reliable source for downstream industries. Production levels of the processed wood
sector are expected to remain low until the supply shortage is resolved.
In addition to restricting access to raw material domestically, Lao PDR has also imposed an export ban
on unfinished wooden products since 2016 to further disincentivize illegal logging behaviour. Only
products featured on a narrowly defined export list are allowed to be sold to foreign markets,
including semi-finished items unequivocally originating from sustainable plantation wood. These
restrictions are perceived as an important obstacle for the private sector. Foreign buyers sometimes
demand products which slightly deviate from the specifications set out on the export list, and the
impossibility of exporting such customized products results in missed business opportunity.
Together, the persistent supply shortage and ongoing export ban are expected to limit the production,
and hence the export potential of processed wood products in the short and medium run. In the long
run, sustainable production capacity in the processed wood sector crucially depends on the availability
plantation wood as an input. Sustainability thus emerges as a key challenge for the sector, with the
need of moving towards larger domestic value-added given limited wood supply in the short run, and
ensuring reliable and sustainable wood supply at a large scale in the long run.
7 A detailed list of all products in the Processed Wood sector is included in Table 1 (Annex). 8 Natural wood refers to trees that have grown naturally, as opposed to plantation and conversion wood.

10
Export Potential
“Sawn/chipped wood” has large export potential ($790 million), but it is
declining under the export ban
Lao PDR has export potential in 15 different wood products. With $790 million, “wood, sawn/chipped
lengthwise, sliced/peeled, thickness >6mm” represents 94% of total export potential in the processed
wood sector (figure 2). Most of the export potential in this product lies in ASEAN (48%) and China
(45%). These results are driven by data on past exports of sawn/chipped wood, which were indeed
important. However, product exports are falling under the export ban the Laotian government has
established to protect its natural resources. Hence, firms in the sector have to search for other, more
sustainable export alternatives.
Figure 2: Export potential in processed wood, by product and destination
Source: ITC calculations based on ITC Export Potential Map data (2019).
Fully exploiting the export potential in products authorized under the export
ban could increase exports in processed wood by $31 million
The processed wood products that remain authorized under the export ban combine a total export
potential of $54 million, out of which $31 million are currently untapped. Fully realizing this export
potential would lead to the creation of about 12,500 jobs – about 125 in the wood products sector
itself, about 6,500 in the wood products value chain, and about 5,900 through increased consumption
in the rest of the economy.
The most important authorized export product is “wood charcoal”, with an
untapped export potential of $19 million
The second most important product is “wood charcoal, incl. nut or shell charcoal”, which represents
$35 million, or 4% of the total export potential in the sector. 47% of export potential is currently used,
0 200 400 600 800
Wood, sawn/chipped lengthwise, sliced/peeled,thickness >6mm
Wood charcoal, incl. shell or nut charcoal
Other products
$ millionRealized potential Friction-based untapped potential Growth-based untapped potential
Export potential, by destination
ASEAN
EU
China
RoW
EU
ASEAN
China
RoW

11
32% unused due to frictions, and 21% driven by expected growth (figure 3). 34% of export potential
in this product lies in ASEAN, 22% in China, 17% in the EU, and 27% elsewhere.
Figure 3: Export potential in processed wood, by product, excluding sawn/chipped wood
Source: ITC calculations based on ITC Export Potential Map data (2019).
The remaining 13 products account for only 2% of the total export potential. In this group of products, 32% of export potential is already used, and 23% is dynamic export potential stemming from expected growth in markets. At 45%, unused static export potential is particularly high, implying that frictions are important for these less established export products. They are also the products with the highest share of export potential to the EU (22%).
Other products with export potential include sheets for veneering, parquet
flooring and furniture
A yet more disaggregated perspective, displayed in figure 4, reveals the main products in this group.
Those with a total export potential above $1 million include sheets for veneering, wood for parquet
flooring and different types of furniture. The share of untapped export potential is relatively high in
this category, impyling that it is possible to achieve substantial relative increases should frictions be
overcome. However, total export potential in this group of products is still small, totalling only $18
million.
Figure 4: Export potential in processed wood, by product, excluding sawn/chipped wood and
wood charcoal
Source: ITC calculations based on ITC Export Potential Map data (2019).
0 5 10 15 20 25 30 35 40
Wood charcoal
Other
$ million
Realized potential Friction-based untapped potential Growth-based untapped potential
0 1 2 3 4 5 6
Sheets for veneering, plywood
Wood for parquet flooring
Seats with wooden frames
Sheets for veneering, coniferous plywood
Plywood, veneered panel, laminated wood
Wooden furniture, nes
Other wood products
$ million
Realized potential Friction-based untapped potential Growth-based untapped potential

12
Sawn/chipped wood was mostly exported to Asian countries, but the EU is an
important potential market for more sustainable wood products
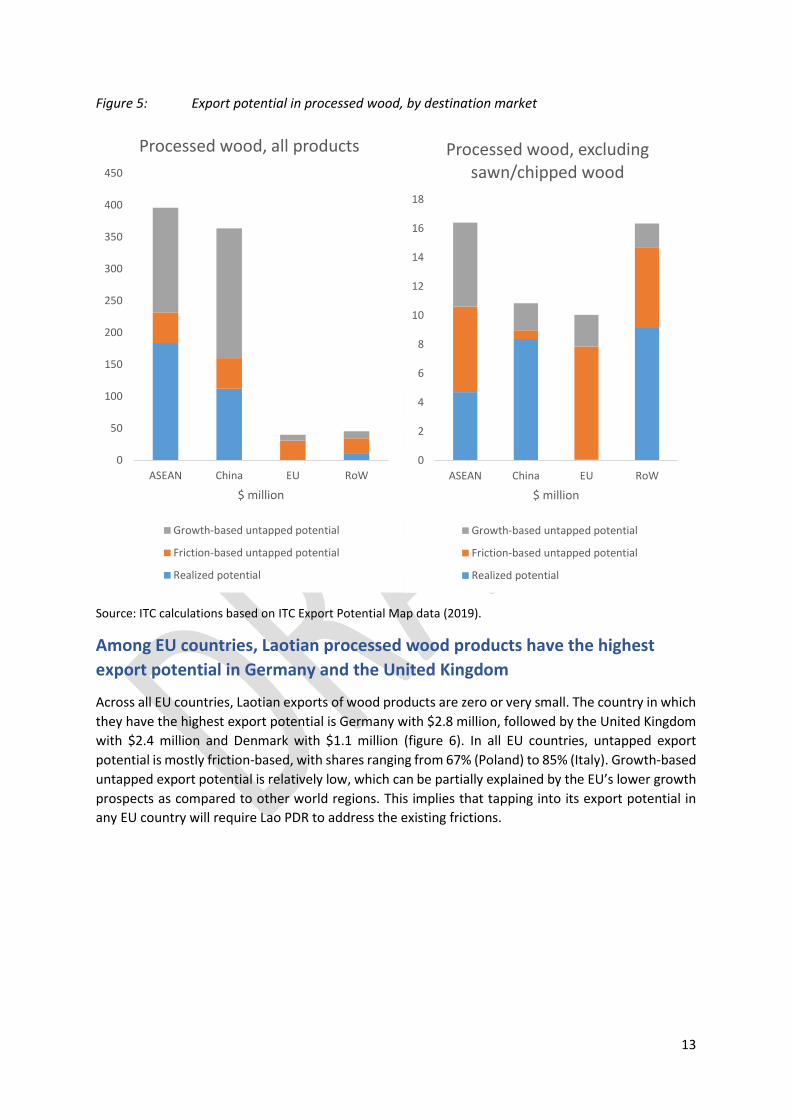
When accounting for all wood products, including those currently prohibited by the export ban (figure
5, right side), ASEAN is by far the region with the highest export potential ($396 million, or 47% of
total export potential). China accounts for 43% of Lao PDR’s processed wood export potential with
$363 million. With $40 million, the export potential to the EU is much smaller, representing only 4.7%
of the total.
When excluding sawn/chipped wood (figure 5, graph on the left), ASEAN remains the market with the
highest export potential ($16 million, or 31% of total export potential). China comes second with $11
million (20%), while the EU market gains in relative importance with $10 million (19%). In ASEAN,
about one third of total export potential is already realized, one third is driven by frictions, and one
third driven by expected growth. In China, a large share (77%) of export potential already is realized,
leaving only $2.5 million in export growth potential. While total export potential in the EU is slightly
smaller than in China, it is still virtually unused (less than 1% is realized). Hence, opportunities to
realize additional exports in the EU ($10 million) are much larger than in China, and almost as large as
in ASEAN ($12 million).
Frictions need to be identified and addressed to benefit from export potential
in the EU market
While frictions represent about half of untapped export potential in ASEAN and about a quarter in
China, this share is much larger (78%) in the EU. This implies that frictions are an important hindrance
for Laotian exports to the EU – these frictions need to be identified and addressed in order for the
country to benefit from opportunities in the EU market.
Findings from the qualitative interviews suggest that exports to European markets are limited by less
established trade networks, high certification requirements (e.g. Forest Law Enforcement,
Governance and Trade (FLEGT)) and high transport costs. ASEAN markets are much more accessible
than European markets, both in terms of certification requirements and transport costs. Regional
trade frictions are mostly limited to informal border taxes occasionally applied to shipments to
Thailand or disproportionate transport costs for small shipments to Viet Nam. China incentivizes
imports of raw material to support its domestic processing industry and imposes additional fees on
processed wood imports from Lao PDR.
13
Figure 5: Export potential in processed wood, by destination market
Source: ITC calculations based on ITC Export Potential Map data (2019).
Among EU countries, Laotian processed wood products have the highest
export potential in Germany and the United Kingdom
Across all EU countries, Laotian exports of wood products are zero or very small. The country in which
they have the highest export potential is Germany with $2.8 million, followed by the United Kingdom
with $2.4 million and Denmark with $1.1 million (figure 6). In all EU countries, untapped export
potential is mostly friction-based, with shares ranging from 67% (Poland) to 85% (Italy). Growth-based
untapped export potential is relatively low, which can be partially explained by the EU’s lower growth
prospects as compared to other world regions. This implies that tapping into its export potential in
any EU country will require Lao PDR to address the existing frictions.
0
50
100
150
200
250
300
350
400
450
ASEAN China EU RoW
$ million
Processed wood, all products
Growth-based untapped potential
Friction-based untapped potential
Realized potential
0
2
4
6
8
10
12
14
16
18
ASEAN China EU RoW
$ million
Processed wood, excluding sawn/chipped wood
Growth-based untapped potential
Friction-based untapped potential
Realized potential

14
Figure 6: Export potential in processed wood to the EU, excluding sawn/chipped wood
Source: ITC calculations based on ITC Export Potential Map data (2019).
Export potential in ASEAN lies almost exclusively in Thailand and Viet Nam
Thailand is by far the most important export potential destination for Lao PDR in ASEAN, with $12
million in total, out of which $9 million are yet to be realized (figure 7). Viet Nam is second, with a
total of $4 million, half of which untapped. All other ASEAN countries combined represent export
opportunities of only $175,000. Untapped export potential is about half friction-based and half
growth-based in both Thailand and Viet Nam. Frictions appear to be a relatively less important
constraint to exports within the region than to those destined to the EU.
Figure 7: Export potential in processed wood to ASEAN, excluding sawn/chipped wood
Source: ITC calculations based on ITC Export Potential Map data (2019).
0
0.5
1
1.5
2
2.5
3
$ million
Realized potential Friction-based untapped potential Growth-based untapped potential
0
2
4
6
8
10
12
14
Thailand Viet Nam Other
$ million
Realized potential Friction-based untapped potential Growth-based untapped potential
15
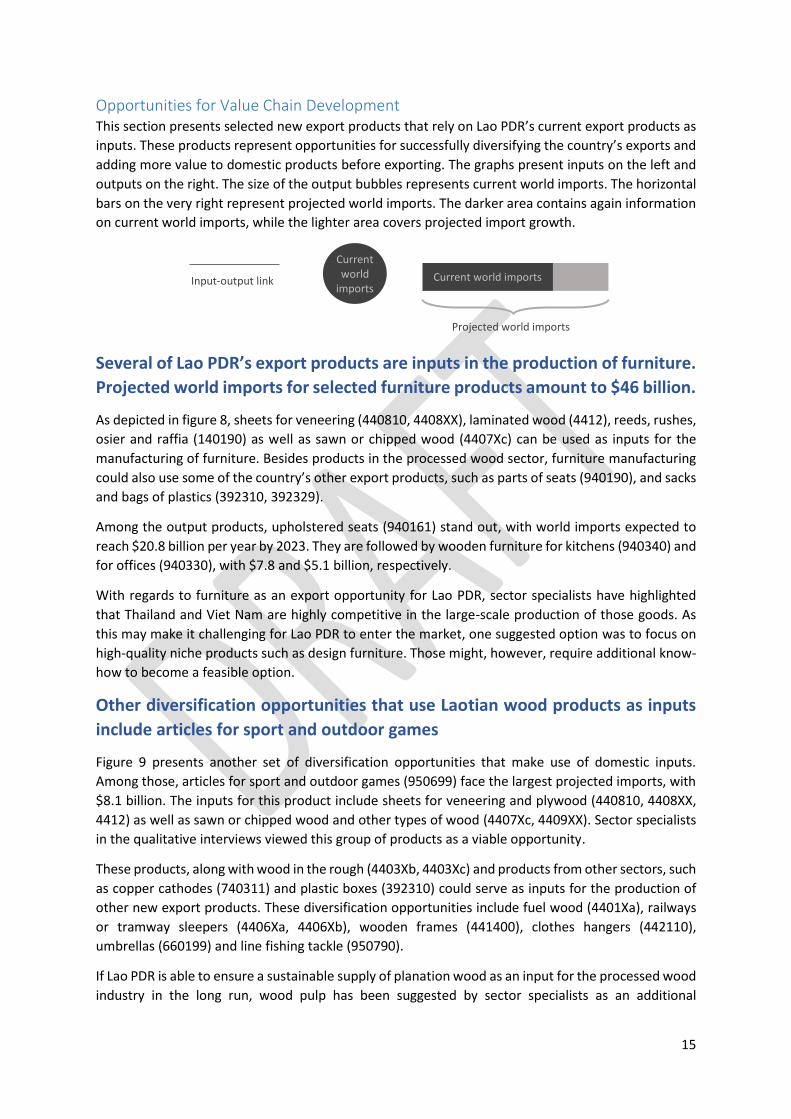
Opportunities for Value Chain Development This section presents selected new export products that rely on Lao PDR’s current export products as
inputs. These products represent opportunities for successfully diversifying the country’s exports and
adding more value to domestic products before exporting. The graphs present inputs on the left and
outputs on the right. The size of the output bubbles represents current world imports. The horizontal
bars on the very right represent projected world imports. The darker area contains again information
on current world imports, while the lighter area covers projected import growth.
Several of Lao PDR’s export products are inputs in the production of furniture.
Projected world imports for selected furniture products amount to $46 billion.
As depicted in figure 8, sheets for veneering (440810, 4408XX), laminated wood (4412), reeds, rushes,
osier and raffia (140190) as well as sawn or chipped wood (4407Xc) can be used as inputs for the
manufacturing of furniture. Besides products in the processed wood sector, furniture manufacturing
could also use some of the country’s other export products, such as parts of seats (940190), and sacks
and bags of plastics (392310, 392329).
Among the output products, upholstered seats (940161) stand out, with world imports expected to
reach $20.8 billion per year by 2023. They are followed by wooden furniture for kitchens (940340) and
for offices (940330), with $7.8 and $5.1 billion, respectively.
With regards to furniture as an export opportunity for Lao PDR, sector specialists have highlighted
that Thailand and Viet Nam are highly competitive in the large-scale production of those goods. As
this may make it challenging for Lao PDR to enter the market, one suggested option was to focus on
high-quality niche products such as design furniture. Those might, however, require additional know-
how to become a feasible option.
Other diversification opportunities that use Laotian wood products as inputs
include articles for sport and outdoor games
Figure 9 presents another set of diversification opportunities that make use of domestic inputs.
Among those, articles for sport and outdoor games (950699) face the largest projected imports, with
$8.1 billion. The inputs for this product include sheets for veneering and plywood (440810, 4408XX,
4412) as well as sawn or chipped wood and other types of wood (4407Xc, 4409XX). Sector specialists
in the qualitative interviews viewed this group of products as a viable opportunity.
These products, along with wood in the rough (4403Xb, 4403Xc) and products from other sectors, such
as copper cathodes (740311) and plastic boxes (392310) could serve as inputs for the production of
other new export products. These diversification opportunities include fuel wood (4401Xa), railways
or tramway sleepers (4406Xa, 4406Xb), wooden frames (441400), clothes hangers (442110),
umbrellas (660199) and line fishing tackle (950790).
If Lao PDR is able to ensure a sustainable supply of planation wood as an input for the processed wood
industry in the long run, wood pulp has been suggested by sector specialists as an additional
Current world imports
Projected world imports
Current world
imports Input-output link

16
opportunity for export diversification. In the future, wood pulp may play an important role as a
sustainable substitute for cotton in textile industries in Thailand and Viet Nam.

17
Figure 8: Diversification opportunities for value chain development, furniture
Source: ITC calculations based on ITC Export Potential Map data (2019).
Inputs Outputs World imports
$5.9 bn
$3.7 bn
$207 mn
$3.5 bn
$16.1 bn
$5.5 bn
$1.9 bn
$1.4 bn
$64 mn
$1.2 bn
$4.8 bn
$1.8 bn

18
Figure 9: Diversification opportunities for value chain development, other wood products
Source: ITC calculations based on ITC Export Potential Map data (2019).
Inputs Outputs World imports
$1.0 bn
$6.5 bn
$950.1 mn
$340.6 mn
$874.4 mn
$253.8 mn
$435.2 mn
$423.7 mn
$2.7 bn
$454.8 mn
$47.4 mn
$65.6 mn
$28.7 mn
$20.2 mn

19
Specialty Agriculture9
The agricultural sector in Lao PDR
High-quality niche products are considered a promising opportunity for
Laotian agricultural exports
Exporting commercial crops on a large scale would be challenging for Lao PDR, as its limited size and
labour force and lack of sea access make it difficult to compete on price. Instead, Lao PDR’s
comparative advantage lies in its topography, which allows growing a wide range of specialty
vegetables and fruits and its perception as an organic origin due to a traditionally low usage of
fertilizers. High quality niche products that market their exotic origin or organic nature are deemed to
be the way forward.
With respect to the analysis presented in this report, it should be noted that it is methodologically
challenging to study specialty agriculture using international trade data. This analysis uses data at the
6-digit level of the HS classification. At this level of detail, and even in more disaggregated data that is
reported by some countries, it is not possible to distinguish high-quality or specialty varieties of a
product from ordinary ones. For example, organic specialty coffee from a particular cultivation area
falls under the same HS code as any low-quality variety. Hence, this analysis provides an overview of
products and markets in which Lao PDR has export potential, but needs to be complemented by more
in-depth information whenever it is necessary to clearly distinguish between specialty and non-
specialty varieties.
In addition, the niche nature of several specialty agriculture products makes it challenging to compute
reliable export potential figures, as trade flows tend to be small and volatile. This is especially the case
for products the country has only started exporting very recently. During the expert interviews, several
specialty agriculture products that did not figure prominently in the report were mentioned, for
example mulberry, sticky rice or macadamia nuts. These may indeed present interesting niche
products for export, but individually account for a very small fraction of exports and/or export
potential, which is why they could not be considered in the quantitative section of this report.
Export Potential
Fully exploiting export potential in specialty agriculture to ASEAN, China and
the EU could increase Lao PDR’s exports by $447 million
Lao PDR has an export potential of $634 million in specialty agriculture. Fully realizing this potential
could increase exports by $447 million and create about 229,000 jobs: 111,000 in the export sectors
directly, 10,000 in upstream sectors in the value chain, and 108,000 through increased demand in
other sectors in the economy.
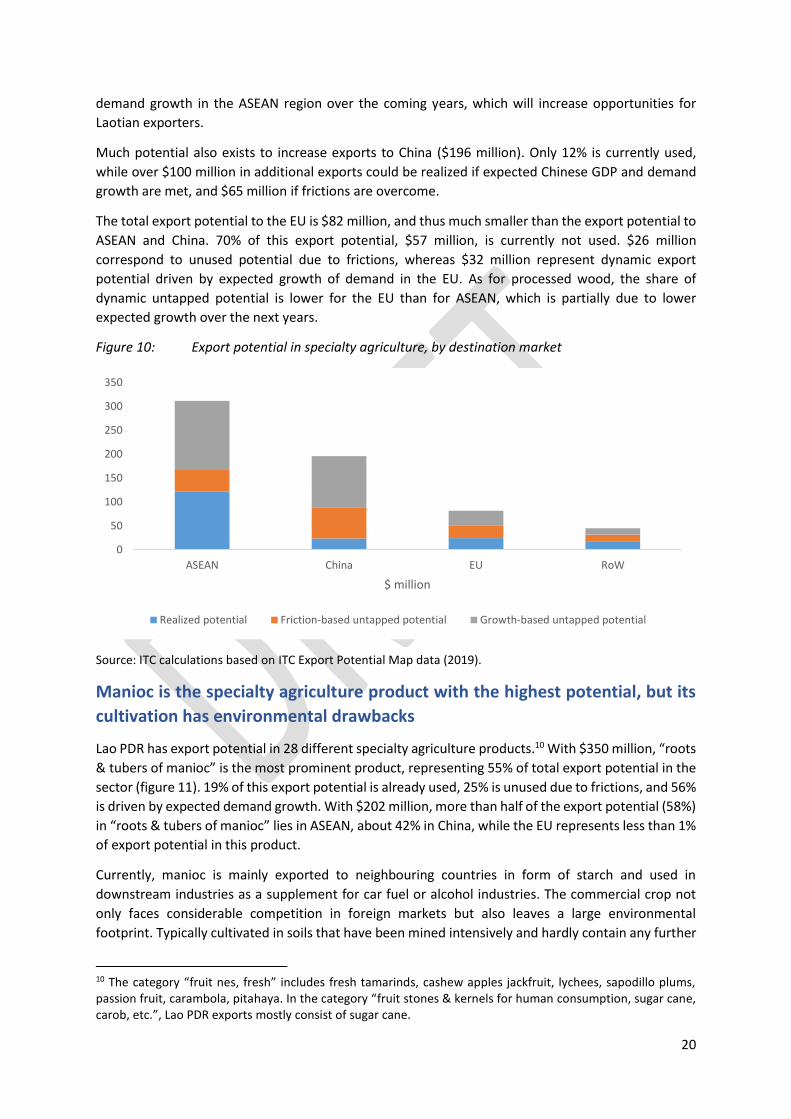
The region with the highest export potential is ASEAN ($311 million), which accounts for 49% of Lao
PDR’s total export potential in specialty agriculture (figure 10). While 39% of this export potential is
already used, fully exploiting the remaining 61% would correspond to additional exports of $189
million. Within the unused export potential, $44 million is static export potential, likely to be unused
due to frictions. Another $145 million is dynamic export potential. It stems from expected GDP and
9 A detailed list of all products in the Specialty Agriculture sector is included in Annex 2.
20
demand growth in the ASEAN region over the coming years, which will increase opportunities for
Laotian exporters.
Much potential also exists to increase exports to China ($196 million). Only 12% is currently used,
while over $100 million in additional exports could be realized if expected Chinese GDP and demand
growth are met, and $65 million if frictions are overcome.
The total export potential to the EU is $82 million, and thus much smaller than the export potential to
ASEAN and China. 70% of this export potential, $57 million, is currently not used. $26 million
correspond to unused potential due to frictions, whereas $32 million represent dynamic export
potential driven by expected growth of demand in the EU. As for processed wood, the share of
dynamic untapped potential is lower for the EU than for ASEAN, which is partially due to lower
expected growth over the next years.
Figure 10: Export potential in specialty agriculture, by destination market
Source: ITC calculations based on ITC Export Potential Map data (2019).
Manioc is the specialty agriculture product with the highest potential, but its
cultivation has environmental drawbacks
Lao PDR has export potential in 28 different specialty agriculture products.10 With $350 million, “roots
& tubers of manioc” is the most prominent product, representing 55% of total export potential in the
sector (figure 11). 19% of this export potential is already used, 25% is unused due to frictions, and 56%
is driven by expected demand growth. With $202 million, more than half of the export potential (58%)
in “roots & tubers of manioc” lies in ASEAN, about 42% in China, while the EU represents less than 1%
of export potential in this product.
Currently, manioc is mainly exported to neighbouring countries in form of starch and used in
downstream industries as a supplement for car fuel or alcohol industries. The commercial crop not
only faces considerable competition in foreign markets but also leaves a large environmental
footprint. Typically cultivated in soils that have been mined intensively and hardly contain any further
10 The category “fruit nes, fresh” includes fresh tamarinds, cashew apples jackfruit, lychees, sapodillo plums, passion fruit, carambola, pitahaya. In the category “fruit stones & kernels for human consumption, sugar cane, carob, etc.”, Lao PDR exports mostly consist of sugar cane.
0
50
100
150
200
250
300
350
ASEAN China EU RoW
$ million
Realized potential Friction-based untapped potential Growth-based untapped potential

21
nutrients, it is treated as a crop of “last resort”. Manioc requires few inputs (such as fertilizer) and has
deep roots, which extract all remaining nutrients from the soil. After harvest, the soil is often not
suited for further cultivation and suffers from severe soil erosion. Hence, although manioc shows up
as a product with large export potential, especially in ASEAN countries and China, sector experts have
suggested that it might not be advisable to promote it given its important environmental drawbacks.
Figure 11: Export potential in specialty agriculture, by product and destination market
Source: ITC calculations based on ITC Export Potential Map data (2019).
Fully exploiting export potential in coffee, the second export potential
product, could increase exports by $62 million
The second most important export potential product is “coffee, not roasted, not decaffeinated”,
amounting to $125 million, or 20% of total export potential in specialty agriculture. The EU represents
the largest market for this product ($61 million, 49%), while ASEAN follows second ($38 million, 31%).
China remains relatively small ($3 million, 2%) (figure 11).
In the EU, Lao PDR currently exploits about 36% of its total export potential, implying that it could
increase its exports by $39 million in this region alone (figure 12). 38% of this export growth potential
is currently hindered by frictions, whereas the remaining 62% are driven by expected GDP and demand
growth. This implies that the frictions faced by Laotian exporters in the EU market are relatively less
constraining in the coffee sector than in other sectors. Nonetheless, addressing them could increase
exports by $15 million, thanks to the overall size of the sector. In the ASEAN market, Lao PDR is
currently exploiting 64% of its export potential. Of the remaining $14 million in untapped export
potential, 48% are caused by frictions and 52% by expected growth.
0 50 100 150 200 250 300 350 400
Roots & tubers of manioc
Coffee, not roasted, not decaffeinated
Fruit stones & kernels, sugar cane, carob, etc.
Fruits nes, fresh
Cabbages, kohlrabi, kale, fresh
Sweet potatoes
Other products
$ million
EU ASEAN China RoW

22
Figure 12: Export potential of coffee, by destination market
Source: ITC calculations based on ITC Export Potential Map data (2019).
As highlighted by sector experts, Coffee is a prime example of a niche product. High quality coffee
varieties from Lao PDR such as “mountain coffee” from the Northern parts of the country are sold
globally and benefit from relatively well established supplier-buyer networks in European, ASEAN and
Chinese markets. Challenges in the coffee sector mainly relate to two areas: quality and processing
capacity. Difficulties in upholding consistent levels of quality, especially in reaction to demand shocks,
can restrict access to export markets while limited domestic processing capacity restricts Laotian
producers to export raw beans rather than high-priced roasted varieties. In the EU, larger distance and
higher certification standards limit coffee exports to a group of niche products. In ASEAN and China,
less refined varieties of coffee are increasingly sold at respectable prices as certification standards and
diversification requirements are lower than in EU markets.
Lao PDR has export potential to the EU in 28 specialty agriculture products –
in 15 of them, more than 50% of export potential is unused due to frictions
The product with the highest export potential to the EU is “coffee, not roasted, not decaffeinated”,
which represents $61 million, or 74% of total export potential in specialty agriculture (figure 13). It is
followed by “fruit stones & kernels for human consumption, sugar cane, carob, etc.” ($6 million, 7%),
“bananas, fresh or dried” ($3 million, 4%) and “sweet potatoes” ($3 million, 3%). All other products
represent less than $2 million and less than 2% of total export potential. The share of export potential
unused due to frictions is relatively low (24%) in the main export potential product (“coffee, not
roasted, not decaffeinated”), implying that Lao’s coffee exporters are already relatively well informed
about how to access the European coffee market. Yet, another $15 million of exports seem possible if
all opportunities were fully exhausted. In many other products, the share of unused static export
potential is high – for 15 of them, it lies above 50%.
0
10
20
30
40
50
60
70
EU ASEAN RoW China
$ million
Realized potential Friction-based untapped potential Growth-based untapped potential

23
Figure 13: Export potential in specialty agriculture to the EU, by product
Source: ITC calculations based on ITC Export Potential Map data (2019).
Germany is the EU country with the most important opportunities for Laotian
exporters. The share of unused export potential varies considerably across EU
destinations.
Among the 20 EU countries to which Lao PDR has export potential in specialty agriculture, Germany is
the most important one, representing $38 million or 47% of total export potential to the EU (figure
14). The share of export potential that is unused due to frictions is 29% ($11 million). This share
however varies significantly across destinations: while it is relatively low for Italy (6%) and Belgium
(9%), it lies above 40% for 12 countries. These include large export potential destinations such as the
United Kingdom and the Netherlands, to which the export potential is of $8 million and $4 million,
respectively. With an average of 39%, the share of export potential to the EU driven by expected
demand growth is significantly higher for specialty agriculture than for processed wood.
0 10 20 30 40 50 60 70
Coffee, not roasted, not decaffeinated
Fruit stones & kernels, sugar cane, carob, etc.
Bananas, fresh or dried
Sweet potatoes
Cabbages, kohlrabi, kale, fresh
Fruits nes, fresh
Other products
$ million
Realized potential Friction-based untapped potential Growth-based untapped potential

24
Figure 14: Export potential in specialty agriculture to the EU, by country
Source: ITC calculations based on ITC Export Potential Map data (2019).
Export potential in specialty agriculture to ASEAN is almost exclusively driven
by exports to Thailand and Viet Nam, the most important product being
“roots & tubers of manioc”
The specialty agriculture product with the highest export potential to ASEAN is “roots & tubers of
manioc”, representing $202 million, or 65% of total export potential (figure 15). 15% of this export
potential, or $31 million, is currently not used due to frictions. The next most important export
potential products are coffee, cabbages and fruits, nes. Frictions preventing exports appear to be less
of a hurdle in Laotian exports to ASEAN than to the EU. They are above 40% of total export potential
for 5 of the 25 products with export potential to ASEAN, as opposed to 16 of 27 in exports to the EU.
Figure 15: Export potential in specialty agriculture to ASEAN, by product
Source: ITC calculations based on ITC Export Potential Map data (2019).
0 5 10 15 20 25 30 35 40
Germany
United Kingdom
Italy
Netherlands
Belgium
France
Denmark
Sweden
Poland
Other countries
$ million
Realized potential Friction-based untapped potential Growth-based untapped potential
0 50 100 150 200 250
Roots & tubers of manioc
Coffee, not roasted, not decaffeinated
Cabbages, kohlrabi, kale, fresh
Fruits nes, fresh
Sweet potatoes
Fruit stones & kernels, sugar cane, carob, etc.
Other products
$ million
Realized potential Friction-based untapped potential Growth-based untapped potential

25
Export potential to ASEAN is almost entirely driven by two destinations, Thailand ($225 million, 72%)
and Viet Nam ($84 million, 27%) (figure 16). For both of them, the share of export potential which is
unused due to frictions is relatively low (respectively 16% and 9%).
Figure 16: Export potential in specialty agriculture to ASEAN, by country
Source: ITC calculations based on ITC Export Potential Map data (2019).
Most of the export potential to China for specialty agriculture lies in “roots &
tubers of manioc”
Three quarters of Lao PDR’s export potential to China in specialty agriculture products lies in “roots &
tubers of manioc” ($146 million) (figure 17). Current exports are almost non-existent ($731 thousand).
More than half of the remaining potential is driven by expected Chinese GDP and demand growth ($89
million), the rest is due to frictions ($56 million).
All other products represent together about $50 million of export potential. Most of the untapped
potential ($18 million out of $27 million) comes from expected Chinese GDP and demand growth.
Figure 17: Export potential in specialty agriculture to China, by product
Source: ITC calculations based on ITC Export Potential Map data (2019).
0 50 100 150 200 250
Thailand
Viet Nam
Other countries
$ million
Realized potential Friction-based untapped potential Growth-based untapped potential
0 20 40 60 80 100 120 140 160
Roots & tubers of manioc
Fruit stones & kernels for human consumption, sugarcane, carob, etc.
Fruits nes, fresh
Manioc starch
Other products
$ million
Realized potential Friction-based untapped potential Growth-based untapped potential

26
Diversification Opportunities
13 of Lao PDR’s top-20 diversification opportunities are in the specialty
agriculture sector, the most important in terms of market imports being
“cocoa beans”, “cashew nuts, shelled” and “black tea, packings > 3kg”
The specialty agriculture sector comprises a large share of the products with the highest potential for
export diversification. 13 of the 20 products with the highest potential for export diversification are in
this sector, and another 11 are ranked between 21 and 87.
Figure 18 displays the most important specialty agriculture products for export diversification, ordered
by diversification rank. Bars on the right side of the graph capture current and projected world imports
from all countries to which Lao PDR is expected to be able to export.11 The diversification opportunity
rank differs from world market size, as it is driven by other factors, including a “density” measure that
captures how close Lao PDR is to being able to export this product, and information on tariffs and
distances.
The products with the highest imports are “cocoa beans” ($10 billion current and $16 billion projected
imports), “cashew nuts, shelled” ($4 billion and $6 billion), “cut flowers and buds, fresh” ($4 billion
and $5 billion) and “Black tea, packings > 3kg” ($3 billion and $5 billion).
According to sector experts, the cultivation of cocoa beans in Lao PDR may face natural limitations
due to a lack of humidity. Moreover, large competitors in the region would make it difficult to reach
the needed scale to offer products at attractive prices. The latter applies to cashew nuts as well. While
there do not seem to be natural limitations in cultivating them, neighbours like Cambodia possess a
competitive advantage and currently dominate regional markets.
Tea, on the other hand, is regarded as a promising niche product and shares similar challenges and
opportunities as coffee. Consistently referred to as a promising source of future export revenue, high
quality tea varieties in Lao PDR benefit from their exotic character (e.g. wild tea and forest tea) and a
reputation of being more organic than foreign counterparts, despite the fact that not all producers in
the country hold related certifications. Tea exports to the EU remain very low due to weak trade
networks, high transport costs, insufficient packaging and difficulties to adapt products to local taste.
Consequently, sector experts see more important opportunities in Asian markets (ASEAN, China,
Japan) whereas exports to the EU are expected to remain small and concentrated on high-quality
varieties.
Flowers as a potential candidate for export diversification would require further development of
cooling chains in order to preserve them during transport. This technology exists in neighbouring
Thailand and could be imported or brought in through foreign direct investment (FDI).
11 It is not possible to compute (expected) imports from Lao PDR alone, as the country is not exporting (or not exporting sufficiently large quantities) of these products yet.

27
Figure 18: Market imports of specialty agriculture products with opportunities for diversification
Source: ITC calculations based on ITC Export Potential Map data (2019).
Black tea presents diversification potential in most important EU and ASEAN
markets and China – and import demand is expected to grow significantly
“Black tea (packings > 3kg)” is among the top-5 products for diversification in many important markets
considered in this study: 22 EU countries, six ASEAN countries and China. Among those, the countries
with the largest imports are the United Kingdom, Germany, China, Poland, the Netherlands and
Malaysia. In all of those major markets, projected imports are considerably larger than current
imports: imports are expected to increase by more than 50% in all of them (figure 19). This predicted
rise in import demand may present opportunities for Lao PDR to start exporting black tea.
537
977
52
483
299
391
1,028
2,440
1,113
4,991
724
1,197
595
333
3,659
1,833
4,227
1,492
3,419
769
2,394
4,960
6,400
15,632
0 2,000 4,000 6,000 8,000 10,000 12,000 14,000 16,000
Onions & shallots, fresh (Rank 87)
Chickpeas, dried & shelled (Rank 80)
Nutmeg (Rank 68)
Cardamom (Rank 65)
Dried peaches, pears, papaws "papayas", tamarinds…
Green tea, packings > 3 kg (Rank 43)
Seaweeds & other algae (Rank 39)
Kidney beans "Phaseolus vulgaris", dried & shelled…
Desiccated coconuts (Rank 27)
Cut flowers & buds, fresh (Rank 25)
Cloves (Rank 21)
Vanilla (Rank 20)
Roots & tubers nes, sago pith (Rank 18)
Turmeric "curcuma" (Rank 16)
Pepper (Piper), not crushed, not ground (Rank 14)
Pineapples, prepared or preserved (Rank 13)
Nuts nes (Rank 12)
Legumes nes, dried & shelled (Rank 9)
Pineapples, fresh or dried (Rank 8)
Coconuts, fresh (Rank 6)
Beans "Vigna mungo or Vigna radiata", dried & shelled…
Black tea, packings >3kg (Rank 3)
Cashew nuts, shelled (Rank 2)
Cocoa beans (Rank 1)
$ million
Current market imports Projected market imports

28
Figure 19: Market imports of black tea (packings > 3kg), selected importers
Source: ITC calculations based on ITC Export Potential Map data (2019).
Cut flowers present diversification potential in most important markets –
import demand is expected to grow faster in Asia than in the EU
“Cut flowers and buds, fresh” show diversification potential in most of the countries considered in this
study; however, they rank lower than black tea in all of them, indicating that the likelihood of
successfully exporting flowers is slightly lower than that of tea.
Figure 20 presents the current and projected imports of cut flowers of the top-importers in ASEAN,
the EU and China that are likely to import flowers from Lao PDR. Several EU countries are important
importers of cut flowers, and demand in those countries is expected to grow by between 13% (Latvia)
and 45% (Ireland) (figure 20). While total imports are smaller, expected import growth is larger in the
most important Asian markets, with 74% in Thailand and 100% in China.
0 100 200 300 400 500
Malaysia
Netherlands
Poland
China
Germany
United Kingdom
$ million
Market imports Projected market imports

29
Figure 20: Market imports of fresh cut flowers, selected importers
Source: ITC calculations based on ITC Export Potential Map data (2019).
0 20 40 60 80 100 120 140 160
Thailand
Latvia
China
Romania
Finland
Lithuania
Ireland
Denmark
Czech Republic
Spain
Sweden
Poland
$ million
Market imports Projected market imports

30
Opportunities for Value Chain Development This section presents selected new export products that rely on Lao PDR’s current export products as
inputs. These products represent opportunities for successfully diversifying the country’s exports and
adding more value to domestic products before exporting. The graphs present inputs on the left and
outputs on the right. The size of the output bubbles represents current world imports. The horizontal
bars on the very right represent projected world imports. The darker area contains again information
on current world imports, while the lighter area covers projected import growth.
Domestically grown vegetables could be transformed into vegetables mixtures
for export diversification
Asparagus (070920) and beetroot (070690) serve as inputs into the production of all diversification
opportunities. Other relevant inputs include cabbages (070490), capsicum or pimenta fruits (070960)
and sweet potatoes (071420). These products neared $22 billion in exports in 2017, with cabbages
accounting for almost 60%.
The diversification opportunities that could be produced using these export products, along some
others such as papaya (080720), ginger (0910XX), raw cane sugar (1701XX) and other vegetables
(0709XX), are displayed in figure 21. Together, they will face a world demand of $18.3 billion by 2023.
Frozen vegetables (071080) and prepared vegetables or mixtures of vegetables (2005XX) stand out,
with projected world imports surpassing $4.7 billion each. Other diversification opportunities are
frozen mixtures of vegetables (071090), provisionally preserved vegetables and mixtures thereof
(071190), dried vegetables and mixtures thereof (071290), vegetables, fruit, nuts and other edible
parts of plants, prepared or preserved by vinegar or acetic acid (200190) and frozen (mixtures of)
prepared vegetables (200490).
According to sector experts, producing and exporting processed vegetables and vegetable mixtures is
within reach, but would require an upgrading of current processing and packaging capacities in the
country.
Current world imports
Projected world imports
Current world
imports Input-output link

31
Figure 21: Diversification opportunities for value chain development, vegetable mixtures
Source: ITC calculations based on ITC Export Potential Map data (2019).
$84.5 mn
$5.0 bn
$7.1 bn
$462.8 mn
$43.0 mn
$2.2 bn
$3.2 bn
$245.2 mn
Inputs Outputs World imports

32
References Decreux, Y., & Spies, J. (2016). Export Potential Assessments – a methodology to identify export
opportunities for developing countries. Mimeo. URL:
https://exportpotential.intracen.org/media/1089/epa-methodology_141216.pdf.
ITC (2018a). Value Chain Indicator: adding value to national exports and developing cross-country
production chain. Addendum to the ITC technical paper “Exploring Malawi’s export potential”. URL:
https://malawi.exportpotential.intracen.org/media/1098/vc-methodology-20-12-2018.pdf.
ITC (2018b). Turning export potential into employment. A case study for Jordan. URL:
http://www.intracen.org/publication/export-potential-employment-Jordan/.
33
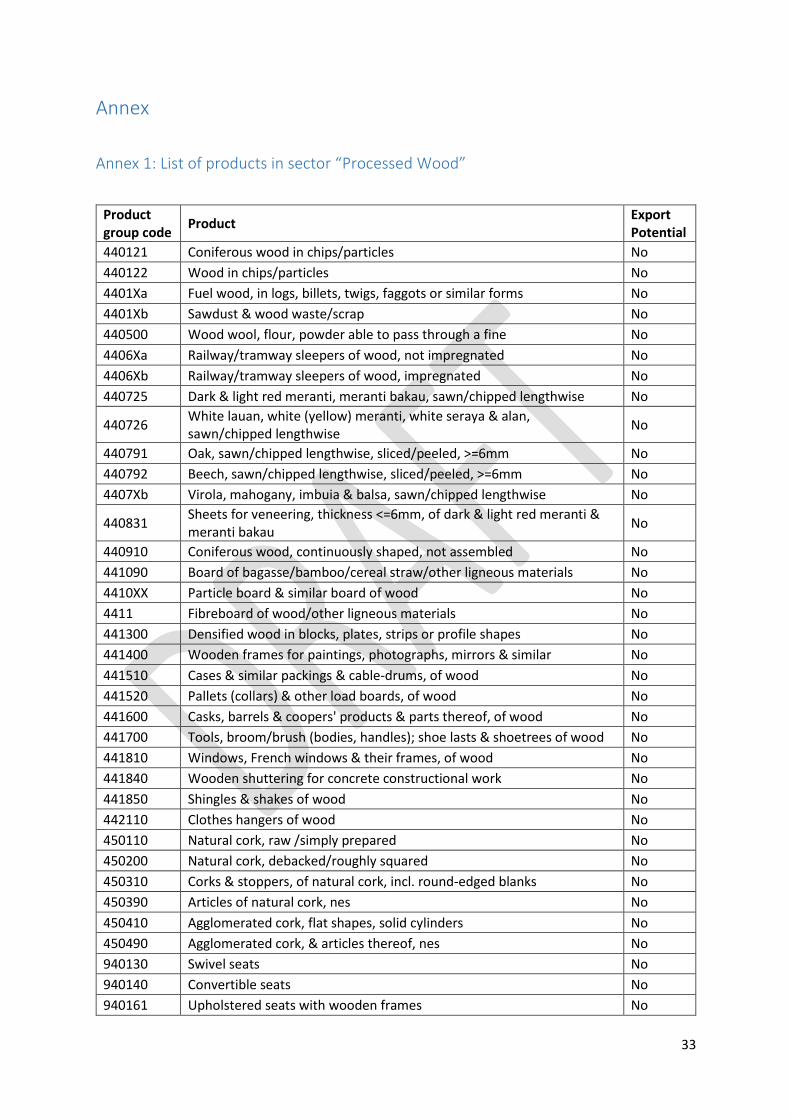
Annex
Annex 1: List of products in sector “Processed Wood”
Product group code
Product Export Potential
440121 Coniferous wood in chips/particles No
440122 Wood in chips/particles No
4401Xa Fuel wood, in logs, billets, twigs, faggots or similar forms No
4401Xb Sawdust & wood waste/scrap No
440500 Wood wool, flour, powder able to pass through a fine No
4406Xa Railway/tramway sleepers of wood, not impregnated No
4406Xb Railway/tramway sleepers of wood, impregnated No
440725 Dark & light red meranti, meranti bakau, sawn/chipped lengthwise No
440726 White lauan, white (yellow) meranti, white seraya & alan, sawn/chipped lengthwise
No
440791 Oak, sawn/chipped lengthwise, sliced/peeled, >=6mm No
440792 Beech, sawn/chipped lengthwise, sliced/peeled, >=6mm No
4407Xb Virola, mahogany, imbuia & balsa, sawn/chipped lengthwise No
440831 Sheets for veneering, thickness <=6mm, of dark & light red meranti & meranti bakau
No
440910 Coniferous wood, continuously shaped, not assembled No
441090 Board of bagasse/bamboo/cereal straw/other ligneous materials No
4410XX Particle board & similar board of wood No
4411 Fibreboard of wood/other ligneous materials No
441300 Densified wood in blocks, plates, strips or profile shapes No
441400 Wooden frames for paintings, photographs, mirrors & similar No
441510 Cases & similar packings & cable-drums, of wood No
441520 Pallets (collars) & other load boards, of wood No
441600 Casks, barrels & coopers' products & parts thereof, of wood No
441700 Tools, broom/brush (bodies, handles); shoe lasts & shoetrees of wood No
441810 Windows, French windows & their frames, of wood No
441840 Wooden shuttering for concrete constructional work No
441850 Shingles & shakes of wood No
442110 Clothes hangers of wood No
450110 Natural cork, raw /simply prepared No
450200 Natural cork, debacked/roughly squared No
450310 Corks & stoppers, of natural cork, incl. round-edged blanks No
450390 Articles of natural cork, nes No
450410 Agglomerated cork, flat shapes, solid cylinders No
450490 Agglomerated cork, & articles thereof, nes No
940130 Swivel seats No
940140 Convertible seats No
940161 Upholstered seats with wooden frames No

34
9401XX Seats of cane, osier & similar No
940330 Wooden office furniture No
940340 Wooden kitchen furniture No
9403XX Furniture of cane, osier & similar No
4402 Wood charcoal, incl. shell or nut charcoal Yes
4407Xa12 Coniferous wood sawn/chipped lengthwise, sliced/peeled Yes
4407Xc13 Wood, sawn/chipped lengthwise, sliced/peeled, thickness >6mm Yes
440810 Sheets for veneering, coniferous plywood or similar, sawn lengthwise/sliced/peeled, thickness <=6mm
Yes
4408XX Sheets for veneering, plywood or similar, sawn lengthwise/sliced/peeled, thickness <=6mm
Yes
4409XX Wood continuously shaped, non-coniferous Yes
4412 Plywood, veneered panel & similar laminated wood Yes
441820 Doors & their frames & thresholds, of wood Yes
4418XX Other builders' joinery & carpentry of wood Yes
4419 Table/kitchenware, of wood Yes
442090 Wood marquetry & inlaid wood; caskets, cases for jewellery/cutlery Yes
4421XX Articles of wood, nes Yes
940169 Seats with wooden frames Yes
940350 Wooden bedroom furniture Yes
940360 Wooden furniture, nes Yes
Annex 2: List of products in sector “Specialty Agriculture”
Product group code
Product Export Potential
60110 Dormant unedible bulbs, tubers, etc. No
60120 Growing unedible bulbs, tubers, etc. No
60210 Unrooted cuttings & slips No
60220 Edible fruit or nut trees No
60230 Rhododendrons & azaleas No
60240 Roses No
60290 Live plants & mushroom spawns No
60390 Cut flowers & buds, not fresh No
0603XX Cut flowers & buds, fresh No
70110 Seed potatoes No
70190 Potatoes, fresh No
70200 Tomatoes, fresh No
70310 Onions & shallots, fresh No
70320 Garlic, fresh No
12 4407Xa is not currently authorized for export. 13 4407Xc is not currently authorized for export.

35
70390 Leeks, scallion, chives, fresh No
70410 Cauliflowers & broccoli, fresh No
70420 Brussels sprouts, fresh No
70511 Cabbage lettuce, fresh No
70519 Lettuce, fresh, excl cabbage lettuce No
70521 Witloof chicory, fresh No
70529 Chicory, fresh, excl witloof chicory No
70610 Carrots & turnips, fresh No
70700 Cucumbers & gherkins, fresh No
70810 Peas "Pisum sativum", fresh No
70820 Beans "Vigna spp., Phaseolus spp.", fresh No
70890 Legumes nes, fresh No
70930 Aubergines, fresh No
70940 Celery, fresh, excl celeriac No
70951 Edible mushrooms & truffles, fresh or chilled No
70959 Mushrooms, fresh or chilled No
70970 Spinach, fresh No
71010 Potatoes, raw, steamed or boiled, frozen No
71021 Peas "Pisum sativum", frozen No
71022 Beans "Vigna spp., Phaseolus spp.", frozen No
71029 Legumes nes, frozen No
71030 Spinach, frozen No
71040 Sweetcorn, frozen No
71080 Vegetables nes, frozen No
71090 Mixtures of vegetables, frozen No
71120 Olives, provisionally preserved No
71151 Mushrooms, unsuitable for immediate consumption No
71159 Mushrooms & truffles, unsuitable for immediate consumption No
71190 Vegetables & mixtures of, unsuitable for immediate consumption No
71220 Onions, dried No
71231 Dried mushrooms, whole, cut or in powder No
71232 Dried wood ears, whole, cut or in powder No
71233 Dried jelly fungi, whole, cut or in powder No
71239 Dried mushrooms & truffles, whole, cut or in powder, nes No
71290 Vegetables nes & mixtures, dried No
71310 Peas, dried & shelled No
71320 Chickpeas, dried & shelled No
71331 Beans "Vigna mungo or Vigna radiata", dried & shelled No
71332 Adzuki beans, dried & shelled No
71333 Kidney beans "Phaseolus vulgaris", dried & shelled No
71340 Lentils, dried & shelled No
71350 Broad beans & horse beans, dried & shelled No
0713Xb Legumes nes, dried & shelled No
0714XX Roots & tubers nes, sago pith No

36
80111 Desiccated coconuts No
80121 Brazil nuts, in shell No
80122 Brazil nuts, shelled No
80132 Cashew nuts, shelled No
0801XX Coconuts, fresh No
80211 Fresh or dried almonds in shell No
80212 Fresh or dried almonds, shelled No
80221 Hazelnuts, in shell No
80222 Hazelnuts, shelled No
80231 Walnuts, in shell No
80232 Walnuts, shelled No
0802Xa Chestnuts No
0802Xb Pistachios No
0802Xc Nuts nes No
80410 Dates, fresh or dried No
80420 Figs, fresh or dried No
80430 Pineapples, fresh or dried No
80440 Avocados, fresh or dried No
80510 Oranges, fresh or dried No
80540 Grapefruit, fresh or dried No
80550 Lemons & limes, fresh or dried No
80590 Citrus fruit nes, fresh or dried No
0805XX Citrus fruits nes, fresh or dried No
80610 Grapes, fresh No
80620 Grapes, dried No
80711 Watermelons, fresh No
80719 Melons, fresh, excl watermelons No
80810 Apples, fresh No
0808XX Pears & quinces, fresh No
80910 Apricots, fresh No
80930 Peaches & nectarines, fresh No
80940 Plums & sloes, fresh No
0809XX Cherries, fresh No
81010 Strawberries, fresh No
81020 Raspberries, blackberries, mulberries & loganberries, fresh No
81040 Cranberries, bilberries & other Vaccinium fruits, fresh No
81050 Kiwifruits, fresh No
81060 Durians, fresh No
81110 Strawberries, raw, steamed or boiled, frozen No
81120 Raspberries, blackberries, etc., raw, steamed or boiled, frozen No
81190 Fruits & nuts nes, raw, steamed or boiled, frozen No
81210 Cherries, provisionally preserved No
81290 Fruits & nuts nes, provisionally preserved No
81310 Apricots, dried No

37
81320 Prunes, dried No
81330 Apples, dried No
81350 Mixtures of nuts or dried fruits No
81400 Peel of citrus fruit or melons No
90112 Coffee, not roasted, decaffeinated No
90122 Coffee, roasted, decaffeinated No
90190 Coffee husks & skins; coffee substitutes No
90210 Green tea, packings <=3kg No
90230 Black tea, packings <=3kg No
90240 Black tea, packings >3kg No
90300 Mate No
90411 Pepper (Piper), not crushed, not ground No
90412 Pepper (Piper), crushed or ground No
0904XX Pepper (Capsicum or Pimenta), dried, crushed or ground No
905 Vanilla No
90620 Cinnamon (incl flowers), crushed or ground No
0906XX Cinnamon (incl flowers), not crushed, not ground No
907 Cloves No
0908Xa Nutmeg No
0908Xb Mace No
0908Xc Cardamons No
0909Xa Coriander seeds No
0909Xb Cumin seeds No
0909Xc Juniper berries & seeds of anise, badian, caraway or fennel No
91020 Saffron No
91030 Turmeric "curcuma" No
91091 Mixtures of different types of spices No
91099 Spices nes No
110510 Flour, meal & powder of potatoes No
110520 Flakes, granules & pellets of potatoes No
110610 Flour, meal & powder of dried legumes No
110630 Flour, meal & powder of edible fruit & nuts No
110813 Potato starch No
110819 Starch, excl wheat, maize, potato & manioc No
110820 Inulin No
120810 Soya bean flour & meal No
120890 Flours & meal of oil seeds or oleaginous fruit, excl soya & mustard No
121010 Hop cones, excl ground, powdered or in pellets No
121020 Hop cones, ground, powdered or in pellets; lupulin No
121120 Ginseng roots No
121130 Coca leaf, fresh or dried, whether or not cut, crushed or powdered No
121140 Poppy straw, fresh or dried, whether or not cut, crushed or powdered No
1212Xa Seaweeds & other algae No
130120 Natural gum arabic No

38
130212 Extracts of liquorice, excl with >10% of sucrose & confectionery No
130213 Extracts of hops No
130220 Pectic substances, pectinates & pectates No
130231 Agar-agar No
130232 Mucilages & thickeners, derived from locust beans or guar seeds No
130239 Mucilages & thickeners derived from vegetable products nes No
151790 Edible mixtures of fats, oil & fractions, chemically modified nes No
170410 Chewing gum No
170490 Sugar confectionery not containing cocoa No
180100 Cocoa beans No
180310 Cocoa paste, not defatted No
180320 Cocoa paste, defatted No
180400 Cocoa butter, fat & oil No
180500 Cocoa powder No
180610 Cocoa powder, sweetened No
180620 Chocolate & other cocoa food preparations No
180631 Chocolate & other cocoa preparations, filled No
180632 Chocolate & other cocoa preparations, unfilled No
180690 Chocolate & other cocoa preparations, in containers No
190110 Food preparations for infant use No
190120 Mixes & doughs of flour No
190190 Malt extract No
190211 Uncooked pasta, containing eggs No
190219 Uncooked pasta, not containing eggs No
190220 Pasta, stuffed No
190230 Pasta No
190240 Couscous No
190300 Tapioca No
190410 Prepared foods from roasting cereals No
190420 Prepared foods from cereal flakes No
190430 Bulgur wheat in the form of worked grains No
190490 Cereals in worked grains, prepared, n.e.s. No
190510 Crispbread No
190520 Gingerbread & the like No
190531 Sweet biscuits No
190532 Waffles & wafers No
190540 Rusks, toasted bread No
190590 Bread, pastry No
200110 Cucumbers & gherkins No
200190 Vegetables preserved by vinegar or acetic acid No
200210 Tomatoes, whole or in pieces, prepared No
200290 Tomatoes, prepared No
200310 Mushrooms, prepared No
200390 Mushrooms & truffles, prepared No

39
200410 Potatoes, prepared or preserved (not in vinegar), frozen No
200490 Vegetables & mixtures of vegetables No
200510 Homogenised vegetables put up for retail No
200520 Potatoes No
200540 Peas "Pisum Sativum" No
200551 Shelled beans No
200559 Unshelled beans No
200560 Asparagus No
200570 Olives No
2005XX Vegetables nes & mixtures, prepared or preserved (not in vinegar), not frozen
No
200600 Edible parts of plants preserved by sugar No
200710 Homogenised preparations of fruit or nuts, cooked, <=250g No
200791 Citrus fruit jams or similar, nes No
200799 Fruit (excl citrus) jams or similar, nes No
200811 Groundnuts, prepared or preserved, excl with sugar No
200819 Nuts & other seeds, prepared or preserved, nes No
200820 Pineapples, prepared or preserved, nes No
200830 Citrus fruit, prepared or preserved, nes No
200840 Pears, prepared or preserved, nes No
200850 Apricots, prepared or preserved, nes No
200860 Cherries, prepared or preserved, nes No
200870 Peaches, prepared or preserved, nes No
200880 Strawberries, prepared or preserved, nes No
200891 Palm hearts, prepared or preserved, excl in vinegar No
200897 Mixtures of edible parts of plants, prepared or preserved, nes No
200911 Orange juice, frozen No
200912 Orange juice, unfermented, Brix value <= 20 No
200919 Orange juice, unfermented, Brix value > 20 No
200921 Grapefruit juice, unfermented, Brix value <= 20 No
200929 Grapefruit juice, unfermented, Brix value > 20 No
200931 Single citrus fruit juice, unfermented, Brix value <= 20 No
200939 Single citrus fruit juice, unfermented, Brix value > 20 No
200941 Pineapple juice, unfermented, Brix value <= 20 No
200949 Pineapple juice, unfermented, Brix value > 20 No
200950 Tomato juice, unfermented No
200961 Grape juice, incl. grape must, unfermented, Brix value <= 30 No
200969 Grape juice, incl. grape must, unfermented, Brix value > 30 No
200971 Apple juice, unfermented, Brix value <= 20 No
200979 Apple juice, unfermented, Brix value > 20 No
200990 Mixtures of fruit & vegetables juices No
2009XX Juice of fruit or vegetables, unfermented No
210120 Tea or mate extracts & preparations No
210130 Roasted coffee substitutes & extracts No
210210 Active yeasts No

40
210220 Inactive yeasts No
210230 Prepared baking powders No
210310 Soya sauce No
210320 Tomato ketchup & other tomato sauces No
210330 Mustard flour & meal No
210390 Preparations for sauces & prepared sauces No
210410 Soups & broths & preparations therefor No
210420 Food preparations, mixtures of two or more ingredients No
210500 Ice cream & other edible ice No
210610 Protein concentrates & textured protein substances No
210690 Food preparations No
220110 Mineral waters & aerated waters No
220190 Ordinary natural water No
220210 Waters as beverage No
2202XX Non-alcoholic beverages No
220900 Vinegar No
500100 Silkworm cocoons for reeling No
500200 Raw silk (non-thrown) No
500400 Silk yarn, nes No
500500 Silk waste yarn, nes No
500600 Silk yarn & silk waste yarn, for retail; silkworm gut No
500710 Noil silk wovens No
500720 Wovens, >=85% silk or schappe No
500790 Wovens, <85% silk or silk waste No
70490 Cabbages, kohlrabi, kale, fresh Yes
70690 Salad beetroot, salsify, celeriac, radishes, fresh Yes
70920 Asparagus, fresh Yes
70960 Peppers (Capsicum or Pimenta), fresh Yes
0709XX Vegetables, fresh or chilled Yes
71140 Cucumbers & gherkins, provisionally preserved Yes
0713Xa Beans "Vigna & Phaseolus" nes, dried & shelled Yes
71410 Roots & tubers of manioc Yes
71420 Sweet potatoes Yes
80131 Cashew nuts, in shell Yes
803 Bananas, fresh or dried Yes
80450 Guavas, mangoes & mangosteens, fresh or dried Yes
80720 Papayas, fresh Yes
0810XX Fruits nes, fresh Yes
81340 Peaches, pears, papayas, etc., unmixed, dried Yes
90111 Coffee, not roasted, not decaffeinated Yes
90121 Coffee, roasted, not decaffeinated Yes
90220 Green tea, packings >3kg Yes
0910XX Ginger Yes
110620 Flour, meal & powder of sago, roots or tubers Yes

41
110814 Manioc starch Yes
1211XX Medicinal plants, herbs, etc., nes Yes
1212Xb Fruit stones & kernels for human consumption, sugar cane, carob, etc. Yes
130190 Lac; natural gums (excl gum arabic), resins, balsams, etc. Yes
1302XX Vegetable saps and extracts Yes
200580 Sweetcorn Yes
2008XX Edible parts of plants, prepared or preserved, nes Yes
210111 Coffee extracts Yes
210112 Coffee preparations Yes
220300 Beer made from malt Yes